(NISl_-T_-72863) STABILITY A_D CO_ITttOL DEI_IVATIVE ESTIMATES OBTAINED FRO"I FLIGBT DATA FOR TEE BEECH 99 _IRCRAFT (N_SA) 38 p HC AO3/MF A01 CSCL 01C NASA T_.ehnical Memorandum 72863 c, 3/0 8 g79-2013_ Unclas 172_ I _j STABILITY AND CONTROL DERIVATIVE ESTIMATES OBTAINED FROM FLIGHT DATA FOR THE BEECH 99 AIRCRAFT Russel R. Tanner and Terry D. Montgomery April 1979 ,•.,i •:•I https://ntrs.nasa.gov/search.jsp?R=19790011963 2019-03-10T05:21:20+00:00Z
STABILITY AND CONTROL DERIVATIVE ESTIMATES OBTAINED
FROM FLIGHT DATA FOR THE BEECH 99 AIRCRAFT
Russel R. Tanner and Terry D. Montgomery
Dryden Flight Research CenterEdwards, Califorr, i_
Nat,onal Aeronaut,cs and
Space Adm,n,strat,on
STABILITY AND CONTROL DERIVATIVE ESTIMATES
OBTAINED FROM FLIGHT DATA FOR
THE BEECH 99 AIRCRAFT
RUSSEL R. TANNER AND TERRY D. MONTGOMERY
DRYDEN FLIGHT RESEARCH CENTER
INTRODUCTION
Reliable estimates of stability and control derivatives are essential
for flight simulations and handling quality evaluations of aircraft. In
response to the growing need for reliable derivative estimates, the NASA
Dryden Flight Research Center developed a technique for obtaining the sta-
bility and control derivatives of aircraft from flight data (r_f. l) and
developed a set of FORTRAN computer programs to implement the technique(ref. 2). This method of derivative extraction is based on a modified
maximum likelihood estimator that uses the Newton-Balakrishna_ algorithm
to perform the required minimization.
These computer programs were used to determine the stability and control
derivatives of a modified Beech 99 alrplane. The aircraft, flown as a co-
operative effort by NASA, Beech Aircraft Corporation, and the University
of Kansas Flight Research Laboratory, was utilized to study the effects
of separate surface stability augmentation (ref. 3). Data were obtainedwith the aircraft in a clean configuration and with one-third flap deflec-
tion. This report presents the Beech 99 derivative estimates obtained
with the modified maximum likelihood technique and compares these esti-
mates with predicted values.
A, B, C, D, R
an, ax, ay
b
CL , CD
C_, Cm, Cn
CN, Cy
CG
C
G
g
IX, IXZ, Iy, IZ
J
m
P
q
q
r
S
t
TC
T
U
V
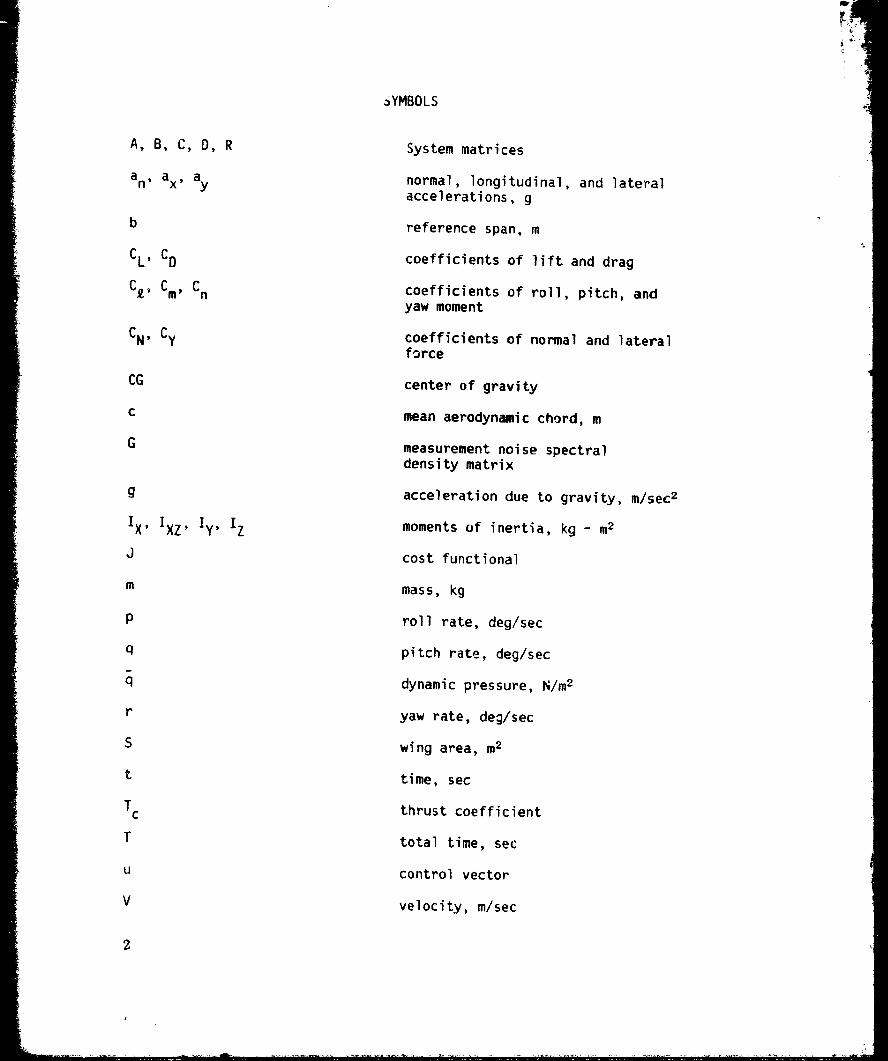
SYMBOLS
System matrices
normal, longitudinal, and lateral
accelerations, g
reference span, m
coefficients of lift and drag
coefficients of roll, pitch, and
yaw moment
coefficients of normal and lateral
force
center of gravity
mean aerodynamic chord, m
measurement noise spectral
density matrix
acceleration due to gravity, m/sec z
moments of inertia, kg - m2
cost functional
mass, kg
roll rate, deg/sec
pitch rate, deg/sec
dynamic pressure, fi/mz
yaw rate, deg/sec
wing area, m2
time, sec
thrust coefficient
total time, sec
control vector
velocity, m/sec
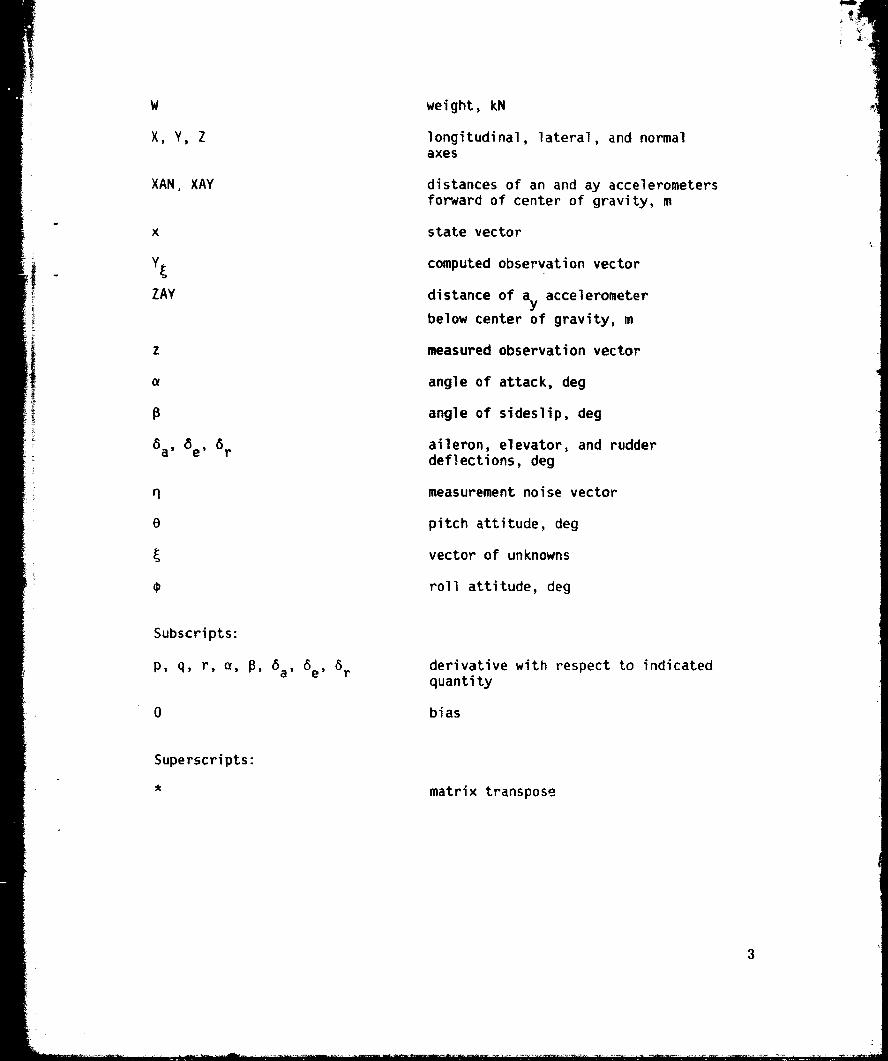
XAN, XAY
X
ZAY
Z
8a, 6e, 6r
q
0
Subscripts:
p, q, r, _, 8, 6a, 6e, 6r
0
Superscripts:
weight, kN
longitudinal, lateral, and normalaxes
distances of an and ay accelerometers
forward of center of gravity, m
state vector
computed observation vector
distance of ay accelerometer
below center of gravity, m
measured observation vector
angle of attack, deg
angle of sideslip, deg
aileron, elevator_ and rudder
deflections, deg
measurement noise vector
pitch attitude, deg
vector of unknowns
roll attitude, deg
derivative with respect to indicated
quantity
bias
matrix transpose
DESCRIPTIONOFTHEAIRPLANEANDINSTRUMENTATION
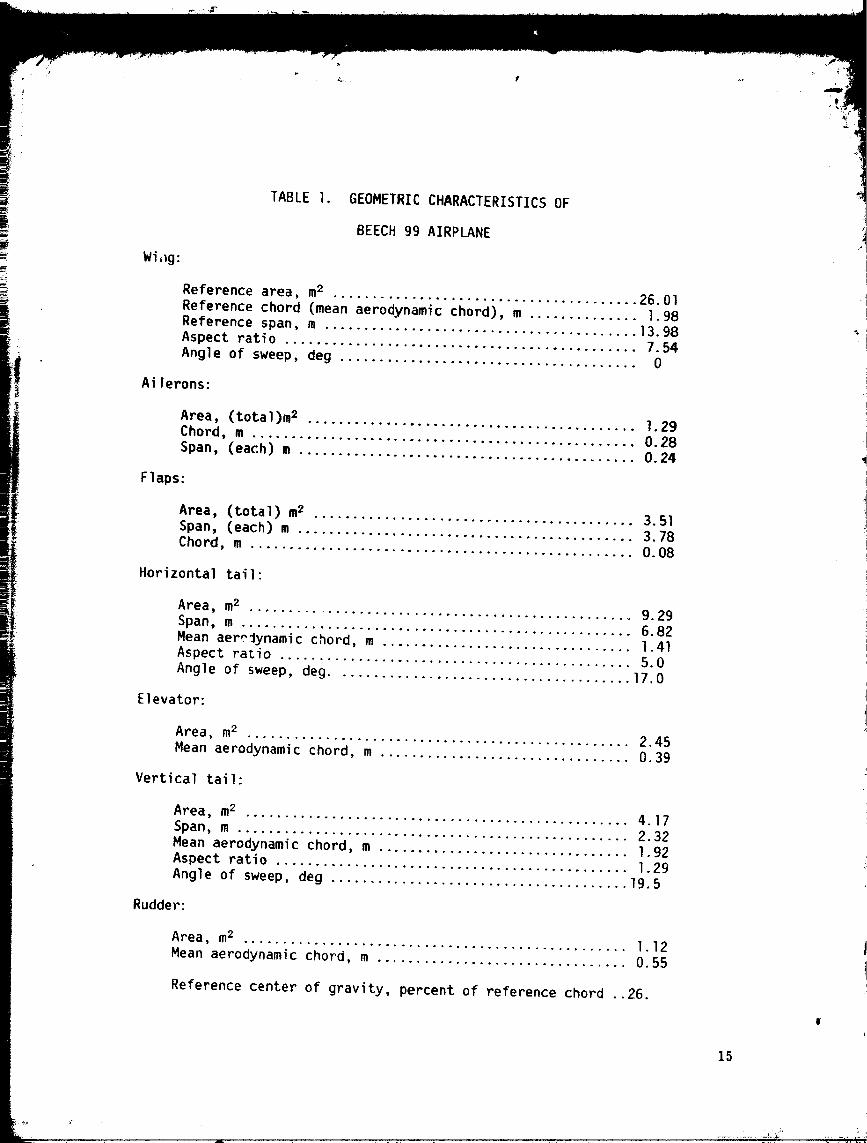
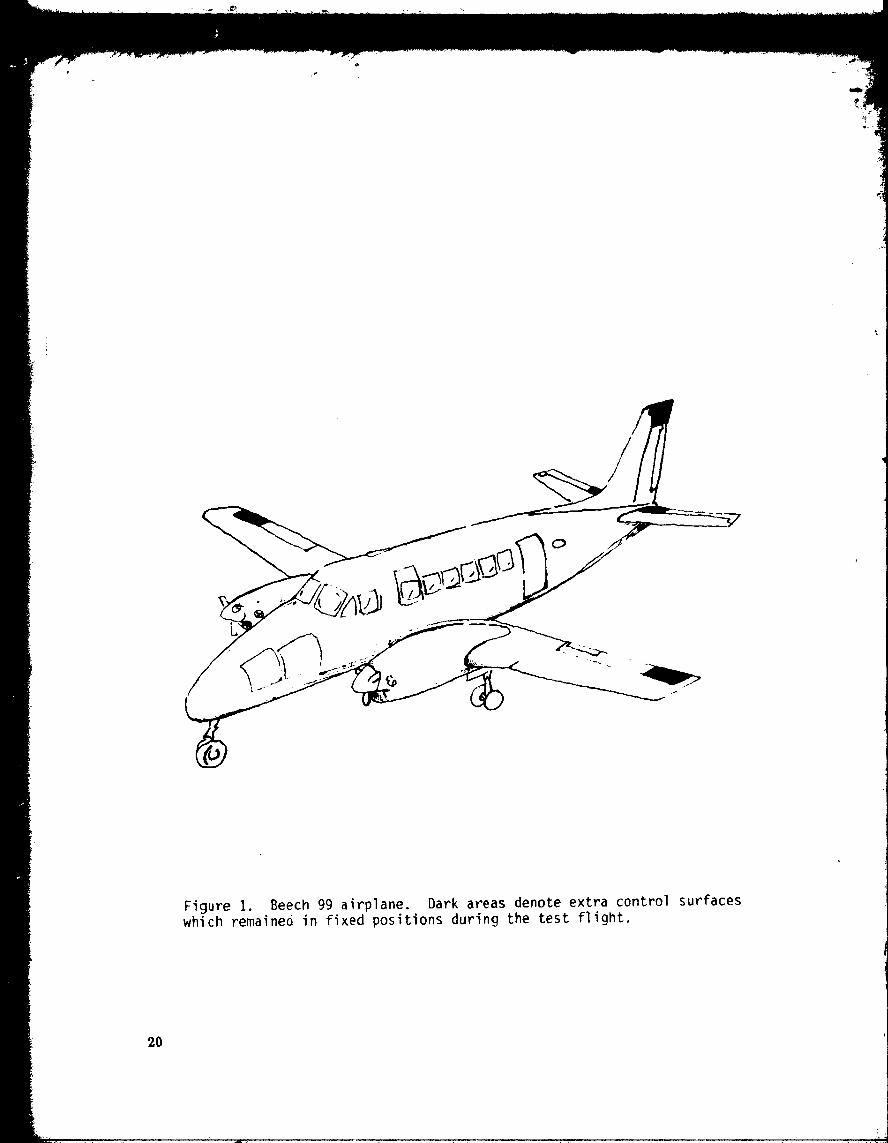
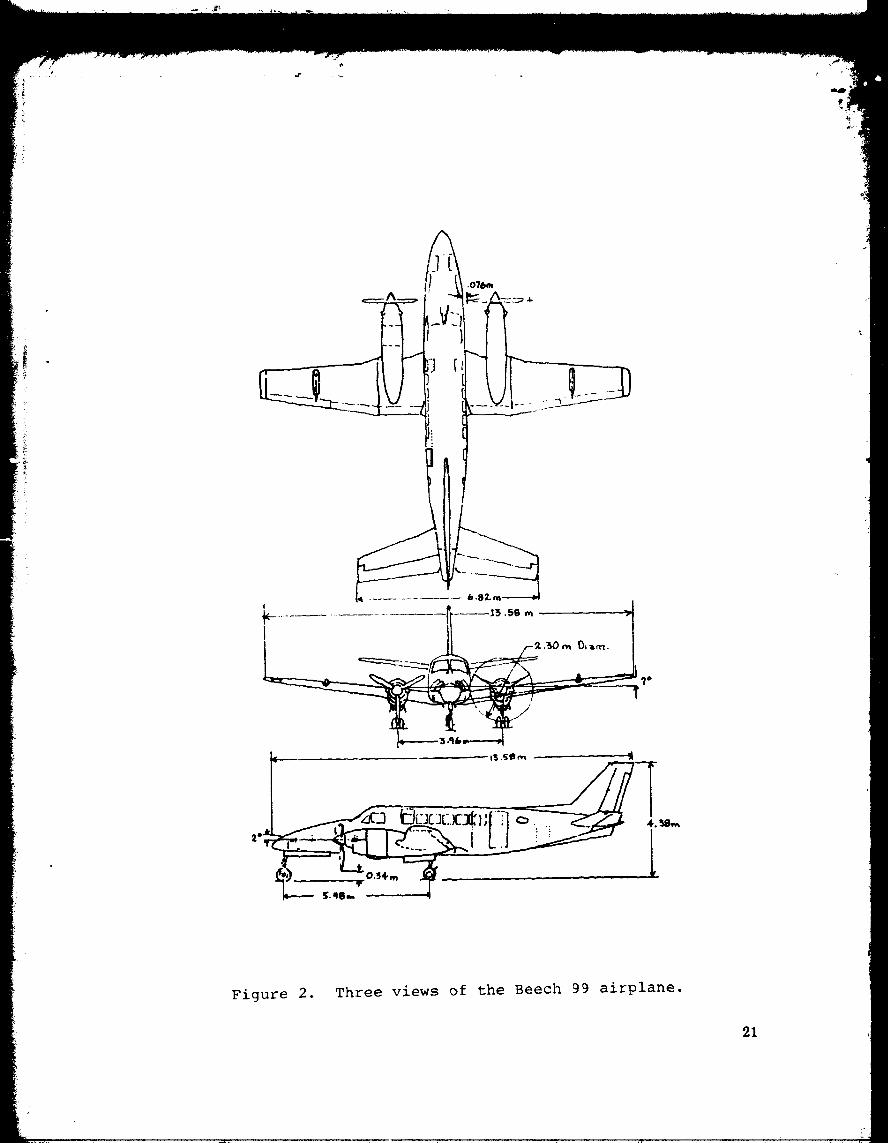
The modified Beech 99 airplane used in this analysis is a 14-_eat, twinturboprop commercial airliner with low wings and retractable landing gear
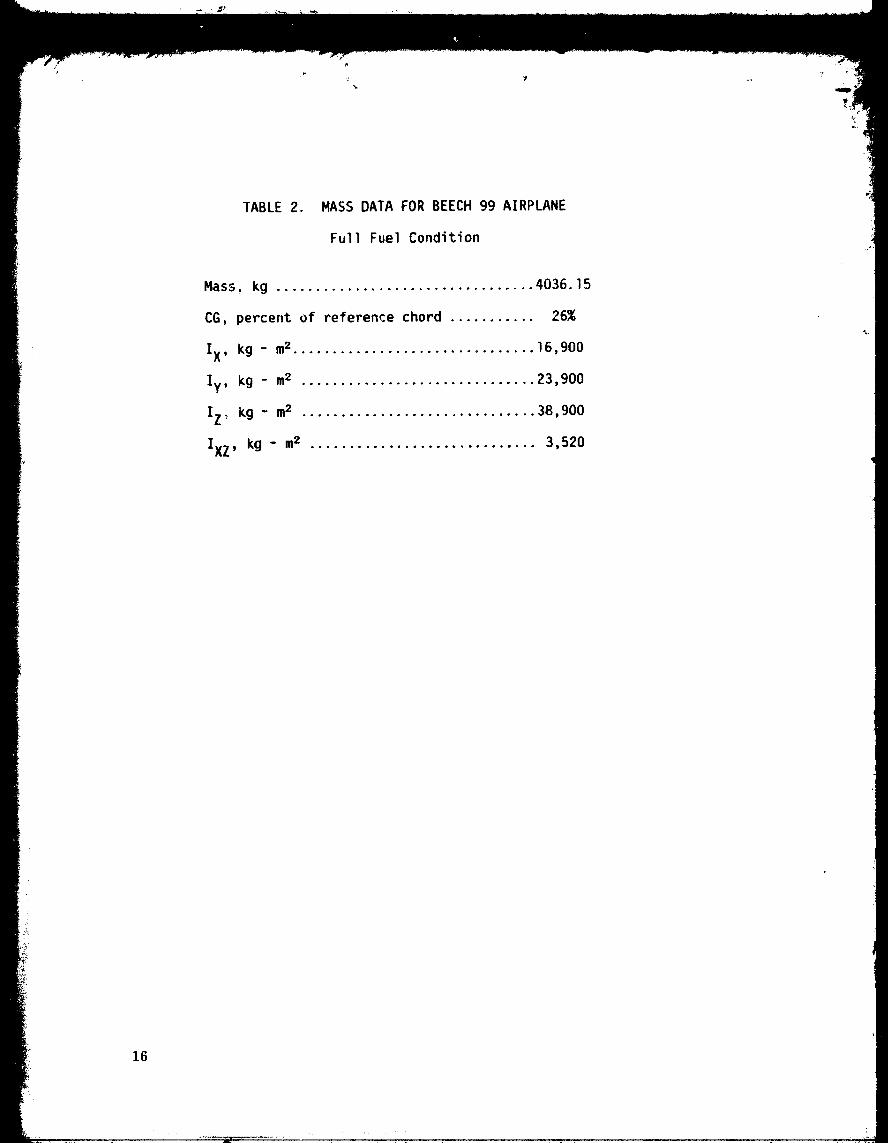
(figs. l and 2). Tables l and 2 list important geometric and mass charac-
teristics of the Beech 99 airplane. The test airplane was modified so that
there were two independently operable control surfaces where there is normal-
ly only one; however, only one set of rudder, aileron and elevator surfaces
was used during the test flight. The extra surfaces are shaded in figure I.
These extra surfaces remained in fixed positions during the flight.
The instrumentation of the airplane consisted of a standard packageused for the measurement of stability and control parameters, including
three-axis angular rate gyros, attitude gyros, and linear accelerometers,along with boom-mounted angle of attack and angle of sideslip es. The
data were filtered with 40-hertz passive analog filters, then sompled with
a 9-bit pulse code modulation (PCM) system and telemetered to a ground
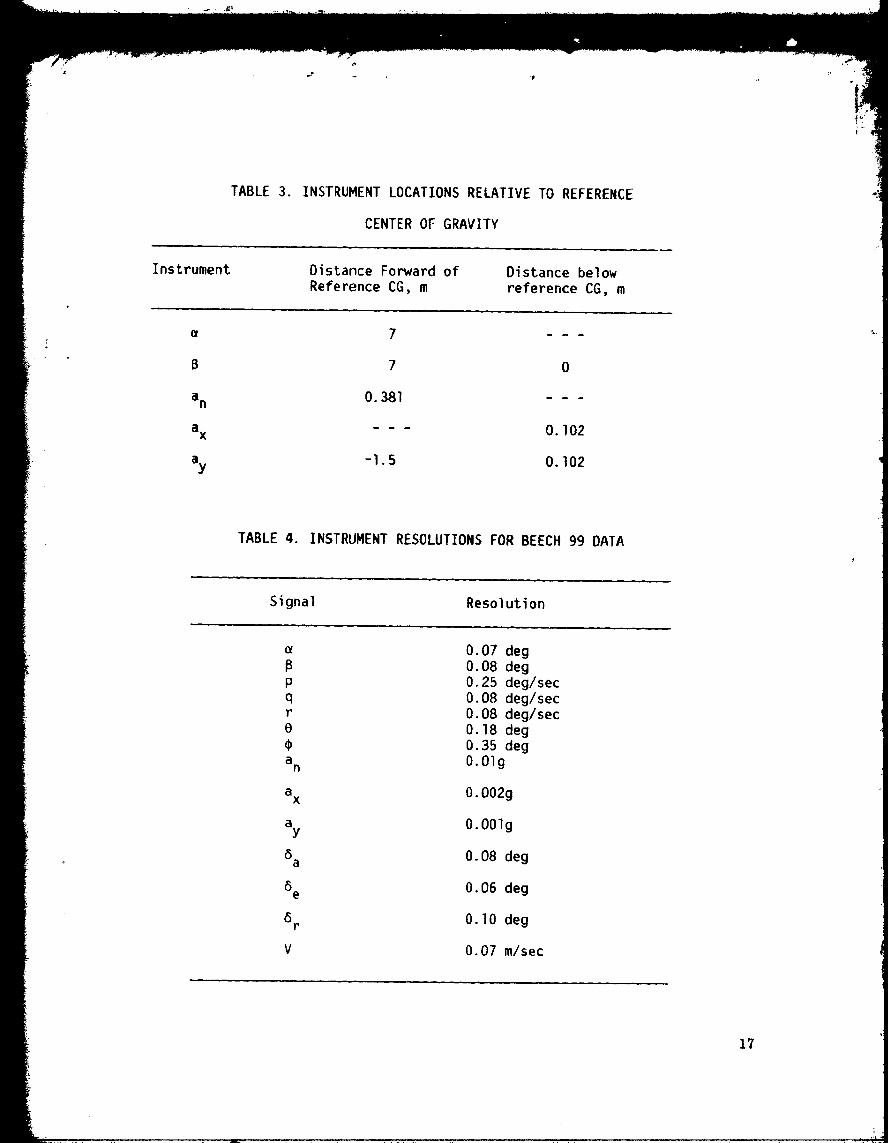
station for real-time monitoring.The analysis used in the derivative extraction accounts for the effect
of instrument location on the measurement of linear accelerations and flow
angles. The instrument locations used in the analysis of the flight data
are presented in table 3. Table 4 lists the resolutions of the instrumen-
tation system used in the analysis.
TEST PROCEDURES AND FLIGHT CONDITIONS
The Beech 99 airplane was flown in the cruise configuration for half of
the maneuvers analyzed and at one-third flap setting for the remainder. All
maneuvers were flown with the center of gravity at approximately 26 percent
of the mean aerodynamic chord. Most of the maneuvers performed were simpleaileron, rudder, or elevator pulses.
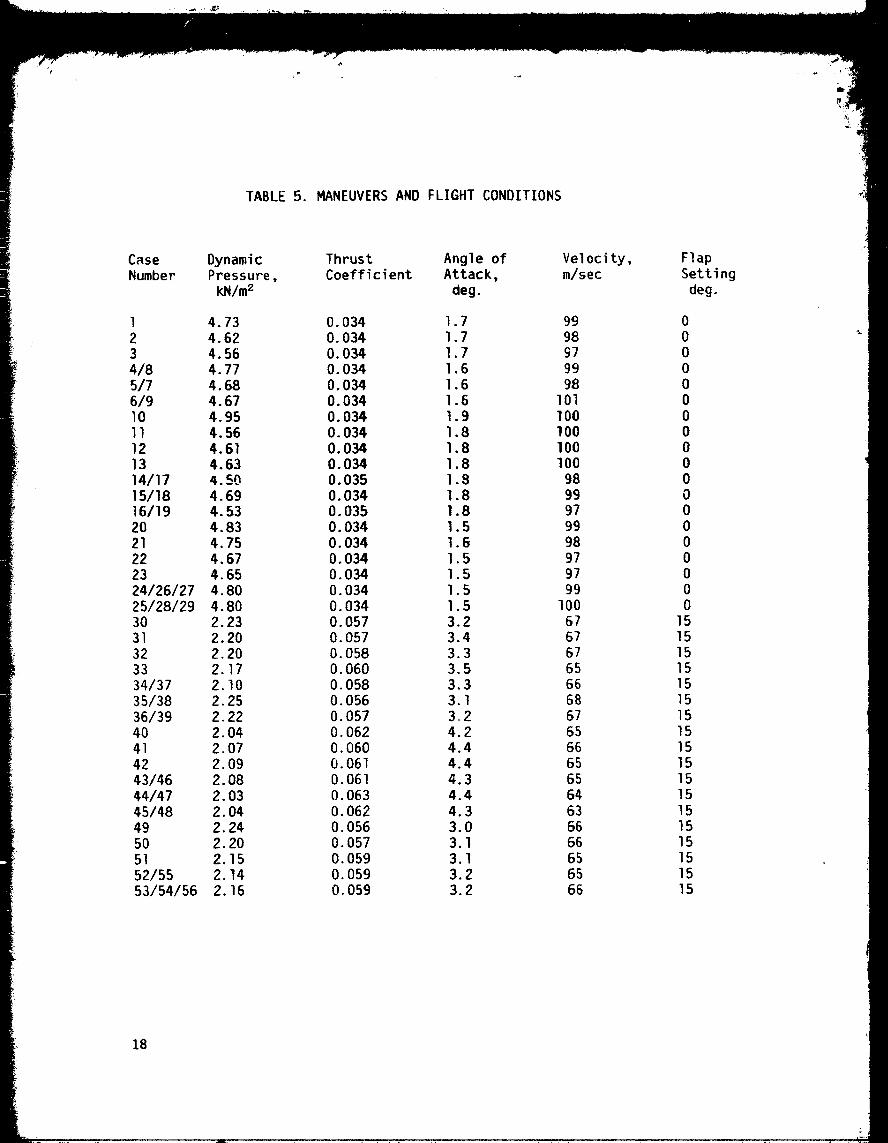
All data were obtained during a 2-hour flight in smooth air. F_fty-six
maneuvers were performed for derivative estimation over an angle of attack
r_ _e from 1.5 to 4.5 degrees, a velocity range from 65 to lO0 meters Qer
second and an altitude range from 1800 to 3200 meters. Table 5 lists the
flight condition corresponding to each maneuver.
METHOD &F ANALYSIS
A maximum likelihood method of analysis was used to determine a complete
set of linear body axis stability and control derivatives from the 56 maneu -
vers performed in flight. The digital computer program used is called themodified maximum likelihood estimator, version three (MMLE-3) which is an out-
growth of the program described in detail and listed in reference 2. The
program is discussed briefly in appendix A_ Further information is available
upon request from the Dryden Flight Research Center. The analysis technique
is an iterative technique that minimizes the difference between the measured
4
aircraft response and the computed aircraft response by adjusting th -,_stabil-
ity and control derivative values used in calculating the computed r(,_nse.
This method can be modified to include _ priori information from pre_,_s
calculations, flight tests, or wind tunnel tests; however', no _ priori infor-mation was used in this Beech 99 analysis. The maximum likelihood techni-
que is described fully in reference I.
In addition to giving derivative estimates, this method provides uncer-
tainty levels for each derivative. The uncertainty levels are proportional
to the approximation of the Cramer-Rao bounds described in reference l, and
are analogous to the standard deviations of the estimated derivatives. Thelarger the uncertainty level, the more uncertain the validity of the estimated
value. The uncertainty levels obtained for derivatives from different maneu-
vers at the same flight conditions can be compared to determine the most valid
estimate. The uncertainty levels provide additional information about the
validity of the derivative estimation. Further information on the interpre-tation of uncertainty levels is included in reference 4.
The digital computer program used in the data analysis is capable of pro-ducing one set of derivative estimates based on multiple sets of data. The
lateral-directional derivative estimates in this report result from the simul-
taneous analysis of both rudder and aileron maneuvers. Analysis of rudder
and aileron maneuvers simultaneously usually results in improved derivativeestimates, as shown in reference 4.
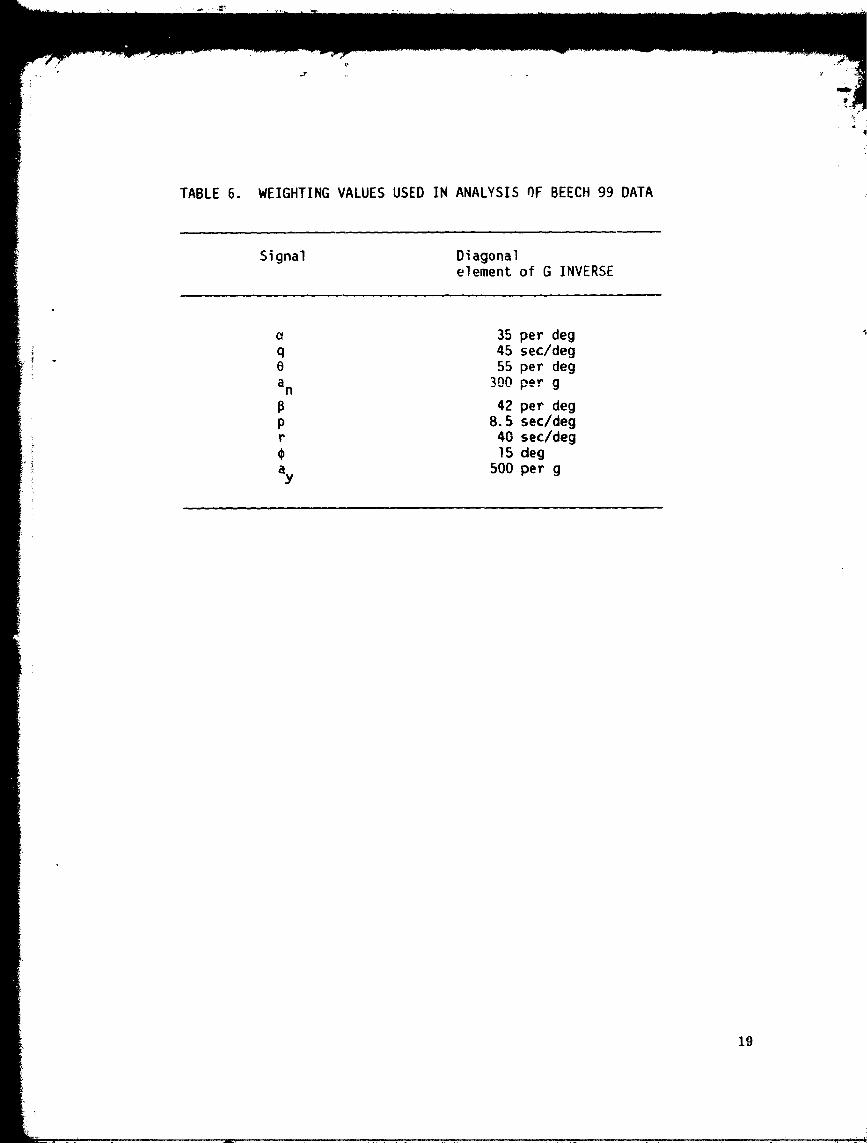
The cost functional minimized by theprogram is given in appendix A.
The matrix G in this cost functional acts as a signal weighting matrix. Forthis analysis, G was chosen to be diagonal with values given in table 6.
RESULTS AND DISCUSSION
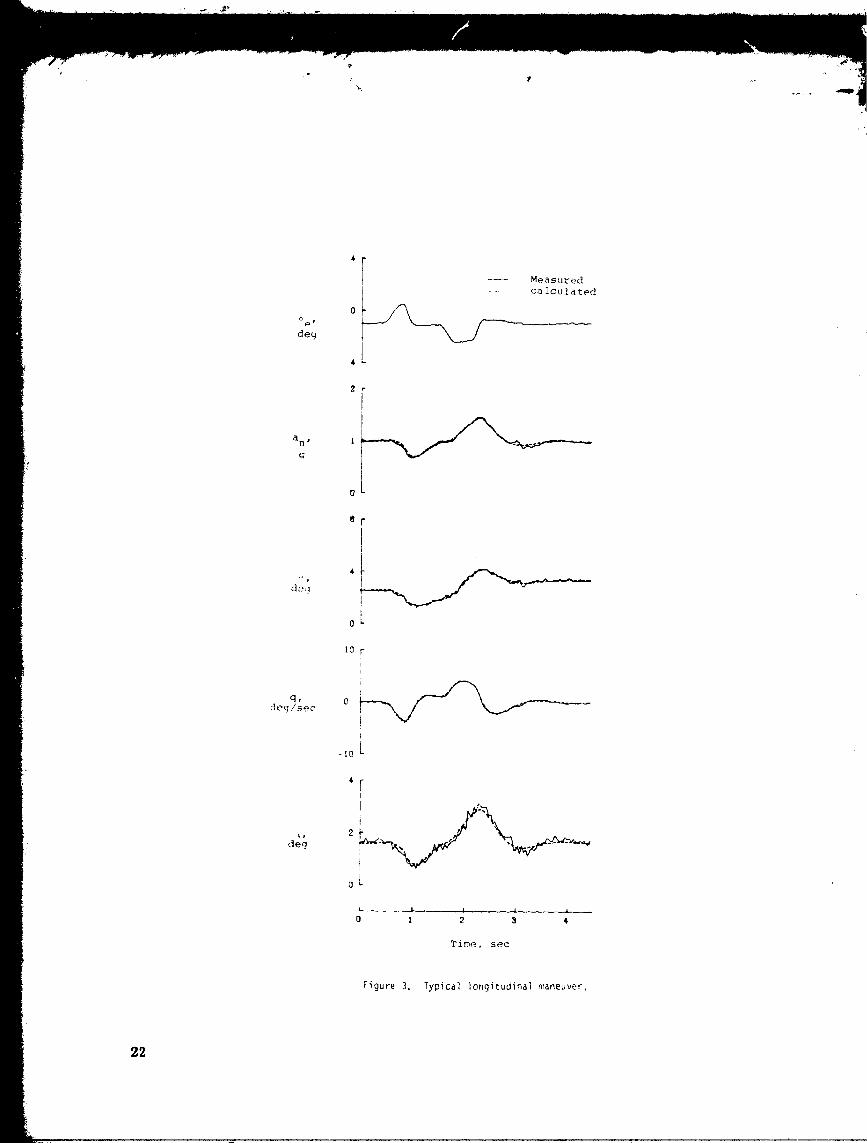
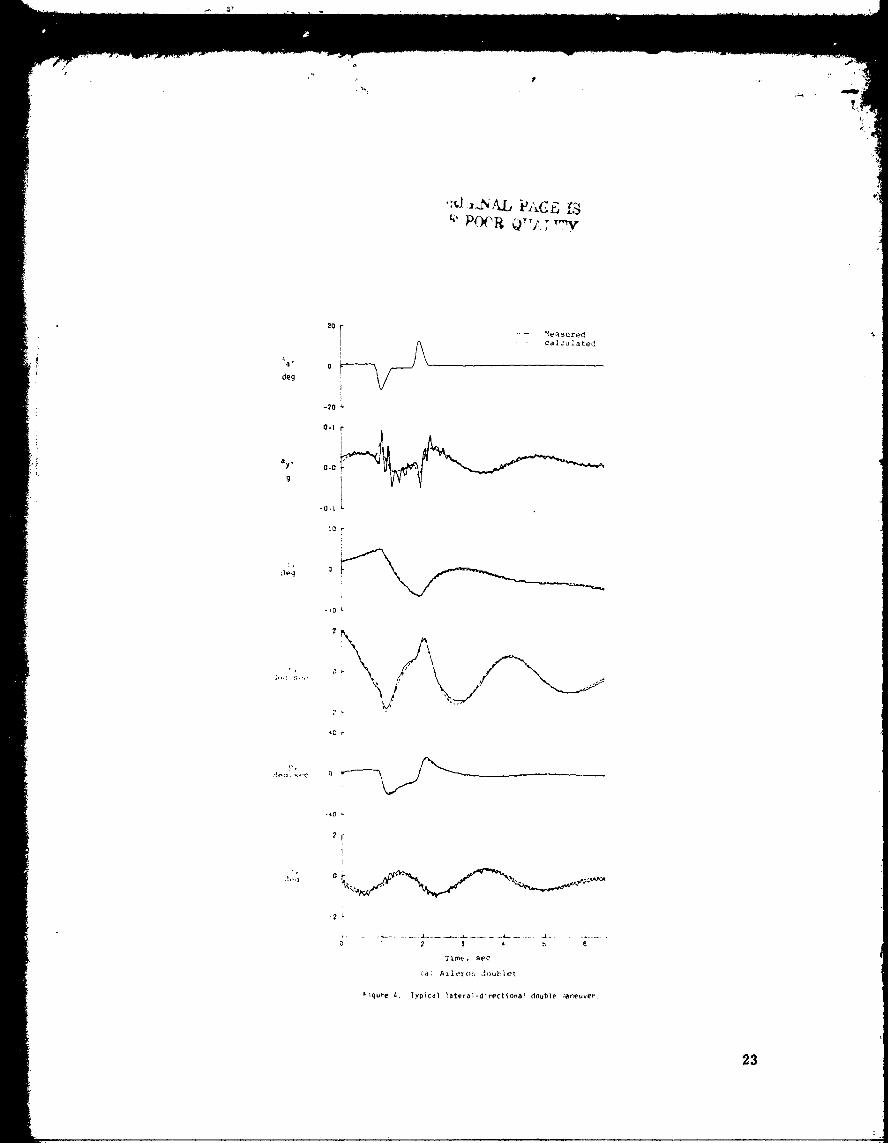
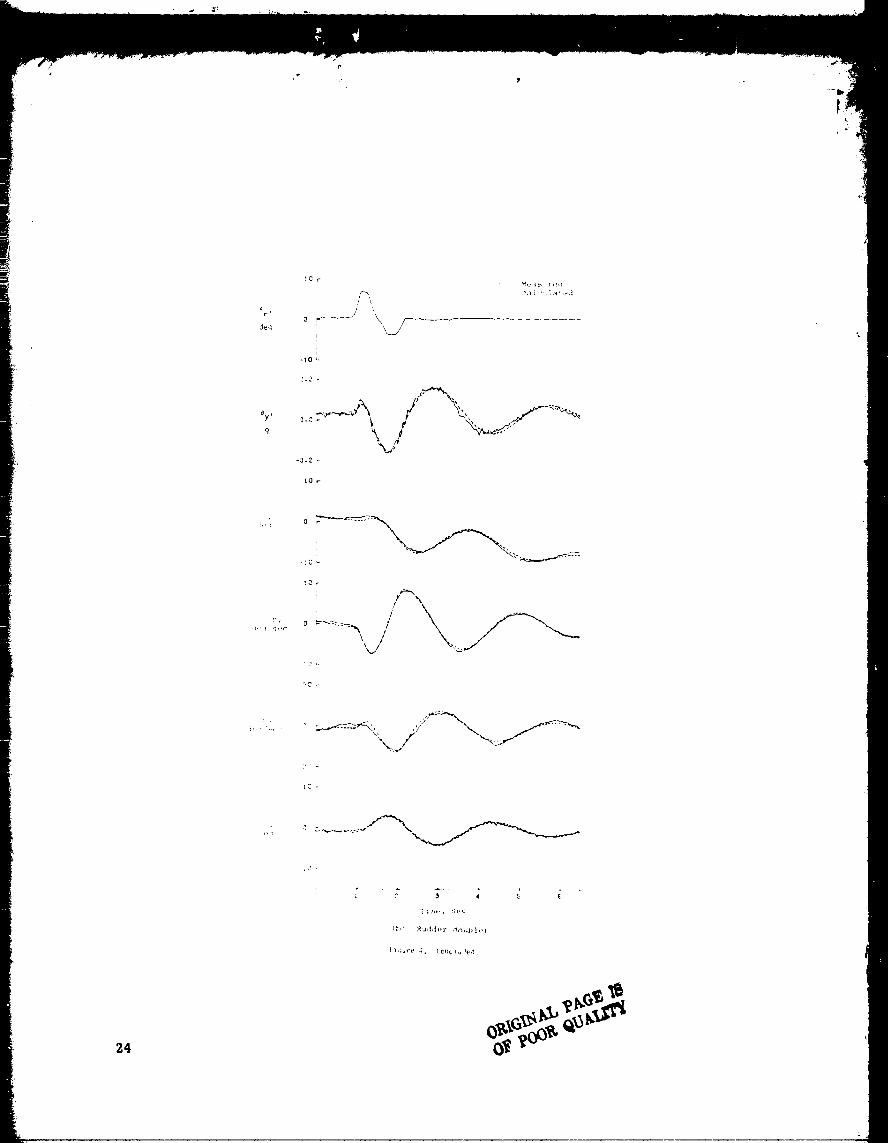
For all _6 maneuvers flown with the Beech 99 airplane, the measured air-
craft response compared satisfactorily with the computed response based on
the maximum likelihood estimation. A typical longitudinal maneuver is shown
in figure 3, and a typical lateral-directional double maneuver is shown in
figure 4. The measured (solid-line) and computed (dashed line) response of
the aircraft are in excellent agreement in these figures. Some maneuvers pro-
duced better agreement than others; however, on the average, the agreementwas quite good.
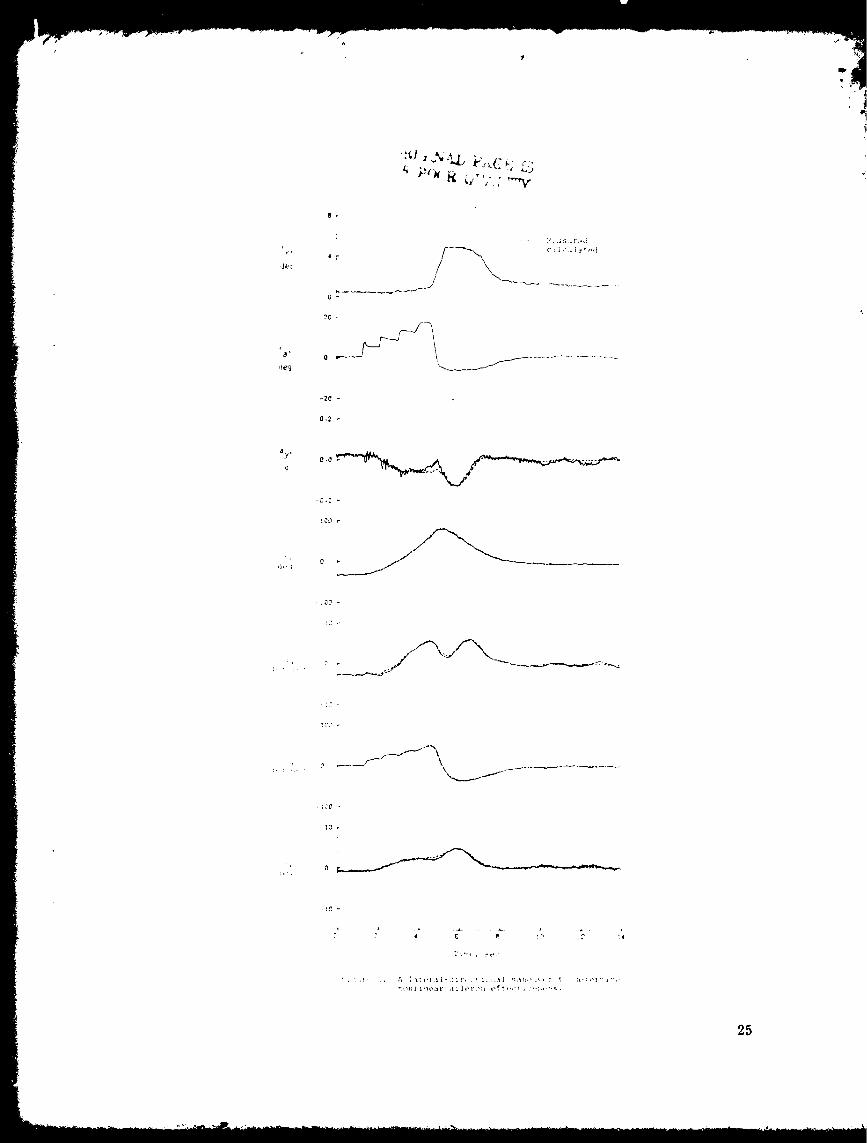
An atypical maneuver combining aileron and rudder inputs is shown in
figure 5. This maneuver was performed to determine any nonlinearities in
aileron effectiveness. The excellent fit in figure 5 based on a linear model
indicates that there was no significant nonlinearity in aileron effectiveness.
The MMLE stability and control derivative estimates based on the analysis of
this maneuver were in excellent agreement with estimates from more conven-
tional maneuvers. The analysis of this maneuver required that the small angle
approximation (in bank angle) be removed from the mathematical model (seeappendix B}. All other maneuvers were analyzed using small angle approxima-tions.
The estimates for 56 maneuvers (19 primarily with elevator inputs, 21
primarily with rudder inputs, 15 primarily with aileron inputs, and one with
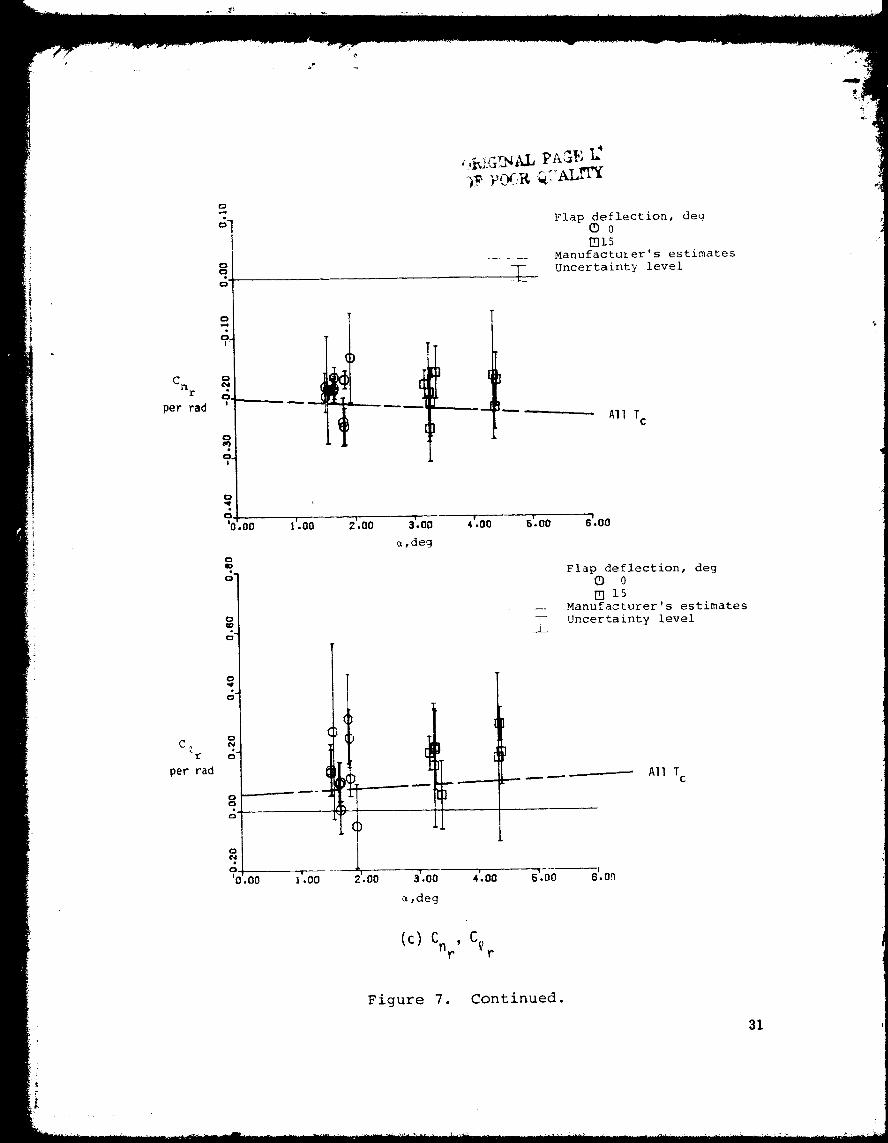
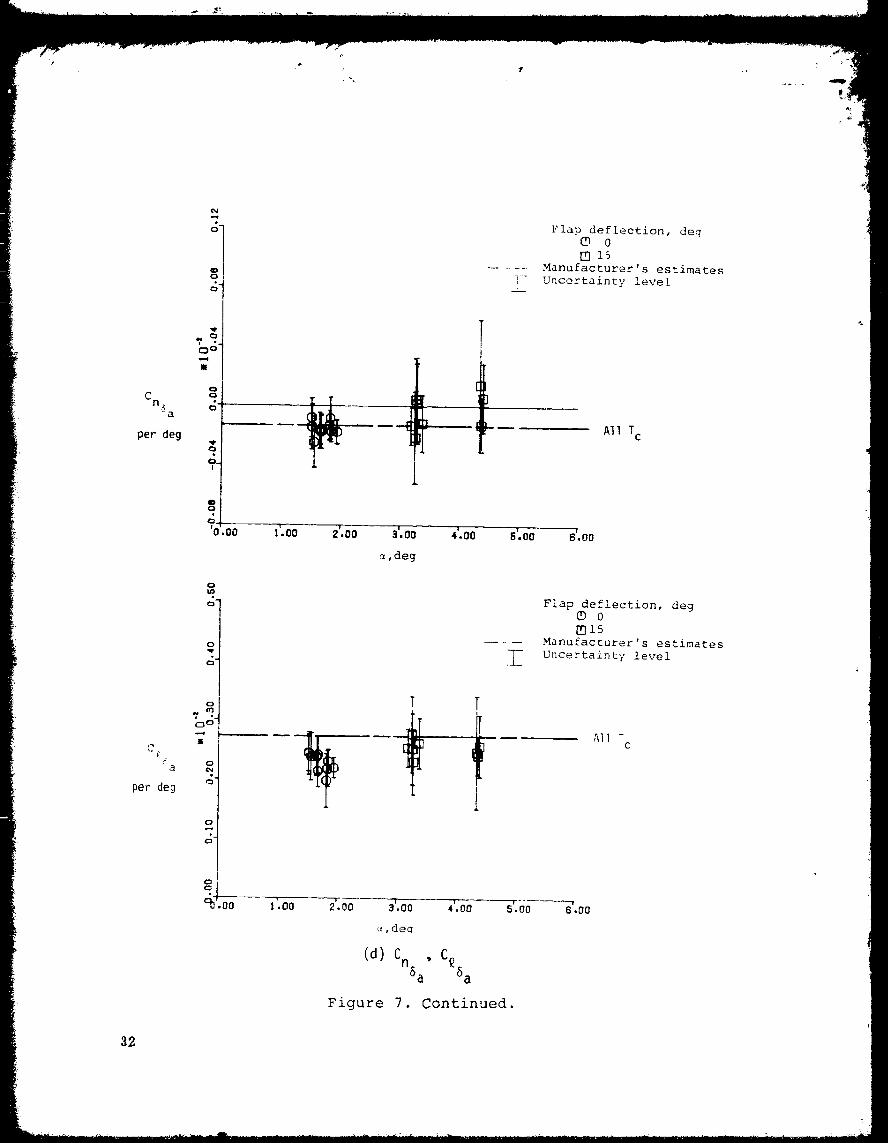
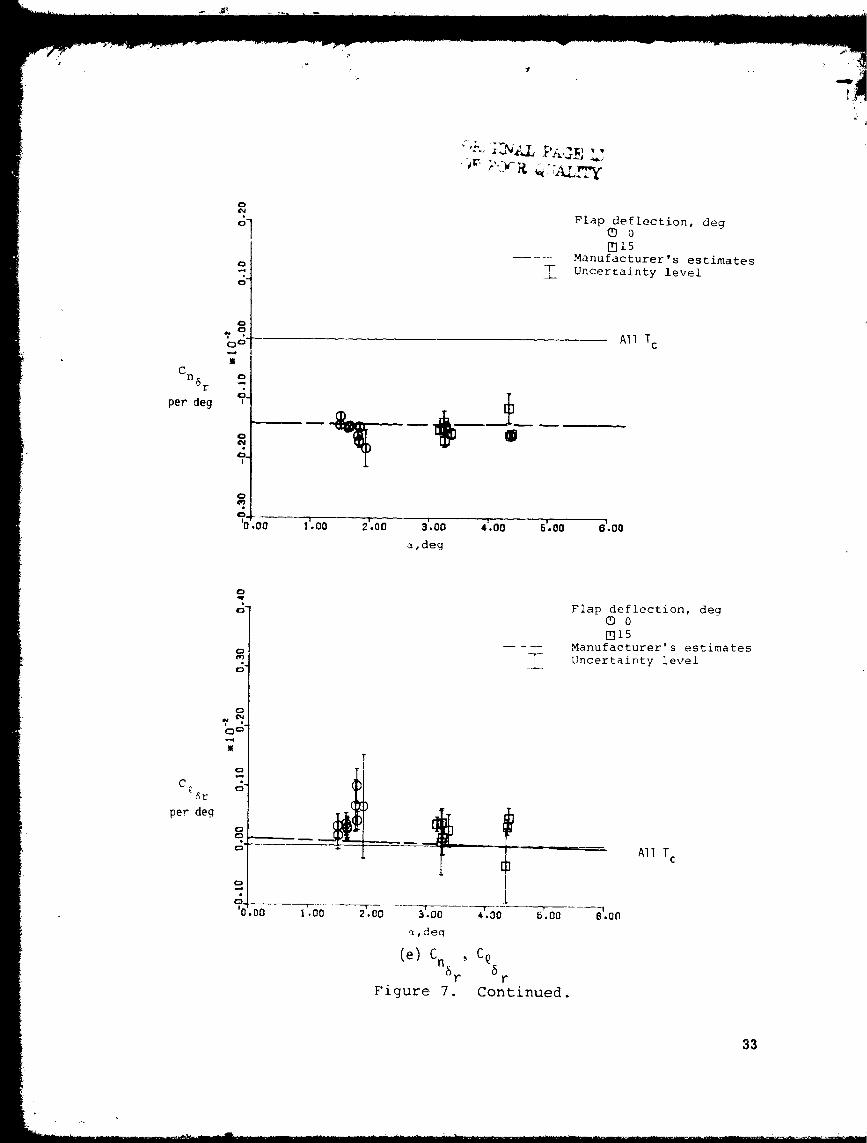
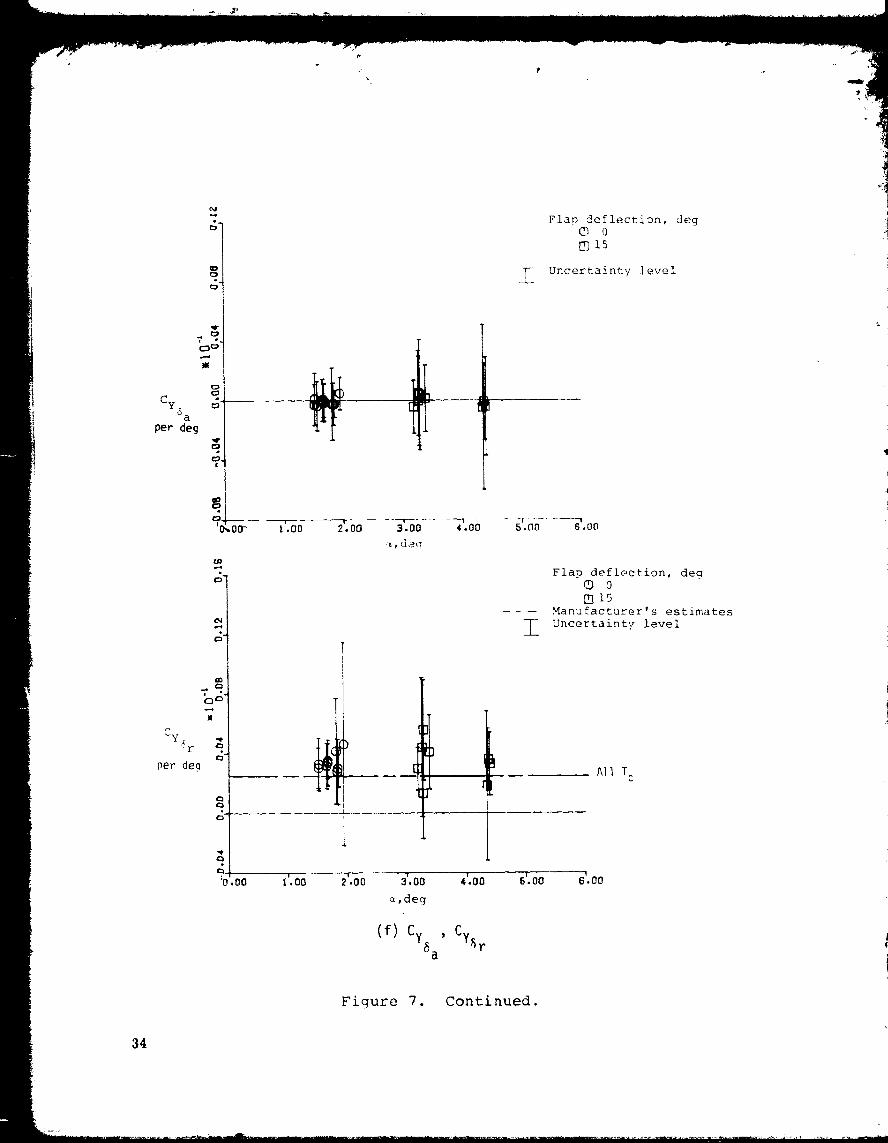
simultaneous aileron and rudder inputs) are presented in figures 6 and 7.
5
The longitudinal stability and control derivative estimates are pres-
ented in figure 6, while the lateral-directional estimates are displayed in
figure 7. Each symbol indicates the derivative estimate for one maneuver,
and the vertical bar associated with the symbol represents the uncertainty
level for that derivative estimate. The square symbols are used to indicate
one-third flap down maneuvers. Manufacturer predicted derivatives based on
a combination of analytical predictions, wind tunnel tests, and flight test
results are shown along with the MMLE-3 derivative estimates for comparison.
The manufacturer's predictions of derivatives that are functions of
thrust coefficient (CN , CN , Cm , and Cn ) are indicated by dashed linesa 6e 6e
for thrust coefficients of 0 and 0.1. This range of thrust coefficients in-cludes the values observed in flight (see table 3). The manufacturer's pred-ictions for the derivatives that are not functions of thrust coefficient are
indicated by a single dashed line. These predictions are valid for both cruiseand one-third flap down configurations. Details of the mathematics involved inthe presentation of the manufacturer's derivatives are given in appendix B.
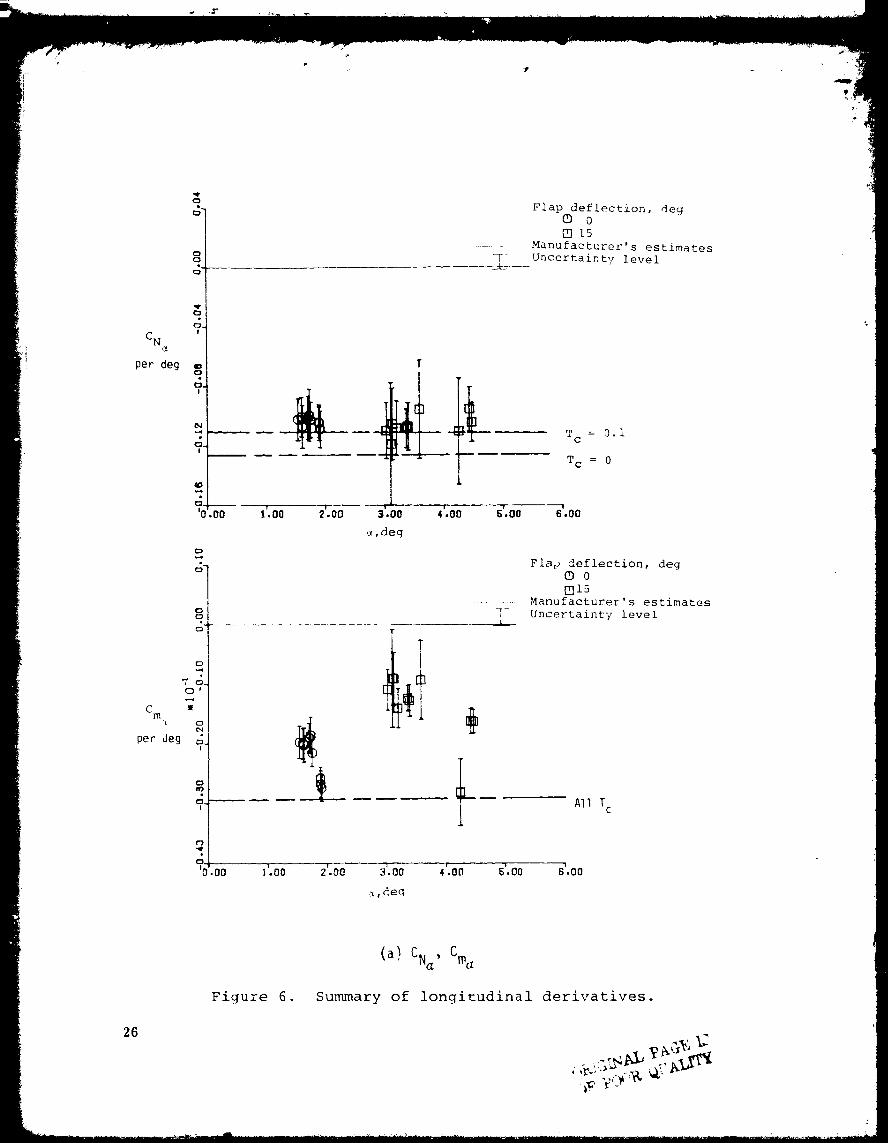
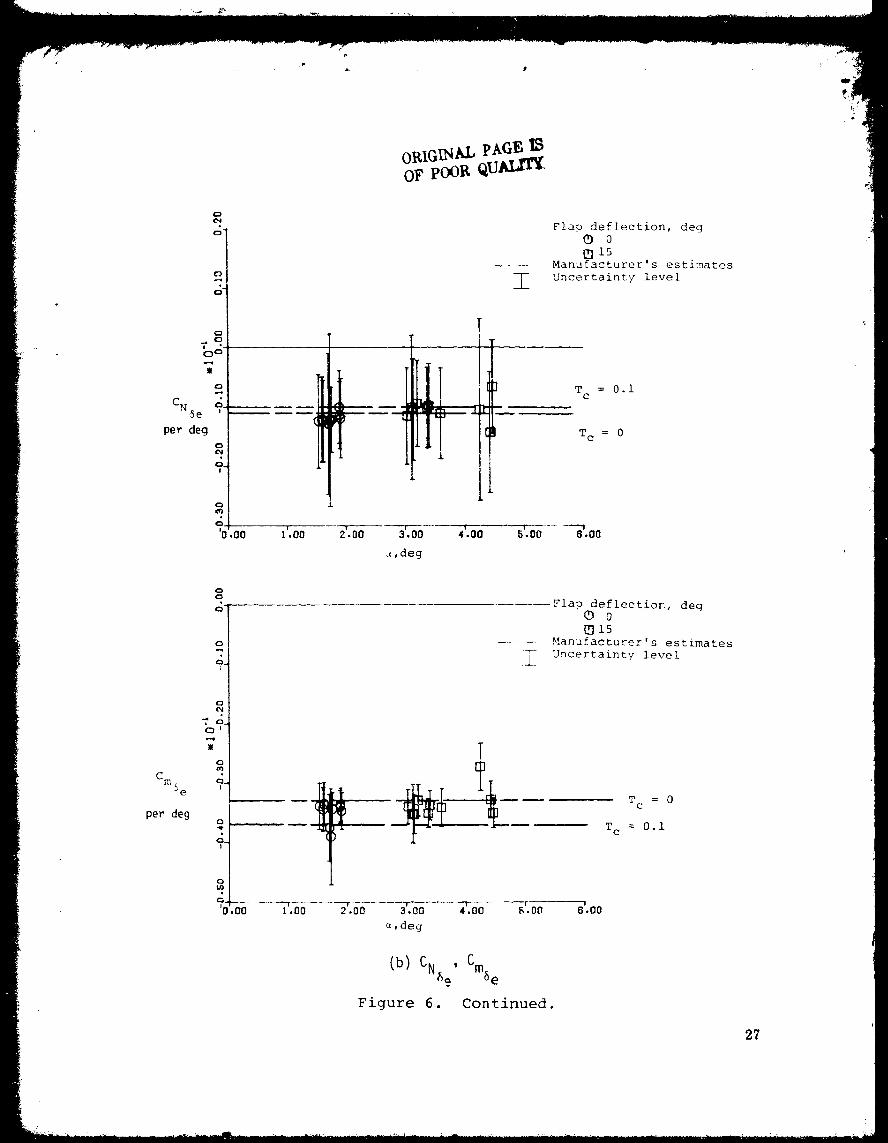
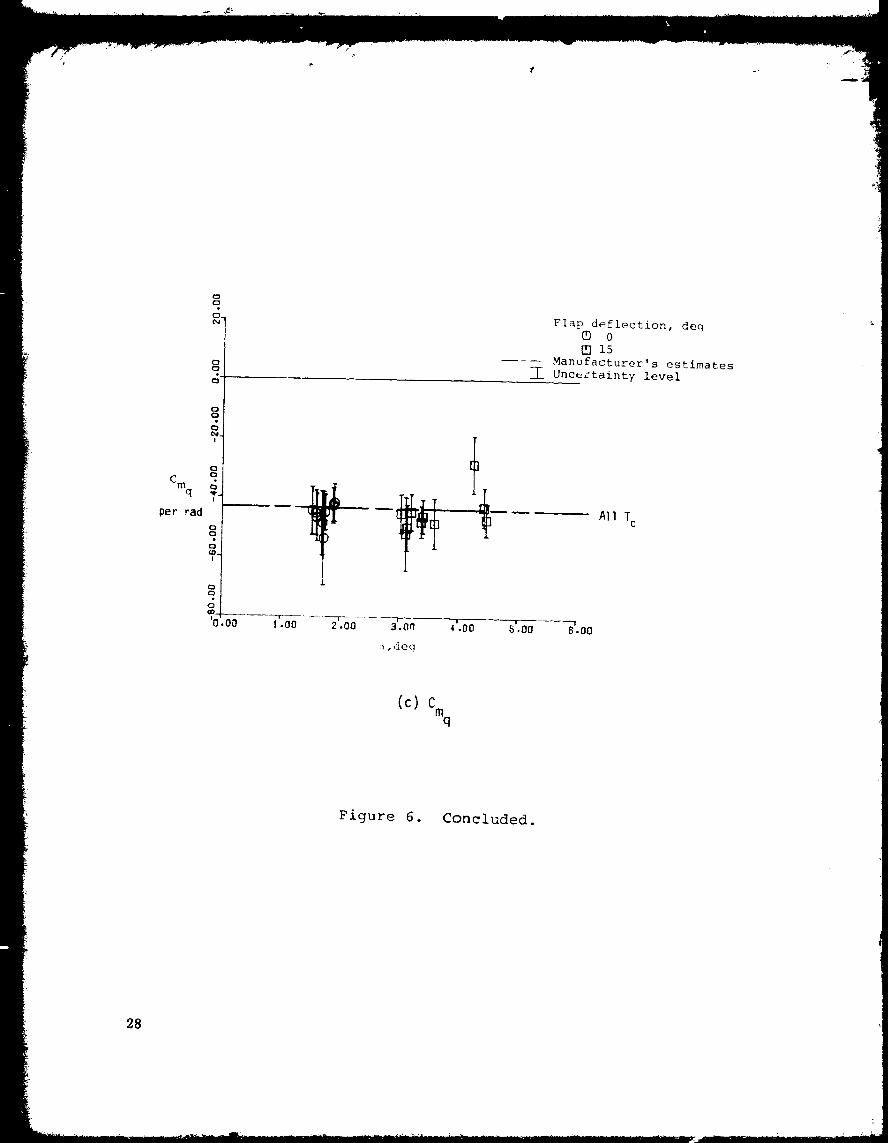
LONGITUDINAL DERIVATIVES
Figure 6 shows the MMLE-3 longitudinal derivative estimates for the Beech
99 aircraft along with the corresponding predictions of the manufacturer.
Comparison between the flight estimates and the manufacturers predictions
shows close agreement except for the derivative Cm For some unexplained
reason, the flight data did not produce consistent estimates of this deriva-
tive. Other flight estimated derivatives are consistent, with the exception
of the estimates of Cm and Cm resulting from one maneuver at an angle of
q 6e
attack of 4.25 degrees. The plots of CN_' Cmq' CN_e' and Cm6e are nearly
constant with angle of attack, showing no observable effect of flap deflection.
All these parameters show good agreement with the manufacturer's estimates.
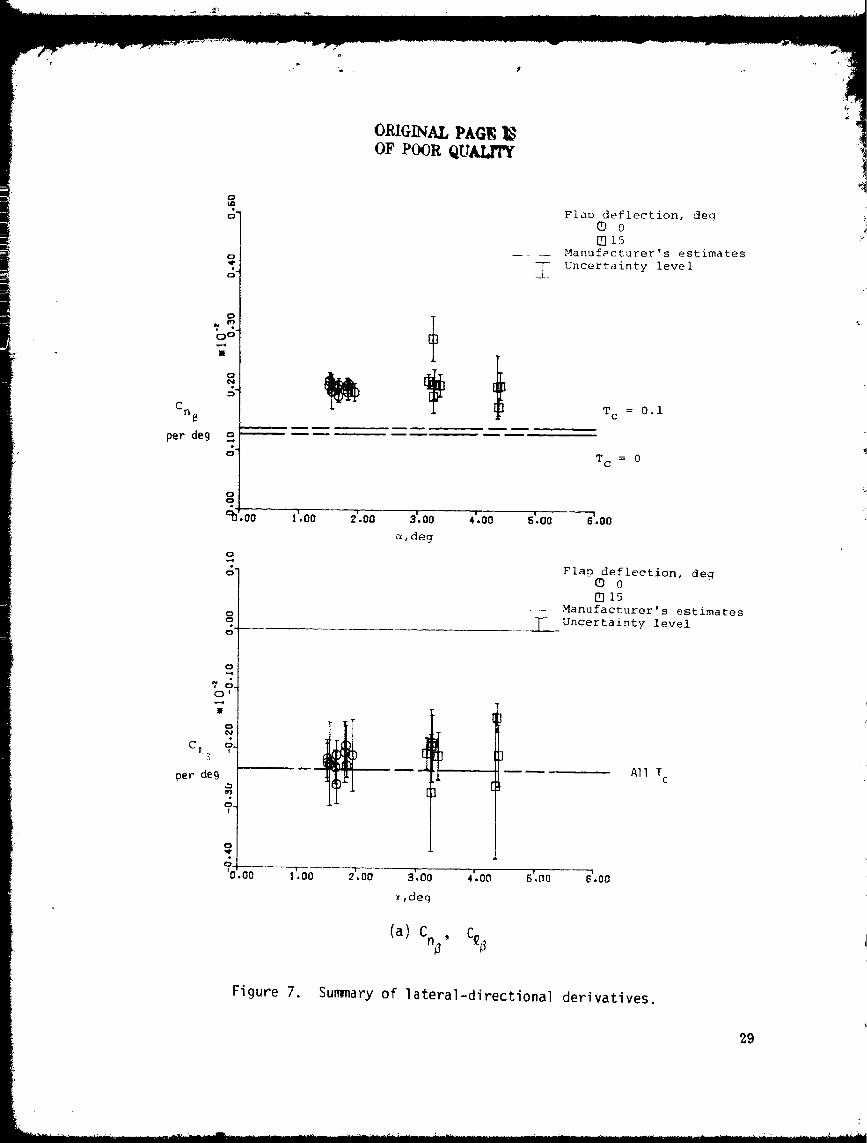
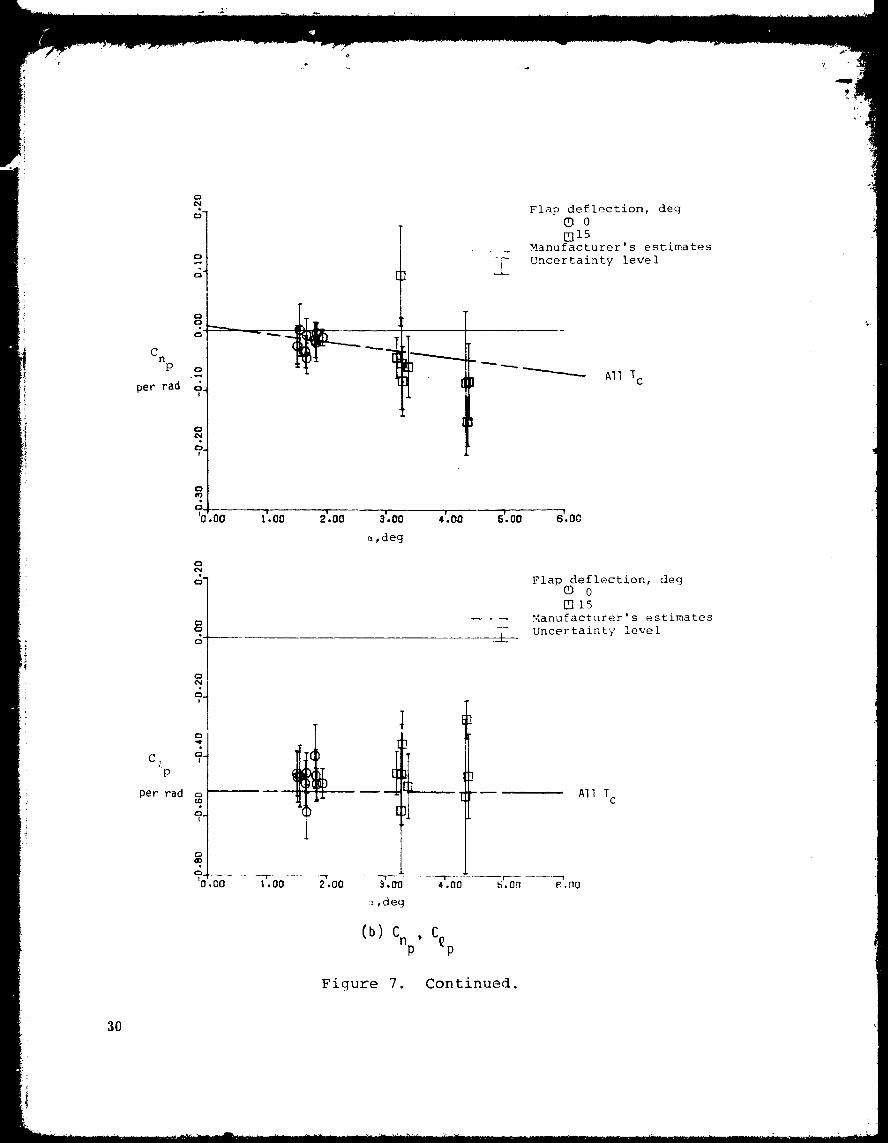
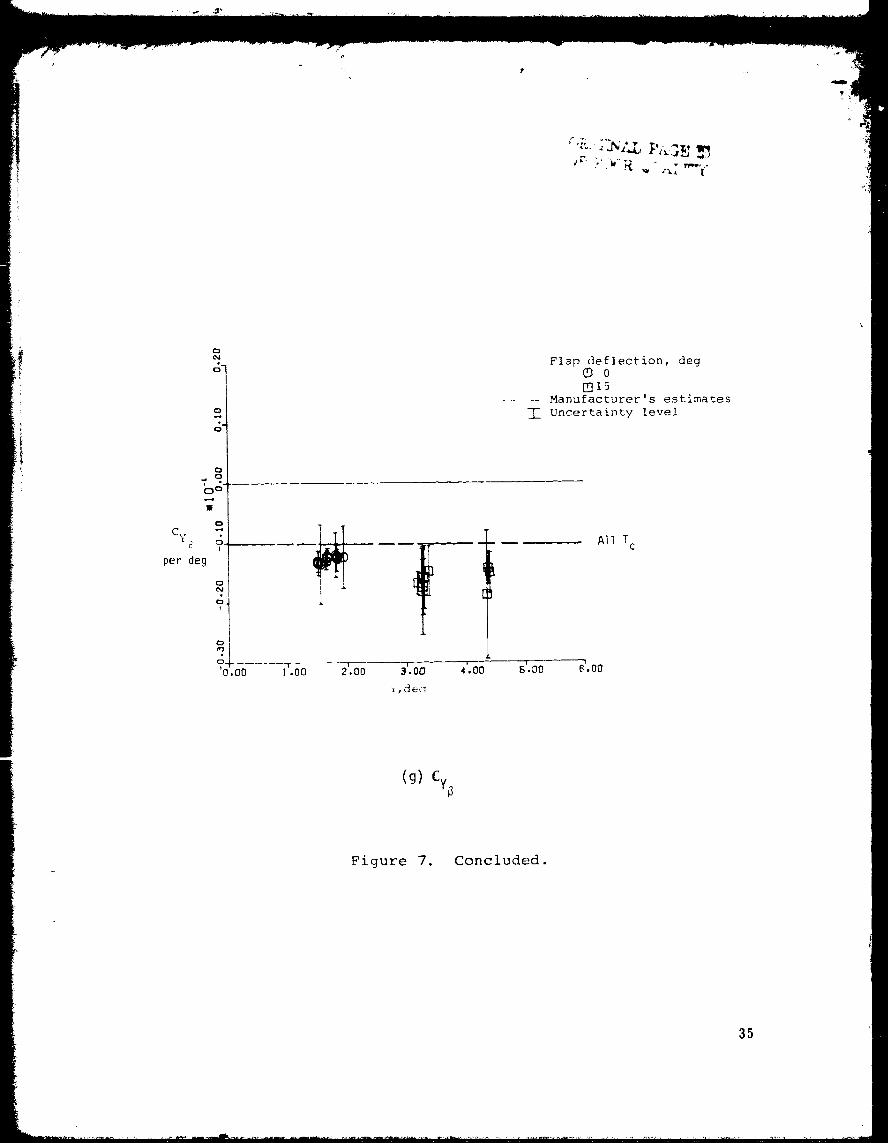
LATERAL-DIRECTIONAL DERIVATIVES
As with the longitudinal derivatives, the lateral-directional deriva-
tives are plotted with the manufacturer's estimates (fig. 7). The deriva-
tives , Cn , Cy , Cy , , and C are quite con-C_B C_p, P C_r' Cnr' _a 6r C£_r n6r
sistent with the derivative estimates of the manufacturer. C_ is for
'6a
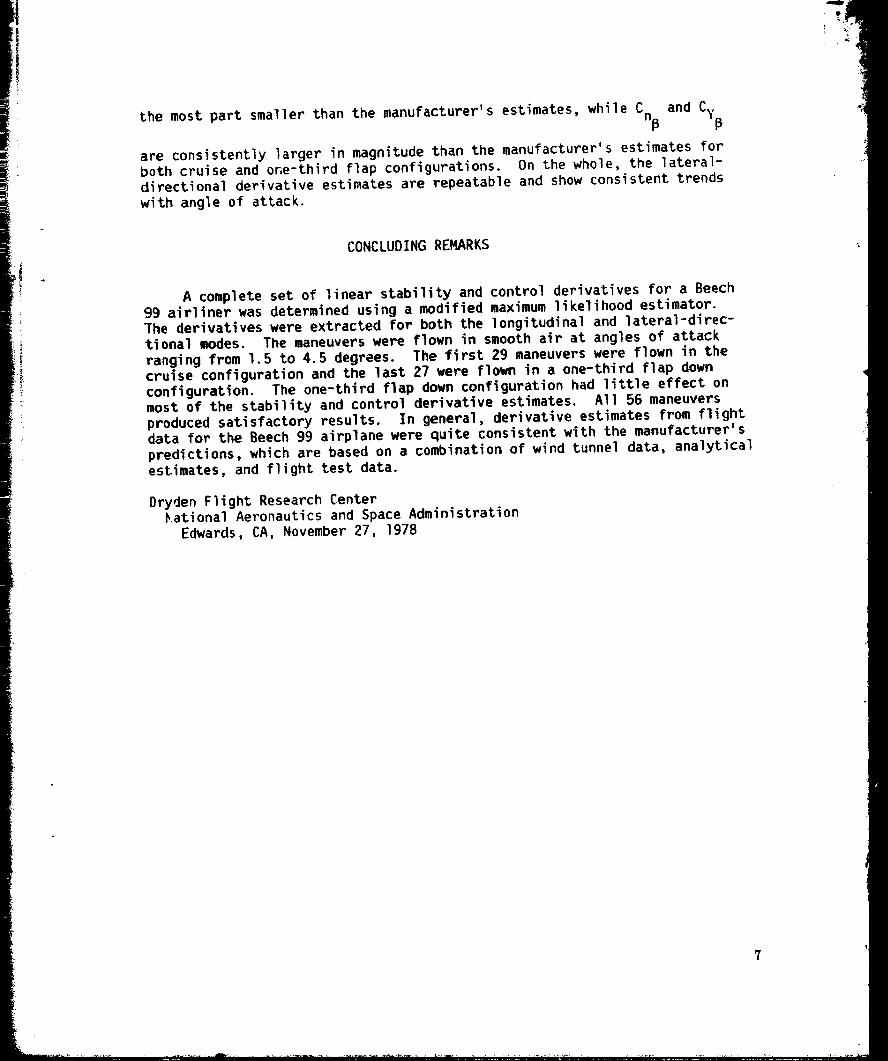
the most part smaller than the manufacturer's estimates, while CnBand CyB
are consistently larger in magnitude than the manufacturer's estimates forboth cruise and one-third flap configurations. On the whole, the lateral-directional derivative estimates are repeatable and show consistent trendswith angle of attack.
CONCLUDINGREMARKS
A complete set of linear stability and control derivatives for a Beech
99 airliner was determined using a modified maximum likelihood estimator.
The derivatives were extracted for both the longitudinal and lateral-direc-
tional modes. The maneuvers were flown in smooth air at angles of attack
ranging from 1.5 to 4.5 degrees. The first Z9 maneuvers were flown in thecruise configuration and the last 27 were flown in a one-third flap down
configuration. The one-third flap down configuration had little effect on
most of the stability and control derivative estimates. All 56 maneuvers
produced satisfactory results. In general, derivative estimates from flight
data for the Beech 99 airplane were quite consistent with the manufacturer's
predictions, which are based on a combination of wind tunnel data, analyticalestimates, and flight test data.
Dryden Flight Research Center
kational Aeronautics and Space Administration
Edwards, CA, November 27, 1978
7
-,B
t_J
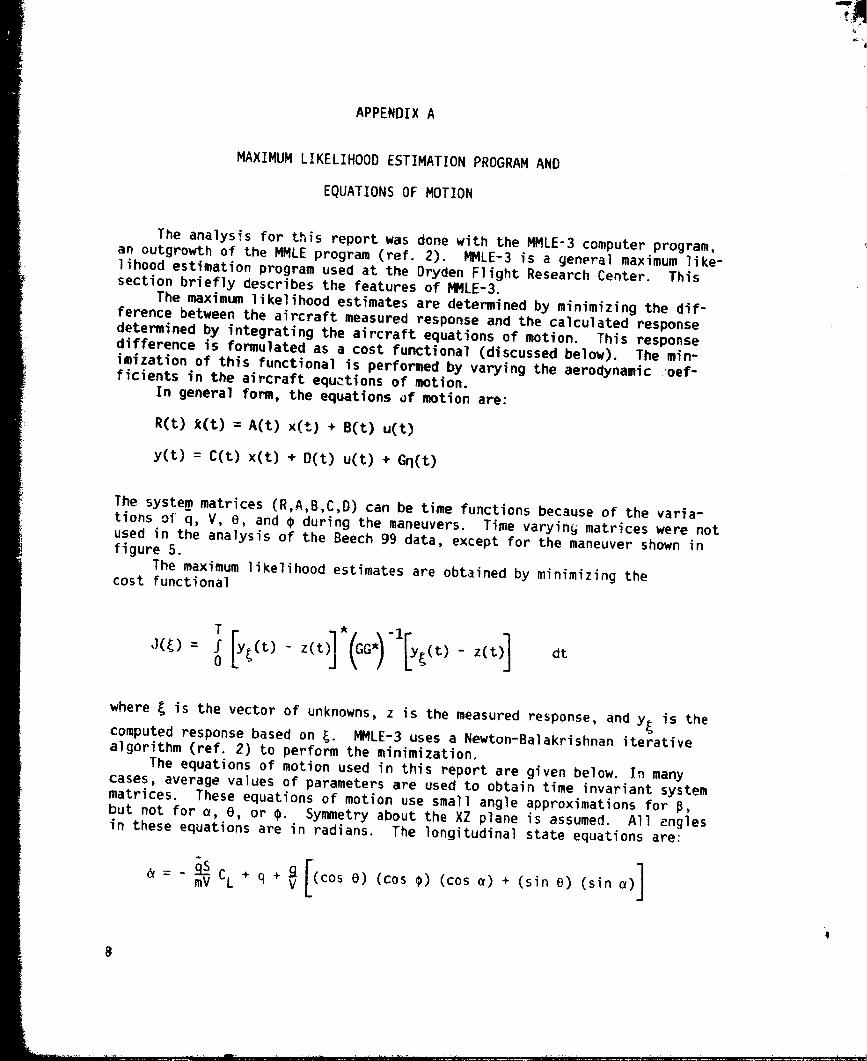
APPENDIX A
MAXIMUM LIKELIHOOD ESTIMATION PROGRAM AND
EQUATIONS OF MOTION
The analysis for this report was done with the MMLE-3 computer program,
an outgrowth of the MMLE program (ref. 2). MMLE-3 is a general maximum like-
lihood estimation program used at the Dryden Flight Research Center. This
section briefly describes the features of MMLE-3.
The maximum likelihood estimates are determined by minimizing the dif-ference between the aircraft measured response and the calculated response
determined by integrating the aircraft equations of motion. This response
difference is formulated as a cost functional (discussed below). The min-
imization of this functional is performed by varying the aerodynamic ;'oef-
ficients in the aircraft equctions of motion.
In genera] form, the equations uf motion are:
R(t) _(t) = A(t) x(t} + B(t) u(t)
y(t) = C(t) x(t) + D(t) u(t) +Gq(t)
The system matrices (R,A,B,C,D) can be time functions because of the varia-tions of q, V, B, and _ during the maneuvers. Time varyin§ matrices were not
used in the analysis of the Beech 99 data, except for the maneuver shown in
figure 5.
The maximum likelihood estimates are obtained by minimizing thecost functional
dt
where _ is the vector of unknowns, z is the measured response, and y_ is the
computed response based on _. MMLE-3 uses a Newton-Balakrishnan iterative
algorithm (ref. 2) to perform the minimization.
The equations of motion used in this report are given below. In many
cases, average values of parameters are used to obtain time invariant system
matrices. These equations of motion use small angle approximations for 6,but not for _, B, or _. Symmetry about the XZ plane is assumed. All engles
in these equations are in radians. The longitudinal state equations are:
[ ](_= - m_VS CL + q + V_ (cos O) (cos _) (cos e) + (sin B) (sin a)
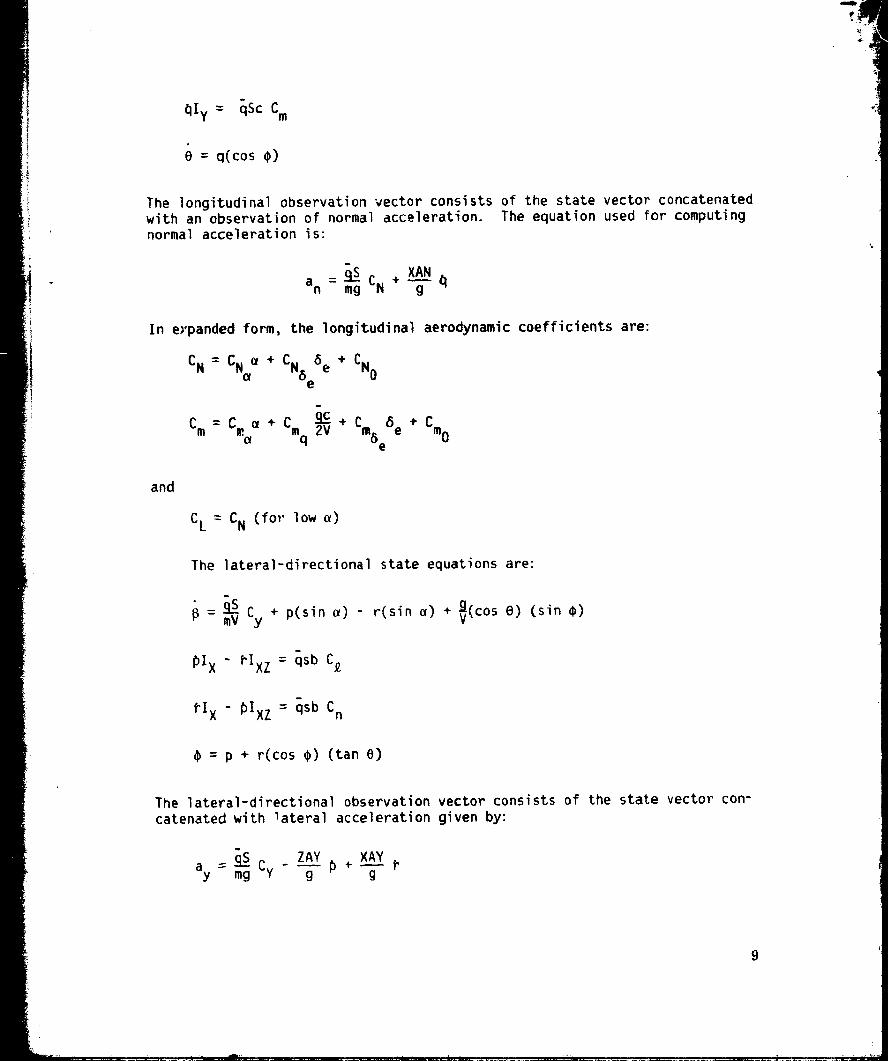
_Iy = qSc Cm
O = q(cos ¢)
The longitudinal observation vector consists of the state vector concatenated
with an observation of normal acceleration. The equation used for computingnormal acceleration is:
_]S CN + XANan = mg _ _
In e)'panded form, the longitudinal aerodynamic coefficients are:
The lateral-directional observation vector consists of the state vector con-
catenated with lateral acceleration given by:
ay = m_gS Cy_ ZAY XAY
g _+ _g
9
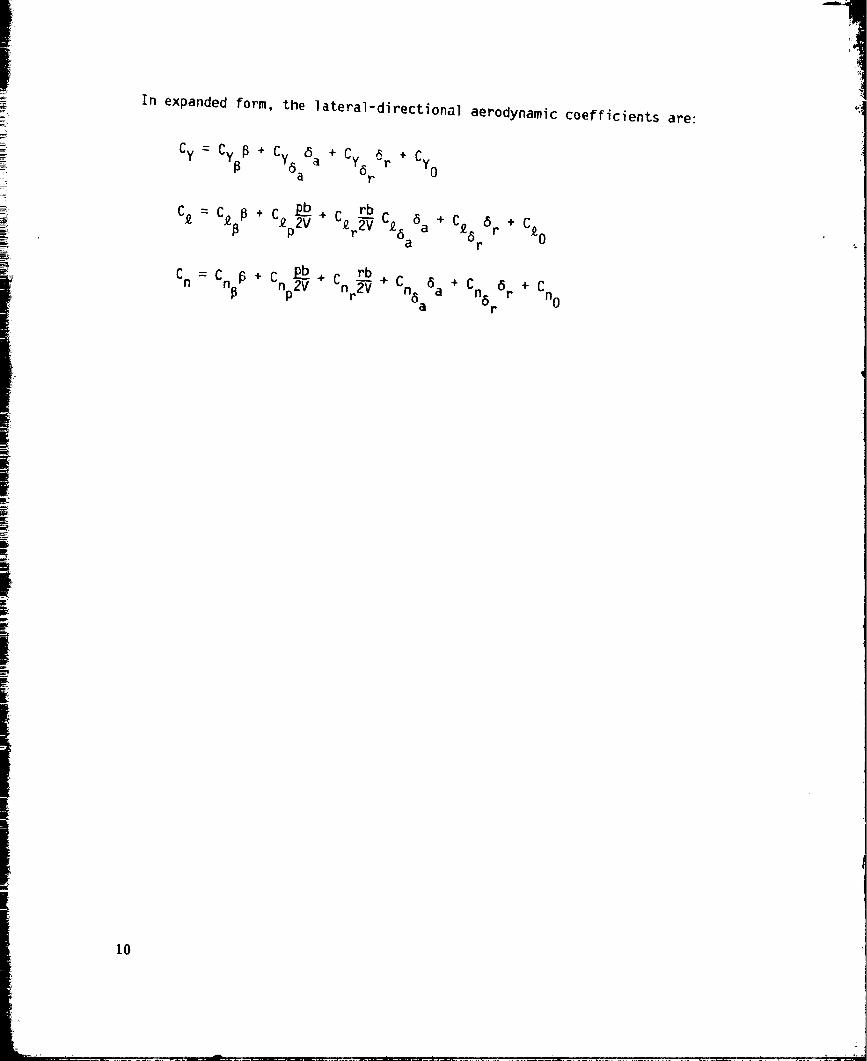
In expandedform, the lateral-directional aerodynamic coefficients are:
Cy = Cy _ + Cy 6 + _r +5a a CY6r CYo
+ C_p_+ C_rrbC_6 6a C£6 r+ 6 +
a r C_O
Cn = Cn_ + Cn _ + Cnrr_ + Cn6 6p aa
+ Cn6 8r + Cnor
-'I
10
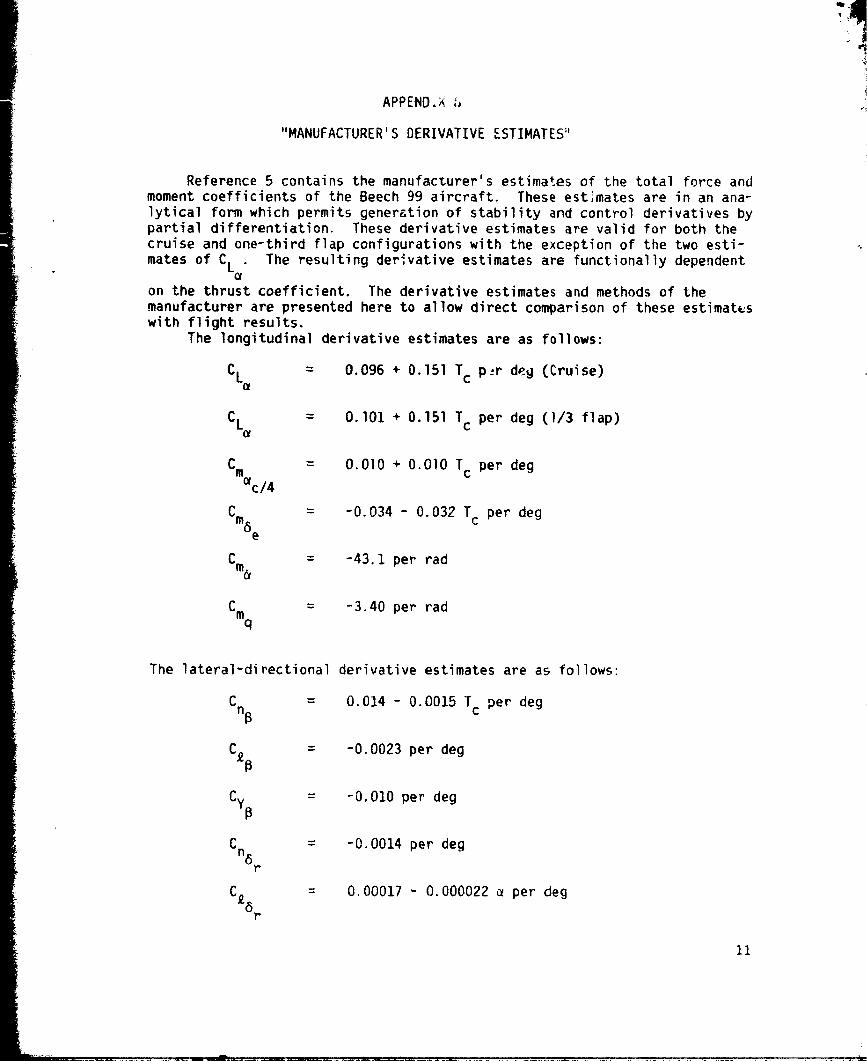
APPEND,Xi,
"MANUFACTURER'SDERIVATIVEESTIMATES"
Reference 5 contains the manufacturer's estimates of the total force and
moment coefficients of the Beech 99 aircraft. These estlmates are in an ana-
lytical form which permits generation of stability and control derivatives bypartial differentiation. These derivative estimates are valid for both the
cruise and one-third flap configurations with the exception of the two esti-
mates of CL . The resulting derivative estimates are functionally dependent
on the thrust coefficient. The derivative estimates and methods of the
manufacturer are presented here to allow direct comparison of these estimates
with flight results.
The longitudinal derivative estimates are as follows:
CL 0.096 + 0.151T c p_r deg (Cruise)
CL 0.101 + 0.151T c per deg (I/3 flap)
Cm = O.OlO + O.OlO Tc per deg
_c/4
Cm5 = -0.034 - 0.032 Tc per dege
Cm_ = -43.1 per tad
Cm = -3.40 per radq
The lateral-directional derivative estimates are as follows-
C = 0.014 - 0.0015 T per degnB c
c_-0.0023 per deg
Cy@ = -0,010 per deg
Cn6
y-
-0.0014 per deg
0.00017 - 0.000022 _ per deg
11
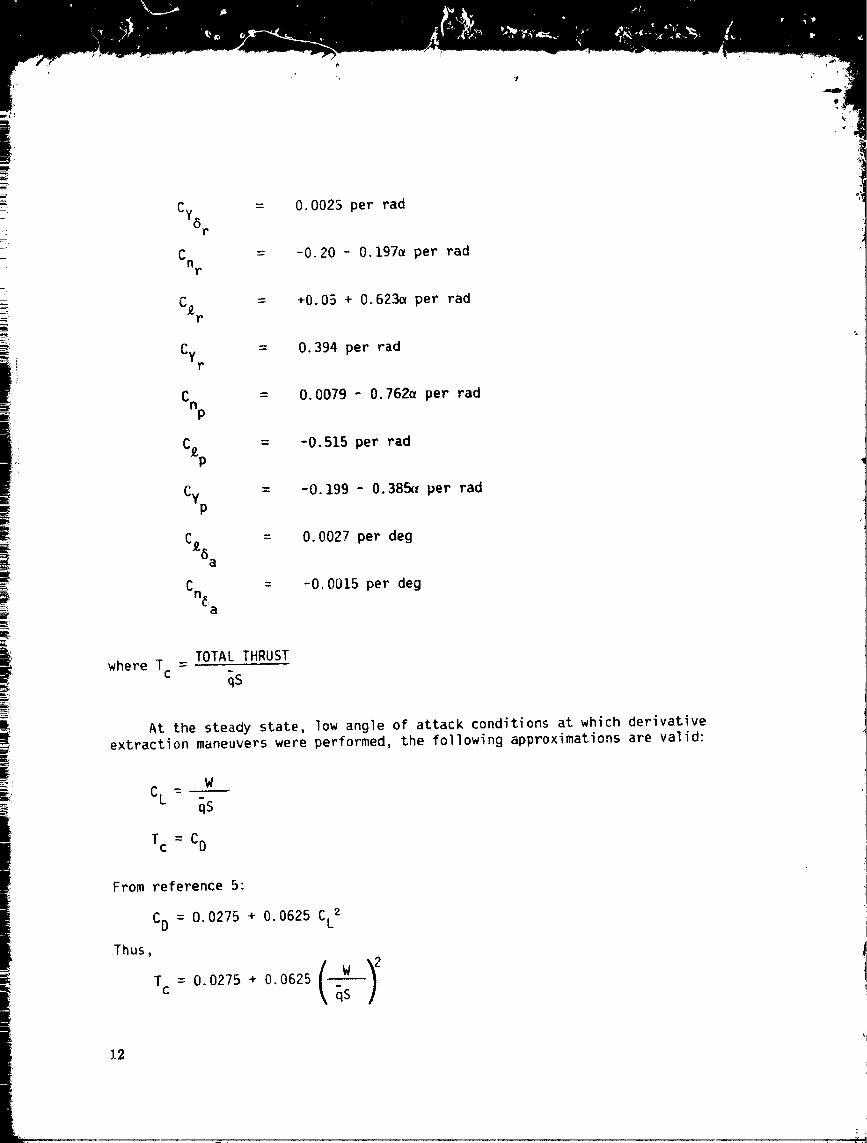
Cy6 = 0.0025 per radr
Cnr
C£r
-0.20 - 0.197e per rad
+0.05 + 0.623_ per rad
CYr = 0.394 per tad
Cnp0.0079 - 0.762e per rad
C£p = -0.515 per rad
Cyp-0.199 - 0.38_t per rad
C£6 = 0.0027 per dega
-0.0015 per deg
where TC
TOTAL THRUST
qS
At the steady state, low angle of attack conditions at which derivative
extraction maneuvers were performed, the following approximations are valid:
WCL -
i Tc = CO
From reference 5"
CD = 0.0275 + 0.0625 CL2
Thus,
Tc = 0.0275 + 0.0625 { W y
\qS !
12
.... CC_
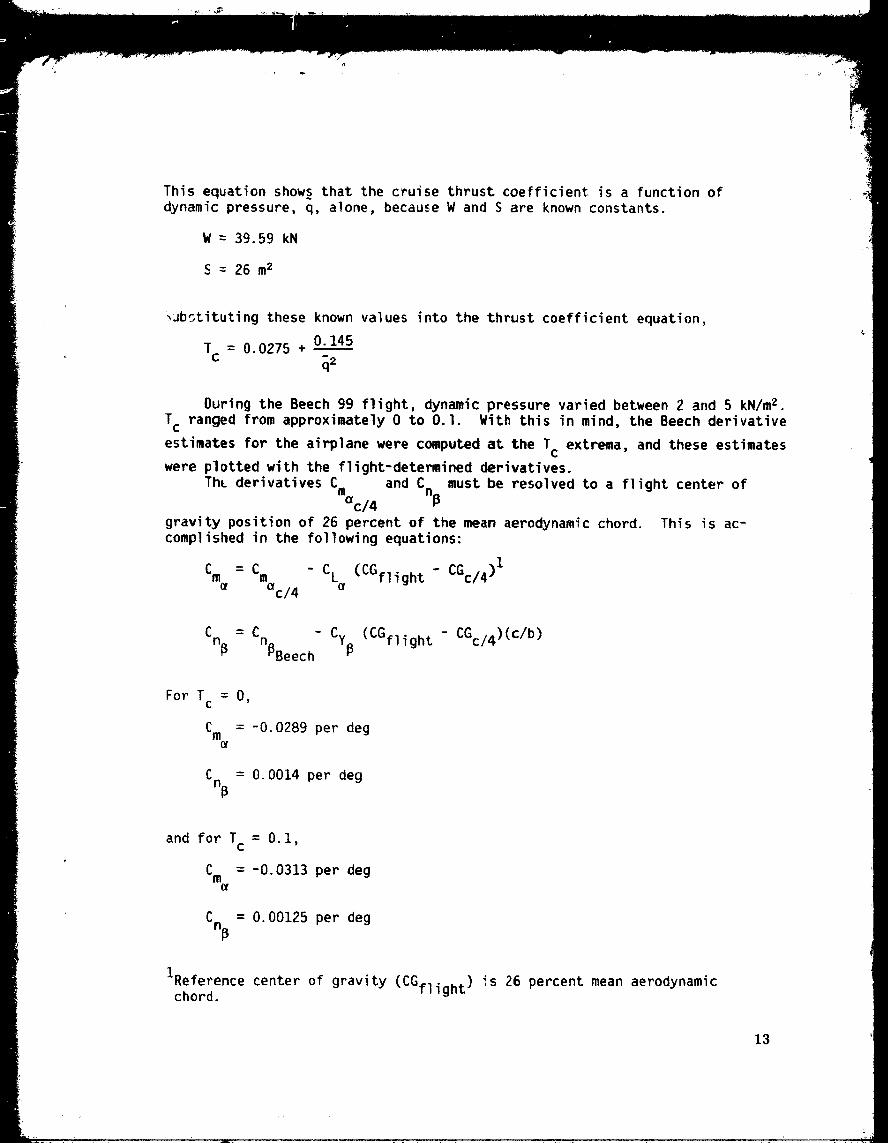
This equation shows that the cruise thrust coefficient is a function of
dynamic pressure, q, alone, because W and S are known constants.
W = 39.59 kN
S = 26 m2
_Jb_tituting these known values into the thrust coefficient equation,
0.145T = 0.0275 +_
c
During the Beech 99 flight, dynamic pressure varied between 2 and 5 kN/m2.
Tc ranged from approximately 0 to 0.1. With this in mind, the Beech derivative
estimates for the airplane were computed at the Tc extrema, and these estimates
were plotted with the flight-determined derivatives.
ThL derivatives Cm and Cn_ must be resolved to a flight center ofacl4
gravity position of 26 percent of the mean aerodynamic chord. This is ac-
complished in the following equations:
Cm = Cm - CL (CGflight - CGc/4 )1
ac/4 e
Crib Cn_Beech Cy_ (CGflight CGc/4)(c/b )
For T = O,C
Cm
= -0.0289 per deg
C = 0.0014 per degnB
and for T = 0.1,C
Cm
= -0.0313 per deg
CnB= 0.00125 per deg
1Reference center of gravity (CGflight) is 26 percent aerodynamicmeanchord.
13
li
REFERENCES
I °
.
.
.
.
I1iff, Kenneth W.; and Taylor, Lawrence W., Jr.: Determination of
Stability Derivatives From Flight Data Using a Newton-RaphsonMinimization Technique. NASA TN D-6579, 1972.
Maine, Richard E.; and Iliff, Kenneth W.: A FORTRAN Program forDetermining Aircraft Stability and Control Derivatives FromFlight Data. NASA TN D-7831, 1975.
Jenks, Gerald E.; Henry, Howard F.; and Roskam, Jan: Flight Test
Results for a Separate Surface Stability Augmented Beech Model99. NASA CR-143839, 1977.
Iliff, Kenneth W.; and Maine, Richard E.: Practical Aspects of
Using a Maximum Likelihood Estimation Method to Extract Sta-
bility and Control Derivatives From Flight Data. NASA TN D-8209, 1976.