NITRATE CONCENTRATION IN DRINKING NITRATE CONCENTRATION IN DRINKING WATER FROM WELLS AT THREE DIFFERENT WATER FROM WELLS AT THREE DIFFERENT LOCATIONS IN LOCATIONS IN NORTHWEST CROATIA NORTHWEST CROATIA Jasna NEMCIC JUREC Jasna NEMCIC JUREC Milan MESIC Milan MESIC Ferdo BASIC Ferdo BASIC Ivica KISIC Ivica KISIC Zeljka ZGORELEC Zeljka ZGORELEC
Transcript
NITRATE CONCENTRATION IN NITRATE CONCENTRATION IN DRINKING WATER FROM WELLS AT DRINKING WATER FROM WELLS AT THREE DIFFERENT LOCATIONS INTHREE DIFFERENT LOCATIONS IN
Agriculture is often recognized as one of the most Agriculture is often recognized as one of the most important non-point-source of pollution with important non-point-source of pollution with nitrogen (N) and in some areas it can be a major nitrogen (N) and in some areas it can be a major cause of water-quality problemscause of water-quality problems
Excessive levels of N-fertilisation may increase Excessive levels of N-fertilisation may increase nitrate (NO3-) leaching although some natural nitrate (NO3-) leaching although some natural processes can be also taken into account when processes can be also taken into account when groundwater nitrate levels are discussed groundwater nitrate levels are discussed
Groundwater pollution by nitrates has become a Groundwater pollution by nitrates has become a problem of major concern for surrounding problem of major concern for surrounding communities that use groundwater as their water communities that use groundwater as their water supply.supply.
EU Nitrate DirectiveEU Nitrate Directive(91/676/EEC)(91/676/EEC)
WWas designed to reduce water pollution as designed to reduce water pollution from agriculturally derived nitrates from agriculturally derived nitrates
Drinking water Directive establishes Drinking water Directive establishes maximum allowable level of 50 mgmaximum allowable level of 50 mg/L/L and and guideline level of 25 mgguideline level of 25 mg/L /L
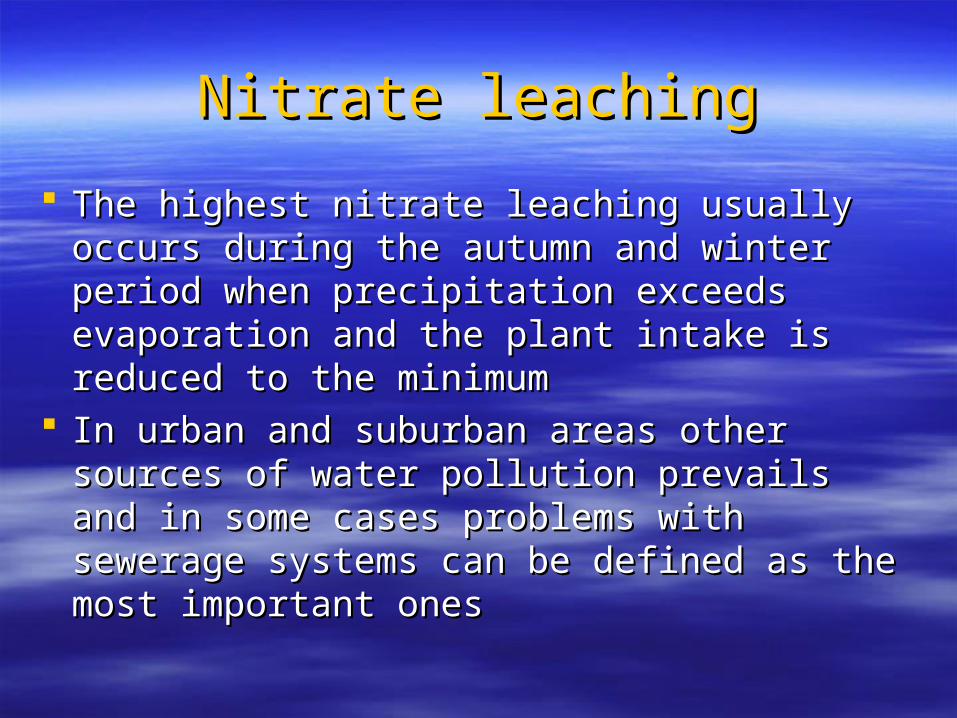
Nitrate leachingNitrate leaching
TThe highest nitrate leaching usually occurs he highest nitrate leaching usually occurs during the autumn and winter period when during the autumn and winter period when precipitation exceeds evaporation and the precipitation exceeds evaporation and the plant intake is reduced to the minimum plant intake is reduced to the minimum
In urban and suburban areas other sources In urban and suburban areas other sources of water pollution prevails and in some of water pollution prevails and in some cases problems with sewerage systems can cases problems with sewerage systems can be defined as the most important ones be defined as the most important ones
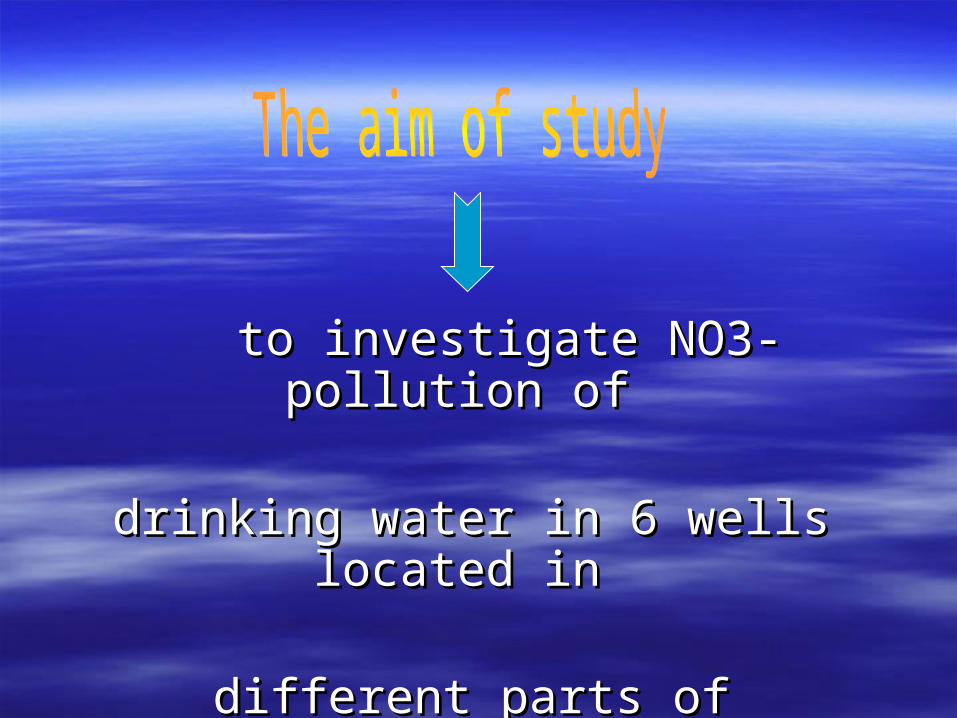
to investigate NO3- pollution of to investigate NO3- pollution of
drinking water in 6 wells located in drinking water in 6 wells located in
different parts of Northwest Croatiadifferent parts of Northwest Croatia
MATERIAL AND METHODSMATERIAL AND METHODS LLocations were used for this researchocations were used for this research
Kalnik Kalnik Area of Kalnik is presented with Area of Kalnik is presented with
400 m deep water well (L1) without 400 m deep water well (L1) without any influence of agriculture or any influence of agriculture or urbanisation on nitrate concentration urbanisation on nitrate concentration in exhausted water. Water samples in exhausted water. Water samples from this location were used as a from this location were used as a control for comparison of nitrate control for comparison of nitrate concentration in water from other 2 concentration in water from other 2 locations. locations.
Krizevci Krizevci Water samples from 2 wells Water samples from 2 wells (10-50 m (10-50 m
depth) depth) in suburb of Krizevci (L3 i L4) in suburb of Krizevci (L3 i L4) represent an area with possible represent an area with possible influence of agriculture combined influence of agriculture combined with inadequate sewerage systems with inadequate sewerage systems of the households but without of the households but without possibility for detailed distinction of possibility for detailed distinction of main source. main source.
KoprivnicaKoprivnica Area of Koprivnica is presented with Area of Koprivnica is presented with
3 wells 3 wells (10-50 m depth) (10-50 m depth) that are that are located mainly in area of intensive located mainly in area of intensive agricultural production (L2, L5 and agricultural production (L2, L5 and L6). L6).
LOCATIONS OF WELLS INCLUDED IN LOCATIONS OF WELLS INCLUDED IN MONITORINGMONITORING
Ground water samples were collected weekly on described Ground water samples were collected weekly on described locations (L1-L6) in the period from April 1st 2005 to April 1st 2006 locations (L1-L6) in the period from April 1st 2005 to April 1st 2006
Immediately after sampling samples were stored in 1 L plastic Immediately after sampling samples were stored in 1 L plastic bottles at temperature between 4°C to 6°Cbottles at temperature between 4°C to 6°C
Method used for analyses was Ion chromatography (HRN ISO Method used for analyses was Ion chromatography (HRN ISO 10304-1:1998) 10304-1:1998)
IC system-Dionex DX 500IC system-Dionex DX 500 gradient pump GP 40gradient pump GP 40 autosampler AS 4autosampler AS 40 0 chromatographic chromatographic compartment LC 20 compartment LC 20 conductivity detector CD 20conductivity detector CD 20 cchemical suppression was hemical suppression was
performed by using Dionex performed by using Dionex ASRS-ULTRA 4 mm ASRS-ULTRA 4 mm suppressor suppressor
eentire system was controlled ntire system was controlled by Dionex Peak Net 5.2 by Dionex Peak Net 5.2 software.software.
ffor separation Dionex Ion Pac or separation Dionex Ion Pac AS-9-HC analytic column AS-9-HC analytic column (4x250 mm) and suitable (4x250 mm) and suitable guard column Ion Pac AG 9-guard column Ion Pac AG 9-HC (4x50mm) have been HC (4x50mm) have been usedused
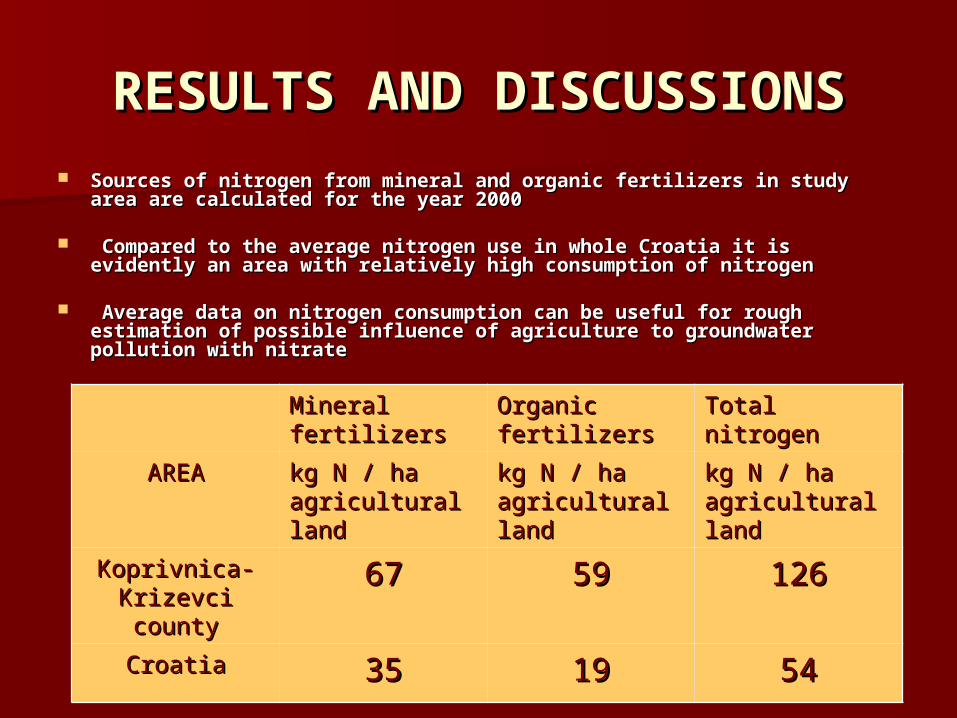
RESULTS AND DISCUSSIONSRESULTS AND DISCUSSIONS Sources of nitrogen from mineral and organic fertilizers in study area Sources of nitrogen from mineral and organic fertilizers in study area
are calculated for the year 2000 are calculated for the year 2000
Compared to the average nitrogen use in whole Croatia it is evidently Compared to the average nitrogen use in whole Croatia it is evidently an area with relatively high consumption of nitrogenan area with relatively high consumption of nitrogen
Average data on nitrogen consumption can be useful for rough Average data on nitrogen consumption can be useful for rough estimation of possible influence of agriculture to groundwater estimation of possible influence of agriculture to groundwater pollution with nitratepollution with nitrate
Mineral Mineral fertilizersfertilizers
Organic Organic fertilizersfertilizers
Total nitrogenTotal nitrogen
AREAAREA kg N / ha kg N / ha agricultural agricultural landland
kg N / ha kg N / ha agricultural agricultural landland
kg N / ha kg N / ha agricultural agricultural landland
Koprivnica-Koprivnica-Krizevci countyKrizevci county
6767 5959 126126
CroatiaCroatia 3535 1919 5454
Average nitrogen load from mineral and organic fertilizers for year 2000.
Nitrogen balance, 2000.Nitrogen balance, 2000.
N
EW
S
50 0 50 100 KilometersKm
Površinska bilanca dušika za poljoprivredna tla u 2000 g.prema županijama i poljoprivrednim regijama Hrvatske
-20--10-10-00-1010-2030-4040-5050-6060-7080-90
Tumaè
kgha -1N
Autori: Milan Mesiæ, Stjepan Husnjak
Granica poljoprivrednih regija
Granica poljoprivrednih podregija
Granica Županija
Poljoprivredne regije i podregije
P1P2
P3
P4
G1
G2J1
J2
J3
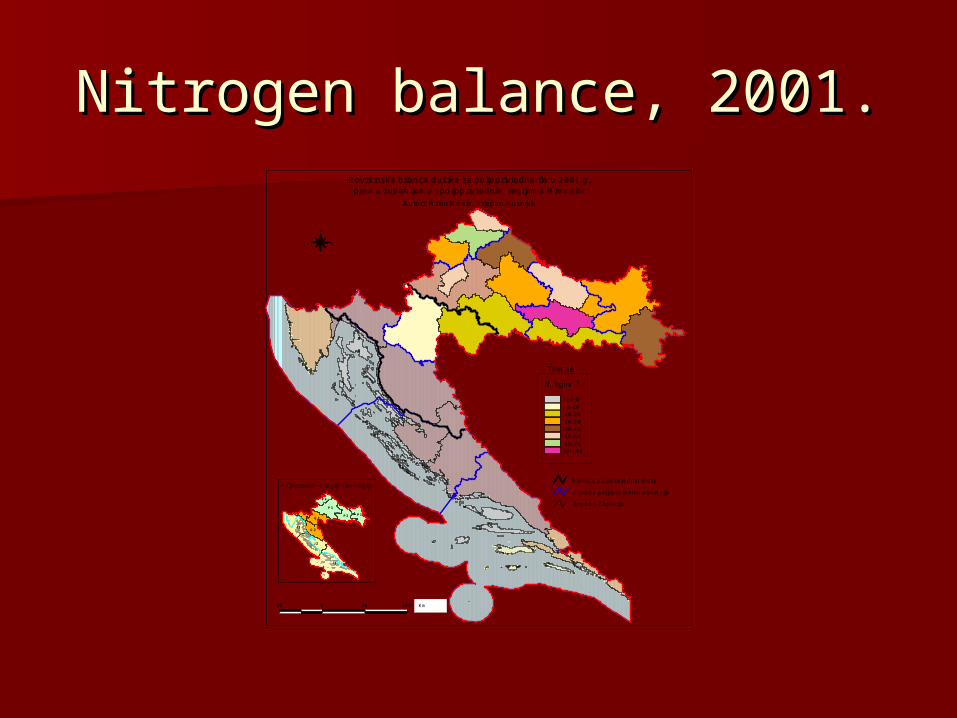
Nitrogen balance, 2001.Nitrogen balance, 2001.
N
EW
S
50 0 50 100 KilometersKm
N -1kgha
Tumaè
20-30
90-10060-7040-5030-40
10-200-10
-10-0
Autori: Milan Mesiæ, Stjepan Husnjak
Poljoprivredne regije i podregijeGranica poljoprivrednih regija
Granica poljoprivrednih podregija
Granica Županija
Površinska bilanca dušika za poljoprivredna tla u 2001 g.prema županijama i poljoprivrednim regijama Hrvatske
P1P2
P3
P4
G1
G2J1
J2
J3
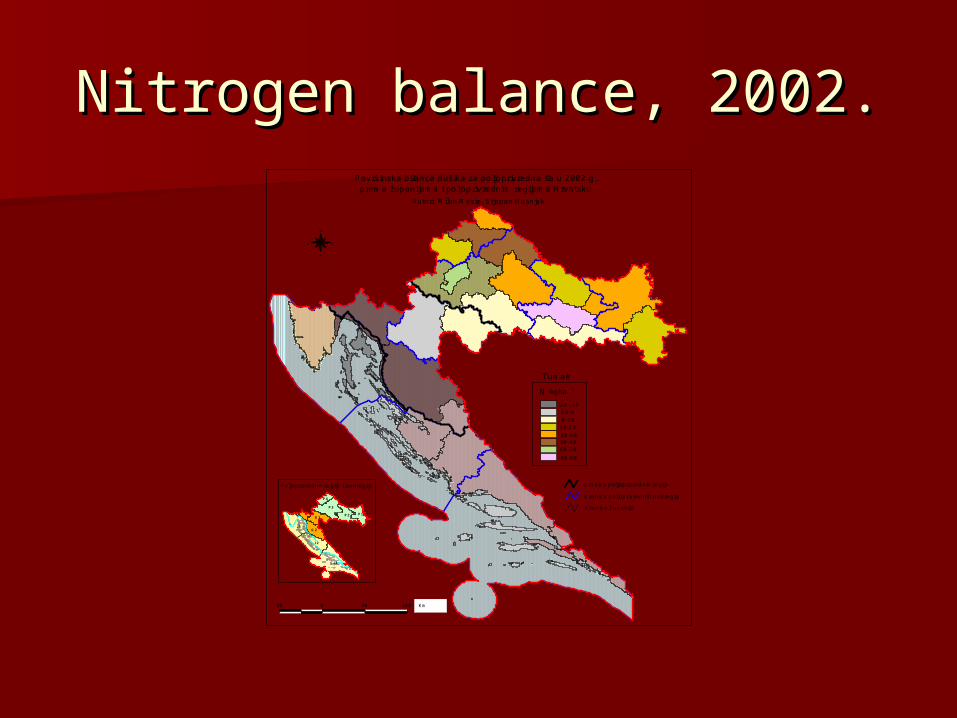
Nitrogen balance, 2002.Nitrogen balance, 2002.
Autori: Milan Mesiæ, Stjepan Husnjak
50 0 50 100 Kilometers
N
EW
S
Km
Tumaè
kgha -1N
-10-00-10
10-20
30-4020-30
60-7080-90
-20--10
Poljoprivredne regije i podregije Granica poljoprivrednih regija
Granica poljoprivrednih podregija
Granica Županija
Površinska bilanca dušika za poljoprivredna tla u 2002 g.prema županijama i poljoprivrednim regijama Hrvatske
P1P2
P3
P4
G1
G2J1
J2
J3
Nitrogen balance, 2003.Nitrogen balance, 2003.
N
EW
S
50 0 50 100 Kilometers
Autori: Milan Mesiæ, Stjepan Husnjak
Km
Poljoprivredne regije i podregijeGranica poljoprivrednih regija
Granica poljoprivrednih podregija
Granica Županija
Površinska bilanca dušika za poljoprivredna tla u 2003 g.prema županijama i poljoprivrednim regijama Hrvatske
N -1kgha
Tumaè
50-6040-50
20-3030-40
10-200-10
-10-0
60-7070-80> 100
P1P2
P3
P4
G1
G2J1
J2
J3
Autori: Milan Mesiæ, Stjepan Husnjak
50 0 50 100 Kilometers
N
EW
S
Km
50-6040-50
20-3030-40
10-200-10
-10-0
Tumaè
kgha -1N-20--10
> 100
Poljoprivredne regije i podregijeGranica poljoprivrednih regija
Granica poljoprivrednih podregija
Granica Županija
Površinska bilanca dušika za poljoprivredna tla u 2000-2003 g.prema županijama i poljoprivrednim regijama Hrvatske
Nitrate concentrations in single water Nitrate concentrations in single water samples from 3 different locations in samples from 3 different locations in
Koprivnica-Krizevci CountyKoprivnica-Krizevci County
At location Kalnik nitrate concentration in water from deep At location Kalnik nitrate concentration in water from deep well was almost constant and it was relatively low. well was almost constant and it was relatively low.
According to the single measurements of nitrate According to the single measurements of nitrate concentration in water samples from shallow wells in concentration in water samples from shallow wells in locations Krizevci and Koprivnica values were much higher locations Krizevci and Koprivnica values were much higher compared to the location Kalnik and differences in nitrate compared to the location Kalnik and differences in nitrate concentration between individual samples relatively high concentration between individual samples relatively high
0
10
20
30
40
50
60
0 50 100 150 200
Number of measurements (N)
NO
3-
(mg
l-1
)
Krizevci Koprivnica Kalnik
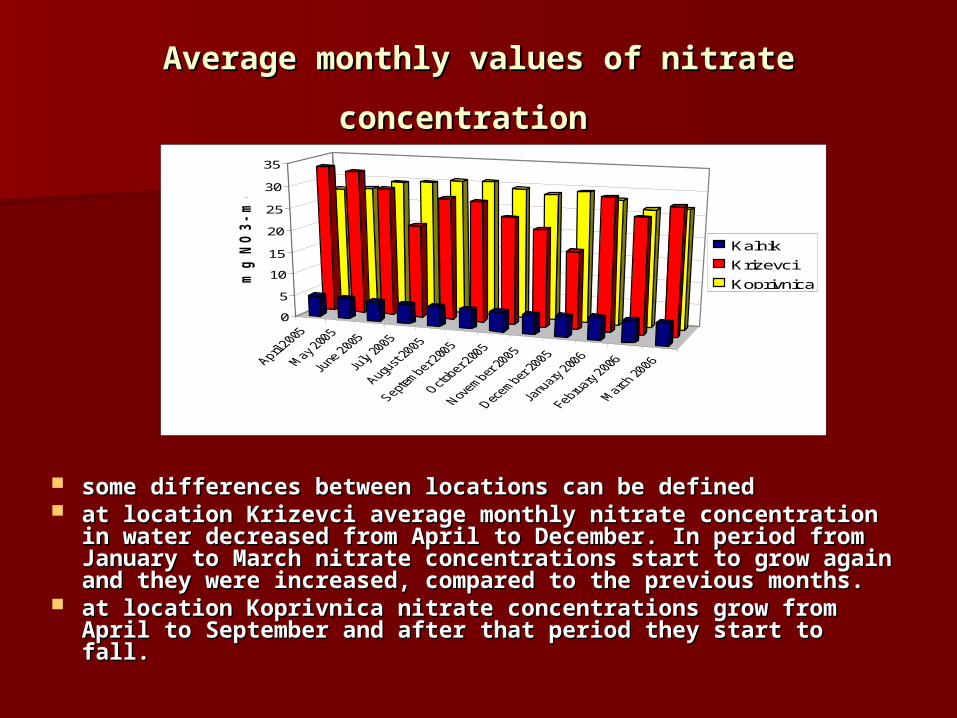
AAverage monthly values of nitrate verage monthly values of nitrate
concentrationconcentration
some differences between locations can be defined some differences between locations can be defined aat location Krizevci average monthly nitrate concentration t location Krizevci average monthly nitrate concentration
in water decreased from April to December. In period from in water decreased from April to December. In period from January to March nitrate concentrations start to grow January to March nitrate concentrations start to grow again and they were increased, compared to the previous again and they were increased, compared to the previous months.months.
aat location Koprivnica nitrate concentrations grow from t location Koprivnica nitrate concentrations grow from April to September and after that period they start to fall. April to September and after that period they start to fall.
0
5
10
15
20
25
30
35
mg
NO
3-
mg
L-1
Kalnik
Krizevci
Koprivnica
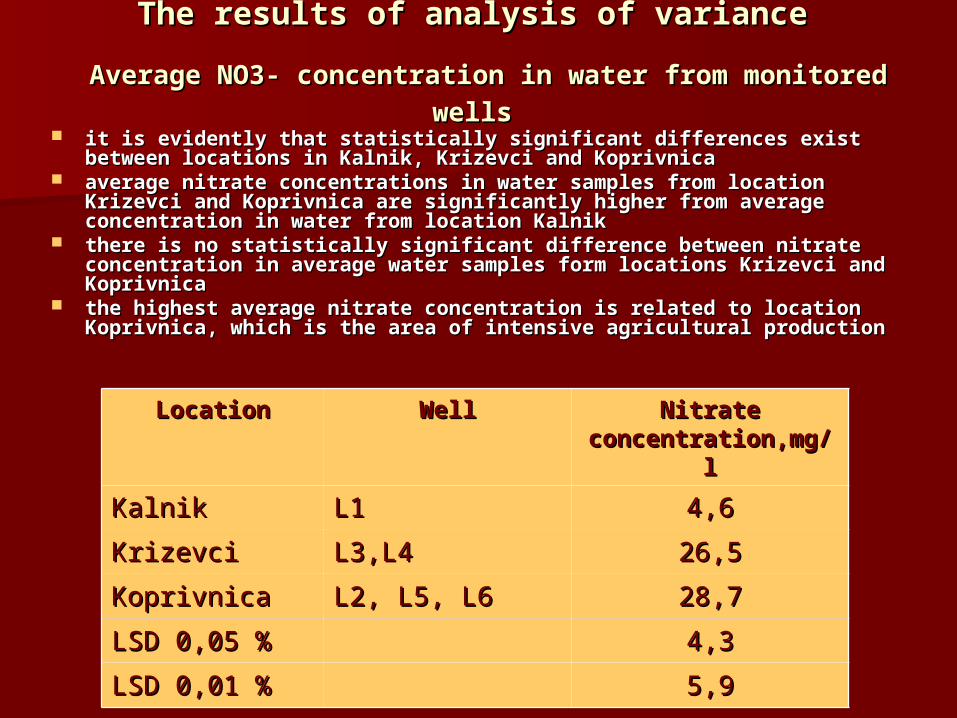
TThe results of analysis of variancehe results of analysis of variance
Average Average NO3- NO3- concentration in water from monitored concentration in water from monitored wellswells
it is evidently that statistically significant differences exist it is evidently that statistically significant differences exist between locations in Kalnik, Krizevci and Koprivnicabetween locations in Kalnik, Krizevci and Koprivnica
aaverage nitrate concentrations in water samples from location verage nitrate concentrations in water samples from location Krizevci and Koprivnica are significantly higher from average Krizevci and Koprivnica are significantly higher from average concentration in water from location Kalnikconcentration in water from location Kalnik
tthere is no statistically significant difference between nitrate here is no statistically significant difference between nitrate concentration in average water samples form locations Krizevci concentration in average water samples form locations Krizevci and Koprivnicaand Koprivnica
tthe highest average nitrate concentration is related to location he highest average nitrate concentration is related to location Koprivnica, which is the area of intensive agricultural productionKoprivnica, which is the area of intensive agricultural production
Differences in average nitrate concentration can be explained with:
different depths of water extraction
agricultural nitrogen application
individual home sewage disposal systems
Differences in average nitrate concentration can be explained partly with:
Kalnik – high depth of water extraction
Krizevci - stronger influence in nitrate enrichment can be given to households and their septic tank systems
Koprivnica - agricultural application of mineral and organic fertilizers is most probably the main source of water pollution with nitrates
CONCLUSIONS
The findings confirm that nitrate concentrations in water samples from wells in 3 different locations in Northwest Croatia are significantly different
The highest average nitrate concentration of 28.7 mg L-1 NO3- is related to location Koprivnica, which is the area of intensive agricultural production
At location Krizevci wells are located at suburban area and average nitrate concentration is 26.5 mg L-1 NO3-
Compared to this two values significantly lower average concentration of 4.6 mg L-1 NO3- is determined at location Kalnik in water samples without any influence of agriculture and urbanisation