There has been much interest in the detection ofexhaled nitric oxide �eNO� in medicine for directlyassessing airway inflammation. Clinical eNObreath analysis provides the physician a simple andnoninvasive window into the activities of disease, in-cluding asthma, chronic obstructive pulmonary dis-order, and cystic fibrosis, in the lower airways.1There have been numerous studies with which eNOwas monitored in children and adults that focusedmainly on the use of such measurements for assistingin initial investigations for the presence of airwayinflammation associated with asthma and monitor-
C. Roller, K. Namjou �[email protected]�, and J. D. Jeffersare with Ekips Technologies, Inc., 710 Asp Avenue, Suite 308,Norman, Oklahoma 73069. M. Camp is with The Lung Center,Inc., Norman, Oklahoma 73071. A. Mock is with Department ofElectrical and Computer Engineering, Columbia University, NewYork, New York 10027. P. J. McCann and J. Grego are withSchool of Electrical and Computer Engineering, University ofOklahoma, Norman, Oklahoma 73019.
Received 21 March 2002; revised manuscript received 20 June2002.
ing the effectiveness of anti-inflammatory glucocorti-coid medications aimed at inhibiting nitric oxide �NO�producing synthase activity.2,3 Current diagnostictests such as spirometry provide limited and onlyindirect information about the actual degree of in-flammation in the lower airways.4 It is worth not-ing that there is a lack of objective and routineclinical diagnostic tests for assessing airway inflam-mation in children younger than 8 years of age.
Various technologies have been proposed for next-generation medical devices that will be capable ofmaking routine eNO measurements of patients in aclinical setting. Chemiluminescence is the most re-cently proposed technique for this purpose and hasgiven rise to numerous insightful reports, many ofwhich are referenced in Ref. 5. Based on these re-ports, the American Thoracic Society has proposedstandardized breath-collection procedures and theEuropean Respiratory Society has stated that eNOserves as a valid biological marker of airway inflam-mation and can be used to evaluate the effectivenessof treatments.6,7 However, several factors havehampered the adoption of chemiluminescence in theUnited States, and these include the need for fre-quent calibrations and the necessity for the patient tomaintain constant exhalation flows.8 Although en-
dogenous and exogenous water vapor, carbon dioxide,and ammonia can contribute to inaccurate eNO mea-surements with chemiluminescence instruments,9the reasons mentioned above are most likely respon-sible for the large variations of results reported invarious clinical studies.5 Because of the complexityof breath collection by chemiluminescence, the tech-nique is not recommended for children younger than8 years of age. Fourier-transform IR spectroscopyand gas chromatography coupled with mass spectros-copy are selective and sensitive but cannot performrapid trace-gas measurements, which are desired forclinical use. To date, the U.S. Food and Drug Ad-ministration has not approved any medical device forNO breath monitoring, but it has assigned the prod-uct code MXA for such a device, and efforts to obtainapproval are ongoing.
Mid-IR high-resolution spectroscopy in the3–20-�m region is an analytical technique that canpermit rapid and selective measurements of eNOwith the required sensitivity of �1 part in 109 �ppb�.Tunable laser absorption spectroscopy �TLAS� is acommon technique for laboratory and scientific fieldmeasurements of trace gases with absorption fea-tures residing in the mid-IR region of the electromag-netic spectrum. Two major factors have preventedthe practical application of TLAS in clinical settingsfor routine breath analysis. First, the need for cryo-genic cooling of some mid-IR lasers requires a largeliquid-N2 supply, which is not readily available inmost clinical settings. Second, the need for frequentcalibrations with calibration gases can be burden-some and limits the operators of the instrument totrained personnel. A brief overview of candidatemid-IR spectroscopic gas sensing technologies foreNO breath measurements is now given.
2. Mid-IR Laser Gas Sensing Technologies
Mid-IR sources for TLAS systems that are currentlyavailable include quantum cascade �QC� distributed-feedback �DFB� lasers and IV–VI diode lasers. QClasers can be operated either in continuous-wave �cw�mode at cryogenic temperatures or by pulsing of thepump current with duty cycles that are typically �1%at temperatures ranging from �40 °C to above roomtemperature. There is a significant reduction in av-erage optical output power when the QC laser ispulsed, but average optical output powers in the mil-liwatt range can still be achieved without the need forliquid-N2 sources. Pulsed QC lasers have demon-strated room-temperature operation, and Namjou etal.10 reported measurements of N2O in the low partsin 106 �ppm� range by pulsing the laser and usingsecond-harmonic �2f � detection. NO trace-gas mea-surements at concentrations of less than 10 ppb withrapid integration times ��5 s� for pulsed QC DFBlasers operated at near room temperature in the 5.1to 5 �m region can be difficult to achieve. Pulsingthe QC laser current can result in laser linewidthbroadening caused by frequency chirp reducing theeffective sensitivity. However, the frequency chirpeffect when QC lasers are pulsed could be minimized
by incorporation of advanced data-acquisition tech-niques. Research into improving mid-IR QC lasertechnology is ongoing, and room-temperature cw QClasers operating at 9.1 �m have recently been dem-onstrated with maximum optical output powers of 17mW.11 Extension of this achievement toward fabri-cation of room-temperature cw QC lasers operatingat shorter wavelengths at which NO absorption linescan be measured is a worthwhile objective.
IV–VI diode lasers �also known as lead-salt lasers�have been used to make sensitive measurements ofmany molecular species. Specifically, cryogenicallycooled IV–VI lasers operated in cw mode have beenused to measure CO, NO, CO2, NH3, and CH4 in theexhaled breath of human subjects.12,13 IV–VI laserswith emission wavelengths of 4–8 �m composed ofconventional double-heterostructure p–n junctionsare commercially available. As with QC lasers, re-search into improving mid-IR IV–VI laser technologyis ongoing. For example, it has been shown14 thatone can achieve a significant increase in operatingtemperatures by removing the growth substrate froman epitaxially grown laser structure15,16 and applyinga second heat sink to improve heat dissipation in theactive region. Other recent achievements that illus-trate the possibility of room-temperature cw laseremission include demonstration of above-room-temperature cw photoluminescence from IV–VImultiple-quantum-well structures17–19 and above-room-temperature operation near 4.1 �m of an opti-cally pumped vertical-cavity surface-emitting laser.20
The results of this theoretical and experimental workshow that significant improvements in IV–VI lasertechnology are possible, and commercialization ofnovel mid-IR IV–VI lasers with improved operatingcharacteristics is a realistic expectation. Furtherdevelopment of IV–VI laser technology, as with QClaser technology, will permit significant reductions inthe size and cost of chemical sensing instrumentsdesigned for trace-gas measurements and clinicalbreath analysis.
An alternative to waiting for improvements in theoperating temperatures of mid-IR laser sources is toeliminate the need for liquid-N2 refills by using aclosed-cycle cryogenic refrigerator to cool both themid-IR laser and the mid-IR detector in the TLASsystem. That is the method employed and describedin the research reported in this paper. With this inmind, the TLAS techniques described here are poten-tially suitable for either IV–VI or QC lasers.
Of equal importance to the tunable laser in amid-IR high-resolution spectroscopy system is thechoice of gas cell and detection technique. A longoptical path length is needed for sensitive measure-ments, and a small gas-cell volume is needed for fastgas exchange rates and rapid measurements. Cav-ity ring-down spectroscopy �CRDS� gas cells canachieve optical path lengths of several kilometers andgas cell volumes near �15 cm3. The CRDS tech-nique measures the decay times of cavity modes andhas been used to measure 48.4 � 0.7 ppb NO in pureN2 with integration times of �8 s.21 In the study
described in Ref. 21, CRDS with cw QC lasers was notable to observe eNO in breath near 1921.6 cm�1 be-cause of strong interference from CO2 absorptionlines nearby at 1921.575 and 1921.641 cm�1, whichhas high concentrations in breath of approximately4% CO2. NO absorption lines located near 1900cm�1, where there is a larger separation between NOand CO2 absorption features,21 may be better candi-dates for breath analysis applications that use CRDS.Herein, all techniques other than CRDS that are dis-cussed are based on intensity measurements,whereas CRDS is based on cavity decay times and isindependent of laser optical output power fluctua-tions.
Cavity enhanced spectroscopy takes advantage oflow-loss dielectric mirrors in the IR and can achieveoptical path lengths up to �1 km and cell volumesbelow 20 cm3. A 670-m optical path-length cavityenhanced spectroscopy gas cell has been used withquasi-cw QC lasers �duty cycle, �50%� at cryogenictemperatures to measure NO, but it was not able toachieve the required sensitivities for measurementsof eNO in human breath.22 In the same cryogeni-cally cooled quasi-cw QC laser system, the cavity en-hanced spectroscopy cell was replaced with amultipass Herriott cell of 100-m optical path lengthand 3.5-L cell volume. This system was capable ofmeasuring eNO in human breath. The minimumdetectable limits for the cryogenically cooled QC lasersystem coupled with a Herriott cell were reported tobe �2.6 ppb, with a measurement integration time of200 s.22
TLAS systems equipped with IV–VI lasers in con-junction with either a Herriott or a multipass Whitecell have been used in studies that measured eNO inhuman breath.23,24 IV–VI lasers have suitable char-acteristics for breath analysis, such as sufficientsingle-mode powers ��500 �W�, narrow spectral line-widths ��100 MHz�,25,26 and wide tunability ��200cm�1 with temperature tuning and �3 cm�1 withinjection current tuning�. These characteristics giveTLAS instruments with IV–VI lasers high sensitivi-ties, high molecular selectivity, rapid response times,and the ability to measure multiple trace gases si-multaneously. Until QC lasers demonstrate sensi-tive and near real-time measurements of eNO atthermoelectrically cooled or higher laser operatingtemperatures, IV–VI lasers will be the most attrac-tive and cost-effective mid-IR tunable diode lasers touse for breath analysis, especially when cryogenictemperatures are unavoidable �see Table 1�. Thenarrow linewidths of IV–VI lasers allow measure-ments of CO2 and NO to be made simultaneously inthe region near 1912.8 cm�1. Because optical out-put powers from IV–VI lasers can vary over time, CO2can be used to normalize absorption magnitudes andcalculate eNO concentrations without the need forcalibration procedures that use calibration gases oradded optics to measure reference spectra.
It is useful to compare TLAS systems equippedwith QC lasers and IV–VI lasers designed for per-forming eNO measurements in adults. The cryo-
genically cooled TLAS system with a cw QC laserdescribed in Ref. 22 incorporated a 100-m opticalpath-length Herriott cell and achieved an estimatedminimum detection limit for NO of �2.6 ppb for a200-s integration time. The TLAS system equippedwith a cw IV–VI laser with an 8-m optical path-lengthHerriott cell as described in Ref. 24 achieved an es-timated similar minimum detection limit of �1 ppbwith an �0.5-s integration time. Table 1 comparesthe operational characteristics of the two systems.The most noticeable difference between the QC lasersystem and the IV–VI laser system is the muchshorter integration time for the IV–VI laser system,which is sufficiently short to permit real-time mea-surements of eNO during an exhalation. Breathanalysis with long integration times is possible whenoff-line techniques are used, and chemiluminescenceexperiments comparing on-line �real-time� and off-line eNO measurements have suggested that eithertechnique is suitable.1 However, real-time mea-surements have the distinct advantage of giving in-stant feedback for verification of correct breathdonations.
To reach cryogenic temperatures, TLAS systemsthat use IV–VI lasers generally require liquid N2,which results in the need for frequent refills and anavailable liquid-N2 source. Replacing liquid-N2 De-wars with a closed-cycle cryogenic refrigerator capa-ble of continuous operation eliminates the need forliquid-N2 refills and allows for long periods of conve-nient operation. Modern closed-cycle refrigeratorscan achieve continuous maintenance-free operationover a 5-year period, a more than adequate opera-tional time for successful deployment in a clinicalsetting.
In this paper we describe a liquid-N2-free TLASsystem equipped with a IV–VI laser operating near
Table 1. eNO Measurements of QC DFB and IV–VI Lasers
Measured PropertyIV–VILasera
QC DFBLaserb
Measured NO line wavelength 1850.2 cm�1 1918.7 cm�1
NO line intensity�cm�1�molecule cm�2�
1.03 � 10�19 8.09 � 10�21
Optical output power Not reportedc 80 mWSensitivity �1 ppb �2.6 ppbOperating temperature 110 K �120 KOptical path length 8 m 100 mIntegration time 0.5 s 200 sNumber of spectral coaverages 64 10,000Near real-time analysis Yes NoTypical power dissipation
�not reported��1 Wd 5 We
aRef. 24.bRef. 22.cTypical maximum optical output powers for IV–VI lasers are �2
mW.dPower dissipation of less than 5 W is required for the cryogenic
cooling system described in this paper. Excessive heat dissipa-tion prevented high-power measurements of cw QC lasers with aJanis closed-cycle He cryostat in the research reported in Ref. 27.
5.2 �m for the purpose of analyzing eNO and exhaledCO2 �eCO2� simultaneously in expired breath. Thesystem required no consumables other than dispos-able mouthpieces for breath analysis. Absorptionmeasurements were performed with a 107-m multi-pass White cell with a 16-L volume. A closed-cyclecryogenic refrigerator was used to maintain cryogeniclaser operating temperatures below 120 K. Theserefrigerators can dissipate �5 W of power at typicallaser heat-sink temperatures of �90 K. IV–VI la-sers are well suited for cooling with such a systembecause they typically generate less than 1 W ofwaste heat. By contrast, QC lasers with their largecompliance voltages often generate more than 10 Wof waste heat.27,28 The system further takes advan-tage of the ability of a single IV–VI laser to measureH2O, CO2, and NO simultaneously, which eliminatesthe need for calibration gases, reference cells, andreference detectors.23 A breath-collection apparatuswas fabricated to collect and sample breath in closeaccordance to the recommendations suggested by theAmerican Thoracic Society. Daily breath measure-ments from five human volunteers over a period of 10working days were performed. Daily eNO concen-trations measured from these five individuals calcu-lated with eCO2 end-tidal absorption magnitudes asa reference were compared with concentrations ob-tained by comparison with a calibrated NO gas stan-dard. The effect of elevated NO levels in theambient air on calculated eNO concentrations wheneCO2 was used as an internal reference was alsostudied. To test the flexibility of the internal cali-bration scheme and to simulate measurements of achild’s breath, we performed experiments in which anadult’s breath was measured at different exhalationtimes from 5 to 20 s. Finally, suggestions for futureresearch to establish better-standardized methodolo-gies for implementing internal calibration for eNO byuse of eCO2 are given.
3. Spectroscopic Considerations for H2O, CO2 and NOnear 5.2 �m
A brief discussion of specific absorption-line at-tributes for the molecules of interest �NO, CO2, andH2O� from 1912.5 to 1913.0 cm�1 is given. TheR�10.5� NO lines located at 1912.7937–1912.7956cm�1 have a maximum intensity of 1.032 � 10�20
cm�1��molecule cm�2� and are separated by 0.05cm�1 from the nearest H2O and CO2 absorption lines.The single CO2 absorption line P�6� at 1912.96 cm�1�was measured and has a modest intensity greaterthan 1.134 � 10�25 cm�1��molecule cm�2�. There isa second measurable CO2 line, located at 1912.69cm�1, with an intensity of 1.009 � 10�26 cm�1��mol-ecule cm�2�. Also measured simultaneously withCO2 and NO was H2O, which has a strong absorptionline located at 1912.5 cm�1 with an intensity of1.110 � 10�23 cm�1��molecule cm�2�. This unam-biguous absorption feature is visible in exhaledbreath and in ambient air. The region near 5.2 �mcontains adequate separation of NO, CO2, and H2Olines, mainly as a result of the narrow line widths of
IV–VI lasers. The NO and CO2 absorption lines ofinterest from 1904 to 1920 cm�1 obtained from theHITRAN database29 are shown in Fig. 1. There areother possible candidate NO and CO2 absorptionlines for simultaneous measurements without inter-ference from each other at 1895–1925 cm�1, whichare adequate for the eNO breath analysis procedureas described in this paper.
4. Experimental Design and Breath CollectionApparatus
The TLAS system design is shown in Fig. 2. A singleIV–VI laser �Ekips Technologies, Norman, Okla.�with typical optical output power of 300 �W wasmounted onto a temperature-controlled stage inside asealed cryostat kept at cryogenic temperatures with aclosed-cycle cryogenic refrigerator rated for continu-ous maintenance-free operation �CryoTiger fromAPD Cryogenics, Allentown, Pa.�. The beam emit-
Fig. 1. NO and CO2 line intensities in the region near 5.2 �m ofthe IR spectrum. Data are from the HITRAN ’96 database.28
Fig. 2. Schematic of the breath-collection apparatus and theTLAS system equipped with a IV–VI mid-IR laser. The sealedcryostat under vacuum houses the IV–VI laser and the mid-IRdetector. Two mass-flow controllers in a parallel configuration�not shown� maintain a constant flow of 2 L�min through the Whitecell.
ted from the IV–VI laser was directed first through aZnSe window and onto an off-axis parabolic mirror tocollimate the beam. A combination of flat and con-cave mirrors was used to direct the beam through a107-m multipass White cell �Infrared Analysis, Ana-heim, Calif.�. On exiting the White cell, the beamwas focused with a ZnSe lens and passed through aZnSe window onto a HgCdTe mid-IR photovoltaic de-tector also located inside the cryostat. An inte-grated heater and temperature controller�Lakeshore, Westerville, Ohio� maintained stable la-ser operating temperatures at 102 K with an accu-racy of �0.01 K.
A low-noise laser current driver supplied currentsfrom 800 to 900 mA. A sawtoothed voltage ramp of40 Hz and 0.11 Vpp �where pp is peak to peak� wasused to tune the single-mode laser emission from1912.5 to 1913.0 cm�1. Superimposed onto the saw-tooth ramp was a smaller triangle waveform at 26.5kHz and 0.01 Vpp to modulate the laser emissionfrequency. The output of the photovoltaic detectorwas preamplified before a commercial lock-in ampli-fier �Stanford Research Systems, Sunnyvale, Calif.�sampled the signal at twice the modulation fre-quency, a procedure known as second-harmonic �2f �detection. A transistor–transistor logic signal fromthe 40-Hz ramp waveform generator was used to trig-ger the analog-to-digital �A�D� acquisitions of theoutput signal from the lock-in amplifier. A personalcomputer �PC� controlled a 12-bit analog-to-digitalconverter card �National Instruments, Austin, Tex.�and acquired 500 data points per scan at a samplingfrequency of 20 kHz. To reduce high-frequencynoise we coaveraged 75 consecutive scans and sentthem through a digital low-pass Butterworth filter.The largest source of optical noise in the system wasetalon fringes that originated in the White cell andoptics.
Spectral shifting of the spectrum can occur as theresult of slight temperature variations of the heatsink for the laser. To counteract this shifting effectwe used the H2O absorption peak at 1912.5 cm�1
shown in Fig. 3 as a spectral reference to line up eachspectrum before coaveraging to reduce smear andimprove detection sensitivities. A custom softwareprogram was used to control the external functions ofthe lock-in amplifier, function generators, and cur-rent driver by use of IEEE-488.2 general-purpose in-terface bus communications. The software alsoperformed the coaveraging, filtering, and spectralanalysis algorithms for determining concentrationsbased on breath eNO�eCO2 ratios that we discusslater in this paper. A second-harmonic spectrum ofhuman breath containing peaks for NO, CO2, H2O,and associated HITRAN absorption line strengths isshown in Fig. 3.
Second-harmonic spectra contain absorption mag-nitudes that are directly proportional to concentra-tions of the associated molecular species. Acalibration curve of the instrument was generated byuse of the gas dilution system depicted in Fig. 4,which is designed for diluting a 10 ppm � 2% NO gas
standard �Airgas, Mobile, Ala.� with purified N2.Mass-flow controllers located at the inlet to the Whitecell were used to mix various flows of NO with N2 toachieve continuous flow concentrations from 10 ppmto 20 ppb. To quantify concentrations we collected areference spectrum at a known concentration of 50ppb. The absorption magnitude of a 50-ppb NO ref-erence spectrum was then compared with subsequentabsorptions of NO at concentrations as diluted as 20ppb by use of a least-squares fitting routine describedin Ref. 30. The least-squares fitting routine re-turned the average absorption magnitude over theentire spectral feature including both negative lobes,
Fig. 3. Second-harmonic spectrum of exhaled alveolar-enrichedbreath measured at 1912.5–1913.0 cm�1. Top, the entire spec-trum with a strong H2O absorption feature at 1912.55 cm�1 alongwith the etalon fringe �free spectral range of the etalon, 0.048cm�1�. Bottom, the absorption features of NO, CO2, and H2O arehighlighted. The NO line of interest is at 1912.79 cm�1, and theCO2 line of interest is located at 1912.96 cm�1.
Fig. 4. Schematic of the gas dilution system capable of producingcalibrated NO concentrations of 20 ppb–10 ppm by dilution of a10-ppm NO gas standard with purified N2. Continuous flowthrough the stainless-steel canister ensured steady-state homoge-neous mixing of the NO and N2.
which is more accurate than just measuring the peakof the absorption feature. Details of the least-squares fitting routine are described in Section 5.The calibration curve showing diluted NO gas stan-dard calibrations versus measured NO is shown inFig. 5. The error bars for the points in Fig. 5 repre-sent the standard deviation over 200 consecutivedata points measured at each calibration concentra-tion. The line shapes at several concentrations areshown in Fig. 6. Measured NO absorption magni-tudes have a strong linear relationship �R2 � 0.998�with calibrated NO concentrations. The minimumdetection limit for a 4-s integration time �75 co-adds�was determined to be 1.5 ppb, based upon the Vrmsnoise in the baseline of the second-harmonic spec-trum. Further improvement of this figure of merit ispossible with faster electronics to collect more spectrain a given time.
5. Breath Analysis
Breath measurements were performed at a pressureof 13 Torr to reduce line broadening and interferenceamong NO, CO2, and H2O. A mechanical vacuumpump induced flow through the gas cell that wasmaintained at a constant rate of 2 L�min by the flowcontrollers. This rate of gas suction was comfortablefor patients exhaling into the system over a period of20 s or less. The breath-collection device �Quintron,Milwaukee, Wisc.� was designed to collect single ex-halations and consisted of a T-shaped piece connectedto a disposable mouthpiece, a 500-mL discard bag,and a 0.635-cm �0.2 in.� diameter Teflon tubing todirect breath through the flow controllers and intothe White cell. The discard bag accepted the first500 mL of breath at little to no breathing resistance.This headspace breath contains a high concentrationof NO that originates from the nasal cavity. Theremaining exhaled air entered the Teflon tubing at aconstant rate of 2 L�min. Volunteers were in-structed to exhale a single breath with force, whichassisted in closing the velopharyngeal aperture, lim-iting the entry of nasal NO via the posterior naso-pharynx.6 A one-way flutter valve located at theentrance to the discard bag prevented headspacebreath from reentering the breath-collection system,and the discard bag was manually emptied after eachexhalation. All breath measurements given in thispaper are single breath exhalations for 20 s unlessotherwise stated. Institutional Review Board ap-proval was granted from the University of Oklahomafor human subjects research, and each participantsigned an informed consent form before donatingbreath.
The magnitude of absorption that was due tobreath eNO and eCO2 was determined by use of aleast-squares fitting routine, which uses a referencespectrum to analyze measured spectra during breathtesting. Two reference spectra, denoted #1 and #2,at unknown but different concentrations of NO andCO2 are shown in Fig. 7. The rectangular windows
Fig. 5. Gas calibration curve obtained by measuring concentra-tions of NO produced with the gas dilution system. The curveshows a strong linear relationship �R2 � 0.998� between the di-luted NO gas samples and the measured absorption intensities.The error bars represent the standard deviation of 200 consecutivemeasured NO data points for each concentration.
Fig. 6. Measured second-harmonic absorption features of NO�1912.79 cm�1� for concentrations of 50, 124, 244, and 475 ppb.Each spectrum was obtained in a 4-s integration time �75 coaver-ages� at a cell pressure of 13 Torr.
Fig. 7. Two reference spectra �Ref #1 and Ref #2� at variousunknown concentrations of NO and CO2. The reference spectraare compared with measured signals over the entire absorptionprofiles for NO and CO2, as shown by rectangular windows.
that encompass the NO and CO2 absorption featuresdefine the windows that we used to compare the ref-erence spectra with the measured spectra; they in-clude both negative lobes and the absorption peak.To characterize the relationship between the NO andCO2 absorption profiles within each reference we sub-tracted background spectra from each reference spec-trum to eliminate any baseline offset. Next, wedetermined the peak absorption voltages to obtain avoltage ratio �VNO�VCO2
�.During breath donations, measured spectra con-
taining the absorption features for eNO and eCO2were compared to either reference spectrum #1 orreference spectrum #2 by the least-squares fittingroutine. The measured absorption-line featurescontained in the set window for the sample �Y� andthe reference �X� have a linear relationship of theform Yj � a bXj. Here X and Y are the measuredvoltage amplitudes within a window containing theentire absorption feature including the negative lobesand some baseline on either side. The amplitudescaling factor, b, represents the absorption magni-tude determined with the least-squares methodshown in Eq. �1� below. Coefficient a representsbaseline offset and is ignored. Subscript j in thisequation represents the position of the channel num-ber in acquired spectra as shown in Fig. 6:
b �
�� Yj��� Xj� � N�� XjYj��� Xj�2
� N�� Xj2� . (1)
Example eNO and eCO2 absorption magnitude ar-rays over time obtained for 20-s breath donationsfrom a nonasthmatic and an asthmatic volunteer areshown in Fig. 8. The end-tidal �or maximum� valuesin Fig. 8 occur after the end of the exhalation periodbecause there are short delays caused by gas ex-change and software processing overhead. Weperformed and averaged 5 s of NO and CO2 before-exhalation measurements to determine their absorp-tion magnitudes in the ambient air. We determinethe absorption magnitude for eCO2, beCO2
, by takingthe end-tidal value in the exhalation trend arraybeCO2
�i. Subscript i in the exhalation trend arraydenotes absorption magnitude data points collectedover the breath-analysis period. The maximumbeCO2
value is used to verify correct breath donation;this works as a good verification because eCO2 con-centrations are always greater than CO2 concentra-tions in ambient air. The absorption value in thebeNO�i array measured during the exhalation periodthat most deviates from the established baseline ab-sorption magnitude for NO in the ambient is used todetermine beNO. For determining beNO it is notproper to use only the maximum value in beNO�ibecause it is possible to have larger NO concentra-tions in ambient air than in exhaled breath. OncebeNO and beCO2
have been determined, we use thefollowing equation to describe the overall absorption
ratio, AeNO�AeCO2, that relates the measured absorp-
tion magnitudes of analyzed breath samples to thevoltage magnitudes of the reference spectra:
AeNO
AeCO2
�beNO
beCO2
�VNO
VCO2
. (2)
Utilizing known standard line strengths S�v�� andpressure broadening coefficients �g� found in theHITRAN database, we can use the following equationto relate the concentrations of eNO and eCO2 inbreath, where CeNO and CeCO2
represent concentra-tions of eNO and eCO2, respectively:
CeNO � �AeNO
AeCO2
�� gNO
gCO2
��S�v�CO2
S�v�NO� � CeCO2
. (3)
We derived Eq. �3� by using Beer’s law and the factthat second-harmonic spectra produce absorptionmagnitudes that have an approximately linear rela-tionship to the concentration of the absorbing gasspecies. In Eq. �3� it is assumed that laser power isequivalent across both the NO and the CO2 absorp-tion lines. To solve for CeNO we assumed that eCO2concentrations are 4%, which is the typical value forexhaled CeCO2
in human breath.31 Equation �3� isvulnerable to error if the actual value of CeCO2
froman individual deviates significantly from 4%. Slightvariations ��10%� in actual CeCO2
, however, do notsignificantly affect the interpreted results because itis not critically clinically important at this time toobtain high-precision eNO concentrations. A 10%variation in eCO2 concentration would give a typicalerror of �2 ppb in the calculated eNO concentration,which is much smaller than the difference betweeneNO concentration ranges for asthmatics �30–80ppb� and nonasthmatics �5–20 ppb�.1
Fig. 8. Exhalation trends of eNO and eCO2 measured from anasthmatic participant and from a nonasthmatic participant over a20-s exhalation. The asthmatic participant had end-tidal eNOabsorption magnitudes �beNO� that were 3� larger than the non-asthmatic, and both had similar end-tidal eCO2 absorption mag-nitudes �beCO2
Results of testing five individuals �four nonasthmat-ics and one asthmatic� with reference spectra #1 and#2 over a period of 10 days are presented. Cali-brated eNO levels are compared with calculated eNOconcentrations by use of Eq. �3�. Also given are theresults of studying different breath-testing parame-ters including various exhalation times, White cellpressures, and ambient NO levels.
For reference spectrum #1, each participant gavethree breaths, and the eNO results calculated withEq. �3� were averaged over the three breaths. Thesame procedure was repeated with reference spec-trum #2. To perform calibration measurements foreach participant we flowed a diluted NO standard of100 ppb through the White cell for 20 s, just as if aparticipant were exhaling. Figure 9 shows an exam-ple concentration trend for calibrated NO flowingthrough the gas cell. The 100-ppb NO signal overthe 20-s period was compared with a reference spec-trum collected while the White cell was saturatedwith 100 ppb of NO and the associated average ab-sorption magnitude �b� was �1.0, as indicated in Fig.9. The 100-ppb NO sample flow for 20 s does notcompletely saturate the White cell volume of 16 L ata gas exchange rate of 2 L�min, and a small softwaretime constant that is due to data computational over-head does not allow bcal eNO to completely reach 1.0.Immediately following analysis of the 100-ppb NOcalibration gas the volunteer exhaled into the system,and the absorption magnitude for beNO was then com-pared with the 20-s 100-ppb calibration NO absorp-tion magnitude, bcal NO. The calibrated eNOconcentration, Ccal eNO, was calculated as follows:
Ccal eNO � � beNO
bcalNO� � �100 ppb Reference NO�.
(4)
Three sequential calibrated eNO breath measure-ments were performed and averaged to yield the cal-ibrated eNO concentration, Ccal eNO. It should benoted that a 16-L cell volume is suitable when one isdiscarding headspace, but smaller cell volumes aremore desirable for rapid gas exchange rates and im-proved temporal resolution.
Each of the five participants donated nine breathsdaily over the period of ten working days �threebreaths for Ref. #1, three breaths for Ref. #2, andthree breaths for calibration�. The relationship be-tween calibrated eNO results and calculated eNOresults for references #1 and #2 over the ten-dayperiod are shown by error bars in Fig. 10. There wasa good linear relationship �R2 � 0.939� between thetwo methods, showing that Eq. �3� including a 4%value for eCO2 concentrations permitted accurateeNO measurements over the 2-week testing period.
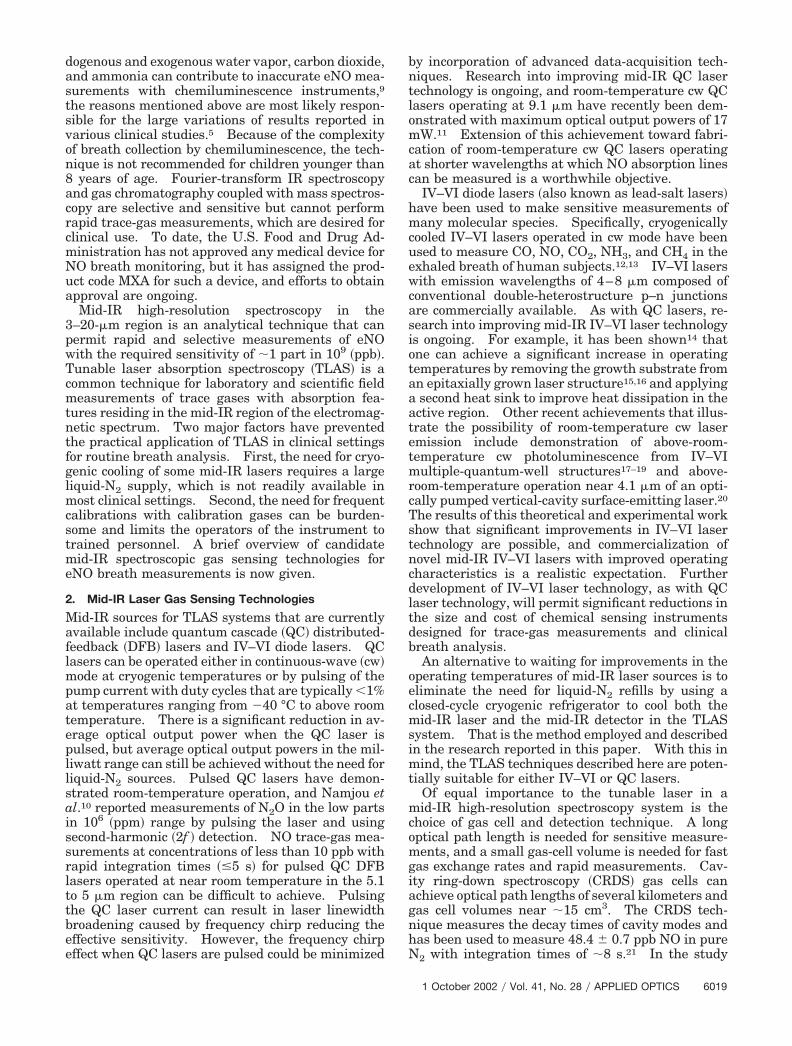
Adults found the 20-s exhalation time comfortablefor a constant 2-L�min flow rate. The young, theelderly, or the ill, however, may find a 20-s exhalationperiod too long. Figure 11 shows the results of anadult participant’s exhaling for periods of 15, 10, and5 s, which would simulate breath collection from achild or from an adult with limited lung function.The longer the exhalation times, the stronger themeasured signals, because there will be more NO andCO2 molecules occupying the White cell. However,the eNO and eCO2 ratios together help to account forvariations in exhalation times, and they resulted inlittle variation in calculated eNO concentrationswhen Eq. �3� was used: the concentrations were10.6 � 0.75, 11.7 � 0.25, and 11.6 � 0.57 ppb for 5, 10,and 15 s, respectively.
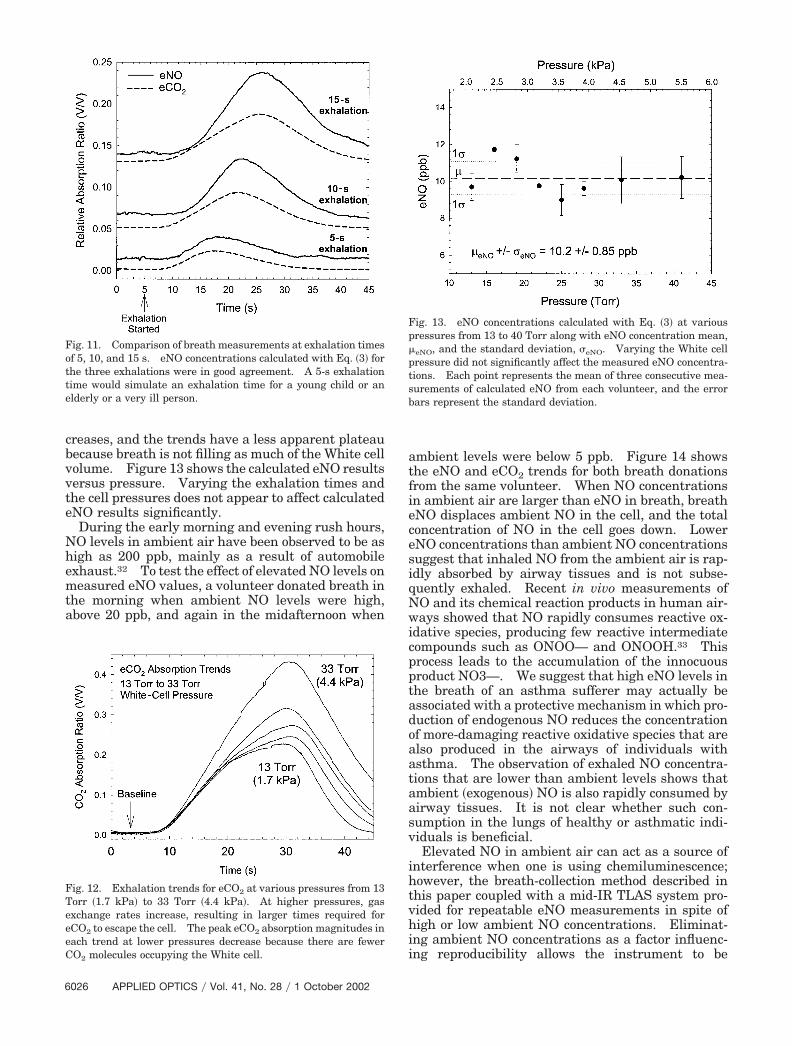
Figure 12 shows eCO2 trends from an individualexhaling at sample cell pressures ranging from 13 to33 Torr. As the pressure increases, the volume in-
Fig. 9. Absorption magnitude of NO versus time for 100-ppb NOgas flowed through the cell for 20 s and for a volunteer’s breath fora 20-s exhalation. The two trends were compared with the cali-brated eNO concentrations by use of Eq. �4�. An absorption mag-nitude of b � 1 corresponds to the White cell’s being completelysaturated with 100-ppb NO gas.
Fig. 10. Plot of calibrated eNO breath measurements quantifiedwith a 50-ppb NO gas standard versus eNO concentrations calcu-lated with the eCO2 absorption magnitudes and Eq. �3�. Thelinear relationship �R2 � 0.939� between calibrated and calculatedeNO concentrations validates the use of eCO2 as an internal cali-bration gas. Each point represents the mean of three consecutivemeasurements of eNO calculated from each volunteer, and theerror bars represent the standard deviation.
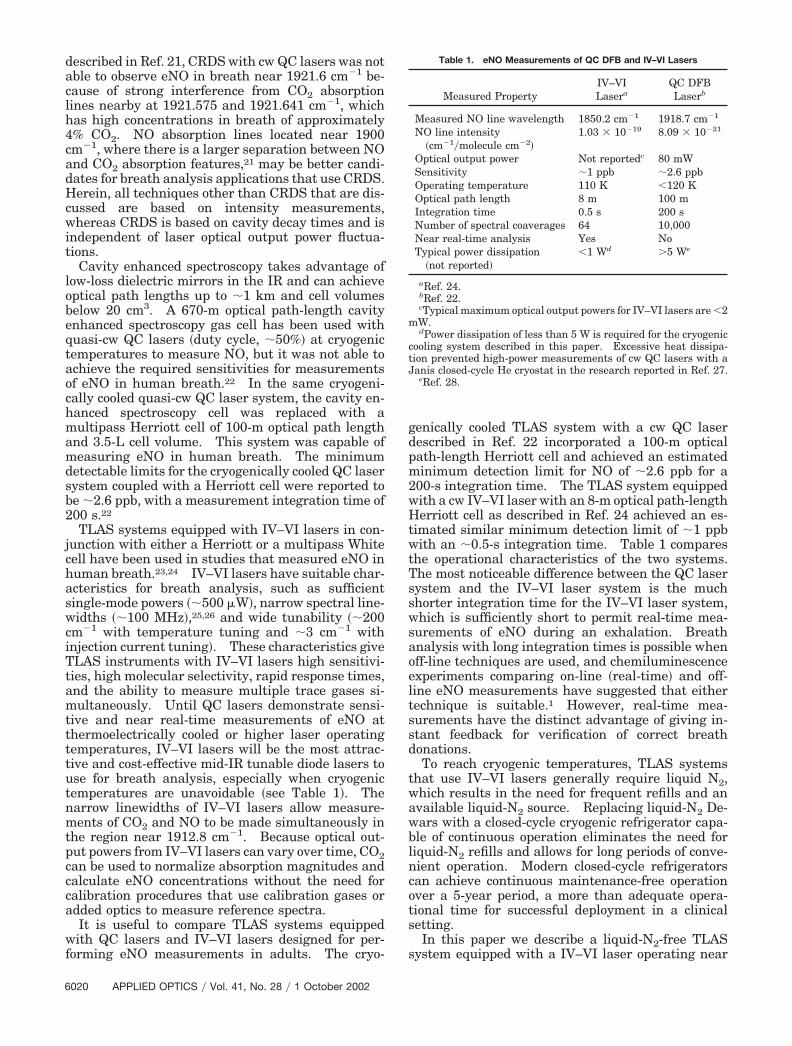
creases, and the trends have a less apparent plateaubecause breath is not filling as much of the White cellvolume. Figure 13 shows the calculated eNO resultsversus pressure. Varying the exhalation times andthe cell pressures does not appear to affect calculatedeNO results significantly.
During the early morning and evening rush hours,NO levels in ambient air have been observed to be ashigh as 200 ppb, mainly as a result of automobileexhaust.32 To test the effect of elevated NO levels onmeasured eNO values, a volunteer donated breath inthe morning when ambient NO levels were high,above 20 ppb, and again in the midafternoon when
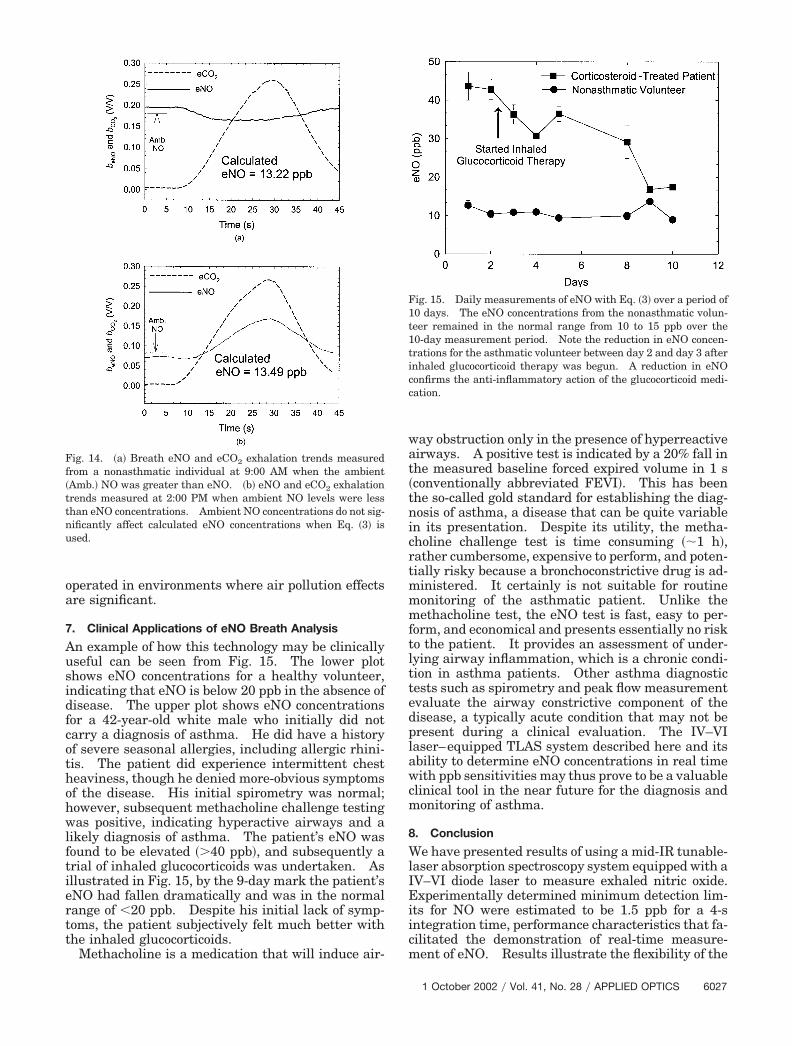
ambient levels were below 5 ppb. Figure 14 showsthe eNO and eCO2 trends for both breath donationsfrom the same volunteer. When NO concentrationsin ambient air are larger than eNO in breath, breatheNO displaces ambient NO in the cell, and the totalconcentration of NO in the cell goes down. LowereNO concentrations than ambient NO concentrationssuggest that inhaled NO from the ambient air is rap-idly absorbed by airway tissues and is not subse-quently exhaled. Recent in vivo measurements ofNO and its chemical reaction products in human air-ways showed that NO rapidly consumes reactive ox-idative species, producing few reactive intermediatecompounds such as ONOO— and ONOOH.33 Thisprocess leads to the accumulation of the innocuousproduct NO3—. We suggest that high eNO levels inthe breath of an asthma sufferer may actually beassociated with a protective mechanism in which pro-duction of endogenous NO reduces the concentrationof more-damaging reactive oxidative species that arealso produced in the airways of individuals withasthma. The observation of exhaled NO concentra-tions that are lower than ambient levels shows thatambient �exogenous� NO is also rapidly consumed byairway tissues. It is not clear whether such con-sumption in the lungs of healthy or asthmatic indi-viduals is beneficial.
Elevated NO in ambient air can act as a source ofinterference when one is using chemiluminescence;however, the breath-collection method described inthis paper coupled with a mid-IR TLAS system pro-vided for repeatable eNO measurements in spite ofhigh or low ambient NO concentrations. Eliminat-ing ambient NO concentrations as a factor influenc-ing reproducibility allows the instrument to be
Fig. 11. Comparison of breath measurements at exhalation timesof 5, 10, and 15 s. eNO concentrations calculated with Eq. �3� forthe three exhalations were in good agreement. A 5-s exhalationtime would simulate an exhalation time for a young child or anelderly or a very ill person.
Fig. 12. Exhalation trends for eCO2 at various pressures from 13Torr �1.7 kPa� to 33 Torr �4.4 kPa�. At higher pressures, gasexchange rates increase, resulting in larger times required foreCO2 to escape the cell. The peak eCO2 absorption magnitudes ineach trend at lower pressures decrease because there are fewerCO2 molecules occupying the White cell.
Fig. 13. eNO concentrations calculated with Eq. �3� at variouspressures from 13 to 40 Torr along with eNO concentration mean,�eNO, and the standard deviation, �eNO. Varying the White cellpressure did not significantly affect the measured eNO concentra-tions. Each point represents the mean of three consecutive mea-surements of calculated eNO from each volunteer, and the errorbars represent the standard deviation.
operated in environments where air pollution effectsare significant.
7. Clinical Applications of eNO Breath Analysis
An example of how this technology may be clinicallyuseful can be seen from Fig. 15. The lower plotshows eNO concentrations for a healthy volunteer,indicating that eNO is below 20 ppb in the absence ofdisease. The upper plot shows eNO concentrationsfor a 42-year-old white male who initially did notcarry a diagnosis of asthma. He did have a historyof severe seasonal allergies, including allergic rhini-tis. The patient did experience intermittent chestheaviness, though he denied more-obvious symptomsof the disease. His initial spirometry was normal;however, subsequent methacholine challenge testingwas positive, indicating hyperactive airways and alikely diagnosis of asthma. The patient’s eNO wasfound to be elevated �40 ppb�, and subsequently atrial of inhaled glucocorticoids was undertaken. Asillustrated in Fig. 15, by the 9-day mark the patient’seNO had fallen dramatically and was in the normalrange of �20 ppb. Despite his initial lack of symp-toms, the patient subjectively felt much better withthe inhaled glucocorticoids.
Methacholine is a medication that will induce air-
way obstruction only in the presence of hyperreactiveairways. A positive test is indicated by a 20% fall inthe measured baseline forced expired volume in 1 s�conventionally abbreviated FEVI�. This has beenthe so-called gold standard for establishing the diag-nosis of asthma, a disease that can be quite variablein its presentation. Despite its utility, the metha-choline challenge test is time consuming ��1 h�,rather cumbersome, expensive to perform, and poten-tially risky because a bronchoconstrictive drug is ad-ministered. It certainly is not suitable for routinemonitoring of the asthmatic patient. Unlike themethacholine test, the eNO test is fast, easy to per-form, and economical and presents essentially no riskto the patient. It provides an assessment of under-lying airway inflammation, which is a chronic condi-tion in asthma patients. Other asthma diagnostictests such as spirometry and peak flow measurementevaluate the airway constrictive component of thedisease, a typically acute condition that may not bepresent during a clinical evaluation. The IV–VIlaser–equipped TLAS system described here and itsability to determine eNO concentrations in real timewith ppb sensitivities may thus prove to be a valuableclinical tool in the near future for the diagnosis andmonitoring of asthma.
8. Conclusion
We have presented results of using a mid-IR tunable-laser absorption spectroscopy system equipped with aIV–VI diode laser to measure exhaled nitric oxide.Experimentally determined minimum detection lim-its for NO were estimated to be 1.5 ppb for a 4-sintegration time, performance characteristics that fa-cilitated the demonstration of real-time measure-ment of eNO. Results illustrate the flexibility of the
Fig. 14. �a� Breath eNO and eCO2 exhalation trends measuredfrom a nonasthmatic individual at 9:00 AM when the ambient�Amb.� NO was greater than eNO. �b� eNO and eCO2 exhalationtrends measured at 2:00 PM when ambient NO levels were lessthan eNO concentrations. Ambient NO concentrations do not sig-nificantly affect calculated eNO concentrations when Eq. �3� isused.
Fig. 15. Daily measurements of eNO with Eq. �3� over a period of10 days. The eNO concentrations from the nonasthmatic volun-teer remained in the normal range from 10 to 15 ppb over the10-day measurement period. Note the reduction in eNO concen-trations for the asthmatic volunteer between day 2 and day 3 afterinhaled glucocorticoid therapy was begun. A reduction in eNOconfirms the anti-inflammatory action of the glucocorticoid medi-cation.
measurement technique and its suitability for use inclinical applications. The need for liquid N2 waseliminated by the inclusion of a closed-cycle cryogenicrefrigerator to cool both the laser and the detector inthe TLAS system. Internal calibration was accom-plished by use of exhaled CO2 absorption magnitudesmeasured simultaneously with eNO, eliminating theneed for calibration gases. The effects of varyingsample cell pressures, exhalation times, and ambientNO concentrations were studied and had little affecton calculated eNO levels obtained with the algorithmdescribed in this paper. We used the TLAS systemto perform daily eNO measurements, and our resultsdemonstrated the capability of this technique to mon-itor the effectiveness of anti-inflammatory treat-ments. By addressing the problems associated withchemiluminescence eNO measurements, TLAS hasbeen shown to be a capable and user-friendly tool fornext-generation eNO analysis in clinical settings.The simplified breath-collection procedure describedfor the TLAS system should make the eNO measure-ment technique suitable for pediatric patients underthe age of 8 years. Future research should includestudies of pediatric patients and include investiga-tion of integrating a low-cost CO2 sensor to accountfor the variation of eCO2 levels in individuals.
References1. D. H. Yates, “Role of exhaled nitric oxide in asthma,” Immunol.
Cell Biol. 79, 178–190 �2001�.2. K. Alving, E. Weitzberg, and J. M. Lundberg, “Increased
amount of nitric oxide in exhaled air of asthmatics,” Eur. Re-spir. J. 6, 1368–1370 �1993�.
3. S. A. Kharitonov and P. J. Barnes, “Clinical aspects of exhalednitric oxide,” Eur. Respir. J. 16, 781–792 �2000�.
4. K. J. Haley and J. M. Drazen, “Inflammation and airway func-tion in asthma, what you see is not necessarily what you get,”Am. J. Respir. Crit. Care Med. 157, 1–3 �1998�.
5. M. Bernareggi and G. Cremona, “Measurement of exhaled ni-tric oxide in humans and animals,” Pulmonary Pharmacol.Therapeut. 12, 331–352 �1999�.
6. P. E. Silkoff, “Recommendations for standardized proceduresfor the online and offline measurement of exhaled lower respi-ratory nitric oxide and nasal nitric oxide in adults andchildren—1999,” Am. J. Respir. Crit. Care Med. 160, 2104–2117 �1999�.
7. S. Kharitonov, K. Alving, and P. J. Barnes, “Exhaled and nasalnitric oxide measurements: recommendations �ERS TaskForce Report�,” Eur. Respir. J. 10, 1683–1693 �1997�.
8. P. E. Silkoff, P. A. McLean, A. S. Slutsky, H. G. Furlott, E.Hoffstein, S. Wkita, K. R. Chapman, J. P. Szalai, and N. Zamel,“Marked flow-dependence of exhaled nitric oxide using a newtechnique to exclude nasal nitric oxide,” Am. J. Respir. Crit.Care Med. 155, 260–267 �1997�.
9. N. Binding, W. Muller, and P. A. Czeschinski, “NO chemilu-minescence in exhaled air: interference of compounds fromendogenous and exogenous sources,” Eur. Respir. J. 6, 499–503 �2000�.
10. K. Namjou, S. Cai, E. A. Whittaker, J. Faist, C. Gmachl, F.Capasso, D. L. Sivco, and A. Y. Cho, “Sensitive absorptionspectroscopy with a room-temperature distributed-feedbackquantum-cascade laser,” Opt. Lett. 23, 219–222 �1998�.
11. M. Beck, D. Hofstetter, T. Allen, J. Faist, U. Oesterle, M.Ilegems, E. Gini, and H. Melchior, “Continuous wave operation
of a mid-infrared semiconductor laser at room-temperature,”Science 295, 301–305 �2002�.
12. L. Konstantin, A. I. Nadezhdinskii, and I. A. Adamouskaya,“Human breath trace gas content study by tunable diode laserspectroscopy technique,” Infrared Phys. Technol. 37, 181–192�1996�.
13. K. Namjou, P. J. McCann, and W. T. Potter, “Breath testingwith a Mid-IR laser spectrometer,” in Application of TunableDiode and Other Infrared Sources for Atmospheric Studies andIndustrial Processing Monitoring II, A. Fried, ed., Proc. SPIE3758, 74–80 �1999�.
14. K. R. Lewelling and P. J. McCann, “Finite element modelingpredicts possibility of thermoelectrically-cooled lead-salt diodelasers,” IEEE Photon. Technol. Lett. 9, 297–299 �1997�.
15. H. Z. Wu, X. M. Fang, R. Salas, D. McAlister, and P. J. Mc-Cann, “Transfer of PbSe�PbEuSe epilayers grown by MBE onBaF2-coated Si�111�,” Thin Solid Films 352, 277–282 �1999�.
16. D. W. McAlister, P. J. McCann, H. Z. Wu, and X. M. Fang,“Fabrication of thin film cleaved cavities using a bonding andcleaving fixture,” IEEE Photon. Technol. Lett. 12, 22–24�2000�.
17. P. J. McCann, K. Namjou, and X. M. Fang, “Above-room-temperature continuous wave mid-infrared photolumines-cence from PbSe�PbSrSe quantum wells,” Appl. Phys. Lett. 75,3608–3610 �1999�.
18. X. M. Fang, K. Namjou, I. Chao, P. J. McCann, N. Dai, and G.Tor, “Molecular beam epitaxy of PbSrSe and PbSe�PbSrSemultiple quantum well structures for use in mid-infrared lightemitting devices,” J. Vacuum Sci. Technol. 18, 1720–1723�2000�.
19. D. W. McAlister, P. J. McCann, K. Namjou, H. Z. Wu, and X. M.Fang, “Mid-IR photoluminescence from IV–VI layers grown onsilicon,” J. Appl. Phys. 89, 3514–3516 �2001�.
20. F. Zhao, H. Wu, L. Jayasinghe, and Z. Shi, “Above-room-temperature optically pumped 4.12 um midinfrared vertical-cavity surface-emitting lasers,” Appl. Phys. Lett. 80, 1129–1131 �2002�.
21. A. A. Kosterev, A. L. Malinovsky, F. K. Tittel, C. Gmachl, F.Capasso, D. L. Sivco, J. N. Baillargeon, A. L. Hutchinson, andA. Y. Cho, “Cavity ringdown spectroscopic detection of nitricoxide with a continuous-wave quantum-cascade laser,” Appl.Opt. 40, 5522–5529 �2001�.
22. L. Menzel, A. A. Kosterev, R. F. Curl, F. K. Tittel, C. Gmachl,F. Capasso, D. L. Sivco, J. N. Baillargeon, A. L. Hutchinson,A. Y. Cho, and W. Urban, “Spectroscopic detection of biologicalNO with a quantum cascade laser,” Appl. Phys. B. 72, 859–863 �2001�.
23. C. Roller, K. Namjou, J. Jeffers, W. Potter, P. J. McCann, andJ. Grego, “Simultaneous measurement of NO and CO2 in hu-man breath using a single IV–VI mid-infrared laser,” Opt.Lett. 27, 107–109 �2002�.
24. E. V. Stepanov, P. V. Zyrianov, and V. A. Miliaev, “Single-breath NO detection with tunable diode lasers for pulmonarydisease diagnosis,” in ALT’98 Selected Papers on Novel LaserMethods in Medicine and Biology, G. P. Koz’min, A. M.Prokhorov, and V. I. Pustovoy, eds., Proc. SPIE 3829, 103–109�1999�.
25. J. Reid, D. T. Cassidy, and R. T. Menzies, “Linewidth mea-surements of tunable diode lasers using heterodyne and etalontechniques,” Appl. Opt. 21, 3961–3965 �1982�.
26. E. D. Hinkley and C. Freed, “Direct observation of the Lorent-zian line shape as limited by quantum phase noise in a laserabove threshold,” Phys. Rev. Lett. 23, 277–279 �1969�.
27. M. Razeghi, S. Slivken, A. Matlis, A. Rybaltowski, C. Jelen,and J. Diaz, “Low threshold quantum cascade lasers grown byGSMBE,” LEOS Newsletter 12�6�, 5–7 �1998�.
28. A. A. Kosterev, R. F. Curl, F. K. Tittel, C. Gmachl, F. Capasso,D. L. Sivco, J. N. Baillargeon, A. L. Hutchinson, and A. Y. Cho,
“Effective utilization of quantum-cascade distributed-feedbacklasers in absorption spectroscopy,” Appl. Opt. 39, 4425–4430�2000�.
29. L. S. Rothman, C. P. Rinsland, A. Goldman, S. T. Massie, D. P.Edwards, J. M. Flaud, A. Perrin, C. Camy-Peyret, V. Dana,J. Y. Mandin, J. Schroeder, A. McCann, R. R. Gamache, R. B.Wattson, K. Yoshino, K. V. Chance, K. W. Jucks, L. R. Brown,V. Nemtchinov, and P. Varanasi, “The HITRAN molecularspectroscopic database and HAWKS �HITRAN atmosphericworkstation�: 1996 edition,” J. Quant. Spectrosc. Radiat.Transfer 60, 665–710 �1998�.
30. A. Fried, J. R. Drummond, B. Henry, and J. Fox, “Versatileintegrated tunable diode laser system for precision: applica-tion for ambient measurements of OCS,” Appl. Opt. 30, 1916–1932 �1991�.
31. J. J. Carr and J. M. Brown, “The human respiratory system
and its measurement,” in Introduction to Biomedical Equip-ment Technology, 3rd ed., C. E. Stewart, ed. �Prentice-Hall,Upper Saddle River, N.J., 1998�, Chap. 10.
32. A. Mock, C. Roller, K. Namjou, J. Jeffers, P. J. McCann, andJ. Grego, “Real-time ground level atmospheric nitric oxidemeasurements using a calibrated TLDAS system,” in LaserApplications to Chemical and Environmental Analysis �LA-CEA�, Vol. 36 of OSA Trends in Optics and Photonics Series�Optical Society of America, Washington, D.C., 2002�, pp.SaC4-1–SaC4-3.
33. R. A. Dweik, S. A. A. Comhair, B. Gaston, F. B. J. M. Thun-nissen, C. Farver, M. J. Thomassen, M. Kavuru, J. Hammel,H. M. Abu-Soud, and S. C. Erzurum, “NO chemical events inthe human airway during the immediate and late antigen-induced asthmatic response,” Proc. Natl. Acad. Sci. 98�5�,2622–2627 �2001�.