• • NITRIFICATION IN HIGH RATE TRICKLING FILTERS by Dennis Eston Harman A Thesis Presented to the Graduate Committee of Lehigh University in Candidacy for the Degree of Master of Science in Civil Engineering Lehigh University 1971
Transcript
•
•
NITRIFICATION IN HIGH RATE TRICKLING FILTERS
by
Dennis Eston Harman
A Thesis Presented to the Graduate Committee
of Lehigh University in Candidacy for the Degree of
Master of Science in
Civil Engineering
Lehigh University 1971
ACKNOWLEDGEMENTS
The author wishes to express his gratitude to the National
Science Foundation for its financial support under a fellowship, to
the Bethlehem Sewage Treatment Plant for its financial, physical, and
moral support of the research work, and, most importantly, to Dr.
Robert L. Johnson, Assistant Professor of Civil Engineering, for his
help and guidance throughout this research.
iii
TABLE OF CONTENTS
page
LIST OF FIGURES v
LIST OF TABLES vi
... LIST OF ABBREVIATIONS vii
ABSTRACT 1
INTRODUCTION 2
LITERATURE REVIEW 6
DESCRIPTION OF RESEARCH 13
PILOT PLANT DESCRIPTION 14
SAMPLING AND ANALYSIS PROCEDURES 17 -
PILOT PLANT OPERATING RESULTS 22 ..
SUMMARY AND CONCLUSIONS 37
REFERENCES 38
APPENDDC A 40
APPENDIX B 42
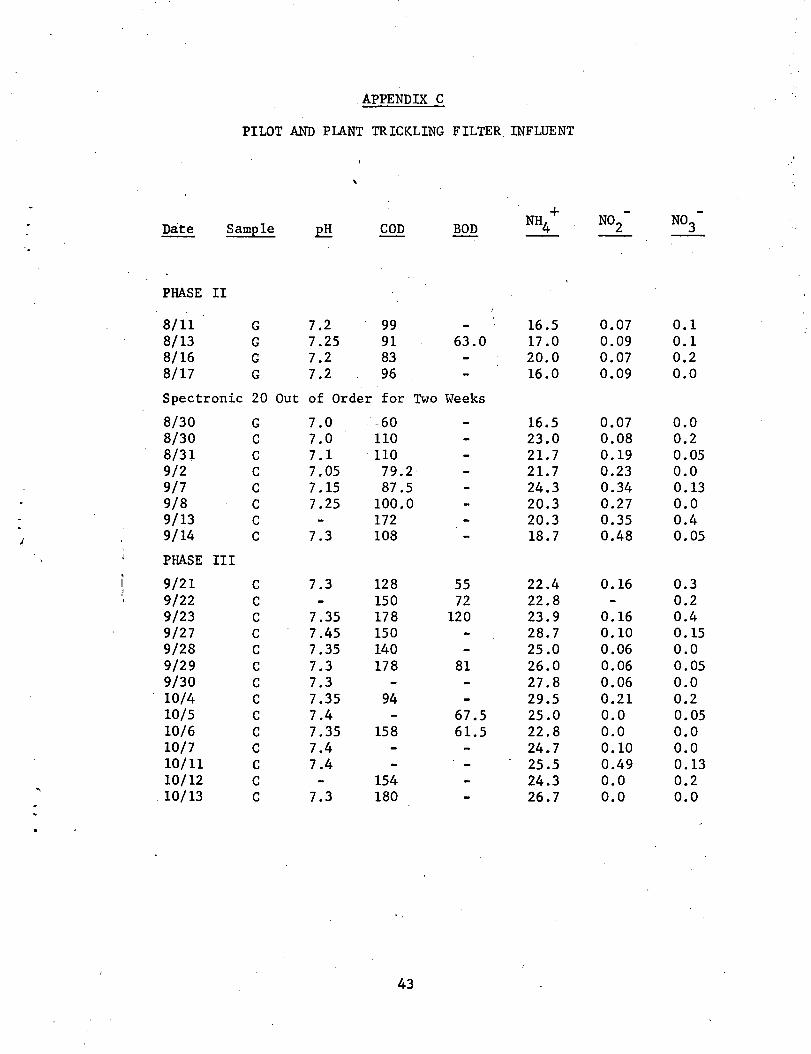
APPENDIX C 43
-ABOUT THE AUTHOR 46
iv
.LIST OF FIGURES
page
1. Nitrogen Cycle 7
2. Schematic Flow Diagram 15
3. Annnonia Calibration Curve 19
4. Nitrite Calibration Curve 20
5. Nitrate Calibration Curve 21
6. Diurnal Variation in pH 25
7. Daily Annnonia Concentrations 28
8. Daily Nitrite Concentrations 29
, 9. Daily Nitrate Concentrations 30
10. BOD Loading vs. Nitrate Increase 32
11. COD Loading vs. Nitrate Increase 33
12. COD Concentration vs. Nitrate Increase 34
13. Effect of COD Loading on Ni~rification . 35
v
•
..
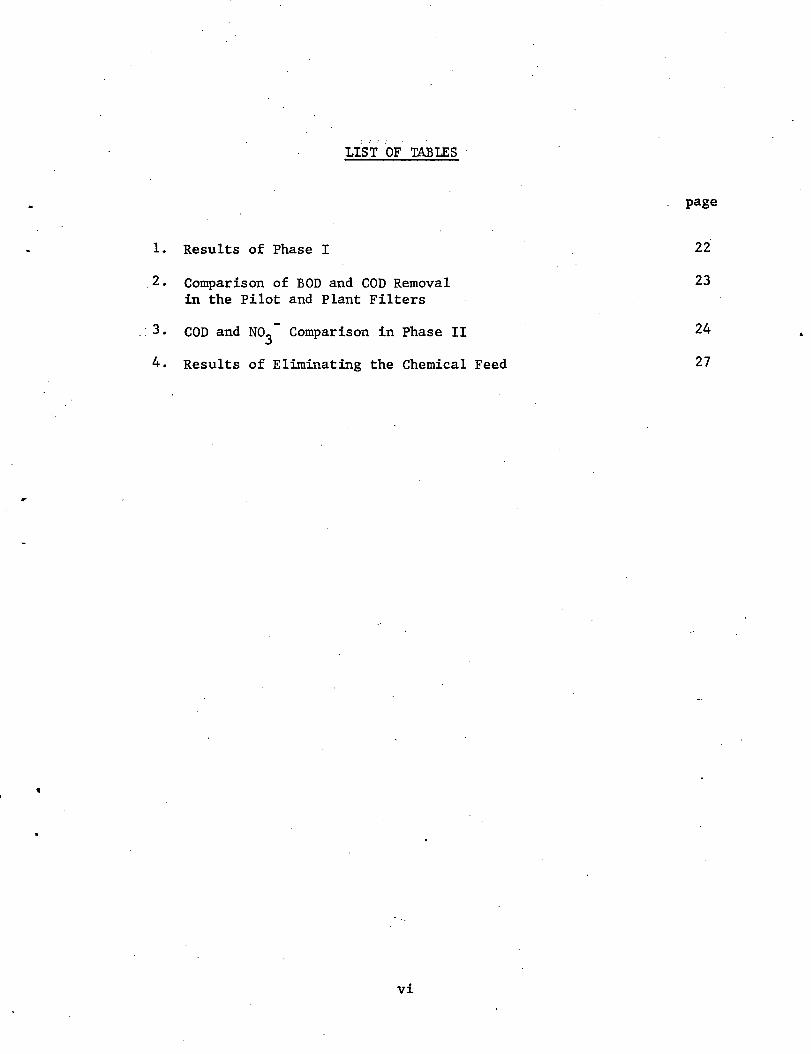
LIST OF TABlES ·
1. Results of Phase I
_2. Comparison of BOD and COD Removal in the Pilot and Plant Filters
.. 3. COD and N03
Comparison in Phase II
4. Results of Eliminating the Chemical Feed
vi
page
22
23
24
27
NOD
BOD
COD
TOO
BODL
gpd/sq
ft
gpm
MGAD
mg/1
ml
MGD
ptcfd
ft
LIST OF ABBREVIATIONS
Nitrogenous Oxygen Demand
5 day 20°C Biochemical Oxygen Demand
Chemical Oxygen Demand
Total Oxygen Demand
Ultimate Biochemical Oxygen Demand
gallons per day per square foot
Feet
gallons per minute
Million Gallons Per Acre Daily
milligrams per liter
milliliter
million gallons per day
pounds per thousand cubic feet per day
vii
ABSTRACT
This study attempted to increase the rate of nitrification
by a pilot scale high rate trickling filter operated at the Bethlehem
Sewage Treatment Plant. The pH of the pilot scale trickling f:i.lter
influent was increased to approximately 8.5 which is the optimum range
for the growth of Nitrosomonas and Nitrobacter, the two major nitri
fying bacteria.
Test results indicate that the adjustment of the sewage pH
did increase the degree of nitrification. However, the magnitude of
the increase was not significant enough to warrant the procedure on
a plant scale basis.
The major cause of low nitrification with or without the pH
adjustment was the high organic loading due to the actual trickling
filter influent of the Bethlehem .facility. Pilot scale trickling filter
operation at slightly lower organic loadings indicate that further re
duction of the organic loading will be required before nitrification
can be achieved.
Occasional high concentrations of cyanide in the wastewater
during the study probably inhibited the nitrification to an appreciable
degree. Additional verification of this problem is needed at the
Bethlehem facilities.
...
INTRODUCTION
Nitrification of wastewaters is the oxidation of amm<>nia
nitrogen to the nitrate form via nitrite. This oxidation occurs na
turally in soils and streams as a result of autotrophic bacterial
metabolism. Autotrophic bacteria synthesize new cell protoplasm,
most using inorganic chemical sources and a.few using sunlight as the
energy source. Carbon dioxide serves as the carbon source although
carbon monoxide can also be a carbon source (13).
A typical effluent from conventional secondary sewage treat
ment facilities will contain 10 to 20 mg/1 ammonia nitrogen (10). In
the receiving waters, nitrifying bacteria will oxidize this amnonia
first to nitrite and then to nitrate. A limited amount of ammonia
is used directly by other organisms in their metabolism. Under favor
able environmental conditions ammonia oxidation will ·proceed rapidly
and may' reduce the dissolved oxygen of the stream or lake to near zero,
resulting in a possible fish kill.
The oxygen demand exerted by nitrification has been termed
the NOD. The NOD will be most critical for low flow streams which
receive relatively large quantities of secondary sewage effluent.
· The most critical period is during the summer when warm temperatures
and low stream flows create favorable environmental conditions for
nitrification (10).
Nitrogen in the ammonia, nitrite, and nitrate forms is also
an important nutrient for cultural eutrophication. Eutrophication is
2
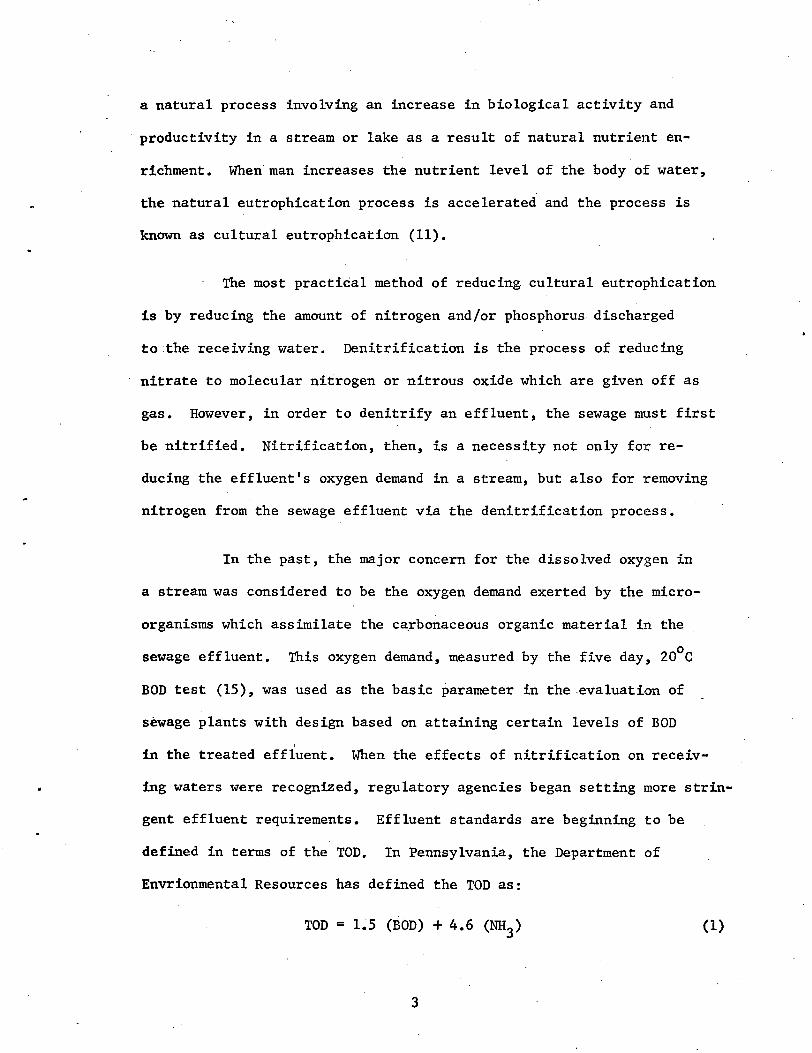
a natural process involving an increase in biological activity and
productivity in a stream or lake as a result of natural nutrie11t en-
richment. When man increases the nutrient level of the body of water,
the natural eutrophication process is accelerated and the process is
known as cultural eutrophication (11).
The most practical method of reducing. cultural eutrophication
is by reducing the amount of nitrogen and/or phosphorus discharged
to:the receiving water. Denitrification is the process of reducing
nitrate to molecular nitrogen or nitrous oxide which are given off as
gas. However, in order to denitrify an effluent, the sewage must first
be nitrified. Nitrification, then, is a necessity not only for re-
ducing the effluent's oxygen demand in a stream, but also for removing
nitrogen from the sewage effluent via the denitrification process.
In the past, the major concern for the dissolved oxygen in
a stream was considered to be the oxygen demand exerted by the micro-
organisms which assimilate the ca.rbonaceous organic material in the
sewage effluent. This oxygen demand, measured by the five day, 20°C
BOD test (15), was used as the basic parameter in the evaluation of
sewage plants with design based on attaining certain levels of BOD ;
in the treated effluent. When the effects of nitrification on receiv-
ing waters were recognized, regulatory agencies began setting more strin-
gent effluent requirements. Effluent standards are beginning to be
defined in terms of the TOD. In Pennsylvania, the Department of
Envrionmental Resources has defined the TOD as:
TOD = 1~5 (BOD) + 4.6 (NH3) (1)
3
The 1.5 factor is used to transform the five day 20°C BOD to the
ultimate BODL. The 4.6 factor is the stoichiometric amount of oxygen
needed to oxidize one unit of ammonia to nitrate, both expressed as N.
The TOD thus requires more than six times the amount of oxygen as
indicated by the BOD. As a result, new plants are being designed to
consider the TOD of the sewage.
Existing plants are faced with a very real problem in meeting
present and future effluent quality standards which require a greater
degree of nitrification. Increased nitrification might be obtained
by adding biological nitrifying units, but the cost of additional units
could be quite high. A desirable alternative would be to increase
nitrification in the existing secondary treatment units.
The following example using TOD as the effluent quality
criteria will illustrate the additional degree of treatment required.
Suppose a secondary treatment plant is removing 90% of the influent
BOD which averages 250 mg/1. The plant is also removing a quite
respectable 50% of the influent ammonia which is approximately 30 mg/1.
The following values for TOD would then exist:
•
TODinf = 1.5 (250) + 4.6 (30) = 513 mg/1
TODeff = 1.5 (25) + 4.6 (15) = 106.5 mg/1
The plant efficiency for TOD removal is only 79%. In order to meet
an effluent standard of 90% TOD removal, the plant would have to produce
an effluent with a TOD of 46 mg/1. This means that the current TOD of
the plant effluent would have to be reduced about 60%. An increase in
4
plant facilities of this magnitude is quite costly.
Wild et al. (18) have shown that by adjusting the pH of
sewage increased nitrification could be achieved in activated sludge
units. They adjusted the pH to approximately 8.0 to 8.5, the-optimum
for the growth of nitrifying bacteria. Since the nitrifying bacteria
increased the rate and extent of ammonia oxidation at this pH in acti
vated sludge units, then this pattern should hold true in high rate
trickling filters. The objective of this research was to determine
the increase in nitrification corresponding to an increase in the pH
of the filter influent to these optimum levels.
By significantly increasing nitrification in high rate
trickling filters, the existing plants could save on the cost of addi
tional nitrifying units. Instead of building new units the plants
would only have to install a chemical feed system to adjust the pH
of the sewage. The only additional costs would be for the chemicals
and the chemical feed equipment.
5
LITERATURE REVIEW
Nitrogen is an important ingredient in all life functions.
A general composition of biological protoplasm is c5
H7o2N, indicating
that 0.13 pounds of nitrogen are required for each pound of bacterial
cells synthesized (8). The earth's atmosphere is approximately 78%
molecular nitrogen, which is unusable by most living organisms.
Through electrical discharge, molecular nitrogen is converted to the
nitrate form, the first step in the nitrogen cycle depicted in Fig. 1
(15).
Nitrate is utilized by green plants in their photosynthesis
to produce protein.
N03 + co2 + green plants + sunlight ~ protein
Nitrogen-fixing bacteria and some forms of algae are able to convert
molecular nitrogen directly to protein.
N2 + nitrogen fixing bacteria and/or algae ~ protein
.The protein becomes the source of nitrogen for humans, animals, and
some plants that are unable to use nitrate directly. Nitrogen in the
form of protein is used in the body for growth and muscle repair.
This nitrogen from the proteins is continuously released by
humans and other animals as waste products. Nitrogen compounds are
also released upon the death of plants and animals. About 85 to 90%
of the nitrogen released is in the form of ammonia or an organic com
pound easily broken down into ammonia. A common form is urea, which
6
~)
~)
c 0 -Cf)
0 Cl..lo.. E a> 0 N o= Q)
O"t: Q)
...:LJ... 0 0-m c
0
"''a... c 0
.c -0 Q)
0
Fig. 1 Nitrogen Cycle
7
c: 0 -0 ::J c "'0 .Q Q)
0: -0 "'0 )(
0 -....: 0 0
CD
I -·
is hydrolyzed by the enzyme urease to ammonium carbonate (15).
Enzyme ~) Urease
Ammonia is further converted to nitrite and nitrate by auto-
trophic bacteria. The nitrogen in the nitrate form once again becomes
an important nutrient for •plant growth.
The nitrogen in the nitrate form can be converted to one of
two different forms. As previously mentioned, nitrate may be converted
to protein by green plants, or may be reduced to molecular nitr.ogen
by microbial activity according to the following equation (8):
~)
Unlike nitrification, there are many denitrifying species
of bacteria capable of reducing nitrate to molecular nitrogen or, in
some cases, to nitrous oxide. Anaerobic conditions are required
along with a supply of organic carbon (8).
The current research was concerned with a portion of the nitro-
gen cycle--the oxidation of ammonia to the nitrate ion via nitrite. As
previously stated, herein lies one portion of the water pollution problem.
The natural bacterial oxidation reduces the dissolved oxygen level in
the receiving body of water which can lead to deleterious effects on
fish and other aquatic life.
The solution to the problem of reduced dissolved oxygen in
the receiving water due to the NOD is to oxidize the ammonia prior to
8
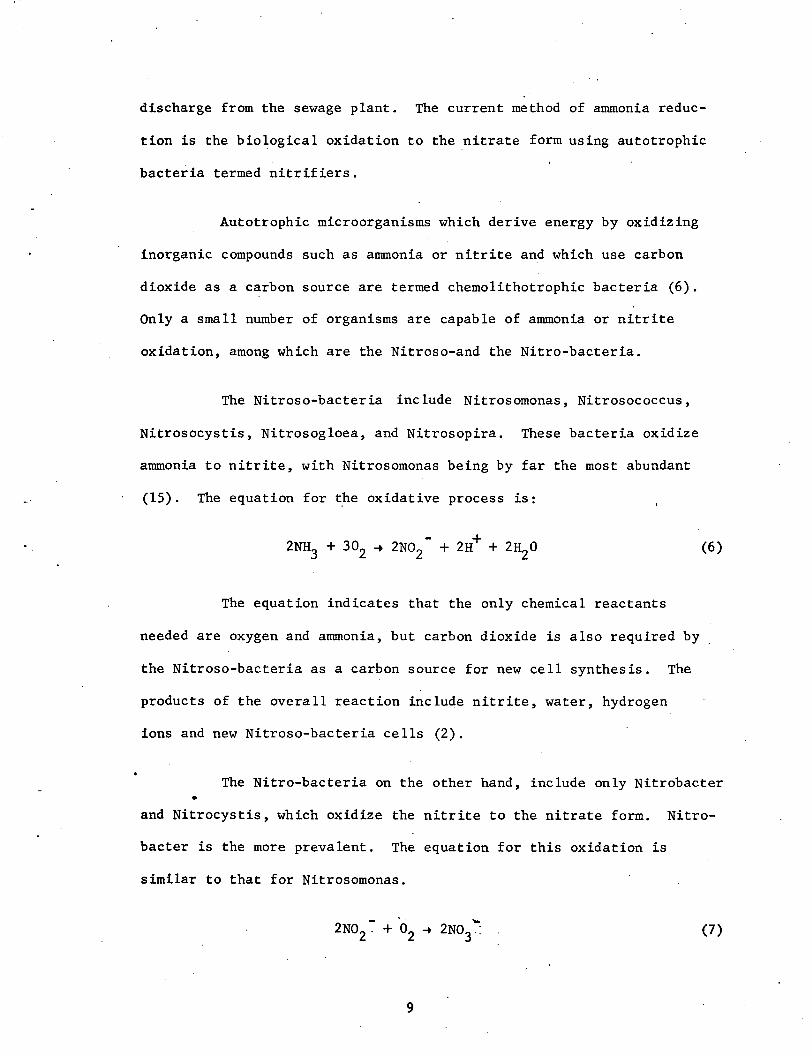
discharge from the sewage plant. The current method of ammonia reduc-
tion is the biological oxidation to the nitrate form using autotrophic
bacteria termed nitrifiers.
Autotrophic microorganisms which derive energy by oxidizing
inorganic compounds such as ammonia or nitrite and which use carbon
dioxide as a carbon source are termed chemolithotrophic bacteria (6).
Only a small number of organisms are capable of ammonia or nitrite
oxidation, among which are the Nitroso-and the Nitro-bacteria.
The Nitroso-bacteria include Nitrosomonas, Nitrosococcus,
Nitrosocystis, Nitrosogloea, and Nitrosopira. These bacteria oxidize
ammonia to nitrite, with Nitrosomonas being by far the most abundant
(15). The equation for the oxidative process is:
(6)
The equation indicates that the only chemical reactants
needed are oxygen and ammonia, but carbon dioxide is also required by
the Nitroso-bacteria as a carbon source for new cell synthesis. The
products of the overall reaction include nitrite, water, hydrogen
ions and new Nitroso-bacteria cells (2).
The Nitro-bacteria on the other hand, include only Nitrobacter •
and Nitrocystis, which oxidize the nitrite to the nitrate form. Nitro-
bacter is the more prevalent. The equation for this oxidation is
similar to that for Nitrosomonas.
(7)
9
Nitrite and oxygen are the reactants, along with carbon dioxide as a
carbon source, yielding nitrate and new Nitrobacter cells as end products
(5).
The usual growth rate for these autotrophs is quite slow,
taking about a week for a new generation of the bacteria to be produced.
In order to increase the nitrification in trickling filters, the growth
and metabolism rate of Nitrosomonas and Nitr·obactet must be increased.
Additional nutrients, such as phosphorous, magnesium, and iron,
are required. in small quantities for growth of Nitrosomonas and
Nitrobacter (13). Nitrosomonas also requires calcium and copper in
small amounts.
It has been determined (2) that the rate of nitrification
is independent of the ammonia concentration when it is greater than
3 mg/1 as N. Another study (18) found no inhibitory effects on Nitro-
' somonas when the ammonia concentration reached 60 mg/1. A typical raw
sewage will contain about 25 to 40 mg/1 ammonia. All of the other
nutrients are usually found in substantial amounts in sewage except for
the nitrite ions, which are supplied by the Nitrosomonas bacterial
metabolism (14).
Nitrosomonas and Nitrobacter tend to adhere to solid surfaces.
In fact, for Nitrosomonas a solid surface is almost a necessity for
growth, although the reason is not certain (13). The trickling filter
media provides an excellent surface onto which the nitrifiers can adhere.
10
Oxygen is needed in abundant amounts for nitrification.
The stoichiometric oxygen requirements for oxidation of ammonia and
nitrite has been determined to be 3.22 mg/1 oxygen per mg/1 ammonia
as N oxidized to nitrite and 1.11 mg/1 oxygen per mg/1 nitrite as N
· oxidized to nitra'te (12, 15). The equations for this oxygen consumption
due to a slightly lower alkalinity in the sewage during this portion
of the day.
On October 21, the flow scheme and flow rate were changed to
start Phase IV operation. The hydraulic rate was increased while the
organic loading was reduced by using the plant filter effluent as the
pilot filter influent. The complete test results can be seen in
Appendix C. On 8 of 9 days that tests were conducted, the nitrate
level in the pilot effluent equaled or exceeded 1.0 mg/1. This is
quite significant considering that during the 14 days that analyses
were performed in Phase III only one analysis had a nitrate concentra
tion greater than 0.75 mg/1 in the pilot filter effluent. This indi
cates that the organic loading, not the hydraulic loading, is a more
important variable for nitrification in trickling filters.
Phase V consisted of a three day set of tests to show that
the nitrification in the pilot filter would drop with the cessation
of chemical addition to raise th~ pH. Tests were discontinued after
3 days as a result of a pump failure and much colder weather. The
pH of the pilot filter returned to the same value as the plant filters
and the nitrate concentration dropped from Phase IV levels. The nitrate
concentration did not decrease to the concentrations in the plant filters:
this was anticipated since the plant filter effluent was the pilot
filter influent and some additional nitrification is to be expected.
Table 4 shows the actual test results.
26
TABLE 4
Results of Eliminating the Chemical Feed
Effluent Plant Filter Pilot Filter ..
Date pH COD N03 pH COD NO. (mg/1) . (mg/1) 3
. 11/9 7.4 81 0.13 7.8 81 ·0.6
11/10 7.5 112 0.4 7.6 117 0.9
11/11 7.5 0.68 7.5 1.09
The daily ammonia concentration in the influents and effluents
is shown in Fig. 7. The last influent samples from the pilot filter
and plant filter were taken October 14. On October 21, the plant filter
effluent. became the influent to the pilot filter. The effluent of the
pilot filter consistently had lower ammonia concentrations than the
effluent of the plant filter.
Daily nitrite levels are illustrated in Fig. 8 while Fig. 9
shows the variation in the nitrate nitrogen. The pilot filter effluent
contained the highest nitrite level over 90 per cent of the time. This
would indicate a greater Nitrosomonas activity in this unit due to the
more optimum pH conditions.
Nitrate concentration in the pilot filter effluent was
generally lower than in the plant filter effluent when the pilot filter
operated at 407 gpd/sq ft. When the hydraulic loading was reduced to
203 gpd/sq ft, the average pilot filter effluent nitrate was 0.25 mg/1
higher than the plant filter effluent. When the operation was changed
to use the plant filter effluent as the pilot filter influent at a
27
30
"Zj .... OQ . .......
0 IU t-'• -..... ~ '<
> 0'
N ~ E (X) 0 -::l z ....
IU I (') +v 0 ::l :c
15 n z ~ ::l rt t1 Ill rt t-'• 0 ::l (ll
--- Plant T.F. lnf. Plant T.F. Eff.
---- Pilot T. F Eff.
Flow Rate 407 gpd/sq. ft.
.,
9/4 9/14 9/24
Flow Rate 203 gpd/sq. ft..
10/4
DATE
10/14
I I
I
I• / -"', I l I
\ I l I \ I I /. \ I ll ,, "
'I
Flow Rate 326 gpd/sq. ft.
10/24 11/3 • 11/13
1.6
...,
.... O'Q ' . co
1.2 if -..... ~ ..... '< CJ)
!Z E ..... -N ,..,. z \0 t1 ..... I 0.8 ,..,. (1) tN n 0 0 z ::s () (1)
::s ,..,. t1 Ill ,..,. ..... 0 ::s {ll
. .
--- Plant T. F. I nf. •
--Plant T.F. Eff. ----Pilot T.F. Eff.
Flow Rate 407 gpd/sq.ft.
" ,, ' . I I I \
. ) \.
Flow Rate 203 gpd/sq. ft.
A I\ I
I \ / I \ I
I \ I , -- .... .,;.'
I \ I - ,----... "" J I - .., ,, , , "'"' . "
9/4 9/14 9/24
' , .,
10/4 DATE
10/14
~ '' ' ' ' ' ' ' ' ' ' '-, ' ',,
I I I
I I I
II ' I I I I II I I I I II
/ I I ''' I I I el I
'
I II I I f I
LJ·
Flow Rate 326 gpd/sq.ft.
10/24 11/3 a
11/13
L6 I'Zj ....
OQ . \0
t:;j 1.2 IU -1-'• o( 1--'
' '< C1' z E .... rt .-o; z w IU
0 rt
I llf) 0.8 I (l)
(') 0 0 l ::s z n l (l)
::s l rt o; ' IU
0.4' rt 1-'• 0 ::s Cll
. '
--- Plant T. F. lnf. Plant T. F. Eff.
---- Pilot T. F. Eff.
Flow Rate 407 gpd/sq.ft.
Flow Rate 203 gpd /sq. ft.
......... , ,. I I I I I
/J I I I
9/4 9/14
__ , '
9/24 10/4 DATE
I I
I I
I I I
I I
I I
' J ";'
10/14
·Flow Rate
1', 326 gpd/sq.ft.
I ' 1 I \ I I \ I~
\. I I \ I
' ' I I \ I I \ I I i
I I t, ,1 I
10/24
\.' I I I I I I I I I I
~
11/3" 11/13
higher hydraulic loading rate of 326 gpd/sq ft, the nitrate concentra
tion in the pilot filter effluent increased to about 0.75 mg/1 greater
than the plant effluent. When chemical addition was stopped on Nov
ember 8, the nitrate concentration in the pilot filter effluent decreased.
The results seem a clear indication that 1) the lower the organic
loading the greater the nitri.:Hcation and 2) the increased pH does
improve the degree of nitrification.
Further support of the first statement is shown in Fig. 10.
As the BOD loading decreased, the nitrate production in the pilot filter
increased. This trend is also shown in Fig. 11 using the COD as a
measure of the organic loading. It would appear from Fig. 12 that
increased nitrification is at least partially dependent on the concen
tration of the organic loading onto the trickling filter.
During Phase IV operation the Pilot filter effluent nitrate
concentration was about 1.25 mg/1 No3
--N. Over the entire research
study nitrate in the plant trickling filter effluent was about 0.40
mg/1 N03--N. Thus, Phase IV operation produced an increase of about
0.85 mg/1 nitrate nitrogen. This concentration seems a very nominal
increase, however, when considered in terms of pounds of oxygen per
day for a 10 MGD plant, this nominal 0.85 mg/1 increas~ in nitrate
results in a decrease of 327 pounds per day of oxygen demand that would
otherwise be exerted in the receiving stream.
In Fig. 13, the curve defined by the data of Fig. 11 has been
extrapolated. This shows the probability of greatly increasing the
nitrification in the trickling filters at Bethlehem by using a COD
31
0
..
40
- 35 "C ..... 0 -0. ......... 0 0
- m 30 .
A ,•.
0
25 0 A
"T'"
0
N03 INCREASE (mg/~)
Fig. 10 BOD Loading vs. Nitrate Increase
32
0 0 (.)
120
•
0 .2 .4
0 0
.6
' ..,... .
N03 INCREASE (mg/R)
Fig. 11 COD Loading vs. Nitrate Increase
33
0
0
.8 1.0
(") 0 0
(")
0 ::s n (1)
::s rt ~ Ill
U) rt +='- .....
0 ::s < en . z ..... rt ~ Ill rt
.(1)
H ::s n ~ (1) Ill en (1)
I rl t
0
0
0
0
t. , I I
0
0 ,p ...
-.
.2 .4 .6 .8 1.0 1.2 1.4 N03 INCREASE (mg/.5l)
. '.
.,
"'1 ..... OQ . t-" w
tr:l Hl Hl (!) n rt
0 -Hl ~
("") 0 0 -t:1 a. w -V1 t"" 0 0 IU
0 c;l.. ..... (.) ::s OQ
0 ::s z ..... rt t1 ..... Hl ..... n IU rt ..... 0 ::s
N03 (mg/J.)
loading of about 20 ptcfd. Time did not permit investigation of the
effect this COD loading rate would have on nitrification and further
studies need to be undertaken in this area.
Several difficulties were encountered in the pilot plant
operation. Periodically, both the centrifugal supply pump and the
chemical feed pump failed. Clogging of the .flow control valve and of
the intake in the chemical storage tank also caused interruptions.
In addition the Bethlehem Sewage Treatment Plant was undergoing sand
blasting and painting of equipment and throughout the study both the
primary and secondary clarifiers, as well as all four of the trickling
filters were shut down for maintenance at various times. This resulted
in variations in the sewage strength and quality.
The interference with perhaps the most deleterious effect
on the test results was cyanide. On three different occasions cyanide
concentrations exceeded 0.14 mg/1 in the raw sewage. Cyanides are
quite toxic to the nitrifying bacteria. The effects of the cyanide
on the results of the study can not be thoroughly defined, but there
probably was a deleterious effect on the nitrification in the pilot
trickling filter •
•
36
be drawn:
SUMMARY AND CONCLUSIONS
From all the results of the study several conclusions can
a. Nitrification is increased in high rate trickling filters
by raising the pH to the optimum level for bacterial
growth.
b. The organic loading onto the trickling filter has a
definite effect on the nitrification, with increased
nitrification as the organic loading decreases.
c. The increase in nitrification due to pH adjustment is
not sufficient to be of practical benefit at the organic
loading rates experienced at the Bethlehem Sewage Treat
ment Plant.
d. Periodic amounts of cyanide in substantial concentrations
may have had a detrimental effect on the results of the
study. The total effect is undefined but it is felt to
be significant.
While is is acknowledged that this study has failed to show
significant increase in nitrification by raising the pH, more work needs
to be done, especially at reduced organic loadings on the pilot trick
ling filter. In addition, in view of the difficulty encountered,
cyanide and other interfering substances should be monitored during
the studies.
37
REFERENCES
1. American Public Health Association, STANDARD METHODS FOR THE EXAMINATION OF WATER AND WASTEWATER, 12th Ed., American Public Health Association, New York, 1965
2. Balakrishnan, S. and Eckonfelder, W. W., NITROGEN RELATIONSHIPS IN BIOLOGICAL TREATMENT PROCESSES - II. NITRIFICATION IN TRICKLING FILTERS, Water Research, Vol. 3, p. 167
3. Barth, E. F., Brenner, R. C. and Lewis, R. F., CHEMICAL-BIOLOGICAL CONTROL OF NITROGEN AND PHOSPHORUS IN WASTEWATER EFFTDENT, Journal WPCF, Vol. 40, No. 12, p. 2040 (1968)
4. Barth, E. F., Mulbarger, M., Ettinger, M. B. and Salotto, B. V., REMOVAL OF NITROGEN BY MUNICIPAL WASTEWATER TREATMENT PLANTS, Jour. WPCF, Vol. 38, No. 7, p. 1208
5. Department of the Environment, NITRIFICATION IN THE BOD TEST, Notes on Water Pollution, Water Pollution Research Laboratory, No. 52 (March 1971)
6. Doelle, H. W., BACTERIAL METABOLISM, Academic Press, New York, 1969
7. Eckenfelder, W. Wesley, Jr., WATER QUALITY ENGINEERING FOR PRACTICING ENGINEERS, Barnes and Noble, Inc., New York (1970)
8. Eliassen, Rolf and Tchobanoglous, George, REMOVAL OF NITROGEN AND PHOSPHORUS FROM WASTEWATER, Environmental Science and Technology, Vol. 3, p. 536 (1969)
9. Engle, M.S. and Alexander, M., GROWTH AND AUTOTROPHIC METABOLISM OF NITROSOMONAS EUOPAEA, Jour. Bact., Vol. 76, p. 217 (1958)
10. Gannon, John J. and Wezernak, Chester T., EVALUATION OF NITRIFICATION IN STREAMS, Jour. ASCE Sanitary Engineering Division, Vol. 94, No. SA5, p. 883 (October 1968)
11. Grundy, Richard D. , STRATEGIES FOR CONTROL OF MAN-MADE EUTROPHICATION, Environmental Science and Technology, Vol. 5, No. 12, p. 1184 (December 1971)
12. Johnson, Walter K. and Schroepfer, George J., NITROGEN REMOVAL BY NITRIFICATION AND DENITRIFICATION, Jour. WPCF, Vol. 36, No. 8, pp. 1015-1036 (1964)
13. Lees, Howard, BIOCHEMISTRY OF AUTOTROPHIC BACTERIA, Butterworths Scientific Publications, London (1955)
38
14 . Painter, H. A. , A REVIEW OF LITERATURE ON INORGANIC NITROGEN METABOLISM IN MICROORGANISMS, Water Research, Vol. 4, p. 393
15. Sawyer, Clair N. and McCarty, Perry L., CHEMISTRY FOR SANITARY ENGINEERS, 2nd Ed., McGraw-Hill Book Company, New York (1967)
16 .. Schroeder, Edward D. and Moore, Stephen F., THE EFFECT OF NITROGEN FEED RATE ON DENITRIFICATION, Water Resources, Vol. 5, No. 7, p. 445 (July 1971)
17. Thimann, Kenneth V., THE LIFE OF BACTERIA, The Macmillan Company, New York (1965)
18. Wild, H. E., Sawyer, C. N. and McMahon, T. C., Jour. WPCF, Vol. 43, No. 9, pp. 1845-1854,FACTORS AFFECTING NITRIFICATION KINETICS
•
39
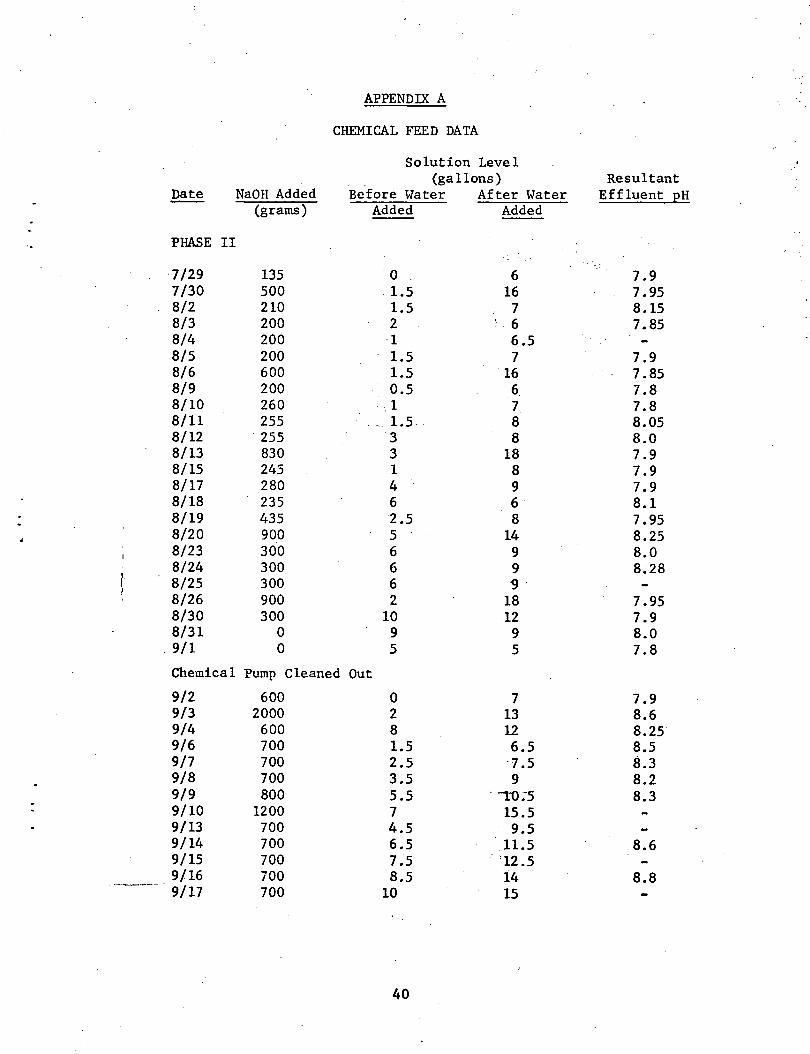
APPENDIX A
CHEMICAL FEED DATA
Solution Level (gallons) Resultant
Date NaOH Added Before Water After Water Effluent EH (grams) Added Added