Page 1
1
NITROGEN MASS BUDGET OF A SILAGE CORN FIELD AT THE UNIVERSITY OF FLORIDA DAIRY UNIT IN HAGUE, FL
By
REBECCA J. HELLMUTH
A THESIS PRESENTED TO THE GRADUATE SCHOOL OF THE UNIVERSITY OF FLORIDA IN PARTIAL FULFILLMENT
OF THE REQUIREMENTS FOR THE DEGREE OF MASTER OF SCIENCE
UNIVERSITY OF FLORIDA
2013
Page 2
2
© 2013 Rebecca J. Hellmuth
Page 4
4
ACKNOWLEDGMENTS
I would like to thank my advisor, Dr. George Hochmuth, for taking a chance on me
and giving me the opportunity to pursue this degree. I also would like to thank him for all
his help and direction throughout the process. I would like to thank my committee
members, Dr. Mark Clark, Dr. Adegbola Adesogan, and Dr. Lynn Sollenberger, for their
guidance and input in my thesis work. I would like to thank Dawn Lucas who helped me
with my field and lab work for always being patient and willing to answer all my
questions. Your support and encouragement were greatly appreciated. I’d like to thank
my family for all their support and encouragement.
Page 5
5
TABLE OF CONTENTS page
ACKNOWLEDGMENTS .................................................................................................. 4
LIST OF TABLES ............................................................................................................ 7
LIST OF FIGURES .......................................................................................................... 9
LIST OF ABBREVIATIONS ........................................................................................... 10
CHAPTER
1 LITERATURE REVIEW .......................................................................................... 13
Introduction ............................................................................................................. 13 Nutrient Mass Budgets............................................................................................ 15
Components of Nutrient Mass Budgets .................................................................. 21 Soil Nitrogen ..................................................................................................... 22 Crop Uptake ..................................................................................................... 25
Leaching ........................................................................................................... 28 Volatilization ..................................................................................................... 31
Mineralization .......................................................................................................... 34 Objectives ............................................................................................................... 37
2 MATERIALS AND METHODS ................................................................................ 38
Dairy Unit Site Description ...................................................................................... 38 Nitrogen Mass Budget ............................................................................................ 40
Sampling Locations in the Field ........................................................................ 41 Directly Measured Components of Nitrogen Mass Budget ............................... 42
Soil sampling and analysis ......................................................................... 42 Crop sampling and analysis ....................................................................... 45 Leachate sampling and analysis ................................................................ 48
Mineralization Experiment ....................................................................................... 51 Data Analysis .......................................................................................................... 53
3 RESULTS AND DISCUSSION ............................................................................... 58
Site Characterization............................................................................................... 58
Spring Season ........................................................................................................ 59 N Inputs ............................................................................................................ 59
Initial soil N content .................................................................................... 59 Manure effluent and mineralized N ............................................................ 62 Inorganic N fertilizer ................................................................................... 65 Atmospheric deposition .............................................................................. 66
N Outputs ......................................................................................................... 66
Page 6
6
Final soil N content .................................................................................... 66
Crop uptake ............................................................................................... 68 Leaching .................................................................................................... 72
Unaccounted-for N ..................................................................................... 74 Summer Season ..................................................................................................... 76
N Inputs ............................................................................................................ 76 Initial soil N content .................................................................................... 77 Manure effluent and mineralized N ............................................................ 78
Inorganic N fertilizer ................................................................................... 83 Atmospheric deposition .............................................................................. 84
N Outputs ......................................................................................................... 84 Final soil N content .................................................................................... 84 Crop uptake ............................................................................................... 85
Leaching .................................................................................................... 89 Unaccounted-for N ..................................................................................... 92
Winter Season ........................................................................................................ 93
N Inputs ............................................................................................................ 93 Initial soil N content .................................................................................... 94 Manure effluent and mineralized N ............................................................ 94
Inorganic N fertilizer ................................................................................... 98 Atmospheric deposition .............................................................................. 99
N Outputs ......................................................................................................... 99 Final soil N content .................................................................................... 99 Crop uptake ............................................................................................. 101
Leaching .................................................................................................. 102
Unaccounted-for N ................................................................................... 104
2011- 2012 Cropping System Mass Balance ........................................................ 106 N Inputs .......................................................................................................... 106
N Outputs ....................................................................................................... 108
4 CONCLUSIONS ................................................................................................... 128
LIST OF REFERENCES ............................................................................................. 132
BIOGRAPHICAL SKETCH .......................................................................................... 138
Page 7
7
LIST OF TABLES
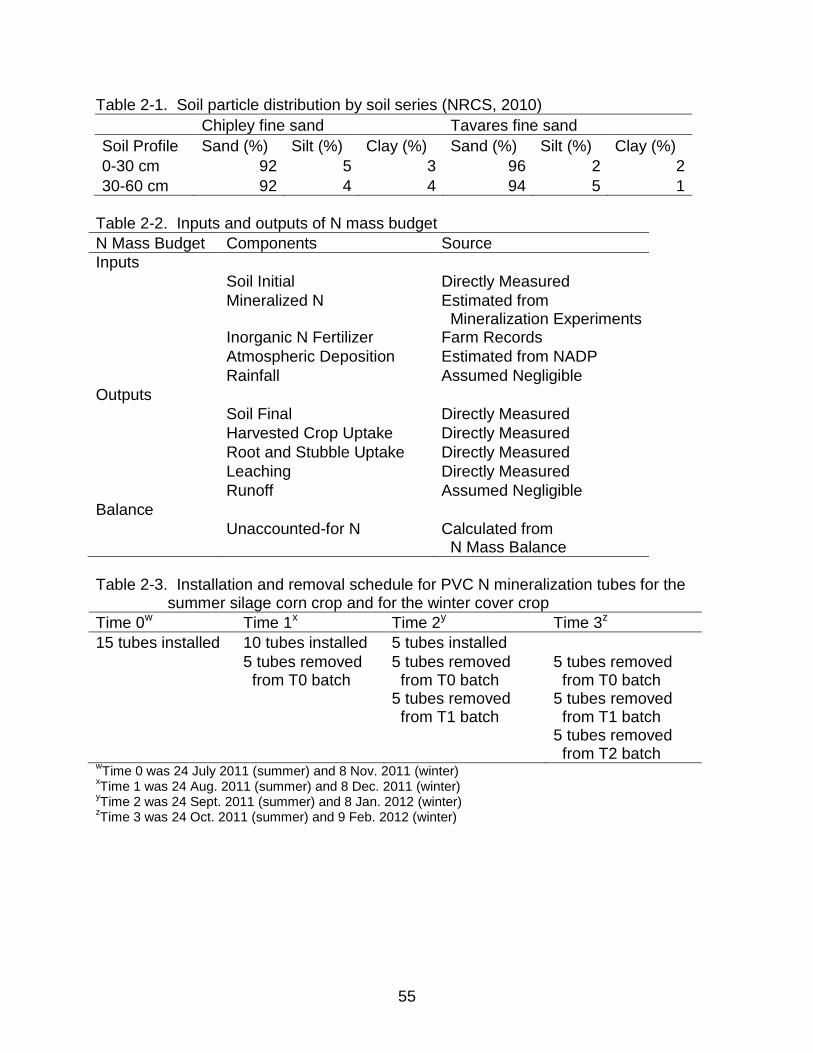
Table page 2-1 Soil particle distribution by soil series (NRCS, 2010) .......................................... 55
2-2 Inputs and outputs of N mass budget ................................................................. 55
2-3 Installation and removal schedule for PVC N mineralization tubes for the summer silage corn crop and for the winter cover crop ...................................... 55
3-1 Physical and chemical properties of topsoil at lysimeter locations on 14 June 2012 ................................................................................................................. 112
3-2 Bulk density of soil samples (0-60 cm) on four sampling dates ........................ 112
3-3 Bulk density of soil samples by depth ............................................................... 112
3-4 Soil mineral N (nitrate-N plus ammonium-N) content in the 0 to 60 cm soil profile by season .............................................................................................. 112
3-5 Soil mineral N (nitrate-N plus ammonium-N) content divided into 30 cm increments by season ....................................................................................... 113
3-6 Soil nitrate-N content in the 0 to 60 cm soil profile by season .......................... 113
3-7 Soil ammonium-N content in the 0 to 60 cm soil profile by season................... 113
3-8 Soil TKN content in the 0 to 60 cm soil profile by season ................................. 113
3-9 Soil nitrate-N content in 0 to 30 cm and 30 to 60 cm soil profile by sampling date .................................................................................................................. 114
3-10 Soil ammonium-N content in 0 to 30 cm and 30 to 60 cm soil profile by sampling date ................................................................................................... 114
3-11 Soil TKN content in 0 to 30 cm and 30 to 60 cm soil profile by sampling date . 114
3-12 Manure effluent N (TKN) application by month ................................................. 114
3-13 Inorganic N fertilizer (Total N) application by month ......................................... 115
3-14 Wet ion deposition by season (NADP, 2011) ................................................... 115
3-15 Crop dry weight yield by season ....................................................................... 115
3-16 University of Florida corn silage variety trial dry matter yields and crude protein concentration in 2011 (UF DAS, 2011) ................................................. 115
Page 8
8
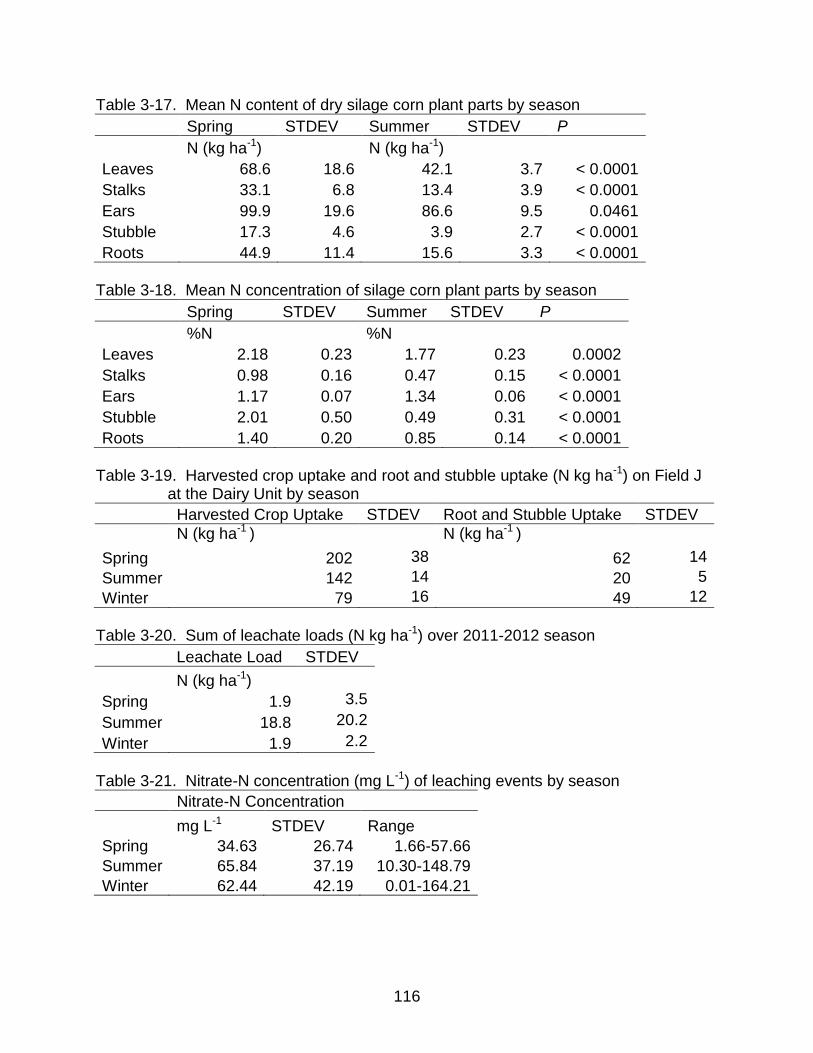
3-17 Mean N content of dry silage corn plant parts by season ................................. 116
3-18 Mean N concentration of silage corn plant parts by season ............................. 116
3-19 Harvested crop uptake and root and stubble uptake (N kg ha-1) on Field J at the Dairy Unit by season .................................................................................. 116
3-20 Sum of leachate loads (N kg ha-1) over 2011-2012 season .............................. 116
3-21 Nitrate-N concentration (mg L-1) of leaching events by season ........................ 116
3-22 N mass balance of spring silage corn crop at the Dairy Unit ............................ 117
3-23 Soil mineral N (nitrate-N plus ammonium-N) content of each location over three time periods for the summer mineralization experiment on Field J at the Dairy Unit .......................................................................................................... 117
3-24 Change in soil mineral N content over three time periods for the summer mineralization experiment on Field J at the Dairy Unit ...................................... 118
3-25 N mass balance of summer silage corn crop at the Dairy Unit ......................... 119
3-26 Soil mineral N content of each location over three time periods for the winter mineralization experiment on Field J at the Dairy Unit ...................................... 119
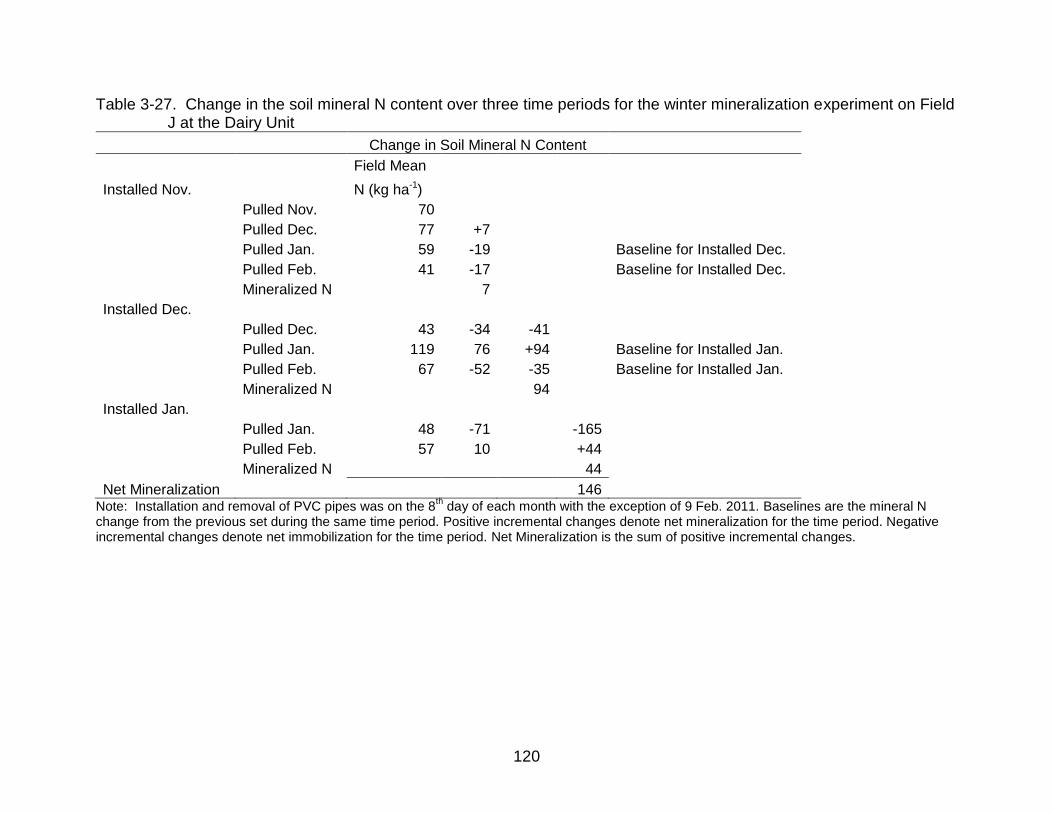
3-27 Change in the soil mineral N content over three time periods for the winter mineralization experiment on Field J at the Dairy Unit ...................................... 120
3-28 N content of rye/ryegrass plant parts ................................................................ 121
3-29 Mean percent N concentration of rye-ryegrass plant parts ............................... 121
3-30 N mass balance of winter rye/ryegrass crop at the Dairy Unit .......................... 121
3-31 Overall N mass balance of 2011-2012 corn-corn-rye/ryegrass cropping system at the Dairy Unit ................................................................................... 121
Page 9
9
LIST OF FIGURES
Figure page 2-1 Preselected sampling locations in Field J ........................................................... 56
2-2 Selection method of six additional sampling locations ........................................ 56
2-3 Drainage lysimeter design .................................................................................. 57
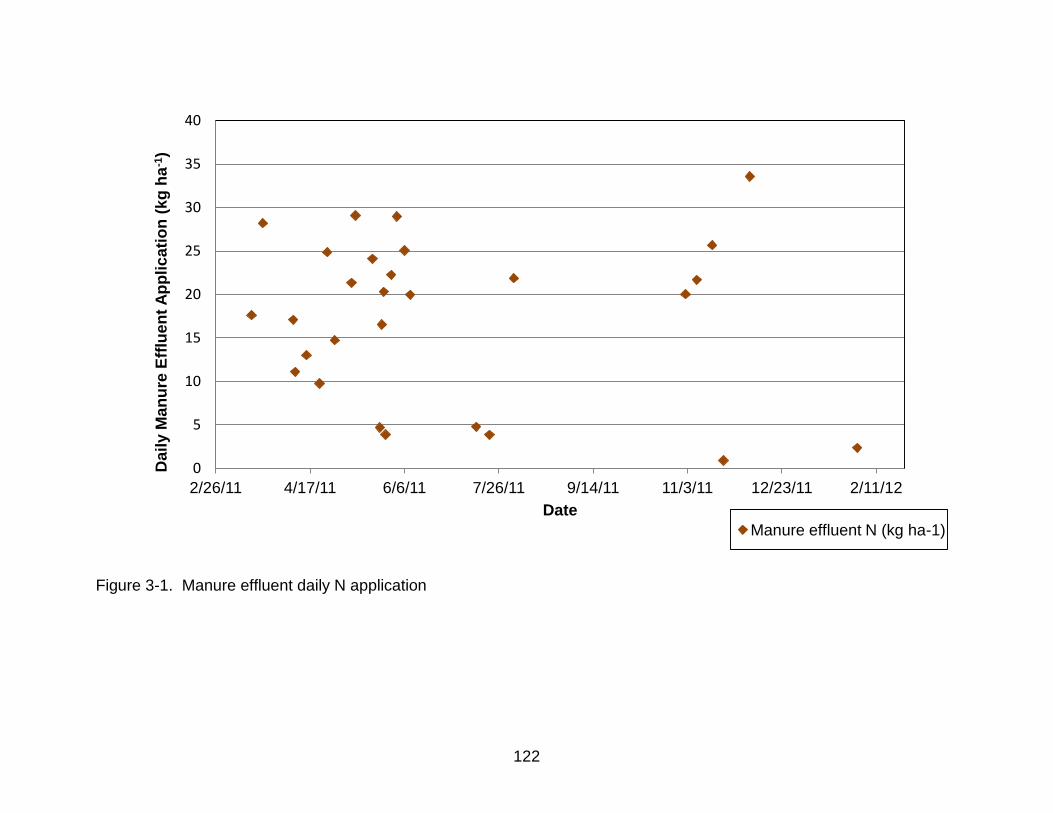
3-1 Manure effluent daily N application ................................................................... 122
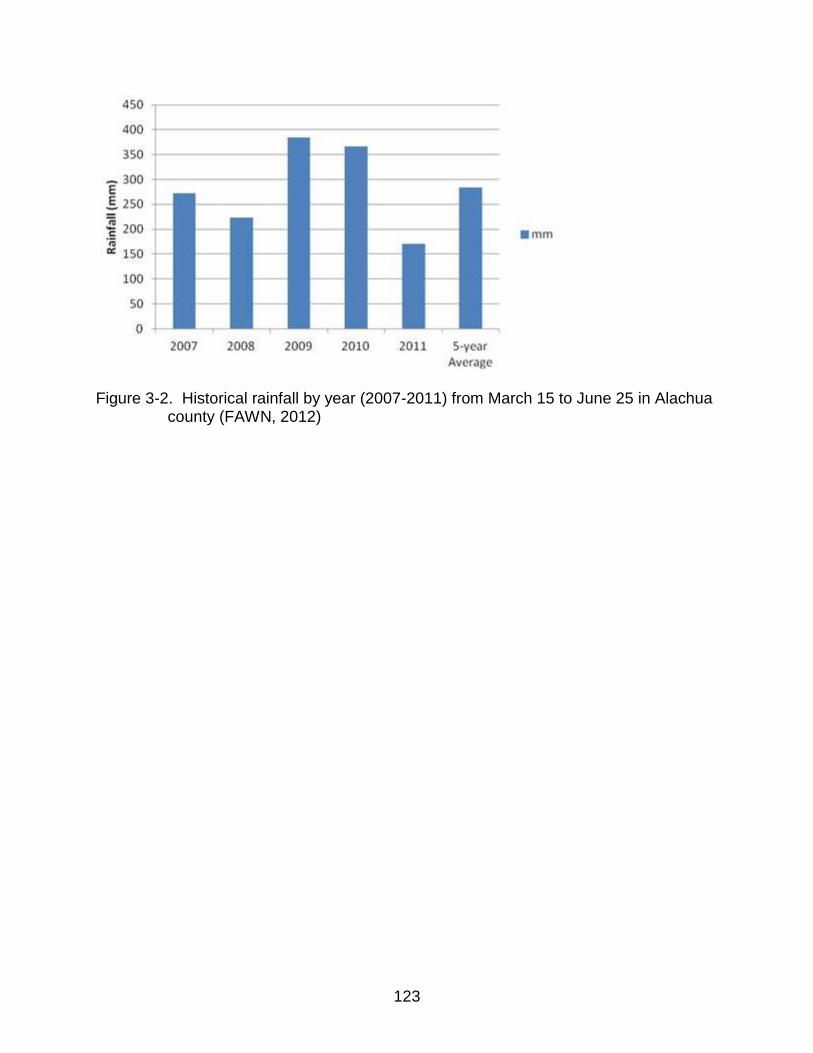
3-2 Historical rainfall by year (2007-2011) from March 15 to June 25 in Alachua county ............................................................................................................... 123
3-3 N leaching versus rainfall, fresh water irrigation, and manure effluent application (kg ha-1) ......................................................................................... 124
3-4 Historical rainfall by year (2007-2011) from June 2 to September 21 in Alachua county ................................................................................................. 125
3-5 Net mineralization/immobilization of summer mineralization experiment .......... 125
3-6 Mineral N content of summer mineralization experiment PVC pipes installed on 24 July 2011 ................................................................................................ 126
3-7 Net mineralization/immobilization of winter mineralization experiment ............. 126
3-8 Mineral N concentrations of winter mineralization experiment PVC pipes installed at 8 Nov. 2011 .................................................................................... 127
3-9 Historical rainfall by year (2007-2012) from September 21 to March 12 in Alachua county ................................................................................................. 127
Page 10
10
LIST OF ABBREVIATIONS
ARL Analytical Research Laboratory
BMP Best Management Practices
CAFO Concentrated Animal Feeding Operation
EPA Environmental Protection Agency
ESTL Extension Soil Testing Laboratory
FDEP Florida Department of Environmental Protection
FNUE Fertilizer Nitrogen Use Efficiency
GPS Global Positioning System
IFAS Institute of Food and Agricultural Sciences
K Potassium
MCL Maximum Contaminant Load
N Nitrogen
NADP National Atmospheric Deposition Program
NBS National Bureau of Standards
NELAC National Environmental Laboratory Accreditation Conference
NMP Nutrient Management Plan
NRCS USDA Natural Resource Conservative Service
P Phosphorus
PVC Polyvinyl Chloride
TKN Total Kjeldahl Nitrogen
UF University of Florida
Page 11
11
Abstract of Thesis Presented to the Graduate School of the University of Florida in Partial Fulfillment of the Requirements for the Degree of Master of Science
NITROGEN MASS BUDGET OF A SILAGE CORN FIELD
AT THE UNIVERSITY OF FLORIDA DAIRY UNIT IN HAGUE, FL
By
Rebecca J. Hellmuth
May 2013
Chair: George Hochmuth Major: Soil and Water Science
This study was conducted to identify potential environmental impacts of silage
production on a northeast Florida dairy farm and provide recommendations to minimize
excess nitrogen pollution. Agriculture is a contributor of non-point source nutrient
pollution contributing to Florida’s water quality concerns. A nitrogen mass budget was
quantified for a production field during the 2011-2012 crop year using farm records,
estimates from the NADP, and direct measurement of soils, crops, and leaching. Silage
corn was grown in the spring and summer seasons and rye-ryegrass was grown in the
winter season. All crops were fertilized by inorganic fertilizer and manure effluent
available to crops as mineralized N. The N balance inputs were soil mineral N content
(286 kg ha-1 N), mineralized N (407 kg ha-1 N), inorganic fertilizer (139 kg ha-1 N), and
atmospheric deposition (2 kg ha-1 N). The N outputs were soil mineral N content (28 kg
ha-1 N), harvested crop uptake (423 kg ha-1 N), root and stubble uptake (131 kg ha-1 N),
and leaching (23 kg ha-1 N). Unaccounted-for losses, consisting of gaseous losses, (229
kg ha-1 N) were calculated as the difference in inputs and outputs. Leaching (3% of N
outputs) was not a substantial N loss impacting the environment. Gaseous losses were
27% of N outputs due to volatilization of excessive manure effluent applications during
Page 12
12
the spring season. Therefore, more even fertilizer distribution throughout the crop year
was recommended. Even with poor manure effluent management, in low rainfall years
leaching may be minimal.
Page 13
13
CHAPTER 1 LITERATURE REVIEW
Introduction
Dairies are an important agricultural industry in Florida producing 2.1 billion
pounds of milk per year statewide (De Vries and Giesy, 2009). Balancing milk
production with environmental concerns is a major issue for dairy farms. Dairy farms
contribute to Florida’s nutrient and water quality problems (US EPA, 2005). Non-point
source nutrient pollution is the main cause of impaired water quality in the United States
(US EPA, 2005). Agriculture is the greatest contributor of non-point source pollution
contributing excess nitrogen (N) and phosphorus (P) from commercial fertilizers and
livestock manure (US EPA, 2005). The excess nutrients may increase algae growth
(eutrophication) in water bodies which can eventually create hypoxic conditions
detrimental to the environment (Shepard, 2005).
In Florida, eutrophication is a concern in Lake Okeechobee where excess P
contamination runs off from dairies during the rainy season (Zhang et al., 2007). The
agriculturally-based Suwannee River basin watershed in Florida is vulnerable to
contamination due to losses of fertilizer and distribution of manure waste as organic
amendments applied by farmers to produce crops in the watershed. The low water
holding capacity of the sandy soil in the region puts excess nitrate and P at a high risk
for leaching into the groundwater spring system after rainfall or excessive irrigation
(Mylavarapu, 2003). Over the past 20 years, nitrate levels in the groundwater have
increased due to nonpoint nutrient sources such as fertilizers and animal wastes.
Extensive efforts have been made by the Suwannee River Partnership (suwannee.org)
to reduce nitrate levels in surface waters and groundwater. The Partnership helps
Page 14
14
farmers implement voluntary or incentive-based programs to protect and conserve
water resources using research-based best management practices.
In accordance with the United States Clean Water Act, the National Pollutant
Discharge Elimination System regulates point sources such as dairies by requiring
permits in order to control pollution of the waters of the United States (NPDES, 2011).
Dairies are considered an Animal Feeding Operation where animals are raised in
confined conditions; instead of grazing, feed is brought to the animals (NPDES, 2011).
In Florida, dairy farms are regulated by the Florida Department of Environmental
Protection (FDEP). Dairies are required by FDEP to maintain minimum ground water
quality standards by installation of water-monitoring wells and requiring nutrient
management plans including manure-disposal plans (FDEP, 2010).
N pollution is the main contributor to all water quality problems in northern
Florida. Most soils in northern Florida are considered “coated” soils (at least 5% silt-
plus-clay) meaning the soils have the ability to retain large amounts of P (NRCS, 2010).
If soils are coated and the water table is not classified as high in geographic elevation,
then fertilizer recommendations are designed for N rather than for P loadings.
Therefore, N is the most common mineral fertilizer applied to agricultural lands, because
N is generally the most limiting nutrient to optimum crop production (Follett and
Delgado, 2002).
Excess N can cause environmental problems as well as harmful effects to infants
if high levels of nitrates are consumed through drinking water (EPA, 2010).
Methemoglobinemia, can result from ingesting drinking water containing high levels of
nitrates, which inhibit transport of oxygen by the blood. This syndrome has been
Page 15
15
documented in infants younger than three months and is therefore also known as blue
baby syndrome (Follett and Walker, 1989).
In the United States, the current national standard for the maximum contaminant
level (MCL) for nitrate-N in drinking water is 10 mg L-1. Dairy farmers must prove that
their water-monitoring wells adhere to these standards for groundwater. Nutrient
management plans developed for each dairy by the USDA Natural Resource
Conservation Service (NRCS) are required to control nutrient pollution on dairy farms in
order to meet these standards. These plans provide guidelines to correctly deal with
sources of nutrients such as manures and fertilizers in order to avoid nutrient pollution.
They are specific to each farm and take into account factors impacting the flow of
nutrients on the farm such as the number of cows, type of waste management system,
feed, typical farming practices, soil type, and fertilizers. The nutrient management plan
must be approved by the FDEP and is a contract between the dairy operation and the
FDEP. Nutrient management plans can be effective in drawing farmer’s attention to
sources of nutrients on the farm. Shepard (2005) conducted a survey of farmers in two
Wisconsin watersheds and showed that farmers with nutrient management plans
applied less total N and P than farmers without nutrient management plans.
Nutrient Mass Budgets
Nutrient mass budgets account for the inputs and outputs of nutrients in a chosen
area such as a dairy farm. Some outputs are potential losses to the environment and
therefore may constitute nutrient pollution. Typical inputs for an agricultural area are
fertilizer and feeds bought off the farm; typical outputs include runoff, leaching,
atmospheric losses, and agricultural products sold off the farm. Nutrient mass budgets
are used to evaluate the efficiency of the nutrient management plan, determine
Page 16
16
environmental concerns, and provide economic evaluation of the flow of nutrients on a
farm.
Kuipers et al. (1999) conducted a study in the Netherlands where the government
developed targets to reduce N losses from agriculture starting in the 1990s. Standards
were set for groundwater that it should contain less than 11.3 mg L-1 of nitrate-N.
Kuipers et al. (1999) described the Netherlands use of government imposed nutrient
balance sheets to control nutrient losses of N and P. Surpluses of N and P would result
in a tax being imposed on a dairy farmer. Dairy farmers were expected to adjust farming
practices to lessen nitrate leaching to groundwater and lessen P accumulation in the
soil (Kuipers et al., 1999). Korevaar (1992) described several farming practices used in
the Netherlands to reduce N losses such as manure slurry injection, covering slurry
storage, growing catch crops, increasing maize silage feeding while reducing grazing,
and reducing N application rate on grazing fields.
Nutrient mass budgets can be constructed for single fields, whole farms,
watersheds, or regions by identifying the nutrients cycling through a given area.
Because nutrient cycling within a given area is never a fully-closed system, estimates or
modeling of potential inputs and outputs are sometimes necessary. Many times, certain
pools of nutrients are very difficult to quantify. In the case of a N mass budget,
volatilization, denitrification, and atmospheric deposition are the most difficult to quantify
because they deal with N in the atmosphere. Rotz et al. (2005) used measured or
estimated inputs, outputs, and flows to construct a complete farm balance with nutrient
flows of N and P over two grassland farming systems in Germany and the Netherlands.
These farm balances were used to evaluate nutrient management relative to average
Page 17
17
commercial farms in terms of economics and environmental impacts. Models such as
the Integrated Farm System Model (Rotz et al., 1999; Rotz et al., 2005) and the
Dynamic North Florida Dairy Farm Model (Cabrera et al., 2005a) are used to
understand how changes in management decisions change the nutrient mass budget
and in turn affect economics and environmental concerns. Kohn et al. (1997) modeled a
35 ha dairy farm using herd efficiency, crop production and feed purchase coefficients
determined by Dou et al. (1996) and simulated four management scenarios of feed
intensive, legume intensive, fertilizer intensive, and manure importer. Kohn et al. (1997)
used N balance equations for the overall model farm to perform sensitivity analysis of
herd nutrition, manure management, and crop selection on nutrient losses. In the
model, Kohn et al. (1997) characterized farm inputs as legume fixation, imported feeds,
and imported fertilizers; outputs as crop production; and losses as leaching, runoff,
volatilization, and denitrification. The researchers found that importing feed resulted in
the lowest N losses relative to production. Farms using legumes for N fixation had more
efficient N utilization and fewer N losses from leaching, runoff, or denitrification than
farms applying inorganic N fertilizers. Improvement of N uptake of available soil N had a
greater impact in farm efficiency and therefore fewer N losses than a similar
improvement in manure availability.
Historical records from farms coupled with research sampling are often used to
construct nutrient mass budgets (Bacon et al., 1990; Klausner et al., 1998; Powell et al.,
2007). Typically, nutrient outputs are subtracted from nutrient inputs to obtain a nutrient
mass balance (Bacon et al., 1990; Rotz et al., 2005). Bacon et al. (1990) conducted a
nutrient cycling study on a Pennsylvania dairy farm using farm records and samples of
Page 18
18
crops and purchased inputs for measurements of moisture and nutrient content.
Nutrient mass balances were obtained by subtracting nutrient outputs from nutrient
inputs; factors such as volatilization losses, residual manure decomposition, leaching,
denitrification, and biological N fixation were estimated due to the difficulty in direct
measurement. A large net accumulation of N, P, and K occurred in the soil, and one
source was the nutrients in imported feedstuffs. A reduction in imported feedstuffs was
recommended. Once implemented, the reduction in importing feedstuffs did not
significantly affect milk production, but it provided an economic benefit to the farm and
decreased nutrients in the soil providing a potential benefit to the environment (Bacon et
al., 1990).
Powell et al. (2007) surveyed 54 dairy farms in Wisconsin to evaluate whether
actual farmer nutrient management behaviors conformed to their farm-specific nutrient
management plans to minimize negative effects to water quality. Manure collection
methods of the dairies were examined first, then feed and manure data were validated
and the accuracy of farm records was analyzed over a whole-farm basis. Finally, on a
field-by-field basis, nutrient application was studied to determine if it conformed to state
standards and how application corresponded to farm characteristics including livestock
inventories, cropping practices, and field histories. Manure collection and management
practices were recorded by farmers and included type of manure, application method,
quantity spread, and fields receiving the manure. Manure samples were also collected
by farmers periodically and analyzed.
Powell et al. (2007) found that N applications were approximately 40% fertilizer,
30% manure, and 30% from previous legume crops. Fields which received low (1-80 kg
Page 19
19
ha-1) available N application (in the form of fertilizer, manure, and previous legume) on
their total corn land represented 38, 51, and 34% of the studied farms in the Northeast,
South-Central, and Southwest regions of Wisconsin, respectively. The large majority of
farms had applied N within the agronomic N recommendations for corn (81 to 240 kg
ha-1). Excessive N inputs (>240 kg ha-1) of fertilizer, manure, and previous legumes
occurred on 6 of 12 farms in the Northeast, 5 of 12 farms in the South-Central, and 6 of
9 farms in the Southwest region, representing 40, 31, and 34%, respectively, of the total
corn area on those farms. Powell et al. (2007) found that that few Wisconsin dairy farms
used nutrient management practices that were detrimental to surface water quality
management areas. An important factor to optimize nutrient management is having an
adequate amount of cropland to spread manure.
Klausner et al. (1998) calculated an overall farm nutrient mass balance of N, P,
and K for a dairy farm in central New York. Farm records, legume acreage, and
percentage legume of the forage crop were used to obtain nutrients in feeds, fertilizers,
cattle, milk, and biological N fixation. Biological fixation of atmospheric N was estimated
to be 40% of the legume N content at harvest. Forage and milk analyses were
performed by a lab and nutrient content of purchased feed was obtained from the
supplier. Nutrient composition of purchased and sold cattle was estimated. Soil testing,
manure analysis, crop analysis, and feed analysis were performed to assess nutrient
contents of nutrient imports and exports. Hutson et al. (1998) determined N leaching by
background modeling, soil tests, and records using soil hydraulic conductivity, cropping
patterns, and conditions of the soil surface due to rainfall, temperature, evaporation, and
nutrient addition.
Page 20
20
Klausner et al. (1998) found that 60 to 72% of imported N, P, and K were in
excess of nutrient exports and the majority of the excess nutrients were from purchased
feedstuffs. After the nutrient mass budget was evaluated, a reformulation of feed was
recommended and it resulted in reduction of total N excretion and increased net farm
income by $40,200. N was defined as the most limiting crop nutrient. Crop nutrient
management recommendations were based on crop nutrient requirements taking into
account soil tests, starter fertilizer, and residual manure N available. Decreasing the use
of commercial synthetic fertilizer produced an additional $1,350 in net farm income, but
manure storage capacity constraints hindered further economic benefit. Construction of
a manure storage pond to provide more manure-based nutrient capacity was
considered, but costs associated with the pond would have resulted in a net financial
loss. Environmental implications of excess nutrient imports were not discussed. A
difference in whole farm imports and exports of 46.7 Mg year-1 of N was reported, but
estimations of possible exports to account for the difference such as volatilization,
denitrification, leaching, runoff, etc. were not reported.
Hall and Risser (1993) conducted a N budget on a Pennsylvania dairy farm to
determine the losses of N to the environment. It was found that 37% of mean annual N
outputs were from harvested crops, 25% of N losses from volatilization of N in applied
manure, 38% of the losses were from N leaching to ground water, and less than 1%
from surface runoff.
Wang et al. (2000) used a whole-herd optimization model developed for the
Cornell Net Carbohydrate and Protein System model to evaluate the nutrient mass
balance of a dairy farm and how changes in feed would affect economics and
Page 21
21
environmental impacts. Dividing lactating dairy cows’ feed ration based on their level of
milk production decreased the remaining N (Imports minus Exports) in the N mass
balance (Mg year-1) from 51.7 to 44.7 Mg year-1. Increasing forage quality (lower neutral
detergent fiber and higher crude protein) did not improve the N mass balance due to
increased N fixation by the forage crop instead of greater crop uptake of applied N, but
improving overall yields to the maximum potential reduced the remaining N in the N
mass balance by 29 Mg year-1.
Van Horn et al. (1996) developed a whole-farm nutrient budget on a manure-
irrigated field in Tifton, Georgia using inputs of nutrients from animal manures and
outputs of potential plant removal and losses due to manure management and fertilizer
management of crop production. Exporting nutrients off-farm, if necessary, was
considered as an alternative output of nutrients. Van Horn et al. (1996) determined the
total manure nutrient excretion, estimated volatilization of N in manure before flushing
and during holding and irrigation, soil nutrient content, nutrients in rainfall, nutrients lost
to surface runoff, nutrients lost to groundwater from leaching, nutrients in harvested
crop uptake, recycled feed nutrient content, and purchased feed stuffs should all be
included in the nutrient mass budget. Van Horn et al. (1996) highlighted the importance
of ensuring that livestock farmers’ use nutrient budgets to document nutrient
accountability and their use in optimizing the allocation of manure resources.
Components of Nutrient Mass Budgets
The research cited above describes the importance of nutrient mass budgets in
assessing nutrient flows on a farm. The most important nutrients studied are N and P
and their quantification involves measuring N and P in various pools. For example when
conducting a N mass budget for a single agricultural field, the main N pools are in the
Page 22
22
soil, crops, runoff, leaching, rain water, volatilization, denitrification, and atmospheric
deposition. The pools are then separated into inputs and outputs to build the N mass
budget. The following discussion describes the major N pools on farms and how the
pools are quantified.
Soil Nitrogen
The N content of the soil consists of inorganic N (nitrate-N and ammonium-N) and
organic N. The amounts of inorganic N in the soil and potentially mineralized organic N
are the forms available for crop uptake and therefore should be taken into account when
determining the amount of fertilizer and manures to add for crop N needs. Soil nitrate-N
is important to consider because it is highly susceptible to leaching into groundwater
and to denitrification losses. Application of excessive N for plant needs may result in N
accumulation in the soil or to leaching below the root zone.
Available soil N can be measured by soil testing or indirectly measured by growing
non-legume crops on unfertilized plots and measuring the resulting crop biomass for N
content. This indirect method results in a slight underestimation of the total N content of
the soil (Haefele et al., 2002). Direct soil testing for N content is the most common
method used. In Swanton, Vermont, Jokela (1992) measured N fertilizer and manure
application effects on soil nitrate-N and corn yield by sampling the soil profile from 0 to
150 cm for nitrate-N content twice a year in May and October/November from
November of 1986 to May of 1989. Jokela (1992) found that below 90 cm very little
nitrate-N was present and most nitrate-N was found in the upper 60 cm. He found that
soil nitrate-N concentration was higher in October/November than in May for most
treatments due to losses from leaching, denitrification, or immobilization during the
previous fall and early spring. Application of manures at different treatment levels
Page 23
23
resulted in similar or only slightly higher soil nitrate-N levels indicating the additional N
with the higher rates of N was taken up by the crop.
Van Horn et al. (1996) conducted soil testing on the surface 30 cm of the soil
profile on a manure-irrigated field in Tifton, Georgia. They found that soil inorganic N in
the upper 30 cm of soil was 29, 41, 57, and 54 kg ha-1 for manure application rates per
year of 200, 400, 600, and 800 kg ha-1 total N, respectively. All of the soils had mean
nitrate-N concentrations less than the critical pre-sidedress nitrate-N soil level for corn
of 21 mg kg-1. When the nitrate-N soil level is below the critical pre-sidedress nitrate-N
soil level, a yield response to application of additional N is expected. Van Horn et al.
(1996) found that a yield response to additional manure was expected in all soils due to
soil nitrate-N concentrations less than 10 mg kg-1. Van Horn et al. (1996) also found
applying small amounts of manure over the crop growing season did not result in soil N
accumulation.
Bacon et al. (1990) used a nutrient balance to estimate soil N content. Calculating
N inputs such as manures, fertilizer, and residual N and N outputs in crops harvested
left a positive balance of total N which was accounted for by biological N fixation or soil
N accumulation. Amounts of N found in precipitation, seeds, nonsymbiotic N fixation,
and residual manure decomposition, and nutrient output by leaching or denitrification
were not included in the nutrient balance calculations. They found an accumulation of P
and total N and a net depletion of available N in all fields. Individual field’s nutrient
balances varied widely. They concluded there were advantages to record keeping on
individual fields as opposed to the whole farm.
Page 24
24
Dou et al. (1996) used an equation to estimate the amount of residual N in the soil:
Nt = Nf + (N1 or Nm) where Nt was the total soil residual N, Nf was the residual N credit
from manure that was applied during the previous fall or winter, N1 was the preexisting
legume residues, and Nm was the manure applied in the past excluding Nf. A sample
dairy farm was selected for modeling with manure from 101 lactating cows and 89
heifers and 5500 kg of total N as manure from a contracted poultry section on the farm.
Agricultural production included 24.3 ha of corn silage, 13.7 ha of sorghum-sudangrass
silage, 18.5 ha of alfalfa and grass hay, and 27.3 ha of ryelage planted as a winter
cover crop. Using the Cornell Net Carbohydrate and Protein System, Dou et al. (1996)
predicted total soil N reserves for a Pennsylvania dairy farm to be 424 kg year-1 based
on the residual fecal N expected to be available in the subsequent three years. In New
York, Klausner et al. (1998) used an estimate of residual N from crop residues (alfalfa)
and a pre-sidedress nitrate-N soil test for corn to determine the soil available N content
and predicted an additional 43 kg ha-1 N fertilizer needed for corn crops.
Constantin et al. (2010) collected soil samples three times during the year to
determine soil inorganic N content change due to the catch crop treatments: white
mustard, Italian ryegrass, and radish at Boigneville, Kerlavic, and Thibie, France,
respectively. Samples were collected to 90 cm at Boigneville and Kerlavic. At Thibie,
data from previous soil samples collected in 2003 to 110 cm was used. Organic soil N
was measured from soil samples to a depth of 60 cm and divided into 0-15 cm, 15-30
cm, and 30-60 cm sections. Samples for organic-N determinations were taken less
frequently than for inorganic N, only 5 times over 2 years. Soil mineral N was found to
be dependent on the previous crop grown, the climate, and the dates of sampling. At
Page 25
25
harvest of the main crop, the soil nitrate-N ranged from 29 to 58 kg ha-1. Catch crop
treatments decreased the soil mineral N content in late autumn and mid-winter. Catch
crops had a significant effect on soil organic N with a mean annual N increase of 11.9,
24.2, and 22.2 kg ha-1year-1 at Boigneville, Kerlavic, and Thibie, respectively. The soil
organic N in the 30-60 cm layer did not differ significantly between treatments (including
catch crop treatments and no catch crop). Soil organic N in the lower 30-60 cm layer
contained a small portion of the N in the sampled soil profile.
Soil mineral N content is a source of N available to agricultural crops and therefore
should be measured and included as an input in the nutrient mass budget. Van Horn et
al. (1996) and Klausner et al. (1998) used pre-sidedress nitrate-N soil testing to
measure soil nitrate-N, one component of soil mineral N. Both studies found soil nitrate-
N in the range of 29 to 58 kg ha-1 which indicated that additional N fertilization was
needed for corn crops. Dou et al. (1996) showed manure applications to crops make
estimating the soil mineral N input more difficult due to mineralization of organic N over
the crop season. Soil mineral N content fluctuates over the crop year due to
mineralization, immobilization, N fertilization, N leaching, and crop uptake.
Crop Uptake
The N content of the crop is an important component of the N mass budget as it is
the farmer’s preferred output of N from the field. The N content of the crop is typically
related to crop yields and it is used to form the proteins and amino acids that will affect
the nutritional value of forage crops as animal feed. Some whole farm nutrient mass
budgets do not account for crop uptake of nutrients, because crops are used as animal
feed. In these cases, the nutrients are cycled within the farm, because crops are not
sold off-farm.
Page 26
26
Jokela (1992) sampled grain and total silage yield for corn by harvesting 6 m of
row (3 m each from the center 2 rows) at a nearly mature stage (milk line advanced
one-third to two-thirds down kernel) and analyzing the plants using standard Kjeldahl
methods (Bremner and Mulvaney, 1982). He used a split plot experimental design with
manure effluent as the main plot (0 and 240 kg ha-1 N) and N-fertilizer treatments as the
subplots (0, 56, 112, and 168 kg ha-1 N). Jokela (1992) found that total dry matter yield
ranged from 7.8 Mg ha-1 with the control treatment receiving no manure or fertilizer to
16.6 Mg ha-1 with the treatment combination of 112 kg ha-1 N synthetic fertilizer plus 240
kg ha-1 N from manure.
In Tifton, Georgia, Van Horn et al. (1996) studied spring corn silage N uptake
using a variety of flushed manure N applications through a center pivot. Annual N
application rates ranged from 240 to 986 kg ha-1. Corn silage N uptake ranged from 49
kg ha-1 N harvested from 240 kg ha-1 N application to 265 kg ha-1 N harvested from 798
kg ha-1 N application. ‘Abruzzi’ cereal rye N uptake ranged from 53 kg ha-1 N with 240
kg ha-1 N application to 249 kg ha-1 N with 739 kg ha-1 N application. Mean N
concentrations as a percent of dry matter ranged from 0.90 to 1.20% for silage corn
vegetative forage, 1.57 to 2.0% for corn grain, and 2.25 to 3.01% for rye with annual
dairy manure applications of 229 to 751 kg ha-1 N, respectively. The greatest N
application resulted in the highest N concentration for each plant type.
Eghball and Power (1999) measured N uptake of summer corn crops in Nebraska
in a split-plot experimental design with two tillage systems and three fertilizer treatments
plus a control with no fertilizer application. The three fertilizer treatments were
composted or non-composted beef cattle feedlot manures and commercial fertilizer.
Page 27
27
Composted manure averaged 8.5 g kg-1 total N and non-composted manure averaged
11.7 g kg-1 total N over the four year study period (1992-1995). The control plants
receiving no fertilizer had total N uptake of 50 kg ha-1 N. The commercially fertilized
plants resulted in the maximum total N uptake of 118 kg ha-1 N. The manure and
composted-manure treatment plants resulted in N uptakes of 89 and 87 kg ha-1 N,
respectively. Plants from composted manure applications had similar N uptake to plants
from non-composted manured plots. Plants from fertilized plots had the greatest N
uptake compared to plants from the composted and non-composted manure plots due
to greater N availability to plants.
Bacon et al. (1990) studied nutrient flow on a whole farm basis as well as on an
individual field boundary. For all-fields, the authors found that for corn with inputs of 261
kg ha-1 year-1 total N, the corn crop uptake output was 235 kg ha-1 year-1 total N for
1985. In 1986, the corn input was 157 kg ha-1 year-1 total N and the corn crop uptake
output was 131 kg ha-1 year-1 total N. Differing rates of manure application were
determined by farm management and related more to livestock production and the type
and capacity of manure storage than crop requirements. The differences in rates of
manure application led to differences in rates in N application on a field by field basis.
This resulted in some crops being N deficient and some crops having high positive N
balances and so possible N leaching.
Crop uptake of N was shown to be dependent on N application by Bacon et al.
(1990), Jokela (1992), Van Horn et al. (1996), and Eghball and Power (1999). Corn
crops were evaluated by several methods of dry matter yield, crop N uptake, and N
Page 28
28
concentration of the corn plant. Past researchers found corn silage N crop uptake varied
from 49 to 265 kg ha-1 N depending on N application amount.
Leaching
Water moving down through the soil profile carries soluble nutrients. Nutrients
leached out of the root zone are no longer available to plants and pose possible
environmental risk (Van Horn et al., 1996). N leaching to ground water is an output of
the N mass budget that is undesirable to the dairy farmer. Not only is the N leached no
longer available to the crop and represents an economic loss, but it also is a pollutant to
ground water. FDEP-permitted dairy farms must implement farming practices in order to
maintain a concentration of nitrate-N in groundwater below the MCL of 10 mg L-1 nitrate-
N. Leaching is difficult to measure since it is dependent on the soil hydraulic
conductivity as well as cropping patterns and soil moisture conditions due to rainfall,
temperature, evaporation, and nutrient additions (Hutson et al., 1998). When the water
holding capacity of the soil is exceeded, the soil water percolates and nutrients in the
soil water are subject to leaching, but the water content of the soil is highly variable and
continuously changing and so it is difficult to measure over time. When the soil water
moves, it carries with it any N it contains in organic and inorganic forms deeper into the
soil profile and eventually to the ground water.
A tool for determining leaching under field conditions in situ is the drainage
lysimeter. The drainage lysimeter has a basin buried below the root zone within the soil
profile which collects soil water moving down through the soil profile. The soil water
carrying nutrients (leachate) drains into a reservoir where the leachate can then be
sampled (Gazula et al., 2006). N loads for the lysimeter can be calculated by multiplying
the N concentration by the volume for each sampling of leachate. The load can be
Page 29
29
expressed on the basis of the cropped area using the load calculated from the soil area
above the lysimeter. Duan et al. (2010) installed lysimeters with a 0.2 m diameter and a
depth of 0.46 m, flush with the soil surface. The lysimeters were filled with coarse
gravel, fine gravel, and sand (to ensure the ability to pump leachate) and 0.3 m of
undisturbed soil to mimic the natural setting. The lysimeters were sampled monthly for
leachate using a PVC pipe installed along the inside wall of the lysimeter. Leachate was
analyzed for total N, nitrate-N, and ammonium-N within 24 hours of collection. Their
lysimeters were relatively small, using 19 L buckets as the basin to catch leachate.
Other researchers have used larger cylindrical lysimeters 49 cm in diameter and 70 cm
deep, with the top edge placed at the soil surface (Silva et al., 2005).
For long-term studies of field conditions, lysimeters are buried below the root zone
and deep enough to provide for normal tillage practices. Drainage lysimeters must be
carefully installed so that the soil profile is returned with minimal mixing of the soil
horizons and so that normal crop production can proceed above the lysimeter. Van Es
et al. (2006) installed lysimeters 1.8 m deep with a central drain line and an access hole
to allow for long term sampling of drainage water. Constantin et al. (2010) studied
leaching and soil N contents over 13 to 17 years at Boigneville, Kerlavic, and Thibie in
northern France. Suction lysimeters and drainage lysimeters were installed to measure
N concentration and the amount of nitrate-N in the percolating water (load),
respectively, due to catch crop treatments. Nitrate-N measurements were made
infrequently, only 4, 9, and 4 times per year on average at the three sites. The N
leached per year was calculated based on nitrate-N concentrations from the suction
lysimeters and the drainage amounts from drainage lysimeters. N leaching varied from
Page 30
30
0 to 138 kg ha-1 year-1 depending on climate, site, crop type, drainage intensity, and
management practices. Catch crops reduced N leaching by 9, 32, and 19 kg ha-1 year-1
N, at the three respective experimental locations and their use appeared to be a very
efficient way to decrease leaching losses of N (Constantin et al., 2010).
Leaching is often not directly measured and instead is estimated based on the
difference in inputs and measured outputs. Jokela (1992) measured nitrate-N
concentrations in the soil solution, but not leaching load. Nitrate-N concentrations in the
soil pore water below 0.9 m were less than the national MCL for drinking water of 10 mg
L-1 nitrate-N and therefore significant nitrate-N loading of ground water most likely did
not occur. Hall and Risser (1993) estimated leaching as 38% of the total outputs of their
N mass budget. Wang et al. (2000) conducted a whole-farm mass balance and found
remaining N (the difference in exports and inputs) to be 61.5% of the total budget. N
leached to ground water would be included in this estimate of remaining N. Haas et al.
(2007) included losses through milk, cash crops and animals as outputs for the whole-
farm nutrient mass budget but did not include leaching. Dou et al. (1996) used the
Cornell Net Carbohydrate and Protein System model to create a whole-farm balance for
a sample dairy farm with 101 lactating dairy cows and 89 heifers. Total inputs of 19,880
kg of N, total outputs of 8,440 kg of N, resulted in a difference of 11,440 kg of N which
included various N losses such as leaching, run-off, denitrification, and volatilization.
Although dairy farmers should strive to minimize leaching, Magette et al. (1989)
confirmed the difficulty of managing leaching even when recommended nutrient
management practices are followed. Weather conditions and annual variations in crop
production resulted in frequent discharges which exceeded the national standard of 10
Page 31
31
mg L-1 of nitrate-N to groundwater. Some N loading of ground water is inevitable, but
farm management of irrigation in conjunction with rainfall and manure application can
minimize spikes in nitrate-N concentration reaching the ground water. Direct
measurement of leaching losses helps improve the accuracy of N mass balances.
Volatilization
The use of manures as fertilizer provides N in the two primary forms of
ammonium-N and organic N. The amine groups from the cow’s urine are easily
converted to a gaseous NH3. Most manures, lagoons and feed lot soil surfaces have a
pH greater than 7 which results in a scarcity of hydrogen ions and prevents the
conversion of ammonia to NH4 (Van Horn et al., 1994). Volatilization is highly variable
and is affected by temperature, moisture content, pH, air movement, and possibly other
factors (Van Horn et al., 1996). Organic constituents of manure degrade leading to
further volatilization of ammonia thus enhancing the loss of N as ammonia gas (Van
Horn et al., 1996). N losses from animal manures through volatilization can reach 50 to
75%, most often from NH3 lost to the atmosphere (Van Horn et al., 1994).
Because volatilization is very difficult to measure, many researchers do not
attempt to quantify volatilization directly. Instead volatilization can be treated as one
possible pathway for N losses when a positive balance of nutrients is found (Bacon et
al., 1990). Volatilization estimates are normally made to quantify potential losses. Bacon
et al. (1990) estimated a N availability factor of 20 to 50% for the total N in manure
applied to fields taking into account volatilization losses and N unavailable to plants.
These estimates are from previous research cited by Bacon et al. (1990).
Klausner et al. (1998) did not measure volatilization directly during their research
on a dairy farm in New York, but concluded major losses of N to volatilization due to a N
Page 32
32
deficit in crops even though there was an apparent surplus of total N in manure applied.
There was a long delay between application of manure and its incorporation in the field
and so all ammoniacal N was assumed to be lost to volatilization. Haas et al. (2007) did
not calculate volatilization for their farm nutrient budget, but instead made assumptions
of volatilization outputs on single-farm balances. Mean N surplus of 43 kg ha-1 N
included denitrification and nitrate leaching which were not measured by Haas et al.
(2007). Hall and Risser (1993) estimated volatilization to be 25% of outputs of N from
their 55-acre site in Pennsylvania.
The Cornell Net Carbohydrate and Protein System model (Dou et al., 1996)
considers two major factors for manure transformations: mineralization of organic N and
volatilization of ammonia N. The model assumes that the urine component of manure
becomes inorganic during manure collection and storage. Conditions to model
volatilization during manure storage vary so widely due to temperature, pH, and loading
rate that only the type of manure management facility (in-ground pit, aboveground metal
tank, earthen mounds, etc.) is considered in the model. Several published papers
reported estimated losses via ammonia volatilization in dairy manure as affected by
manure management system. For anaerobic lagoons, Gilbertson et al. (1979) estimated
75% N loss, whereas in aerobic lagoons or oxidation ditches, losses were estimated at
44%. Pennsylvania Department of Environmental Resources (PSAG, 1986) estimated
liquid and solid manure held in uncovered, watertight structures to have losses of 30-
40%; liquid and solid manure in a pond, agitated before spreading was estimated to
have similar losses. Several other management facilities were also used in the model,
but not cited. The Cornell model uses the amount of available N after mineralization, the
Page 33
33
expected volatilization based on the manure management facility, the predicted ratio of
organic and inorganic N of the stored manure, and application method to determine N
availability in the manure when making fertilizer recommendations for manure
application to plants (Dou et al., 1996).
Kuipers et al. (1999) outlined the European Union’s guidelines for reducing
ammonia volatilization 50 to 70%. One recommendation was for the application of
manure slurry by injection into the soil which can reduce volatilization at the farm level
by almost 50% compared with surface application (Kuipers et al., 1999). European
guidelines recommended restricting the application of slurry to during the growing
season when potential for volatilization would be diminished. Slurry storage facilities
built after 1987 are required by Dutch policy to be covered (Kuipers et al., 1999).
Eghball and Power (1999) estimated 50% total N losses mostly from volatilization from
beef cattle feedlot manure by the time the manure is collected. There was no significant
difference in N volatilization losses between surface application and incorporation of
beef feedlot manure by conventional tillage when applied to fields (Eghball and Power,
1999). Beef cattle feedlot manure contained mostly organic forms of N and only small
concentrations of ammonium-N which is subject to volatilization. Van Horn et al. (1994)
estimated that gaseous losses of volatilization and denitrification should be estimated at
greater than 50% of the N in original manure excretions; less than 50% of N should be
assumed available for crop uptake once manure was applied to fields. Overcash et al.
(1983) found that in dairy, swine, or poultry manure, surface-applied manure lost up to
50% of the total N in the ammonium-N form.
Page 34
34
In constructing nutrient mass budgets, Van Horn et al. (1994), Bacon et al. (1990),
Klausner et al. (1998), Haas et al. (2007), Hall and Risser (1993), and Eghball and
Power (1999) estimated volatilization instead of directly measuring the losses. Most
estimates of volatilization losses were about 50 to 75% of N manure application.
Mineralization
Within the N mass budget, transformations of N over time make quantifying some
sources of N difficult. Volatilization and mineralization are the two major transformations
of N in manure. When manure is applied to crops as a fertilizer, these transformations
play a major role in N crop availability. The inorganic ammonium-N fraction of N in
manure is subject to losses through volatilization. The organic fraction of N in manure is
subject to mineralization which is the process by which microbial populations in the soil
break down organic N into inorganic N. Mineralization allows more inorganic N to
become available to crops, but also leaves it subject to losses (Dou et al., 1996).
Mineralization not only occurs with organic N in manure, but also organic N of plant
residues such as stubble and roots left behind from harvested crops.
Mineralization occurs over time and is dependent on many factors such as the
soil’s microbial population, climatic conditions, and management practices. The initial
nutrient composition of manure varies with factors affecting the cow such as feed, water
intake, the animal’s age, etc. (Azeez and Van Averbeke, 2010). Different types of
storage and application practices also affect the nutrient content of the manure before it
is applied to the soil (Azeez and Van Averbeke, 2010). It is therefore very difficult to
make recommendations for manure application to fulfill crop requirements. Measuring
mineralization in field conditions is the best way to make predictions for N availability
from manure applications.
Page 35
35
Mineralization rate can be measured in situ by many methods including the
litterbag (or buried bag) method, the open-ended Polyvinyl Chloride (PVC) tube method,
and the small sheltered soil method. The litterbag method uses nylon mesh bags filled
with manure buried in the soil. Over time, the bags are removed for tests for organic
matter decomposition and N release (Cusick et al., 2006). The PVC tube method uses
pipes driven into the ground to trap a given amount of soil which is then incubated in
situ. Tubes are removed from the soil at intervals over the growing season for N
determinations (Wienhold, 2007). The small sheltered soil method uses a shelter
around an area of soil that experiences the same temperature, moisture and weather
conditions as the bulk field soil. Soil is then sampled from under the shelter and
evaluated for mineralization of N by analyzing the soil for mineral and organic N
constituents (Mikha et al., 2006).
Mikha et al. (2006) found that no-tillage management of fields resulted in
conservation of added organic material which resulted in organic N released by
mineralization in later years. Mikha et al. (2006) used modeling to estimate N
mineralization in addition to in situ sampling to measure actual N mineralized. The
model generally overestimated N mineralization. It also did not include environmental
factors such as soil water content and soil temperature.
Azeez and Van Averbeke (2010) used a lab incubation study to measure
ammonium, nitrate, and total mineral N over time. Soil was mixed with manure in 400
mL plastic containers and kept the soil moisture at field capacity in a dark cupboard at
23°C for 120 days. They found that there was a gradual buildup of ammonium-N after
20 days, but then it declined markedly during the remaining 100 days of the experiment.
Page 36
36
Total mineral N content decreased due to net immobilization after 10 days, then
increased to peak at 358 mg kg-1 total N after 55 days. Net immobilization due to an
increase in reproductive rates of the microbes and therefore high competition for N led
to a decrease in mineral N at 70 to 90 days of incubation. As nutrient release
decreases, microbes die off and decomposition of the microbial mass led to a soil
mineral N net increase peaking at 191 mg kg-1 total N after 120 days. Immobilization of
N by microbial populations makes the N unavailable to crops, but fluxes in microbial
population tend to happen rapidly (Azeez and Averbeke, 2010).
Cusick et al. (2006) found results similar to those of Azeez and Averbeke. In an
incubation trial using dairy manure, during the first 21 days there was a net
mineralization of N, followed by an immobilization from day 21-84, then a mineralization
from day 84 to the end of the trial at 168 days. Overall, a low net mineralization from
manure was found, but this was most likely due to the initial high level of total N present
in the soil (Cusick et al., 2006). In Cusick’s litterbag experiment, by day 21, the majority
of mineralizable N was released from the litterbags. In the first year of the experiment by
day 21, 52.6% of the mineralizable pool had been converted; in the second year, 85.7%
of the mineralizable pool of N had been mineralized by day 21. Over the 148-day
experiment, an average of 67% of the total manure N was mineralized.
The literature indicates there is a lack of studies compiling N mass budgets by
direct measurement of all N inputs and outputs. Estimations are often used to account
for leaching instead of direct measurement. This study aims to directly measure soil N,
inorganic fertilizer, crop uptake, and leaching while performing mineralization
Page 37
37
experiments to estimate mineralized N. Direct measurement of N pools yields a greater
understanding of the N mass budget and potential N losses.
Objectives
The objectives of the study were: 1) quantify a N mass budget in order to evaluate
the N balance of Field J at the University of Florida Dairy Unit so that determinations
can be made of the most likely sources of N losses and 2) make recommendations to
the University of Florida Dairy Unit to amend their management practices that will in turn
reduce N losses especially nitrate losses to leaching. The hypotheses of this study
were: 1) fertilizer N application to the fields is greater than the IFAS recommendation
due to overestimated gaseous losses. Farm management assumes 40% losses (Martin,
2000). This leads to an over-fertilization of the crops and leaching of N to groundwater;
2) leaching losses of N are mostly associated with rainfall after the crop is harvested
and not to irrigation during the growing season; 3) manure application late in the
growing season increases the likelihood of leaching losses in the fallow season; and 4)
mineralization of soil organic matter accounts for less than 20% of the N in the total crop
N inputs.
Page 38
38
CHAPTER 2 MATERIALS AND METHODS
Dairy Unit Site Description
A N mass budget study for a silage corn production system was conducted during
the 2011- 2012 crop year at the University of Florida Dairy Unit (29°47’N, 82°24’W) in
Hague, FL. A 14.16 ha field, Field J (Figure 2-1), with a center pivot irrigation system,
was selected for the study. Planting schedules and irrigation system were typical of
farming practices for cultivated fields at the Dairy Unit and for commercial dairies in
Florida. Field J was planted with two crops of silage corn (Zea mays L.) in the spring
and summer of 2011, and a cereal rye (Secale cereale L.) and ryegrass (Lolium
multiflorum Lam.) mixture during the winter of 2011-2012. The crops received manure
effluent and fresh water through the center pivot irrigation system. The soil in Field J is
predominately Chipley fine sand (thermic, coated, Aquic Quartzipsamments) with less
than 5% of the field Tavares fine sand (hyperthermic, uncoated, Typic
Quartzipsamments) in the northwest corner (NRCS, 2010) (Table 2-1). The soil is
somewhat poorly drained with a slope of 0-5% (NRCS, 2010) and 1.9% organic matter.
The mean soil pH (1:2 soil:deionized H2O ratio) was measured to be 7.5.
All farming practices including crop varieties, plant spacing, pest control, and
application of inorganic fertilizers and manure effluent were determined by farm
management according the IFAS guidelines for silage corn production (Mylavarapu et
al., 2009; Wright et al., 2011a). Corn variety ‘Agratech 999 RR’ (Agratech Seeds,
Dunwoody, GA, USA) was planted on 15 Mar. 2011 for the spring season and ‘Pioneer
2023 HR’ (DuPont Pioneer, Des Moines, IA, USA) was planted on 2 July 2011 for the
summer season. Silage corn was planted in rows 76 cm apart. For the winter, a mixture
Page 39
39
of ‘Florida 401 Rye’ (Brown and Brown Farms, Oxford, FL, USA) and ‘EarlyPloid’ annual
ryegrass (Ragan and Massey, Inc., Ponchatoula, LA, USA) was planted on 28 Oct.
2011. The planting was by grain drill with a seeding rate of 90 kg ha-1 for rye and 17 kg
ha-1 for annual ryegrass.
The Dairy Unit at the University of Florida is classified as a medium Concentrated
Animal Feeding Operation (CAFO) because animals, feed, manure and urine, dead
animals, and production operations are on a small land area, the feed is brought to the
cows at the Dairy Unit rather than animals grazing in pastures, and the dairy maintains
an annual average of 200 to 699 mature dairy cows. Because the Dairy Unit is classified
as a CAFO, it is required by the EPA to submit a Nutrient Management Plan (NMP).
The NMP includes best management practices (BMPs), conservation practices, and
management activities to ensure agricultural production goals are met as well as
defining soil and water conservation goals to reduce threats to water quality and public
safety. The NMP must address manure storage, animal mortality management, clean
water diversions, prevention of direct animal contact with water, chemical handling,
conservation practices to control runoff, manure and soil testing protocols, land
application protocols, and record keeping requirements.
The NMP for the Dairy Unit selected N as the controlling nutrient based on the
Chipley soil series meeting the “coated” soils criterion (Martin, 2000). Therefore, P
would be less of a concern than N. The manure produced by the approximately 575 cow
milking herd (approximately 186 kg day-1 N) travels through a manure solids separator
and then a three-stage waste storage pond system. The NMP assumed that
approximately 72 million liters of manure effluent from the final-stage waste storage
Page 40
40
pond is applied to Field J through the wastewater application system each year and that
40% of the N in the applied wastewater will be lost due to volatilization, denitrification,
and leaching. Crop land requirements for the application of manure effluent (207 million
liters applied annually) are approximately 75 hectares of the 136 hectares available at
the Dairy Unit for application. The NMP also stipulates that neither manure effluent nor
fresh water will be applied to fields unless a crop is actively growing (Martin, 2000).
Nitrogen Mass Budget
The following equation was used to compute the N mass budget for the study:
(SoilInitial + Mineralized N + Inorganic N Fertilizer + Atmospheric Deposition) –
(SoilFinal + Harvested Crop Uptake + Root and Stubble Uptake + Leaching) =
Unaccounted-for N
SoilInitial and SoilFinal were the soil mineral N content (nitrate-N plus ammonium-N) of the
soil at the beginning and end of the growing season for each crop. The inputs, outputs,
and balance of the N mass budget are shown in Table 2-2. The inputs of the N mass
budget were SoilInitial, mineralized N, inorganic N fertilizer, and atmospheric deposition.
The outputs of the N mass budget were SoilFinal, harvested crop uptake, root and
stubble uptake, and leaching. The balance of the N mass budget was unaccounted-for
N. Runoff was assumed to be zero, because the slope of the field was less than 5%
(NRCS, 2010) and no signs of runoff were observed in the field during any season.
Amounts of manure effluent from the lagoon and inorganic fertilizer applications for
each season were determined from farm records. The National Atmospheric Deposition
Program’s reports for nitrate and ammonium ion wet deposition for 2010 were used to
estimate atmospheric deposition of mineral N for Field J (NADP, 2010). The NADP’s
data from the Bradford Forest (FL03) collection site (29°97’N, 82°20’W) were selected
Page 41
41
due to its proximity to the Dairy Unit. Atmospheric N deposition was calculated using the
site’s annual ion wet deposition, percent of N in the ion, and the number of days in the
season.
For the spring season, mineralized N was estimated from the crop available
ammonium-N content of manure effluent samples taken during the spring season. For
the summer and winter seasons, mineralized N was estimated from N mineralization
experiments conducted during the summer 2011 and winter 2011-2012 crop seasons.
The N mass balance was calculated at the end of each season by subtracting the
outputs from the inputs. The unaccounted-for N in the N mass balance (inputs minus
outputs) was assumed to consist of gaseous losses from denitrification and
volatilization.
Sampling Locations in the Field
Six locations, lettered A through F, were selected in Field J as shown in Figure 2-1
for installation of lysimeters to measure leaching. The six lysimeter locations were
chosen to representatively sample leaching in the field and to select sites which varied
in the spatial distance from the center of the pivot. It was assumed that there would be
variation in the spray field distribution of the pivot and so lysimeter locations were
distributed along the three pivot wheel tracks. The lysimeter locations were also
selected with the criteria that they be spread evenly throughout the field with three sites
in the north half of the field, three sites in the south half, equally distributed from east to
west. Once the general locations of the lysimeters were determined, the exact locations
of the lysimeters were chosen randomly during installation and adjusted to avoid buried
irrigation piping and electrical lines.
Page 42
42
For soil and crop sampling, six additional locations were randomly selected for
sampling on each sampling date in addition to sampling at the six lysimeter locations. A
diagram of the site selection is shown in Figure 2-2. The six additional locations were
selected by dividing the field into 6 equal parcels as shown in “A.” Within each parcel,
an area was selected by dividing the parcel in half, flipping a coin to select either the
half closer to the center of the field or the half farther away as shown in “B.” Once one
half of the parcel was selected, the area was then divided into two equal portions and a
coin was flipped to randomly decide the outcome as shown in “C.” Within the highlighted
area shown in “C”, a site was randomly chosen for sampling. On each sampling date for
soil and crop sampling, this procedure was repeated for each sixth of the field to select
six additional locations to sample plus the lysimeter locations. GPS coordinates were
taken for all locations.
Directly Measured Components of Nitrogen Mass Budget
Soil sampling and analysis
Soil cores were taken on 14 Apr. 2011, 1 July 2011, 29 Sept. 2011, and 16 Mar.
2012 to determine the SoilInitial and SoilFinal values for the N mass budget. Soil was
sampled using a bucket auger to a depth of 60 cm in two increments, 0 to 30 cm and 30
to 60 cm. Soil sampling depth extended below the silage corn root depth of 40 cm (rye-
ryegrass root depth was 25 cm) in order to include all soil N available for crop uptake in
the root zone. The crop root depths were determined by excavating soil to a depth
below which no roots were observed in the soil excavation face, washing the soil from
the face, and observing where rooting extended.
On 14 Apr. 2011, one soil core was collected at each of the lysimeter locations A
through F and six “additional locations” labeled G through L chosen randomly by the
Page 43
43
method referenced above, for a total of 24 soil samples once divided into 0 to 30 cm
and 30 to 60 cm depths. On the remaining sampling dates, three soil cores were
collected at each of six lysimeter locations and six “additional locations” for a total of 36
soil cores and 72 soil samples. Because it was difficult to precisely excavate 30 cm
increments with the bucket auger, the soil sample depths were measured with a tape
measure after each sample was taken and the actual soil sample depth was recorded
for use in calculating soil bulk density and mass of soil for the sampling depth on a
hectare basis.
The entire mass of soil was collected, the wet weight was measured, and soil was
refrigerated at 4° C during storage. Soil samples were typically stored for less than one
week. A known volume of each soil sample was taken for bulk density measurements
and a second subsample taken for analytical N measurements. The bulk density
samples were weighed and oven-dried at 105°C for at least 24 hours or until a constant
weight was reached. The oven-dried soil was weighed and bulk density was calculated
by dividing the total oven-dried soil sample weight by the calculated volume of the hole
dug by the bucket auger using the noted actual depth. The subsamples taken for N
analytical measurements were air-dried at 38°C and sieved through a 2 mm screen.
The air-dried soil samples were analyzed for nitrate-N, ammonium-N, and total
Kjeldahl N (TKN) using automated colorimetric analysis at the Analytical Research
Laboratory at the University of Florida. Nitrate-N and ammonium-N concentrations were
determined following KCl extraction. Fifty mL of 1 M KCl was added to 5 g of soil in a
125 mL polypropylene bottle, shaken for 30 minutes on a reciprocating shaker set at
180 reciprocations per minute. The solution was then filtered through a 15 cm Whatman
Page 44
44
No. 42 filter paper into a 150 mL plastic cup. The solution was then poured into a 20 mL
plastic scintillation vial; the remainder was discarded (Hanlon et al., 1996). The vials
were refrigerated at 4°C until analyzed by automated colorimetric analysis (EPA Method
353.2. and EPA Method 350.1 (modified)) using the Alpkem Flow Solution IV (OI
Analytical, College Station, TX, USA).
Soil analysis of TKN was determined by digesting 1 g of soil, 2 g of Kjeldahl
mixture (Pope Kjeldahl Mixture, Inc., Dallas, TX, USA) and 5 mL of 18 M sulfuric acid in
a 50 mL digestion tube on a preheated 250°C aluminum block digester for 1 hour. After
adding glass funnels on all digestion tubes, the temperature of the block digester was
increased to 325°C for an additional 2.5 to 3 hours. The sides of each digestion tube
were washed with 5 to 10 mL of deionized water, tubes were mixed on a vortex shaker,
and then transferred to a 100 mL volumetric flask. After flasks were cool, the solution
was diluted to volume, covered with parafilm, and mixed thoroughly. The solution was
then filtered using a 15 cm Whatman No. 41 filter paper into a 20 mL scintillation vial;
the remainder of the solution was discarded (Hanlon et al., 1996). The solution was
analyzed for N by automated colorimetric analysis (EPA Method 351.2) using the
Alpkem Flow Solution IV (OI Analytical, College Station, TX, USA).
Topsoil samples were collected on 14 June 2012 at each of the lysimeter
locations. A soil probe was used to collect soil to a depth of 15 cm. At each lysimeter
location, the soil probe was used to randomly collect 5 soil samples within 10 m of the
lysimeter location. These soil samples were mixed thoroughly in a plastic bucket then
sub-sampled (Shober and Mylavarapu, 2009). The soil sub-sample for each lysimeter
location was analyzed for pH, organic matter, electrical conductivity, lime requirement,
Page 45
45
and Mehlich-1 macro and micro-nutrients including phosphorus, potassium,
magnesium, calcium, manganese, zinc, and copper. The soil sub-samples were
analyzed at the Analytical Research Laboratory (ARL) at the University of Florida
according to the methods described in the UF/IFAS Extension Soil Testing Laboratory
(ESTL) Analytical Procedures and Training Manual (Mylavarapu, 2002).
Crop sampling and analysis
Corn plant samples were taken on 21 June 2011 and 20 Sept. 2011 to determine
crop N removal and root and stubble N uptake of crops in the spring and summer
seasons. Rye/ryegrass samples were taken on 17 and 20 Feb. 2012 to determine crop
N removal and root and stubble N uptake of the winter season. The short battery life of
battery powered clippers used for the rye/ryegrass sampling prevented finishing
sampling on a single day. Farm management indicated to the researcher the planned
commercial harvest date and plant samples were taken as close to the planned
commercial harvest date as possible. Rainfall and scheduling conflicts with hired
harvesters delayed commercial harvesting during the winter season.
Excavating the total silage corn root mass was difficult due to labor and time
constraints. A preliminary experiment was therefore conducted to determine a sampling
method for estimating the total corn root mass. The “shovel sampling method” used a
rounded 25 cm shovel to dig up the main root mass in a circular area with a radius of 25
cm from the corn stubble. The plant root mass sampled by the “shovel sampling
method” was compared to the total plant root mass to estimate the percentage of the
root mass captured by the “shovel sampling method.”
The following procedure was used to determine the total root mass. The corn
rooting depth was determined to be 40 cm by excavating soil to a depth below which no
Page 46
46
roots were observed in the soil excavation face (determined by washing the soil from
the face and observing where rooting extended). A 76 cm x 76 cm x 40 cm sampling
area was decided based on the corn root depth and the 76 cm corn row spacing. The
76 cm width of the sampling area allowed for all the soil between the middle of adjacent
row alleys to be collected.
Within the 76 cm x 76 cm x 40 cm sampling area, first the “shovel sampling
method” was used to sample the plant root mass. All roots captured by the “shovel
sampling method” were set aside. All remaining soil and roots were then dug up and
washed through a screen to collect the roots. The “shovel sampling method” and soil
and root excavation within the 76 cm x 76 cm x 40 cm sampling area were repeated
four times in Field J. All roots were dried at 40°C and weighed.
Root was determined to be that part of the plant below the soil surface but also
included the brace roots below the soil surface. The sum of the root masses sampled by
the “shovel sampling method” and the remaining root mass dug up from the sample
area were considered the total root mass found in the 76 cm x 76 cm x 40 cm area. The
total root mass dry weight was compared to the “shovel sampling method” root mass
dry weight. The root mass captured by the “shovel sampling method” was calculated to
be 66% of the total root mass (standard deviation 18%) which was then used to
calculate the whole field root mass from samples collected using the “shovel sampling
method.”
Corn plant samples were harvested from a randomly selected 200 cm length of
corn row at the six lysimeter locations, A through F, and six “additional locations”
chosen randomly on the day of sampling. Plants were harvested by cutting stalks 25 cm
Page 47
47
above the soil surface to mimic mechanical harvesting for silage. The remaining corn
stalk from 25 cm above ground to the soil surface comprised the stubble. A rounded 25
cm shovel was used to dig up the main root mass using the “shovel sampling method”
described above. The harvested root mass was washed to remove soil from the roots
and then the stubble, the part above the soil line, was cut from the main root mass.
Corn samples were separated into leaves, ears, stalks, stubble, and roots. The total
number of corn plants and sample fresh weight for the leaves, ears, and stalks was
measured. The fresh weight of the harvested portion (leaves, ears, and stalks) was
measured for comparison to farm records of silage corn yield.
The rye-ryegrass winter crop was sampled at the six preselected locations, A
through F, and six random locations labeled S through X. The rye-ryegrass mixture was
sampled using a 0.25 m2 quadrat ring that was randomly placed in the selected location
to include two seeding rows of the rye/ryegrass mixture. Four samples using a 0.25 m2
quadrat ring were taken at each location for a total of 48 samples. The rye/ryegrass
mixture was clipped 10 cm above the soil surface to mimic the height of the mechanical
harvester. Rye-ryegrass harvested sample fresh weights were recorded.
Stubble samples, the remaining plant material above the soil surface, were
collected at each of the forty-eight 0.25 m2 quadrat ring locations. The rye/ryegrass root
depth was determined to be 25 cm by excavating soil to a depth at which no more roots
were observed, washing the soil from the soil face, and determining the deepest root
extension. The rye/ryegrass mixture roots were sampled by digging up one quarter of
the 0.25 m2 quadrat ring location using a 25 cm rounded shovel. The quarter of the 0.25
m2 quadrat ring was randomly selected. All of the soil and roots in the quarter of the
Page 48
48
0.25 m2 quadrat ring location were removed and washed through a screen to collect the
roots. These measurements were multiplied by 4 to estimate the total root mass in the
full 0.25 m2 quadrat ring sample area.
All plant samples were dried at 40°C until a constant dry weight was measured. A
dry weight was recorded for all samples and the samples were ground to 2 mm using a
Wiley mill to create a homogenous sample. The samples were analyzed for total N by
combustion using an Elementar Vario Max CN Analyzer (Elementar Americas Inc., Mt.
Laurel, NJ). A sample of 250 to 255 mg ground plant tissue was measured into a
crucible. Crucibles were loaded into the Elementar Vario Max CN Analyzer for
determination of total N by combustion. All samples were run in duplicate. A National
Bureau of Standards tomato leaf was run approximately every 25 to 30 samples to
ensure the instrument was calibrated correctly. All sample measurements maintained a
replication precision of 5%. Any samples not meeting this criterion were rerun.
Leachate sampling and analysis
Drainage lysimeters were used to capture leachate and estimate leaching for the
N mass budget. Twelve drainage lysimeters were installed in Field J at the six lysimeter
locations; two lysimeters were paired at each location shown in Figure 2-1. Lysimeters
were paired at each location in order to provide a check for lysimeter leaching results at
each location. Comparison of the paired leaching results was used to determine when a
random spike in N load, as measured by a single lysimeter, did not actually reflect a
high N leaching load for that particular location.
Drainage lysimeters were constructed with a basin to collect the leachate and a
reservoir. The basin was constructed from plastic 208 L capacity drums cut in half
lengthwise. The basin was 89 cm long, 30 cm high, and had a diameter of 60 cm. A
Page 49
49
drain at one end of the basin allowed leachate to drain into a 19 L reservoir. Pebbles
covered the bottom of the basin to allow water to freely drain into the reservoir. A plastic
screen was placed over the pebbles prevented mixing of soil and pebbles. The basin
was installed at a decline towards the drain. Water collected in the reservoir was
sampled through Tygon tubing within a capped PVC pipe which connected the reservoir
to the soil surface. A diagram of the lysimeter design is in Figure 2-3.
When the drainage lysimeters were installed, the soil profile above the intended
location of the lysimeter was removed separately by horizon. The lysimeters were
buried with the upper edge of the drainage basin at a depth of 76 cm to prevent
disturbance by farm tillage equipment during the study and also make sure the lysimeter
basin was below the root zone. Placing the lysimeter basins below the root zone
maintained natural leaching conditions by preventing plant roots from taking up leachate
collected in the basin and only measuring leachate that had drained past the root zone.
All of the removed soil was replaced by horizon into the basin to recreate the original
soil profile and the soil was repacked to approximately the original bulk density. The
drainage lysimeters captured leachate from an 89 cm by 60 cm area of soil profile.
Drainage lysimeters were installed in Field J at the 6 lysimeter locations (Figure 2-
1) on 4 and 10 March 2011. Because drainage lysimeters were installed less than 2
weeks prior to the silage corn spring planting, lysimeters were allowed to settle prior to
the start of sampling. Lysimeters were pumped out 22 April 2011 to start the first
sampling period for the spring. Water samples from the drainage lysimeter reservoir
were taken approximately every two weeks. Leachate was collected from the reservoir
by using a ShopCraft Multi-Use Pump (Part No. W1145) (Advanced Auto Parts, Inc.,
Page 50
50
Roanoke, VA, USA) connected to the Tygon tubing to manually pump leachate out of
the reservoir. Leachate was allowed to flow into a 19 L bucket for a few seconds before
40 mL was captured in two 20 mL scintillation vials. One drop of 9 M sulfuric acid was
added to each scintillation vial and vials were kept on wet ice to maintain a temperature
less than 4°C. An additional 20 mL scintillation vial of leachate was provided for 10% of
the samples submitted for each analysis in order to fulfill lab quality control
requirements. The rest of the leachate was captured in the bucket so that total leachate
could be measured. The drainage lysimeter reservoirs were pumped dry at each
sampling date. The time, lysimeter location, and volume of total leachate were recorded
for each lysimeter. When lysimeter reservoirs were empty for any sampling date, it was
recorded that no leaching occurred. Leachate was sampled according to the
Environmental Protection Agency certification guidelines (Autry, 2003).
Water samples were analyzed for nitrate-N directly from the sample vial by
automated colorimetric analysis (EPA Method 353.2) using an Alpkem Flow Solution IV
(OI Analytical, College Station, TX, USA). For TKN analysis of water samples, 25 mL of
water sample and 5 mL of digestion solution (Sulfuric acid-mercuric sulfate-potassium
sulfate solution) were mixed in a digestion tube with a vortex mixer. After adding four to
eight Teflon boiling chips to the digestion tube, tubes were placed in a block digester
preheated to 160°C for one hour. The temperature of the block was raised to 380°C and
tubes continued to heat for an additional 1.5 hours before tubes were removed and
diluted with 25 mL of reagent water. Prepared solutions were analyzed for TKN by
automated colorimetric analysis (EPA Method 351.2) using the Astoria Z Analyzer
(Astoria-Pacific, Inc., Clackamas, OR, USA).
Page 51
51
Water samples were analyzed at the University of Florida Analytical Research
Laboratory (E72850) as National Environmental Laboratory Accreditation Conference
(NELAC) certified water samples (EPA/600/R-04/003). Total N was the sum of nitrate-N
plus TKN. Nitrate-N and TKN concentrations were multiplied by the volume of the total
leachate collected to obtain the leached N load. Sampling date N loads were summed
to quantify leaching for each crop season.
Mineralization Experiment
Nitrogen mineralization experiments were carried out during the summer and
winter growing seasons on Field J at the University of Florida Dairy Unit. The
experiments were conducted to calculate the mineralized N input for the summer and
winter seasons as well as improve farm management’s estimation of how quickly
organic N is broken down into a plant available inorganic form. Because the primary
source of N applied to crops at the Dairy Unit is manure effluent, correctly estimating
mineralization of organic N in manure effluent is important to providing an optimal
amount of plant available inorganic N to the crops. Having a better estimation of
mineralization in field conditions allows for farm management to improve decisions on
the timing of manure effluent application.
The PVC tube method (Wienhold, 2007) was used to measure N mineralization
over three, one-month time periods during the summer and winter season. Because
manure effluent was applied to Field J throughout the year, isolating soil over different
time periods allowed the PVC tubes to capture varying amounts of previously applied
manure effluent and soil N content. One-month time periods also allowed for consistent
intervals depicting the changes in speciation of N in the soil due to mineralization.
Page 52
52
PVC tubes approximately 30 cm long and 5 cm in diameter were used to isolate
an area of soil. Holes (1 cm in diameter) in the sides of the PVC tubes helped maintain
normal soil moisture conditions and prevented anaerobic conditions inside the tubes.
Once the PVC tubes were installed in the ground, they were capped to prevent rainfall
and manure effluent from entering the isolated soil. The PVC tubes were installed at the
six preselected locations according to the schedule in Table 2-3. In the summer season,
Time 0 was 24 July 2011, Time 1 was 24 Aug. 2011, Time 2 was 24 Sept. 2011, and
Time 3 was 24 Oct. 2011. In the winter season, Time 0 was 8 Nov. 2011, Time 1 was 8
Dec. 2011, Time 2 was 8 Jan. 2012, and Time 3 was 9 Feb. 2012. The PVC tube caps
were spray painted different colors to indicate which time period they were installed.
In the winter season, the experimental protocol was improved and soil samples
were taken at Time 0, Time 1, and Time 2 to account for the initial soil N content and N
speciation to use in conjunction with the measurements on the soil isolated by the PVC
tubes over time. In the month preceding the installation of the first set of PVC pipes, 20
kg ha-1 TKN of manure effluent was applied to the rye-ryegrass mixture in Field J. The
winter mineralization experiment captured 104 kg ha-1 TKN of manure effluent over the
winter crop season (Table 3-12). On each soil sampling date, three soil samples from
the top 25 cm of the soil profile were taken at each of the preselected locations (Figure
2-1) by using the PVC tube as a soil probe. All soil samples were air-dried at 38°C and
sieved through a 2 mm screen. The samples were analyzed for nitrate-N, ammonium-N,
and TKN using the soil analysis methods outlined above by the Analytical Research
Laboratory at the University of Florida.
Page 53
53
Data Analysis
All data comparisons for each component of the N mass budget were analyzed
separately using PROC NPAR1WAY, a non-parametric Wilcoxon test, due to non-
normal distributions of data (SAS Institute, 2002). For the soil samples, the population
and experimental unit were the soil N content of Field J. The treatment was time. The
mean and standard deviation of soil bulk density, mineral N, nitrate-N, ammonium-N,
and TKN content were calculated for the 0 to 60, 0 to 30, and 30 to 60 cm soil profile on
a kg ha-1 basis for the four sampling dates. Each season's initial soil N content was
compared the final soil N content for soil mineral N, nitrate-N, ammonium-N, and TKN
for the 0 to 60, 0 to 30, and 30 to 60 cm soil profiles. The null hypothesis was the mean
of the initial soil N content was equal to the mean of the final soil N content. Sources of
error would have been variation caused by uneven application of manure effluent or
fertilizer, accidentally sampling in the corn rows versus the alley, organic matter (corn
stalks) that was not evenly distributed causing differences in mineralization and
immobilization rates, soil texture, and soil structural differences in the field impacting N
transformations, manure infiltration, and losses. Soil bulk density was also compared by
sampling date, location, and depth (0 to 30 and 30 to 60 cm). The mean and standard
deviation of soil bulk density was calculated for each soil sampling date.
For the silage corn samples, the population and experimental unit were the N
content of the silage corn in Field J. The treatment was time. The N content of the silage
corn plant parts (leaves, stalks, ears, stubble, and roots), the harvested crop uptake,
and root and stubble uptake were compared between the spring and summer season.
The null hypothesis was the mean of the N content of the spring silage corn (each plant
part separately, the harvested crop uptake, and the root and stubble uptake) was equal
Page 54
54
to the mean of the N content of the summer silage corn (each plant part separately, the
harvested crop uptake, and the root and stubble uptake). Sources of error were from
variation caused by uneven availability of nutrients including mineral N for plant uptake,
differences in water availability for the crop, impacts from pests and disease, soil
texture, and soil structural differences in the field. For each sampling location, the N
content of the harvested portion (leaves, stalks, and ears) was summed and converted
to a kg ha-1 basis, then the mean and standard deviation were calculated.
For the rye-ryegrass samples, the population and experimental unit were the N
content of the winter rye-ryegrass in Field J. The stubble and roots were summed for
each sampling location to calculate the root and stubble uptake. The harvested crop
uptake and root and stubble uptake were converted to a kg ha-1 basis. The mean and
standard deviation for the harvested crop uptake and root and stubble uptake N content
were calculated from the 12 replicates at 12 locations. Sources of error were the same
as those of the silage corn samples.
For leaching measurements, the N load was calculated for each leachate
measurement and converted to a kg ha-1 basis. The N load for each lysimeter was
summed for each season. The mean and standard deviation of the 12 lysimeter N loads
were then calculated for each season. Comparisons between seasons were not made,
because of seasonal differences in rainfall, manure effluent application, freshwater
irrigation, crop grown, and length of the season. It was not reasonable to assume that
the mean N loads for each season were equal.
Page 55
55
Table 2-1. Soil particle distribution by soil series (NRCS, 2010)
Chipley fine sand Tavares fine sand
Soil Profile Sand (%) Silt (%) Clay (%) Sand (%) Silt (%) Clay (%)
0-30 cm 92 5 3 96 2 2
30-60 cm 92 4 4 94 5 1
Table 2-2. Inputs and outputs of N mass budget
N Mass Budget Components Source
Inputs
Soil Initial Directly Measured
Mineralized N Estimated from Mineralization Experiments
Inorganic N Fertilizer Farm Records
Atmospheric Deposition Estimated from NADP
Rainfall Assumed Negligible
Outputs
Soil Final Directly Measured
Harvested Crop Uptake Directly Measured
Root and Stubble Uptake Directly Measured
Leaching Directly Measured
Runoff Assumed Negligible
Balance
Unaccounted-for N Calculated from N Mass Balance
Table 2-3. Installation and removal schedule for PVC N mineralization tubes for the
summer silage corn crop and for the winter cover crop
Time 0w Time 1x Time 2y Time 3z
15 tubes installed 10 tubes installed 5 tubes installed
5 tubes removed from T0 batch
5 tubes removed from T0 batch
5 tubes removed from T0 batch
5 tubes removed from T1 batch
5 tubes removed from T1 batch
5 tubes removed from T2 batch
wTime 0 was 24 July 2011 (summer) and 8 Nov. 2011 (winter)
xTime 1 was 24 Aug. 2011 (summer) and 8 Dec. 2011 (winter)
yTime 2 was 24 Sept. 2011 (summer) and 8 Jan. 2012 (winter)
zTime 3 was 24 Oct. 2011 (summer) and 9 Feb. 2012 (winter)
Page 56
56
Figure 2-1. Preselected sampling locations in field J
Figure 2-2. Selection method of six additional sampling locations. For each sixth of the
field, one additional sampling location was selected by the following method. Example: A) Field J was separated into sixths. The highlighted portion indicates the area where the first additional sampling location would be randomly selected. B) The first sixth was equally divided between the inner and outer portion. The outer portion was randomly selected by a coin toss. C) The outer potion was then equally divided into right and left sides. The right side of the outer portion was randomly selected by a second coin toss. The additional sampling location would then be randomly selected from this area by the researcher.
Page 57
57
Figure 2-3. Drainage lysimeter design
Page 58
58
CHAPTER 3 RESULTS AND DISCUSSION
Site Characterization
The soil in the research field was mapped as two soil types (Table 2-1). Topsoil
samples taken on 14 June 2012 from the upper 15 cm of the soil profile at the lysimeter
locations (Figure 2-1) had an mean soil pH of 7.5, organic matter content of 1.90%, and
electrical conductivity (EC) of 0.11 dS m-1 (Table 3-1). Mehlich-1 macro and micro
nutrient analyses indicated high or very high concentrations of phosphorus (very high,
692 mg kg-1), potassium (high, 110 mg kg-1), and magnesium (very high, 314 mg kg-1)
(Mylavarapu et al., 2009). For calcium (1920 mg kg-1), manganese (19 mg kg-1), and
zinc (10 mg kg-1), no additional fertilizer was recommended (Mehlich, 1953; Mylavarapu
et al., 2009) (Table 3-1). According to the IFAS recommendations for irrigated corn,
there may be a crop response to copper (Cu) application, but plant tissue testing was
recommended before application of Cu (Wright et al., 2011b). No Cu fertilizer was
added in addition to that already in the manure effluent. Nitrogen application was
recommended based on the crop growth requirement. No lime was required due to the
soil pH testing above the target pH of 6.5 (Mylavarapu et al., 2009).
Soil bulk density was measured for the soil samples taken on 14 April 2011, 1 July
2011, 29 Sept. 2011, and 16 Mar. 2012 for use in the calculation of the N content in the
upper 60 cm of the soil profile (Table 3-2). Soil bulk density was significantly lower (P <
0.0001) in the upper 0 to 30 cm (1.5 g cm-3) of the soil cores than in the lower 30 to 60
cm (1.6 g cm-3) (Table 3-3). Soil bulk density was reported to increase with depth by
Hillel (1980). Soil bulk density did not change over the cropping year (Table 3-2). The
no-till farming practices used at the Dairy Unit resulted in bulk densities within the
Page 59
59
typical range of 1.3 to 1.8 g cm-3 for cultivated soils (Mattos et al., 2003; Brady and Weil,
2008; Zotarelli et al., 2009; Constantin et al., 2010; Frazao et al., 2010).
Spring Season
N Inputs
Silage corn was planted on 15 March 2011 at which point manure effluent and
inorganic N fertilizer were applied to supply N to the crop. The starting point for
calculating the spring season N mass budget was marked by the initial soil mineral N
measurement on 14 April 2011. Atmospheric deposition of N also contributed to the N
pools in Field J.
Initial soil N content
The initial soil N content for the spring season was measured on 14 April 2011
within the 0 to 60 cm soil profile. The initial soil mineral N content was 286 kg ha-1 N
(Table 3-4) comprised of 161 kg ha-1 N in the 0 to 30 cm soil profile and 125 kg ha-1 N in
the 30 to 60 cm soil profile (Table 3-5). In the 0 to 60 cm soil profile, the soil mineral N
content was made up of 113 kg ha-1 nitrate-N (Table 3-6) and 173 kg ha-1 ammonium-N
(Table 3-7). Soil TKN (organic N plus ammonium-N) was 3310 kg ha-1 N (Table 3-8) at
the start of the spring season, but the organic N portion (3140 kg ha-1 organic N) organic
N was not readily available to provide N to the silage corn until further N mineralization.
The soil TKN contained organic N from previous manure applications, plant residues,
and N immobilized by microbes. The initial concentration of TKN in this soil was 373 mg
kg-1 TKN. Similar concentrations of soil TKN (347 mg kg-1 TKN) were found on entisols
in southern Spain by Cabrera et al. (2005b). That study, conducted on a sandy soil
similar to the Dairy Unit, concluded that coarser textured soils have lower fertility when
Page 60
60
compared to the soil TKN concentration of sandy-clay-loam entisols with 536 mg kg-1
TKN.
Soil nitrate-N in the root zone (0 to 30 cm) was significantly greater (P < 0.0001)
than the soil nitrate-N in the lower 30 to 60 cm of the soil profile, for all sampling dates
(Table 3-9). Jokela (1992) found soil nitrate-N decreased with soil depth and that soil
nitrate-N was proportional to the amount of N input from fertilizer and manure. This
researcher also found the vertical distribution of soil nitrate-N suggested some
movement of soil nitrate-N into the bottom increment of the soil profile. It is difficult to
determine if the soil nitrate-N distribution in the soil profile indicated prior leaching,
because the pre-fertilization soil nitrate-N content was not known. An increase of soil
nitrate-N in the lower soil profile over the season would indicate that nitrate-N moved
downward in the soil profile which ultimately could result in leaching.
Soil ammonium-N content did not differ significantly with depth for any sampling
dates (Table 3-10). Soil TKN content in the upper 0 to 30 cm was significantly greater (P
< 0.0001) than the soil TKN content of the lower 30 to 60 cm for all sampling dates
(Table 3-11). Soil nitrate-N and soil TKN content decreased with depth whereas
ammonium-N was not significantly different in the lower soil profile. Nitrification could
have prevented an accumulation of soil ammonium-N in the upper 0 to 30 cm soil
profile.
Altom et al. (2002) studied soil N distributions on a Minco fine sandy loam in
Oklahoma and found surface accumulation of ammonium-N in the 0 to 15 cm soil profile
with 336 and 448 kg ha-1 N rate of ammonium nitrate fertilizer treatments. At lower
depths, these researchers found no differences in ammonium-N due to fertilizer
Page 61
61
treatments and concluded that movement of ammonium-N into the profile was limited
and was not a leaching threat. That these researchers used inorganic N fertilizers as
treatments instead of manure effluent applications, may explain why their results
(ammonium-N buildup in the surface of the soil profile and the lack of ammonium in the
lower profile) differed from the results at the Dairy Unit.
In Boigneville and Kerlavic, France, Constantin et al. (2010) observed a lower
range, 19 to 68 kg ha-1 nitrate-N, in the 0 to 90 cm soil profile than the nitrate-N
observed at the Dairy Unit in the 0 to 60 cm soil profile, 113 kg ha-1 nitrate-N (Table 3-
6). Zotarelli et al. (2009) measured nitrate-N concentrations in the 0 to 30 cm soil profile
on spring sweet corn plots with a cover crop previously grown over the winter season.
These researchers found initial nitrate-N concentrations from 2 to 9 mg kg-1 nitrate-N,
which was less than the nitrate-N concentration (17 mg kg-1) observed at the Dairy Unit
in the 0 to 30 cm soil profile. In Mato Grosso, Brazil, Frazao et al. (2010) measured
concentrations of nitrate-N and ammonium-N in the 0 to 20 cm layer over several land
uses (native, conventional till, pasture, and no-till). In February 2006, they observed
nitrate-N concentrations between 0.04 and 1.73 mg kg-1, and ammonium-N
concentrations between 0.57 and 1.89 mg kg-1. Those researchers observed lower
concentrations of ammonium-N during the rainy season and determined the small
amount of nitrate-N to be a result of leaching.
At the Dairy Unit, the concentrations of ammonium-N and nitrate-N were
measured from soils sampled one month after planting. From the time of planting (15
March 2011) to when the soil samples were taken (14 April 2011), 74 kg ha-1 N of
manure effluent and 35 kg ha-1 N of inorganic N fertilizer were applied to the spring
Page 62
62
silage corn crop. Sampling the soil after manure effluent and inorganic fertilizer were
applied explains the elevated concentrations of nitrate-N and ammonium-N compared to
those observed by Zotarelli et al. (2009), Constantin et al. (2010), and Frazao et al.
(2010) on similar soils. To accurately describe total crop available N fertilizer inputs
during the spring season, the N fertilizer applications made prior to soil sampling were
counted in the N mass budget inputs. Initial soil sampling avoided corn rows and would
not have accurately sampled inorganic N fertilizer banded at planting. Crop uptake
during the first month would have also taken up a portion of N fertilizer applied.
Multiple years of manure effluent application have built up the organic N content of
the soil in Field J to high levels (3130 kg ha-1). The organic N pool in the soil provided a
substantial pool of N that was subject to mineralization in turn providing mineral N for
crop uptake. Although only mineral N in the soil provided N readily available for crop
uptake, the organic N in the soil provided a large reserve of N that mineralized
throughout the crop year. Because manure effluent was surface applied, it built up the N
content of the upper 0 to 30 cm soil profile more than the lower 30 to 60 cm soil profile
(Table 3-5). It was beneficial to the silage corn crop to have a majority of N in the upper
0 to 30 cm because corn roots only grew to approximately 40 cm in the soil profile.
Because more mineral N (286 kg ha-1 N) was available in the soil than the crop
requirement (235 kg ha-1 N) and additional N fertilizers were applied, N leaching was
possible over the spring season.
Manure effluent and mineralized N
Farm management at the Dairy Unit applied fertilizers (inorganic N fertilizer and
manure effluent) to the silage corn in order to provide N for plant uptake. Fertilizer
applications to the spring silage corn were made according to the University of Florida
Page 63
63
Institute of Food and Agricultural Sciences (UF IFAS) recommendations of 235 kg ha-1
N for irrigated corn or 470 kg ha-1 N applied annually for 2 seasons of irrigated corn
(Mylavarapu et al., 2009).
The general practice of the Dairy Unit is to apply the maximum amount of N
allowed by UF IFAS Extension recommendations to produce the best silage corn yields.
Manure effluent (353 kg ha-1 TKN) was applied through the center pivot irrigation
system to the spring silage corn crop (Table 3-12). The NMP of the Dairy Unit assumed
40% of the N in the manure effluent would be lost during and after application (due to
volatilization, denitrification, leaching, etc.) and adjusted the application rates to account
for this projected loss (Martin, 2000). N content of the manure effluent was calculated
from farm records of liters of effluent applied to Field J and analytical results from
monthly sampling. The mean manure effluent TKN concentration during the spring
season was 159 mg L-1 TKN (organic N plus ammonium-N) of which 92 mg L-1 (58%)
was ammonium-N. Daily manure effluent application for the spring season averaged 19
kg ha-1 TKN per application event and ranged from 4 to 29 kg ha-1 TKN (Figure 3-1). In
the last month before the silage corn crop was harvested, 74 kg ha-1 TKN manure
effluent was applied to the field. These applications were late in the growing season and
could have increased N leaching during the fallow period between the spring and
summer silage corn seasons. A monthly schedule of manure effluent application to Field
J is shown in Table 3-12.
A large portion of the N applied through manure effluent was in the organic form
and was not readily available for crop uptake. Organic N was not subject to volatilization
and remained in the soil until it was mineralized or lost to leaching. Ammonium-N in the
Page 64
64
manure effluent was available for plant uptake. Past measurements by farm
management of the nitrate-N portion of manure effluent were small enough that nitrate-
N was not considered by farm management in N applications. Manure effluent samples
during the 2011-2012 crop year measured nitrate-N in the range of 0.07 to 41 mg kg-1
nitrate-N or 9% of the total N concentration of manure effluent (198 mg kg-1 N). Because
nitrate-N was the primary form of N susceptible to leaching, leaching was not expected
from manure effluent applications due to its small nitrate-N concentration. In addition, a
portion of organic N from manure effluent application and the initial soil organic N pool
(3130 kg ha-1 organic N) was mineralized by soil microbes and became available for
plant uptake over the spring season. Although farm management had to apply manure
effluent based on the TKN content, estimating mineralized N provided a better
calculation of plant available N as a N input.
For the spring season, mineralized N from manure effluent applications was
estimated to be only the ammonium-N portion of the manure effluent. Ammonium-N was
58% of manure effluent TKN during the spring. Estimated mineralized N was 204 kg ha-
1 ammonium-N which was the portion of crop available N in the applied manure effluent.
This estimate does not include any mineralized N from the organic N portion of manure
effluent or account for any volatilization losses during application. This estimate was
used because no mineralization experiment was carried out during the spring season to
better determine mineralized N. The pool of organic N in the soil was large enough that
even large manure effluent applications (353 kg ha-1 TKN) during the spring season did
not significantly increase the soil TKN content from the initial soil TKN content of 3310
kg ha-1 N.
Page 65
65
Inorganic N fertilizer
Inorganic N fertilizer (59 kg ha-1 N) was applied to the spring silage corn crop in
addition to manure effluent (Table 3-13). At planting, 35 kg ha-1 N as NH4NO3 was
applied as liquid fertilizer (28-0-0) banded at planting. In April, 24 kg ha-1 N as
(NH4)2SO4 of granular fertilizer (16-0-0) was broadcast by tractor. A monthly schedule of
inorganic N fertilizer application is shown in Table 3-13. According to farm management,
inorganic N fertilizer was typically applied at planting and then again when corn plants
were 25 to 35 cm high.
IFAS recommends 235 kg ha-1 N application to irrigated corn (Mylavarapu et al.,
2009). Using the Dairy Unit’s assumption of 40% losses of N from manure effluent due
to gaseous losses, of the total manure effluent applied, 212 kg ha-1 N was assumed to
be available for the crops in Field J. The total N fertilizer (manure effluent assuming
40% losses plus inorganic N fertilizer) available to crops in Field J for the spring season
was 271 kg ha-1 N which exceeds the IFAS recommendation (235 kg ha-1 N) for N
application to irrigated corn plants in a single season. The fertilizer application for the
spring silage corn also exceeds the Dairy Unit’s NMP’s estimated N uptake for corn
receiving wastewater (174 kg ha-1 N) (Martin, 2000). Mineralized N (204 kg ha-1 mineral
N) plus inorganic fertilizer (59 kg ha-1 N) provided a total of 263 kg ha-1 mineral N for
crop uptake. The available N for crop uptake was greater than the estimated N uptake
for corn receiving wastewater and the IFAS recommended crop requirement of 235 kg
ha-1 N. Therefore, plant available N was more than sufficient for silage corn crop needs
from mineralized N and inorganic fertilizer. Volatilization losses were expected due to
the high concentration of ammonium-N in the manure effluent and because it was
surface applied and left unincorporated.
Page 66
66
Atmospheric deposition
Atmospheric deposition was also an input of N to the spring cropping system. In
2010, the annual wet deposition was 0.6 kg ha-1 NH4+-N and 1.2 kg ha-1 NO3
--N (NADP,
2011). The total mineral N contributed by atmospheric deposition was 0.5 kg ha-1 N for
the spring season (102 days) (Table 3-14).
N Outputs
The spring silage corn was harvested on 25 June 2011. The soil mineral N content
decreased over the spring season due to crop uptake and leaching losses.
Unaccounted-for N comprised the N inputs minus the measured N outputs of final soil
mineral N content, harvested crop uptake, root and stubble uptake, and leaching.
Unaccounted-for N was assumed to be from gaseous losses.
Final soil N content
The soil mineral N content (165 kg ha-1 N) at the end of the spring silage corn
season was less (P < 0.0001) than the initial soil mineral N content (286 kg ha-1 N)
(Table 3-4). There was a difference (P < 0.0001) between the final soil ammonium-N
content (66 kg ha-1 N) and the initial soil ammonium-N content (173 kg ha-1 N) (Table 3-
7). The final soil nitrate-N content (100 kg ha-1 N) in the 0 to 60 cm soil profile was not
significantly different from the initial soil nitrate-N content (113 kg ha-1 N) (Table 3-6).
There was no significant difference in Soil TKN content in the initial spring soil TKN
content (3310 kg ha-1 TKN) and the final spring soil TKN content (3430 kg ha-1
TKN)(Table 3-8). During the spring season, soil mineral N decreased by 121 kg ha-1 N
due to crop uptake, leaching or gaseous losses.
In the upper soil profile (0 to 30 cm), the initial and final soil mineral N contents
were different (P < 0.0001) (Table 3-5). In the 0 to 30 cm soil profile, soil nitrate-N
Page 67
67
decreased from 73 to 56 kg ha-1 nitrate-N and soil ammonium-N decreased from 88 to
31 kg ha-1 ammonium-N over the spring season (Table 3-9) (Table 3-10). Although soil
mineral N decreased (P < 0.0001) in the 30 to 60 cm soil profile from the soil initial to
final measurements, the soil nitrate-N increased (Table 3-5) (Table 3-9). The change in
soil nitrate-N in the 30 to 60 cm soil profile from the initial soil measurement (40 kg ha-1)
to the final soil measurement (44 kg ha-1) indicated that nitrate-N leached into the lower
soil profile over the season (Table 3-9). Zotarelli et al. (2009) found similar nitrate-N
trends over the spring sweet corn season with changes in nitrate-N concentrations with
depth indicating leaching.
At the end of the season, soil ammonium-N in the 0 to 30 cm soil profile (31 kg ha-
1) was not significantly different from the soil ammonium-N in the 30 to 60 cm soil profile
(35 kg ha-1) (Table 3-10). Although soil ammonium-N decreased from 14 April 2011 to 1
July 2011, soil ammonium-N in the 0 to 60 cm soil profile remained evenly distributed
(Table 3-10). Frazao et al. (2010) observed no significant difference in ammonium-N
concentration by depth during the soil sampling in July 2005. Soil TKN in the 0 to 30 cm
soil profile decreased from 2410 to 2370 kg ha-1 TKN but increased in the 30 to 60 cm
soil profile from 896 to 1060 kg ha-1 TKN indicating movement of organic N deeper in
the soil over the season.
Although manure effluent applications over the spring season were 353 kg ha-1
TKN, they did not cause a significant change in soil TKN content due to the large pool of
soil TKN already in the soil. The primary form of N in manure effluent was ammonium-
N, but the ammonium-N content decreased from 173 to 66 kg ha-1 over the spring
season. The depletion of soil ammonium-N despite large manure effluent additions
Page 68
68
suggested volatilization was a large factor in ammonium-N losses. Crop uptake and
nitrification would have also decreased soil ammonium-N content. In the lower 30 to 60
cm soil profile, nitrate-N and soil organic N increased over the season, possibly
indicating potential issues with leaching.
Crop uptake
For farm management, the most important output of the spring season nutrient
budget was the silage corn crop. Farm management was interested in having as much
as possible of the N inputs go into producing a crop. The dry weight of the sampled
leaves, stalks, and ears was used to calculate a dry weight silage yield for Field J. For
the spring season, the dry weight yield was 15.2 Mg ha-1 although the Dairy Unit’s
harvested yield was 8.8 Mg ha-1 (Table 3-15). Spring silage corn yields at the Dairy Unit
were less than those of the University of Florida spring silage corn variety trials
conducted at the Plant Science Research and Education Unit at Citra, FL (UF DAS,
2011). The mean yield for all varieties grown in 2011 was 20.1 Mg ha-1 (Table 3-16).
Variety trials were also grown according to IFAS recommendations so yield differences
were not due to a difference in fertilizer allowance. The silage corn plants around the
edges of the field were observed to be smaller than the plants closer to the center of the
pivot. This size difference was not reflected in the yield calculated from the sampling
locations because few sampling locations were on the edges of the field. Silage corn
plants were sampled on 21 June 2011 and commercially harvested on 25 June 2011.
The time difference in sampling and commercial harvest meant the moisture content of
the silage at commercial harvest was lower, because the silage had more time to
continue drying down. Fresh yield of silage corn changes based on the moisture content
at harvest and the maturity of the corn plant.
Page 69
69
N taken up by the leaves, stalks, and ears was harvested for silage, while the
roots and stubble of the corn plants were left in the field. Although the roots and stubble
were not removed from the field before the next crop, root and stubble N uptake were
included in the N output pool at the end of the season because they represented a
measured pool of N at the end of the season that was not lost.
Crop N uptake consisted of the total N (organic N and nitrate-N) found in the plant
tissue of the silage corn. Table 3-17 shows the N uptake (kg ha-1) of the silage corn
plant parts divided into leaves, stalks, ears, stubble, and roots for the spring season.
The leaves, stalks, and ears comprised the portion of the crop harvested commercially
for silage. The spring harvested crop uptake was 202 kg ha-1 N (Table 3-19). Harvested
crop uptake N accounted for 76% of the total plant crop uptake (harvested crop uptake
plus root and stubble uptake) (264 kg ha-1 N) in the spring season. The roots and
stubble N uptake for the spring was 62 kg ha-1 N and was 24% of the total plant crop
uptake (Table 3-19).
The percentages of total N in dry silage corn plant parts for the spring crop are
shown in Table 3-18. For the harvested portion of the plant, the leaves, stalks, and cobs
were 2.18, 0.98, and 1.17%, respectively (Table 3-18). The total harvested silage mean
was 1.48% N. The N percentage of the crop was used to calculate crude protein
content by multiplying the percent N by 6.25. The percent crude protein for the spring
silage corn crop was 9.25% slightly higher than spring 2011 corn silage variety trial
(8.00%) (Table 3-16) (UF DAS, 2011).
The Dairy Unit’s spring silage corn ear N uptake (100 kg ha-1) was similar to the
total N uptake of the corn grain yield harvested by Eghball and Power (1999). Eghball
Page 70
70
and Power measured an average of 66 to 99 kg ha-1 total N uptake for corn grain from
1993 to 1996. The Dairy Unit’s harvested crop uptake (202 kg ha-1 N) was similar to
results found by Van Horn et al. (1996) in Tifton, GA. Van Horn et al. (1996) harvested
129 and 197 kg ha-1 N from corn silage from yearly manure application of 421 and 493
kg ha-1 N, respectively. Although the results of Eghball and Power (1999) and Van Horn
et al. (1996) were similar to the results observed at the Dairy Unit, the N uptake was in
the upper end of the ranges observed by past researchers. This may have been due to
the large amount of manure effluent applied as N fertilizer.
Fertilizer N use efficiency (FNUE) was calculated for each season by dividing the
N crop uptake by the N fertilizers applied. The total amount of N fertilizers applied was a
combination of manure effluent and inorganic N fertilizer. The FNUE for the spring
silage corn was calculated by dividing 202 kg ha-1 N of the harvested crop uptake by the
manure effluent N application of 353 kg ha-1 plus the inorganic N fertilizer application of
59 kg ha-1. The FNUE of the spring silage corn was 49%. Because an unfertilized plot
was not available, crop uptake solely from N fertilizers could not be determined. FNUE
is overestimated, because a part of N crop uptake came from the soil mineral N content.
A large portion of the manure effluent applications were organic N and were not readily
available for crop uptake. Volatilization losses also subtracted from the amount of
ammonium-N available from manure effluent. Without an unfertilized crop to compare to
the fertilized crop, FNUE was difficult to evaluate since a more accurate estimate of
mineralized N was not available and soil mineral N likely provided N to the corn.
Meng et al. (2012) reported apparent N recovery for maize grain yields, which was
similar to the FNUE calculated in this study. Apparent N recovery was calculated as the
Page 71
71
N removed by the crop grown with fertilizer minus the N removed by an unfertilized crop
divided by the N fertilizer application. The world average for apparent N recovery of
maize grain yields is 33%. At the recommended N fertilizer application rate of 450 kg ha-
1 N, the apparent N recovery in the spring crop was 28%. Meng et al. (2012) determined
an optimal N fertilization rate by subtracting the soil mineral N in the root zone from
target N values for the crop. At the optimal N fertilization rate, the apparent N recovery
rate was 72%. The spring silage corn FNUE (49%) was lower than the apparent N
recovery rate of 72% achieved by the optimal N fertilization rate, but higher than the
world average apparent N recovery (33%) and the recommended N rate apparent N
recovery (28%).
Zotarelli et al. (2009) measured apparent N recovery of sweet corn (including
stems, leaves, and ears) fertilized with 267 kg ha-1 N in 2004 and 2006. In 2004,
apparent N recovery was 40% while in 2006 apparent N recovery was 50%. For the
Dairy Unit’s spring silage corn, the N fertilization (270 kg ha-1 N assuming 40% gaseous
losses) and FNUE (49%) were comparable to the results found by Zotarelli et al. (2009).
Fertilization rates greater than the IFAS N recommendation for irrigated corn contributed
to the FNUE of 49% being lower than other efficiencies for lower fertilization rates. In
2006, Zotarelli et al. (2009) observed apparent N recoveries of 80% for sweet corn
fertilized with 133 kg ha-1 N and 70% for sweet corn fertilized with 200 kg ha-1 N. They
found that N uptake in the ears and stover was equal for the 200 and 267 kg ha-1 N
application treatments in 2004 and 2006. The harvested crop N uptake (202 kg ha-1 N)
exceeded the Dairy Unit’s NMP’s estimated N uptake for corn receiving wastewater
(174 kg ha-1 N)(Martin, 2000). The results of Zotarelli et al. (2009) indicated that a
Page 72
72
higher FNUE could be achieved for silage corn at the Dairy Unit by applying less N
fertilizer while yields would likely remain the same.
The N fertilization rates of Zotarelli et al. (2009) were less than the N available
from mineralized N (204 kg ha-1 ammonium-N) plus inorganic N fertilizer (58 kg ha-1 N)
applied during the spring season at the Dairy Unit. Fertilization of silage corn at the
Dairy Unit was greater than the crop requirement and decreased the FNUE. The FNUE
was also lower than the results found by Zotarelli et al. because manure effluent
contained a large amount of unavailable organic N which could not be utilized by the
crop without mineralization. Without an unfertilized corn silage plot to compare crop
uptake, it was difficult to determine the true N fertilizer use efficiency.
Manure effluent applications added to the organic N pool in the soil which
mineralized over time to provide adequate plant available N for crop uptake. It was
unclear if manure effluent applications determined mineralization rates or if
mineralization was driven solely by the soil organic N content because no mineralization
experiment was completed during the spring season. Mineralized N provided a
substantial source of N for crop uptake during the spring season in addition to inorganic
N fertilizer and soil mineral N. There was little potential for leaching losses because the
large amounts of manure effluent applied contained very little nitrate-N, leaving
inorganic N fertilizer as the only considerable source of nitrate-N.
Leaching
Lysimeter N loads were calculated using the volume (liters) of leachate collected,
nitrate-N concentration in the leachate, and the area of the lysimeter (0.534 m2).
Lysimeters which were empty were recorded as zero load for the sampling date.
Page 73
73
Lysimeters which had less than the 40 mL of leachate needed for laboratory N analysis
were recorded as no sample or zero load.
The cause of the increase in nitrate-N in the lower soil profile (30 to 60 cm) over
the spring crop season was leaching measured by the drainage lysimeters. Only one
leaching event on 21 May 2011 was observed during the spring season. Lysimeter
reservoirs were empty for all other sampling dates over the spring. Nitrate-N leaching
for the spring season (1.9 kg ha-1 N) was calculated as the mean N load per lysimeter
for the one leaching event of the season on 21 May 2011 (Table 3-20). The mean
nitrate-N concentration of the leachate observed on 21 May 2011 was 35 mg L-1 nitrate-
N (Table 3-21).
Over the spring silage corn season, 59 mm of fresh water was applied through the
irrigation system. The greatest amount of fresh water applied on one day was 12 mm.
Before the leaching event on 21 May 2011, a total of 11 mm of fresh water had been
applied to the silage corn crop more than 2 weeks before. Therefore, fresh water
irrigation was not a likely contributor to leaching during the spring crop season.
Rainfall during the spring season (15 March 2011 to 25 June 2011) was low (170
mm) compared to the average rainfall of 283 mm (Figure 3-2) from 15 March to 25 June
over the last 5 years (2011-2007) in Alachua County (FAWN, 2012). Figure 3-3 shows
daily rainfall, fresh water irrigation, manure effluent, and leaching events. One high
rainfall event on 14 May 2011 of 84 mm appears to have caused the spring season
leaching event recorded on 21 May 2011 (Figure 3-3).
Reference evapotranspiration during the spring season was 3.81 mm day-1 in
Alachua County. Corn crop coefficients were 0.7 for the first 40 days and 1.1 for the rest
Page 74
74
of the season (SCS, 1967). Total evapotranspiration during the spring season was 386
mm, whereas only 229 mm of water was added to the crop through freshwater irrigation
and rainfall. This left a deficient in water availability to the silage corn crops.
Constantin et al. (2010) reported 14 kg ha-1 year-1 N leached from a no-till field
with a cover crop. Cover crops and no-till systems were found to be efficient techniques
for reducing N leaching. The rye/ryegrass cover crop grown previous to the spring
silage corn in combination with the no-till agricultural practices of the Dairy Unit likely
explains the small amount of leaching during the spring season. Morari et al. (2012) did
not measure any nitrate-N concentrations of lysimeter water greater than 25 mg L-1
nitrate-N. The mean leaching measured for maize crops was 10.9 kg ha-1 N (Morari et
al., 2012). Leaching is highly variable and despite large additions of manure effluent
during the spring crop season, little leaching was observed.
So although N fertilizer applications exceeded IFAS recommendations, leaching
losses during the spring season were very small, less than 1% of N outputs. Hypothesis
#1 was “N fertilizer application to the fields is greater than the IFAS recommendation
due to overestimated gaseous losses. Farm management assumes 40% losses. This
leads to an over-fertilization of the crops and leaching of N to groundwater.” Although
there was excessive N fertilizer application, leaching losses were small. The decrease
in soil N content over the spring season paired with little leaching losses and poor silage
corn yields indicated the likelihood of high gaseous losses.
Unaccounted-for N
The inputs and measured outputs of the spring season were used to calculate
unaccounted-for N in the spring N mass budget. For the spring season, 119 kg ha-1 N of
the inputs were unaccounted-for in the total mass budget (Table 3-22).
Page 75
75
Unaccounted-for N was 22% of the total N budget outputs (550 kg ha-1 N) in the
spring season. A possible reason for unaccounted-for N would be an overestimated
initial soil mineral N measurement. Initial soil mineral N measurements were taken in
the field after the crop had been fertilized by manure effluent and inorganic fertilizer
applications (74 kg ha-1 TKN manure effluent plus 35 kg ha-1 N inorganic fertilizer). The
late soil sampling date may have resulted in a soil mineral N measurement on 14 April
2011 greater than the soil mineral N content would have been at planting (15 March
2011). Thus, a portion of the soil mineral N content measured on 14 April 2011 was also
counted in the N fertilizer inputs. N total inputs for the spring season would therefore be
overestimated due to that part of the N pool being counted twice. The overestimated N
inputs would result in overestimated unaccounted-for N.
Unaccounted-for N included volatilization and denitrification losses. Farm
management estimated 40% N losses from manure effluent application due to gaseous
losses. This would result in 141 kg ha-1 N of gaseous losses from the 353 kg ha-1 N of
manure effluent applied as an input. Estimated unaccounted-for N was 119 kg ha-1 N,
which was 22 kg ha-1 N less than farm management assumptions. This suggested that
N fertilizer application (353 kg ha-1 manure effluent minus 119 kg ha-1 N gaseous losses
plus 59 kg ha-1 inorganic N fertilizer) was greater than the IFAS recommendation of 235
kg ha-1 N due to overestimated gaseous losses (Hypothesis #1).
Van Horn et al. (1996) estimated volatilization losses to be 50 to 70% of N from
surface applied animal manures. This would result in 177 to 247 kg ha-1 N losses from
the 353 kg ha-1 N manure effluent applied. Alternatively, Hall and Risser (1993)
estimated volatilization to be 25% of outputs. This estimate was similar to the Dairy
Page 76
76
Unit’s spring season unaccounted-for N which was 22% of the outputs (119 kg ha-1 N
divided by 550 kg ha-1 N). Although manure effluent applications were large, organic N
applied appeared to have been stored in the soil. This would suggest that gaseous
losses were less than those proposed by Van Horn et al. (1996) and similar to those
found by Hall and Risser (1993).
Accounting for all of the N outputs in a system is very difficult. Nevertheless, the
unaccounted-for N was only 22% of the Dairy Unit’s outputs. Kuipers et al. (1999) found
a 75% surplus of N between measured imports and exports on a dairy farm in the
Netherlands. Bacon et al. (1990) found a N balance (inputs-outputs) of 54% of the N
inputs in 1985 and 51% of the N inputs in 1986, but Bacon did not account for
environmental losses. By these standards, during the spring season at the Dairy Unit, a
larger portion of N outputs were accounted for than in other studies.
Summer Season
N Inputs
Silage corn was planted in Field J for the summer season on 2 July 2011, 7 days
after the spring silage corn was harvested. The final measurements for soil N contents
from the spring season were used as the initial soil N content of the summer season. No
manure was applied in between the two corn crops. Manure effluent and inorganic N
fertilizers were applied to the summer season silage corn. Mineralized N was estimated
from the summer mineralization experiment and included as a N input in the mass
balance. Crop available N inputs to Field J for the summer season were initial soil
mineral N content, mineralized N, inorganic N fertilizer, and atmospheric deposition of
N.
Page 77
77
Initial soil N content
The initial soil mineral N (nitrate-N plus ammonium-N) in the total 0 to 60 cm soil
profile was 165 kg ha-1 N (Table 3-4) made up of 100 kg ha-1 nitrate-N (Table 3-6) and
66 kg ha-1 ammonium-N (Table 3-7). The initial soil TKN (organic N plus ammonium-N)
content in the 0 to 60 cm soil profile for the summer season was 3430 kg ha-1 TKN
(Table 3-8). Soil TKN content of the 0 to 30 cm soil profile was 2370 kg ha-1 TKN; in the
lower 30 to 60 cm soil profile, it was 1060 kg ha-1 TKN (Table 3-11).
Zotarelli et al. (2009) measured soil nitrate-N in sweet corn plots, 15 days after
harvest on 30 June 2006. Nitrate-N concentrations measured between 3 and 5 mg kg-1
nitrate-N. The timing of the soil sampling was similar to the initial summer soil sampling
on 1 July 2011. At the Dairy Unit, nitrate-N concentrations averaged 11 mg kg-1 nitrate-
N in the 0 to 60 cm soil profile. The soil nitrate-N concentration at the Dairy Unit is likely
a higher concentration than measured by Zotarelli et al. (2009) due to the spring silage
corn receiving higher N fertilization than the 133 kg ha-1 N fertilizer application to the
sweet corn.
Frazao et al. (2010) measured nitrate-N and ammonium-N in July 2005. These
researchers observed mean nitrate-N concentrations in the 0 to 20 cm soil profile of
0.54 mg kg-1 nitrate-N. The nitrate-N concentrations in the 0 to 30 cm soil profile
measured on 1 July 2011 were 12.6 mg kg-1 nitrate-N. Constantin et al. (2010) observed
the soil nitrate-N content at the harvest of main crops. In Boigneville, France, the no-till,
cover crop experimental site measured 41 kg ha-1 nitrate-N at the harvest of the main
crop (spring barley). The soil nitrate-N content measured at the Dairy Unit at the start of
the summer silage corn season was 100 kg ha-1 nitrate-N. Zotarelli et al. (2009), Frazao
et al. (2010), and Constantin et al. (2010) observed soil N contents less than those
Page 78
78
measured at the Dairy Unit but were comparable to those in agricultural systems with
lower N fertilization of the previous crop.
Soil nitrate-N contents higher than those found by other researchers were likely
due to the nitrification of manure effluent applications. During the spring season, high
amounts of manure effluent were applied which would have raised soil N levels. In
addition, during the last month of the growing season, 74 kg ha-1 TKN was applied
through manure effluent. Most of this N was likely not taken up by the spring crop, left in
the soil, and subject to nitrification, raising the nitrate-N concentration of the soil.
Manure effluent and mineralized N
Total N fertilizer applications during the summer season were less than the N
fertilizer applied in the spring season. Manure effluent applications in the summer
season (31 kg ha-1 TKN) were only 9% of those applied in the spring season (353 kg ha-
1 TKN) (Table 3-12), while summer inorganic fertilizer applications (56 kg ha-1 N) were
similar to the quantity applied in the spring season (59 kg ha-1 N) (Table 3-13). Manure
effluent was applied on only three days in the summer growing season (Figure 3-1).
One manure effluent application was 22 kg ha-1 TKN in August, while the other two
applications in July were 4 and 5 kg ha-1 TKN, respectively (Figure 3-1). The mean N
composition of manure effluent during the summer season was 82 mg L-1 organic N,
108 mg L-1 ammonium-N, and 17.5 mg L-1 nitrate-N.
In 2011, the summer season had 378 mm of rainfall (Figure 3-4). The more
frequent rainfall in the summer season compared to the spring season (170 mm)
resulted in fewer opportunities for the farm management to apply manure effluent to the
summer silage corn because the water was not needed. Water availability did not limit
crop production during the summer growing season. In the spring season, there were
Page 79
79
19 days with rainfall, while in the summer season there were 29 days when it rained.
Typically, farm management avoided applying manure effluent when it was raining and
when the field soil moisture was high due to recent heavy rainfall.
A soil N mineralization experiment was conducted with the summer silage corn
crop to characterize mineral N (nitrate-N plus ammonium-N) made available during the
growing season. Soil mineral N could come from inorganic fertilizer, mineral N in
manure effluent, atmospheric deposition, and from the mineralization of soil organic
matter. Sources of soil organic matter include manure effluent, roots, stubble, and other
plant matter left in the field from previous seasons. The soil N mineralization experiment
estimated “mineralized N” additions or the increase of mineral N due to the
mineralization of organic N over the summer silage corn crop. Mineralized N was a N
input in the summer N mass budget and was available for crop uptake as well as
environmental losses. Further, knowing the amount of mineralized N will help the farm
management make decisions about amounts of manure effluent needed for crop growth
requirements.
Organic N from manure effluent applications during the summer season in addition
to the pool of organic N remaining in the soil from previous seasons was mineralized
during the summer N mineralization experiment. Over the summer mineralization
experiment, 31 kg ha-1 N of manure effluent was applied to Field J. The complete
mineralization experiment sampling plan is described in Table 2-3. Staggering the
installation of PVC pipes in monthly time periods allowed for the isolation of different
initial soil mineral N contents throughout the summer. Varying initial soil mineral N
contents resulted from applications of manure effluent. Over a one month period, the
Page 80
80
observed change in soil mineral N was due to net mineralization (positive change) or
net immobilization (negative change). One-month periods also allowed for baseline soil
mineral N contents to be established from each manure effluent application. For
example, a soil isolated in July and its subsequent mineral N changes over time could
serve as a baseline for a soil isolated in August containing additional manure effluent.
Soil mineral N changes different than those observed in the July soil baseline could be
attributed to the additional manure effluent in the soil isolated in August. Therefore, the
soil isolated by the previous month’s PVC pipe installation provided the baseline for the
changes of the next month’s soil mineral N content.
In the month preceding the start of the summer mineralization experiment (24
June to 24 July 2011), 9 kg ha-1 N of manure effluent was applied to the silage corn in
Field J. The initial set of PVC pipes for the summer mineralization experiment was
installed on 24 July 2011. The results of the soil mineral N content of the soil isolated by
PVC pipes on 24 July 2011 are shown in Table 3-23. The monthly soil mineral N
content was used to calculate any increases in soil mineral N due to net mineralization
of organic N in the soil over the time of the experiment.
For the soil isolated by PVC pipes installed on 24 July, the change in mineral N
content over the first month time period could not be calculated, because no initial soil
samples were taken on 24 July. The change in mineral N content at each lysimeter
location was calculated from August to September and September to October by
subtracting the mineral N content on 24 August from the content on 24 September and
the content on 24 September from 24 October For each lysimeter location, the
accumulations of mineral N in the soil isolated by the PVC pipes installed on 24 July
Page 81
81
were summed. The sums for each lysimeter location were then averaged to get the N
mineralized for the soil samples isolated by the first set of PVC pipes installed on 24
July. The mean mineralized N during the first measurement period was 18 kg ha-1
mineral N, which was considered a N input in the summer N mass budget. The mineral
N content of soil isolated on 24 July 2011was used as a baseline to compare against
the mineral N content of soil samples isolated by PVC pipes installed on 24 August and
sampled on 24 September and 24 October.
Between 24 July and 24 August 2011, 22 kg ha-1 N from manure effluent was
added to Field J. Soil mineral N content of the soil isolated by PVC pipes installed on 24
August 2011 was measured on 24 Sept. and 24 Oct. The baseline changes in the soil
mineral N content of soil isolated on 24 July 2011 were subtracted from the change in
soil mineral N isolated on 24 Aug. 2011. By subtracting the baseline, the difference
showed only the net mineralization/immobilization after 24 August. The mean
mineralized N in the soil isolated by PVC pipes on 24 August was 24 kg ha-1 mineral N
(Table 3-24).
Between 24 August and 24 September 2011, no manure effluent was added.
Mineralization and immobilization still occurred due to the supply of organic N in the soil
as of 24 September 2011. PVC pipes were installed on 24 September and the isolated
soil was sampled on 24 Oct. 2011. The mineral N content of the soil isolated on 24
September and sampled on 24 October was compared to the baseline mineral N
content from the soil isolated on 24 August and sampled on 24 October. In each
location, the mineral N content of the soil isolated on 24 September was lower than the
baseline N content from the soil isolated on 24 August (Table 3-24) resulting in net
Page 82
82
immobilization or no mineral N added to the soil from mineralization from 24 September
to 24 October. Over the summer mineralization experiment, the total mineral N available
for plant uptake due to mineralization was 43 kg ha-1. The mean daily mineralized N
was 0.7 kg ha-1 mineral N. Figure 3-5 depicts the net mineralization and immobilization
for PVC pipes installed in July, August, and September.
Figure 3-6 shows the results of the soil mineral N content of the soil isolated by the
PVC pipes installed on 24 July 2011. The general trend was a decrease or net
immobilization of soil mineral N from the soil sampled one month after installation to the
soil sampled two months after installation (24 Sept. 2011). Between soil sampled two
months after installation and three months after installation (24 September to 24
October 2011), the general trend was a positive increase or net mineralization in soil
mineral N. Although it was unknown whether the mineral N content increased from 24
July to 24 August 2011, the general trend of the mineral N content followed the same
results as the incubation trial of Cusick et al. (2006). They found a net mineralization in
the first 21 days, a net immobilization from day 21 to 84, and then a net mineralization
from day 84 to the end of the trial. The researcher’s results were similar to the results
seen in Figure 3-6 although it was likely that net mineralization began before 84 days in
the summer mineralization experiment.
The summer mineralization experiment did not provide a mineral N estimate for
the entire season. Mineralized N for the summer season was calculated using the
average daily mineralized N of 0.71 kg ha-1 mineral N. The summer season was 81
days long resulting in an estimated mineralized N of 57.4 kg ha-1 mineral N (0.71 kg ha-1
N multiplied by 81 days). Estimated mineralized N for the summer season was greater
Page 83
83
than manure effluent applications (31 kg ha-1 TKN). Large amounts of manure effluent
applied during the spring season continued to mineralize over the summer season
providing mineralized N greater than the summer manure effluent applications. This was
expected because manure effluent would not fully mineralize during one crop season.
Mineralized N accounted for 21% of total mineral N inputs for the summer crop
season (279 kg ha-1 mineral N). During the summer crop season, we failed to reject
Hypothesis #4, “Mineralization of soil organic matter accounts for less than 20% of the
N in the total crop N inputs.” During the summer, soil mineral N was the greatest
contributor to crop available N inputs followed by mineralized N (57 kg ha-1 mineral N)
estimated from the summer mineralization experiment.
Inorganic N fertilizer
In the summer season, a total of 56 kg ha-1 of inorganic fertilizer was applied
(Table 3-13). At planting, 34 kg ha-1 N as NH4NO3 of liquid fertilizer (28-0-0) was applied
during the planting operation. In August, 22 kg ha-1 N as NH4NO3 of liquid fertilizer (28-
0-0) was applied to the crop through the center pivot irrigation.
The total N fertilizer application for the summer silage corn season was less than
the IFAS recommendation of 235 kg ha-1 N for irrigated corn (Mylavarapu et al., 2009).
Assuming the NMP’s estimated 40% losses of the manure effluent applied, only 19 kg
ha-1 N of manure effluent was available for the corn crop in Field J during the summer
season (Martin, 2000). The total N fertilizer application assumed by farm management
(manure effluent after 40% losses plus inorganic fertilizer) was 75 kg ha-1 N which was
160 kg ha-1 N less than the IFAS recommendation. The Dairy Unit’s nutrient
management plan estimated corn N uptake to be 174 kg ha-1 N. Applied N fertilizer for
the summer season was less than the estimated crop uptake.
Page 84
84
Inorganic N fertilizer in addition to the estimated mineralized N (57 kg ha-1 mineral
N) provided a total crop available mineral N of 113 kg ha-1 mineral N. These sources of
crop available N fell short of the 235 kg ha-1 N recommendation for irrigated corn.
Although the soil mineral N content could have provided N to the plants, the N
applications were not sufficient for crop requirements. The lack of N fertilization
suggested that crop yields would be limited. Leaching was also not expected to be
substantial during the summer season due to the lack of N fertilization.
Atmospheric deposition
Atmospheric deposition of N contributed to the N inputs for the summer silage corn
crop. The summer season was 81 days long, from 2 July to 21 Sept. 2011. Total NO3- -
N and NH4+ -N from atmospheric deposition from the summer season was 0.4 kg ha-1 N
(Table 3-14) (NADP, 2011).
N Outputs
The summer silage corn was harvested on 21 Sept. 2011. Crop available N inputs
were the initial soil mineral N content, estimated mineralized N, inorganic N fertilizer,
and atmospheric deposition. Crop uptake was the most desirable N output. Other N
outputs were the final soil N content, leaching, and unaccounted-for N. Unaccounted-for
N was assumed to be from gaseous losses.
Final soil N content
The final soil mineral N content of the summer season was 53 kg ha-1 N. There
was a significant difference (P < 0.0001) between the initial soil mineral N content (165
kg ha-1 N) in the 0 to 60 cm soil profile and final soil mineral N content (53 kg ha-1 N)
(Table 3-4). There was a change of 112 kg ha-1 N of mineral N from the beginning to the
end of the summer growing season. Final soil nitrate-N content (47 kg ha-1 nitrate-N)
Page 85
85
significantly differed (P < 0.0001) from the initial soil nitrate-N content (100 kg ha-1
nitrate-N) in the 0 to 60 cm soil profile (Table 3-6). Final soil nitrate-N levels for the
summer season were similar to results found by Jokela (1992) in Swanton, VT. In
October 1988, he found 86 kg ha-1 of soil nitrate-N in 0 to 150 cm of the soil profile after
a corn harvest with N fertilizer (56 kg ha-1 N at planting) and manure application (240 kg
ha-1 yr-1 N) to Field J. Constantin et al. (2010) observed nitrate-N levels of 25 kg ha-1
nitrate-N in late autumn on no-till plots with a cover crop grown on soils similar to the
Dairy Unit.
Soil TKN content at the end of the summer season was 3460 kg ha-1 N (Table 3-
8). There was no significant difference between the initial and final soil TKN contents of
the summer season (Table 3-8). Because the soil TKN content was a larger pool of soil
N compared to nitrate-N and ammonia-N, the small amount of manure effluent applied
during the summer season did not significantly increase the soil TKN content.
Soil nitrate-N in the lower 30 to 60 cm decreased from 44 to 18 kg ha-1 nitrate-N
over the summer season. This suggested possible nitrate-N leaching, because corn
roots only reached to approximately 40 cm making significant N uptake in the lower soil
profile unlikely. Only one third of the initial soil mineral N content remained at the end of
the summer season. Crop uptake could have depleted mineral N in the soil, because N
fertilization was inadequate during the summer season.
Crop uptake
The dry weight yield for the summer silage corn crop was calculated from the corn
samples taken on 20 Sept. 2011. The dry weight yield of the summer silage corn (11.8
Mg ha-1) was less than the spring silage corn dry weight yield of 15.2 Mg ha-1 (Table 3-
15). The Dairy Unit’s dry weight harvested yield (7.6 Mg ha-1) was less than the
Page 86
86
calculated yield from the crop sampling due to smaller plants near the field edges which
were not sampled in the current research. The summer silage corn crop was
commercially harvested on 21 Sept. 2011.
Silage corn production yields are typically less for the summer season than the
spring season due to shorter growing seasons. In the 2011 Corn Silage Field Day Corn
Hybrid Variety Test (UF DAS, 2011) performed by the University of Florida in Citra,
Florida, varieties of silage corn were planted in the spring and in the summer. The mean
dry yield per hectare was 20.2 Mg ha-1 for the spring planting, whereas for the summer
silage corn mean dry yield was 14.8 Mg ha-1 (Table 3-16). The variety test yield results
were characteristic of silage corn production in Florida where summer yields are
typically 25% less than spring yields (UF DAS, 2011). Because farm management
expected greater silage yields in the spring season, more manure effluent was applied
during the spring season than in the summer.
The concentrations of total N in dry silage corn plant parts for the summer crop are
shown in Table 3-18. For the harvested portion of the plant, the leaves, stalks, and ears
were 1.77, 0.47, and 1.34%, respectively (Table 3-18). The total harvested silage mean
was 1.39% N. The concentration of crude protein for the summer silage corn crop was
8.69% slightly higher than summer 2011 corn silage variety trial (7.34%) (Table 3-16)
(UF DAS, 2011). Both seasons of silage corn at the Dairy Unit had poorer yields than
the variety trials, but a higher concentration of N and crude protein.
Adequate N fertilization would likely have increased the summer silage corn yields.
Estimated mineralized N and inorganic N fertilizer applications during the summer
season provided less than 50% of the N crop requirement of 235 kg ha-1 N. Crop
Page 87
87
available N inputs totaled 279 kg ha-1 mineral N for the summer season, but 78 kg ha-1
mineral N of that amount was soil mineral N in the lower soil profile to which plants had
limited access. Farm management did not provide adequate N fertilization for the
summer silage corn.
The crop N uptake of the summer silage corn season was calculated for leaves,
stalks, ears, stubble, and roots and the results are shown in Table 3-17. There was a
significant difference in the N uptake for all plant parts (P < 0.0001 for the leaves, stalks,
stubble, and roots; P = 0.0461 for the ears) between the spring and summer season
crops. The summer season corn N uptake was less than plant N uptake in the spring
silage corn. Greater yields during the spring crop season and lower fertilization in the
summer explain the difference in crop N uptake.
The harvested crop uptake (leaves, stalks, and ears) was 142 kg ha-1 N for the
summer crop (Table 3-19). The harvested crop N uptake was removed from Field J and
used for corn silage to feed to the dairy cows. Harvested crop uptake was 88% of the
total plant crop N uptake for the summer season. During the spring season, the
harvested crop uptake had been 76% of the total crop plant N uptake. Although the
summer silage corn crop had a lower yield than the spring silage corn crop, it was more
efficient in partitioning N to the harvested crop uptake plant parts.
The root and stubble N uptake in the summer silage corn season was 20 kg ha-1 N
(Table 3-19). For the summer season, root and stubble N uptake accounted for 12 % of
the total plant crop uptake. Root N content was greater than stubble N content for both
the spring and summer silage corn crops. Root N uptake was 45 and 16 kg ha-1 N in the
Page 88
88
spring and summer crops, respectively (Table 3-17). Stubble N uptake was 17 and 4 kg
ha-1 N in the spring and summer crops, respectively (Table 3-17).
The FNUE for the summer silage corn was calculated by dividing 142 kg ha-1 N in
the harvested crop uptake by the N fertilizer applied, which was the sum of manure
effluent N application (31 kg ha-1 TKN) plus the inorganic N fertilizer application (56 kg
ha-1 N). The calculated FNUE of the summer silage corn was 163%. The large
difference in silage corn FNUE between the spring and summer seasons was primarily
caused by the difference in N fertilizer application. The summer silage corn crop
received much less manure effluent than the spring silage corn crop (31 vs. 353 kg ha-1
TKN). The summer silage corn harvested crop uptake was greater than the N fertilizers
applied which indicated that the summer silage corn drew N from the soil N content. The
summer silage corn FNUE indicated that the silage corn crop yield was limited by
inadequate N fertilization.
The results for apparent N recovery found by Meng et al. (2012) are not
comparable to the FNUE calculated for the summer silage corn. Because the N crop
uptake of the summer silage corn was greater than the total N applied through manure
effluent and inorganic N fertilizer, a portion of N crop uptake came from the soil mineral
N content. Without an unfertilized silage corn crop to compare to the summer silage
corn N crop uptake, the FNUE of the summer crop was difficult to evaluate based solely
on N fertilizer applications. Although the high FNUE (163%) of the summer crop seems
optimal, it was clear that the soil mineral N content was depleted by crop uptake.
In 2006, Zotarelli et al. (2009) reported the highest apparent N recovery (80%) on
sweet corn fertilized with 133 kg ha-1 N. This N treatment did not result in the greatest
Page 89
89
yield. The 133 kg ha-1 N treatment yielded 9.76 Mg ha-1 dry above-ground biomass.
With a lower apparent N recovery of 70%, the 200 kg ha-1 N treatment yielded 9.81 Mg
ha-1 dry above-ground biomass. It was likely that the summer yield would have been
greater with greater N fertilization similar to the results observed by Zotarelli et al.
(2009).
Leaching
During the summer seasons, some drainage lysimeters did not yield an
observation at each sampling date because of problems with the lysimeter equipment.
Lysimeter reservoirs at location C were dug up and repaired on 22 November 2011 due
to problems incurred over the summer season. Reservoirs at locations A and B were
dug up and repaired on 17 January 2012. All repaired drainage lysimeters showed the
same problem of crimping in the soft, Tygon tubing used to pump out the reservoir from
the weight of the soil on top of the bucket reservoir pushing the PVC piping down into
the tubing (Figure 2-3). Crimped tubing prevented leachate from being pumped out of
the reservoir and therefore no observation was recorded.
Leaching was calculated from the 8 lysimeters which were not blocked during the
summer season. Lysimeter locations A2, B2, C1, and C2 (Figure 2-1) were blocked for
the 4 sampling dates during the summer season and were not included in the mean
load for the season. Lysimeter N loads were calculated using the volume (liters) of
leachate collected, the nitrate-N concentration in the leachate, and the area of the
lysimeter (0.534 m2). The calculated load of each lysimeter was summed over all
summer sampling dates. The individual lysimeter sums were then averaged to obtain
the summer leaching total load. The leaching events for the summer season resulted in
the greatest (P = 0.0028) leaching load for any season (19 kg ha-1 nitrate-N) (Table 3-
Page 90
90
20). Leaching observations were recorded for each sampling date. The mean nitrate-N
concentration of observed leachate events for the summer season was 66 mg L-1 (Table
3-21).
The short fallow period between the spring and summer silage corn seasons had
one leaching event of 4.8 kg ha-1 nitrate-N. During the fallow period, Field J received 37
mm of rainfall on 30 June 2011 (Figure 3-3). After the summer silage crop was planted,
Field J received 53 mm of rainfall on 9 July 2011. There was no freshwater irrigation
application during the fallow period. In June, relatively late in the spring growing season,
74 kg ha-1 TKN manure effluent was applied. Hypothesis #3 stated “Manure effluent
application late in the growing season increases the likelihood of leaching losses in the
fallow period.” It is difficult to determine whether manure effluent applications, high
rainfall events, or a combination of the two were the cause of the leaching event
observed on 17 June 2011. Therefore, we failed to reject hypothesis #3.
Because there were few manure effluent applications during the summer season,
thus lower quantities of water, it was likely that rainfall events were the major cause of
leaching events and not manure effluent applications. The summer season rainfall was
208 mm greater than the rainfall during the spring season. The summer season also
had a greater number of days of rainfall (29 vs. 19 days in the spring) in addition to the
summer season being 20 days shorter than the spring season. The greater amount of
rainfall during the summer season most likely caused the increase in the number of
leaching events and overall load during the summer season compared to the spring
season as shown in Figure 3-3.
Page 91
91
Rainfall during the summer season (378 mm) was less than average rainfall over
the last 5 years (508 mm) (Figure 3-4). The dry summer weather likely limited leaching
compared to past summer seasons with greater rainfall. During a summer season with
greater rainfall, it is likely that leaching would be greater than the 19 kg ha-1 nitrate-N
observed during the 2011 summer season.
During the summer season, a total of 31 mm of fresh water was applied to Field J
through the center pivot irrigation system (Figure 3-3). The mean fresh water applied on
a single day was 4 mm. This amount was less than the mean rainfall event on a single
day during the summer season (10 mm). Fresh water was primarily applied later in the
summer season with almost all applications in late August and September. Because
fresh water was applied in smaller quantities compared to rainfall events, it was not
likely that fresh water application was a cause of leaching.
The reference evapotranspiration rate for the summer season was 3.95 mm day-1
(FAWN, 2012). The corn crop coefficients for the first 40 days of the season were 0.7
and 1.1 for the remainder of the season (SCS, 1967). The total crop evapotranspiration
for the summer season was 286 mm. Total rainfall (378 mm) and freshwater irrigation
(31 mm) provided 409 mm of water to the corn crop. Considering manure effluent
applications added additional water to the crop, the water applied to Field J was greater
than evapotranspiration losses. Therefore, leaching during the summer season was
expected.
In Boigneville, France, Constantin et al. (2010) reported a mean 14 kg ha-1 year-1
N leached on a no-till field with a cover crop. Cover crops and no-till systems were
found to be efficient techniques for reducing N leaching. Although leaching over the
Page 92
92
summer season at the Dairy Unit was greater than the 14 kg ha-1 year-1 N reported by
Constantin et al. (2010), it was less than the mean N leached (32 kg ha-1 year-1) on all
experiment sites.
Leaching events during the summer silage corn season can best be explained by
high rainfall events. Because the quantity of the few manure effluent applications was
similar to manure effluent application rates in the spring season which only had 1.9 kg
ha-1 nitrate-N leached, manure effluent was not a likely cause of N leaching during the
summer. Freshwater irrigation was also in smaller quantities than rainfall events.
Leaching during the summer silage corn season was more likely caused by the
saturation of soil pores due to rainfall or a combination of rainfall, freshwater irrigation,
and manure effluent.
Hypothesis #1 stated “N fertilizer application to the fields is greater than the IFAS
recommendation due to overestimated gaseous losses. Farm management assumes
40% losses. This leads to an over-fertilization of the crops and leaching of N to
groundwater.” Although N fertilizer applications over the summer season did not exceed
IFAS recommendations, it was possible that excessive N fertilizer applications over the
spring season increased soil nitrate-N in the lower 30 to 60 cm soil profile and resulted
in leaching during the summer season when rainfall was much greater (Figure 3-2)
(Figure 3-4).
Unaccounted-for N
The inputs and measured outputs of the summer season were used to calculate
unaccounted-for N in the summer N mass budget. Unaccounted-for N was calculated by
subtracting the measured outputs of final soil mineral N content, crop N uptake, root and
stubble N uptake, and leaching from the inputs of initial soil mineral N, estimated
Page 93
93
mineralized N, inorganic fertilizer, and atmospheric deposition. For the summer season,
44 kg ha-1 N of the N inputs were unaccounted-for in the N mass balance (Table 3-25).
Unaccounted-for N was composed of gaseous losses.
Unaccounted-for N was lower in the summer season (44 kg ha-1 N) than in the
spring season (119 kg ha-1 N), accounting for 16% of the N outputs in the summer crop
season. Farm management at the Dairy Unit assumed that 12 kg ha-1 N of manure
effluent applications (40% of the 31 kg ha-1 N manure effluent applied) would be lost to
gaseous losses. Unaccounted-for N was greater than gaseous losses assumed by farm
management at the Dairy Unit. Unaccounted-for N was greater than the estimate of 50
to 70% of volatilization from animal manures by Van Horn et al. (1996). The percentage
of unaccounted-for N relative to N outputs, assumed to be gaseous losses, was less
than Hall and Risser’s (1993) estimation of volatilization (25%) in the outputs of a N
mass budget on a Pennsylvania dairy farm. Kuipers et al. (1999) and Bacon et al.
(1990) found a greater percentage of their N mass budgets were unaccounted-for than
the 16% of N outputs as unaccounted-for N in the summer season.
Winter Season
N Inputs
The final soil mineral N content for the summer season was the starting point for
the winter season. The fallow period between the summer harvest on 21 Sept. 2011
and the rye/ryegrass mixture planted on 28 Oct. 2011 was included in the winter
season. There were no inputs into Field J by farm management during the fallow period
between summer corn and winter rye-ryegrass. During the winter season, soil mineral N
content, mineralized N, inorganic N fertilizer, and atmospheric deposition of N provided
inputs of N for the rye/ryegrass winter cover crop.
Page 94
94
Initial soil N content
Initial soil mineral N content for the winter season was 53 kg ha-1 consisting of 47
kg ha-1 nitrate-N and 6 kg ha-1 ammonium-N (Table 3-4, 3-6, and 3-7). Soil TKN
(organic N plus ammonium-N) was 3460 kg ha-1 TKN at the start of the winter season,
but only the ammonium-N in the soil TKN content was readily available to provide N to
the rye-ryegrass mixture (Table 3-8). Soil nitrate-N and soil TKN significantly decreased
(P < 0.0001) with sampling depth (Table 3-9, 3-11). Soil TKN content of the upper 0 to
30 cm was 2350 kg ha-1 TKN; in the lower 30 to 60 cm, it was 1110 kg ha-1 TKN (Table
3-11).
Jokela (1992) measured nitrate-N in the 0 to 150 cm soil profile in November 1987
and October 1988 on a sandy loam soil in Vermont. The experimental plot similar to the
Dairy Unit’s N applications received approximately 240 kg ha-1 year-1 TKN from manure
and 56 kg ha-1 inorganic N fertilizer at planting of summer corn crops. The soil nitrate-N
measured in 1987 was 87 kg ha-1 nitrate-N and 86 kg ha-1 nitrate-N in 1988. Although
Jokela’s measurements of fall season soil nitrate-N were greater than the Dairy Unit’s
47 kg ha-1 nitrate-N measured in September 2011, the measurements at the Dairy Unit
were from the 0 to 60 cm soil profile instead of 0 to 150 cm. When taking into account
Jokela’s (1992) report that very little nitrate-N was measured below 90 cm in the soil
profile, the nitrate-N measured at the Dairy Unit was similar to the 86 to 87 kg ha-1
nitrate-N measured by Jokela (1992) when the difference in soil sampling depth was
taken into account.
Manure effluent and mineralized N
During the fallow period from 21 September to 28 October 2011, no manure
effluent or inorganic fertilizer was applied to Field J. Once the winter rye-ryegrass crop
Page 95
95
was planted on 28 October 2011, a total of 104 kg ha-1 TKN from manure effluent was
applied through the center pivot irrigation system during the winter crop season (Table
3-12). The majority of the manure effluent applications occurred in November and
December, and consisted of 68 and 34 kg ha-1 TKN, respectively (Table 3-12). The N
composition of manure effluent during the winter season was 115 mg L-1 organic N, 93
mg L-1 ammonium-N, and 9 mg L-1 nitrate-N. Daily manure effluent application is shown
in Figure 3-1. Mean manure effluent applied at each application event during the winter
season was 17 kg ha-1 TKN.
A winter soil N mineralization experiment was conducted with the rye-ryegrass
cover crop to determine amounts of mineral N (nitrate-N plus ammonium-N) made
available during the winter growing season. The results of the winter mineralization
experiment are shown in Table 3-26. The design of the summer mineralization
experiment was improved upon for the winter season by taking soil samples when PVC
pipes were installed. Initial soil samples allowed for the change in mineral N
concentration to be recorded over more periods. The results of the winter mineralization
experiment were used to calculate the increase in mineral N in the soil due to
mineralization of manure effluent and organic N in the soil over the time of the
experiment. The calculations used were the same as those used for the summer
mineralization experiment. The change in soil mineral N content and the mean field
mineralization are shown in Table 3-27.
The mean mineralized N of the soil isolated by the PVC pipes installed on 8 Nov.
2011 was 7 kg ha-1 mineral N. The mineral N contents of soil isolated on 8 Nov. 2011
and sampled on 8 Dec. 2011, 8 Jan. 2012, and 9 Feb. 2012 were used as baselines to
Page 96
96
compare against the mineral N content of soil samples taken on 8 Dec. 2011 and soil
isolated by PVC pipes installed on 8 Dec. 2011 and sampled on 8 Jan. 2012 and 9 Feb.
2012.
Between 8 Nov. and 8 Dec. 2011, 82 kg ha-1 TKN manure effluent was added. Soil
samples were taken at each lysimeter location on 8 Dec. 2011. Soil mineral N content of
the soil isolated by PVC pipes installed on 8 Dec. 2011 was measured on 8 Jan. 2012
and 9 Feb. 2012. The baseline changes in the soil mineral N content of soil isolated on
8 Nov. 2011 were subtracted from the change in soil mineral N isolated on 8 Dec. 2011.
By subtracting the baseline, the difference showed only the net mineralization or
immobilization after 8 December. The mean mineralized N for the soil isolated by PVC
pipes installed on 8 Dec. 2011 was 94 kg ha-1 mineral N.
Between 8 Dec. 2011 and 8 Jan. 2012, no manure effluent was added to Field J.
PVC pipes were installed and a soil sample was taken on 8 Jan. 2012 and the isolated
soil was sampled on 9 Feb. 2012. The mineral N content of the soil samples taken on 8
Jan. 2012 and the soil isolated on 8 January and sampled on 9 February was compared
to the baseline mineral N content from the soil isolated on 8 Dec. 2011 and sampled on
8 Jan. 2012 and 9 Feb. 2012. Even though no additional manure effluent was added,
un-mineralized manure effluent from previous time periods and organic N in the soil
were subject to mineralization. The mean mineral N added from mineralization for the
PVC pipes installed at 8 Jan. 2012 was 44 kg ha-1. The total mineralized N over the
winter mineralization experiment was 145 kg ha-1. Figure 3-7 depicts the net
mineralization or immobilization of PVC pipes installed in November, December, and
January.
Page 97
97
Estimated mineralized N during the winter season was greater than the manure
effluent application of 104 kg ha-1 TKN. Continued mineralization of both past manure
effluent applications and the pool of organic N in the soil provided more mineral N than
was applied. This was expected because large manure effluent applications were made
during the spring season and manure effluent was mineralized slowly over time.
The winter mineralization experiment lasted from November 2011 to February
2012. Although the winter season began when the summer silage corn was harvested
on 21 Sept. 2011, Field J received no manure effluent additions during September and
October. The summer mineralization experiment found no mineralized N in October.
Therefore, the winter mineralization experiment was a good estimate of mineralized N
during the winter season. This addition of mineralized N provided N for possible rye-
ryegrass plant uptake over the winter season and was a N input in the winter N mass
balance. Mineralized N was 64% of N inputs for the winter cover crop season. As a
result, Hypothesis #4, “Mineralization of soil organic matter accounts for less than 20%
of the N in the total crop N inputs,” was rejected for this season.
Figure 3-8 shows the results of the soil mineral N content of the PVC pipes
installed at T0. The general trend was an increase in soil mineral N due to net
mineralization from installation to 30 days after installation, a decrease in soil mineral N
or net immobilization from the pipes pulled 30 days after installation to the pipes pulled
90 days after installation. The general trend of the mineral N content was similar to the
results of an incubation trial by Cusick et al. (2006). They found a net mineralization in
the first 21 days, a net immobilization from day 21 to 84, and then a net mineralization
from day 84 to the end of the trial. The results in Figure 3-8 do not show a net
Page 98
98
mineralization in the soil mineral N content 90 days after installation. The cooler weather
of the winter months could have resulted in slowed mineralization. The overall trend in
soil mineral N is consistent with the results of Azeez and Van Averbeke (2010). In the
researchers’ laboratory incubation study, the initial mineral N concentration of 27 mg kg-
1 increased to 186 after 30 days, decreased to 33 mg kg-1 after 70 days, and decreased
further to 20 mg kg-1 after 90 days.
Inorganic N fertilizer
Inorganic N fertilizer was applied to the rye-ryegrass to provide an additional 24
kg ha-1N as (NH4)2SO4 for plant growth. The monthly winter schedule of inorganic N
fertilizer applications is shown in Table 3-13. Granular fertilizer (19-0-0) was broadcast
by tractor only one time to the rye-ryegrass mixture in December.
Annual silage corn N fertilizer application in 2011 was below IFAS recommended
N rates of 470 kg ha-1 N. Because the full amount of allowed N fertilizer was not applied
during the spring plus summer corn seasons, supplemental N fertilizer was allowed to
be applied to the rye-ryegrass winter cover crop. Assuming a 40% loss of N from the
manure applications, 86 kg ha-1 N fertilizer (manure effluent plus inorganic fertilizer) was
available to the rye/ryegrass cover crop. The N fertilizer application was less than the
estimated N uptake by rye/ryegrass receiving wastewater (135 kg ha-1 N) from the Dairy
Unit’s nutrient management plan (Martin, 2000).
Mineralized N estimated from the winter mineralization experiment provided 145
kg ha-1 mineral N to the winter cover crop. The combination of mineralized N and
inorganic N fertilizer provided mineral N (170 kg ha-1 mineral N) greater than the
estimated crop uptake of 135 kg ha-1 N (Martin, 2000). Since manure effluent was the
Page 99
99
primary form of N fertilizer applied at the Dairy Unit, mineralization of organic N was an
important source of N for crop uptake needs.
Atmospheric deposition
Atmospheric deposition of N was an input of the winter rye-ryegrass season. The
winter season was 172 days including the fallow period. Total nitrate-N and ammonium-
N from atmospheric deposition from the winter season was 0.8 kg ha-1 N made up of
0.28 kg ha-1 NH4+-N and 0.56 kg ha-1 NO3
--N (Table 3-14).
N Outputs
The winter rye-ryegrass mixture was harvested on 13 Mar. 2012. The final soil
mineral N content decreased over the winter season. Crop uptake and leaching losses
were measured outputs that decreased the final soil mineral N content. Unaccounted-for
N comprised the N inputs minus the measured outputs of final soil mineral N content,
crop uptake, and leaching.
Final soil N content
In the winter season, the final soil mineral N content was 28 kg ha-1 (Table 3-4).
Soil nitrate-N content of the total 0 to 60 cm soil profile was significantly different (P <
0.0001) between the initial soil nitrate-N content and final soil nitrate-N content (47 vs.
20 kg ha-1 nitrate-N) (Table 3-6). The final soil nitrate-N level was significantly different
(P < 0.0001) between the upper 30 cm (16 kg ha-1 nitrate-N) and the lower 30 to 60 cm
(4 kg ha-1 nitrate-N) of the soil core (Table 3-9). There was a significant difference (P <
0.0001) between the initial soil ammonium-N and final soil ammonium-N measurements
for the total 0 to 60 cm soil profile (Table 3-7). During the winter season, soil
ammonium-N increased from 6 to 8 kg ha-1. The final soil ammonium-N content did not
differ significantly by depth (Table 3-10).
Page 100
100
The final soil TKN content was 3460 kg ha-1 TKN at the end of the winter season.
There was not a significant change from the initial soil TKN content (3460 kg ha-1 TKN)
(Table 3-8). Soil TKN differed significantly (P < 0.0001) by depth. In the 0 to 30 cm soil
profile, soil TKN content was 2560 kg ha-1 TKN at the end of the winter season. In the
30 to 60 cm soil profile, soil TKN content was 900 kg ha-1 TKN (Table 3-11).
Constantin et al. (2010) measured nitrate-N levels of 33 kg ha-1 nitrate-N in mid-
winter on no-till plots with a cover crop (planted late August to September) grown on
soils similar to those at the Dairy Unit. They observed an increase in soil nitrate-N from
sampling in late autumn to mid-winter. The soil nitrate-N content at the Dairy Unit
significantly decreased from the initial winter measurements (47 kg ha-1) to the final
winter measurements (20 kg ha-1) in 2012. Constantin et al. (2010) determined that the
cover crop diminished soil mineral N compared to the non-cover crop treatments in both
late autumn and mid-winter, but more efficiently in late autumn. At the Dairy Unit, winter
initial soil measurements were not reduced by a cover crop, because the initial soil
measurements for the winter season were sampled in September before the winter rye-
ryegrass was planted.
Woodard et al. (2003) reported rye to be highly effective at controlling nitrate-N
leaching. Rye was reported to extract large amounts of N from the soil as well as soil
moisture. Mineralized N contributed 145 kg ha-1 mineral N to the soil profile over the
winter crop season. Despite the addition of mineralized N, there was a net loss of 25 kg
ha-1 soil mineral N over the winter season. Possible soil mineral N fates were crop
uptake, leaching, or gaseous losses.
Page 101
101
Crop uptake
The dry weight yield for the winter rye-ryegrass mixture was calculated from the
samples of the harvested portion of the rye-ryegrass mixture taken on 17 and 20 Feb.
2012. The stubble and roots of the rye-ryegrass mixture were not included in the dry
weight yield for the winter crop. The dry weight yield for the winter rye-ryegrass was 4.1
Mg ha-1 (Table 3-15). The Dairy Unit’s dry weight harvested yield (2.4 Mg ha-1) was less
than the calculated yield from the rye-ryegrass samples. Differences in yield between
the rye-ryegrass dry weight yield and the Dairy Unit’s dry weight harvested yield were
due to the crop drying down between the sampling date (17 and 20 February) and final
commercial harvested on 12 March 2012.
Harvested crop uptake contained the total N (organic N plus nitrate-N) found in the
plant tissue of the harvested portion of the rye-ryegrass mixture. The total N removed by
rye-ryegrass harvested crop uptake from the winter season was 79 kg ha-1 N (Table 3-
19). The total plant crop uptake was 128 kg ha-1 N made up of 79 kg ha-1 N of harvested
crop uptake and 49 kg ha-1 N of root and stubble uptake (Table 3-19). The harvested
portion of the rye-ryegrass was 62% of the total plant crop uptake for the rye-ryegrass
mixture. The root N uptake was 27 kg ha-1 N; the stubble N uptake was 22 kg ha-1 N
(Table 3-28). The root and stubble uptake for the winter rye-ryegrass was an output of
the winter season for the N mass budget.
Van Horn et al. (1996) grew corn silage and Abruzzi rye in Tifton, GA. These
researchers found rye crop N uptake of 53 to 249 kg ha-1 with manure effluent
applications of 240 to 990 kg ha-1yr-1 N. In the treatment most similar to the manure
application of the Dairy Unit, Van Horn et al. (1996) applied 493 kg ha-1yr-1 N from
manure effluent and returned 172 kg ha-1 N of Abruzzi rye crop uptake. The rye-
Page 102
102
ryegrass harvested crop uptake (79 kg ha-1 N) at the Dairy Unit was lower than Van
Horn’s results with similar manure effluent application.
The mineral N (nitrate-N plus ammonium-N) available for crop uptake (196 kg ha-1)
was from depletion of soil mineral N (25 kg ha-1, the difference between initial and final
soil mineral N), estimated mineralized N (145.8 kg ha-1), inorganic fertilizer (24 kg ha-1
N), and atmospheric deposition (0.8 kg ha-1 N). Rye-ryegrass total crop uptake was
128.3 kg ha-1 N, leaving 67.3 kg ha-1 N subject to leaching or gaseous losses.
The NUE of the winter rye-ryegrass was calculated by dividing 79 kg ha-1 N crop
uptake by the manure effluent N application of 104 kg ha-1 TKN plus the inorganic N
fertilizer application of 24 kg ha-1 N. The calculated NUE of the winter rye-ryegrass was
62%. Raun and Johnson (1999) reported a worldwide NUE estimate for rye as 33%.
Because mineralized N provided the majority of crop available mineral N, the NUE was
difficult to evaluate without an unfertilized rye-ryegrass plot to compare to. NUE would
have been lower if the yield from an unfertilized plot had been subtracted from the
numerator of the calculation.
Leaching
All 12 lysimeters yielded observations during the winter crop season. The mean of
these loads was then calculated to obtain the winter leaching total load. The mean
leaching load for the winter season including the fallow period was 1.9 kg ha-1 nitrate-N
(Table 3-20). Two leaching events were observed during the fallow period on 2 Oct.
2011 (0.05 kg ha-1 nitrate-N) and 13 Oct. 2011 (0.83 kg ha-1 nitrate-N) (Figure 3-3).
Although leaching events were more frequent in the winter season as seen in Figure 3-
3, the nitrate-N load leached was similar to the spring season when there was only one
leaching event. The mean nitrate-N concentration of leaching events during the winter
Page 103
103
season was 62 mg L-1 (Table 3-21). The nitrate-N concentrations were variable with a
range of 0.01 to 164.21 mg L-1.
Rainfall over the winter season was 413 mm (Figure 3-9) with one high rainfall
event on 20 January 2012 (137 mm) (Figure 3-3), but overall quantity of leachate
recorded was low compared to the summer season. Rainfall during the winter season
was 39 mm above the 5-year historical mean for the same time period 21 September to
12 March (Figure 3-9).
A total of 118 mm of fresh water was applied to Field J through the center pivot
irrigation system (Figure 3-3). The mean fresh water applied on a single day was 10
mm. This amount was the same as the mean rainfall event on a single day during the
summer season (10 mm). Fresh water was primarily applied later in the summer season
with almost all applications in January and February. Fresh water was applied in larger
quantities compared to rainfall events (5 mm mean, excluding the 136 mm rainfall event
on 20 Jan. 2012). It is likely that fresh water application contributed to leaching, but the
leachate N concentration was low and so total N leaching was less than 1% of N
outputs for the winter N mass balance.
During the fallow season, evaporation from the soil was approximately 14 mm total
over the 38 day fallow period. During the winter rye-ryegrass crop season, the daily
reference evapotranspiration rate was 1.5 mm day-1 in Alachua County (FAWN, 2012).
Taking into account pasture crop coefficients of 0.8 for the season, total
evapotranspiration during the winter season was 164 mm (SCS, 1967). Freshwater
irrigation provided 118 mm of water in addition to 325 mm of rainfall. Approximately 280
mm of water was applied above the crop needs and was subject to leaching.
Page 104
104
Woodard et al. (2003) reported rye’s excellent ability to control N leaching by
removing N and water from the soil. The 128 kg ha-1 N total crop uptake left 60 kg ha-1
mineral N (of the available 189 kg ha-1 mineral N) subject to leaching and gaseous
losses. The leaching losses (1.9 kg ha-1 total N) only accounted for a small portion of
the left over 60 kg ha-1 mineral N. It must be concluded that the majority of left over
mineral N was lost to gaseous losses.
During the fallow period from 21 Sept. to 28 Oct. 2011, 0.9 kg ha-1 N was leached.
There was 103 mm of rainfall during this time period. No freshwater irrigation or manure
effluent applications were made during the fallow period as per the nutrient
management plan’s stipulation that manure effluent and fresh water only be applied to
actively growing crops. The last manure effluent application during the summer season
was on 3 Aug. 2011, 47 days before the summer silage corn was harvested. The
hypothesis (#3), “Manure effluent application late in the growing season increases the
likelihood of leaching losses in the fallow season,” was not applicable, because manure
effluent was not applied late in the growing season.
The hypothesis (#2), “Leaching losses of N are mostly associated with rainfall after
the crop is harvested and not with excessive irrigation during the growing season,” was
rejected. Leaching losses during the fallow period were only 4% of the total leaching
losses for the 2011-2012 crop system. 96% of N leaching occurred during the growing
season. It does appear that rainfall was the main cause of leaching during the fallow
period since no freshwater irrigation or manure effluent was applied.
Unaccounted-for N
The inputs and measured outputs of the winter season were used to calculate
unaccounted-for N in the winter N mass budget. Unaccounted-for N was calculated by
Page 105
105
subtracting the measured outputs of final soil mineral N, harvested crop uptake, root
and stubble uptake, and leaching from the inputs of initial soil mineral N, mineralized N,
inorganic fertilizer, and atmospheric deposition. Unaccounted-for N was 66 kg ha-1 N in
the winter rye/ryegrass season (Table 3-30).
Unaccounted-for N was composed of gaseous losses from volatilization and
denitrification. Typically, volatilization slows during the winter crop season due to cooler
temperatures (Van Horn et al., 1996). Farm management at the Dairy Unit used the
same estimate for gaseous losses (40%) from manure effluent application year-round.
The Dairy Unit estimated 42 kg ha-1 N of manure effluent would be lost to gaseous
losses during the winter season. Unaccounted-for N (66 kg ha-1) was slightly more than
the farm management’s estimated manure effluent losses.
Rye-ryegrass available mineral N for crop uptake was composed of mineral N from
initial soil mineral N (53 kg ha-1), mineralized N (145 kg ha-1), inorganic fertilizer (24 kg
ha-1), and atmospheric deposition (0.8 kg ha-1). Of the known available mineral N, 128
kg ha-1 mineral N was taken up by crops and, 28 kg ha-1 mineral N remained in the soil,
very little of it was leached (2 kg ha-1 nitrate-N). Using these data, approximately 66 kg
ha-1 mineral N was lost to the environment by gaseous losses and was unaccounted-for
N.
Assuming all unaccounted-for N was gaseous losses, they were 29% of the N total
outputs (224 kg ha-1) for the winter N mass budget. This estimation was slightly higher
than Hall and Risser’s (1993) estimation of volatilization (25%) in the outputs of a N
mass budget on a Pennsylvania dairy farm. Unaccounted-for gaseous losses were
within the range Van Horn et al. (1996) estimated 50 to 70% for volatilization from
Page 106
106
animal manures. Since greater than 40% of manure effluent applications were gaseous
losses, then we reject the hypothesis (#1), “Fertilizer N application to the fields is
greater than the IFAS recommendation due to overestimated gaseous losses. Farm
management assumes 40% losses. This leads to an over-fertilization of the crops and
leaching of N to groundwater.” Gaseous losses were greater than 40% during the winter
season. Farm management underestimated gaseous losses in the winter season, but
instead of over-fertilization, soil N was depleted and leaching was minimal. Mineralized
N over the winter season provided substantial mineral N for crop uptake.
2011- 2012 Cropping System Mass Balance
N Inputs
The N mass balance for the 2011-2012 cropping system is shown in Table 3-31.
Crop available N inputs over the 2011-2012 cropping system were 286 kg ha-1 mineral
N from the soil, 407 kg ha-1 N from mineralized N, 138 kg ha-1 N from inorganic fertilizer,
plus 1.7 kg ha-1 N from atmospheric deposition (Table 3-31). The initial soil mineral N
content was higher than expected because soil samples were taken a month after the
spring silage corn was planted. Manure effluent (74 kg ha-1 TKN) and inorganic fertilizer
(35 kg ha-1 N) were applied to the crop before soil sampling, increasing the initial soil
mineral N content. Van Horn et al. (1996) found soil mineral N content was 57 kg ha-1 N
for the medium manure application rate of 600 kg ha-1 N per year. The findings of Van
Horn et al. were comparable to the Dairy Unit’s final soil mineral N content (28 kg ha-1
N), but the Dairy Unit’s initial soil mineral N content was more than 7 times the mineral
N found by Van Horn et al. (57 kg ha-1 N).
Using an estimation of 40% losses from application of manure effluent, the farm
management determined the total N fertilizer applied was 430 kg ha-1 N. Farm
Page 107
107
management considered 40% to be a conservative estimate from the 45-50%
volatilization loss estimation specified in their comprehensive nutrient management plan
(Martin, 2000). N fertilizer application fell within the UF IFAS recommended guidelines
for yearly application of N fertilizer to irrigated silage corn of 470 kg ha-1 N. Spring N
fertilizer application (270 kg ha-1 N) exceeded the IFAS recommendation for an irrigated
corn crop (235 kg ha-1 N). More equal distribution of N fertilizers over the two silage corn
crops might increase the summer crop yields.
Inorganic N fertilizer was 17% of N inputs in the N mass balance (Table 3-31).
Reducing inorganic N fertilizer could have a cost benefit to farm management since it is
the only N input which the Dairy Unit must purchase from off the farm. Whereas the cost
of application of manure effluent for forage corn production is only determined by the
overhead expense of operating the irrigation system, the cost of inorganic N fertilizer is
determined by the variable costs of the amount of fertilizer purchased, equipment costs
to apply the fertilizer, and the number of applications.
During the soil N mineralization experiments, 407 kg ha-1 mineralized N was a
measured N input during the 2011-2012 crop system. A lack of fertilizer or manure
effluent additions for long time periods could result in little to no mineralized N available
for plant uptake. This was seen during October in the summer mineralization
experiment. Atmospheric deposition had very little impact on the N inputs of the
cropping system accounting for less than 1% of total N inputs (Table 3-31).
The mean monthly mineralized N from the summer and winter mineralization
experiments was 38 kg ha-1 mineral N. Using this estimate, the mineralized N for the
spring season would have been 125 kg ha-1 mineral N (approximately 3.3 months in the
Page 108
108
spring season). This was less than the estimated mineralized N (204 kg ha-1
ammonium-N) from the spring season used in the spring N mass budget. Manure
effluent applications during the spring season were much larger than either the summer
or the winter applications. It would be expected that mineralized N for the spring season
would be greater than what was seen in the summer and winter mineralization
experiments for this reason. Although mineralized N was highly variable and dependent
on many changing climactic factors, the estimated mineralized N used for the spring
season seems reasonable.
N Outputs
During the 2011-2012 cropping system, there was a build-up of soil TKN content
due to manure applications, but soil mineral N content decreased over the crop season.
The final soil mineral N content was 28 kg ha-1 N (Table 3-31) which meant 258 kg ha-1
N was removed by crop uptake, leaching, and gaseous losses. The Dairy Unit applied
626 kg ha-1 total N fertilizers over the entire corn-corn-rye and ryegrass cropping system
(Table 3-31). The total harvested crop uptake was 423 kg ha-1 N. Dry matter yields were
less than those measured by the 2011 Corn Silage Field Day Corn Hybrid Variety Test
(UF DAS, 2011). The silage corn dry harvested yield at the Dairy Unit was 15.1 Mg ha-1
versus the mean yield of the variety trial of 20.2 Mg ha-1 for the spring and 11.7 Mg ha-1
versus the mean yield of the variety trial of 14.8 Mg ha-1 for the summer.
The Dairy Unit’s harvested crop uptake represented a 68% N recovery or NUE
(423 kg ha-1 N harvested crop uptake/ 626 kg ha-1 N fertilizers). The total plant crop
uptake (harvested crop uptake plus root and stubble uptake) was 554 kg ha-1 N,
representing 51% of the total outputs. In a corn-corn-rye and clover cropping system in
Tifton, GA, Newton et al. (2003) applied 560 kg ha-1 N of dairy manure and commercial
Page 109
109
fertilizer and harvested 384 kg ha-1N total crop uptake. They reported a 69% recovery of
N fertilizer applied, very similar to the results found at the Dairy Unit. The NUE (68%) for
the 2011-2012 cropping system was close to apparent N recovery (72%) at the optimal
N fertilizer rate found by Meng et al. (2012). Harvested crop uptake (423 kg ha-1 N)
during the 2011-2012 cropping system was greater than the N uptake estimated by the
Dairy Unit’s comprehensive nutrient management plan (409 kg ha-1 N for corn silage-
corn silage-rye)(Martin, 2000).
Leaching over the 2011-2012 cropping system was a small part of the total N
mass balance, only 3% of N outputs (Table 3-31). The mean rainfall in the spring and
summer seasons was below average and resulted in fewer leaching events. Average to
high rainfall would likely have caused much greater N leaching especially during the
spring season when large amounts of manure effluent were applied. Although rainfall
during the winter 2011-2012 season was above the historical 5-year average (Figure 3-
9), N leaching was 2 kg ha-1 N. During the fallow period from 21 Sept. to 28 Oct. 2011,
there was little leaching most likely due to the low mineral N content of the soil (53 kg
ha-1 N) and the low manure effluent application during the summer season (31 kg ha-1
N). If manure effluent applications were increased over the summer season, leaching
during the fallow period could increase.
Figure 3-3 shows daily rainfall, freshwater irrigation, manure effluent applications,
and leaching events. Yearly leaching was determined to be 23 kg ha-1 nitrate-N (Table
3-31). In France, Constantin et al. (2010) found a similar mean N leachate of 27 kg ha-1
yr-1 N. They reported leaching to be highly variable, ranging from 11 to 71 kg ha-1 yr-1 N,
depending on climate, site, and crop type. Rotz et al. (2005) estimated leaching to be 45
Page 110
110
kg ha-1 yr-1 nitrate-N on a non-grazed, grass and maize silage simulated dairy farm. The
estimation of leaching load by Rotz et al. (2005) is greater than the 23 kg ha-1 nitrate-N
leached during the year on Field J at the Dairy Unit. Measuring leaching over a year
with higher rainfall could result in estimates similar to Rotz et al. (2005).
In Germany, annual leaching rates for arable sandy soils were 63 kg ha-1 nitrate-N
(Richter and Roelcke, 2000). This exceeds the annual leaching of total N found at the
Dairy Unit in 2011 of 23 kg ha-1 nitrate-N. Richter and Roelcke (2000) calculated surplus
N to be the difference between total inputs of inorganic fertilizer, manures, and
atmospheric deposition and N removed by the harvested part of crops. The mean N
surplus for arable crops in Germany in recent decades was 110 to 130 kg ha-1 yr-1 N.
When using the same calculation for the Dairy Unit’s N surplus [(488 kg ha-1 yr -1 N
manure effluent, 138 kg ha-1 yr-1 N inorganic fertilizer, 1.7 kg ha-1 yr-1 N atmospheric
deposition)- 423 kg ha-1 yr-1 N harvested crop uptake), a N surplus of 205 kg ha-1 yr -1 N
was calculated (Table 3-31). Differences in the agricultural systems of Germany versus
the Dairy Unit are evident from the estimates Richter and Roelcke (2000) make of
gaseous losses. Gaseous losses are estimated to be less than 20 kg ha-1 yr-1 N for
arable systems in Germany (Richter and Roelcke, 2000). The climate and soil type of
northeast Florida causes gaseous losses to be a much greater output of N in the N
mass balance than it is in Germany.
Unaccounted-for N over the entire crop year was 229 kg ha-1 N or 27% of the total
outputs for the N mass budget (Table 3-31). The percentage of harvested crop uptake
(51%) of the Dairy Unit’s budget was greater than Hall and Risser’s (1993) findings of
37% of mean annual N outputs from harvested crops on a Pennsylvania dairy farm.
Page 111
111
They found the percentage of N leaching to be much higher (38%) than the Dairy Unit’s
N leached (3%) although rainfall was lower than historical averages in the spring and
summer seasons in Alachua County. Unaccounted-for N (27%) at the Dairy Unit was
approximately the same as the estimated volatilization losses (25%) of Hall and Risser
(1993).
The large amount of unaccounted-for N during the spring season (53% of total
unaccounted-for N) appeared to be a direct result of the high manure effluent
application during that season. Reducing manure effluent application would likely have
resulted in less unaccounted-for N without impacting silage corn yield. During the winter
mineralization experiment, greater manure effluent application (104 kg ha-1 N) resulted
in more (146 kg ha-1) mineralized N as opposed to the summer experiment which had
31 kg ha-1 N of manure effluent applied and resulted in 57 kg ha-1 mineralized N. Spring
crop loading of manure effluent above the crop requirement did not increase soil mineral
N or significantly increase soil TKN. Therefore, N from applied manure effluent was
subject to gaseous losses since little N was found in leaching.
Page 112
112
Table 3-1. Physical and chemical properties of topsoil at lysimeter locations on 14 June 2012
Lysimeter Location
A B C D E F Mean
pHw 7.4 7.3 7.6 7.7 7.4 7.7 7.5
% OMx 2.44 2.1 1.76 1.22 1.83 2.04 1.90
ECy, dS m-1 0.13 0.11 0.12 0.10 0.09 0.10 0.11
Mehlich-1z P, mg kg-1 719 796 860 558 615 605 692
Mehlich-1z K, mg kg-1 129 88 93 124 103 123 110
Mehlich-1z Mg, mg kg-1 316 287 322 281 305 373 314
Mehlich-1z Ca, mg kg-1 1944 2016 2057 1553 1755 2197 1920
Mehlich-1z Cu, mg kg-1 0.07 0.16 0.11 0.12 0.11 0.02 0.10
Mehlich-1z Mn, mg kg-1 19.75 20.28 17.03 16.66 18.88 22.96 19.26
Mehlich-1z Zn, mg kg-1 8.75 10.46 11.28 10.04 8.74 8.27 9.59 wpH (1:2 soil: deionized H2O ratio)
xOM- Walkley-Black Method (Mylavarapu, 2002)
yEC (1:2 soil:water) soluble salts
zMehlich-1 (Mehlich, 1953)
Table 3-2. Bulk density of soil samples (0-60 cm) on four sampling dates
Lysimeter Locations Field Mean STDEV
Time g cm-3
4/14/2011 1.4 0.14
7/1/2011 1.5 0.16
9/29/2011 1.5 0.17
3/16/2012 1.5 0.12
Table 3-3. Bulk density of soil samples by depth
Field Mean STDEV
Depth g cm-3
0-30 cm 1.5 0.17
30-60 cm 1.6 0.13
P < 0.0001
Table 3-4. Soil mineral N (nitrate-N plus ammonium-N) content in the 0 to 60 cm soil
profile by season
Initial 0-60 (cm) STDEV
Final 0-60 (cm) STDEV P
N (kg ha-1)
N (kg ha-1)
Spring 286 42 165 58 < 0.0001
Summer 165 58 53 22 < 0.0001
Winter 53 22 28 14 < 0.0001
Page 113
113
Table 3-5. Soil mineral N (nitrate-N plus ammonium-N) content divided into 30 cm
increments by season
Initial STDEV Final STDEV P
N (kg ha-1) N (kg ha-1)
-----------------------------------0-30 (cm)--------------------------------
Spring 161 23 87 40 < 0.0001
Summer 87 40 33 13 < 0.0001
Winter 33 13 21 12 0.0002
----------------------------------30-60 (cm)------------------------------
Spring 125 22 78 28 < 0.0001
Summer 78 28 20 12 < 0.0001
Winter 20 12 7 2 < 0.0001
Table 3-6. Soil nitrate-N content in the 0 to 60 cm soil profile by season
Initial 0-60 (cm)
STDEV
Final 0-60 (cm)
STDEV P
kg ha-1 kg ha-1
Spring 113 18 100 47 NS
Summer 100 47 47 21 < 0.0001
Winter 47 21 20 13 < 0.0001
Table 3-7. Soil ammonium-N content in the 0 to 60 cm soil profile by season
Initial 0-60 (cm)
STDEV
Final 0-60 (cm)
STDEV P
kg ha-1 kg ha-1
Spring 173 38 66 23 < 0.0001
Summer 66 23 6 2 < 0.0001
Winter 6 2 8 3 < 0.0001
Table 3-8. Soil TKN content in the 0 to 60 cm soil profile by season
Initial 0-60 (cm) STDEV
Final 0-60 (cm)
STDEV P
kg ha-1 kg ha-1
Spring 3310 660 3430 700 NS
Summer 3430 700 3460 540 NS
Winter 3460 540 3460 550 NS
Page 114
114
Table 3-9. Soil nitrate-N content in 0 to 30 cm and 30 to 60 cm soil profile by sampling date
0-30 (cm) STDEV 30-60 (cm) STDEV P
kg ha-1
kg ha-1
4/14/2011 73 10 40 14 < 0.0001
7/1/2011 56 32 44 27 < 0.0001
9/29/2011 30 13 18 11 < 0.0001
3/16/2012 16 12 4 2 < 0.0001
Table 3-10. Soil ammonium-N content in 0 to 30 cm and 30 to 60 cm soil profile by
sampling date
0-30 (cm) STDEV 30-60 (cm) STDEV P
kg ha-1
kg ha-1
4/14/2011 88 20 85 21 NS
7/1/2011 31 13 35 13 NS
9/29/2011 3 1 2 1 NS
3/16/2012 5 2 3 1 NS
Table 3-11. Soil TKN content in 0 to 30 cm and 30 to 60 cm soil profile by sampling
date
0-30 (cm) STDEV 30-60 (cm) STDEV P
kg ha-1
kg ha-1
4/14/2011 2410 530 900 180 < 0.0001
7/1/2011 2370 680 1060 320 < 0.0001
9/29/2011 2350 480 1110 250 < 0.0001
3/16/2012 2560 380 900 250 < 0.0001
Table 3-12. Manure effluent N (TKN) application by month
Spring TKN Summer TKN Winter TKN
kg ha-1 kg ha-1 kg ha-1
March 46 July 9 October 0
April 91 August 22 November 68
May 142 September 0 December 34
June 74
January 0
February 2
Spring Total 353 Summer Total 31 Winter Total 104
Page 115
115
Table 3-13. Inorganic N fertilizer (Total N) application by month
Spring N Summer N Winter N
kg ha-1 kg ha-1 kg ha-1
March 35 July 34 October 0
April 24 August 22 November 0
May 0 September 0 December 24
June 0
January 0
February 0
Spring Total 59 Summer Total 56 Winter Total 24
Table 3-14. Wet ion deposition by season (NADP, 2011)
NH4+ NO3- Total N
---------- kg ha-1 ----------
Spring 0.2 0.3 0.5
Summer 0.1 0.3 0.4
Winter 0.2 0.4 0.7
Table 3-15. Crop dry weight yield by season
Mean Yield STDEV
Mg ha-1
Spring Sampling 15.2 3.1
Dairy Unit 8.8
Summer Sampling 11.8 1.0
Dairy Unit 7.6
Winter Sampling 4.1 0.8
Dairy Unit 2.4 Note: Sampling yields were calculated from harvested portion of plants sampled. Dairy Unit yield was measured by farm management at commercial harvest. Silage corn was grown during the spring and summer seasons. A rye/ryegrass cover crop was grown during the winter season.
Table 3-16. University of Florida corn silage variety trial dry matter yields and crude
protein concentration in 2011 (UF DAS, 2011)
Mean Yield STDEV Crude Protein STDEV
Mg ha-1
%
Spring 20.2 1.1 8.00 0.22
Summer 14.8 0.9 7.34 0.36 Note: Corn silage variety trials were conducted at the Plant Science Research and Education Unit in Citra, FL. Corn was fertilized with 235 kg ha
-1 N and harvested at 35% dry matter. For the spring season,
corn was planted on 16 Mar. 2011 and harvest dates were from 24 to 30 June 2011. For the summer season, corn was planted on 13 July 2011 and harvest dates were from 7 to 19 Oct. 2011.
Page 116
116
Table 3-17. Mean N content of dry silage corn plant parts by season
Spring STDEV Summer STDEV P
N (kg ha-1)
N (kg ha-1)
Leaves 68.6 18.6 42.1 3.7 < 0.0001
Stalks 33.1 6.8 13.4 3.9 < 0.0001
Ears 99.9 19.6 86.6 9.5 0.0461
Stubble 17.3 4.6 3.9 2.7 < 0.0001
Roots 44.9 11.4 15.6 3.3 < 0.0001
Table 3-18. Mean N concentration of silage corn plant parts by season
Spring STDEV Summer STDEV P
%N
%N
Leaves 2.18 0.23 1.77 0.23 0.0002
Stalks 0.98 0.16 0.47 0.15 < 0.0001
Ears 1.17 0.07 1.34 0.06 < 0.0001
Stubble 2.01 0.50 0.49 0.31 < 0.0001
Roots 1.40 0.20 0.85 0.14 < 0.0001
Table 3-19. Harvested crop uptake and root and stubble uptake (N kg ha-1) on Field J
at the Dairy Unit by season
Harvested Crop Uptake STDEV Root and Stubble Uptake STDEV
N (kg ha-1 ) N (kg ha-1 )
Spring 202 38 62 14
Summer 142 14 20 5
Winter 79 16 49 12
Table 3-20. Sum of leachate loads (N kg ha-1) over 2011-2012 season
Leachate Load STDEV
N (kg ha-1)
Spring 1.9 3.5
Summer 18.8 20.2
Winter 1.9 2.2
Table 3-21. Nitrate-N concentration (mg L-1) of leaching events by season
Nitrate-N Concentration
mg L-1 STDEV Range
Spring 34.63 26.74 1.66-57.66
Summer 65.84 37.19 10.30-148.79
Winter 62.44 42.19 0.01-164.21
Page 117
117
Table 3-22. N mass balance of spring silage corn crop at the Dairy Unit
Inputs
Outputs
N (kg ha-1)
N (kg ha-1)
Initial Soil Mineral N 286
Final Soil Mineral N 165
Mineralized N 204
Harvested Crop Uptake 202
Inorganic N Fertilizer 59
Root and Stubble Uptake 62
Atmospheric Deposition 1
Leaching nitrate-N Load 2
Unaccounted-For N 119
Table 3-23. Soil mineral N (nitrate-N plus ammonium-N) content of each location over
three time periods for the summer mineralization experiment on Field J at the Dairy Unit
Summer Soil Mineral N Content
Field Mean STDEV
N (kg ha-1)
Installed July
Pulled Aug. 64 25
Pulled Sept. 53 38
Pulled Oct. 71 39
Installed Aug.
Pulled Sept. 60 27
Pulled Oct. 84 28
Installed Sept. Pulled Oct. 56 18
Note: Installation and removal of PVC pipes was on the 24th day of each month. 9 kg ha
-1 N of manure
effluent was added in the month before 24 July 2011. 22 kg ha-1
N of manure effluent was added between 24 July and 24 Aug. 2011. No manure effluent was added after 24 Aug. 2011 for the remainder of the summer mineralization experiment. Soil Mineral N contents represent the kg ha
-1 N in the upper 60 cm of
the soil profile with a soil bulk density of 1.5 g cm-3
.
Page 118
118
Table 3-24. Change in soil mineral N content over three time periods for the summer mineralization experiment on Field J at the Dairy Unit
Change in Soil Mineral N Content
Field Mean
Installed July
N (kg ha-1)
Pulled Aug. 64
Pulled Sept. 53 -11
Baseline for Installed Aug.
Pulled Oct. 71 +18
Baseline for Installed Aug.
Mineralized N 18
Installed Aug.
Pulled Sept. 60 8 +19
Pulled Oct. 84 24 +5
Baseline for Installed Sept.
Mineralized N 24
Installed Sept.
Pulled Oct. 56 -28 -33
Mineralized N
0
Net Mineralization 43 Note: Installation and removal of PVC pipes was on the 24
th day of each month. Baselines are the change from the previous installed set. Positive
incremental changes denote net mineralization for the time period. Negative incremental changes denote net immobilization for the time period. Net Mineralization is the sum of positive incremental changes.
Page 119
119
Table 3-25. N mass balance of summer silage corn crop at the Dairy Unit
Inputs
Outputs
N (kg ha-1)
N (kg ha-1)
Initial Soil Mineral N 165
Final Soil Mineral N 53
Mineralized N 57
Harvested Crop Uptake 142
Inorganic N Fertilizer 56
Roots and Stubble Uptake 20
Atmospheric Deposition 0
Leaching nitrate-N Load 19
Unaccounted-For N 44
Note: Atmospheric deposition was calculated to be 0.4 kg ha-1
N from estimates of wet deposition from the National Atmospheric Deposition Program (NADP, 2011).
Table 3-26. Soil mineral N content of each location over three time periods for the
winter mineralization experiment on Field J at the Dairy Unit
Soil Mineral N Content
Field Mean STDEV
N (kg ha-1)
Installed Nov.
Pulled Nov. 70 22
Pulled Dec. 77 36
Pulled Jan. 59 28
Pulled Feb. 41 12
Installed Dec.
Pulled Dec. 43 34
Pulled Jan. 119 55
Pulled Feb. 67 46
Installed Jan. Pulled Jan. 48 12
Pulled Feb. 57 22 Note: Installation and removal of PVC pipes was on the 8
th day of each month with the exception of 9
Feb. 2011. 20 kg ha-1
N of manure effluent was added in the month before 8 Nov. 2011. 82 kg ha-1 N of manure effluent was added between 8 Nov. and 8 Dec. 2011. No manure effluent was added between 8 Dec. and 8 Jan. 2011. 2 kg ha-1 N of manure effluent was added between 8 Jan. and 9 Feb. 2011. Soil Mineral N contents represent the kg ha
-1 N in the upper 60 cm of the soil profile with a soil bulk density of
1.5 g cm-3
.
Page 120
120
Table 3-27. Change in the soil mineral N content over three time periods for the winter mineralization experiment on Field J at the Dairy Unit
Change in Soil Mineral N Content
Field Mean
Installed Nov.
N (kg ha-1)
Pulled Nov. 70
Pulled Dec. 77 +7
Pulled Jan. 59 -19
Baseline for Installed Dec.
Pulled Feb. 41 -17
Baseline for Installed Dec.
Mineralized N 7
Installed Dec.
Pulled Dec. 43 -34 -41
Pulled Jan. 119 76 +94
Baseline for Installed Jan.
Pulled Feb. 67 -52 -35
Baseline for Installed Jan.
Mineralized N 94
Installed Jan.
Pulled Jan. 48 -71
-165
Pulled Feb. 57 10 +44
Mineralized N
44
Net Mineralization 146 Note: Installation and removal of PVC pipes was on the 8
th day of each month with the exception of 9 Feb. 2011. Baselines are the mineral N
change from the previous set during the same time period. Positive incremental changes denote net mineralization for the time period. Negative incremental changes denote net immobilization for the time period. Net Mineralization is the sum of positive incremental changes.
Page 121
121
Table 3-28. N content of rye/ryegrass plant parts
Total N STDEV
N (kg ha-1)
Harvested 79 16
Stubble 22 6
Roots 27 9
Table 3-29. Mean percent N concentration of rye-ryegrass plant parts
Harvested STDEV Stubble STDEV Roots STDEV
% N
% N
% N
Winter 1.93 0.22 1.69 0.25 1.34 0.17
Table 3-30. N mass balance of winter rye/ryegrass crop at the Dairy Unit
Inputs
Outputs
N (kg ha-1)
N (kg ha-1)
Initial Soil Mineral N 53
Final Soil Mineral N 28
Mineralized N 146
Harvested Crop Uptake 79
Inorganic N Fertilizer 24
Roots and Stubble Uptake 49
Atmospheric Deposition 1
Leaching nitrate-N Load 2
Unaccounted-For N 66
Table 3-31. Overall N mass balance of 2011-2012 corn-corn-rye/ryegrass cropping
system at the Dairy Unit
Inputs
Outputs
N (kg ha-1)
N (kg ha-1)
Initial Soil Mineral N 286
Final Soil Mineral N 28
Mineralized N 407
Harvested Crop Uptake 423
Inorganic N Fertilizer 139
Root and Stubble Uptake 131
Atmospheric Deposition 2
Leaching nitrate-N Load 23
Unaccounted-For N 229
Page 122
122
Figure 3-1. Manure effluent daily N application
0
5
10
15
20
25
30
35
40
2/26/11 4/17/11 6/6/11 7/26/11 9/14/11 11/3/11 12/23/11 2/11/12
Dail
y M
an
ure
Eff
lue
nt
Ap
plic
ati
on
(kg
ha
-1)
Date
Manure effluent N (kg ha-1)
Page 123
123
Figure 3-2. Historical rainfall by year (2007-2011) from March 15 to June 25 in Alachua
county (FAWN, 2012)
Page 124
124
Figure 3-3. N leaching versus rainfall, fresh water irrigation, and manure effluent application (kg ha-1)
1/7/11 2/26/11 4/17/11 6/6/11 7/26/11 9/14/11 11/3/11 12/23/11 2/11/12 4/1/12 5/21/12
0
5
10
15
20
25
30
35
40 0
25
50
75
100
125
150 Lea
ch
ing
an
d M
an
ure
Eff
lue
nt
Ap
plic
ati
on
(kg
ha
-1)
Rain
fall
an
d F
res
hw
ate
r Ir
rig
ati
on
(m
m)
Date
Rainfall (mm) Freshwater irrigation (mm) Leaching N (kg ha-1) Manure effluent N (kg ha-1)
Page 125
125
Figure 3-4. Historical rainfall by year (2007-2011) from June 2 to September 21 in
Alachua county (FAWN, 2012)
Figure 3-5. Net mineralization/immobilization of summer mineralization experiment
Page 126
126
Figure 3-6. Mineral N content of summer mineralization experiment PVC pipes installed
on 24 July 2011
Note: Error bars denote standard error of the mean.
Figure 3-7. Net mineralization/immobilization of winter mineralization experiment
0
20
40
60
80
0 30 60 90
So
il M
ine
ral N
(kg h
a-1
)
Days after installation
PVC pipes installed 24 July 2011
Page 127
127
Figure 3-8. Mineral N concentrations of winter mineralization experiment PVC pipes
installed at 8 Nov. 2011
Note: Error bars denote standard error of the mean.
Figure 3-9. Historical rainfall by year (2007-2012) from September 21 to March 12 in
Alachua county (FAWN, 2012)
0
20
40
60
80
0 30 60 90
So
il m
ine
ral N
(kg h
a-1
)
Days after installation
PVC pipes installed 8 Nov. 2011
Page 128
128
CHAPTER 4 CONCLUSIONS
In this study, quantifying the N mass balance of Field J revealed that leaching was
not a substantial source of N losses to the environment during this period of below-
average rainfall. N lost to leaching was 23 kg ha-1 nitrate-N for the sampling year.
Leaching events appeared to be caused most often by high rainfall events and not
manure effluent application or freshwater irrigation. Although farm management took
into account weather forecasts when applying manure effluent, rainfall was
unpredictable. Therefore occasional leaching events were unavoidable, especially
during the summer months. Leaching losses during the fallow periods were 25% of
leaching over the crop year and not a majority of total leaching. Farm management of
manure effluent applications and freshwater irrigation during the crop season is critical
to minimize leaching and should continue to be managed carefully.
Initially, one concern of correctly estimating N fertilizer applications was the
possibility of overestimation of gaseous losses. Unaccounted-for N in this study was
assumed to be comprised entirely of gaseous losses (volatilization and denitrification),
because all other sources of N were accounted for. Unaccounted-for N was very high in
the spring season (119 kg ha-1 N). High manure effluent application in the spring season
accompanied by warm temperatures likely caused large amounts of N to be lost to
volatilization making it difficult to correctly calculate N fertilizer application. This loss
pathway may be expected due to the high pH of the soil (>7.0) and the significant
amounts of ammonium-N applied in the manure effluent.
Since gaseous losses were 45% of manure effluent applications (488 kg ha-1 TKN)
over the crop year, farm management’s 40% N loss assumption was a conservative
Page 129
129
estimate of gaseous losses. Therefore, N fertilizer application was within the IFAS
recommendation of 470 kg ha-1yr-1 under current management practices. N fertilizer
applications (294 kg ha-1) for the spring silage corn crop exceeded IFAS
recommendations for the season (235 kg ha-1 N), and gaseous losses (119 kg ha-1 N)
during the spring season were less than 40% of manure effluent inputs (353 kg ha-1
TKN). During the summer season, gaseous losses (44 kg ha-1 N) were greater than
100% of manure effluent inputs (31 kg ha-1 TKN). Although N fertilizer
recommendations and gaseous loss assumptions were made for the crop year as a
whole, seasonal application and losses were highly variable and may deserve individual
consideration by farm management.
Taking into account the high FNUE (163%) of the summer season silage corn, it is
likely that the summer silage corn yield would have been higher with increased N
application. As increasing N fertilizer through manure effluent application in the summer
would likely result in high volatilization losses, applying ammonium-free inorganic N
fertilizer during the summer months would be a better alternative to improve yields.
As found in this study, the large amount of manure effluent applied during the
spring season mineralized and provided mineral N throughout the crop year. Crop
uptake of N is greatest approximately 40 to 60 days after corn is planted. Therefore,
inorganic fertilizer applications at planting may not be needed or should be applied at a
more appropriate time for crop uptake. Also, manure effluent applications (74 kg ha-1
TKN) in the first month of the spring season and continued manure effluent application
may have supplied adequate N to crops without a second application of inorganic
fertilizer during the spring season. Shifting supplemental inorganic fertilizer applied
Page 130
130
during the spring season to the summer season would not increase costs to the dairy
but would likely increase summer silage corn yields while having little effect on spring
corn yields.
The summer and winter mineralization experiments provided an estimate of the
amount of mineral N made available through mineralization of manure effluent and
organic N in the soil. The mineralized N percentage of crop N inputs varied greatly
between the summer and winter experiments. Measuring possible volatilization of
mineral N from mineralization experiment soils would more accurately describe all
mineralized N. Repeating the experiments and including multiple levels of manure
effluent treatments would improve understanding of how soil N level changes based on
N application.
Measuring soil moisture content and taking into account evapotranspiration rates
would lead to a greater understanding of when the combination of manure effluent,
freshwater irrigation, and rainfall result in leaching events. Measuring leaching in years
with average to above-average rainfall would provide a better understanding of whether
leaching increases and may be a greater concern than it was in this study. Although
leaching losses were a small portion of the overall budget, the nitrate-N concentration of
leachate was above the MCL so leaching is a concern for water quality.
Further study of gaseous losses would provide a better characterization of
unaccounted-for N. Volatilization losses are maximized in conditions with surface
application of manures, high pH, soils with low cation exchange capacity, and warm,
slightly moist environments (Pierzynski et al., 2000). All of these conditions apply to the
forage production system at the Dairy Unit. In Field J, somewhat poorly drained soils
Page 131
131
and surface applied manure effluent applications were conditions conducive to
anaerobic activity and therefore possible denitrification. Determination of volatilization
versus denitrification losses would give farm management better information to combat
N losses with possible use of urease and nitrification transformation inhibitors.
Finally, it is recommended that farm management change their practices for N
fertilizer application by more evenly distributing applications throughout the year as
opposed to applying heavily concentrated fertilization in the spring season. Also,
adopting seasonal estimations of gaseous losses instead of using a 40% annual
average would more accurately estimate N losses based on climate conditions that vary
throughout the year. In addition, more investigation into volatilization and denitrification
would provide a better understanding of potential environmental losses.
Page 132
132
LIST OF REFERENCES
Altom, W., J.L. Rogers, W.R. Raun, and W.E. Thompson. 2002. Changes in total inorganic profile nitrogen in long-term rye-wheat-ryegrass forage production system. J. Plant Nutrition. 25:2285-2294.
Autry, L. P. 2003. National Environmental Laboratory Accreditation Conference: Constitution, Bylaws, and Standards, EPA/600/R-04/003. (TIP # 04-009, Published Report.) L. Autry, PO.
Azeez, J.O. and W. Van Averbeke. 2010. Nitrogen mineralization potential of three animal manures applied on a sandy clay loam soil. Bioresour. Technol. 101:5645-5651.
Bacon, S., L. Lanyon and R. Schlauder. 1990. Plant nutrient flow in the managed pathways of an intensive dairy farm. Agron. J. 82:755-761.
Brady N. C. and R. R. Weil. 2008. The Nature and Properties of Soils. 14th ed. Pearson Prentice Hall, Pearson Education Inc. Upper Saddle River, New Jersey.
Bremner, J.M. and C.S. Mulvaney, 1982. Nitrogen. In: A.L. Page et al., editors, Methods of Soil Analysis. Agron. Monogr. 9. Part 2. 2nd ed. ASA and SSSA, Madison, WI. p. 595-624.
Cabrera, V.E., N.E. Breuer, P.E. Hildebrand, and D. Letson. 2005a. The dynamic north Florida dairy farm model: A user-friendly computerized tool for increasing profits while minimizing N leaching under varying conditions. Comput. Electron. Agric. 49:286-308.
Cabrera, F., P. Martin-Olmedo, R. Lopez, and J.M. Murillo. 2005b. Nitrogen mineralization in soils amended with composted olive mill sludge. Nutr. Cycl. Agroecosys. 71:249-258.
Constantin, J., B. Mary, F. Laurent, G. Aubrion, A. Fontaine, P. Kerveillant and N. Beaudoin. 2010. Effects of catch crops, no till and reduced nitrogen fertilization on nitrogen leaching and balance in three long-term experiments. Agric. Ecosyst. Environ. 135:268-278.
Cusick, P.R., J.M. Powell, K.A. Kelling, R.F. Hensler and G.R. Munoz. 2006. Dairy manure N mineralization estimates from incubations and litterbags. Biol. Fertility Soils 43:145-152.
De Vries, A. and R. Giesy. 2009. Florida Dairy Farm Situation in 2009. EDIS Factsheet AN 215.
Page 133
133
Dou, Z., R.A. Kohn, J.D. Ferguson, R.C. Boston and J.D. Newbold. 1996. Managing nitrogen on dairy farms: An integrated approach .1. model description. J. Dairy Sci. 79:2071-2080.
Duan, R., C.B. Fedler and C.D. Sheppard. 2010. Nitrogen leaching losses from a wastewater land application system. Water Environ. Res. 82:227-235.
Eghball, B. and J. Power. 1999. Composted and noncomposted manure application to conventional and no-tillage systems: Corn yield and nitrogen uptake. Agron. J. 91:819-825.
[FAWN] Florida Automated Weather Network. 2012. University of Florida IFAS Extension. http://fawn.ifas.ufl.edu.
Follett, J.A. and R.F. Delgado. 2002. Carbon and nutrient cycles. J. Soil Water Cons. 57:455-464.
Follett, R.F. and D.J. Walker. 1989. Groundwater quality concerns about nitrogen in Nitrogen Management and Groundwater Preservation. Elsevier Science Publishers B.V., Amsterdam, Netherlands.
[FDEP] Florida Department of Environmental Protection. 2010. Florida Administrative Code, Chapter 62-640,-670. www.dep.state.fl.us/legal/rules/rulelist.htm.
Frazao, L.A., M. Piccolo, B.J. Feigl, C.C. Cerri, C.E.P. Cerri. 2010. Inorganic nitrogen, microbial biomass and microbial activity of a sandy Brazilian Cerrado soil under different land uses. Agric. Ecosys. Environ. 135: 161- 167.
Gazula, A., E. Simonne, M. Dukes, G. Hochmuth, B. Hochmuth and B. Studstill. 2006. Optimization of drainage lysimeter design for field determination of nutrient loads. HortScience. 41:508-508.
Gilbertson, C.B., D.L. Vandyne, C.J. Clanton and R.K. White. 1979. Estimating quantity and constituents in livestock and poultry manure residue as reflected by management-systems. Trans. ASAE 22:602-&.
Haas, G., C. Deittert and U. Koepke. 2007. Farm-gate nutrient balance assessment of organic dairy farms at different intensity levels in Germany. Renew. Agr. Food Syst. 22:223-232.
Haefele, S., M. Wopereis and H. Wiechmann. 2002. Long-term fertility experiments for irrigated rice in the West African Sahel: Agronomic results. Field Crops Res. 78:119-131.
Hall, D. and D. Risser. 1993. Effects of agricultural nutrient management on nitrogen fate and transport in Lancaster county, Pennsylvania. Water Resour. Bull. 29:55-76.
Page 134
134
Hanlon, E.A., J.S. Gonzalez, and J.M. Bartos. 1996. IFAS Extension Soil Testing Laboratory (ESTL) and Analytical Research Laboratory (ARL) chemical procedures and training manual. EDIS Circular 812.
Hillel, D. 1980. Fundamentals of soil physics. Academic Press. New York.
Hutson, J., R. Pitt, R. Koelsch, J. Houser and R. Wagenet. 1998. Improving dairy farm sustainability II: Environmental losses and nutrient flows. J. Prod. Agric. 11:233-239.
Jokela, W. 1992. Nitrogen-fertilizer and dairy manure effects on corn yield and soil nitrate. SSSA J. 56:148-154.
Klausner, S., D. Fox, C. Rasmussen, R. Pitt, T. Tylutki, P. Wright, L. Chase and W. Stone. 1998. Improving dairy farm sustainability I: An approach to animal and crop nutrient management planning. J. Prod. Agric. 11:225-233.
Kohn, R., Z. Dou, J. Ferguson and R. Boston. 1997. A sensitivity analysis of nitrogen losses from dairy farms. J. Environ. Manage. 50:417-428.
Korevaar, H. 1992. The nitrogen balance on intensive Dutch dairy farms: a review. Livest. Prod. Sci. Elsevier Science Publishers B.V. Amsterdam, Netherlands. 31:17-27.
Kuipers, A., F. Mandersloot and R. Zom. 1999. An approach to nutrient management on dairy farms. J. Anim. Sci. 77:84-89.
Magette, W., R. Weismiller, J. Angle and R. Brinsfield. 1989. A nitrate groundwater standard for the 1990 farm bill. J. Soil Water Conserv. 44:491-494.
Martin, J. 2000. Nutrient Management Plan for UF, IFAS Dairy Research Unit Hague, FL. Florida Department of Environmental Protection, Northeast District Office, Jacksonville, FL.
Mattos, D., A.K. Alva, S. Paramasivam, and D.A. Graetz. 2003. Nitrogen volatilization and mineralization in a sandy entisol of Florida under citrus. Commun. Soil Sci. Plan. 34: 1803-1824.
Mehlich, A. 1953. Determination of P, Ca, Mg, K, Na, and NH4. Pub. No. 1-53. N.C. Soil Testing Div., Raleigh, NC.
Meng, Q.F., X.P. Chen., F.S. Zhang, M.H. Cao, Z.L. Cui, J.S. Bai, S.C. Yue, S.Y. Chen, and T. Muller. 2012. In-season root-zone nitrogen management strategies for improving nitrogen use efficiency in high-yielding maize production in China. Elsevier Science Publishers B.V. Amsterdam, Netherlands. 22:294-303.
Page 135
135
Mikha, M.M., C.W. Rice and J.G. Benjamin. 2006. Estimating soil mineralizable nitrogen under different management practices. SSSA J. 70:1522-1531.
Morari, F., E. Lugato, R. Polese, A. Berti, and L. Giardini. 2012. Nitrate concentrations in groundwater under contrasting agricultural management practices in the low plains of Italy. Agric. Ecosyst. Environ. 147: 47-56.
Mylavarapu, R. 2002. UF/IFAS Extension Soil Testing Laboratory (ESTL) Analytical procedures and training manual. EDIS Circular 1248.
Mylavarapu, R. 2003. Role of an Extension Soil Testing Program in the Development of Best Management Practices: A Florida Case Study. J. Extension. 45(4) http://www.joe.org/joe/2003august/a7.shtml.
Mylavarapu, R., D. Wright, G. Kidder, and C.G. Chambliss. 2009. UF/IFAS standardized fertilizer recommendations for agronomic crops. EDIS fact sheet. SL 129.
Newton, G.L., J.K. Bernard, R.K. Hubbard, J.R. Allison, R.R. Lowrance, G.J. Gascho, R.N. Gates, G. Vellidis. 2003. Managing manure nutrients through multi-crop forage production. J. Dairy Sci. 86:2243-2252.
[NADP] National Atmospheric Deposition Program (NRSP-3). 2011. NADP Program Office, Illinois State Water Survey, Champaign, IL. http://nadp.sws.uiuc.edu.
[NPDES] National Pollutant Discharge Elimination System. 2011. Animal Feeding Operations. United States Environmental Protection Agency, Washington, D.C. http://cfpub.epa.gov/npdes/home.cfm?program_id=7.
[NRCS] National Resources Conservation Service. 2010. Web Soil Survey. Washington, D.C. http://websoilsurvey.nrcs.usda.gov/app/WebSoilSurvey.aspx.
Overcash, M.R., F.J. Humenik and J.R. Miner. 1983. Livestock waste management. Volume I. CRC Press Inc., Boca Raton, FL.
[PSAG] Pennsylvania State Agronomy Guide. 1982. The Pennsylvania State Univ. College Agric. Ext Serv., University Park, PA.
Pierzynski, G.M., J.T. Sims, and G.F. Vance. 2000. Soils and Environmental Quality, 2nd ed. CRC Press, CRC Press Inc., Boca Raton, FL.
Powell, J.M., D.B. Jackson-Smith, D.F. McCrory, H. Saam and M. Mariola. 2007. Nutrient management behavior on Wisconsin dairy farms. Agron. J. 99:211-219.
Raun, W.R. and G.V. Johnson. 1999. Improving nitrogen use efficiency for cereal production. Agron. J. 91:357-363.
Page 136
136
Richter, J. and M. Roelcke. 2000. The N-cycle as determined by intensive agriculture – examples from central Europe and China. Nutr. Cycl. Agroecosys. 57:33-46.
Rotz, C., L. Satter, D. Mertens and R. Muck. 1999. Feeding strategy, nitrogen cycling, and profitability of dairy farms. J. Dairy Sci. 82:2841-2855.
Rotz, C., F. Taube, M. Russelle, J. Oenema, M. Sanderson and M. Wachendorf. 2005. Whole-farm perspectives of nutrient flows in grassland agriculture. Crop Sci. 45:2139-2159.
SAS Institute. 2002. The SAS system for windows. Release 9.2. SAS Inst., Cary, NC.
[SCS] Soil Conservation Service. 1967. Irrigation Water Requirements Technical Release No. 21. USDA Soil Conservation Service Engineering Division.
Shepard, R. 2005. Nutrient management planning: Is it the answer to better management? J. Soil Water Conserv. 60:171-176.
Shober, A. and R. Mylavarapu. 2009. Soil sampling and testing for the home landscape or vegetable garden. EDIS Document SL 281.
Silva, R.G., K.C. Cameron, H.J. Di and E.E. Jorgensen. 2005. A lysimeter study to investigate the effect of dairy effluent and urea on cattle urine N losses, plant uptake and soil retention. Water, Air, Soil Pollut. 164:57-78.
[UF DAS] University of Florida, Department of Animal Sciences. 2011. Corn silage field day corn hybrid variety test. UF/IFAS Plant Sci. Rsrch. Edu. Unit. Citra, FL. http://animal.ifas.ufl.edu/extension/CSFD/2011csfd/2011present.shtml.
[US EPA] United States Environmental Protection Agency. 2005. Protecting Water Quality from Agricultural Runoff. EPA841-F-05-001. http://www.epa.gov/owow/NPS/Ag_Runoff_Fact_Sheet.pdf.
van Es, H.M., J.M. Sogbedji and R.R. Schindelbeck. 2006. Effect of manure application timing, crop, and soil type on nitrate leaching. J. Environ. Qual. 35:670-679.
VanHorn, H., G. Newton and W. Kunkle. 1996. Ruminant nutrition from an environmental perspective: Factors affecting whole-farm nutrient balance. J. Anim. Sci. 74:3082-3102.
VanHorn, H., A. Wilkie, W. Powers and R. Nordstedt. 1994. Components of dairy manure management-systems. J. Dairy Sci. 77:2008-2030.
Page 137
137
Wang, S., D. Fox, D. Cherney, L. Chase and L. Tedeschi. 2000. Whole-herd optimization with the Cornell net carbohydrate and protein system. III. application of an optimization model to evaluate alternatives to reduce nitrogen and phosphorus mass balance. J. Dairy Sci. 83:2160-2169.
Wienhold, B.J. 2007. Comparison of laboratory methods and an in situ method for estimating nitrogen mineralization in an irrigated silt-loam soil. Commun. Soil Sci. Plant Anal. 38:1721-1732.
Woodard, K.R., E.C. French, L.A. Sweat, D.A.Graetz, L.E. Sollenberger, B. Macoon, K.M. Portier. S.J. Rymph, B.L. Wade, G.M. Prine, and H.H. Van Horn. 2003. Nitrogen removal and nitrate leaching for two perennial, sod-based forage systems receiving dairy effluent. J. Environ. Qual. 32:996-1007.
Wright, D., J. Marois, J. Rich, and R. Sprenkel. 2011a. Field Corn Production Guide. EDIS Document SS-AGR-85.
Wright, D., E.B. Whitty, and C.G. Chambliss. 2011b. Fertilization of Agronomic Crops. EDIS Document SS-AGR-152.
Zhang, J., R.T. James, G. Ritter, and B. Sharfstein. 2007. Lake Okeechobee Protection Program- State of the Lake and Watershed. In: South Florida Environmental Report. South Florida Water Management District, West Palm Beach, FL.
Zotarelli, L., L. Avila, J.M.S. Scholberg, and B.J.R. Alves. 2009. Benefits of vetch and rye cover crops to sweet corn under no-tillage. Agron. J. 101:252-260.
Page 138
138
BIOGRAPHICAL SKETCH
Rebecca Jean Hellmuth was born in 1986 in Baltimore, MD to Martha P. Hellmuth
and Dr. John H. Hellmuth. Rebecca and her family moved to Middleburg, Florida in
1988. Rebecca graduated cum laude from the University of Florida with a bachelor of
science in business administration with a concentration in finance in August 2008. In
2010, Rebecca returned to the University of Florida to pursue a master of science in the
Soil and Water Science Department with a minor in agronomy. Rebecca graduated with
her master’s degree in May 2013.