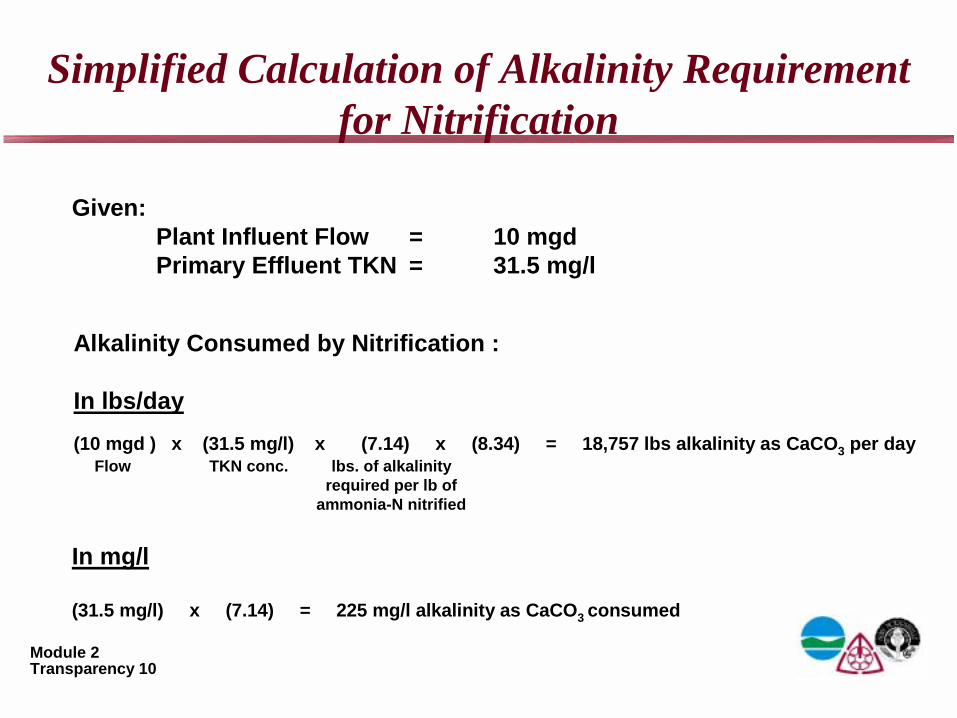
In lbs/day(10 mgd ) x (31.5 mg/l) x (7.14) x (8.34) = 18,757 lbs alkalinity as CaCO3 per day
In mg/l
(31.5 mg/l) x (7.14) = 225 mg/l alkalinity as CaCO3 consumed
Flow TKN conc. lbs. of alkalinityrequired per lb of
ammonia-N nitrified
Module 2Transparency 11
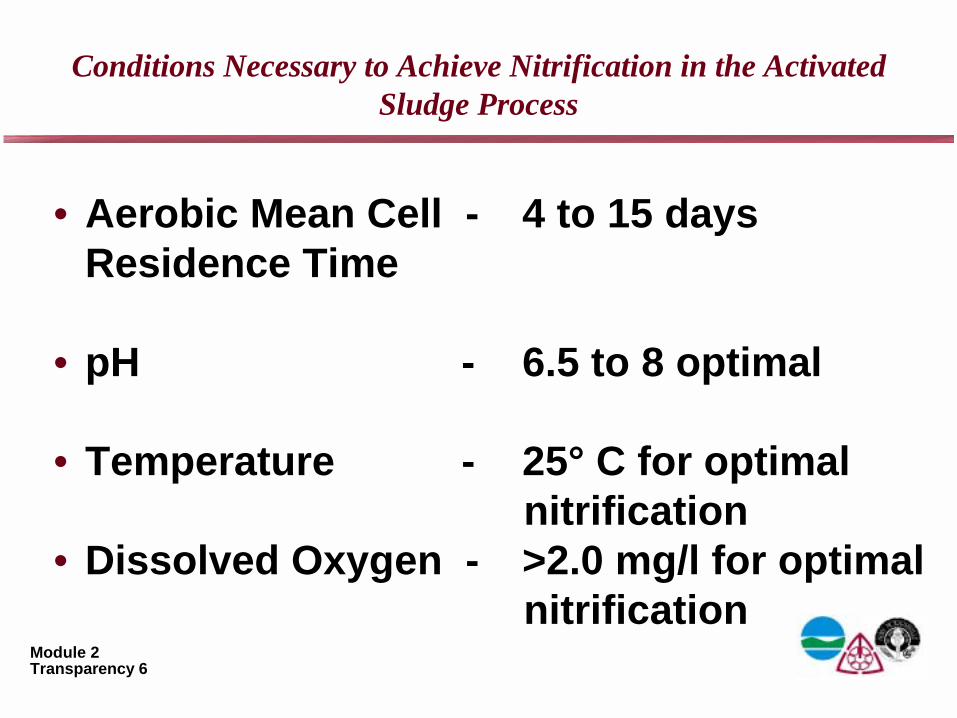
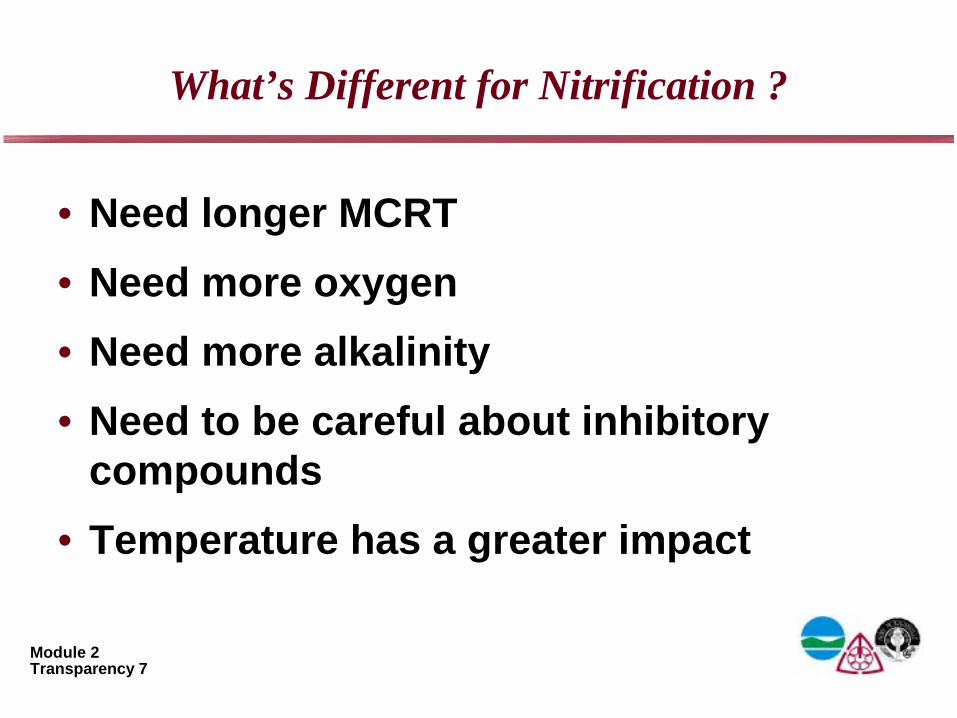
Factors Affecting Nitrification
What is the Key Factor for Achieving Nitrification
?
Module 2Transparency 12
Factors Affecting Nitrification
What is the Key Factor for Achieving Nitrification?
MEAN CELL RESIDENCE TIME(MCRT)
Module 2Transparency 13
Effect of Temperature on Nitrification
As temperature increases, nitrifier growth rateincreases (within the range of 4o C to 35o C).
T �
As nitrifier growth rate increases, requiredMCRT decreases.
� MCRT
Rule of Thumb:For every 10oC increase in temperature,nitrifier growth rate doubles, requiredMCRT is cut in half and required MLSS concentration is also reduced.
Module 2Transparency 14
Effect of Temperature on Nitrifier Growth Rate
0.00
0.20
0.40
0.60
0.80
1.00
1.20
0 5 10 15 20 25 30 35Temperature (Degrees C)
Max
imum
Spe
cific
Gro
wth
R
ate
of N
itrifi
ers
(1/d
ay) Maximum Specific Nitrifier Growth Rate
�max,� = (0.65) (1.055) (T-25)
Maximum Specific Nitrifier Growth Rate
�max,� = (0.65) (1.055) (T-25)
Module 2Transparency 15
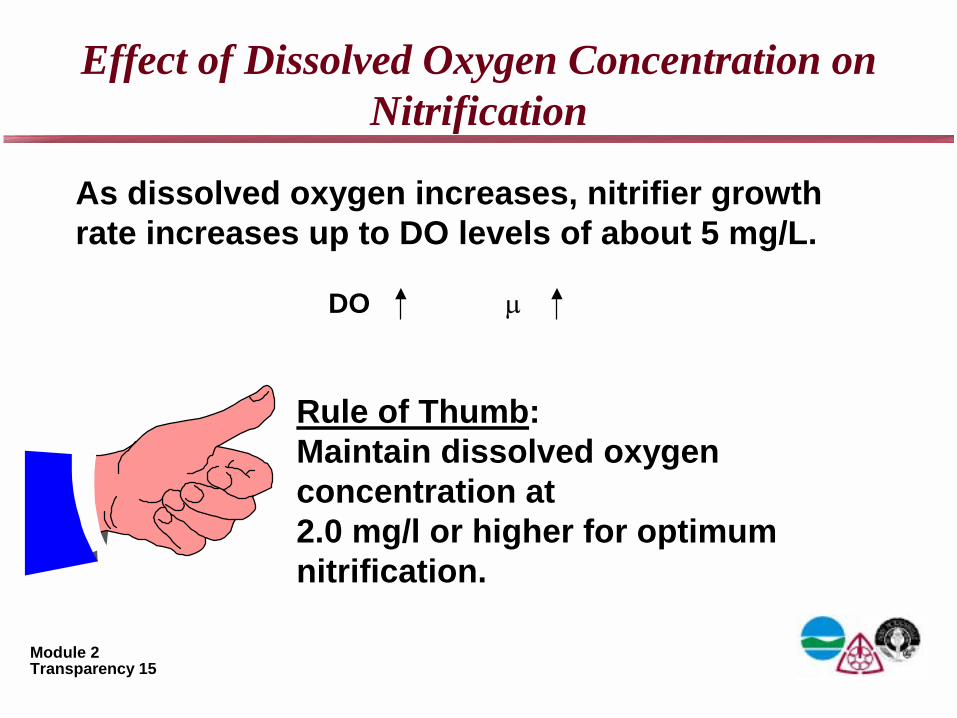
Effect of Dissolved Oxygen Concentration on Nitrification
As dissolved oxygen increases, nitrifier growth rate increases up to DO levels of about 5 mg/L.
DO ����
Rule of Thumb:Maintain dissolved oxygen concentration at2.0 mg/l or higher for optimum nitrification.
Module 2Transparency 16
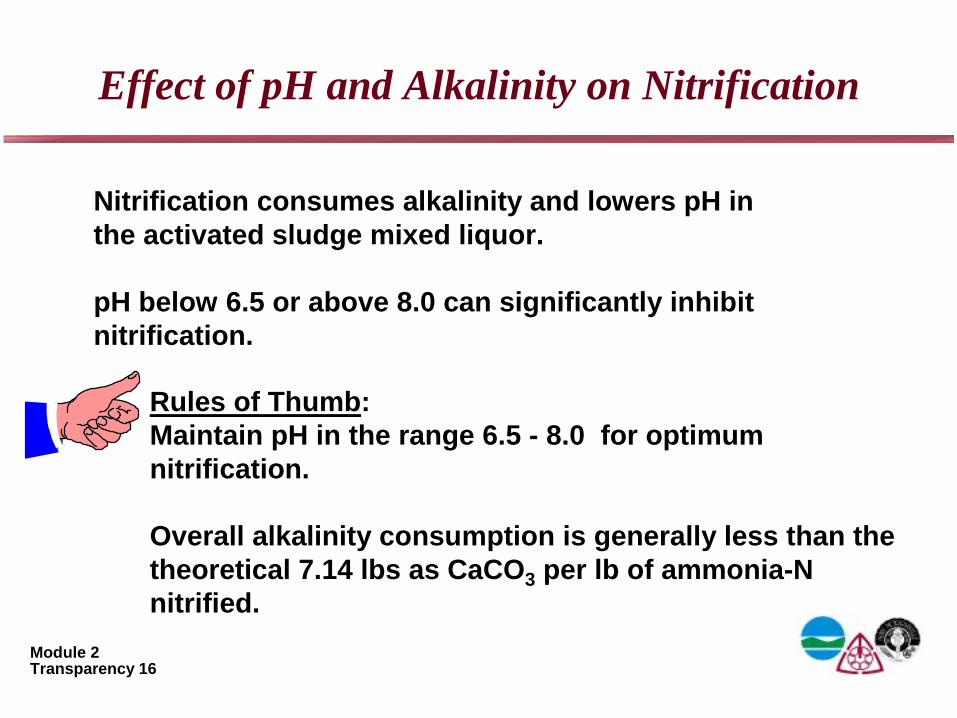
Effect of pH and Alkalinity on Nitrification
Nitrification consumes alkalinity and lowers pH in the activated sludge mixed liquor.
pH below 6.5 or above 8.0 can significantly inhibitnitrification.
Rules of Thumb:Maintain pH in the range 6.5 - 8.0 for optimum nitrification.
Overall alkalinity consumption is generally less than the theoretical 7.14 lbs as CaCO3 per lb of ammonia-N nitrified.
Long Island Sound Nitrogen Removal Training ProgramModule 2
Denitrification Fundamentals
Module 2Transparency 19
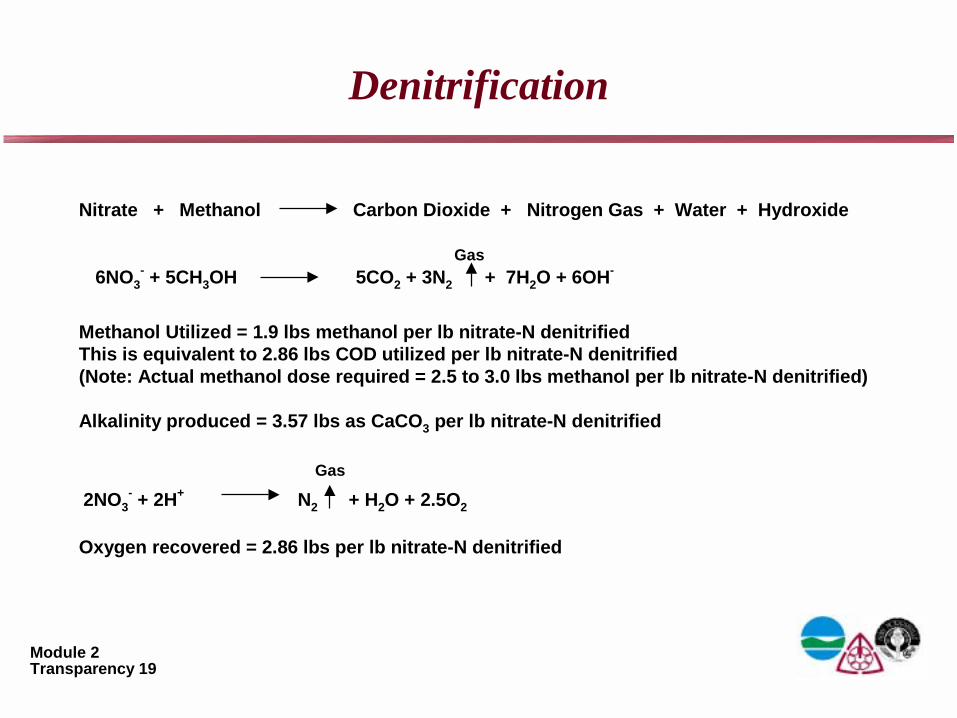
Denitrification
Nitrate + Methanol Carbon Dioxide + Nitrogen Gas + Water + Hydroxide
Methanol Utilized = 1.9 lbs methanol per lb nitrate-N denitrifiedThis is equivalent to 2.86 lbs COD utilized per lb nitrate-N denitrified(Note: Actual methanol dose required = 2.5 to 3.0 lbs methanol per lb nitrate-N denitrified)
Alkalinity produced = 3.57 lbs as CaCO3 per lb nitrate-N denitrified
Oxygen recovered = 2.86 lbs per lb nitrate-N denitrified
6NO3- + 5CH3OH 5CO2 + 3N2 + 7H2O + 6OH-
Gas
2NO3- + 2H+ N2 + H2O + 2.5O2
Gas
Module 2Transparency 20
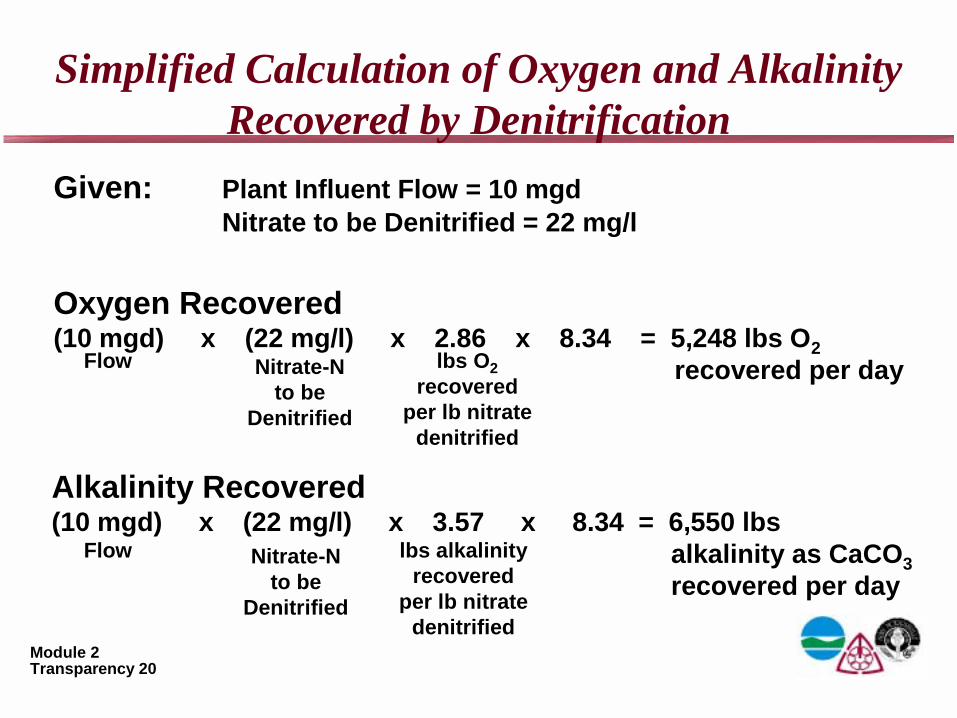
Simplified Calculation of Oxygen and Alkalinity Recovered by Denitrification
Given: Plant Influent Flow = 10 mgdNitrate to be Denitrified = 22 mg/l
Oxygen Recovered(10 mgd) x (22 mg/l) x 2.86 x 8.34 = 5,248 lbs O2
recovered per day
Alkalinity Recovered(10 mgd) x (22 mg/l) x 3.57 x 8.34 = 6,550 lbs
alkalinity as CaCO3recovered per day
Flow Nitrate-Nto be
Denitrified
lbs O2recovered
per lb nitratedenitrified
Flow Nitrate-Nto be
Denitrified
lbs alkalinityrecovered
per lb nitratedenitrified
Module 2Transparency 21
Effect of Dissolved Oxygen on Denitrification
• Dissolved oxygen inhibits denitrification.
• As DO increases, denitrification rate decreases.
Rule of Thumb:
• Maintain DO below 0.3 mg/l in anoxic zone to achieve denitrification.
Module 2Transparency 22
Effect of Dissolved O2 on Denitrification Rate
0.0
0.1
0.2
0.3
0.4
0.5
0.6
0.7
0.8
0.9
1.0
0 2 4 6 8 10Dissolved Oxygen Concentration (mg/l)
Frac
tion
of M
axim
um S
peci
fic G
row
th R
ate
of
Den
itrifi
ers Maximum Specific Denitrifier Growth Rate
�D = �max,D(0.1/(0.1*DO))
Maximum Specific Denitrifier Growth Rate
�D = �max,D(0.1/(0.1*DO))
Module 2Transparency 23
Effect of Temperature on Denitrification Rate
As temperature increases, denitrifier growth rate increases.
T �D
Module 2Transparency 24
Effect of Temperature on Denitrification Rate
100%
0%
10%
20%
30%
40%
50%
60%
70%
80%
90%
2 4 6 8 10 12 14 16 18 20Temperature (Degrees C)
Perc
ent o
f Den
itrifi
catio
n R
ate
at 2
0 D
egre
es C
Denitrifier Growth Rate
�D = �max,D 1.08(T-20)
Denitrifier Growth Rate
�D = �max,D 1.08(T-20)
Module 2Transparency 25
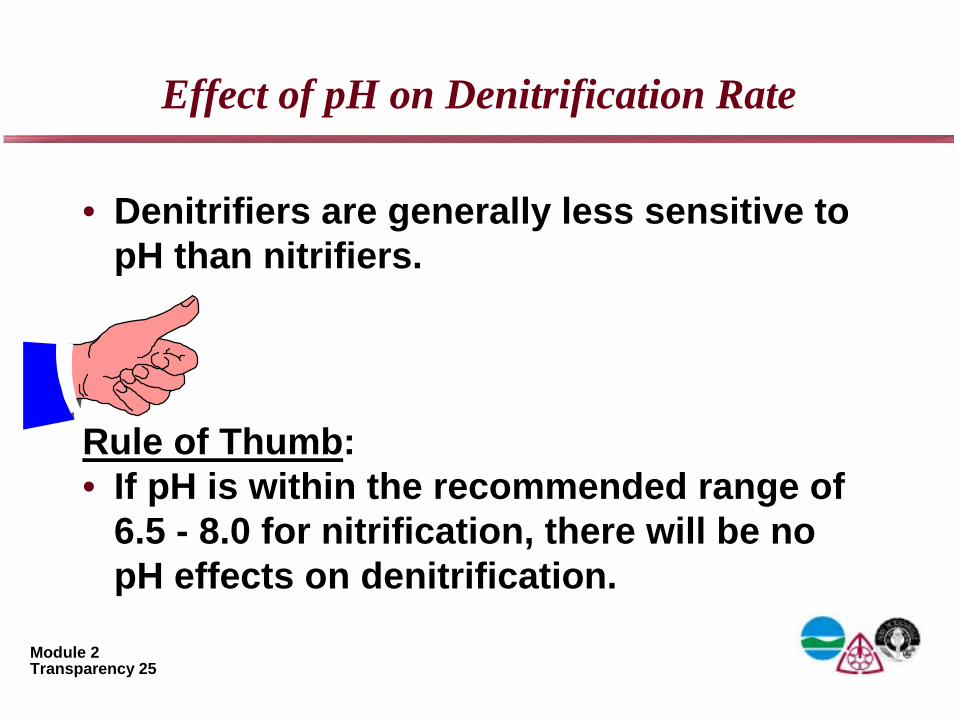
Effect of pH on Denitrification Rate
• Denitrifiers are generally less sensitive to pH than nitrifiers.
Rule of Thumb:• If pH is within the recommended range of
6.5 - 8.0 for nitrification, there will be no pH effects on denitrification.
Module 2Transparency 26
Effects of Inhibitory Compounds on Denitrification
• Denitrifiers are generally less sensitive to inhibitory compounds than nitrifiers.
• If there are no compounds present which inhibit nitrification, there will probably be no inhibition of denitrification.
Module 2Transparency 27
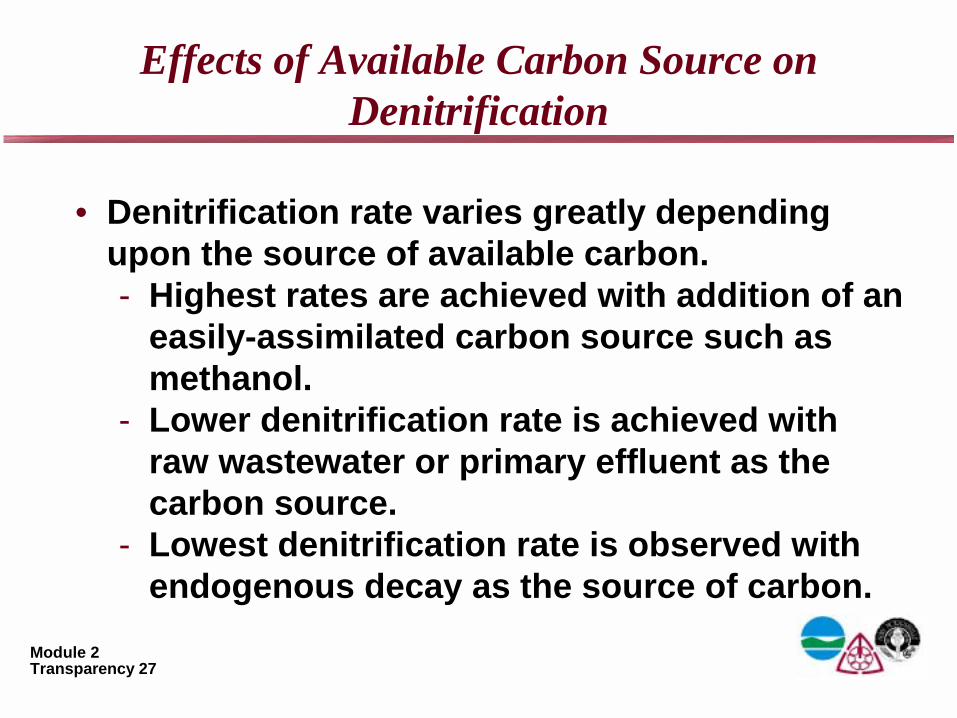
Effects of Available Carbon Source on Denitrification
• Denitrification rate varies greatly depending upon the source of available carbon.- Highest rates are achieved with addition of an
easily-assimilated carbon source such as methanol.
- Lower denitrification rate is achieved with raw wastewater or primary effluent as the carbon source.
- Lowest denitrification rate is observed with endogenous decay as the source of carbon.
Module 2Transparency 28
Denitrification Rates
Reported Denitrification Rates
Carbon Source Denit Rate Temp(g NO3
--N/g VSS-d) (°C)
Methanol 0.10 to 0.32 10 - 27Sewage 0.03 to 0.12 10 - 27Endogenous Decay 0.02 to 0.06 10 - 27
Module 2Transparency 29
Considerations Regarding Methanolas a Carbon Source
• Methanol Costs = $0.70 to $3.00 per gallon• Storage Requirements
– National Fire Protection Agency (NFPA) requirements– Dike around each above ground tank (125% of tank
volume)– Tank fittings should include:
• Inlet with dip tube to prevent splash and static electricity• Anti-siphon valve of hole on the inlet to prevent back siphoning• Vent pipe with pressure vacuum release valve with flame arrester• Outlet connection• Drain connection• Various opening for depth gauges, sample points, and level switches
– Tanks must be grounded
Module 2Transparency 30
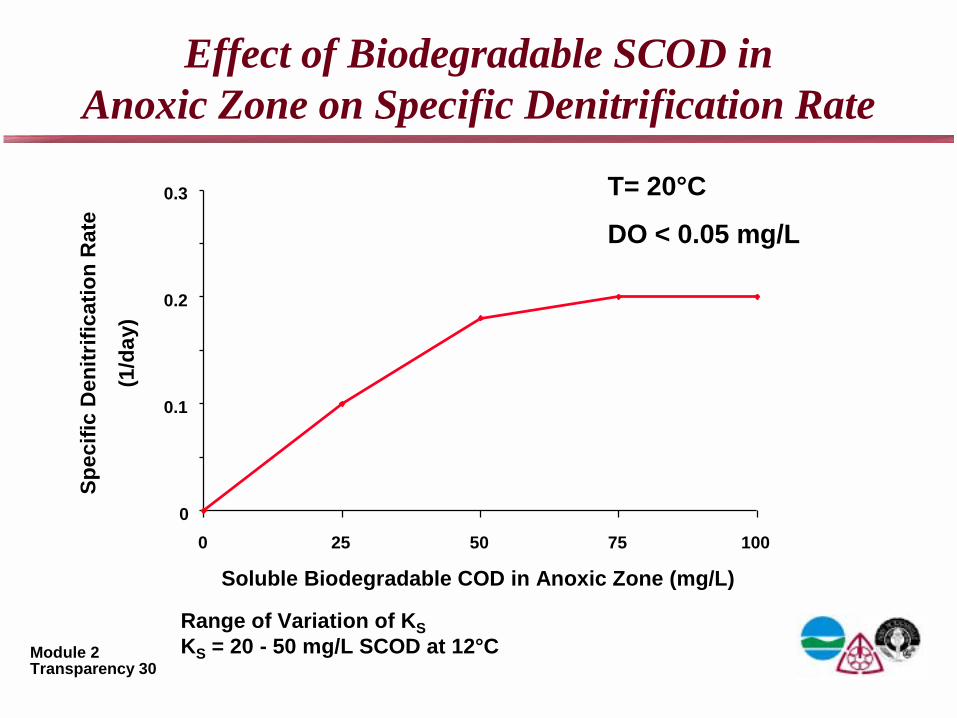
Effect of Biodegradable SCOD in Anoxic Zone on Specific Denitrification Rate
0
0.1
0.2
0.3
0 25 50 75 100
T= 20°C
DO < 0.05 mg/L
Soluble Biodegradable COD in Anoxic Zone (mg/L)
Range of Variation of KSKS = 20 - 50 mg/L SCOD at 12°C
Spec
ific
Den
itrifi
catio
n R
ate
(1/d
ay)
Module 2Transparency 31
Long Island Sound Nitrogen Removal Training ProgramModule 2
Operating Strategies for Nitrification
Module 2Transparency 32
Operating Strategies for Nitrification
So, what do we need to do toget my plant to nitrify
?
Module 2Transparency 33
Operating Strategies for Nitrification
So, what do we need to do toget my plant to nitrify?
Establish sufficient mean cell residence time
(MCRT).
Module 2Transparency 34
Approach to Establishing Nitrification
1. Confirm adequate alkalinity(1)
2. Confirm adequate oxygen(1)
3. Calculate target MCRT(1)
• Determine growth rate at desired temperature• Adjust growth rate for ammonia and DO
concentrations• Use corrected growth rate to determine target
MCRT4. Calculate current actual MCRT5. Adjust MCRT to try to reach target
(1) Include Denitrification for TN removal
Module 2Transparency 35
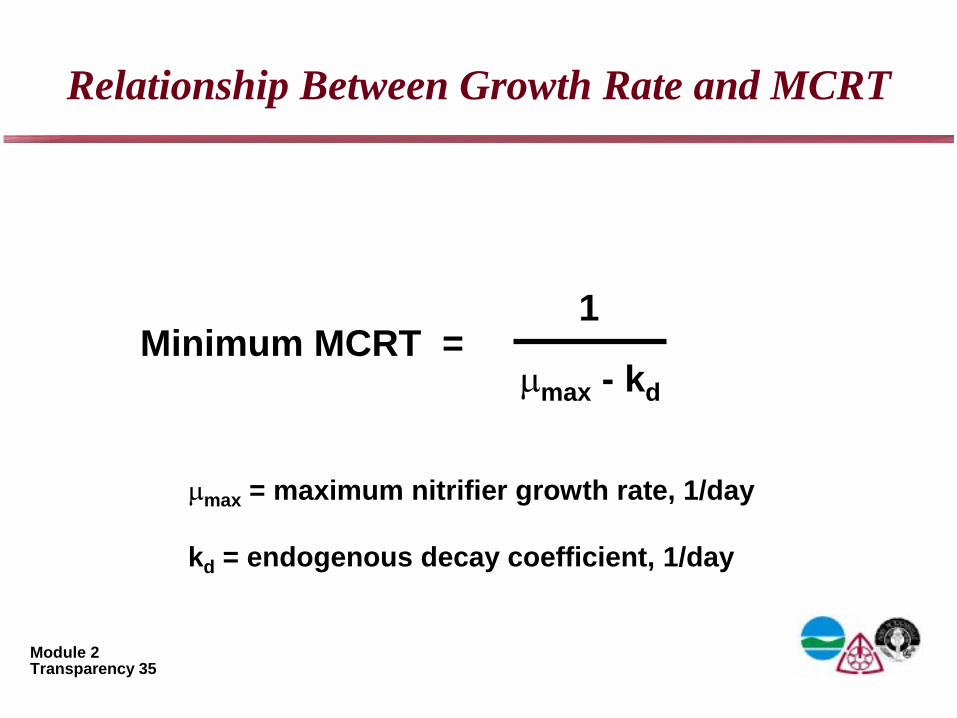
Relationship Between Growth Rate and MCRT
Minimum MCRT = 1
�max - kd
�max = maximum nitrifier growth rate, 1/day
kd = endogenous decay coefficient, 1/day
Module 2Transparency 36
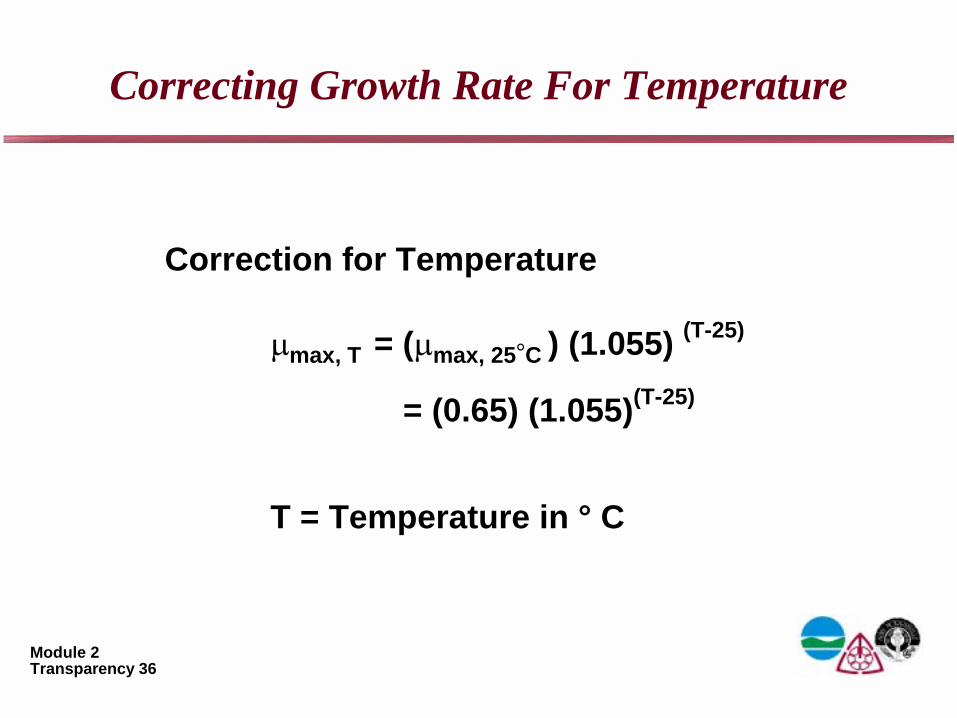
Correcting Growth Rate For Temperature
�max, T = (�max, 25�C ) (1.055) (T-25)
= (0.65) (1.055)(T-25)
T = Temperature in ° C
Correction for Temperature
Module 2Transparency 37
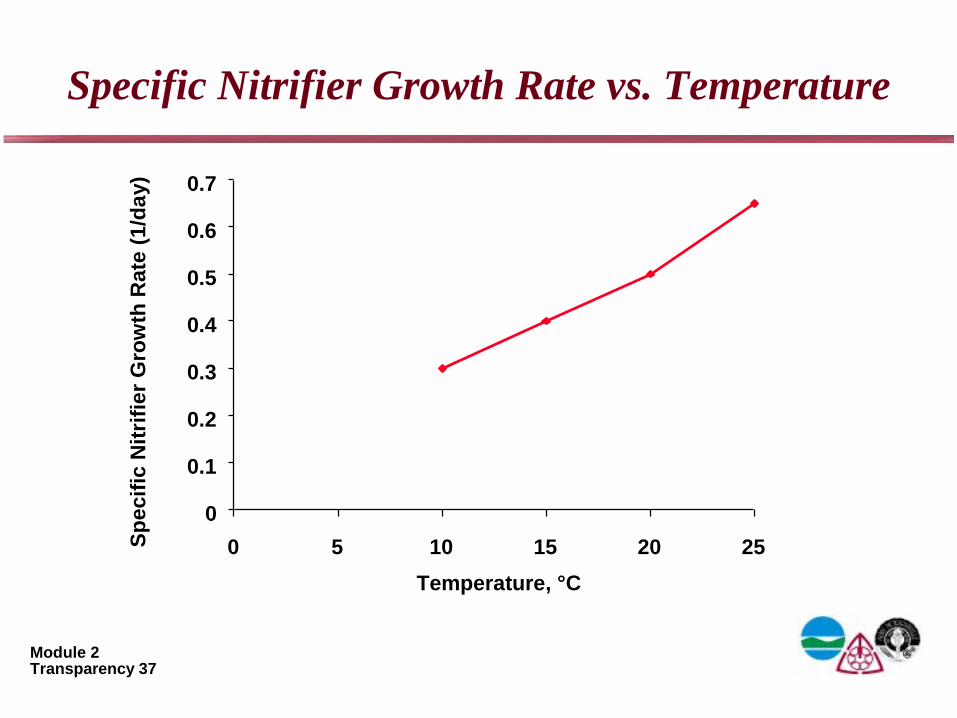
Specific Nitrifier Growth Rate vs. TemperatureSp
ecifi
c N
itrifi
er G
row
th R
ate
(1/d
ay)
0
0.1
0.2
0.3
0.4
0.5
0.6
0.7
0 5 10 15 20 25Temperature, °C
Module 2Transparency 38
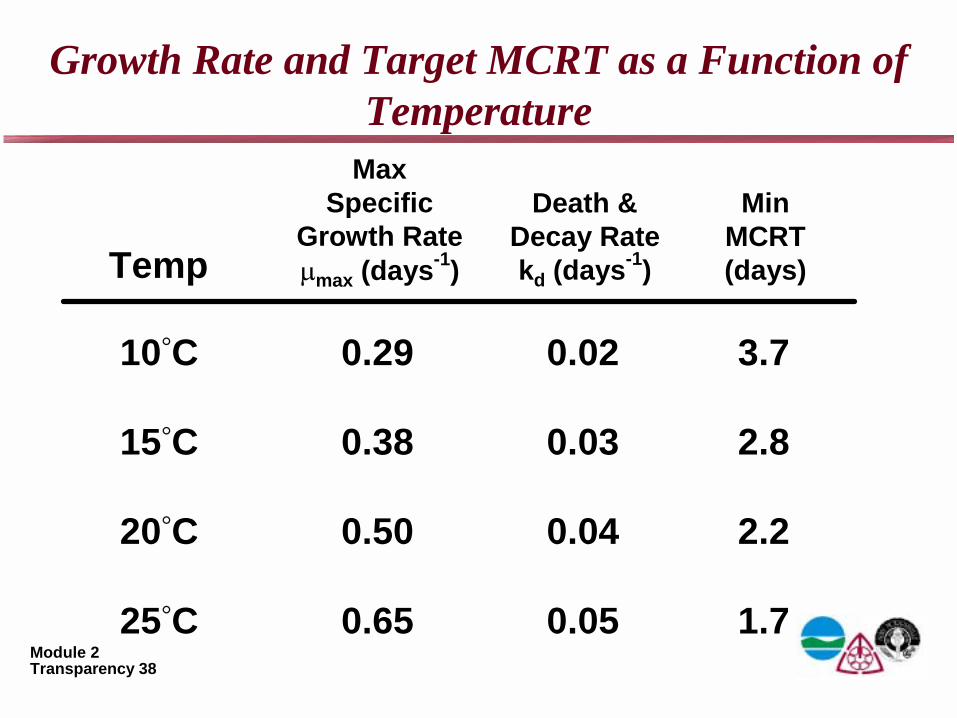
Growth Rate and Target MCRT as a Function of Temperature
10�C
15�C
20�C
25�C
Temp
0.29
0.38
0.50
0.65
MaxSpecific
Growth Rate�max (days-1)
0.02
0.03
0.04
0.05
Death &Decay Ratekd (days-1)
3.7
2.8
2.2
1.7
MinMCRT(days)
Module 2Transparency 39
Correcting Growth Rate for Ammonia Concentration
�NH4+ = (�max)NH4
+
KN + NH4+
Module 2Transparency 40
Relationship Between Effluent Ammonia Concentration and Required MCRT
AEROBIC MCRT (DAYS)
EFF
NH
4+ -N (m
g/L)
INF NH4+-N
Module 2Transparency 41
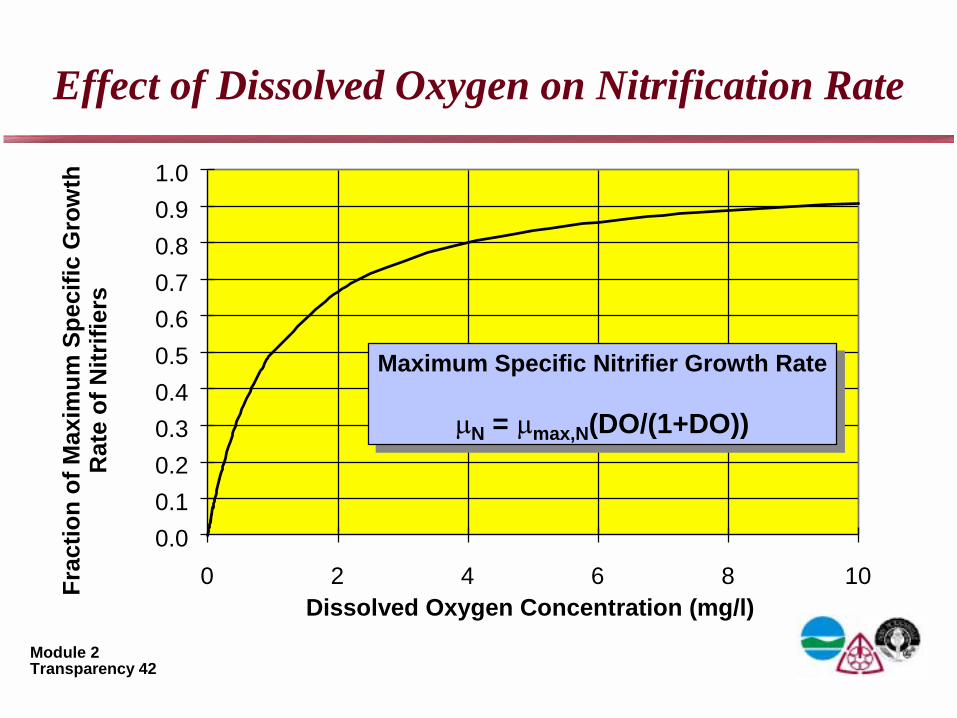
Correcting Growth Rate for Dissolved Oxygen Concentration
�DO = (�max)DO
KDO + DO
Use KDO = 1.0 mg/l
Module 2Transparency 42
Effect of Dissolved Oxygen on Nitrification Rate
0.00.10.20.30.40.50.60.70.80.91.0
0 2 4 6 8 10Dissolved Oxygen Concentration (mg/l)
Frac
tion
of M
axim
um S
peci
fic G
row
th
Rat
e of
Nitr
ifier
s
Maximum Specific Nitrifier Growth Rate
�N = �max,N(DO/(1+DO))
Maximum Specific Nitrifier Growth Rate
�N = �max,N(DO/(1+DO))
Module 2Transparency 43
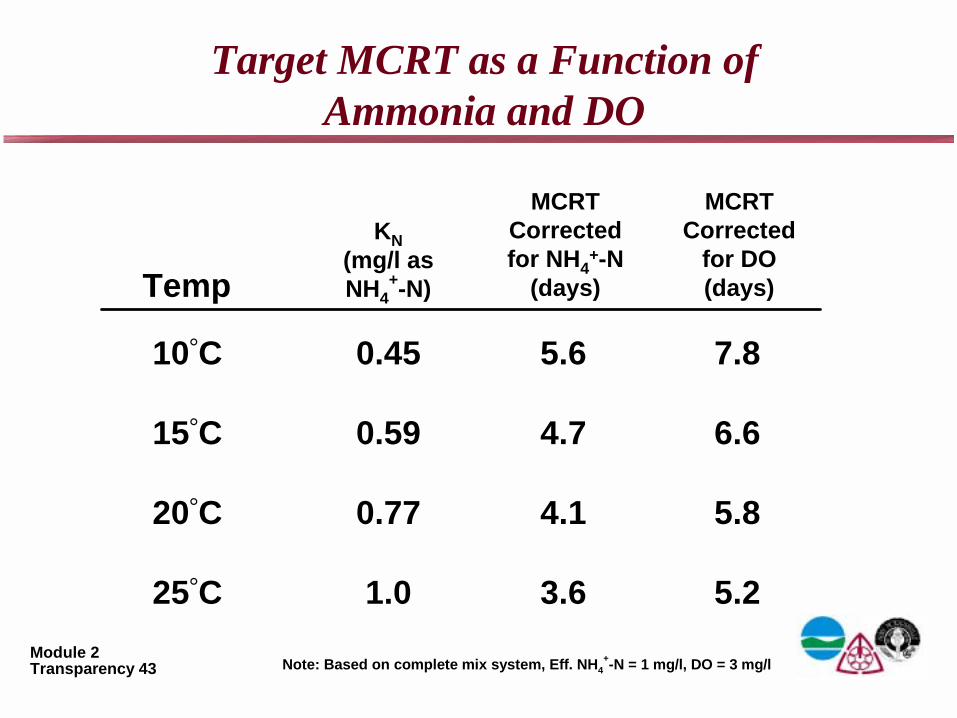
Target MCRT as a Function ofAmmonia and DO
Note: Based on complete mix system, Eff. NH4+-N = 1 mg/l, DO = 3 mg/l
10�C
15�C
20�C
25�C
Temp
0.45
0.59
0.77
1.0
KN(mg/l asNH4
+-N)
5.6
4.7
4.1
3.6
MCRTCorrectedfor NH4
+-N(days)
7.8
6.6
5.8
5.2
MCRTCorrected
for DO(days)
Module 2Transparency 44
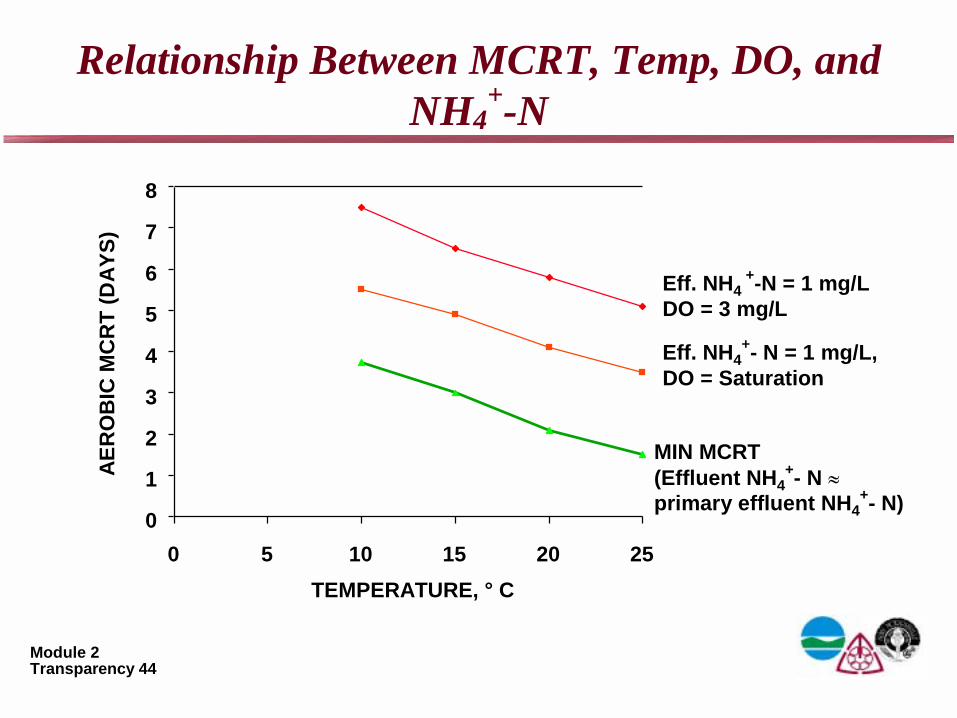
Relationship Between MCRT, Temp, DO, and NH4
+-N
0
1
2
3
4
5
6
7
8
0 5 10 15 20 25TEMPERATURE, ° C
AER
OB
IC M
CR
T (D
AYS)
Eff. NH4 +-N = 1 mg/L
DO = 3 mg/L
Eff. NH4+- N = 1 mg/L,
DO = Saturation
MIN MCRT(Effluent NH4
+- N �primary effluent NH4
+- N)
Module 2Transparency 45
Determining Required MCRT
How do I determine the MCRT required to
get my plant to nitrify?
Module 2Transparency 46
Determination of Actual Operating MCRT
How do I determine the MCRT at which my
plant is actually operating ?
Module 2Transparency 47
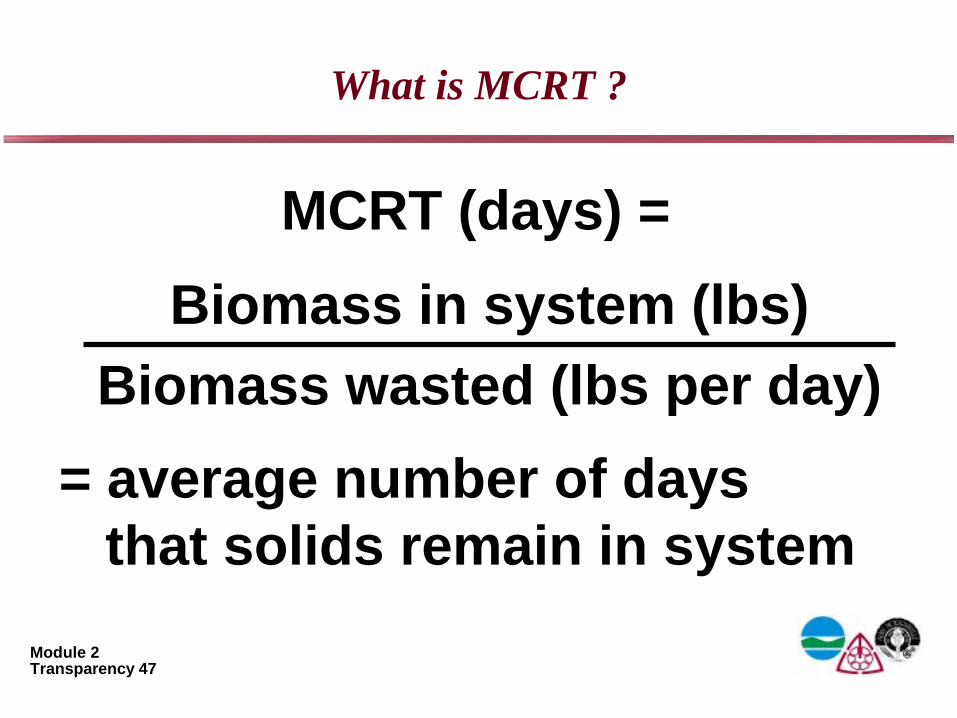
What is MCRT ?
MCRT (days) =Biomass in system (lbs)
Biomass wasted (lbs per day)= average number of days
that solids remain in system
Module 2Transparency 48
Varying Approaches to Calculating MCRT
• Include biomass in aeration tanks only
• Include biomass in aeration tanks and clarifiers
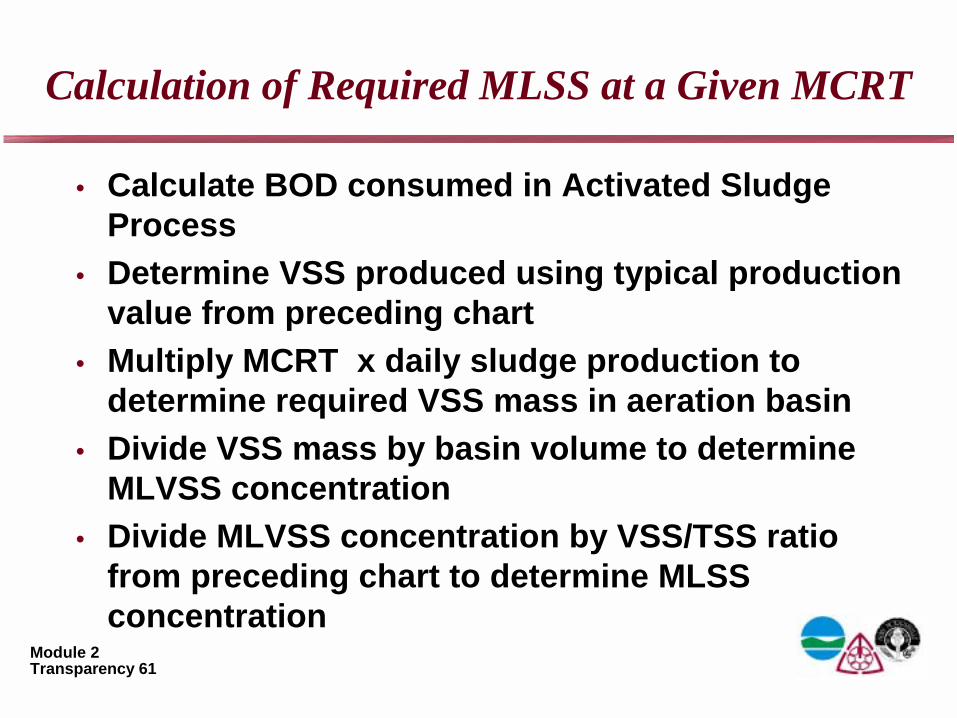
• Calculate BOD consumed in Activated Sludge Process
• Determine VSS produced using typical production value from preceding chart
• Multiply MCRT x daily sludge production to determine required VSS mass in aeration basin
• Divide VSS mass by basin volume to determine MLVSS concentration
• Divide MLVSS concentration by VSS/TSS ratio from preceding chart to determine MLSS concentration
Module 2Transparency 62
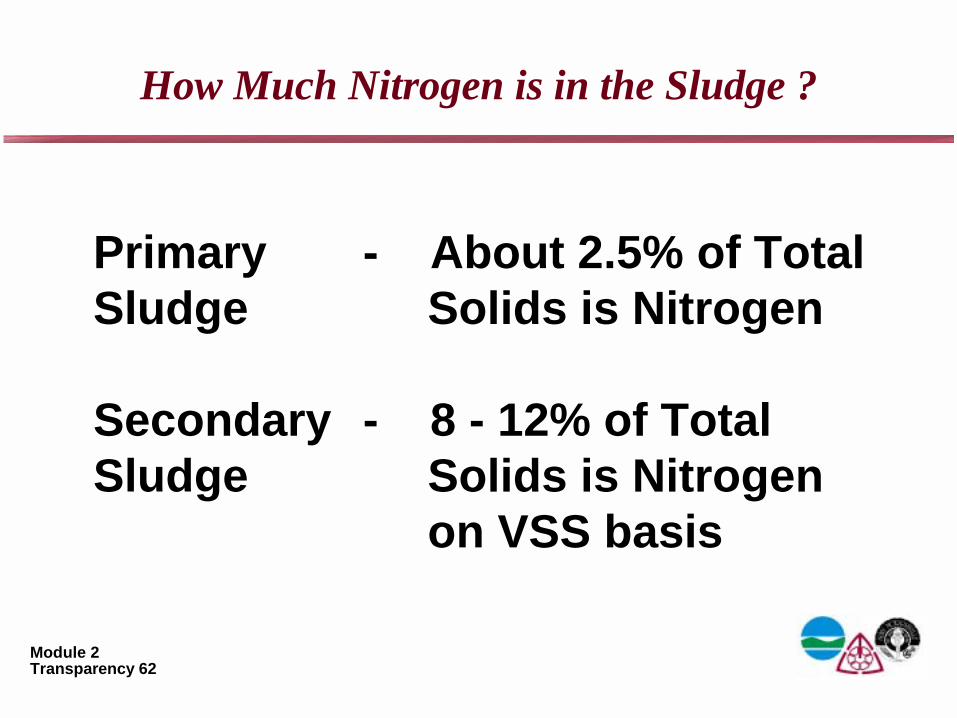
How Much Nitrogen is in the Sludge ?
- About 2.5% of TotalSolids is Nitrogen
- 8 - 12% of TotalSolids is Nitrogenon VSS basis
PrimarySludge
SecondarySludge
Module 2Transparency 63
Nitrification
What if I can’t achieve the MCRT necessary to nitrify
?
Module 2Transparency 64
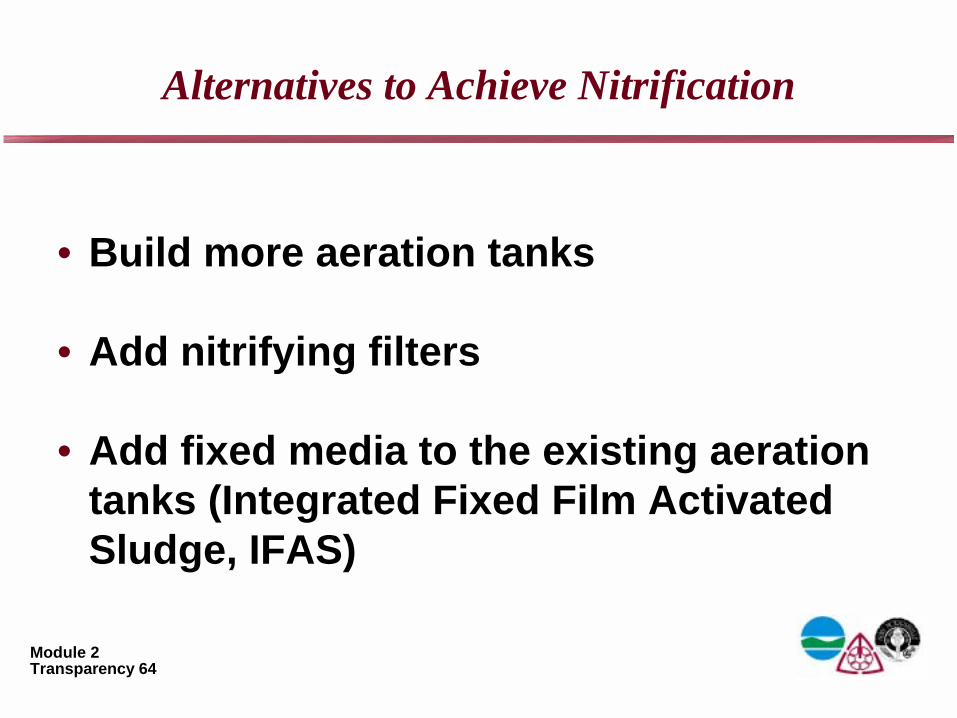
Alternatives to Achieve Nitrification
• Build more aeration tanks
• Add nitrifying filters
• Add fixed media to the existing aeration tanks (Integrated Fixed Film Activated Sludge, IFAS)
Module 2Transparency 65
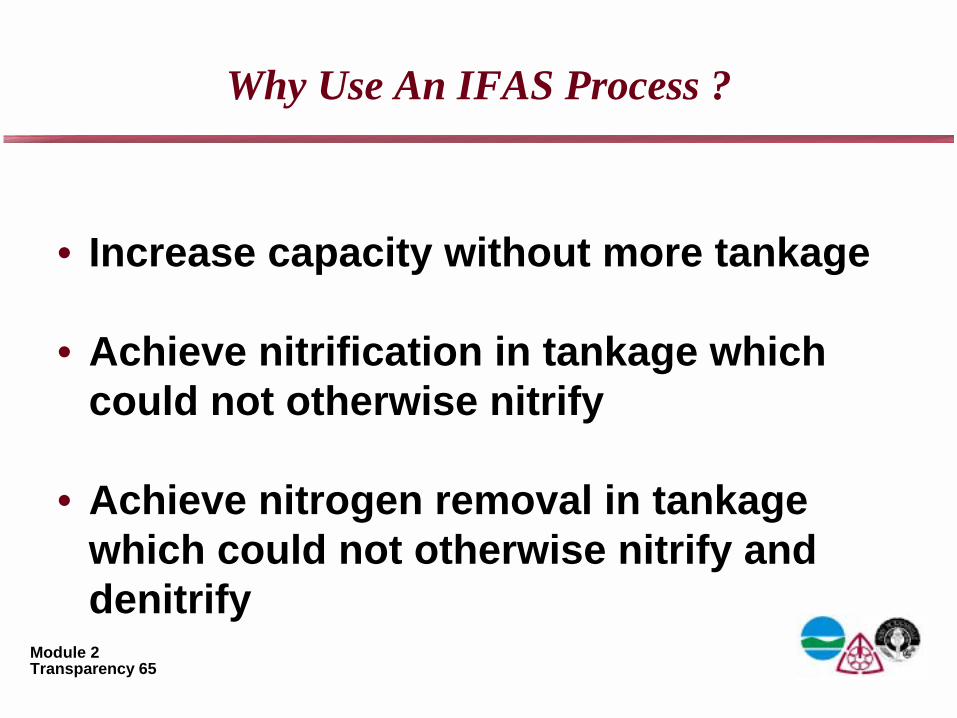
Why Use An IFAS Process ?
• Increase capacity without more tankage
• Achieve nitrification in tankage which could not otherwise nitrify
• Achieve nitrogen removal in tankage which could not otherwise nitrify and denitrify
Module 2Transparency 66
Benefits of IFAS Processes
• Increase total solids inventory without increasing solids loading to clarifier
• Minimize effects of solids washout under high hydraulic loadings
• Avoid cost of construction of new tankage
• Decrease required recycle rates
Module 2Transparency 67
IFAS Processes - Media Comparison
Advantages
Disadvantages
Rope-type
Simplicity - No moving parts
Easily relocated
Can vary media density along length of reactor
Minimum aerobic MCRT for 50% nitrification in suspended growth
Sponge-type
Up to 80% nitrification in suspended growth
Higher rate of nitrification per unit volume
More pumps and appurtenances
Potential for screen clogging
Periodic supplement of media required
Module 2Transparency 68
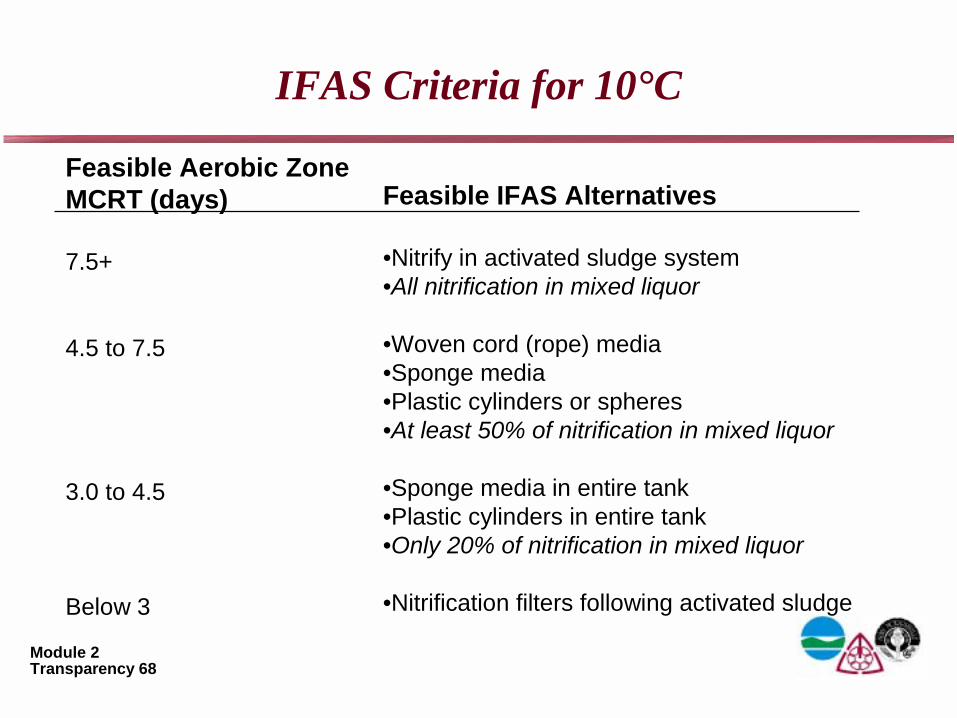
IFAS Criteria for 10°C
Feasible Aerobic ZoneMCRT (days)
7.5+
4.5 to 7.5
3.0 to 4.5
Below 3
Feasible IFAS Alternatives
•Nitrify in activated sludge system•All nitrification in mixed liquor
•Woven cord (rope) media•Sponge media•Plastic cylinders or spheres•At least 50% of nitrification in mixed liquor
•Sponge media in entire tank•Plastic cylinders in entire tank•Only 20% of nitrification in mixed liquor
•Nitrification filters following activated sludge
Module 2Transparency 69
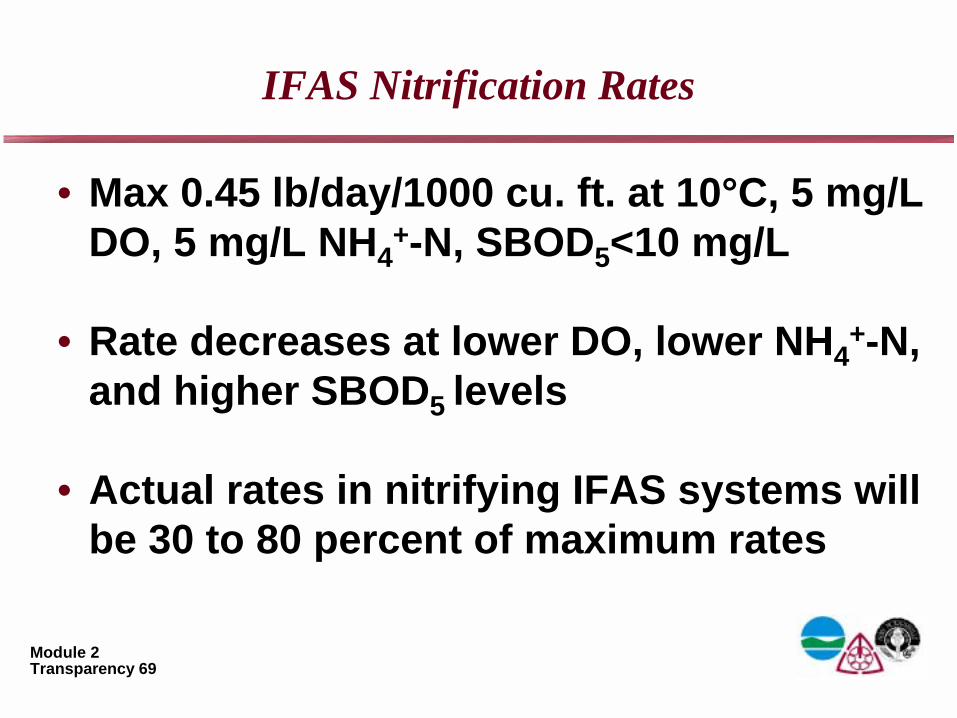
IFAS Nitrification Rates
• Max 0.45 lb/day/1000 cu. ft. at 10°C, 5 mg/L DO, 5 mg/L NH4
+-N, SBOD5<10 mg/L
• Rate decreases at lower DO, lower NH4+-N,
and higher SBOD5 levels
• Actual rates in nitrifying IFAS systems will be 30 to 80 percent of maximum rates
Module 2Transparency 70
Long Island Sound Nitrogen Removal Training ProgramModule 2
Operating Strategies for Denitrification
Module 2Transparency 71
Operating for Denitrification
Now that my plant is nitrifying, what do I need to do to make it
denitrify
?
Module 2Transparency 72
Operating for Denitrification
Now that my plant is nitrifying, what do I need to do to make it
denitrify
?Establish anoxic conditions somewhere in the activated
sludge process
Module 2Transparency 73
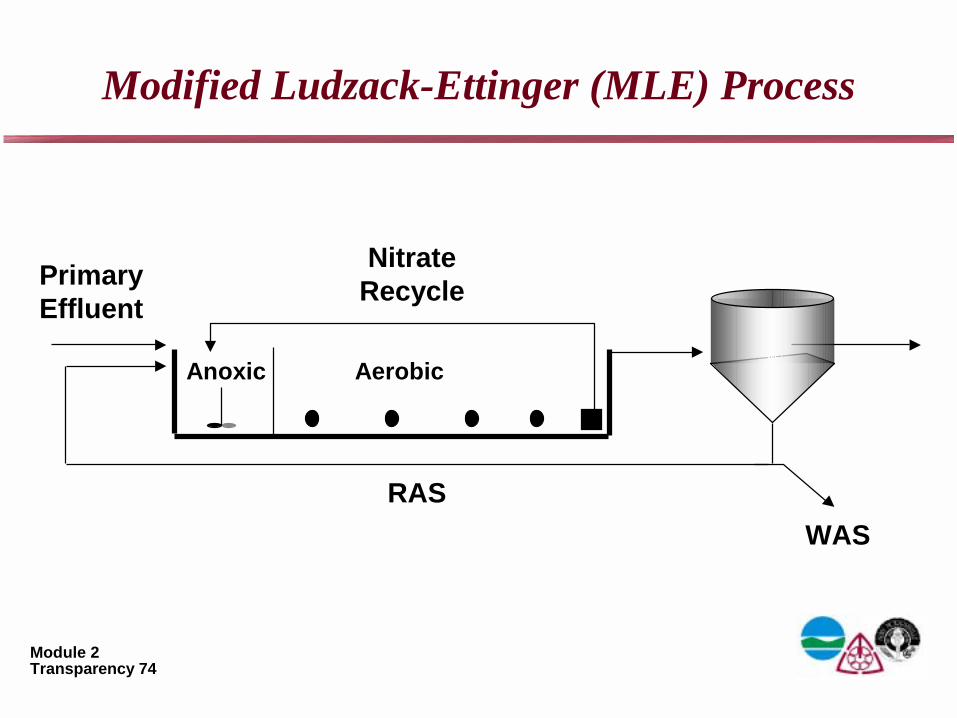
Pre-denitrification
Pre-denitrification uses an anoxic zone at the beginning of the activated sludge tanks.
An example is the Modified Ludzack-Ettinger (MLE) process.
Module 2Transparency 74
Modified Ludzack-Ettinger (MLE) Process
RASWAS
PrimaryEffluent
NitrateRecycle
Anoxic Aerobic
Module 2Transparency 75
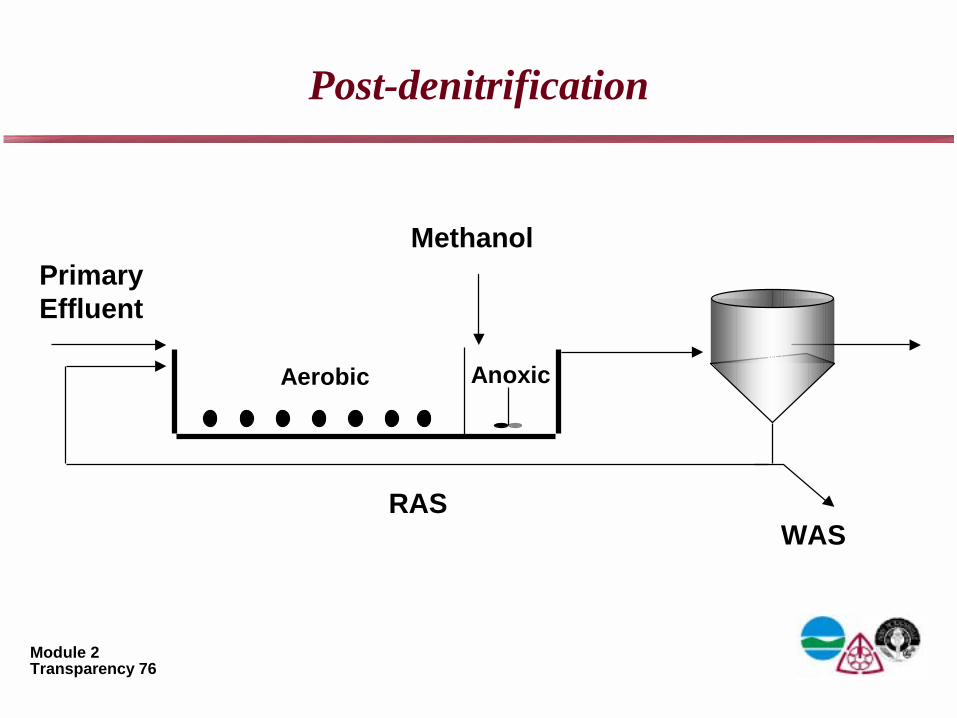
Post-denitrification
Post-denitrification uses an anoxic zone at the end of the activated sludge tanks.
Denitrification is slower in a post-denitrification zone than in a pre-denitrification zone.
Why ?
What could be done to increase the denitrification rate in a post-denitrification zone ?
Module 2Transparency 76
Post-denitrification
Methanol
RASWAS
PrimaryEffluent
AnoxicAerobic
Module 2Transparency 77
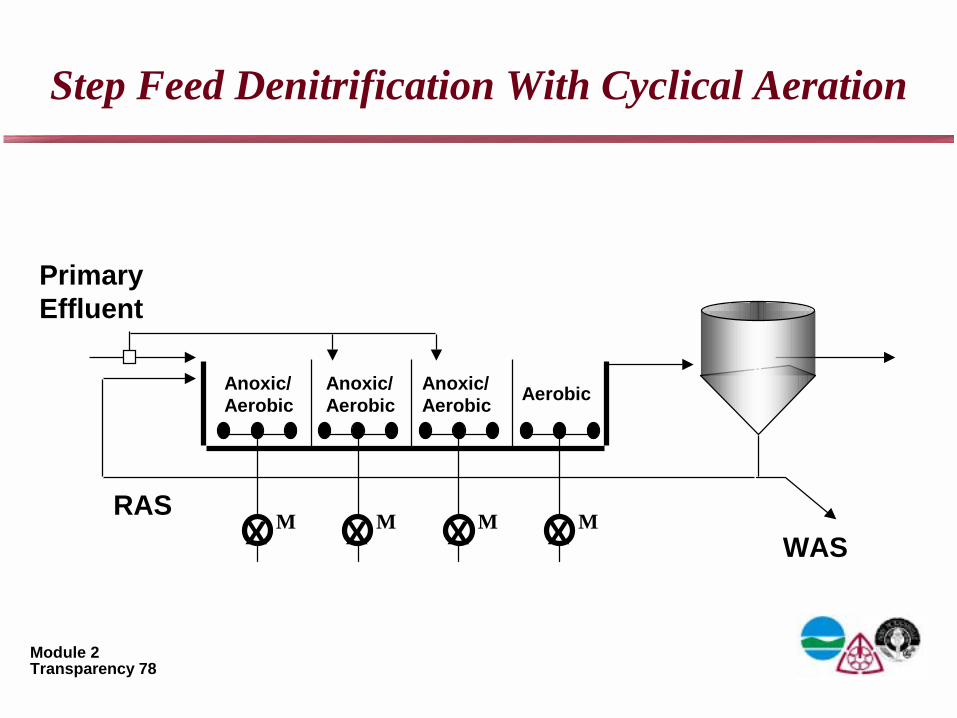
Step Feed Denitrification With Cyclical Aeration
Step-Feed Denitrification uses alternating periods of aerobic and anoxic conditions. Primary effluent is fed at multiple points along the tank to provide a carbon source for denitrification.
What advantages would this arrangement have over pre- or post-denitrification ?
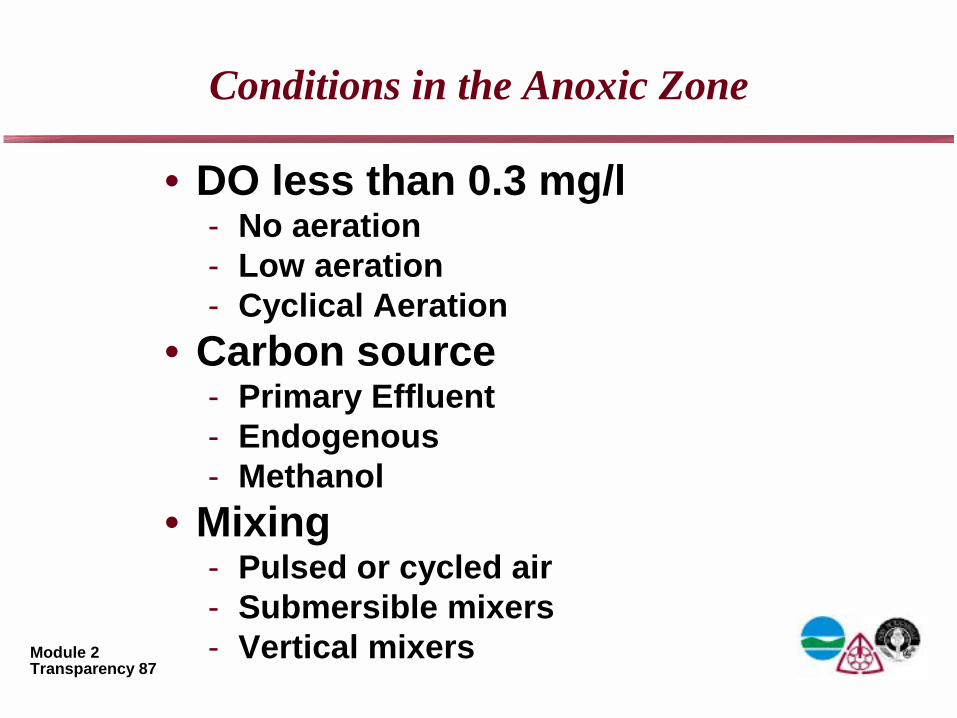
• Mixing- Pulsed or cycled air- Submersible mixers- Vertical mixers
Module 2Transparency 88
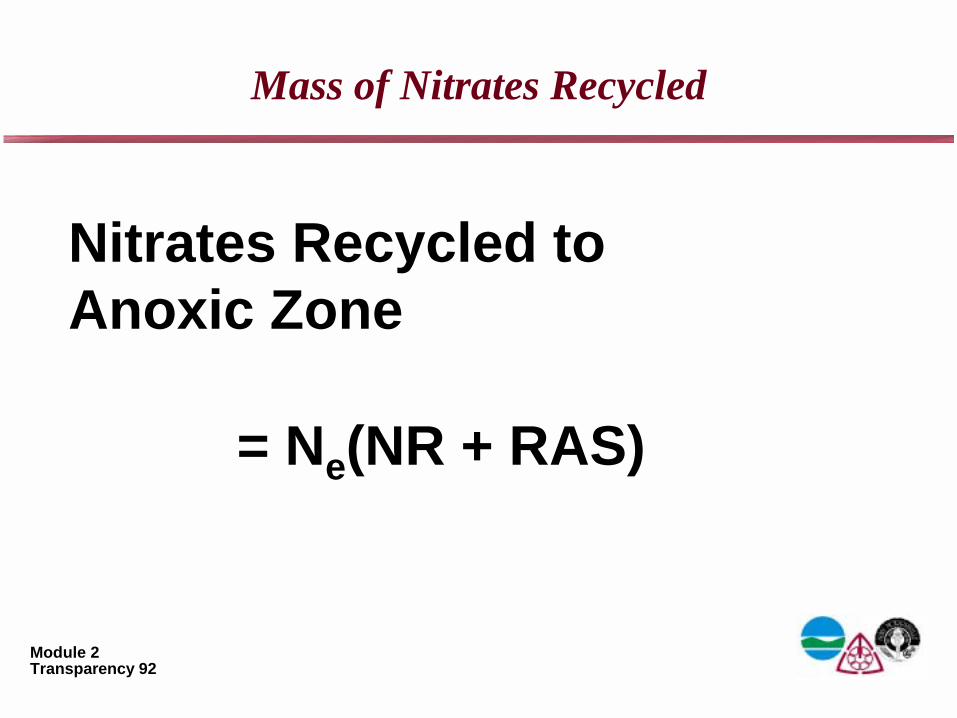
Nitrate Recycle Rate
• Determine desired effluent nitrate
• Determine amount of nitrate to be denitrified
• Determine total recycle rate including RAS flow
Module 2Transparency 89
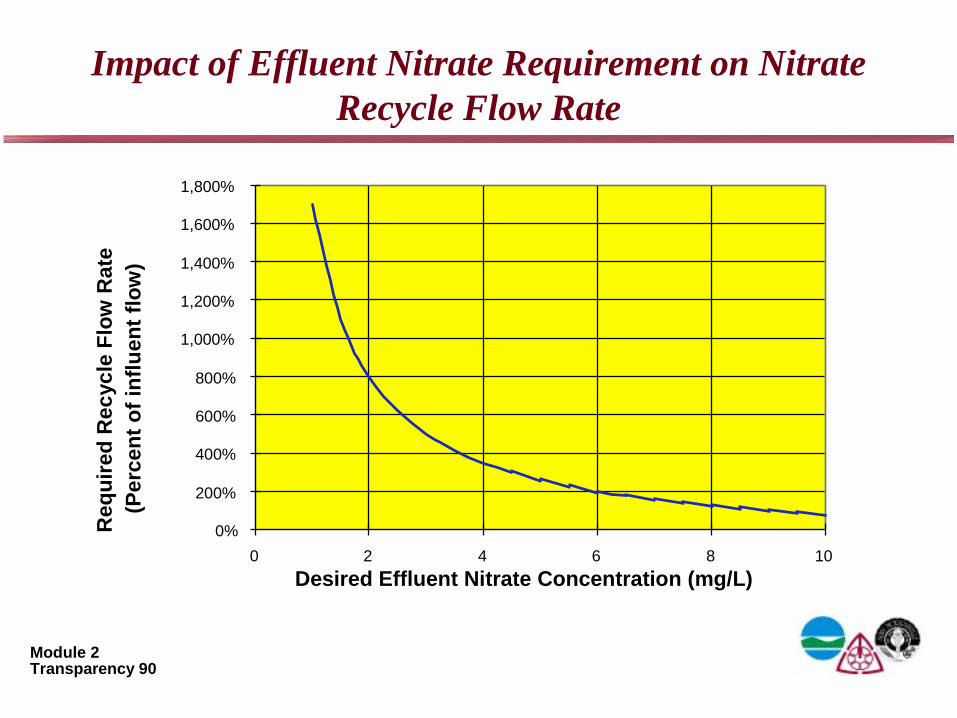
Calculation of Required Recycle Rate
RAS + NR = Q[N/Ne - 1]Required Recycle Rate
RAS + NR = Total recycle rateRAS = Return activated sludge flow rateNR = Nitrate recycle flow rateN = Concentration of nitrate to be denitrifiedNe = Concentration of nitrate in effluentQ = Plant flow rate
Module 2Transparency 90
Impact of Effluent Nitrate Requirement on Nitrate Recycle Flow Rate