Nitrogen use efficiency . CSU Plant sensor training Wednesday, April 10 , 2013. Crop reflectance sensing technology for nutrient management. Marvin Stone Regents professor emeritus Biosystems and Agricultural Engineering Oklahoma State University Stillwater, OK [email protected]. - PowerPoint PPT Presentation
Marvin Stone Regents professor emeritus Biosystems and Agricultural Engineering Oklahoma State University Stillwater, OK [email protected]Nitrogen use efficiency Crop reflectance sensing technology for nutrient management CSU Plant sensor training Wednesday, April 10, 2013
Transcript
Marvin StoneRegents professor emeritus Biosystems and Agricultural EngineeringOklahoma State UniversityStillwater, [email protected]
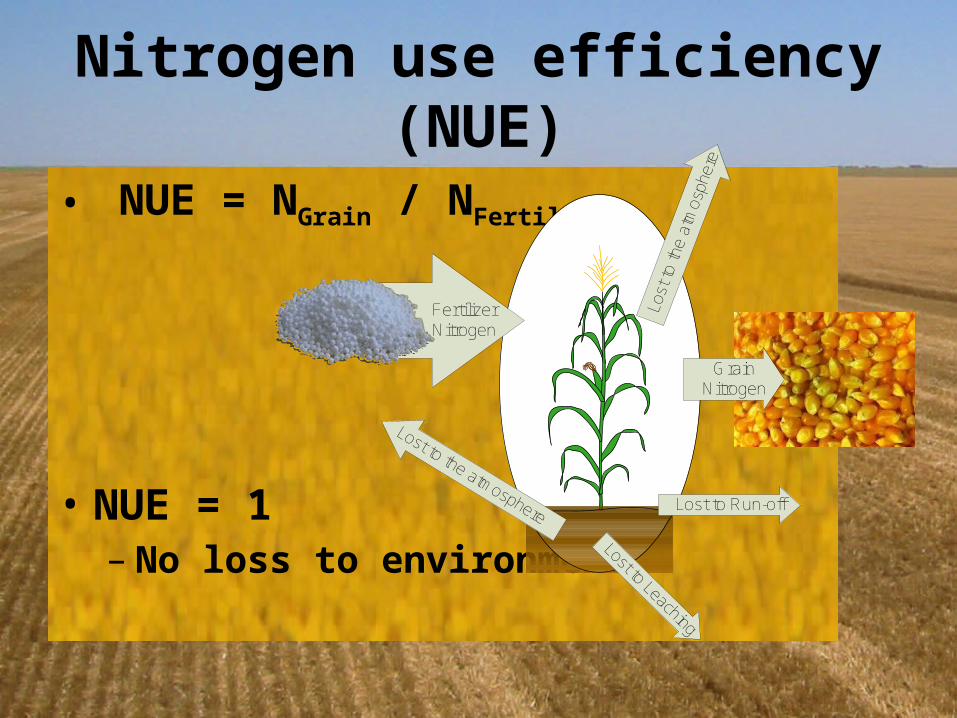
Nitrogen use efficiency
Crop reflectance sensing technology for nutrient management
CSU Plant sensor trainingWednesday, April 10, 2013
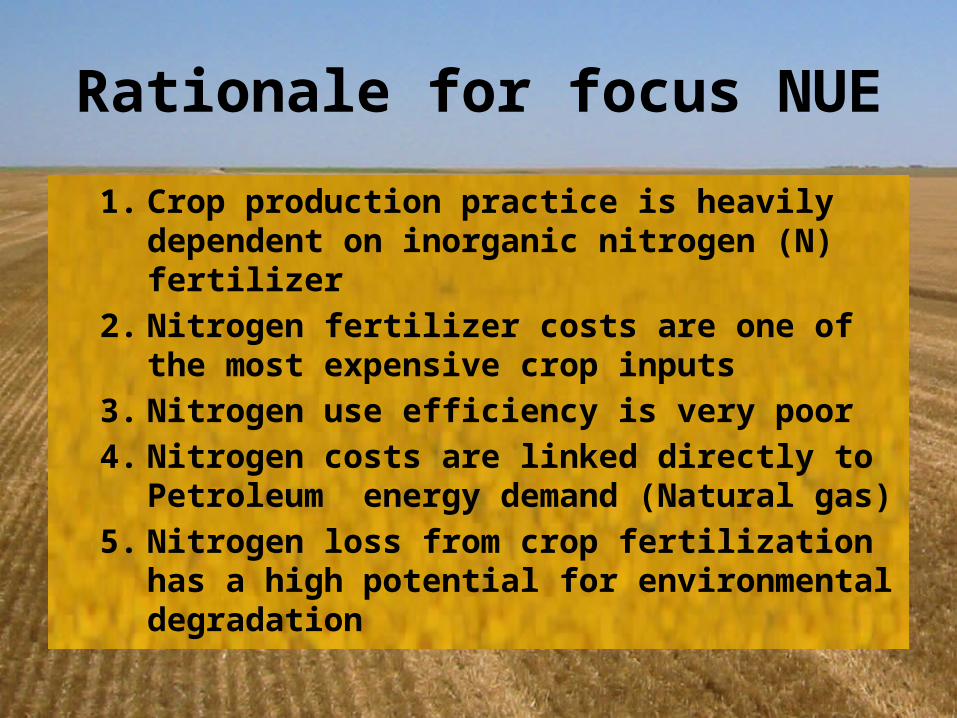
1. Crop production practice is heavily dependent on inorganic nitrogen (N) fertilizer
2. Nitrogen fertilizer costs are one of the most expensive crop inputs
3. Nitrogen use efficiency is very poor4. Nitrogen costs are linked directly to Petroleum
energy demand (Natural gas)5. Nitrogen loss from crop fertilization has a high
potential for environmental degradation
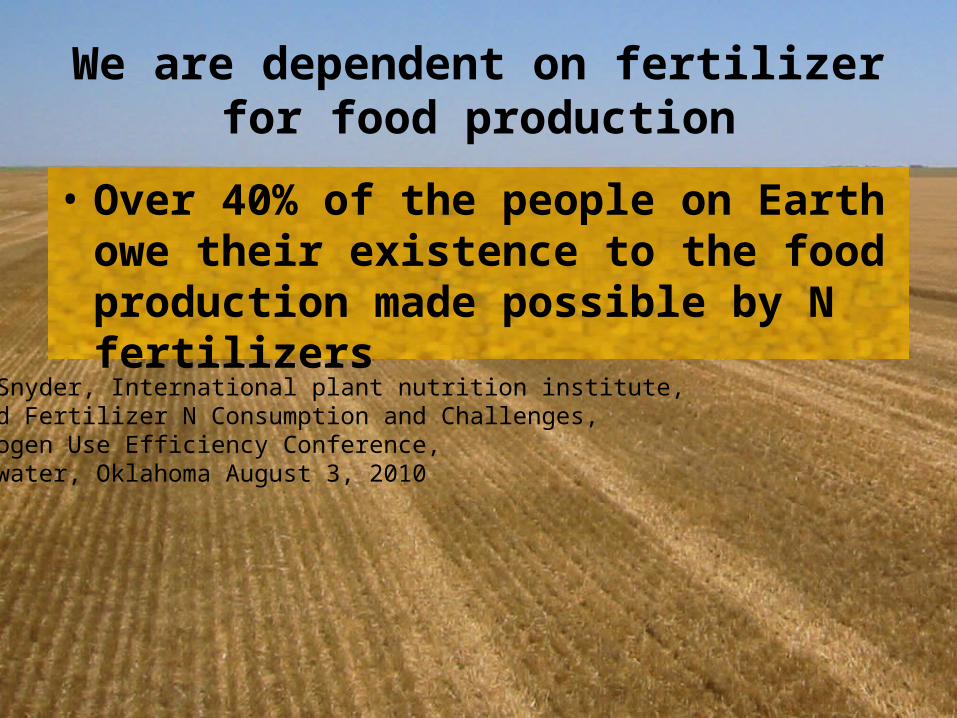
We are dependent on fertilizer for food production
• Over 40% of the people on Earth owe their existence to the food production made possible by N fertilizers
C.S. Snyder, International plant nutrition institute, World Fertilizer N Consumption and Challenges, Nitrogen Use Efficiency Conference, Stillwater, Oklahoma August 3, 2010
Crop production heavily dependent on inorganic N fertilizer
• Organic fertilizers are inadequate to meet needs– “no more than 10-15% of world fertilizer needs could be
met by animal manure”• (Wolman and Fournier, SCOPE, 1987)
– US Human wastes could supply “about 15% of the amount presently marketed as inorganic fertilizer”
• (Wolman and Fournier, SCOPE, 1987)
• In China, the proportion of mineral fertilizer to organic fertilizers has gone from 0% in 1949 to 69.7% in 1995
• (Portch and Jin, UNESCO-EOLSS 2012)
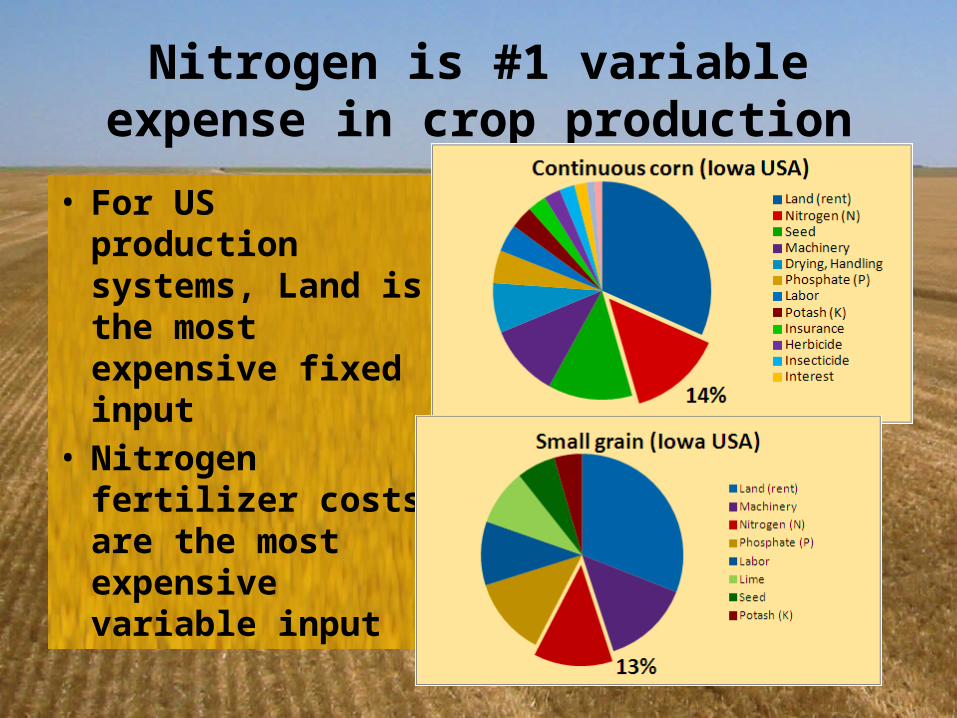
Nitrogen is #1 variable expense in crop production
• For US production systems, Land is the most expensive fixed input
• Nitrogen fertilizer costs are the most expensive variable input
Nitrogen use efficiency (NUE) is low
• World-wide NUE has been estimated at 33%• Raun and Johnson, Agron. J. 91:357–363 (1999)
• In North China Plain wheat and corn production, “N fertilizer could be cut in half without loss of yield or grain quality”
• Vitousek et al., SCIENCE Vol. 324:19 June 2009.
• “Nitrogen use efficiency is declining as nitrogen fertilizer consumption increases faster than grain production.”
• Current world fertilizer trends and outlook to 2011/12. FAO, Rome, 2008.
NUE has gone down asN-Rates increased
NUE
Tillman et al. 2002. Nature
33%
NUE Examples in Cereals(Raun, 2006)
Author Crop Method Year LocationNUE (grain)Varvel Corn 15N 1990 NE 43-53%Russelle Corn Diff. 1981 NE 46%Raun Corn Diff. 1989 NE 30-40%Olson Wheat 15N 1984 KS 27-33%Bronson Wheat 15N 1991 CO 53%Raun Wheat 15N 1999 OK 21-32%Lees Wheat 15N 2000 OK 38-41%Westerman Sorghum 15N 1972 IL 51%Varvel Sorghum 15N 1991 NE 48%DeDatta Rice 15N 1988 Asia 37-47%
N fertilizer production linked to Energy
• One tonne of fertilizer N synthesized through the Haber–Bosch process requires 873 m3 of natural gas
• (Vance, 2001)
N2 + 3 H2 2 NH⇌ 3
CH4NH3
CO2
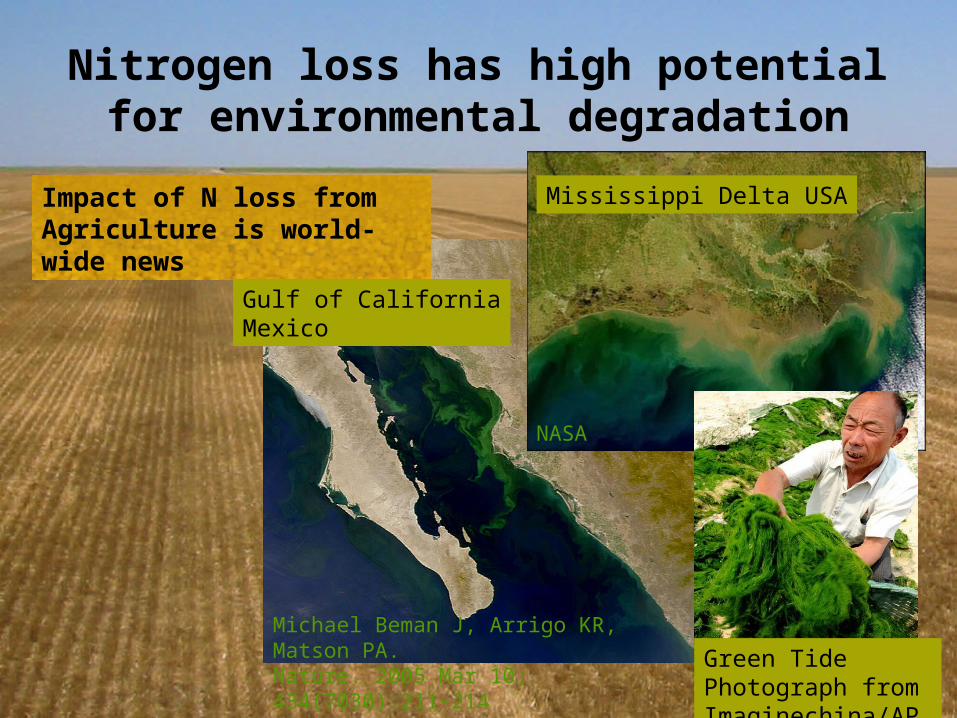
Nitrogen loss has high potential for environmental degradation
Michael Beman J, Arrigo KR, Matson PA. Nature. 2005 Mar 10; 434(7030):211-214
NASA
Green Tide Photograph from Imaginechina/AP
Impact of N loss from Agriculture is world-wide news
Gulf of CaliforniaMexico
Mississippi Delta USA
US GhG Emissions from Agriculture (CO2 Equivalent)
Agriculture6%
Other94%
Total U.S. greenhouse gas emissions
CH4 Enteric Fermentation
33%
CH4 Manure management
12%
Other (CH4 Rice) 2%N2O Manure management
4%
N2O Ag. Soil Management
49%
INVENTORY OF U.S. GREENHOUSE GAS EMISSIONS AND SINKS: 1990-2010, EPA 430-R-12-001, US EPA, 2012
Strategies for improving NUE
• Crop rotations with legumes• Genetic improvements focused on NUE• Management of de-nitrification
• Sensor based management of In-season N application
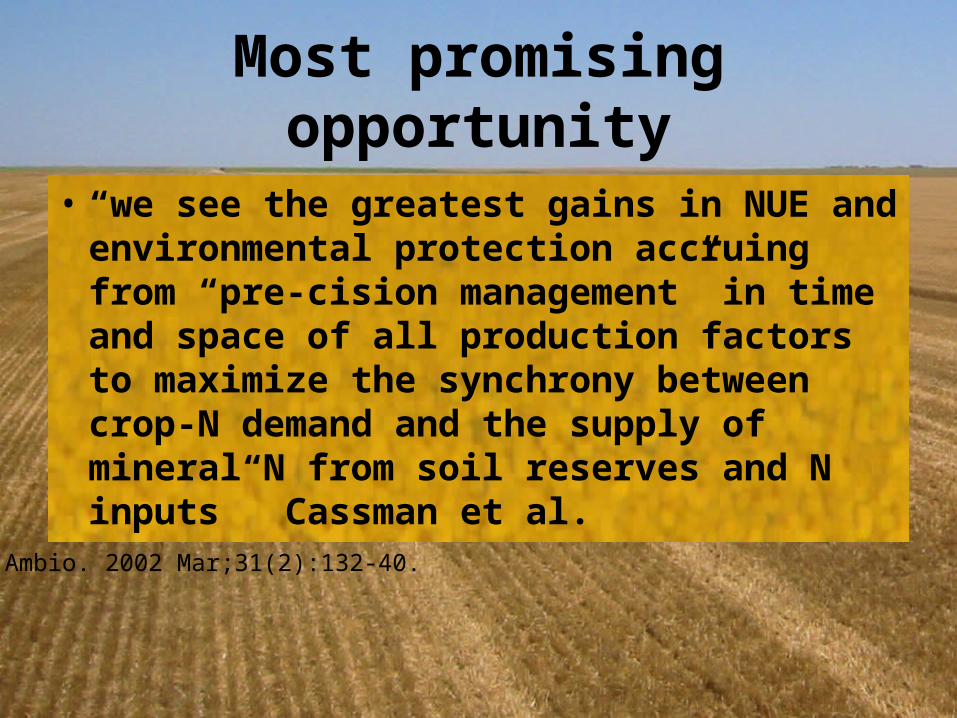
Most promising opportunity
• “we see the greatest gains in NUE and environmental protection accruing from “pre-cision management” in time and space of all production factors to maximize the synchrony between crop-N demand and the supply of mineral N from soil reserves and N inputs” Cassman et al.
Ambio. 2002 Mar;31(2):132-40.
Crop canopy reflectance sensors
• Sensors detect optical reflectance based NDVI
CLAAS Agrosystems, http://www.claas.com
Jared Crain, PSS, OSU, CIMMYT Obregon, Mexico
Canopy reflectance sensors(different forms exist)
Crop Circle ™ ACS470Greenseeker ™ Handheld
Cropscan™ MSR5
Ocean Optics Jaz™
Sensor-based Application Rate Controllers
GreenSeeker ™
OptRx ™
Crop Sensor ™CropSpec ™
550 6504500
0.1
0.2
0.3
0.4
0.5
0.6
0.7
0.8
0.9
1
400 500 600 700 800
Wavelength, nm
Refle
ctan
ce
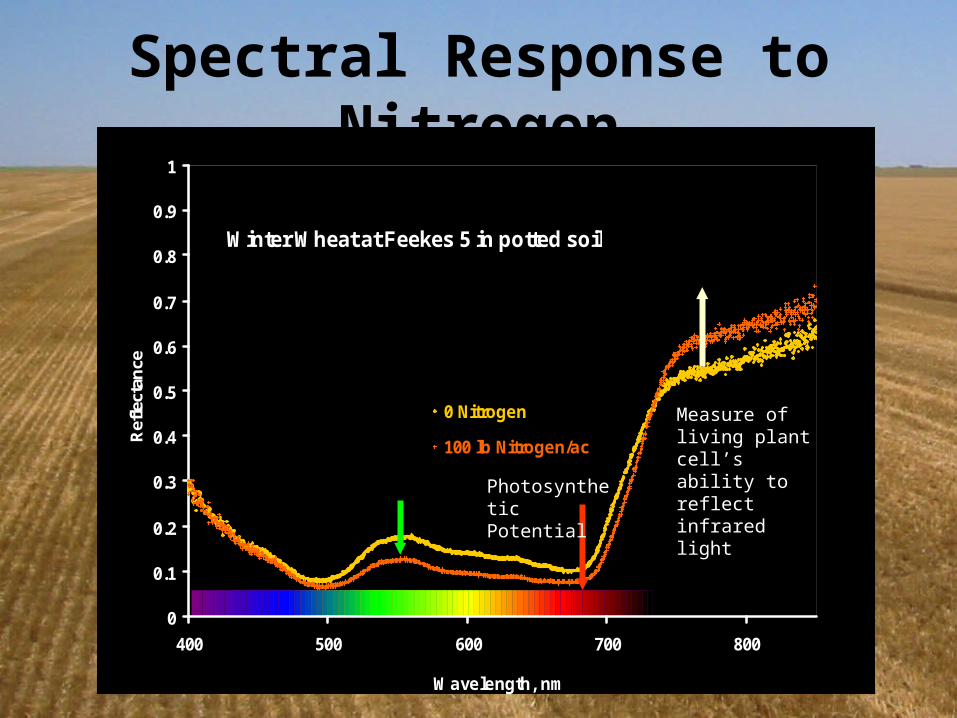
0 Nitrogen
100 lb Nitrogen/ac
Winter Wheat at Feekes 5 in potted soil
Spectral Response to Nitrogen
Measure of living plant cell’s ability to reflect infrared lightPhotosynthetic
Potential
REDNIR
REDNIRNDVI
0
1
2
3
4
5
6
0 0.002 0.004 0.006 0.008 0.01
INSEY=NDVI/Days from planting to sensing GDD>0
Gra
in y
ield
, Mg/
ha
P erkins N&P , 1998P erkins S&N, 1998Tipton S&N, 1998P erkins N&P , 1999Experiment 222, 1999Experiment 301, 1999Efaw A A, 1999Experiment 801, 1999Experiment 502, 1999P erkins N&P , 2000Experiment 222, 2000Experiment 301, 2000Efaw A A, 2000Experiment 801, 2000Experiment 502, 2000Hennessey, AA , 2000P erkins N&P , 2001Experiment 222, 2001Experiment 301, 2001Efaw A A, 2001Experiment 801, 2001Experiment 502, 2001Hennessey, AA , 2001
y=0.4593e246.3x
R2=0.55
Yield EstimationINSEY vs. Wheat Yield (24 locations, 1998-2001)
Response Index can allow estimation of in-season mineralization
practiceFarmer
Ref_strip
NDVINDVI
RI_
Role of RI in Yield Estimation
• Response Index (RI) Estimates yield with added N
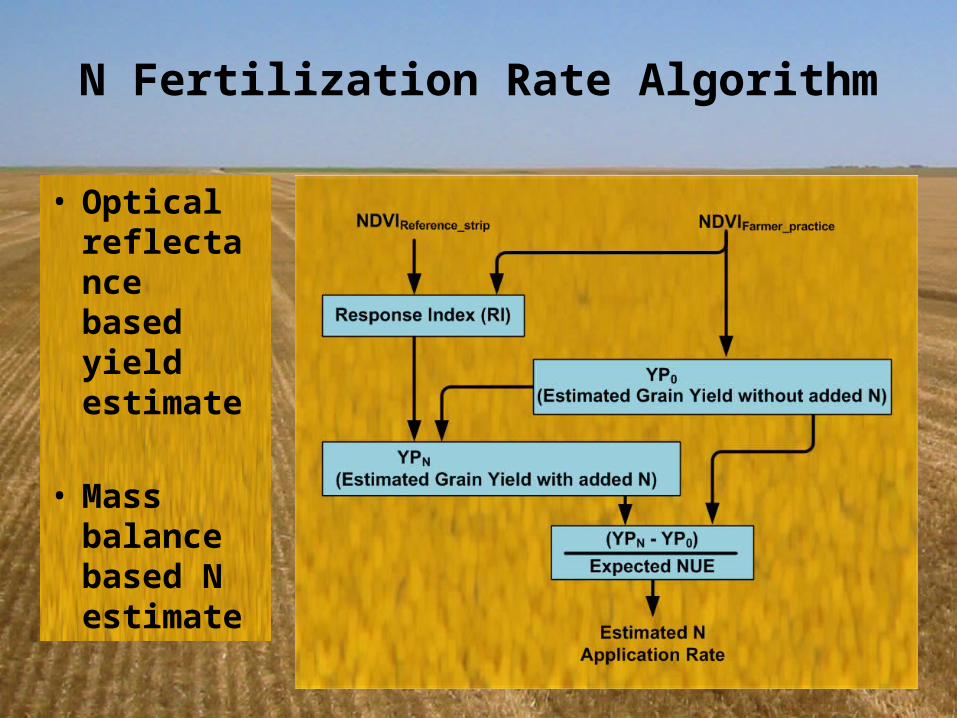
N Fertilization Rate Algorithm
• Optical reflectance based yield estimate
• Mass balance based N estimate
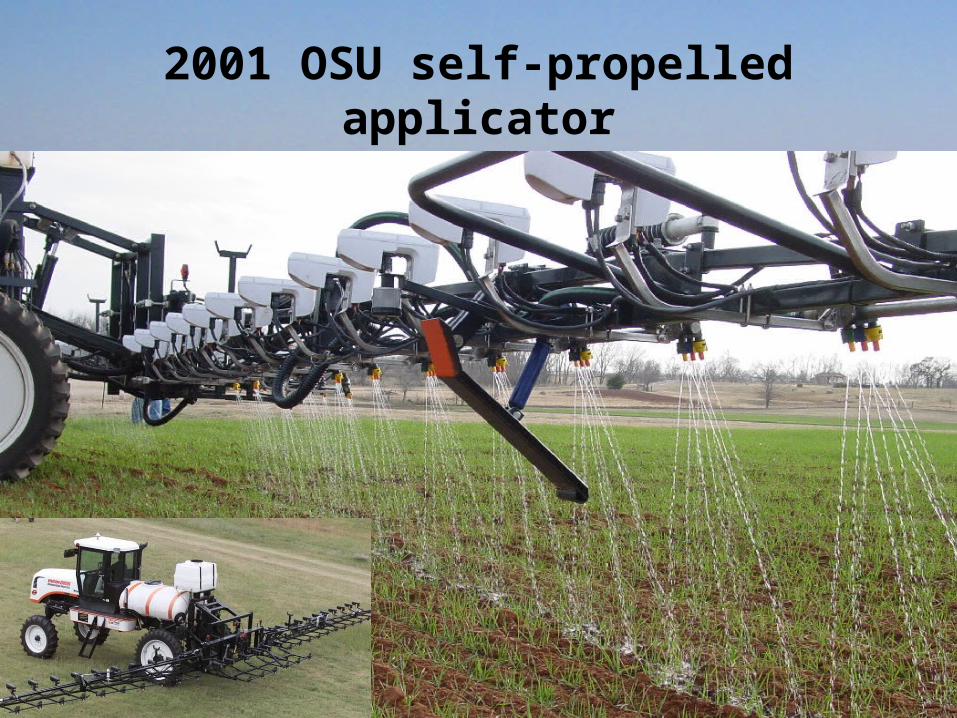
2001 OSU self-propelled applicator
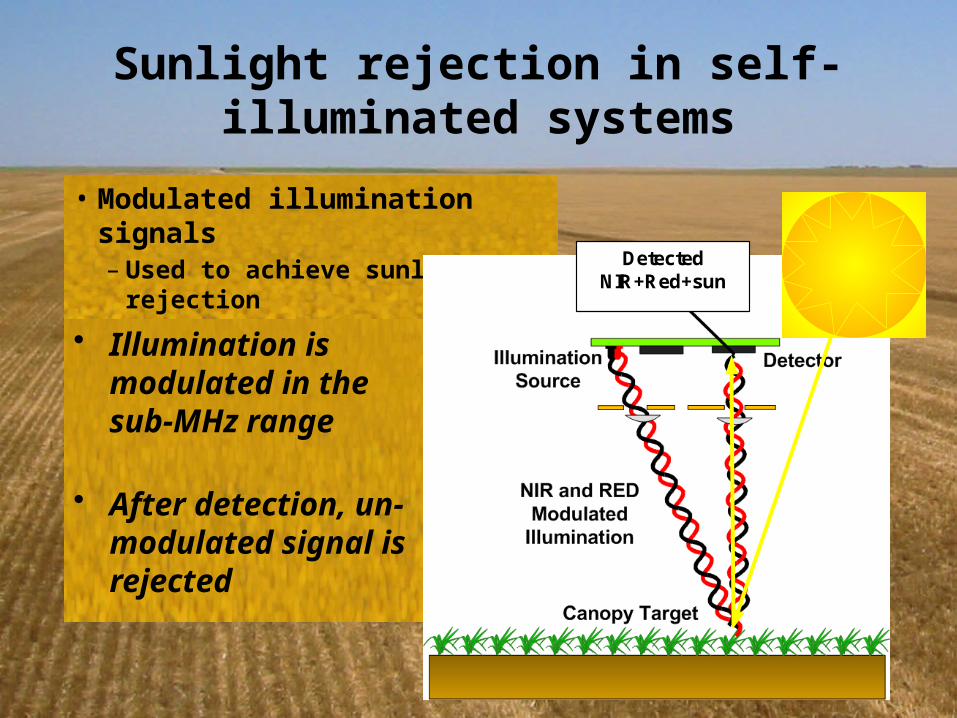
Light generation
Light signal
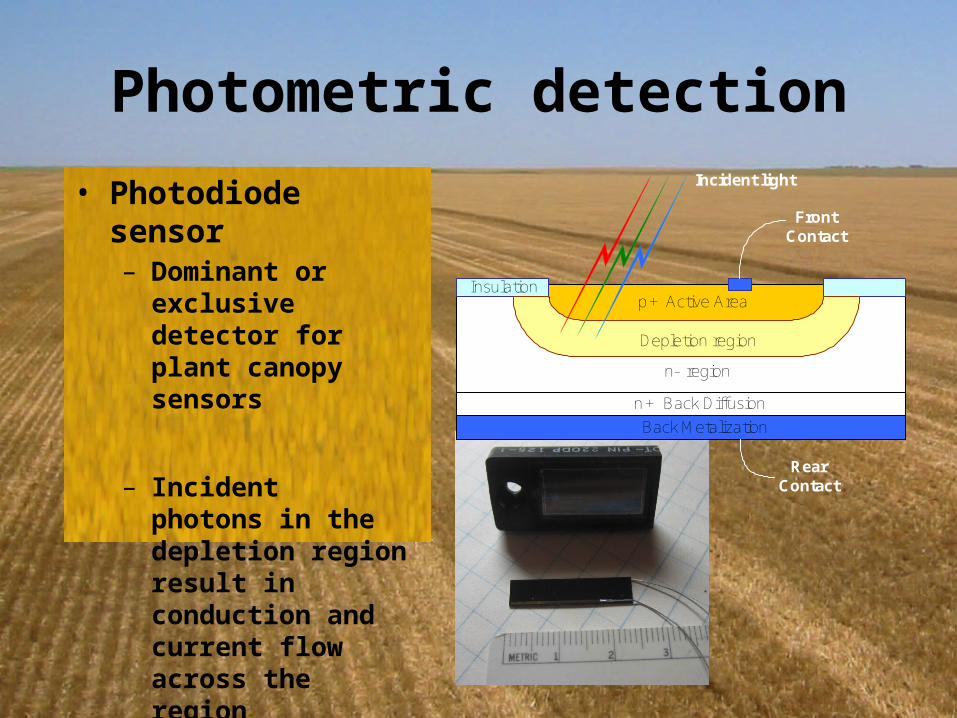
Light detection
Valve settings· Calculate NDVI· Lookup valve setting· Apply valve setting· Send data to UI
“Sensor”Valves
and Nozzles
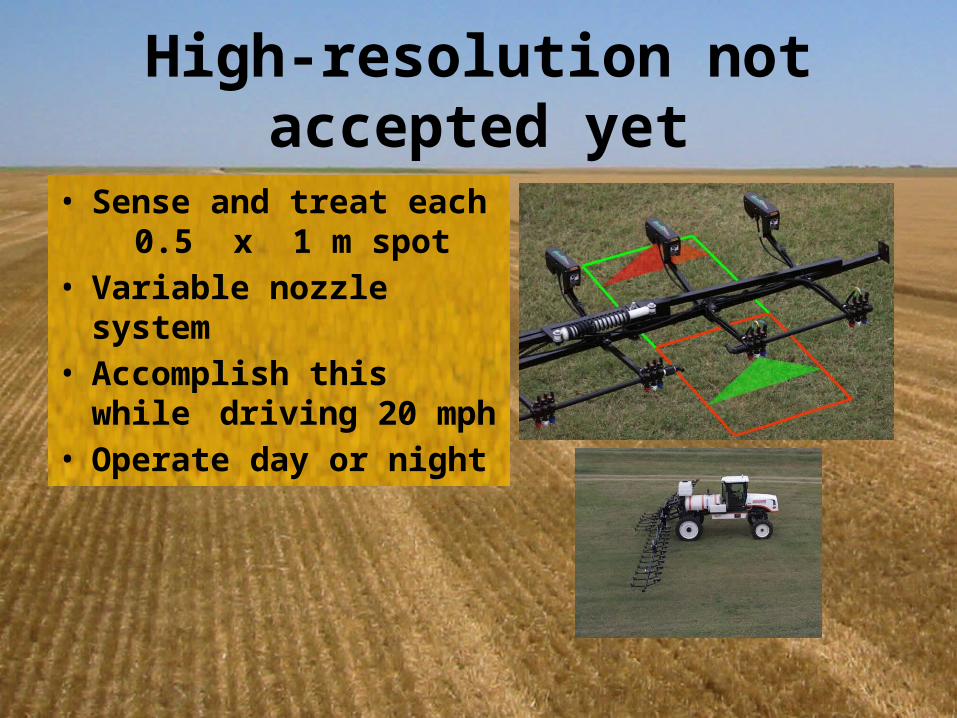
High-resolution not accepted yet
• Sense and treat each0.5 x 1 m spot
• Variable nozzle system• Accomplish this while
driving 20 mph• Operate day or night
Commercial self-propelled applicator
Adoption of sensor based N management
• Local algorithms– Suitable for local crops and cultural practices
• Sensor technologies– Adapted to local crops and cultural practices– Cost appropriate for local conditions
• Training of farmers and technical support– Manage risk through locally demonstrated results
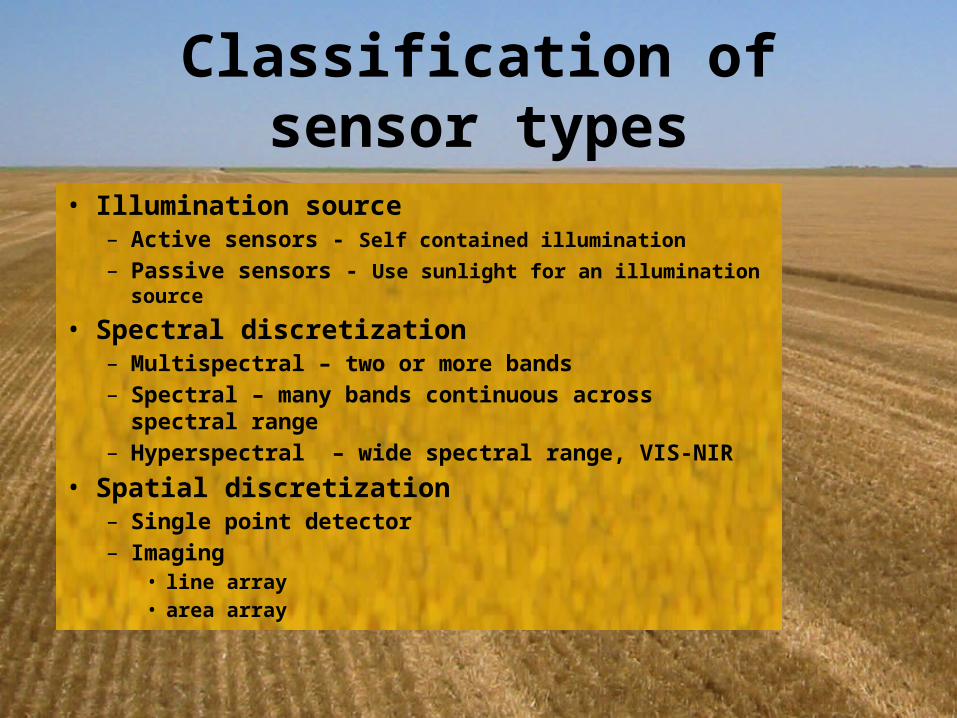
Classification of sensor types
• Illumination source– Active sensors - Self contained illumination– Passive sensors - Use sunlight for an illumination source
• Spectral discretization– Multispectral – two or more bands– Spectral – many bands continuous across spectral range– Hyperspectral – wide spectral range, VIS-NIR
• Spatial discretization– Single point detector– Imaging
• line array• area array
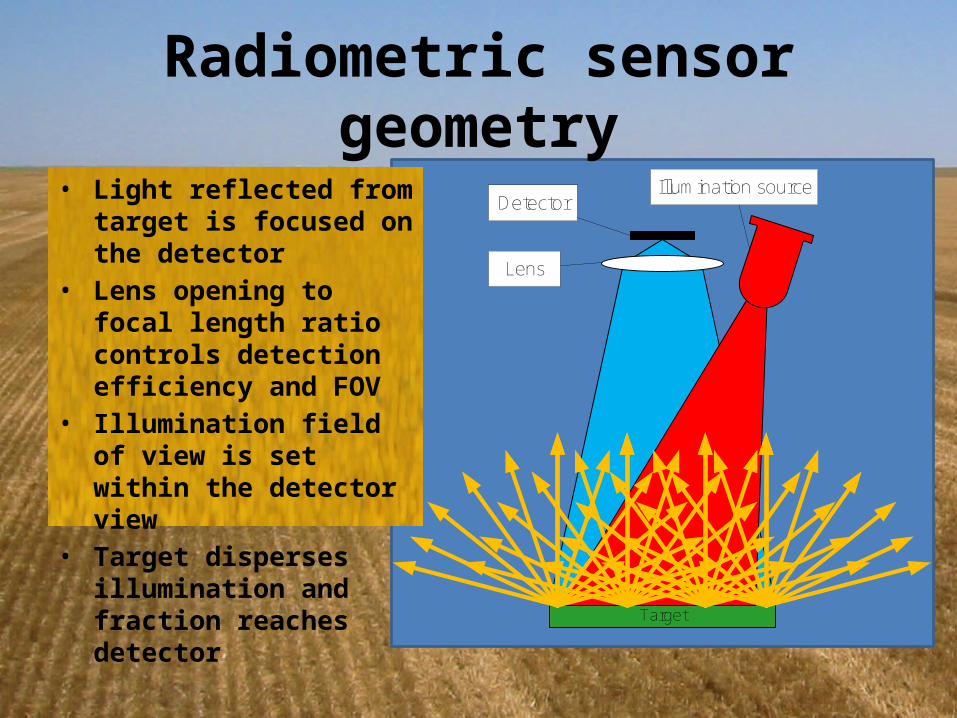
• Light reflected from target is focused on the detector
• Lens opening to focal length ratio controls detection efficiency and FOV
• Illumination field of view is set within the detector view
• Target disperses illumination and fraction reaches detector
Target
Lens
DetectorIllumination source
Radiometric sensor geometry
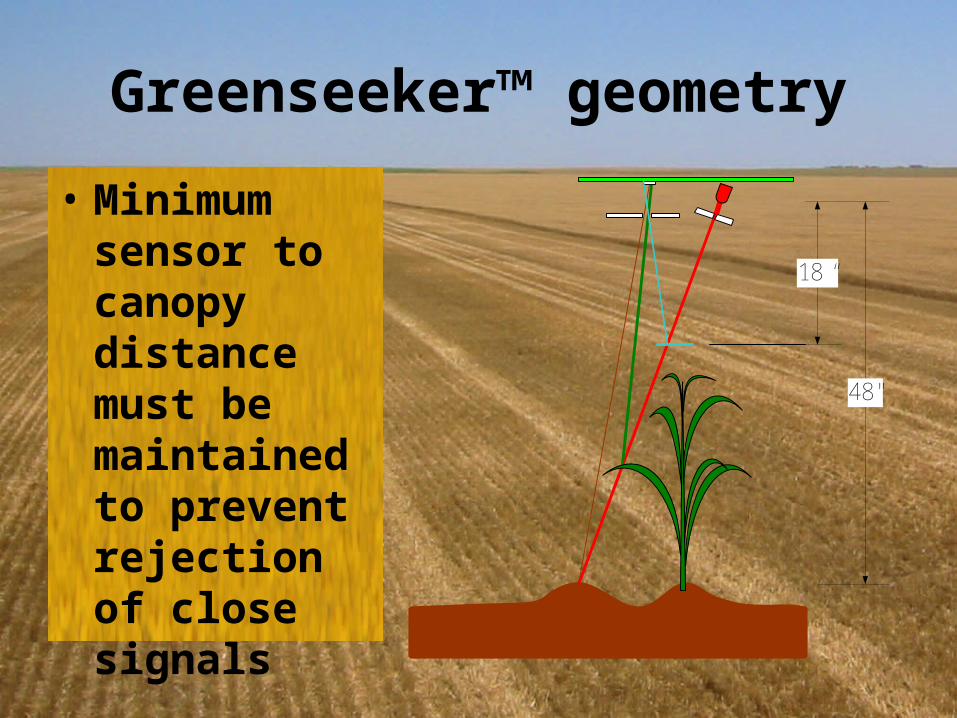
Active sensor - Greenseeker ™
LED Light SourceSource Colimation
PCV Cylindrical Source Optics
PCV Detector Optics
24"
36"
Detector Colimation
Environmental window
3/8"
Reflected DetectorIncident Detector
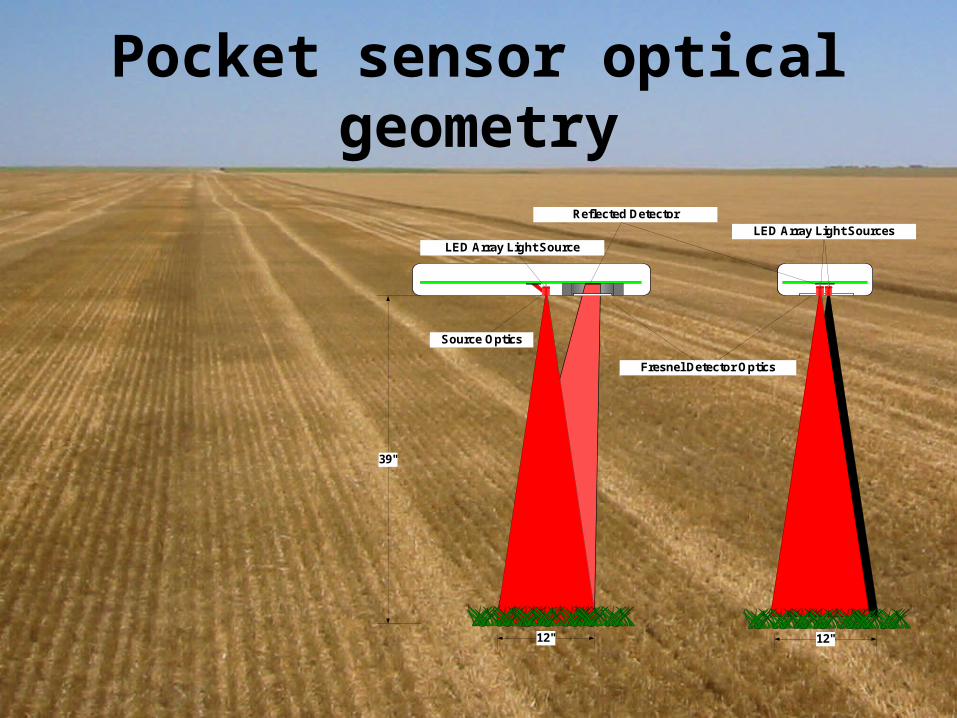
Pocket sensor optical geometry
LED Array Light Source
Source Optics
Fresnel Detector Optics
12"
39"
12"
Reflected DetectorLED Array Light Sources
Inir
Rnir
Ired
R red
Reflectance measurement
Based on ratios ofRed and NIR Reflectance
Red Reflectance: = Rred / Ired
Example Index:red / nir
Reflectance is primarilya function of target
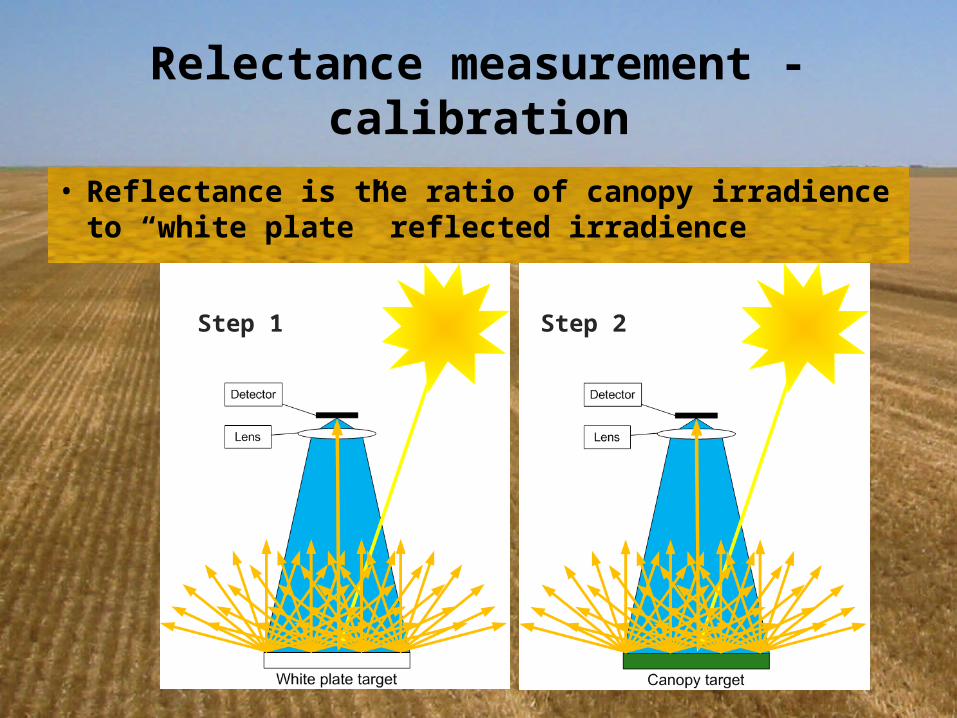
Relectance measurement - calibration
• Reflectance is the ratio of canopy irradience to “white plate” reflected irradience
Step 1 Step 2
Stored “white reference” sensor• Calibrated to a “white plate” to produce reflectance• “White” values are stored until next calibration