35
NJCAT TECHNOLOGY VERIFICATION Filterra® Bioretention System Contech Engineered Solutions May, 2014
| Date post: | 13-Aug-2018 |
| Category: |
Documents |
| Upload: | truongdiep |
| View: | 216 times |
| Download: | 0 times |

NJCAT TECHNOLOGY VERIFICATION
Filterra® Bioretention System
Contech Engineered Solutions
May, 2014

i
TABLE OF CONTENTS
List of Figures ii List of Tables iii 1. Description of Technology 1 2. Laboratory Testing 2
2.1 Test Setup 2 2.2 Testing Procedures 6 2.3 Removal Efficiency Testing 8 2.4 Sediment Mass Loading Capacity 9 2.5 Scour Testing 9 2.6 Quality Assurance/Quality Control 10
3. Performance Claims 10 4. Supporting Documentation 12
4.1 Removal Efficiency Testing 12 4.2 Sediment Mass Loading Capacity Testing 12 4.3 Scour Testing 13 4.4 Quality Assurance/Quality Control 17
5. Design Limitations 18
6. Maintenance Plans 19 7. Statements 21 8. References 26 Verification Appendix 27

ii
List of Figures Page
Figure 1 Filterra Bioretention System ..............................................................................1
Figure 2 Schematic of Test Unit.......................................................................................3
Figure 3 Vibratory Hopper, Mixing Funnel and Influent Water Line ..............................4
Figure 4 View of the Laboratory Setup ............................................................................5
Figure 5 Plan View of the Laboratory Setup ....................................................................5
Figure 6 Effluent Pipe Discharging Water during Scour Testing ....................................6
iii
List of Tables
Page
Table 1 Test Sediment Feed Results and Requirements .................................................7
Table 2 Summary of Removal Efficiency Testing........................................................14
Table 3 Summary of Sediment Mass Loading Capacity Testing ..................................15
Table 4 Summary of Scour Pre-Loading Flow Rates .................................................. 16
Table 5 Summary of Scour Test Sediment Pre-Load .................................................. 16
Table 6 Summary of Scour Test Flow Rates ............................................................... 17
Table 7 Summary of Scour Test Sediment Concentrations ......................................... 17
Table 8 Summary of QA/QC Samples .........................................................................18

1
1. Description of Technology The Filterra Bioretention System is a standalone, fully equipped, pre-constructed drop-in place unit designed for applications in the urban landscape to treat contaminated stormwater runoff. Stormwater runoff flows through a specially designed filter media mixture contained in a landscaped concrete container. The filter media captures and immobilizes sediments reducing the potential for re-suspension of sediments during high flow events; associated pollutants are then decomposed, volatilized and incorporated into the biomass of the Filterra bioretention system’s micro/macro fauna and flora. Once the stormwater runoff flows through the filter media it continues into an underdrain system at the bottom of the pre-cast concrete unit, where the treated water is discharged. Higher flows bypass the Filterra via a downstream inlet structure, curb cut or other appropriate relief. (Figure 1)
Figure 1 Filterra Bioretention System
For on-line installation, Filterra Internal Bypass – Curb (FTIB-C) units are used. A steel Terraflume internal bypass tray is installed two inches above the surface of the FTIB-C unit (mulch layer). The steel tray contains a center pipe which allows bypass flows to enter and flow

2
out of the unit via a 6-inch diameter polyvinyl chloride (PVC) pipe.1 The Standard Filterra (FT) installed in the field bypasses flows higher than the desired treatment flow rate externally for off-line design.
2. Laboratory Testing
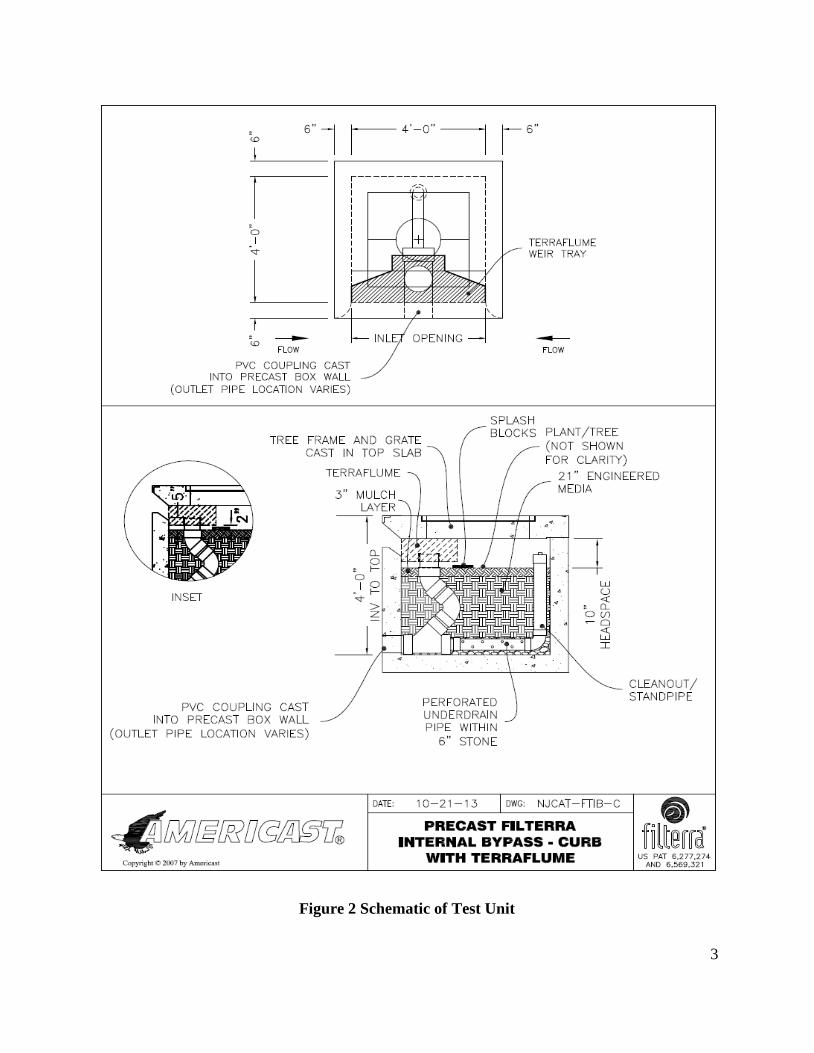
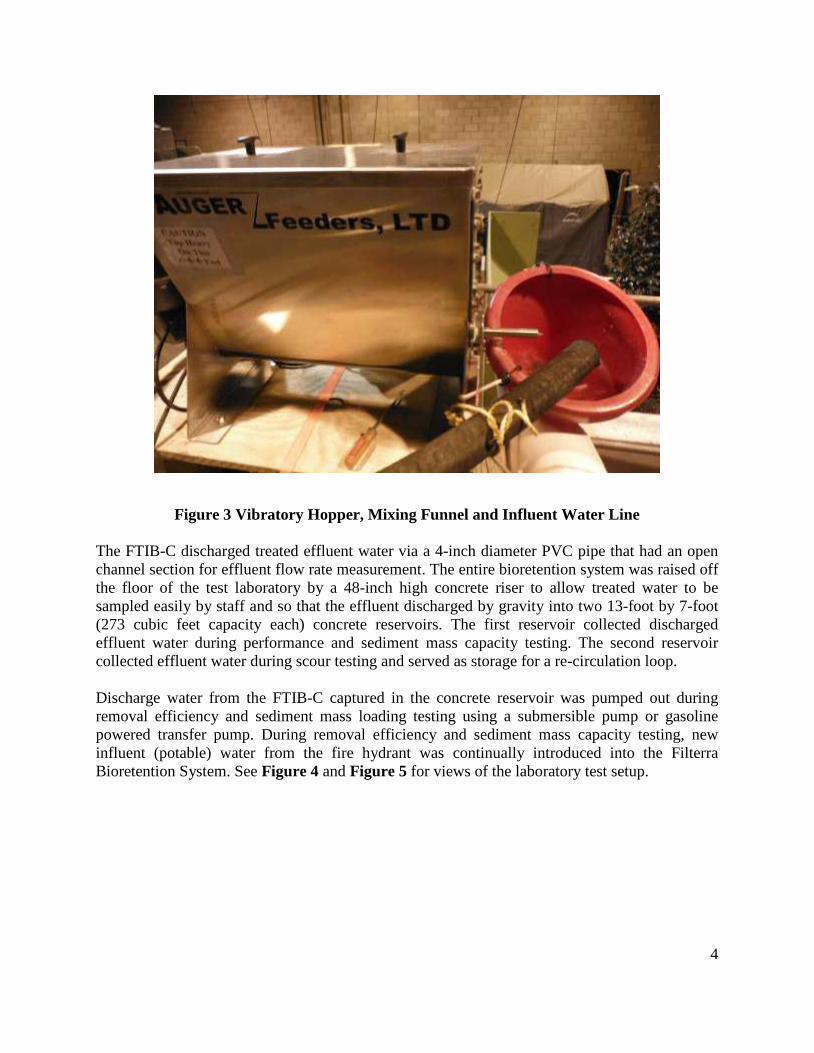
2.1 Test Setup Filterra tested a full-scale, commercially available four-foot (4’) by four-foot (4’) Filterra Bioretention System (designated a 4’x4’ unit). Where “Filterra Bioretention System” is used throughout this report, this will represent both FT and FTIB-C units. A 4’ by 4’ FTIB-C unit was the model configuration selected for testing; however, both configurations provide water quality treatment in the same manner at the maximum treatment flow rate (MTFR). The 4’x4’ unit contains 16 square feet of filter surface area enclosed in a pre-cast concrete box. This unit is the smallest model size available for commercial application. The walls and bottom of the unit are constructed of 6-inch thick concrete (outer dimensions of the unit are five-foot by five-foot). The bottom of the unit contains an under-drain system consisting of a perforated 4-inch diameter PVC pipe in a 6-inch thick layer of stone, which is connected to a clean-out via a 90-degree elbow. Above the under-drain system is a 21-inch thick layer of specialized bioretention filtration media (proprietary blend) that is covered by a 3-inch thick layer of shredded mulch. Approximately 10 inches of empty space remain between the mulch layer and the top of the concrete box walls. The Terraflume sits approximately two inches above the mulch layer and the bypass pipe inlet in the Terraflume is three inches from its’ base (five inches above the mulch layer). Splash blocks/rocks are also on the surface of the mulch at the outlet from the Terraflume. A tree is located (planted) at the center of the unit. Figure 2 is a schematic of the FTIB-C test unit. Influent (potable) water was obtained from an existing on-site fire hydrant located outside Filterra’s testing laboratory. A 2-inch diameter fire hose was connected from the fire hydrant to 2-inch diameter PVC piping which connected to a diaphragm valve (in the laboratory) to control the flow rate into the unit being tested. A paddle wheel flow meter providing instantaneous flow data was attached to the influent pipe to measure the influent flow rate into the unit. Downstream of the flow meter was the influent sediment feed via an auger screw attached to a vibratory hopper. The screw dispensed sediment into a large funnel for sediment mixing (Figure 3) before discharging into a 6-inch diameter PVC pipe that fed into a constructed gutter that discharged into the FTIB-C. The laboratory test used a full-scale 4’ x 4’ FTIB-C with the Terraflume tray installed. The unit was filled with a mulch layer, specialized filtration media, under-drain system, and the tree as described above. The unit tested also included an additional perforated stand-pipe component, per the recently issued New Jersey Department of Environmental Protection Filter Protocol (NJDEP, 2013b), that was capped at the bottom of the filtration media profile (set on the top of under-drain stone layer – 24 inches below the mulch surface layer) and rose above the mulch to allow for head measurements. The stand-pipe was wrapped in a geotextile to minimize sediment intrusion through the perforations. Head measurements were recorded via the measured water level in the stand-pipe. 1 An 8-inch diameter pipe is available for larger units.
3
Figure 2 Schematic of Test Unit
4
Figure 3 Vibratory Hopper, Mixing Funnel and Influent Water Line
The FTIB-C discharged treated effluent water via a 4-inch diameter PVC pipe that had an open channel section for effluent flow rate measurement. The entire bioretention system was raised off the floor of the test laboratory by a 48-inch high concrete riser to allow treated water to be sampled easily by staff and so that the effluent discharged by gravity into two 13-foot by 7-foot (273 cubic feet capacity each) concrete reservoirs. The first reservoir collected discharged effluent water during performance and sediment mass capacity testing. The second reservoir collected effluent water during scour testing and served as storage for a re-circulation loop. Discharge water from the FTIB-C captured in the concrete reservoir was pumped out during removal efficiency and sediment mass loading testing using a submersible pump or gasoline powered transfer pump. During removal efficiency and sediment mass capacity testing, new influent (potable) water from the fire hydrant was continually introduced into the Filterra Bioretention System. See Figure 4 and Figure 5 for views of the laboratory test setup.

5
Figure 4 View of the Laboratory Setup
Figure 5 Plan View of the Laboratory Setup
6
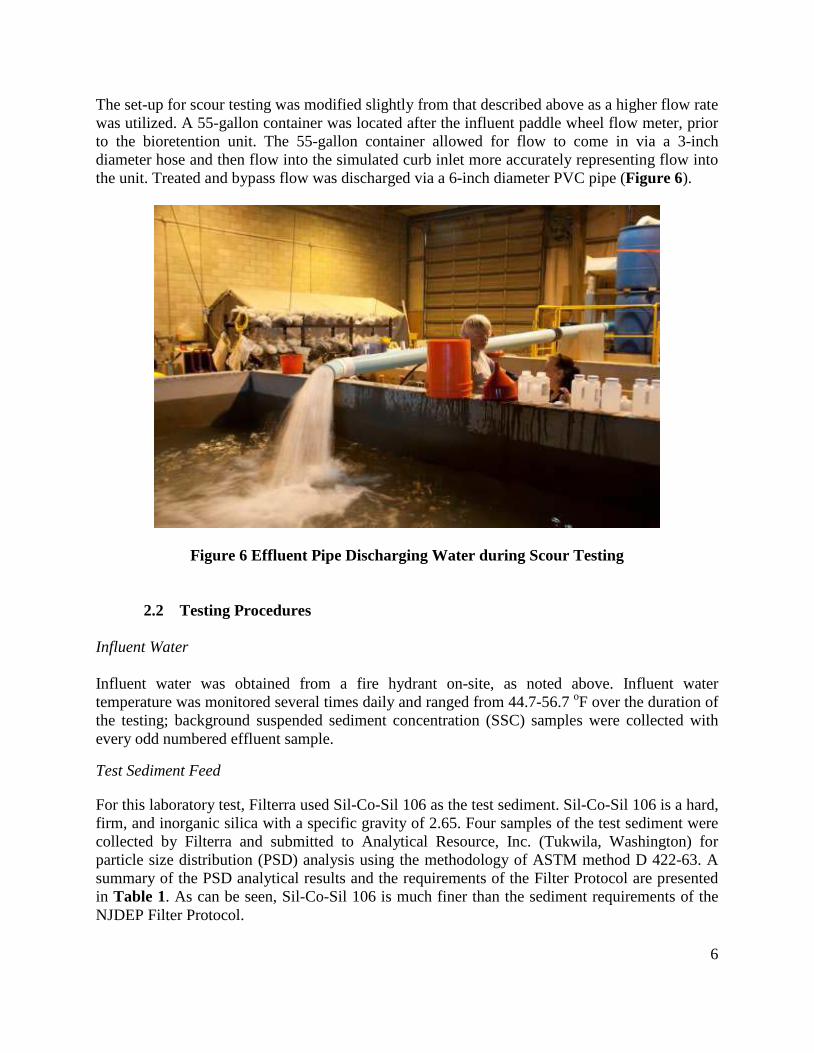
The set-up for scour testing was modified slightly from that described above as a higher flow rate was utilized. A 55-gallon container was located after the influent paddle wheel flow meter, prior to the bioretention unit. The 55-gallon container allowed for flow to come in via a 3-inch diameter hose and then flow into the simulated curb inlet more accurately representing flow into the unit. Treated and bypass flow was discharged via a 6-inch diameter PVC pipe (Figure 6).
Figure 6 Effluent Pipe Discharging Water during Scour Testing
2.2 Testing Procedures Influent Water Influent water was obtained from a fire hydrant on-site, as noted above. Influent water temperature was monitored several times daily and ranged from 44.7-56.7 oF over the duration of the testing; background suspended sediment concentration (SSC) samples were collected with every odd numbered effluent sample.
Test Sediment Feed
For this laboratory test, Filterra used Sil-Co-Sil 106 as the test sediment. Sil-Co-Sil 106 is a hard, firm, and inorganic silica with a specific gravity of 2.65. Four samples of the test sediment were collected by Filterra and submitted to Analytical Resource, Inc. (Tukwila, Washington) for particle size distribution (PSD) analysis using the methodology of ASTM method D 422-63. A summary of the PSD analytical results and the requirements of the Filter Protocol are presented in Table 1. As can be seen, Sil-Co-Sil 106 is much finer than the sediment requirements of the NJDEP Filter Protocol.

7
Table 1 Test Sediment Feed Results and Requirements
Particle Size (µm)
Passing (%) NJDEP Minimum
Requirement (%)
1 2 3 4
250 100 100 99.9 100 90 150 99.9 99.9 99.8 99.7 75 75 93.5 93.3 93.3 92.6 50
50 -- -- -- -- 45 32 60.1 60.1 61.9 59.6 -- 22 47.3 45.5 47.3 41.6 -- 20 -- -- -- -- 35 13 34.6 34.6 34.6 27.1 -- 9 28.2 27.3 27.3 19.9 -- 8 -- -- -- -- 20 7 21.9 20 20.9 15.4 -- 5 -- -- -- -- 10
3.2 12.7 11.8 11.8 7.2 -- 2 -- -- -- -- 5
1.3 5.5 5.5 5.5 2.7 --
During testing, the test sediment was fed into the influent water stream as described in Section 2.1. Initially, the paired (influent and effluent) sampling method was used per the Quality Assurance Project Plan (QAPP; Filterra 2013). However, the analytical results from the first 15 test runs indicated that the variability of the influent SSC concentrations was greater than the coefficient of variation [COV] requirement in the Filter Protocol (COV less than 0.1). Therefore, the remaining test runs were conducted using the test sediment feed calibration methodology in accordance with the Filter Protocol. The variability in the influent SSC was likely due to minor variations in the auger feed rate into the influent water stream. At the MTFR, utilizing a 1-liter sample container for sample collection, a small variation in test sediment feed due to sediment clumping or sediment particle size variation during dosing resulted in a COV greater than 0.1. Using the alternative acceptable test sediment feed calibration method, which employed a one minute sample interval, rather than a 1.5-second sample time (1-liter at MTFR of 23 gallons per minute (gpm) or 87 liters per minute) for paired sampling, greatly reduced the variability in measured test sediment feed.
Flow Measurements
A 2-inch diameter paddle wheel flow meter (6 to 60 gpm range) with digital read-out was installed for measuring the influent flow rate during removal efficiency and sediment mass loading capacity testing. A 3-inch diameter paddle wheel flow meter (60 to 600 gpm) with a

8
digital read-out was installed for monitoring the flow rate during scour testing. The paddle wheel flow meters provided instantaneous flow rates that were recorded every minute during the tests. The flow meters were calibrated by the manufacturers prior to Filterra’s use. Filterra conducted timed-bucket measurements prior to and during testing to confirm flow rates. The 2-inch diameter flow meter consistently had readings approximately 30% less than the actual flow rates. Consequently the flow rates in the 6 to 60 gpm range were monitored and recorded with the effluent flow meter. Effluent flow rates were monitored in 1-minute intervals via a Marsh-McBirney FLO-DAR sensor with a Hach FL900 series flow logger which was calibrated by an outside vendor and checked by Filterra prior to use. The effluent flow monitoring data were downloaded daily or every few days by Filterra.
Head Measurements
A stand pipe set on top of the under-drain stone and within the specialized filtration media was used during all test runs to monitor head in the under-drain. The head measurements were collected using a Solinst 101 water level-meter when influent and/or effluent samples were collected and at 5 minute intervals at the start and end of the test. Head measurements were recorded after each measurement and the tolerance of the standpipe (water level meter) was within 0.125 inches.
Effluent Grab Sampling Method
Influent and effluent samples were initially to be collected via grab sampling at the end-of-pipe. However, as explained above, the influent water quality samples were collected by sampling the flow from the influent pipe into the FTIB-C only during the first 15 test runs. The effluent water quality samples were collected by sampling the effluent from the discharge pipe above the concrete reservoirs. A clean funnel was used in conjunction with clean 1-liter plastic sample containers to ensure whole volume sampling from the influent and effluent pipes. The funnel was rinsed between sample collections using distilled water.
Samples were transported to the independent analytical laboratory (Analytics Laboratory of Ashland, Virginia) to determine the SSC using the methodology of ASTM method D3977-97. In addition, separate (duplicate) samples were analyzed by Filterra in-house to check the independent analytical laboratory’s results and provide quick turnaround time sampling results to calculate the influent COV.
2.3 Removal Efficiency Testing
Removal efficiency testing was conducted using an influent sediment concentration of 200 milligrams per liter (mg/L) +/- 10%. The 4’ x 4’ unit was tested at the maximum treatment flow rate (MTFR) of 140 inches per hour (in/hr.) or 23 gpm (140 in/hr. * 4 ft. * 4 ft. * 1ft/12 inches * 7.48 gallons/ft3 * 1 hr./60 minutes). After initiating and stabilizing the flow rate at the MTFR, influent sampling began after one detention time (6.7 minutes) and effluent sampling began after two detention times (approximately 15 minutes) since the FTIB-C does not contain a wet sump. Test runs #1 through #15 each lasted 54 minutes and six approximately evenly spaced influent and effluent sample pairs were collected downstream of the FTIB-C during each of the first 15
9
test runs. Background samples were collected every 16 minutes in conjunction with every odd numbered effluent sample collected.
Test runs #16 through #27 lasted 64 minutes each and five approximately evenly spaced effluent samples were collected during each test run. The first effluent sample in test runs #16 through #27 were collected after three detention times per the Filter Protocol. In the middle of the test run, after checking the test sediment feed, another three detention times were allowed to pass prior to effluent sample collection. A total of 27 test runs were conducted to determine removal efficiency (15 paired sampling test runs and 12 test runs using test sediment feed calibration).
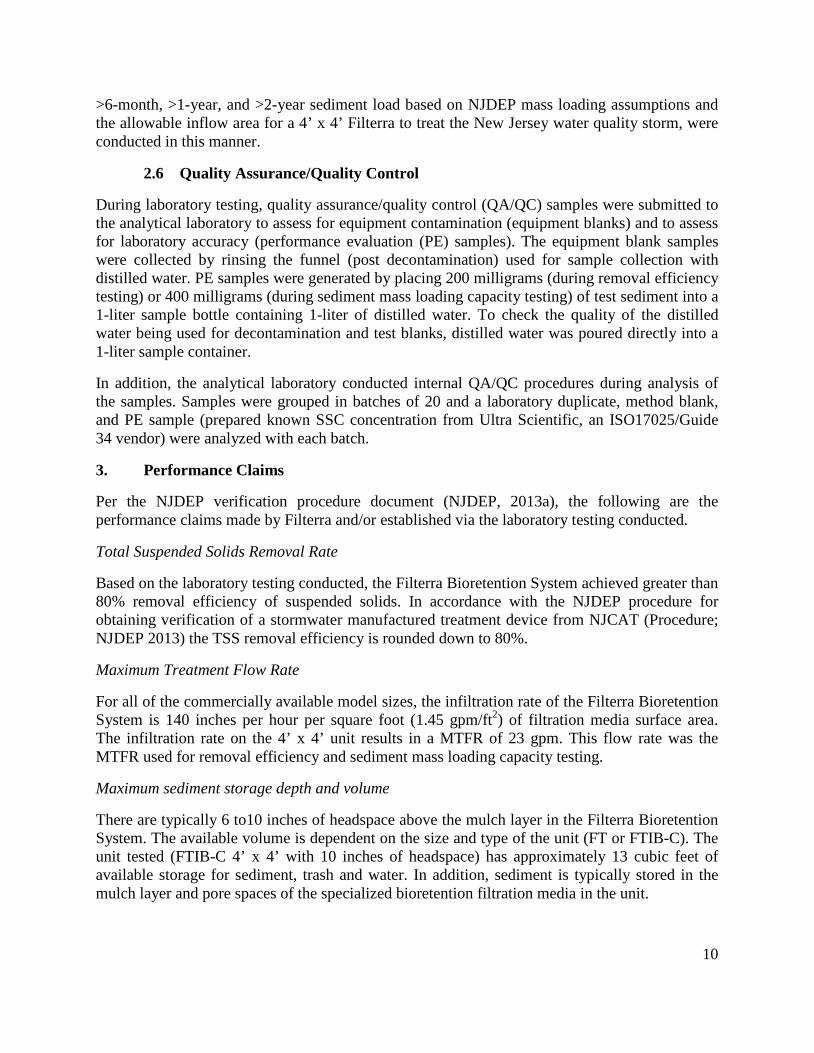
2.4 Sediment Mass Loading Capacity
As a continuation of the removal efficiency testing, sediment mass loading capacity testing was conducted. After initiating and stabilizing the flow rate at the MTFR, effluent sampling began after one detention time (6.7 minutes). Five effluent samples were collected at 15 minute intervals over each 81 minute test run. Background samples were collected every 30 minutes in conjunction with every odd numbered effluent sample collected. Per the Filter Protocol, test runs (#28 through #51) were conducted using an influent SSC concentration of 400 mg/L at a flow rate of 140 in/hr. (23 gpm). Testing was conducted until the FTIB-C went into bypass.
2.5 Scour Testing
At the conclusion of the sediment mass load capacity testing, the spent filtration media was removed from the FTIB-C and new bioretention filtration media was installed to restore the unit back to a new condition. Due to the FTIB-C storing sediment in the mulch and pore spaces of the bioretention filtration media, pre-loading of the unit was conducted by dosing influent water at 23 gpm (MTFR) with a 1,000 mg/L SSC concentration to the target pre-load mass of 26.1 pounds (the anticipated mass load of sediment after six months). At the conclusion of scour test #1, the mass of the sediment scoured was calculated. An equal mass of sediment was added back into the unit by flowing influent water at 23 gpm with a sediment concentration of 1,000 mg/L into the unit until the mass that had been scoured was replaced. While not required by the Filter Protocol, an additional 26.1 pounds of sediment was added in the same manner prior to the start of scour test 2 (pre-load target of 52.2 pounds) and a total of 104.4 pounds was pre-loaded into the unit for scour test #3 to represent one and two year sediment loads without maintenance, respectively.
A 13-foot by 7-foot concrete reservoir was filled with feed water from the fire hydrant and the water was pumped via a transfer pump through the FTIB-C at flow rate of 250 gpm2 without the addition of sediment. The flow rate was stabilized at 250 gpm within 5 minutes of starting the test (t = 5 minutes) and effluent sampling began after one detention time (t = approximately 7 minutes). Seventeen effluent samples were collected over the duration of the test at two minute intervals (total scour test time was 40 minutes). Background samples of the influent water from the reservoir were collected at the same time as odd numbered effluent samples (every 4 minutes). Three scour tests (scour test #1, #2, and #3), representing a system with an expected
2 Flow rate for a 10-year storm event derived from the New Jersey BMP Manual (IDF curve for Trenton). The 10-year event is what many engineers around the country require when sizing the Filterra system.
10
>6-month, >1-year, and >2-year sediment load based on NJDEP mass loading assumptions and the allowable inflow area for a 4’ x 4’ Filterra to treat the New Jersey water quality storm, were conducted in this manner.
2.6 Quality Assurance/Quality Control
During laboratory testing, quality assurance/quality control (QA/QC) samples were submitted to the analytical laboratory to assess for equipment contamination (equipment blanks) and to assess for laboratory accuracy (performance evaluation (PE) samples). The equipment blank samples were collected by rinsing the funnel (post decontamination) used for sample collection with distilled water. PE samples were generated by placing 200 milligrams (during removal efficiency testing) or 400 milligrams (during sediment mass loading capacity testing) of test sediment into a 1-liter sample bottle containing 1-liter of distilled water. To check the quality of the distilled water being used for decontamination and test blanks, distilled water was poured directly into a 1-liter sample container.
In addition, the analytical laboratory conducted internal QA/QC procedures during analysis of the samples. Samples were grouped in batches of 20 and a laboratory duplicate, method blank, and PE sample (prepared known SSC concentration from Ultra Scientific, an ISO17025/Guide 34 vendor) were analyzed with each batch.
3. Performance Claims
Per the NJDEP verification procedure document (NJDEP, 2013a), the following are the performance claims made by Filterra and/or established via the laboratory testing conducted.
Total Suspended Solids Removal Rate
Based on the laboratory testing conducted, the Filterra Bioretention System achieved greater than 80% removal efficiency of suspended solids. In accordance with the NJDEP procedure for obtaining verification of a stormwater manufactured treatment device from NJCAT (Procedure; NJDEP 2013) the TSS removal efficiency is rounded down to 80%.
Maximum Treatment Flow Rate
For all of the commercially available model sizes, the infiltration rate of the Filterra Bioretention System is 140 inches per hour per square foot (1.45 gpm/ft2) of filtration media surface area. The infiltration rate on the 4’ x 4’ unit results in a MTFR of 23 gpm. This flow rate was the MTFR used for removal efficiency and sediment mass loading capacity testing.
Maximum sediment storage depth and volume
There are typically 6 to10 inches of headspace above the mulch layer in the Filterra Bioretention System. The available volume is dependent on the size and type of the unit (FT or FTIB-C). The unit tested (FTIB-C 4’ x 4’ with 10 inches of headspace) has approximately 13 cubic feet of available storage for sediment, trash and water. In addition, sediment is typically stored in the mulch layer and pore spaces of the specialized bioretention filtration media in the unit.

11
Effective treatment, filtration, and sedimentation areas
The Filterra Bioretention System is a high flow rate bioretention unit with specialized bioretention filtration media that can treat 140 inches per hour per square foot of surface area. The total surface area to be treated is dependent on the size of the unit used.
Detention time and wet volume
The wet volume of the Filterra Bioretention System is approximately 21 cubic feet for the 4’ x 4’ unit, which equates to a detention time of approximately 6.7 minutes.
Sediment Mass Loading Capacity
Based on the testing results of the Filterra Bioretention System, the sediment mass loading capacity is approximately 24 pounds per square foot of surface area.
Maximum allowable inflow drainage area
Based on the results of the laboratory testing, approximately 384 pounds of sediment (24 lb/ft2) can be loaded onto the 4’ by 4’ Filterra Bioretention System, while maintaining an overall 80% removal efficiency, prior to the unit going into bypass. That equates to approximately 0.64 acres of allowable inflow drainage area per the NJDEP Process Document. However, using the New Jersey hydraulic sizing information (1.25 inches of rainfall in a 2-hour storm event) the Filterra Bioretention System has an allowable inflow area of only 0.087 acres for the 4’ by 4’ unit. Therefore, the hydraulic sizing of the 4’ by 4’ unit is the limiting factor and thus governs the maximum allowable inflow drainage area.
Relevant Calculations
For the first fifteen test runs during removal efficiency testing, the average influent concentration was determined as the mean of the measured influent concentrations. For the remaining test runs, the average influent concentration was determined as follows:
The removal efficiency of each test run was calculated using the equation below (per the Filter Protocol):

12
The cumulative sediment retained on the unit tested was calculated using the equation below:
4. Supporting Documentation
The NJDEP Procedure (NJDEP, 2013a) for obtaining verification of a stormwater manufactured treatment device (MTD) from the New Jersey Corporation for Advanced Technology (NJCAT) requires that “copies of the laboratory test reports, including all collected and measured data; all data from performance evaluation test runs; spreadsheets containing original data from all performance test runs; all pertinent calculations; etc.” be included in this section. For the Filterra test evaluation this constitutes hundreds and hundreds of pages. This was discussed with NJDEP and it was agreed that as long as such documentation could be made available by NJCAT upon request that it would not be prudent or necessary to include all this information in this verification report.
4.1 Removal Efficiency Testing
A total of 27 test runs were conducted during the removal efficiency testing. The first fifteen test runs were conducted using paired influent and effluent sampling. These test runs had an average removal efficiency of 92%. However, 12 of the 15 test runs did not meet the requirements of the Filter Protocol due to the COV of the influent sediment concentration being greater than 0.1 Test runs #16 through #27 were conducted using the test sediment feed calibration method to account for the small amounts of variability in test sediment feed over short periods of time. All twelve of these test runs met the requirements of the Filter Protocol (COV less than 0.1) in addition to test runs #2, 6, and 10. The 15 qualified test runs had an overall average removal efficiency of 90%. Statistical analysis of the 27 test runs indicated that the effluent SSC concentrations were significantly different than the influent SSC concentrations (Wilcoxon rank sum test, p<0.05). Table 2 contains a summary of the 27 test runs, including flow rate, influent concentration (where applicable), test sediment feed rate (where applicable), effluent concentration, removal efficiency, maximum head in the under-drain system, and cumulative sediment accumulation. (Note: Head measurements changed as water backed up inside the unit during sediment loading. When loading stopped at the end of the day the water drained down.)
4.2 Sediment Mass Loading Capacity Testing
A total of 51 test runs were conducted at the MTFR (COV of influent SSC concentrations less than 0.1) during the sediment mass loading capacity testing. These test runs were all conducted using the test sediment feed rate monitoring method. Including the 27 test runs conducted as part of the removal efficiency testing, per the Filter Protocol, approximately 384 pounds of sediment
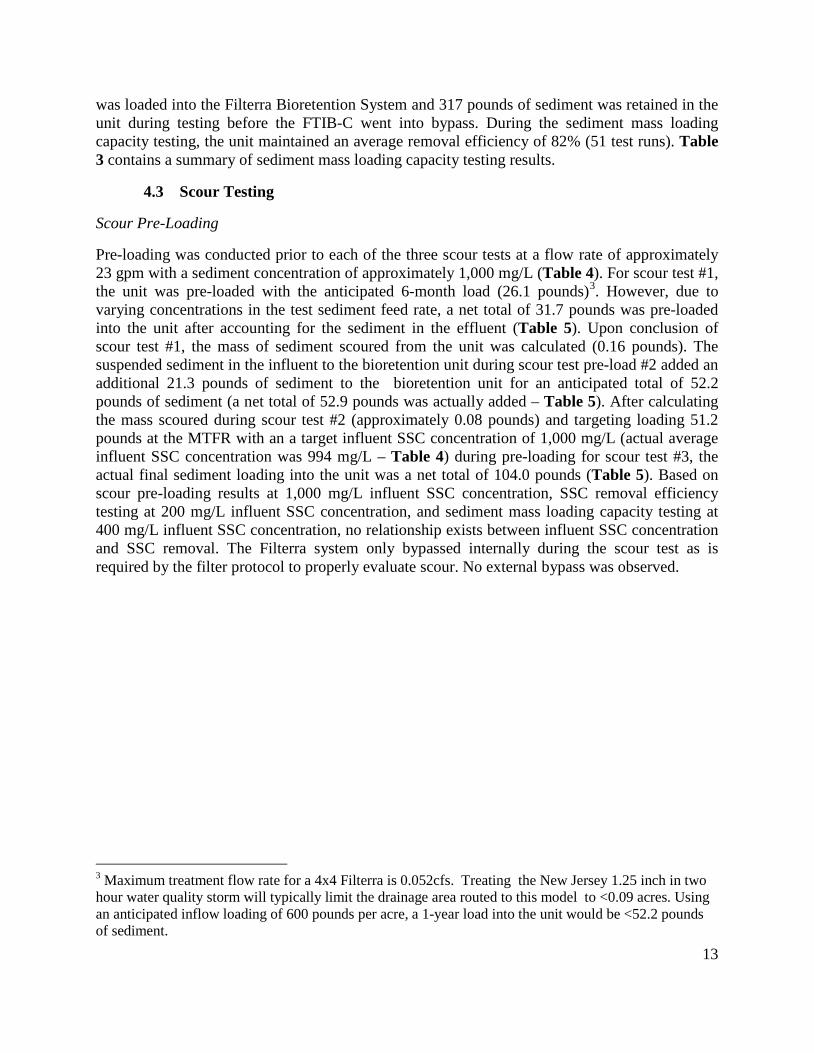
13
was loaded into the Filterra Bioretention System and 317 pounds of sediment was retained in the unit during testing before the FTIB-C went into bypass. During the sediment mass loading capacity testing, the unit maintained an average removal efficiency of 82% (51 test runs). Table 3 contains a summary of sediment mass loading capacity testing results.
4.3 Scour Testing
Scour Pre-Loading
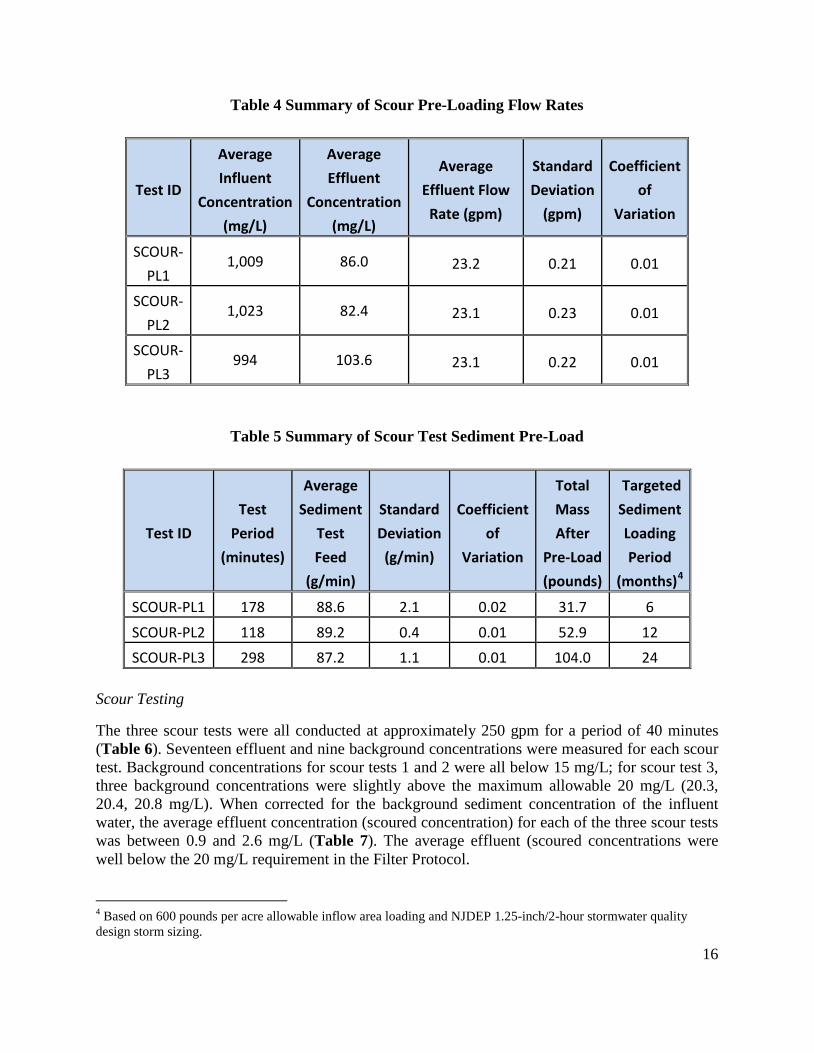
Pre-loading was conducted prior to each of the three scour tests at a flow rate of approximately 23 gpm with a sediment concentration of approximately 1,000 mg/L (Table 4). For scour test #1, the unit was pre-loaded with the anticipated 6-month load (26.1 pounds)3. However, due to varying concentrations in the test sediment feed rate, a net total of 31.7 pounds was pre-loaded into the unit after accounting for the sediment in the effluent (Table 5). Upon conclusion of scour test #1, the mass of sediment scoured from the unit was calculated (0.16 pounds). The suspended sediment in the influent to the bioretention unit during scour test pre-load #2 added an additional 21.3 pounds of sediment to the bioretention unit for an anticipated total of 52.2 pounds of sediment (a net total of 52.9 pounds was actually added – Table 5). After calculating the mass scoured during scour test #2 (approximately 0.08 pounds) and targeting loading 51.2 pounds at the MTFR with an a target influent SSC concentration of 1,000 mg/L (actual average influent SSC concentration was 994 mg/L – Table 4) during pre-loading for scour test #3, the actual final sediment loading into the unit was a net total of 104.0 pounds (Table 5). Based on scour pre-loading results at 1,000 mg/L influent SSC concentration, SSC removal efficiency testing at 200 mg/L influent SSC concentration, and sediment mass loading capacity testing at 400 mg/L influent SSC concentration, no relationship exists between influent SSC concentration and SSC removal. The Filterra system only bypassed internally during the scour test as is required by the filter protocol to properly evaluate scour. No external bypass was observed.
3 Maximum treatment flow rate for a 4x4 Filterra is 0.052cfs. Treating the New Jersey 1.25 inch in two hour water quality storm will typically limit the drainage area routed to this model to <0.09 acres. Using an anticipated inflow loading of 600 pounds per acre, a 1-year load into the unit would be <52.2 pounds of sediment.

14
Table 2 Summary of Removal Efficiency Testing
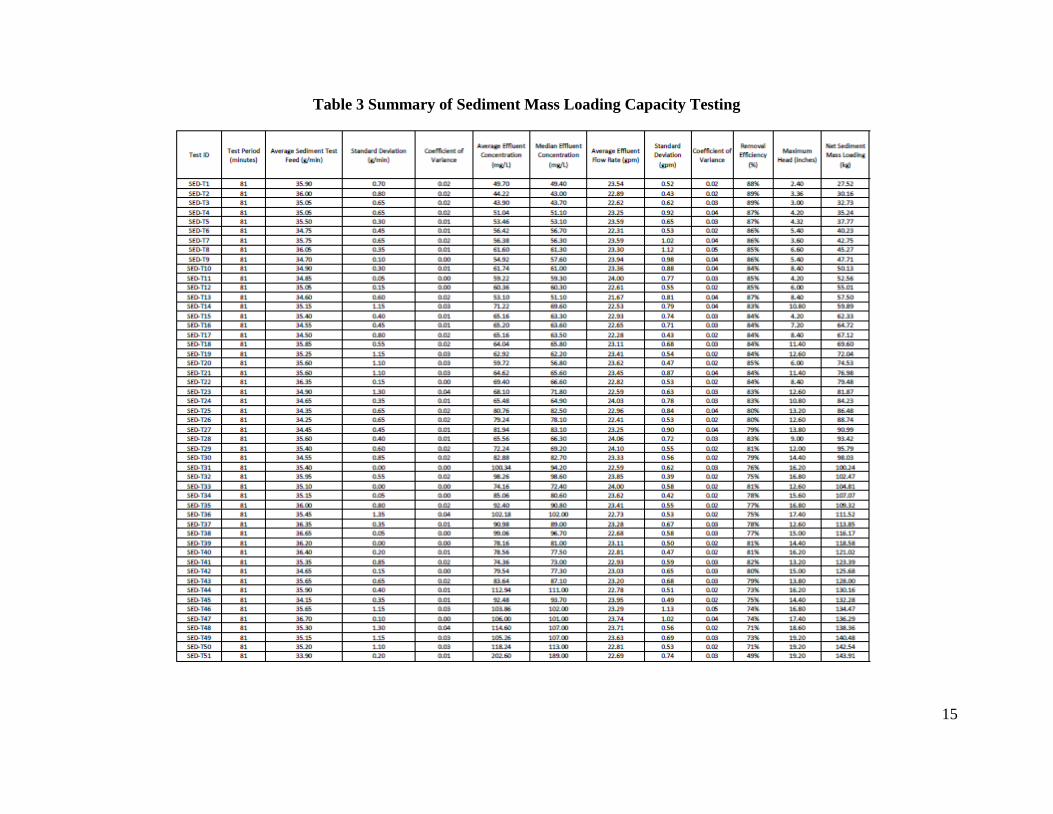
15
Table 3 Summary of Sediment Mass Loading Capacity Testing
16
Table 4 Summary of Scour Pre-Loading Flow Rates
Test ID
Average Influent
Concentration (mg/L)
Average Effluent
Concentration (mg/L)
Average Effluent Flow
Rate (gpm)
Standard Deviation
(gpm)
Coefficient of
Variation
SCOUR-PL1
1,009 86.0 23.2 0.21 0.01
SCOUR-PL2
1,023 82.4 23.1 0.23 0.01
SCOUR-PL3
994 103.6 23.1 0.22 0.01
Table 5 Summary of Scour Test Sediment Pre-Load
Test ID Test
Period (minutes)
Average Sediment
Test Feed
(g/min)
Standard Deviation (g/min)
Coefficient of
Variation
Total Mass After
Pre-Load (pounds)
Targeted Sediment Loading Period
(months)4
SCOUR-PL1 178 88.6 2.1 0.02 31.7 6
SCOUR-PL2 118 89.2 0.4 0.01 52.9 12
SCOUR-PL3 298 87.2 1.1 0.01 104.0 24
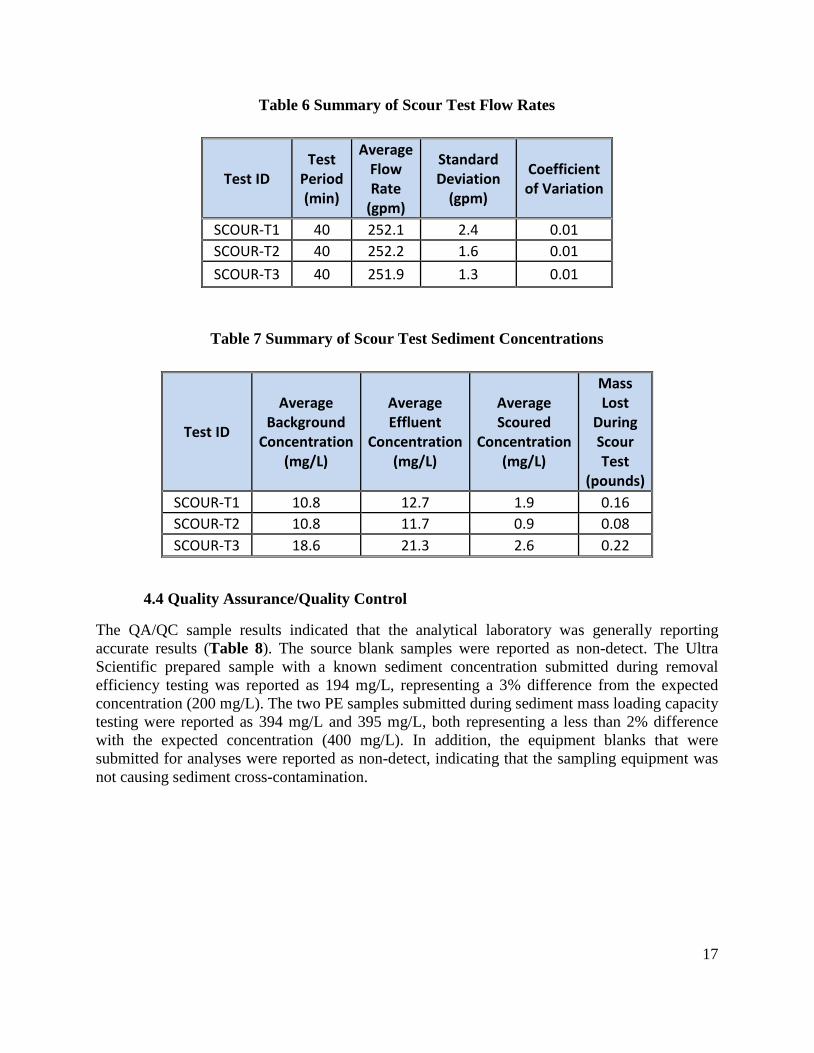
Scour Testing
The three scour tests were all conducted at approximately 250 gpm for a period of 40 minutes (Table 6). Seventeen effluent and nine background concentrations were measured for each scour test. Background concentrations for scour tests 1 and 2 were all below 15 mg/L; for scour test 3, three background concentrations were slightly above the maximum allowable 20 mg/L (20.3, 20.4, 20.8 mg/L). When corrected for the background sediment concentration of the influent water, the average effluent concentration (scoured concentration) for each of the three scour tests was between 0.9 and 2.6 mg/L (Table 7). The average effluent (scoured concentrations were well below the 20 mg/L requirement in the Filter Protocol.
4 Based on 600 pounds per acre allowable inflow area loading and NJDEP 1.25-inch/2-hour stormwater quality design storm sizing.
17
Table 6 Summary of Scour Test Flow Rates
Test ID Test
Period (min)
Average Flow Rate
(gpm)
Standard Deviation
(gpm)
Coefficient of Variation
SCOUR-T1 40 252.1 2.4 0.01 SCOUR-T2 40 252.2 1.6 0.01 SCOUR-T3 40 251.9 1.3 0.01
Table 7 Summary of Scour Test Sediment Concentrations
Test ID
Average Background
Concentration (mg/L)
Average Effluent
Concentration (mg/L)
Average Scoured
Concentration (mg/L)
Mass Lost
During Scour Test
(pounds) SCOUR-T1 10.8 12.7 1.9 0.16 SCOUR-T2 10.8 11.7 0.9 0.08 SCOUR-T3 18.6 21.3 2.6 0.22
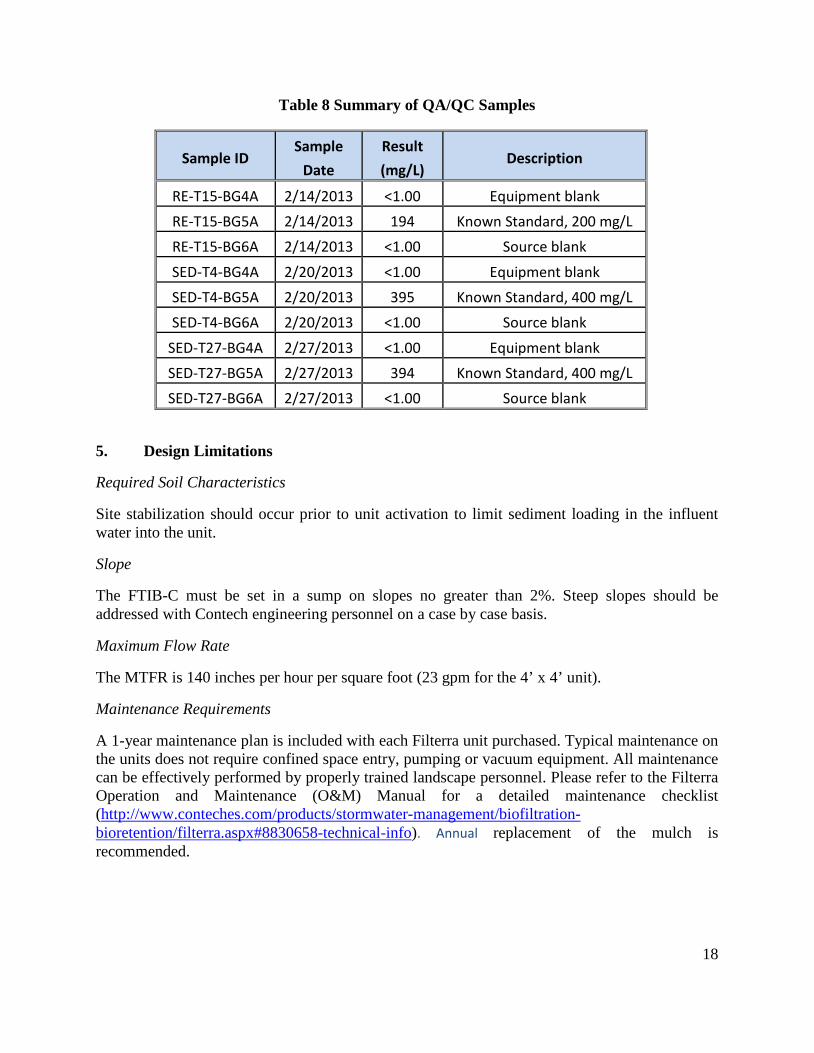
4.4 Quality Assurance/Quality Control
The QA/QC sample results indicated that the analytical laboratory was generally reporting accurate results (Table 8). The source blank samples were reported as non-detect. The Ultra Scientific prepared sample with a known sediment concentration submitted during removal efficiency testing was reported as 194 mg/L, representing a 3% difference from the expected concentration (200 mg/L). The two PE samples submitted during sediment mass loading capacity testing were reported as 394 mg/L and 395 mg/L, both representing a less than 2% difference with the expected concentration (400 mg/L). In addition, the equipment blanks that were submitted for analyses were reported as non-detect, indicating that the sampling equipment was not causing sediment cross-contamination.
18
Table 8 Summary of QA/QC Samples
Sample ID Sample
Date Result (mg/L)
Description
RE-T15-BG4A 2/14/2013 <1.00 Equipment blank
RE-T15-BG5A 2/14/2013 194 Known Standard, 200 mg/L RE-T15-BG6A 2/14/2013 <1.00 Source blank
SED-T4-BG4A 2/20/2013 <1.00 Equipment blank
SED-T4-BG5A 2/20/2013 395 Known Standard, 400 mg/L SED-T4-BG6A 2/20/2013 <1.00 Source blank
SED-T27-BG4A 2/27/2013 <1.00 Equipment blank SED-T27-BG5A 2/27/2013 394 Known Standard, 400 mg/L
SED-T27-BG6A 2/27/2013 <1.00 Source blank
5. Design Limitations
Required Soil Characteristics
Site stabilization should occur prior to unit activation to limit sediment loading in the influent water into the unit.
Slope
The FTIB-C must be set in a sump on slopes no greater than 2%. Steep slopes should be addressed with Contech engineering personnel on a case by case basis.
Maximum Flow Rate
The MTFR is 140 inches per hour per square foot (23 gpm for the 4’ x 4’ unit).
Maintenance Requirements
A 1-year maintenance plan is included with each Filterra unit purchased. Typical maintenance on the units does not require confined space entry, pumping or vacuum equipment. All maintenance can be effectively performed by properly trained landscape personnel. Please refer to the Filterra Operation and Maintenance (O&M) Manual for a detailed maintenance checklist (http://www.conteches.com/products/stormwater-management/biofiltration-bioretention/filterra.aspx#8830658-technical-info). Annual replacement of the mulch is recommended.
19
Driving Head
The Filterra Bioretention System operates without a driving head. However, a driving head will develop over time due to increased sediment buildup on the mulch layer.
Installation limitations
For installation procedures and requirements please refer the Filterra Installation Manual http://www.conteches.com/products/stormwater-management/biofiltration-bioretention/filterra.aspx#8830658-technical-info.
In general, installation on steep slopes must be addressed with engineering support on a case by case basis. The following specific limitations apply to the Filterra model configurations:
• Standard Unit (FT) - This system is not to be placed in a sump as there would be no effective bypass
• Internal Bypass-Curb (FTIB-C) - Must be set in sump not on slopes greater than 2%
Configurations
There are a number of configuration options to deal with different conveyances. The Filterra Bioretention System is very flexible depending on the inlet flow of water, flow rate, and location of the system.
Structural Load Limitations
The tops of the unit are rated for H-20 loading (32,000 pounds per truck axle).
Pretreatment Requirements
There are no pre-treatment requirements for the Filterra Bioretention System.
Limitations in Tailwater
The outlet pipe should be at an elevation greater than the tailwater or receiving water body or structure so as to not allow for water to backup into the unit. However, a check valve (such as a Tideflex® valve) can be used to install the unit in areas where the receiving water body or system’s water elevation is greater than the outlet pipe.
Depth to Seasonal High Water Table
Depth of the seasonal high water table is not an issue with the Filterra Bioretention System as it includes a pre-cast concrete box with a solid floor and the weight of the Filterra Bioretention System (fully loaded with media and under-drain stone) will weigh more than the water it will displace.
20
6. Maintenance Plans
Regular maintenance of the Filterra Bioretention System is necessary. The Filterra O&M Manual http://www.conteches.com/products/stormwater-management/biofiltration-bioretention/filterra.aspx#8830658-technical-info describes the general operation and maintenance requirements of the Filterra® and contains a maintenance checklist complete with problem identification, conditions to check for, conditions that should exist, and actions to be taken to remedy the problem. As the Filterra Bioretention System contains many living organisms, regular maintenance will extend the longevity of the unit. The unit will recycle and accumulate pollutants within the biomass, but is also subjected to other materials entering the system. These materials may include trash, silt, leaves, or other debris which will be contained in the space below the top grate and above the mulch layer. Too much silt may obstruct the unit’s flow rate, which is the reason for requiring site stabilization before using the Filterra Bioretention System, minimizing potential sediment loads. In addition, regular replacement of the mulch layer, on the recommended 1-year maintenance frequency, significantly inhibits the accumulation of sediment and replenishes organics within the media. Maintenance of the unit does not require confined space access, pumping, vacuum equipment or specialized tools. Properly trained landscape personnel can effectively maintain the Filterra Bioretention System. Routine annual maintenance is recommended based on the results of the sediment mass loading capacity testing. Varying land uses can affect maintenance frequency; e.g. some fast food restaurants require more frequent trash removal. Contributing drainage areas which are subject to new development wherein the recommended erosion and sediment control measures have not been implemented require additional maintenance visits outside of typical annual maintenance visits. Some sites may be subjected to extreme sediment or trash loads, requiring more frequent maintenance visits than the recommended annual maintenance visits. This is the reason for detailed notes of maintenance actions per unit, helping the Owner predict future maintenance frequencies, reflecting individual site conditions. Each maintenance visit should consist of the following tasks;
1. Inspection of the unit and surrounding area a. Check for: standing water, damage to box structure and grate, if the bypass is
clear b. Take photographs for documentation
2. Removal of tree grate and erosion control stones
a. Remove metal grates and erosion control stones for access into unit b. Dig out silt (if any) and mulch as well as trash and foreign items
21
3. Removal of debris, trash, and mulch a. After removal of mulch, trash, and debris, measure the distance from the top of
the specialized filtration media to the bottom of the top slab b. If this distance is greater than 13 inches (FTIB-C), add Filterra media (not top soil
or other) to bring the filtration media level to a distance of 13 inches to the bottom of slab
c. Record these measurements and amount of media replaced and save for reference
4. Replace mulch a. Add double shredded mulch evenly to a depth of 3 inches on the surface of the
media b. Ensure correct repositioning of erosion control stones by the inlet c. Replace the grates, taking care not to damage the plant
5. Evaluate plant health
a. Examine the plant’s health and replace if indicated b. Prune as necessary to promote growth
6. Clean area around Filterra
a. Clean area around unit and remove all refuse b. Dispose of all waste appropriately
7. Complete paperwork
a. Good documentation of maintenance performed helps with future servicing b. Some jurisdictions may require submission of maintenance reports
Ideal tools for maintenance include: camera, bucket, shovel, broom, pruners, hoe/rake, and tape measure. Appropriate Personal Protective Equipment (PPE) should be used in accordance with local or company procedures. This may include impervious gloves where the type of trash is unknown, high visibility clothing and barricades when working in close proximity to traffic and also safety hats and shoes. A T-Bar or crowbar should be used for moving the tree grates, which can weigh up to 170 pounds each. Most maintenance visits require only replacement mulch. Three bags of double shredded mulch are used per unit (on a standard 6’ x 6’ size unit). Some maintenance visits may require additional specialized filtration media, available from a supplier. 7. Statements
The NJDEP procedure for obtaining verification of a MTD from NJCAT (NJDEP 2013a) requires signed statements from the manufacturer, third-party observer (if applicable), independent test facility (if applicable) and NJCAT regarding the testing and any conflicts of interest. Following are signed statements from Filterra, Terraphase Engineering and NJCAT.
22

23

24
Center for Environmental Systems Stevens Institute of Technology
Castle Point on Hudson Hoboken, NJ 07030-0000
August 27, 2013
Elizabeth Dragon Environmental Engineer New Jersey Department of Environmental Protection Bureau of Nonpoint Pollution Control 401-02B, PO Box 420 Trenton, NJ 08625-0420 Mindy Hills Research & Development Manager Filterra Bioretention Systems 11352 Virginia Precast Road Ashland, VA 23005 Ryan Janoch, PE Terraphase Engineering Inc. 1404 Franklin Street, Suite 600 Oakland, CA 94612 To all, Based on my review, evaluation and assessment of the testing conducted on the Filterra Bioretention System (FTIB-C) by Filterra and observed by Terraphase Engineering Inc., the test protocol requirements contained in the “New Jersey Laboratory Testing Protocol for Manufactured Treatment devices that Utilize Filtration for Total Suspended Solids Removal” (NJDEP Filter Protocol) were met or exceeded. Specifically: Test Sediment Feed Filterra used Sil-Co-Sil 106 as the test sediment which is much finer than the sediment requirements of the NJDEP Filter Protocol.
25
Removal Efficiency Testing A total of 27 test runs were conducted during removal efficiency testing. The first fifteen test runs were conducted using paired influent and effluent sampling. These test runs had an average removal efficiency of 92%. However, 12 of the 15 test runs did not meet the requirements of the Filter Protocol due to the COV of the influent sediment concentration being greater than 0.1 Test runs #16 through #27 were conducted using the test sediment feed calibration method to account for the small amounts of variability in test sediment feed over short periods of time. All twelve of these test runs met the requirements of the Filter Protocol (COV less than 0.1) in addition to test runs #2, 6, and 10. The 15 qualified test runs had an overall average removal efficiency of 90%. Sediment Mass Loading Capacity A total of 51 test runs were conducted at the MTFR (COV of influent SSC concentrations less than 0.1) during the sediment mass loading capacity testing. These test runs were all conducted using the test sediment feed rate monitoring method. Including the 27 test runs conducted as part of the removal efficiency testing, per the Filter Protocol, approximately 384 pounds of sediment was loaded into the Filterra Bioretention System and 317 pounds of sediment was retained in the unit during testing before the FTIB-C went into bypass. During the sediment mass loading capacity testing, the unit maintained an average removal efficiency of 82% (51 test runs). The anticipated 6-month load per the NJDEP protocol is 26.1 lbs. Hence the anticipated maintenance interval based on sediment loading greatly exceeds 6-months. Scour Testing Three scour tests were conducted (6, 12, and 24-month sediment loading periods) at a flow rate >10X the MTFR (this scour testing greatly exceeded the Filter Protocol requirements). Several of the background concentrations were slightly above 20 mg/L (20.3, 20.4, 20.8 mg/L) for test three, the most aggressive test. When corrected for the background sediment concentration of the influent water, the average effluent concentration (scoured concentration) for each of the three scour tests was between 0.9 and 2.6 mg/L. Sincerely,
Richard S. Magee, Sc.D., P.E., BCEE

26
8. References
Filterra Bioretention Systems. 2013. Quality Assurance Project Plan. January 28.
Terraphase. 2013. Laboratory Test Report, New Jersey Filter Protocol Testing – Filterra Bioretention System. Prepared by Terraphase Engineering Inc., 1404 Franklin Street, Suite 600, Oakland, CA. May 6, 2013 (revised July 8, 2013).
NJDEP. 2013a. New Jersey Department of Environmental Protection Procedure for Obtaining Verification of a Stormwater Manufactured Treatment Device from New Jersey Corporation for Advanced Technology. January 25.
NJDEP. 2013b. New Jersey Department of Environmental Protection Laboratory Protocol to Assess Total Suspended Solids Removal by a Filtration Manufactured Treatment Device. January 25.

27
VERIFICATION APPENDIX

28
Introduction
• Manufacturer – Contech Engineered Solutions LLC, 9025 Centre Pointe Drive, West Chester, OH 45069. General Phone: 800-338-1122. Website: http://www.conteches.com/
• MTD - Filterra®, Approved treatment rates for each standard Filterra model size are shown in Table A-1 and A-2. Approved treatment rates calculated using the certified infiltration rate of 140 inches/hour (0.00324 cfs/ft2) and the approved internal bypass capacity of 250 gpm.
• TSS Removal Rate – 80%
• Specialized bioretention filtration media (Filterra proprietary blend)
• On-line installation with Terraflume up to 250 gpm (New Jersey 10-year storm event)
Detailed Specification
• NJDEP sizing tables attached (Table A-1 and Table A-2)
• Maximum inflow drainage area
o The maximum inflow drainage area is governed by the treatment capacity of each model size as presented in Table A-1 and A-2.
• No head requirement. However, a driving head will develop over time due to increased sediment buildup on the mulch layer.
• No drain down time
• Conditions for installation – See Filterra Installation Manual http://www.conteches.com/products/stormwater-management/biofiltration-bioretention/filterra.aspx#8830658-technical-info
• The 4’ x 4’ Filterra unit was loaded with 104.0 lb. of test sediment prior to scour testing and did not scour. Note that 104 lbs. of sediment represents >2 years of expected sediment load based on NJDEP mass loading assumptions.
• See Filterra O&M Manual for maintenance needs and procedures. http://www.conteches.com/products/stormwater-management/biofiltration-bioretention/filterra.aspx#8830658-technical-info
Contech recommends annual replacement of the mulch. Neither NJCAT nor the NJDEP protocol requires that the impact of this recommended level of maintenance be evaluated to ensure continued Filterra performance as though it was restored to a full “as-new”
29
condition (replacement of both the mulch layer and specialized bioretention filtration media). However, as a micro-bioretention system, Filterra is a unique technology in that it replicates the basic functions of a traditional bioretention system. Similarly, Filterra does not require replacement of its components (with the exception of the mulch layer) over its anticipated useful life of approximately 20 years. Following the manufacturer’s recommended annual replacement of the mulch layer should adequately protect the media and its’ hydraulic capacity of 140 inches/hour (0.00324 cfs/ft2) over this lifespan. However, 4.5 years after activation, in-situ field flow testing is recommended to confirm this hydraulic capacity. If the in-situ field flow test demonstrates flows below 140 inches/hour (0.00324 cfs/ft2), complete media replacement is recommended. Contact Contech for arrangements and information for conducting the in-situ field test.
• This certification does not extend to the enhanced removal rates under NJAC 7:8-5.5 through the addition of settling chambers (such as hydrodynamic separators) or media filtration practices (such as a sand filter).
30
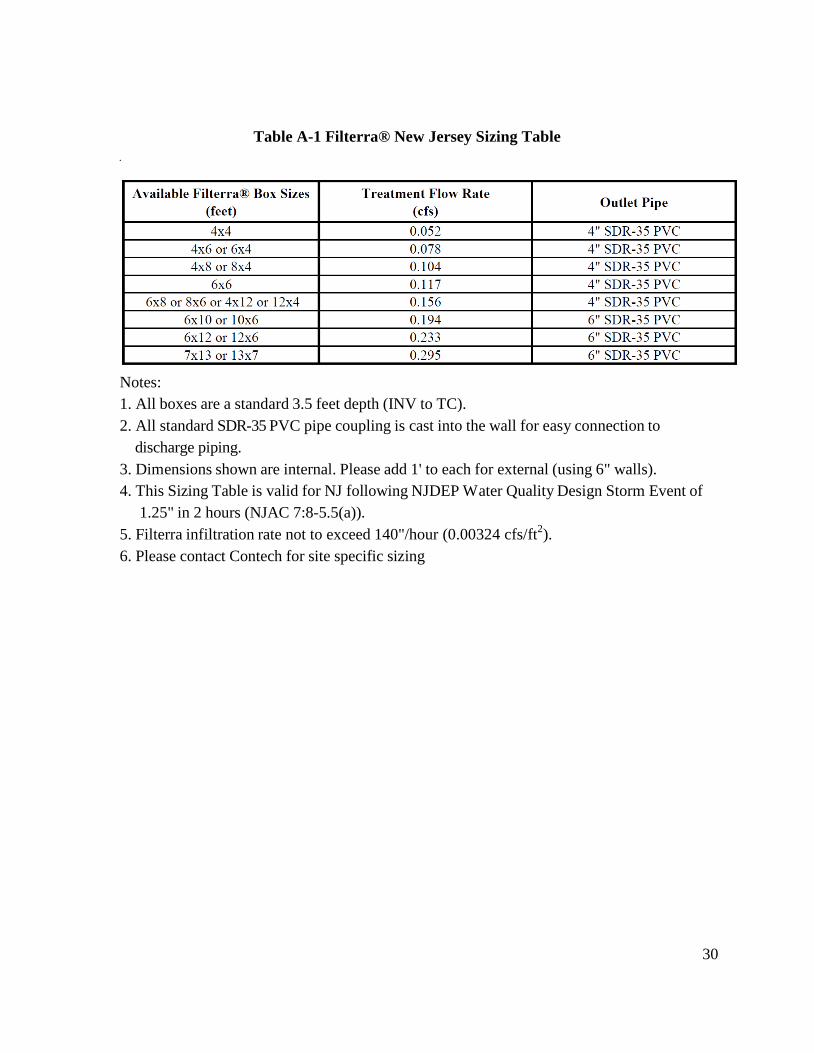
Table A-1 Filterra® New Jersey Sizing Table •
Notes: 1. All boxes are a standard 3.5 feet depth (INV to TC). 2. All standard SDR-35 PVC pipe coupling is cast into the wall for easy connection to discharge piping. 3. Dimensions shown are internal. Please add 1' to each for external (using 6" walls). 4. This Sizing Table is valid for NJ following NJDEP Water Quality Design Storm Event of 1.25" in 2 hours (NJAC 7:8-5.5(a)). 5. Filterra infiltration rate not to exceed 140"/hour (0.00324 cfs/ft2). 6. Please contact Contech for site specific sizing

31
Table A-2 Filterra® Internal Bypass-Curb New Jersey Sizing Table
Notes: 1. All boxes are a standard 4 feet depth (Invert out to Top of Curb) 2. A standard PVC pipe coupling is cast into the wall for easy connection to discharge piping (when used without chamber) 3. Contech recommends a 2’ wide outlet chamber on all sizes to allow for outlet pipe size and orientation flexibility. Chamber required on 4x4. 4. Curb inlet throat opening is 4’ on Filterra Internal Bypass-Curb 5. Dimensions shown are internal. Dimensions do not include optional 2’ wide outlet chamber. 6. This Sizing Table is valid for NJ following NJDEP Water Quality Design Storm Event of 1.25" in 2 hours (NJAC 7:8-5.5(a)). 7. Filterra infiltration rate not to exceed 140"/hour (0.00324 cfs/ft2). 8. Terraflume Tray overflow is sized for a maximum bypass flow of 250 gpm (0.56 cfs) 9. Please contact Contech for site specific sizing


