Date post: | 11-Dec-2015 |
Category: |
Documents |
Upload: | armani-hinkley |
View: | 214 times |
Download: | 0 times |
NM USER FORUM 2014
Nicky CooperHead Network Operations Management
The Network Management response to airlines and airports
Ralph RiedleSenior ATM Consultant,Performance & Operations 29/012014
“Who are the managers in your Network Operations Management team and what are their roles?”
“Please give your personal overview of the highlights of 2013?”
“What have been the strategic directions that guided your operations?”
2
Flexible Use of AirspaceFree Route &
de-fragmented Airspace
End-to-end Information Management
EfficientCNS
Infrastructures
Low impact measures with Cooperative
Traffic Management
A-CDM
Environment friendly Airport
Operations
Facilitated access to Airports
PBN in TMA
Free Routes
Flight Level 315
Structured Airsp
ace
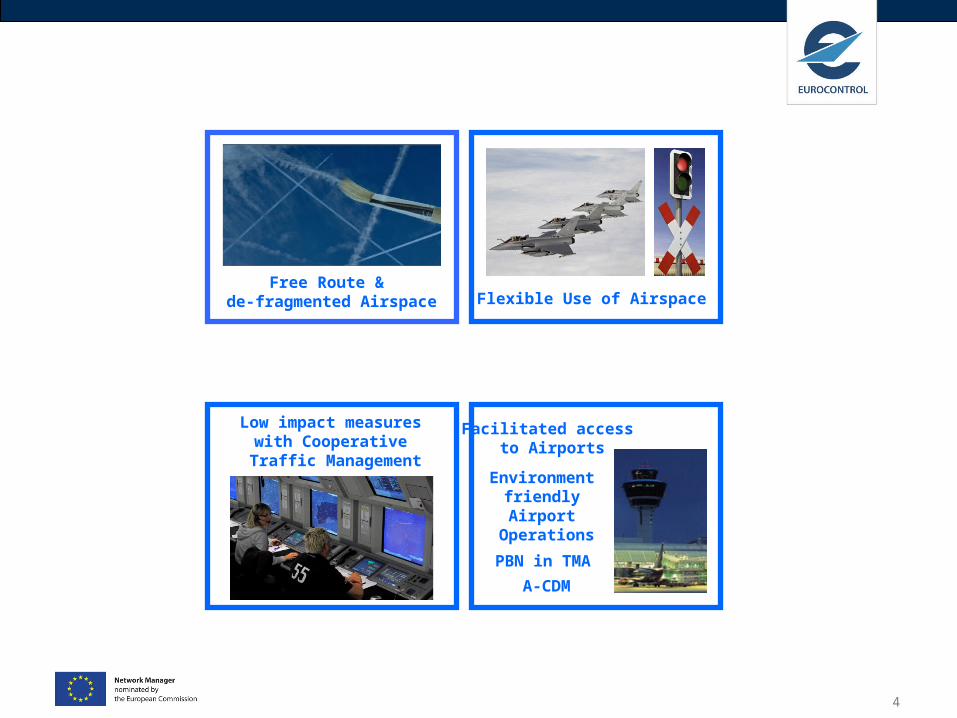
What Airspace Users will get from the Network Concept of Operations by 2020…… to achieve predictability, punctuality, safety and service continuity
Flexible Use of AirspaceFree Route &
de-fragmented Airspace
Low impact measures with Cooperative
Traffic Management
A-CDM
Environment friendly Airport
Operations
Facilitated access to Airports
PBN in TMA
4
Operations Planning
Operations Planning
Support to
Airports
Support to
Airports
Support to Safety
Support to Safety
Coordination& Crisis
NM Operations
Centre
NM Operations
Centre
NOM
Team
NOM
Team
Flexible Use of AirspaceFree Route &
de-fragmented Airspace
Low impact measures with Cooperative
Traffic Management
A-CDM
Environment friendly Airport
Operations
Facilitated access to Airports
PBN in TMA
5
7
Three ages of industrial safety
IT Revolution
2000195019001850
1931Industrial accident
prevention
1893Railroad Safety Appliance Act
1769Industrial
Revolution
1961Fault tree analysis
Age of technology
1979Three Mile
Island
Age of human factors
1986Challenger
Чернобыль
Age of safety management
8
From Negative to Positive Safety
Negative outcomes are caused by failures and malfunctions.
All outcomes (positiveand negative) are due to performance variability.
- +Safety = Reducednumber of adverseevents.
Safety = Ability tosucceed undervarying conditions.
Safety = Ability torespond whensomething fails.
Improve ability torespond to adverseevents.
Eliminate failuresand malfunctions as far as possible.
Improve resilience.
9
“What additional support do the airlines need compared to what is currently done with respect to airspace design and airspace utilisation?
“How do airlines see the cooperation between NM and CFSPs in supporting the airlines efforts to plan better routes?”
RTE-DES
3.53%3.54%3.45%3.22%3.04%2.96%2.80%2.64%
2%
3%
4%
5%
6%
2007 2008 2009 2010 2011 2012 2013 2014
RTE-FPL
4.91%5.03%4.90%4.91%4.73%4.64%4.57%4.48%
2%
3%
4%
5%
6%
2007 2008 2009 2010 2011 2012 2013 2014
Route Efficiency KPI per AIRAC cycle
20
12
20
10
20
10
20
11
20
13
2.5%
3.0%
3.5%
4.0%
4.5%
5.0%
5.5%
1001
1002
1003
1004
1005
1006
1007
1008
1009
1010
1011
1012
1013
1101
1102
1103
1104
1105
1106
1107
1108
1109
1110
1111
1112
1113
1201
1202
1203
1204
1205
1206
1207
1208
1209
1210
1211
1212
1213
1301
1302
1303
1304
1305
1306
1307
1308
1309
1310
1311
1312
1313
AIRAC
Ro
ute
Ext
ensi
on
0
0.1
0.2
0.3
0.4
0.5
0.6
0.7
0.8
0.9
1
RTE-DES
RTE-FPL
Flight Efficiency performance trends
Potential Yearly NM Savings and Mileage FlownAirspace Design
3000000
4000000
4800000
6900000
1700000
3380000
0
1000000
2000000
3000000
4000000
5000000
6000000
7000000
8000000
2008 2009 2010 2011 2012 2013
Year
Sav
ing
s
3700000000
3800000000
3900000000
4000000000
4100000000
4200000000
Mil
eag
e fl
ow
n
Savings(NM)
Mileageflown(NM)
Yearly NM Savings and Mileage FlownFlight Planning
3000000
4600000
-5700000
6200000
1400000
-2111000
-8000000
-6000000
-4000000
-2000000
0
2000000
4000000
6000000
8000000
2008 2009 2010 2011 2012 2013
Year
Sav
ing
s3300000000
3400000000
3500000000
3600000000
3700000000
3800000000
3900000000
4000000000
4100000000
4200000000
4300000000
Mil
eag
e fl
ow
n
Savings(NM)
Mileageflown(NM)
Savings potentially achievable…
12
“What concrete actions did you undertake to progress airport/network integration in 2013?”
“What are the next steps?”
13
• Enhance APT/NM info exchanges• A-CDM – Harmonisation• Advanced Tower Concept• Report real reasons for delay• Better prediction (FPL/APT slot)
2013 2014+
• Info. exchange process & automation• Dynamic airport status map on NOP portal• Centralised Service (FPL/APT slot)
14
“How did we all achieve 0.53mn as the avg. en route delay per flight in 2013?”
“What are your plans for flight efficiency from an operational perspective?"
15
En route delays
• Monitoring via Playbook
• Mitigations in CDM mode • Planning all events > simulation > coordinated implementation
Flight Efficiency
• Pilot project since May 2013 • Now mature for deployment • IPPU2 planned on 1-4-2014• Using the Opportunity Tool •Targeted ATFM measures
ANSP’scontribution
NM & EACCCNM &
EACCC
Info.Sharing
Info.Sharing
ExercisesExercises
SRAApproach
SRAApproach
PilotReports
PilotReports
EVITAEVITA
AOCCCAOCCC
Coordination in times of crisis & network disruption