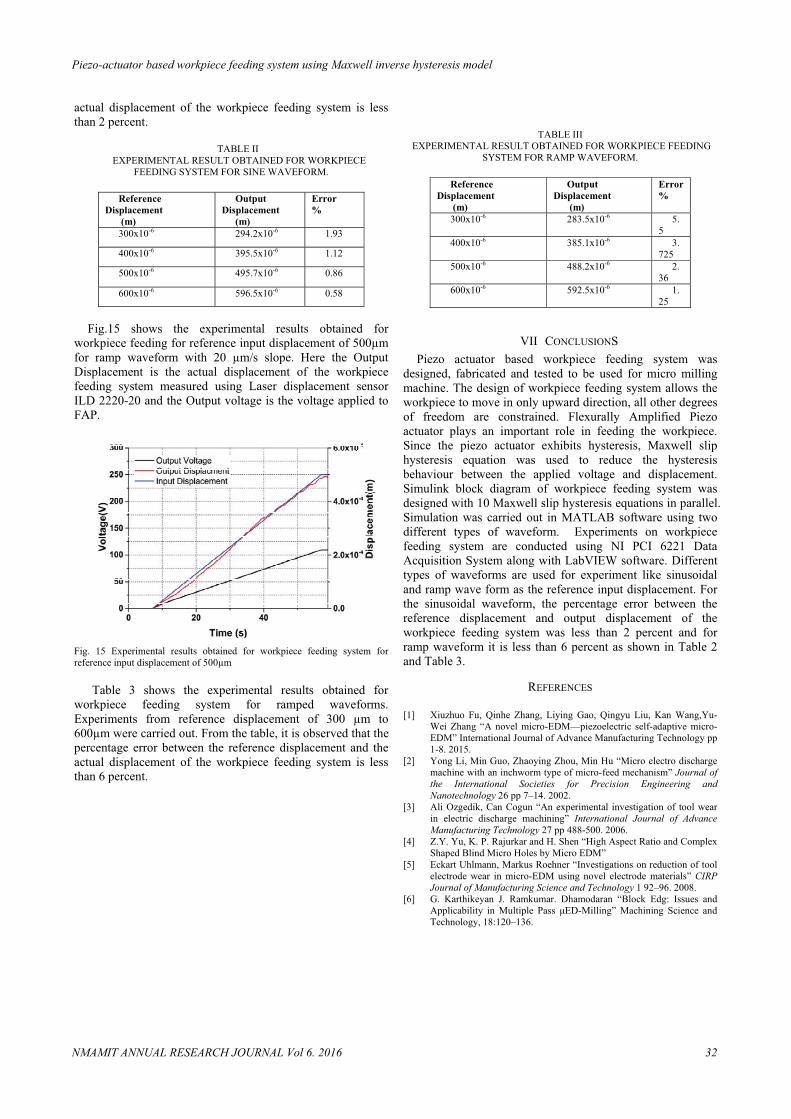
Annual Research Journal Use of PSO optimized Radial Basis Function Neural Network for improved modeling Vruksha R Shetty, Rashmi P Shetty, Srinivasa Pai P 1 In Vitro Propagation and Molecular Characterization of Local Accessions of Santalum Album Aparna B, Bharathi A, Yashas K, Rashmi KV 9 Laterite Soil as A Binder in Concrete Manjunatha M, Gururaj Acharya., Shaik Kabeer Ahamed 13 Smart Surveillance System Using Wireless Sensor Networks: A Survey Asthik She1, Akarsh V Kumar, Deeksha S, Deeksha S Kotian, K. S. Shivaprakasha 17 Influence of injector nozzle hole number and size on the performance of a supercharged direct injection diesel engine Ravinarayana Bhat N. 23 Piezo-actuator based workpiece feeding system using Maxwell inverse hysteresis model Prasad Prabhu, Muralidhara 28 Matching Governance Systems with Performance Frameworks in Higher Education K. Sankaran 34 Gut microbiota, short-chain fatty acids and host gene regulation Prasanna K. Santhekadur 40 NMAMIT Published by: NMAM Institute of Technology An Autonomous Institution Under VTU, Belagavi (A Unit of Nitte Education Trust) NITTE - 574 110, UDUPI DIST., KARNATAKA www.nitte.edu.in/nmamit www.research.nitte.edu.in Volume 6 December 2016 ISSN 2249-0426
Transcript
NMAM INSTITUTE OF TECHNOLOGY, NITTE – 574110NMAM INSTITUTE OF TECHNOLOGY, NITTE – 574110NMAM INSTITUTE OF TECHNOLOGY, NITTE – 574110NMAM INSTITUTE OF TECHNOLOGY, NITTE – 574110NMAM INSTITUTE OF TECHNOLOGY, NITTE – 574110
NMAM Institute of Technology was started in the year 1986, as a part of Nitte Education
Trust, Mangalore and celebrated its Silver Jubilee in 2011. The Institute is named in fond memory
of Nitte Mahalinga Adyanthaya, a distinguished engineer of the district. It is affiliated to the
Visvesvaraya Technological University, Belgaum, enjoying academic autonomy and is recognized
by the All India Council for Technical Education, New Delhi. It is accredited by the National
Board for Accreditation and is certified to the ISO 9001 – 2008 standards for quality education
by KEMA, Netherlands. The Institute has been recognized as Lead Institute under TEQIP- I Project
of World Bank.
The Institute offers B.E, M.Tech and Ph.D pragrammes in various Engineering and Technology
disciplines. The graduate programs comprise of 7 branches of Engineering – Electronics &
Communication Engineering, Computer Science & Engineeing, Civil Engineering, Electrical &
Electronics Engineering, Information Science & Engineering, Bio-Technology and Mechanical
Engineering. The Institute’s postgraduate programs include, Master of Technology in 13
disciplines, Master of Computer Applications and Master of Business Administration. The
Visvesvaraya Technological University has opened a postgraduate extension centre at NMAMIT,
offering M.Tech in Micro-electronics & Control Systems. Besides these, students also pursue
their M.Sc(Eng.) and Doctoral Programs at the Institute. The Institute got academic autonomy
in the year 2007, bringing in the much needed flexibility to innovate in terms of curriculum,
education delivery and evaluation. Institute entered into collaboration with Penn State University,
Harrisburg, USA and started offering 2+2 twinning program in Engineering since 2011.
Annual Research Journal
Use of PSO optimized Radial Basis Function Neural Network for improved modeling
Vruksha R Shetty, Rashmi P Shetty, Srinivasa Pai P 1
In Vitro Propagation and Molecular Characterization of Local Accessions of Santalum Album
Aparna B, Bharathi A, Yashas K, Rashmi KV 9
Laterite Soil as A Binder in Concrete
Manjunatha M, Gururaj Acharya., Shaik Kabeer Ahamed 13
Smart Surveillance System Using Wireless Sensor Networks: A Survey
Asthik She1, Akarsh V Kumar, Deeksha S, Deeksha S Kotian, K. S. Shivaprakasha 17
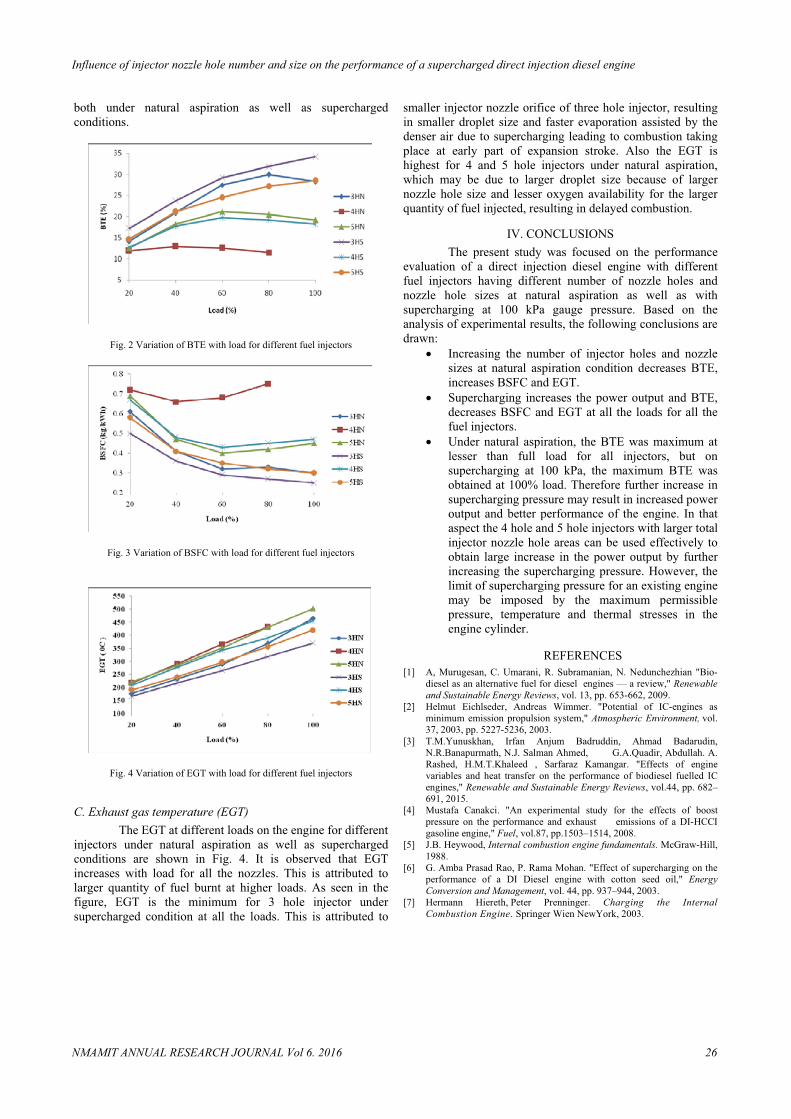
Influence of injector nozzle hole number and size on the performance of
a supercharged direct injection diesel engine
Ravinarayana Bhat N. 23
Piezo-actuator based workpiece feeding system using Maxwell inverse hysteresis model
Prasad Prabhu, Muralidhara 28
Matching Governance Systems with Performance Frameworks in Higher Education
K. Sankaran 34
Gut microbiota, short-chain fatty acids and host gene regulation
Prasanna K. Santhekadur 40
NMAMIT
Published by:
NMAM Institute of TechnologyAn Autonomous Institution Under VTU, Belagavi(A Unit of Nitte Education Trust)NITTE - 574 110, UDUPI DIST., KARNATAKAwww.nitte.edu.in/nmamitwww.research.nitte.edu.in
Volume 6 December 2016 ISSN 2249-0426
GUIDELINES FOR AUTHORS
The contributors are expected to highlight their research work with sufficient details & discussion of results.
The original research paper should be limited to 6 and short communication to 3 printed pages of the journal indouble column standard IEEE format. Please refer to IEEE website for the standard format.
Manuscripts must be submitted online to [email protected] in .docx format.
Enough precaution should be taken to make the manuscript error free.
The papers that are not in the standard format may be rejected
Submission of an article implies that the work described has not been published previously (except in the formof an abstract or as part of a published lecture or academic thesis), that it is not under consideration forpublication elsewhere, that its publication is approved by all authors and tacitly or explicitly by the responsibleauthorities where the work was carried out.
Authors of the selected papers have to send the final camera ready paper (both in MS Word &PDF) for finalprint
After the review process, the selected papers will be published in the Journal.
Article structure
Subdivision - numbered sectionsDivide your article into clearly defined and numbered sections. Subsections should be numbered 1.1 (then1.1.1, 1.1.2, ...), 1.2, etc. (the abstract is not included in section numbering). Use this numbering also forinternal cross-referencing: do not just refer to ‘the text’. Any subsection may be given a brief heading. Eachheading should appear on its own separate line.
IntroductionState the objectives of the work and provide an adequate background, avoiding a detailed literature survey ora summary of the results.
Material and methodsProvide sufficient detail to allow the work to be reproduced. Methods already published should be indicated bya reference: only relevant modifications should be described.
Theory/calculationA Theory section should extend, not repeat, the background to the article already dealt with in the Introductionand lay the foundation for further work. In contrast, a calculation section represents a practical developmentfrom a theoretical basis.
ResultsResults should be clear and concise.
DiscussionThis should explore the significance of the results of the work, not repeat them. A combined Results andDiscussion section is often appropriate. Avoid extensive citations and discussion of published literature.
ConclusionThe main conclusions of the study may be presented in a short Conclusions section, which may stand alone orform a subsection of a Discussion or Results and Discussion section.
AppendicesIf there is more than one appendix, they should be identified as A, B, etc. Formulae and equations in appendicesshould be given separate numbering: Eq. (A.1), Eq. (A.2), etc.; in a subsequent appendix, Eq. (B.1) and so on.Similarly for tables and figures: Table A.1; Fig. A.s1, etc.
Welcome!Indian engineering education is at the crossroads.
With the establishment of large number of engineeringcolleges in the country in the last decade, there is nodearth of fresh engineering personnel to meet therequirement of not only the Indian industries but thatof other countries as well. However, quality of all theseyoungsters coming out of these innumerableengineering colleges is questionable, what with largenumber of surveys carried out by various agenciespointing to the low level of employability of ourgraduates. The spirit of questioning, exploring theunknown, and probing for new knowledge which arethe qualities which make a nation great, areconspicuous by their absent.
The arrival of accreditation process like NBAand NAAC were expected to bring in new lease oflife to engineering education, but alas, they only havebeen able to add to the woes of the faculty members,and did nothing much to improve the quality. Thepresent set of ideas prevalent in engineering collegesare expected to keep them as community collegeswhere focus is more on completion of the curriculum,yearlong fun and frolic, and placement in lowly paidcompanies.
There is also the problem of trying to achievefast research parameters and in the process researchcarried out prove to be of low quality and devoid ofpractical application. Semblance of leadership enjoyedby our nation in the area of technology could besustained by very quickly aiming for cutting edgeresearch and very series academic pursuit in thecampuses with focus on innovation and research.
In this issue we have deviated a little by invitingarticles from erudite scholars. However, our usualpractice of publishing original research papers has beenpersisted with.
I am glad to hand you this issue of the journal.Happy reading.
Dr. Sudesh BekalEditor
EDITORIALMEMBERS OF EDITORIAL BOARDEDITOR-IN-CHEIF
Dr. Nirajnjan N. Chiplunkar
NMAM Institute of Technology, Nitte
EDITOR
Dr. Sudesh Bekal
Dean (R&D), NMAM Institute of Technology, Nitte
EDITORIAL BOARD
Dr. S. Y. Kulkarni
Reva University, Bangalore
Dr. N. S. Sriram
Vidya Vikas College of Engineering, Mysore
Dr. C. Vaman Rao
NMAM Institute of Technology, Nitte
Dr. Ashok Babu T. P.
National Institute of Technology Karnataka, Suratkal
Dr. Jaganath Nayak
National Institute of Technology Karnataka, Suratkal
Dr. Shridhara S.
Indian Institute of Technology Bombay, Mumbai
Dr. K. V. V. Murthy
Indian Institute of Technology, Gandhinagar
Dr. Navakanth Bhat
Indian Institute of Science & Communication, Bangalore
Dr. Gopalakrishna Kini
Manipal Institute of Technology, Manipal
Dr. Khalid
Vellur Institute of Technology, Vellur
EDITORIAL ASSISTANTSDr. Vidya S. M., NMAMIT, Nitte.
Dr. Anil Kumar H.S., NMAMIT, Nitte.
NMAMITAnnual Research Journal
Volume 6
December 2016
ISSN 2249-0426
Published by:
NMAM Institute of TechnologyAn Autonomous Institution Under VTU, Belagavi
(A Unit of Nitte Education Trust)NITTE - 574 110, UDUPI DIST., KARNATAKA
Abstract— In this paper an effort has been made in developing a Radial basis function (RBF) neural network model that uses hybrid Particle Swarm Optimization based Fuzzy C Means (PSO-FCM) clustering algorithm and Extreme Learning Machine (ELM) algorithm for learning. The centers and width of the RBF units of the developed model have been optimally selected using Particle Swarm Optimization (PSO). Extreme learning machine algorithm (ELM) is a single epoch fast learning algorithm that overcomes many drawbacks of gradient descent learning. Three standard datasets Balloon, Iris and Cancer have been used for validating the performance of the developed RBF neural network model. The results for training and testing have been compared with that obtained from [1] and the proposed model has been found to be more effective. Keywords—RBF neural network, PSO-FCM, ELM, PSO.
I. INTRODUCTION Artificial neural networks (ANN) are information processing
paradigms inspired by biological nervous system. It resembles the human brain in two respects; the knowledge is acquired by the network through a learning process, and interneuron connection strengths known as synaptic weights are used to store the knowledge [2]. ANN is used to estimate or approximate functions that depend on a large number of inputs and are generally unknown. It finds application in broad spectrum of areas such as data mining, image processing signal processing, operational analysis etc. Feed forward neural networks have been used extensively in different fields owing to several reasons such as their ability to approximate complex nonlinear mappings directly from input samples. Radial basis function neural networks (RBFNN) is a simple single hidden layer ANN that uses nonlinear Gaussian activation function. Due to better generalization capacity, simplicity and strong tolerance to input noise RBFNN have increasingly attracted interest in engineering applications [3].
The three layers – the input layer, the hidden layer and the output layer of the RBFNN has entirely three different roles. The coordinates of the input vector is transmitted to each of the units in the hidden layer by the input layer. Each unit in the hidden layer then applies a nonlinear transformation function from input space to hidden space. Finally, each unit in the output layer computes a linear weighted combination of the activations of the hidden units. How RBFNN reacts to a given input stimulus is completely determined by the activation functions associated with the hidden units and the weights associated with the links between the hidden layer and the output layer. Depending on how the centers of the radial basis functions are specified, there are different learning strategies in the design of an RBF network. For proper selection of the location and the number of centers of the radial functions, self-organized selection that uses clustering algorithms are found to be advantageous. Clustering is a classification technique that partitions the data objects, according to certain predefined criterion, into a set of disjoint clusters in such a way that objects in the same cluster are more similar to each other than to the objects in different clusters. The clustering algorithm partitions the given set of data points into homogeneous subgroups. After the fuzzy theory was introduced by Zadeh (1978) [4], it has been extensively applied to clustering. Bezdek (1984) proposed the most popular fuzzy c-means (FCM) clustering algorithm [5] and is extensively used in a wide range of applications. FCM suffers from some major issues such as it is sensitive to initial values of the cluster centers and can be easily trapped into local minima. Hence it calls for modifications to the algorithm to improve its performance. Many modifications of FCM are proposed in the literature [6-9]. Attempts have been done in using evolutionary algorithms in clustering problems. Use of algorithms such as Genetic Algorithm (GA), Ant Colony Optimization (ACO), Coral Reefs Optimization (CRO), Tabu
Use of PSO optimized Radial Basis Function Neural Network for improved modeling
NMAMIT ANNUAL RESEARCH JOURNAL Vol 6. 2016 1
search (TS), Particle Swarm Optimization (PSO) etc. in clustering are found to be successful [10-17]. Particle Swarm Optimization (PSO) that is inspired by the flocking and schooling patterns of birds and fish, was formulated by Russell Eberhart and James Kennedy in 1995 [18]. PSO being a global optimization algorithm has many advantages such as it requires less number of parameters, it is simple and has shorter computation time and thus finds extensive use in a wide range of applications. Thus combination of PSO and FCM results in an efficient clustering algorithm since it overcomes the drawbacks of the FCM and is found to be effective [19-23]. In developing a RBFNN, fixing the number of centers and width of the RBF is most important and is usually done on a trial and error basis, which is a time consuming process. Many efforts in use of optimization algorithms for the above purpose can be found in literature [24-27]. Application of PSO for the above purpose can be found in [28].
The unique feature of ANN that it learns from the environment. Learning is a process of improving the performance of an ANN by updating its weights and bias levels. Gradient descent based learning methods have been used in past decades which have many shortcomings. They are very slow due to improper learning steps or may easily converge to local minima. To obtain better performance many iterative learning steps may be required. All the above issues are successfully overcome by Extreme Learning Machine (ELM) algorithm, proposed by G.B Huang (2002) [29]. ELM being an extremely fast non iterative algorithm has good generalization ability and hence been applied in many research applications [30-32]. The combined use of PSO, FCM and ELM in RBF neural network model building can lead to better performance of the model along with quick learning.
In the present work an RBF model has been developed by using hybrid PSO-FCM clustering algorithm and ELM learning. The model is further optimized with respect to centers and width of the RBF units by using PSO.Three standard datasets Balloon, Iris and Cancer have been used for validating the performance of the newly proposed model. The results obtained have been compared with that obtained from [1]. Thus the proposed RBFNN model using PSO, FCM and ELM not only optimizes the parameters of the network but also results in fast learning. This model proposes a fully automatic, quick learning RBF neural network model, which is the novelty of this work.
II. RADIAL BASIS FUNCTION (RBF) NEURAL
NETWORK
It is a special type of neural networks, where the design of the network is viewed as curve fitting problem in a high dimensional space [33]. It is a three layer feed forward neural network. Out of the three layers, input layer, hidden layer and output layer, the RBF network mainly differs from other type of neural networks mainly in the hidden layer. The hidden layer applies a non-linear transformation usually a Gaussian function, from the input space to a hidden space. The nodes in the hidden layer have centers that determine the structure of the network. The output Vj of jth RBF unit in the hidden layer for an input pattern x is given by equation (1)
V�(x) = exp �− �������� � (1)
where cj and σj are respectively the center and width of the jth
RBF unit, j= 1,2,…J are the number of centers, || || is the Euclidean distance. The network output Yk is given by equation (2)
Y = ∑ w� V�(x)� �� (2)
where wjk is the connection weight between the jth neuron and kth output neuron in the network k=1,2,…K are the number of output neurons. In the present study, RBF centers have been selected using PSO based FCM. In the learning phase of the network, an efficient ELM algorithm using a generalized (Moore- Penrose) inverse operation to the hidden layer outputs has been used to obtain the output weight (���) matrix . A. Extreme Learning Machine (ELM) ELM is a simple and efficient learning algorithm that can be used for single hidden layer feed forward neural network. It is entirely different from traditional gradient descent algorithm and has numerous advantages. Learning in ELM follows a non-iterative process where the output weights are analytically determined through simple generalized Moore – Penrose generalized inverse operation of the hidden layer output matrices. The vector of output weights β between the hidden layer and output layer is calculated according to equation (3).
� = �ϯ� (3)
where Hϯ is the Moore – Penrose generalized inverse of the matrix H and T is the output vector. Hence learning in ELM takes one epoch which makes it extremely faster and is the major advantage. It has also been observed that the use of ELM improves the generalization performance in comparison to gradient based learning.
Use of PSO optimized Radial Basis Function Neural Network for improved modeling
NMAMIT ANNUAL RESEARCH JOURNAL Vol 6. 2016 2
III.PSO-FCM CLUSTERING ALGORITHM
FCM is a most popular objective function based fuzzy clustering algorithm that assigns membership to each data point corresponding to each cluster center on the basis of distance between the cluster center and the data point. The objective in FCM is to minimize the sum of the distance between the data points and the center as given in equation (4). � = ∑ ∑ ���� ‖�� − ������!��� ‖ (4) where uki ,membership value, denotes the degree that Xk belongs to cluster j , m is fuzziness parameter usually set to be 2, X={X1,X2,…XN} are the classification samples, Vi is the cluster center , c is the number of clusters. The membership values satisfy the condition in equation (5) ∑ ��� = 1���� (5) The centers and the membership values are calculated using equations (6) and (7)
�� = ∑ "#$% &#'#*+∑ "#$%'#*+ (6)
��� = �∑ ,-.#/0$-
�.#/02� 3(%/+)42*+
(7)
FCM has certain limitations such as getting trapped in the
local minimum and slow convergence and its performance is greatly influenced by the initial value of the membership functions. To overcome these shortcomings, PSO a simple and global optimization algorithm has been introduced into FCM and is found to be successful.
PSO is a population based stochastic optimization algorithm. It uses the number of particles which are created randomly and move in the multidimensional space to reach optima. The two primary operators of Particle Swarm are: Velocity (u) update and Position (s) update. The particles update the position based on its own best (pbest) and entire swarms best (gbest) position using equations (8) and (9). u567� = w ∗ u56 + C�rand1(pbest5 − s56) + C rand2(gbest −s56) (8)
s567� = s56 + u567� (9) where rand1 and rand2 are uniformly distributed random
variables, C1 and C2 are acceleration factors and w is inertia weight.PSO-FCM algorithm is given in Appendix A [23].
IV. PSO FOR OPTIMIZING RBFNN ARCHITECTURE
Fixing of centers and width of the RBF units play a critical role in performance of the RBFNN model. Though the use of best clustering algorithm has some impact on improving the performance of a model, fixing the centers and width of the RBF units have a major role to play in this regard. This task is usually done on a trial and error basis, but is a very tedious, inefficient and time consuming task. Use of optimization algorithm for the above purpose can reduce considerable effort. An attempt has been done in using PSO optimization algorithm for fixing the number of centers and width of the RBF units. The objective function here is to maximize the sum of prediction accuracies on training and test data. Model optimization Algorithm is shown in Appendix B.
V. MODELLING OF DATASETS
The three datasets used in this study are classification data and were obtained from the machine learning repository [34]. Each dataset was divided into training (85%) and test (15%) data. The RBFNN model has been developed using customized MATLAB codes. The simulations have been carried out using matlabR2012a [35] environment running in an Intel i-3, 2.6 GHZ CPU. A suitable normalization procedure has been used to normalize the data (training and test) between (0, 1). Details of the datasets used with respect to the number of training and test data has been presented in Table I. Mean Square Error (MSE) as given in equation (10) has been used as the performance metric in the present study, where �; and �<> are the ith component of the actual and predicted values respectively and n is the length of the vector. MSE = �
? ∑ @X5 − XA> B?5�� (10)
TABLE I DETAILS OF THE DATASETS
Dataset Training Data Test Data Optimal Network
Configuration Balloon 17 3 4-2-1 Cancer 594 105 9-2-1
Iris 128 22 4-4-3
VI. RESULTS AND DISCUSSION The results of the study carried out on the proposed RBFNN model for three data sets namely Balloon, Cancer and Iris have been presented in this section. To implement PSO some parameters need to be initialized. The values of the parameters that have been set for the present study are as given in Table II.
TABLE II EXECUTION PARAMETERS FOR PSO
Parameter Value
Population Size 10 Iterations 100 W 0.9 C1 1.49 C2 1.49
Use of PSO optimized Radial Basis Function Neural Network for improved modeling
NMAMIT ANNUAL RESEARCH JOURNAL Vol 6. 2016 3
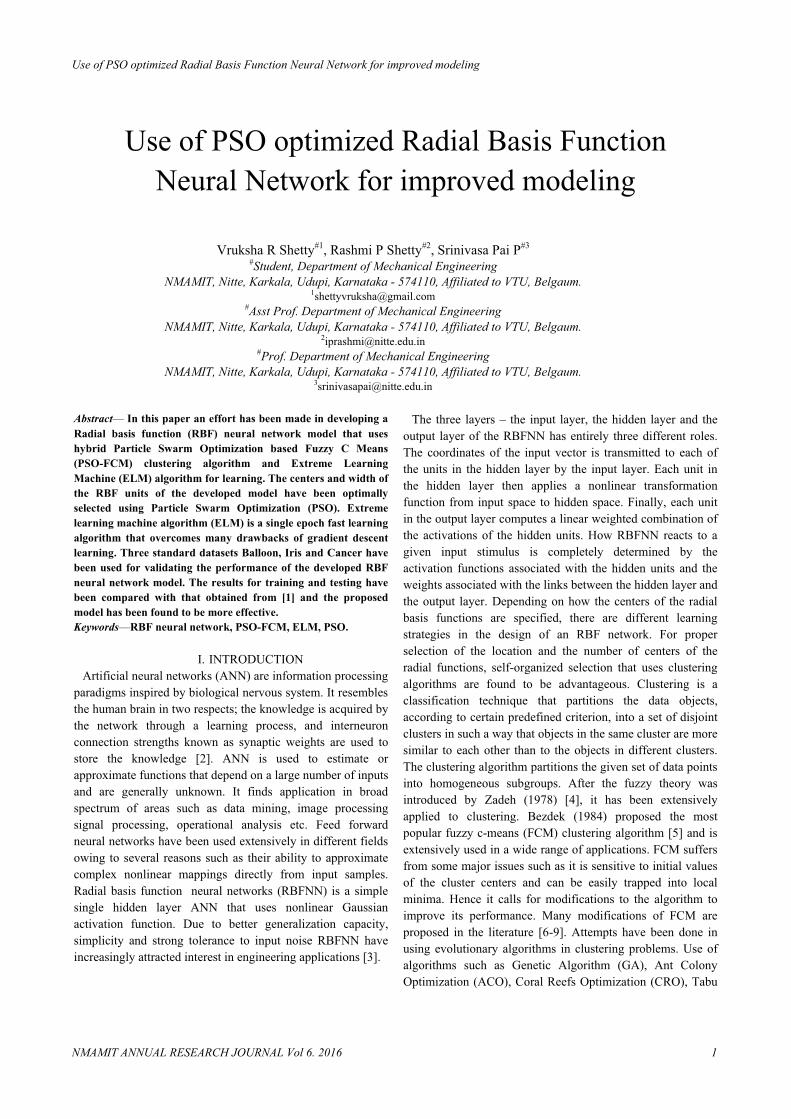
A. B Thiexpediffefor amadinstaaccucentreachThe 1- 1num
Fig. 1
alloon dataset is dataset haeriments. It coerent conditionall the dataset
de use in the ances. As shouracy on both ters and a widhed during trarange for num7 and 0.01- 1
mber of iteration
1 Variation of fitne
RES
ClassificatioAccuracy (%
MSE
Number of ep
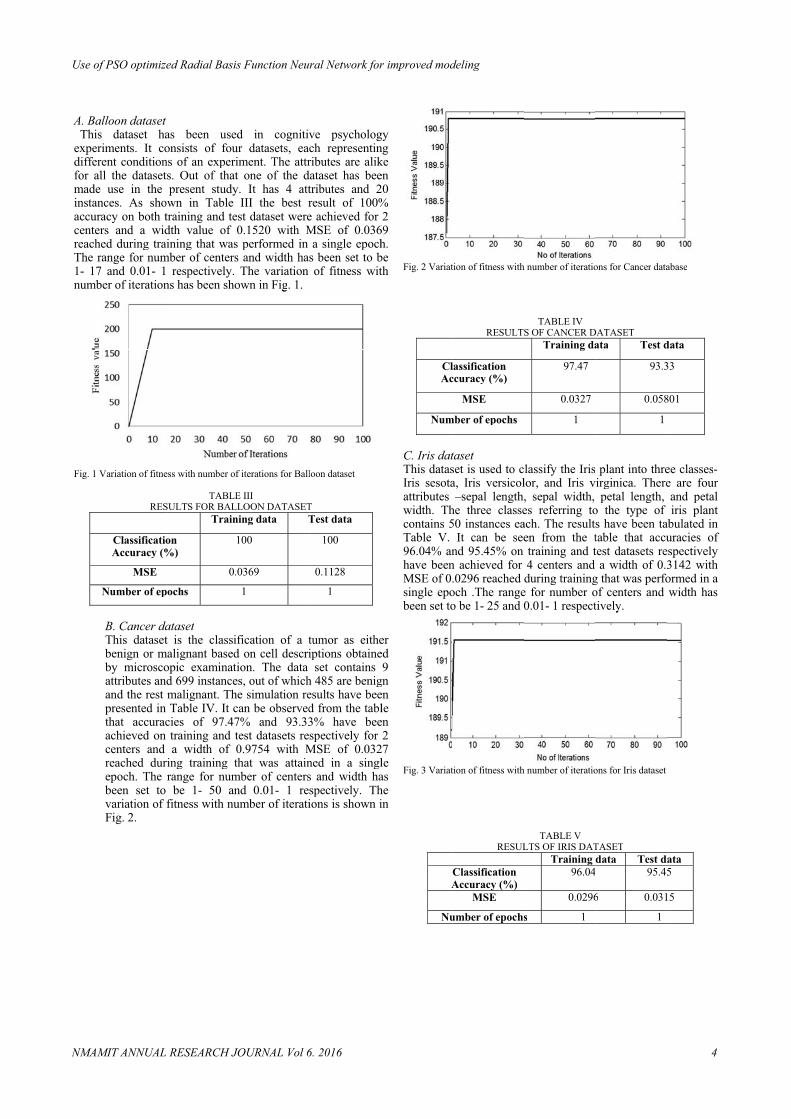
B. Cancer daThis datasetbenign or mby microscoattributes andand the rest presented in that accuracachieved on centers and reached durepoch. The been set to variation of Fig. 2.
as been usedonsists of founs of an experits. Out of thatpresent study
own in Table training and tedth value of 0ining that was
mber of centers respectively.
ns has been sho
ess with number of
TABLESULTS FOR BALL
Train
on %)
1
0.0
pochs
ataset t is the classif
malignant basedopic examinatid 699 instancemalignant. TheTable IV. It c
cies of 97.47training and ta width of 0
ring training thrange for numbe 1- 50 an
fitness with nu
d in cognitivur datasets, eaciment. The attrt one of the dy. It has 4 att
III the best rst dataset were0.1520 with M performed in
s and width hasThe variation
own in Fig. 1.
f iterations for Ball
E III LOON DATASET
ning data T
100
0369
1
fication of a td on cell descriion. The data s, out of whiche simulation re
can be observed7% and 93.33test datasets re0.9754 with Mhat was attain
mber of centersnd 0.01- 1 resumber of iterati
ve psychologch representinributes are alik
dataset has beetributes and 2result of 100%e achieved for MSE of 0.036
a single epochs been set to bof fitness wit
loon dataset
T Test data
100
0.1128
1
tumor as eitheiptions obtaine
set contains h 485 are benigesults have beed from the tabl3% have beespectively for
MSE of 0.032ned in a singls and width haspectively. Thions is shown i
gy ng ke en 20 % 2
69 h. be th
er ed 9
gn en le en 2
27 le as he in
Fig. 2 Variat
ClAc
Num
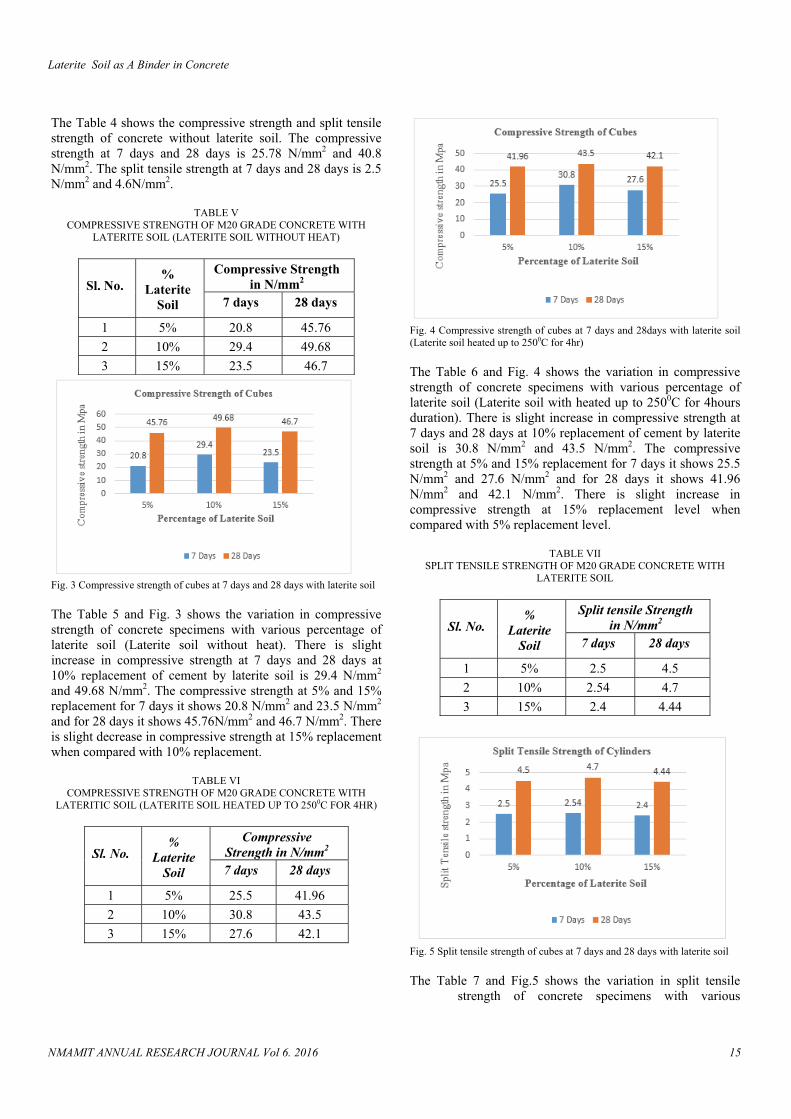
C. Iris datThis datasIris sesotaattributes width. Thcontains 5Table V. 96.04% anhave beenMSE of 0.single epobeen set to
Fig. 3 Variat
A
Nu
tion of fitness with
RESULT
lassification ccuracy (%)
MSE
mber of epochs
taset set is used to ca, Iris versicol–sepal length,
he three classe50 instances ea
It can be seend 95.45% on n achieved for .0296 reached och .The rangeo be 1- 25 and 0
tion of fitness with
RESUL
Classification Accuracy (%)
MSE
umber of epochs
h number of iteratio
TABLE IV S OF CANCER D
Training da
97.47
0.0327
1
lassify the Irislor, and Iris v, sepal width, es referring toach. The resulten from the ttraining and t4 centers and during training
e for number o0.01- 1 respect
h number of iteratio
TABLE V LTS OF IRIS DAT
Training 96.04
0.0296
s 1
ons for Cancer data
DATASET ata Test d
93.3
0.058
1
plant into threvirginica. There
petal length, o the type of s have been tatable that accutest datasets re
a width of 0.3g that was perfoof centers and tively.
ons for Iris dataset
TASET data Test da 95.45
6 0.031
1
abase
data
33
801
ee classes- e are four and petal iris plant
abulated in uracies of
espectively 3142 with ormed in a width has
ata 5
15
Use of PSO optimized Radial Basis Function Neural Network for improved modeling
NMAMIT ANNUAL RESEARCH JOURNAL Vol 6. 2016 4
D. Comparison of Modeling Performance In this section an effort has been done to compare the results of the present study with that of a similar work carried out by S. N. Qasem et al (2009) [1] for these three standard datasets. S. N. Qasem et al incorporated PSO in RBF network for optimizing the centers, the widths and the weights of network which used gradient descent learning. The k-means algorithm was used for initial selection of centers. The parameter values that were set for PSO implementation are as shown in Table VI. The comparison of the results has been shown in Table VII. It can be observed from the table that for Balloon dataset an increased accuracy of 100% on both training and test datasets have been achieved in the present study in comparison with 95.05% and 78.95% of accuracies of the previous work. In both the work, the network configuration is same. It is worth noting that the present study took only one epoch in contrast to 3161 epochs in the previous work that depicts the superiority of the current model. This has been possible due to the implementation of ELM in the present work and thus it greatly reduces the training time. For Cancer dataset, the accuracy on test data is 93.33% with a MSE of 0.05801, which is much higher compared to 71.72% prediction accuracy on test data at a lower value of MSE, when compared to 0.27464. But for Iris dataset the performances of the proposed model is comparable to that of the previous work,
except that this model required only one epoch when compared to 3774 epochs required for the previous case. All the results of the present study have been obtained for the stopping criteria of 100 iterations in PSO. It is in contrast to 10000 iterations for the previous work and thus there is a huge difference in the number of iterations, which proves the superiority of the present model. The use of PSO for optimizing the FCM algorithm, is an additional improvement in the current model, when compared to the previous model. Thus the proposed RBF neural network model which use PSO, FCM and ELM in optimizing the model performance has virtually outperformed the PSO-RBF model proposed by S. N. Qasem et al [1].
TABLE VI
EXECUTION PARAMETERS FOR PSO [S. N. QASEM ET AL (2009)] Parameter Value
This study presents the use of PSO algorithm in improving the clustering efficiency and also optimal selection of RBF parameters namely number of centers and width value of RBF units. ELM has been used as the learning algorithm. Study has been conducted by using three standard datasets. The results have been compared with a similar work carried out by S. N. Qasem et al. [1]. The results show that the proposed model resulted in better prediction accuracy for Balloon and Cancer datasets and comparable accuracy for Iris datasets. Due to the implementation of ELM quick learning in only one epoch have been observed as the major advantage in comparison with thousands of epochs required in case of the previous reported work. The stopping criteria of PSO for the present study also have been observed to be quite small in comparison with that of the previous reported work. Thus the use of PSO in both clustering as well as optimizing the center and
width of the RBF unit in combination with ELM can result in a more efficient RBF neural network model.
REFERENCES
[1] S.N.Qasem and S.M.Shamsuddin, “Improving
Performance of Radial Basis Network based with Particle Swarm Optimization”, IEEE Congress on Evolutionary Computation, pp.3149-3156, 2009.
[2] S. A. Kalogirou, “Artificial neural networks in renewable energy systems applications: a review”, Renewable and Sustainable Energy Reviews, vol. 5. pp. 373–401, 2001.
[3] Y.J.oyang, S.C.Hwang, C.Yu and Z.Chen,”Data classification with radial basis function networks based on a novel kernel density estimation algorithm”, IEEE Transactions on Neural Networks, vol.16. pp. 225-236, 2005.
[4] L.A. Zadeh. “Fuzzy sets as a basis for theory of possibility”, Fuzzy Sets and Systems, vol.1.pp.3-28, 1978
[5] J. Bezdek, R. Ehrlich, and W. Full, “FCM: The fuzzy c-means clustering algorithm”, Computers & Geosciences, vol. 10, no.2, pp. 191-203, April 1984.
[6] N. Pal, K. Pal, J. Keller, and J. Bezdek, “A possibilistic fuzzy c-means clustering algorithm”,
Use of PSO optimized Radial Basis Function Neural Network for improved modeling
NMAMIT ANNUAL RESEARCH JOURNAL Vol 6. 2016 5
IEEE Trans. Fuzzy Syst, vol. 13, no. 4, pp. 517– 530, Aug. 2005.
[7] J.Li; X.Gao; H.Ji, ”A feature weighted FCM clustering algorithm based on evolutionary strategy Intelligent Control and Automation, Proceedings of the 4th World Congress on Year: vol.2. pp. 1549 - 1553. 2002.
[8] K. K. Chintalapudi and M. Kam , “A noise-resistant fuzzy c means algorithm for clustering”, Fuzzy Systems Proceedings, IEEE World Congress on Computational Intelligence, vol.2, pp 1458 - 1463, 1998.
[9] C.C.Hung, S.Kulkarni and B.C.Kuo, "A New Weighted Fuzzy C-Means Clustering Algorithm for Remotely Sensed Image Classification” , IEEE Journal of Selected Topics in Signal Processing, vol.5. no.3, pp.543 - 553, 2011.
[10] L.E.Agust, S.S.Sanz, S.J.Fernández, L.C.Calvo, J.D.Ser, and J.A.P.Figueras, “A new grouping genetic algorithm for clustering problems”, Expert Systems with Applications, vol. 39, no.10, pp. 9695-9703, 2012.
[11] T. Niknam, M. Nayeripour and B.B. Firouzi, “Application of a new hybrid optimization algorithm on cluster analysis”, Proceedings of world academy of science, engineering and technology, vol. 36, pp.741-746, December. 2008.
[12] O.M.Jafar and R.Sivakumar, “A Study of Bio-inspired Algorithm to Data Clustering using Different Distance Measures”, International Journal of Computer Applications, vol. 66, no. 12, pp. 33-44, 2013.
[13] Y. Kao and K. Cheng, “An ACO-based clustering algorithm”, In Ant Colony Optimization and Swarm Intelligence, pp. 340-347, 2006.
[14] Y. Liu, Y. Liu,L. Wang and K.Chen,“A hybrid tabu search based clustering algorithm” Knowledge-Based Intelligent Information and Engineering Systems. pp. 186-192, September. 2005.
[15] K.S.Al-Sultan, “A tabu search approach to the clustering problem”, Pattern Recognition, vol.28, no.9, pp.1443-1451, 1995.
[16] S.Rana, S. Jasola and R.Kumar, “A hybrid sequential approach for data clustering using K-Means and particle swarm optimization algorithm,” International Journal of Engineering, Science and Technology, vol. 2, no.6, pp. 167-176, 2010.
[17] I.G.Medeiros, J.C.Xavier-Junior and A.M. Canuto, “Applying the Coral Reefs Optimization algorithm to clustering problems”, International Joint Conference on Neural Networks (IJCNN), pp. 1-8, July. 2015
[18] R.C.Eberhart and J. Kennedy, “A new optimizer using particle swarm theory”, Proceedings of the sixth international symposium on micro machine and human science, vol. 1, pp. 39-43, October. 1995.
[19] A.Mekhmoukh and K.Mokrani, “Improved Fuzzy C-Means based Particle Swarm Optimization (PSO) initialization and outlier rejection with level set methods for MR brain image segmentation” , Computer methods and programs in biomedicine, vol.122,no. 2, pp. 266-281, 2015.
[20] L. Hongpo,S. Jun, W.Hai, T.Shuhua and T. Zhiguo, “High
Resolution Sonar Image Segmentation by PSO based Fuzzy Cluster Method”, Fourth International Conference on Genetic and Evolutionary Computing (ICGEC), pp. 18-21, December. 2010.
[21] J. Chrouta, A. Zaafouri and M.Jemli, “Identification of an irrigation station using hybrid fuzzy clustering algorithms based on particle swarm optimization”, 12th International Multi-Conference on Systems, Signals & Devices (SSD), pp. 1-7. March. 2015.
[22] E. Sivaraman, S. Arulselvi and K.Babu, “March. Data driven fuzzy c-means clustering based on particle swarm optimization for pH process”, International Conference on Emerging Trends in Electrical and Computer Technology (ICETECT), pp. 220-225, 2011.
[23] H.C. Liu, J.M. Yih, D.B. Wu and S.W. Liu, “Fuzzy C-mean clustering algorithms based on Picard iteration and particle swarm optimization”, International Workshop on Geoscience and Remote Sensing. ETT and GRS vol. 2, pp. 838-842, December. 2008.
[24] Z.Q.Zhao and D.S. Huang, “A mended hybrid learning algorithm for radial basis function neural networks to improve generalization capability”, Applied Mathematical Modelling, vol. 31,no.7, pp.1271-1281, 2007.
[25] S.M.R.Loghmanian, H. Jamaluddin, R. Ahmad, R. Yusof and M. Khalid, “ Structure optimization of neural network for dynamic system modeling using multi-objective genetic algorithm”, Neural Computing and Applications, vol. 21, no.6, pp.1281-1295, 2012.
[26] X.Z. Xu, S.F. Ding, Z.Z. Shi and H. Zhu ,”Optimizing radial basis function neural network based on rough sets and affinity propagation clustering algorithm”, Journal of Zhejiang University SCIENCE, vol. 13, no. 2, pp.131-138, 2012.
[27] N. Qu, H. Mi, B. Wang and Y. Ren, “Application of GA-RBF networks to the nondestructive determination of active component in pharmaceutical powder by NIR spectroscopy”, Journal of the taiwan Institute of Chemical Engineers, vol. 40, no. 2, pp.162-167, 2009.
[28] Z.H.A.O.ZhongQiu, W.U. XinDong, L.U. CanYi, H. Glotin and G.A.O. Jun, “Optimizing widths with PSO for center selection of Gaussian radial basis function networks”, Science China Information sciences, vol. 005, pp. 82-98, 2014.
[29] G.B.Huang, Q.Y. Zhu and C.K. Siew, “Extreme learning machine: a new learning scheme of feedforward neural networks”, IEEE International Joint Conference on Neural Networks, vol. 2, pp. 985-990. July. 2004.
[30] O. Anicica, S. Jovića, H. Skrijelja and B. Nedićb, “Prediction of laser cutting heat affected zone by extreme learning machine”, Optics and Lasers in Engineering , vol. 88, pp. 1–4 .2017,
[31] S. S. Mladenovića, M. Milovančevićb, I. Mladenovića and M. Alizamirc, “Economic growth forecasting by artificial neural network with extreme learning machine based on trade, import and export parameters”, Computers in Human Behavior, vol. 65, pp. 43–45. 2016.
[32] J. S. Oro, A. Duarte and S. S. Sanz, “Robust total energy demand estimation with a hybrid Variable Neighborhood Search – Extreme Learning Machine algorithm”, Energy Conversion and Management, vol.123, no.1, pp.445-452. 2016.
[33] Haykin, S, A comprehensive foundation. Neural Networks, Second edition, Person Education, 2004.
[34] C.Blake and C.J.Merz, “UCI Repository of Machine Learning Databases”, http://www.ics.uci.edu/~MLRepository.html,1998
[35] MATLAB R2012a@R,www.mathworks.com
Use of PSO optimized Radial Basis Function Neural Network for improved modeling
NMAMIT ANNUAL RESEARCH JOURNAL Vol 6. 2016 6
������������ ������������
START
Membership functions (ukj)
���� � ��
Initialize no of particles between 1 & 0
� � ������ ��� ���� ���
Centers are calculated using
� � ��������� � ��
���
������
Calculate fitness value of the objective function
��� � �
����������������
�� !"#�$��
Update membership function using
Calculate fitness value with respect to the updated membership function
The two fitness values are compared and the best is considered pbest
The best pbest value among all the particlesinthe given population is considered as gbest
%&'(� � ) * %&' + ,�-./0��12345& � 4&'# + ,�6-./07�82345 � 4&'# 4&'(� � 4&' + %&'(� The velocity and position of each particle will be updated based on the equations
Stopping criteria
Final centers corresponding to the membership function
STOP
Use of PSO optimized Radial Basis Function Neural Network for improved modeling
NMAMIT ANNUAL RESEARCH JOURNAL Vol 6. 2016 7
�����������������������������������
��
YES
START
Randomly generate center and width within the specified range
No of centers generated by PSO
PSO-FCM clustering algorithm selects the centers
Width values and centers generated
RBFNN model calculates the fitness value of the objective function (Prediction accuracy)
Update velocity and position of particles
Stopping criteria
Best model with high prediction accuracy
STOP
Use of PSO optimized Radial Basis Function Neural Network for improved modeling
NMAMIT ANNUAL RESEARCH JOURNAL Vol 6. 2016 8
In Vitro Propagation and Molecular Characterization ofLocal Accessions of Santalum Album
Aparna B#1, Bharathi A#2, Yashas K#3, Rashmi KV#4
1, 2, 3#Student, Department of Biotechnology, #Assistant Professor, Department of Biotechnology,
Sir M Visvesvaraya Institute of Technology, Bangalore, Karanataka- 562157, Affiliated to VTU, Belgaum. [email protected]
Abstract—Callus induction studies and optimization of shoot induction from the callus is carried out in Santalum album along with , Molecular Phylogenetic analysis of local varieties using chloroplast intergenic spacer region-trnH-psbA .Use of hormones Naphthaleneacetic acid (NAA), 2,4-Dichlorophenoxyacetic acid (2,4-D) and Kinetin (Kn) with concentration of 1mg/L in MS media for inter-nodal explants resulted in Rapid elongation , Callus induction and Multiple Shoot generation in relatively in short period of time. Molecular investigation using trnH-psbA region from the accessions collected from six different biogeographic areas of Karnataka showed no much diversity indicating no subspecies existing within the species.
Keywords—Santalum album, plant tissue culture, phylogenetic analysis
I. INTRODUCTION
Sandalwood (Santalum album) is a hemi root parasitic tree which grows upto 10-15m in height and 12m girth when it reaches the age of 60-80 years [1]. It grows widely in south India and is highly valued for its fragmented heartwood which contains sandal oil. The aroma of oil is due to alpha and beta santalols [2]. Harvesting of sandalwood for its commercial applications results in the removal of entire tree leading to the critical loss of genetic diversity [3,4]. Hence there is an urgent need to develop a efficient protocol for large scale production of high quality sandalwood.
Genetic variation is a important conservation strategy, which provides information about the given species adaptability to environmental changes, natural evolution and survival [5]. Knowledge of genetic variation between and within species plays an important role in appropriate management strategies of conservation [5]. Hence it is necessary to assess genetic variability. Molecular phylogenetic analysis will provide new perspectives on relationships and biogeographic patterns among the widespread and
economically important verities [6]. The present study chloroplast trnH-psbA spacer region is used for molecular characterization. The sequence of chloroplast trnH-psbA intergenic spacer from Santalum album verities can be used as a potential DNA barcode to identify Santalum album varieties in global market [6]. The phylogenetic analysis carried out using chloroplast trnH-psbA spacer sequences aid in determining evolutionary relationship among the biogeographic variants. Here we report a tissue culture protocol to induce rapid elongation and multiple shoot generation from Santalum album in relatively short period of time. With further slight optimization, these protocols can be used for large scale propagation in future to meet the demand for better quality plantlets.
II. MATERIALS AND METHODS
A. In vitro propagation methods
Healthy young Inter-nodal and apical meristem explants are collected from the wildly grown 2 to 3 years old Santalum album plants at Sir MVIT college campus, Bangalore. These explants are surface sterilized with 0.05% (w/v) Bavistin for 5-6mins and 0.1% (w/v) mercuric chloride for 4-5 mins followed by thorough sterile distilled water washes to remove the traces of these chemicals. Murashige and Skoog media (MS media) with 3% sucrose and 0.8% agar, with different concentrations of growth regulators were used for direct and indirect organogenesis (Table I). Explants are inoculated on the semisolid media, incubated at a temperature of 25±2ºC and are provided with cool white fluorescent light with 16hrs photoperiod. Cultures are monitored for any contaminations or response. These cultures are sub cultured on
In Vitro Propagation and Molecular Characterization ofLocal Accessions of Santalum Album
of trnH-psbA regiantalum accessionLane 11: 100ng �
oining (NJ) group showedtudy are mono
ed by ethidiummplate for ampcer region. Amtion mixture M MgCl2, 50m
m were collez., Sir MVITology Bangalo
imal attempts
ntalam internodal e
ion gave an intg between 350indicating lessof 396 bp,
mony informativ
ion in Santalum acns; Lanes 7,8: Pos�DNA
tree with Scd all the accophyletic (Fig.
m bromide plifying the mplification
containing mM KCl
cted from T Campus ore, ,
s for root
explants
tense sharp 0 to 450bp s conserved
144 were ve sites.
ccessions; M: sitive control;
cleropyrum essions of 3). All the
In Vitro Propagation and Molecular Characterization ofLocal Accessions of Santalum Album
NMAMIT ANNUAL RESEARCH JOURNAL Vol 6. 2016 10
Indiathe CobserSanta
Fig.3 multip
StudySantaBA ,K45 daof NArelatiSantavitro for iregensatisfgloba
Sdone congrlikeliSantaanalywith of thbiogealso llarge varietthe in
an accessions wChinese accesrved in the secalum album ha
The Neighbour Jple Sanatlum acces
y of shoot realum album doKn and 2-ip. Tays .however thAA , 2,4-D anvely short pe
alum album hpropagation [
invitro propagneration of elify the consually [15].
tudy of phylogby Harbaugh
ruent trees hood, and B
alum album iysi on Indian vaworld varietiehis species ieography. Genelacking data, wscale genetic
ties which cannvitro techniqu
were clustered ssions and o
cond subclusters nomajor subs
Joining Tree obtassions; Numbers on
IV. DISCU
egeneration frone by Janarth
This study repohe present studnd Kn resulted eriod. Being as always pos
[13,14]. The vgation are verite germplasm
umer demand
geny and biogeh and Baldwiof maximum
Bayesian methin Australia. Aarieties of San
es will providein India andetic diversity awhere we finddiversity analy
n be conservedues. There is al
into one sub one Kerala acr. This indicatspecies.
ained from the trn the branch is boo
USSIONS
rom inter-nodaham and Sumaorted plantlets rdy with hormon
in rapid shooa hemi-root psed greater ch
very few optimry promising
m and disease for sandalw
eography of thin [16], propo
m parsimony hods support A large scaletalum album a better insight
d its evolutioanalysis of Sand hardly few rysis will help td and mass prolso scope to ev
cluster, two ofccession wereted that species
rnH-psbAregion ootstrap percentage
al explants ofathi [12] usingregeneration inne combinationt generation inparasitic plan
hallenges in inmized protocols
towards massfree plants to
wood products
he sandalwoodsosed based on
, maximuman origin of
e phylogeneticand comparisons on the originon in Indiantalum album is
reports [17]. Ato identify eliteopagated using
valuate stress to
f e s
f e
f g n n n t n s s o s
s n
m f c n n n s
A e g o
evaluate such elite
The poptimum protocolsSantalumprotocolsto meet tof chloroalbum vaidentify Phylogenintergenicrelationsh
The BangalorBangalorInstitute HOD, DInstitute o
[1] S.K. Gof San
[2] K. H. Theagof SaIntern
[3] F. H. SandaSympo
[4] A. RSantal49, no
[5] J.ShachlorophyloAmeri
[6] W.J.Kplantsspacer
[7] J.J. DFocus
[8] D. Beand inplants
[9] T. SareticuAmeri
stress induced e varieties to en
V
present study cconcentration
s were responm album. Wits can be appliethe demand foroplast trnH-psarieties can beSantalum alb
netic analysis cc spacer sequehips among the
A
authors acknre, Sri Krishnare, Dr M S Iof Technology
Department of of Technology
Ghosh, M. Balasunndal," KFRI Resea
Shankaranarayangarajan, "Sandalwoantalum album L.national Agricultur
Mc Kinnell, "Staalwood in Westernosium on SandalwRugkhla, "Somatilum album and S. o. 320, pp. 563-57aw, E.B. Lickey, Eoplast genome sgenetic studies inican journal of bot
Kress, D.L.Ericksos: the coding rbcLr region”, Plos one
Doyle, L.J. Doyles, Vol. 12, pp. 13-1ellstedt, M. Pirie, Jnexpensive methods", American Journang, D. Crawfordlate evolution, aican Journal of Bo
response of enhance the oil
V. CONCLUSI
concludes thatns of NAA, 2,4nsive to induth further slied for large scr better qualitybA intergenic
e used as a pobum varieties carried out usinences aid in de biogeographi
ndaran, and M.I.March Report No. 25na, G. Ravikumar, ood, HESP and E" in ACIAR proceral Research, pp. 8atus of managemen Australia and Ind
wood in the Pacific ic embryogenesisspicatum", Journa
1, 1998. E.E. Schilling, R.Lsequences to chn angiosperms: thtany, vol. 94, No. on, “A two-locus L gene complemee, Vol. 2, No.6, ppe, “Isolation of p15, 1990. J. Visser, M. de Vd for the direct PCnal of Botany, 201d, T. Stuessy, “and biogeographyotany, Vol. 84, No
ssential oil prosynthesis.
IONS
t, the MS me4-D and Kn uuce multiple ight optimizatale propagatio
y plantlets.Thespacer from
otential DNA in global ma
ng chloroplast determining evc variants.
MENT
e support ofcational Trust
pal, Sir M Viand Dr H G
gy, Sir M Vi
ES M. Ali, "Studies on 5, 15p,1985.
C. R. RangaswamESPO Oils from theedings, Australia89-92,1998. ent and silviculturdonesia.," In Proce, 1990.
s and plantlet al of Experimenta
L. Small, “Comparhoose noncoding he tortoise and t3, pp. 275-88, Maglobal DNA barc
ents the non-codinp. e508, Jun 2007.lant DNA from
Villiers and B. GehCR amplification o0.
“Chloroplast DNAy of Paeonia (P. 8, pp. 1120-.1136
oduction in
edium with used in our
shoots in tion, these
on in future e sequences m Santalum
barcode to arket. The trnH-psbA
volutionary
f KSCST, (Sri KET), svesvaraya Nagendra, svesvaraya
spike disease
my, and K. S. he Heartwood an Centre for
e research on eedings of the
formation in al Botany, vol.
rison of whole regions for
the hare III”, ar 2007. code for land ng trnH-psbA
fresh tissue”,
hrke, "A rapid of DNA from
A phylogeny, Paeoniaceae)”, 6, Aug 1997.
In Vitro Propagation and Molecular Characterization ofLocal Accessions of Santalum Album
NMAMIT ANNUAL RESEARCH JOURNAL Vol 6. 2016 11
[10] K, Tamura, G, Stecher, D. Peterson, A. Filipski, S. Kumar, “MEGA6: molecular evolutionary genetics analysis version 6.0”, Molecular biology and evolution, mst197, Oct 2013.
[11] N. Saitou, M.Nei, “The Neighbor-joining Method: A New Method for Reconstructing Phylogenetic Trees’,” Mol. Biol. Evol., vol. 4, no. 4, pp. 406–425, 1987.
[12] E. Sumathi and B. Janarthana, "High frequency shoot regeneration from Internodal Explants of Santalum album L," International Journal of Botany, vol. 7, no. 3, pp. 249–254, Mar. 2011.
[13] G. Lakshmi Sita, N. V. Raghava Ram, and C. S. Vaidyanathan, "Differentiation of embryoids and plantlets from shoot callus of sandalwood," Plant Science Letters, vol. 15, no. 3, pp. 265–270, Jul. 1979.
[14] P. S. Rao and V. A. Bapat, "Vegetative propagation of sandalwood plants through tissue culture," Canadian Journal of Botany, vol. 56, no. 9, pp. 1153–1156, May 1978.
[15] Mujib, Abdul. "In vitro regeneration of Sandal (Santalum album L.) From leaves", Turkish Journal of Botany, vol 29, no. 1, pp 63-67, 2005.
[16] D. Harbaugh and B. Baldwin, "Phylogeny and biogeography of the sandalwoods (Santalum, Santalaceae): repeated dispersals throughout the Pacific", American Journal of Botany, vol. 94, no. 6, pp. 1028-1040, 2007
[17] S. Azeez, Abdul, R. Nelson, A. Prasadbabu, and M. Srinivas Rao. "Genetic diversity of Santalum album using random amplified polymorphic DNAs."African Journal of Biotechnology 8, no. 13, 2009.
In Vitro Propagation and Molecular Characterization ofLocal Accessions of Santalum Album
Abstract—Concrete is a major resources using worldwide in several infrastructural projects. In this experimental work, the laterite soil is used as binder material and partially replacing the cement up to 15%. The fresh properties and hardened properties of concrete specimen with laterite soil were studied. The compressive strength of cubes at 28 days is increasing at all replacement level when compared with referral mix compressive strength. The split tensile strength is maximum at 10% replacement level when compared with referral mix split tensile strength. The studies shows that the post-heat laterite soil shows slight decrease in compressive strength when compared with not-heated laterite soil concrete specimen. Keywords—Compressive strength, Split tensile strength, Laterite soil, Workability, Aggregates.
I. INTRODUCTION Concrete is the second largest materials consumed around
globe after the water. The concrete exhibit various properties in hardened states such as strength, durability and fire resistance. Nowadays due to rapid development in the country, the construction industries are facing scarcity of natural resources such as river sand and coarse aggregate, also the burden on the raw materials used in the manufacturing of cement.
In [1] this research study, the authors concluded that the compressive strength, flexural strength and split tensile strength increases at 20% replacement of natural sand with laterite soil. It is observed that [2] by introduction of laterite content into the concrete matrix is found to reduce the workability of the mix. This is due to finesse of laterite which ultimately increases the total surface area of concrete and consequently, more water is required to wet the surface of aggregate. From the observation [3], the compressive strengths of laterite-cement mix increased with increase in percentage of cement content up to 20% but decreased at cement contents above 20%.
II. SCOPE OF RESEARCH These experimental research work has taken up to investigate the strength properties of concrete by partially replacement of cement with laterite soil and compare the results with referral mix. The objective of the research work is:
1. To study the fresh properties of concrete with
various percentage of laterite soil. 2. To study the mechanical properties such as
compressive strength and split tensile strength with various percentage of laterite soil (With and without heat of laterite soil).
III. EXPERIMENTAL PROGRAM The properties of constituent’s materials of concrete (M20) are discussed in this section: A. Cement
The cement is the main ingredient of concrete is used as a binder material, setting starts when cement contacts with water. The cement plays vital role in concrete material to attain required strength and durability. The Ordinary Portland Cement (OPC) is used and it conforms to IS: 12269-1987.
TABLE I
PHYSICAL PROPERTIES OF ORDINARY PORTLAND CEMENT (OPC 53 GRADE)
Sl.No. Characteristics Unit Test
results
Requirement as per
IS: 12269– 1987
1 Setting time Initial Set Final Set
Minute Minute
s
90.00
250.00
Min 30.00
Max 600.00
2 Compressive Strength
3days 7days 28days
MPa MPa MPa
35.00 51.00 63.50
Min 27.00 Min 37.00 Min 43.00
3 Standard % 35.00 -
4 Specific - 3.15 -
B. Coarse aggregate The crushed stone aggregates of 20 mm size obtained from local quarry site were used for the present research work. The
Laterite Soil as A Binder in Concrete
NMAMIT ANNUAL RESEARCH JOURNAL Vol 6. 2016 13
specific gravity of the coarse aggregates were found to be 2.7. The water absorption values obtained for the aggregates is 0.5%.
C. Natural sand The natural sand was locally procured and conformed to grading zone III as per IS: 383-1970. The table 2 shows the properties of natural sand.
TABLE II PROPERTIES OF NATURAL SAND
Sl. No. Characteristics Value
1 Type Natural 2 Specific gravity 2.6 3 Water absorption 2.% 4 Grading zone Zone III
D. Laterite soil The laterite soil sample is collected from a quarry and sieved using 150 micron sieve. The fine laterite soil dust size less than 150 microns is used in the concrete. The chemical composition of laterite soil varies widely based on genesis, climatic conditions and age of laterization. Some lateritic soil contain more than 60% Fe2O3 and little of Al2O3 and where as some contain more than 60% SiO2 and little of Al2O3 and Fe2O.
10 Chloride 0.018 E. Water Water is the most important constituent of a concrete mass which enables bonding between cementatious materials and the aggregates and also helps in the hydration of cement which is the most important phenomenon in gaining strength. Potable water which is free from salts and impurities is used for mixing and also curing purposes. F. Mix design The concrete mix is designed based on IS: 10262-2009. The mix proportions of M20 grade of concrete is 1:1.3:2.4 with water to cement ratio of 0.45. The Ordinary Portland
Cement is partially replaced with lateritic soil at 5%, 10% and 15%.
IV. METHODOLOGY AND DISCUSSION The calculated amount of concrete ingredients were weighed and mixed thoroughly in concrete mixer till the homogeneous mix is achieved. The cubes of 150 mm size, cylinder of 150 mm. diameter and 300 mm length were casted and cured for 7days and 28days. Total eighteen cubes and eighteen cylinders with varying percentage of cement by lateritic soil were tested at room temperature. G. Compressive strength test The compressive strength test was carried out on universal testing machine of 200 MT capacity as shown in fig. 1. After curing periods, the hardened concrete specimens were tested for 7 days and 28 days. The results of concrete specimen with various percentage of lateritic soil is compared with referral mix.
Fig. 1 Compressive Strength Test H. Split tensile strength The cylinder specimen were tested for split tensile strength after curing periods of 7days and 28days on universal testing machine of 200MT capacity as shown in fig. 2.
Fig. 2 Split Tensile Strength Test I. Observation
The following graphs shows the test results of the hardened concrete for 7days and 28days:
TABLE IV
MECHANICAL PROPERTIES OF REFERRAL MIX
Sl. No. Compressive
Strength in N/mm2 Split Tensile
Strength in N/mm2 7 days 28 days 7 days 28 days
1 24.78 40.8 2.5 4.6
Laterite Soil as A Binder in Concrete
NMAMIT ANNUAL RESEARCH JOURNAL Vol 6. 2016 14
The Table 4 shows the compressive strength and split tensile strength of concrete without laterite soil. The compressive strength at 7 days and 28 days is 25.78 N/mm2 and 40.8 N/mm2. The split tensile strength at 7 days and 28 days is 2.5 N/mm2 and 4.6N/mm2.
TABLE V COMPRESSIVE STRENGTH OF M20 GRADE CONCRETE WITH
LATERITE SOIL (LATERITE SOIL WITHOUT HEAT)
Sl. No. %
Laterite Soil
Compressive Strength in N/mm2
7 days 28 days
1 5% 20.8 45.76 2 10% 29.4 49.68 3 15% 23.5 46.7
Fig. 3 Compressive strength of cubes at 7 days and 28 days with laterite soil The Table 5 and Fig. 3 shows the variation in compressive strength of concrete specimens with various percentage of laterite soil (Laterite soil without heat). There is slight increase in compressive strength at 7 days and 28 days at 10% replacement of cement by laterite soil is 29.4 N/mm2 and 49.68 N/mm2. The compressive strength at 5% and 15% replacement for 7 days it shows 20.8 N/mm2 and 23.5 N/mm2 and for 28 days it shows 45.76N/mm2 and 46.7 N/mm2. There is slight decrease in compressive strength at 15% replacement when compared with 10% replacement.
TABLE VI COMPRESSIVE STRENGTH OF M20 GRADE CONCRETE WITH
LATERITIC SOIL (LATERITE SOIL HEATED UP TO 2500C FOR 4HR)
Sl. No. %
Laterite Soil
Compressive Strength in N/mm2 7 days 28 days
1 5% 25.5 41.96 2 10% 30.8 43.5 3 15% 27.6 42.1
Fig. 4 Compressive strength of cubes at 7 days and 28days with laterite soil (Laterite soil heated up to 2500C for 4hr) The Table 6 and Fig. 4 shows the variation in compressive strength of concrete specimens with various percentage of laterite soil (Laterite soil with heated up to 2500C for 4hours duration). There is slight increase in compressive strength at 7 days and 28 days at 10% replacement of cement by laterite soil is 30.8 N/mm2 and 43.5 N/mm2. The compressive strength at 5% and 15% replacement for 7 days it shows 25.5 N/mm2 and 27.6 N/mm2 and for 28 days it shows 41.96 N/mm2 and 42.1 N/mm2. There is slight increase in compressive strength at 15% replacement level when compared with 5% replacement level.
TABLE VII SPLIT TENSILE STRENGTH OF M20 GRADE CONCRETE WITH
LATERITE SOIL
Sl. No. %
Laterite Soil
Split tensile Strength in N/mm2
7 days 28 days
1 5% 2.5 4.5 2 10% 2.54 4.7 3 15% 2.4 4.44
Fig. 5 Split tensile strength of cubes at 7 days and 28 days with laterite soil The Table 7 and Fig.5 shows the variation in split tensile
strength of concrete specimens with various
Laterite Soil as A Binder in Concrete
NMAMIT ANNUAL RESEARCH JOURNAL Vol 6. 2016 15
percentage of laterite soil (Laterite soil without heat). There is slight increase in split tensile strength at 7 days and 28 days at 10% replacement of cement by laterite soil is 2.54 N/mm2 and 4.7 N/mm2. The split tensile strength at 5% and 15% replacement for 7 days it shows 2.5 N/mm2 and 2.4 N/mm2 and for 28 days it shows 4.5 N/mm2 and 4.44 N/mm2. There is slight increase in split tensile strength at 10% replacement level when compared with 5% replacement level.
TABLE VIII
SPLIT TENSILE STRENGTH OF M20 GRADE CONCRETE WITH LATERITIC SOIL (LATERITE SOIL HEATED UP TO 2500C FOR 4HR)
Sl. No. %
Laterite Soil
Compressive Strength in N/mm2 7 days 28 days
1 5% 2.6 4.58 2 10% 2.68 4.9 3 15% 2.5 4.5
Fig. 6 Split tensile strength of cubes at 7 days and 28days with laterite soil (Laterite soil heated up to 2500C for 4hr) The Table 8 and Fig 6 shows the variation in split tensile strength of concrete specimens with various percentage of laterite soil (Laterite soil with heated up to 2500C for 4hours duration). There is slight increase in split tensile strength at 7 days and 28 days at 10% replacement of cement by laterite soil is 2.68N/mm2 and 4.9N/mm2. The split tensile strength at 5% and 15% replacement for 7 days it shows 2.6N/mm2 and 2.5N/mm2 and for 28 days it shows 4.58N/mm2 and 4.5N/mm2. There is slight increase in split tensile strength at 10% replacement level when compared with 5% replacement level.
V. CONCLUSIONS From the above observation, we can conclude that the
compressive strength of concrete cubes specimen at all replacement level of cement with laterite soil shows slight increase in compressive strength when compared with referral mix. The cylinder specimen at 10% replacement level shows increasing in split tensile strength when compared with
referral mix. The post-heat laterite soil in concrete shows slight decrease in compressive strength when compared with not-heated laterite soil in concrete and referral mix, but shows slight increase in split tensile strength when compared with not-heated laterite soil cylinder specimen. Further research work needs to be conducted to study the durability properties of concrete with laterite soil.
REFERENCES [1] Biju Mathew, C. Freeda Christy, Soumya, Benny Joseph, “Study on
Strength of Concrete by Partial Replacement of Fine Aggregate with M-Sand and Laterite with Super plasticizers,” International journal of Engineering Trends and Technology, vol. 38, No. 8, pp. 413-416, 2016.
[2] Tanvir Asif Zerdi, Sayyad Saddan Hussain, Syed Zeeshan Ali, Qizari Ansari, “Suitability of Using Laterite as Partial Replacement of Fine Aggregate in Concrete”, Indian Journal of Applied Research, Vol. 06, No.5, pp. 705-707, 2016.
[3] James Isiwu Aguwa, “Study of Compressive Strength of Laterite-Cement Mixes as a Building Material,” AU J.T., vol. 13, No.2, pp. 114-120, 2013.
[4] IS 383: Specification for coarse and fine aggregates from natural sources for concrete,1970.
[5] IS 10262: Concrete mix proportioning – guidelines, 2009.
Laterite Soil as A Binder in Concrete
NMAMIT ANNUAL RESEARCH JOURNAL Vol 6. 2016 16
Smart Surveillance System Using Wireless Sensor Networks: A Survey
Asthik Shet#1, Akarsh V Kumar#2, Deeksha S#3, Deeksha S Kotian#4, K. S. Shivaprakasha#5
#Department of Electronics and communication Engineering, NMAMIT, Nitte, Karkala, Udupi, Karnataka - 574110, Affiliated to VTU, Belgaum.
[email protected] Abstract—Wireless Sensor Networks (WSN) have become an emerging field in the modern communication system because of its ease of implementation. These networks comprise of hundreds of densely deployed sensor nodes which works through collaboration. In this paper we concentrate on the military applications of WSNs. Here we try to look into the different modules of a sensor node. We aim to present a qualitative analysis of the various systems proposed for military applications using WSN. Keywords—Nuclear, Biological, Chemical attack, CMOS Processor, transceiver, sensor unit.
I. INTRODUCTION
Innovations in the field of sensor technology has evolved WSN as a promising solution to the modern communication problems. WSN poses many challenges. Resource constraint is one such problem. WSN finds applications in various fields including agriculture, military, biomedical, home automation, environmental and industrial applications. In this paper, we will be dealing with the military applications and surveillance system. WSNs are used in battlefields for surveillance applications. They are deployed to monitor the critical areas where human interventions risk lives. Various sensors deployed in the field of interest collect the information about the enemy attack and the same can be conveyed to the central entity or the Base Station (BS). The sensor network thus deployed can be used to detect Nuclear, Biological and Chemical (NBC) attacks. Thus threats can be detected and an alert message can be sent to the military base. Another application of WSN in the field of battlefield is to track the military vehicles. The position and relative speed of the vehicle can be estimated using the sensors deployed. WSNs operate on batteries. The concern here is that the battery technology should be improved enough to support the sensors. It must be long lasting and sustain harsh conditions. Coming to other modules such as sensors, transceivers and processors, it should match the military standards. Stability and durability will be the key factors which will decide
the working of the system. Security too plays an important role. Confidential data should be exchanged without any third person intervention. Looking into all these aspects a sensor network is to be designed. The paper is divided into following subparts: Section II gives an insight into different processors used in WSNs. Section III highlights various sensors used for the designs. Section IV gives an exhaustive list of transceivers used for communication. Section V details the energy sources used in WSN applications. Finally Section VI gives the concluding remarks.
II. PROCESSOR Processing Unit is the heart of a sensor node. Every processor unit is associated with sensors, processor and a memory element. Processors manage the protocols to carry out the tasks of processing the sensing information that can be sent to the central entity in collaboration with the neighbouring nodes. The information sensed by the sensors will be in analog domain that have to be converted into a digital signal using ADC before feeding to the processor unit. The raw data thus received will be processed and the partially processed data will be then conveyed to the next hop. The processors embedded in the nodes of WSNs are generally less sophisticated and thus are unable to process complex cryptographic algorithms [1, 2]. Following are the processing units used in WSNs. A. FPGA Field Programmable Gate Arrays are Programmable Logic Devices. They have the advantage of being reprogrammable and reconfigured. They offer very low NRE (nonrecurring engineering) cost. But they consume more power and also not very compatible to the programming methodologies [1].
Ex: Cool Runner II
B. CMOS Processors
Smart Surveillance System Using Wireless Sensor Networks: A Survey
NMAMIT ANNUAL RESEARCH JOURNAL Vol 6. 2016 17
Limitations of cost and size in WSN lead us to the choice of CMOS technology for the processing. For every time the switch is on, CMOS transistor pair draws the power. Switching frequency, device capacitance and voltage swing are all proportional to switching power. This causes increase in the power consumption. One of the effective ways of lowering the power consumption is to reduce the supply voltage. For data encoding and decoding we require an additional external circuitry [3].
C. Microcontrollers Microcontroller is a computer that contains a processor, non-volatile memory, ADCs, UARTs, counters and timers. They are small in size compared to regular computers. There are many types of microcontrollers ranging from 4 to 32 bit. Given below is the classification of microcontrollers that can be used in Sensor Network design [4]. Atmel: This is one of the most important and popular microcontrollers used in WSNs. They support simpler OS. Mica Mote (Crossbow) is an example of WSN device with Atmel microcontrollers. Cypress: The internal pins and components of this controller can be reconfigured. Free software packages are also provided for the developers which are useful when we are dealing with USB. Microchip:They manufactures PIC microcontrollers that are relatively less expensive. These are mainly used in industrial development due to their low cost. They have serial programming capability. We can set the priority levels to the interrupts. Ex: Hoarder Board, Pico Crickets Panasonic: They too offer a variety of microcontrollers suitable for WSN applications. Examples: Panasonic WM64PNT TI:It is one of the low power consuming processors available in the market. It is ideal for wireless applications and embedded systems. The MSP430 is a 16-bit RISC processor. It offers 27 core instructions and 7 addressing modes. There are six different power modes available. Wakeup time is 6 s with the use of a digital oscillator. NXP: They are designed advanced microcontrollers. Their processors are of power architecture and ARM architecture.
III. SENSOR UNIT
WSNs use sensors to sense some physical entities from the environment. Sensors are hardware
components that for a change in a physical condition produces a measurable change. They have certain specific characteristics such as accuracy, sensitivity etc. for measuring physical data of the parameters to be monitored. An analog-to-digital converter is used to digitalize the continuous analog signal produced by the sensor before sending it to the controller for further processing. Sensor nodes are generally small in size, consume less power, densely deployed, adaptive and can operate unattended. Sensors are classified into three categories:
In passive sensing, the data is sensed without active probing. Here the energy is needed just to amplify the signal. On the contrary, in active sensing there is active probing of the environment. Thus they require power continuously from a source. Narrow-beam sensors have a notion of the direction of measurement whereas omni-directional sensors have no notion of direction involved in their measurements. Passive omni directional antennas are used in most of the WSN applications. For every sensor node there will be a certain area of coverage in which they can be reliable. There are many parameters that consume power in sensor nodes. Sampling of signals, conversion of physical signals into an electrical quantity, signal conditioning, conversion from analog domain to digital domain are few such parameters. Generally nodes are densely deployed in WSN with the spatial density may be as high as 20 nodes/ cubic meter. Most of the sensors are passive devices, that is, they require external circuitry for biasing and amplifying the output signals. Based on the physical property measured, the sensors can be classified into
� Thermal � Mechanical � Magnetic � Electrical � Chemical and Bio-chemical � Radiant
A. Mechanical Sensors They detect mechanical properties and actions. These properties involves pressure, velocity, vibration and acceleration.
Smart Surveillance System Using Wireless Sensor Networks: A Survey
NMAMIT ANNUAL RESEARCH JOURNAL Vol 6. 2016 18
Pressure sensors:It is a type of the sensor where a corresponding electrical signal is generated depending upon the amount of pressure applied. There are many types of pressure sensors. However they are widely categorised as Piezoresistive pressure sensors [5], Capacitive pressure sensors and Optical pressure sensors.
Position and Motion Sensors: Position sensors are required in a large variety of WSN applications. They detect the position or movement of fixed or mobile object. There are many ways in estimating the position of an object. They can be either contact or contact free sensors. Position measurement can either be relative or absolute, linear or angular. Accelerometers:These are a type of sensors that measures the acceleration of they are subjected to. There are many ways to accomplish the same. However the major set of accelerometers are based on resistive, capacitive and piezoelectric methods [6].
B. Temperature sensors These are a set of sensors whose physical parameters like resistance or the output voltage is varied in accordance with the change in the temperature. They are classified as electronic, electro-mechanical and themo- resistive [7]. C. Humidity sensors Humidity is defined as the water content in the air. The measurement of humidity of the air can be done in three ways namely: absolute humidity, relative or dew point. Generally the humidity sensors are base on capacitive, resistive, and thermal conductivity measurement techniques [8]. D. Chemical sensors Chemical sensors are used to determine the presence of the chemical elements or compounds in the area of interest. They generally contain a chemically sensitive film and a transducer. When a particular element comes in contact with the sensitive film, a chemical reaction occurs in or on the chemically sensitive film. This results in the generation of a corresponding signal from the transducer. They are generally used in medical, industry and military applications [9].
IV. TRANSRECEIVERS
A WSN node is designed to perform functions like sensing the physical entities, processing the raw information to extract data of interest and to store the extracted information before transmission [10, 11]. The data is communicated through the network and is then passed to the main station. Wireless communication is always handy as it reduces the wires in a system. A transceiver is a device that helps in Wireless communication, between the sensor node and the BS. In this section we introduce different wireless devices used for communication between node and the BS. A. Zigbee Zigbee was conceived in the year 1998 and standardized in 2003. It is an IEEE 802.15.4 international standard based wireless technology designed to address the needs of device to device communication. It is cheap compared to Wi-Fi and Bluetooth. It has two interfaces, one is connected to the coordinator and the other to the host computer. Military security, environment monitoring and home automation are few places where this is used. B. Bluetooth Bluetooth is a short range communication technology that is less expensive and consumes small power. The use of Bluetooth helps to utilize many features of Bluetooth enabled devices for short range data transfer from fixed or mobile devices. Bluetooth can be deployed in WSNs. Bluetooth standard includes both link layer and application layer definitions for product developers [12, 13]. C. UWB (Ultra-Wide Band) UWB is a short range wireless technology that is used to transmit large amount of data in digital domain over a wide frequency spectrum. It consumes less power. This is the earliest form of radio communication. It has been recognized as a feasible technology for WSN due to its very good time-domain resolution that allows precise location [14]. It adopts an extremely narrow pulse and extremely wide frequency spectrum. D. Wi-Fi It is a technology developed by Wi-Fi Alliance that allows devices to be connected to a wireless LAN. It is an IEEE 802.11 standard. The concern here is about the security. Wi-Fi can easily be hacked and misused. It can be protected using WPA2 encryption and other techniques. Access point of the user can be hidden by disabling SSID (Service Set Identifier) broadcast [12].
Smart Surveillance System Using Wireless Sensor Networks: A Survey
NMAMIT ANNUAL RESEARCH JOURNAL Vol 6. 2016 19
Table I gtransmissio
COMPAC
Energy or Batteries con the locahuman intlong are usupply enono problemthen. Motsupplied wgood batteless. It showeather co A. Primary The predomnodes is ththe batterieenergy to tthat guide listed below A good bafeatures to 1) High en2) Small ce3) Active t4) Recharg5) Life Cyc
gives a comon technologie
TAARATIVE STUDYCOMMUNICATI
V. POW
power unit iscontinuous powation of the motervention is used. They shoough power to m of replacing tes close to c
with continuousery are that it ould be leak pronditions.
y Energy Sourc
minant means hrough the eleces. The batterythe sensor nodus on which
w [15].
attery should psustain:-
nergy density ell potential to packaging vogeable cle of the Batte
mparative studys used in WSN
ABLE I Y OF DIFFERENTON TECHNOLOG
WER UNIT
s a crucial pawer supply can ote. In isolateddifficult, batteould be of opt
the sensors, sthe batteries e
camps and stas power supplyshould last lo
roof and sustai
ce
of providing pctrochemical eny should sufficde when in use
battery can b
posses the foll
olume ratio sho
ery
y of variousNs.
T WIRELESS GIES
art of a WSN.be used based
d places whereeries that lasttimal size andso that there isevery now andations can be
y. Criteria for aong and weighin under harsh
ower to sensornergy stored inciently providee. The featuresbe selected are
lowing quality
ould be high
s
. d e t d s d e a h h
r n e s e
y
A battercharacterparamete
B. Energ These epower sufraction oSensing, requires harvestinshould papplicatiharvesterlead to lo Commonharvestin
C. Batter Batteriesnamely m
ry has few pristics. Few ers for a purpos
TPARAMETER
gy from Other s
nergy sourcesupply but all of the energy c
aggregating high energy
ng circuit muprovide the ouon requiremenr shall be miniower the batter
n energy amng are as shown
T DIFFERENT
ries
s in [17] are cmicro and macr
parameters thaof the mai
se are as shown
TABLE II
RS OF A BATTER
sources
s play an imof these const
consumed by thand storing efficiency. T
ust be active utput in accor
nt. The power cimal. Usage ofry impedance.
mbient sourcen in Table III.
TABLE III T ENERGY SOUR
classified intoro scaled.
at describes iinly consideren in Table II.
RY [16]
mportant role titute only for he sensor nodethe informatio
Thus the energat all times. rdance with thconsumed by thf capacitors ma
es for energ
RCES
o two categori
its ed
in r a es. on gy It
he he ay
gy
ies
Smart Surveillance System Using Wireless Sensor Networks: A Survey
NMAMIT ANNUAL RESEARCH JOURNAL Vol 6. 2016 20
Macro scalIt is furthPrimary- Tbut their lifa constantZinc-air ba Secondarycharge theSolar energharvest enbatteries. Micro scalAchieving as that of eis an issuecan be bourating of thsurface arreducing electrodes battery. Asthe surfacecurrent ouavailable combinatio A comparifeatures are
DIFFEREN
D. Energy The best psampling f The majorenergy con1. Duty csensor nodsense. Soosaving ene
led her classified aThese batteriesfetime is very t, relatively hiatteries
- They are Rese another pgy is one suchnergy and sto
ed the battery co
electronic circ where a lot o
ught indeed to he batteries. P
rea limitationsthe battery saffects the ma
s the micro-bate area of the eleutput would be
in the maron of specificat
ison of few wie presented in
TANT BATTERIES A
Efficient senso
possible way isfrequency [18].
r approaches unsumption in a ycling – It is
des are active oon after sensinergy. Here th
as Primary ans have high eshort. Used in igh power is
Rechargeable primary sourceh kind which core it in the
ompactness is nuits. The battef developmentoptimize the s
Power output bs is the majosize. Surface aximum currentteries are smalectrodes. Thuse small. Manyrket which tions.
batteries. Toe is required.can be used toese secondary
not as efficientery technologyts and changessize and powerbecause of theor obstacle in
area of thent output of thell in size, so as the maximum
y batteries areoffer varied
teries and their
RAMETERS [16]
t
a with a given
eving minimalre as follows: in which the
has the data tod off and thusate should be
. y e :
o . o y
t y s r e n e e s
m e d
r
n
l
e o s e
accurate.under sam2. Adaptactivity the real tbe takensensors. Duty cycomplemhas to psensor nothe samethrough a E. Power Generallyactive mconveys the node Obviouslidle stateswitched While dclassifiedsystem approach a) Clockwhich reincreasedthe inactcontrol c b) Poweris shut das to cconsumpcomplex c) Voltagthey canvoltage crequirem d) Dynacombinatislands te e) Dynindividuacontrolle
From thetechnolo
. Oversamplingmpling leads totive sensing sof the node istime situations
n in designing
cling and adamentary to one provide a set odes as per thee primitives aadaptive sensin
r Management
y sensor nodemode where the
the informatios would be ina
ly, active mode, the unused
d off to avoid an
designing, the d at three tiers
and applicahes used to sav
k gating: It is oeduces dynamid. In this methtive portions
circuitry has to
r gating: In thiown to the inaonserve both
ptions. Howevemechanism.
ge islands: If tn be run at lowcan be shut do
ments.
amic voltage tion of both echniques.
namic threshoal sets of ed.
VI. CO
e above surveygies and produ
g leads to wasto loss of data. strategy – In ts adjusted in as. However pro
the software
aptive sensing another. The of primitives
e duty cycle reqare used to ang strategy.
t
es operate in e sensor senseson and the idleactive.
de consumes mparts of the
ny power loss.
energy probles namely hard
ation. The te power are:
one of the popic power. Herehod the clock of the node. be devised for
is technique, thactive portions
static and der this techniqu
there are somewer frequency own till they m
frequency scpower gatin
old voltage transistors ar
ONCLUSIONS
y, it is clear tucts are availab
te of energy an
this method thaccordance wioper care shoumodules of th
approaches asystem softwato activate th
quirement. Latacquire the da
two modes vis, processes ane mode in whic
more power. sensors can b
.
ems are maindware, operatintechniques an
pular technique static power is turned off An appropria
r the same.
he power suppof the sensor
dynamic powue requires mo
e slower block and the suppmeet the timin
caling: It is ng and voltag
control: Here dynamical
S
that a variety ble for designin
nd
he ith uld he
are are he ter ata
iz: nd ch
In be
nly ng nd
ues is to
ate
ply so
wer ore
ks, ply ng
a ge
ere lly
of ng
Smart Surveillance System Using Wireless Sensor Networks: A Survey
NMAMIT ANNUAL RESEARCH JOURNAL Vol 6. 2016 21
sensor networks. Finally, the aim is to design an optimal one. Sensor networks have evolved highly in past few years and has the capability to grow in serving different fields. WSNs have many applications but we have concentrated over military applications. Precision and stability in the WSNs are key factors that determine the outcome of these networks. WSNs in the field of military applications need many more research activities to strengthen and build better networks since we are dealing with a sensitive and critical issue of security and safety.
REFERENCES
[1] Khemapech, Ittipong, Ishbel Duncan and Alan Miller. A survey of wireless sensor networks technology. 6th Annual Postgraduate Symposium on the Convergence of Telecommunications, Networking and Broadcasting. Vol. 13. 2005.
[2] M. A. M Vieira., C. N. Coelho, D. C. Da Silva, , & J. M.Da Mata, Survey on wireless sensor network devices. In Emerging Technologies and Factory Automation, 2003. Proceedings. ETFA'03. IEEE Conference, Vol. 1, pp. 537-544, 2003.
[3] I. F. Akyildiz., Su, W., Y. Sankarasubramaniam, , E. Cayirci, Wireless sensor networks: a survey. Computer networks, Vol. 38, No.4, pp 393-422, 2002.
=Microcontrollers [Retrieved on 7th November 2016]. [5] M.Z. Shaikh, Dr. S.F. Kodad, Dr. B.C. Jinaga. A
Comparative Performance Analysis of Capacitive and Piezoresistive MEMS for Pressure Measurement. In International Journal of Computer Science and Applications Vol.1, No.3, December 2008.
[6] Sensing Technologies used for Accelerometers. http://www.pcb.com/TestMeasurement/Accelerometers/Sensing_Technologies,[Retrieved on 16th November 2016].
[7] Common Temperature Measurement Sensors http://www.mstarlabs.com/sensors/temperature-sensors.html,[Retrieved on 16th November 2016].
[8] HumiditySensors http://www.engineersgarage.com/articles/humidity-sensor, [Retrieved on 16th November 2016].
[9] Zainab Yunusa, Mohd. Nizar Hamidon, Ahsanul Kaiser, Zaiki Awang. Gas Sensors: A Review. In Sensors & Transducers, Vol. 168, Issue 4, 2014.
[10] H. Karl and A. Willig, Protocols and Architectures for Wireless Sensor Networks, John Wiley & Sons, New York, 2005.
[11] A. Chandrakasan, R. Min, M. Bharadwaj, S-H. Cho and A. Wang, Power Aware Wireless Microsensor Systems, European Solid-state Device Research Conference, Florence, pp 24-26, 2002
[12] E. Ferro and F. Potorti, Bluetooth and Wi-fi wireless protocols: A survey and a comparison , IEEE commun., Vol. 12, No.1, pp. 12-16, 2005.
[13] A. Rodzevski, , J. Forsberg, I. Kruzela, Wireless sensor network with Bluetooth. In Smart Objects Conference (SOC’2003), Grenoble, France, 2003.
[14] Weiwei, Wu, Wang Weidong, and Wei Guo. Wireless Sensor Network. ZTE Communications, 2005.
[15] F. Pistoia, Battery Operated Devices and Systems: From Portable Electronics to Industrial Products, Elsevier, Amsterdam, 2008.
[16] K. Stojcev Mile, and R. Mirko Kosanovi. Power management and energy harvesting techniques for wireless sensor nodes. Telecommunication in Modern Satellite, Cable, and Broadcasting Services, 2009. TELSIKS'09. 9Th International Conference on. IEEE, 2009.
[17] Roundy, Shad, Power sources for wireless sensor networks. European workshop on wireless sensor networks. Springer Berlin Heidelberg, 2004.
[18] Alippi, Cesare, Energy management in wireless sensor networks with energy-hungry sensors. IEEE Instrumentation & Measurement Magazine, Vol.12, No. 2, pp 16-23, 2009.
Smart Surveillance System Using Wireless Sensor Networks: A Survey
NMAMIT ANNUAL RESEARCH JOURNAL Vol 6. 2016 22
Influence of injector nozzle hole number and size on the performance of a supercharged direct injection
diesel engine
Ravinarayana Bhat N. Associate Professor, Department of Mechanical Engineering,
Srinivas Institute of Technology, Valachil, Mangaluru, Karnataka - 574143, Affiliated to VTU – Belgaum. [email protected]
Abstract—Diesel engine as a prime mover has witnessed tremendous growth in its application during the last century. Researchers across the globe have put lot of effort to increase the performance and improve the emission characteristics of it. It is well known that increasing the boost pressure of intake air or supercharging increases the power output of the internal combustion engines. In this paper, the performance of a direct injection diesel engine is discussed with different fuel injector nozzles having different number of holes of different nozzle orifice diameters under natural aspiration and supercharged conditions. It has been observed that the performance of the engine decreased with increased number of holes and larger nozzle holes under natural aspiration. However the performance of the engine has been found to be significantly improved under supercharged condition for all the injector nozzles. For 3 hole injectors at 80% load, the BTE has increased from 29.98% to 31.86% on supercharging, whereas for 4 hole and 5 hole injectors it increased from 11.48% to 19.24% and 20.49% to 27.16% respectively at the same load. Keywords—Diesel engine, fuel injector, nozzle hole, supercharging, performance
I. INTRODUCTION The rapid growth of automotive vehicle population and pressing need for increased mechanization of agricultural equipment due to the requirement of cost competitiveness along with ever-increasing shortage of labour force have resulted in exponential growth in the usage of Internal Combustion(IC) engines. The function of IC engine is to transform the chemical energy released by the combustion of fuel inside the engine cylinder into mechanical work. The German engineer Rudolf Diesel invented the diesel engine in which the combustion of the fuel is initiated by injecting the fuel into compressed air. These days diesel engines are the major source of energy in transport, stationary power plants and agricultural equipment [1, 2]. Diesel engines have proved to be superior to gasoline engines in terms of thermal efficiency, fuel consumption and throttling losses[3], that made the market share of diesel engines to exceeded 50% in some countries [2]. Furthermore, in terms of emissions also diesel engines are not inferior to the gasoline engines as far as
carbon monoxide (CO) is concerned [3]. Today's engines require high power output, economy of operation with least pollutant emissions. Such specific demands have compelled the researchers to focus on improving the diesel engines in various aspects. Intake air pressure boosting or supercharging is a common way to improve the engine output power which is widely used in high performance Spark Ignition and Compression Ignition (CI) engine applications [4]. It is well known that supercharging improves the combustion process of Diesel engines [5]. Though the increase in intake air temperature due to supercharging reduces the unit air charge and also reduces the thermal efficiency moderately, the increase in the density due to the supercharging pressure compensates for the loss, and intercooling is not necessary except for highly supercharged engines[6]. Supercharging the reciprocating piston internal combustion engine is as old as the engine itself. Early on, it was used to improve the high-altitude performance of aircraft engines and later to increase the short term peak performance in sporty or very expensive automobiles. Later on it reached economic importance in the form of the efficiency improving exhaust gas turbocharging of slow and medium speed diesel engines. Today many demands are placed on automobile engines: on the one hand, consumers insist on extreme efficiency, and on the other hand laws establish strict standards for, e.g., noise and exhaust gas emissions. It would be extremely difficult for an internal combustion engine to meet these demands without the advantages afforded by supercharging [7].
The fuel injection system in a diesel engine, being
responsible for supplying the metered quantity of fuel to the combustion chamber, is one of the most important systems. It meters the fuel delivery according to engine requirements, it generates the high injection pressure required for fuel atomization, for air-fuel mixing and for combustion and it contributes to the fuel distribution in the combustion system, hence it significantly affects engine performance emissions and noise [8]. The performance and emissions of diesel engine are greatly affected by the fuel atomization and spray processes, which in turn are strongly influenced by injector nozzle geometry [9, 10]. The number of holes in the fuel injector nozzle directly influences the spray parameters like
Influence of injector nozzle hole number and size on the performance of a supercharged direct injection diesel engine
NMAMIT ANNUAL RESEARCH JOURNAL Vol 6. 2016 23
droplet size and penetration length and thus the combustion process [11]. The penetration length increases with increase the in line fuel pressure and it decreases with decrease in nozzle hole diameter [12]. Smaller injector nozzle orifices are believed to give smaller droplet size, even with reduced injection pressure, which leads to better fuel atomization, faster evaporation and better mixing [13]. Diesel nozzle geometry is considered a major issue in order to fulfil new stringent emissions regulations while maintaining or improving the efficiency of the engine [10].
Wang et al. [14] studied the influence of injector nozzle hole size on flame structure and soot formation of a diesel engine. They have carried out experiments in a high pressure, high temperature constant volume combustion vessel. High injection pressures of 100 MPa, 200 MPa and 300 MPa, and two injector nozzles with diameters of 0.16 mm and 0.08 mm were used. They have reported that with the conventional injector nozzle (0.16 mm), ultra-high injection pressure generated appreciably lower soot formation. With the micro-hole nozzle (0.08 mm), impinging spray flame showed much smaller size and lower soot formation at the injection pressure of 100 MPa. The soot formation was too weak to be detected with the micro-hole nozzle at injection pressures of 200 MPa and 300 MPa. Moon S. et al. [15] used the propagation based X-ray phase contrast imaging technique to visualize and compare the transient needle motion and near nozzle flow characteristics of the single and multi hole(3-hole and 6-hole) diesel injectors in various injection stages during the entire injection event. Yao et al.[10] used five kinds of single-hole cylindrical injectors which have different orifice diameters (0.13–0.23 mm) and lengths (0.7–1.0 mm) to investigate the effects of the nozzle geometry on spray droplet size distribution and corresponding combustion characteristics. The spray droplet size spatial distribution was measured with the Phase Doppler Particle Analyzer. They have reported that the Sauter Mean Diameter (SMD) reduces with the increase of the distance from injector tip and the SMD of the central axis was bigger than that of the periphery. With the increase of the injection pressure (40–120 MPa), the spray SMD decreased significantly. Results showed that different orifice diameters and lengths greatly affect the spray atomization, and then change the combustion and emissions characteristics. Montgomery et al. [16] investigated the effects of number and size of injector nozzle hole on the emissions of a direct injection diesel engine. They used four different injector nozzle hole size and number combinations and reported that the best emissions and second best brake specific fuel consumption were obtained with the nozzle with the maximum number of holes. Sayin et al. [11] have investigated the effects of fuel injector nozzle hole number and size on the performance and exhaust emissions of a diesel engine with biodiesel diesel blends as fuel. They have concluded that the best engine performance and exhaust emissions were obtained with highest injector nozzle hole number for the biodiesel fuel. Varghese et al. [17] have conducted experimental study to find out the effect of fuel injector nozzle hole diameter on
diesel engine performance using Karanja oil- diesel blends. They have used injectors having three holes of different diameters and observed that the exhaust gas temperature and brake specific fuel consumption have increased with increase in nozzle hole size. Basavarajappa et al. [18] conducted experimental investigation on diesel engine operated on Uppage oil methyl ester with different combustion chamber shapes and fuel injectors with different number of holes as well as with varying orifice sizes. They used injectors with number of holes varied from 3 to 6 and the size of nozzle orifice varied from 0.18 to 0.3 mm and reported that the increased number of injector holes with reduced hole size resulted in overall improved performance with reduced emission levels.
With this background in the present work an attempt is made to find the effect of fuel injector nozzle hole size and number of holes in the injector nozzle on the performance of a single cylinder, four-stroke, stationary, direct injection diesel engine at different load conditions, under natural aspiration as well as supercharged conditions. Three fuel injectors with different number of holes and different nozzle hole sizes are considered for the experimental study.
II. EXPERIMENTAL SETUP AND PROCEDURE The experiments are conducted on TV-1 model diesel engine manufactured by Kirloskar Oil Engine Ltd., India. It is a commercial four-stroke, constant speed, single cylinder, water-cooled, direct-injection diesel engine. It has a rated power of 5.2 kW at the rated speed of 1500 rpm and a compression ratio of 17.5. Its normal operating conditions are, fuel injection at 230 crank angle before Top Dead Centre (bTDC) and 190 bar fuel injection pressure. The engine has the cylinder bore diameter of 87.5 mm, stroke length of 110 mm, swept volume of 661.45 cm3 and clearance volume of 41.09 cm3. The engine is loaded by means of an eddy current dynamometer. A continuous circulation of cooling water is maintained through the engine jacket and dynamometer by means of a water pump. The cylinder gas pressure and fuel line pressure are measured using piezo sensors (Make: PCB Piezotronics, Model HSM111A22). The exhaust gas temperature is measured with the help of K-type Chromel-Alumel thermocouple with a range and resolution of 0-10000C and 0.010C respectively. The air flow is measured using an orifice meter, connected to water manometer and the fuel flow is measured using a manometer and DP transmitter. A data acquisition system is connected to the engine for recording and processing of experimental data. The data sampling and recording are done using ICEngineSoft software. For the experiments under supercharged condition, two centrifugal air compressors (C1 and C2) are used, specifications of which are shown in Table 1. The output from the two compressors is fed to an air tank of 35 litre capacity, which is equipped with a pressure regulator to control the supercharging pressure. The general scheme of engine test bench and the experimental apparatus used is shown in Fig.1.
Influence of injector nozzle hole number and size on the performance of a supercharged direct injection diesel engine
NMAMIT ANNUAL RESEARCH JOURNAL Vol 6. 2016 24
Fig. 1 Schematic diagram of experimental set up
The properties of diesel fuel are determined. The density was measured using Hydrometer as 827 kg/m3, kinematic viscosity at 400C using viscometer (Cannon-Fenske) as 2.74 cst, caloric value using Bomb calorimeter (Make: Aditya) as 42,000 kJ/kg and flash point using Cleveland open cup tester (Make: Aditya) as 710C. The experiments were conducted with the normal conditions of 190 bar fuel injection pressure with fuel injection at 230 bTDC. All these experiments were conducted at the natural aspiration as well as supercharging conditions at 20%, 40%, 60%, 80% and 100% (full) load on the engine. An air inlet pressure of 100 kPa (gauge pressure) was maintained for supercharging condition. The parameters such as fuel consumption, air flow rate, cylinder gas pressure and temperature, exhaust gas temperature were recorded at different load conditions. Three different fuel injectors with 3, 4 and 5 holes of orifice diameters of 0.25 mm, 0.31 mm and 0.26 mm respectively have been chosen for the experiments. The total area of injector nozzle holes (orifice) with the 3, 4 and 5 hole fuel injectors are 0.1473 mm2, 0.3019 mm2 and 0.2655 mm2 respectively.
TABLE I
SPECIFICATIONS OF THE COMPRESSORS USED
Specification Compressor C1
Compressor C2
Make ELGI CEC Power (HP) 2 3 Displacement Volume (lpm) 249 310 No. of cylinders 1 2 Speed (rpm) 2880 950 Tank Capacity (Litre) 100 200 Max. Working Pressure (kgf/cm2)
10 12
III. RESULTS AND DISCUSSION
A. Brake thermal efficiency (BTE) BTE is a measure of efficiency with which the energy in the fuel is converted into mechanical work output. The variation of BTE with load on the engine for different fuel injectors is presented in Fig. 2 for both the natural aspiration and supercharged conditions. Here 3HN, 4HN and 5HN represent 3, 4 and 5 hole injectors respectively, at natural aspiration, whereas 3HS, 4HS and 5HS represent 3, 4 and 5 hole injectors respectively, at supercharged condition. It is evident from the figure that higher BTE was obtained for 3 hole injector for all the loads, followed by 5 hole injector and 4 hole injector, in the increasing order of their total nozzle orifice areas. This reduced BTE is attributed to the larger quantity of fuel injected with 4 hole and 5 hole injectors due to their relatively larger total nozzle orifice areas, resulting in insufficient oxygen and thus incomplete combustion. It is observed that, with 4 hole and 5 hole injectors under natural aspiration, the BTE has gradually increased up to 40% and 60% load respectively and then decreased, while with 3 hole injectors under natural aspiration, highest BTE (29.98%) was obtained at 80% load and it has slightly decreased (28.3%) at full load. This decrease in the BTE at higher loads is a clear indication of lack of oxygen with increased quantity of fuel injection. As seen in the figure BTE has increased on supercharging for all the injectors and also, it has increased with load, and the maximum BTE was obtained at 100% load for 3 hole and 5 hole injectors. This is due to the higher availability of oxygen due to supercharging and better utilization of the available oxygen at higher loads. It can be noted that for 3 hole injectors at 80% load, the BTE has increased from 29.98% to 31.86% on supercharging, whereas for 4 hole and 5 hole injectors it has increased from 11.48% to 19.24% and 20.49% to 27.16% respectively at the same load. Also, it was noted during experimentation that the engine could not run at full load with 4 hole injector under natural aspiration due to the oxygen availability falling below the flammability limit for the fuel. However, on supercharging the engine could run event at full load due to increased availability of oxygen.
B. Specific fuel consumption (BSFC) BSFC indicates the mass of fuel consumed per unit of brake power developed. The variation of BSFC with load for different fuel injectors is shown in Fig. 3. The general trend of declining BSFC with load is observed in most cases, especially at lower loads. As seen in the figure, the least BSFC is recorded for 3 hole injector at full load under supercharged condition and the maximum for 4 hole injector under natural aspiration. The mean droplet size of the fuel increases with increase in nozzle hole diameter [5]. For the 4 hole injector, the nozzle hole diameter being the largest, the droplet size is expected to be largest, resulting in slower evaporation and mixing with air and thus incomplete combustion. This may be the reason for the higher BSFC for 4 hole injector at all loads,
Influence of injector nozzle hole number and size on the performance of a supercharged direct injection diesel engine
NMAMIT ANNUAL RESEARCH JOURNAL Vol 6. 2016 25
both under natural aspiration as well as supercharged conditions.
Fig. 2 Variation of BTE with load for different fuel injectors
Fig. 3 Variation of BSFC with load for different fuel injectors
Fig. 4 Variation of EGT with load for different fuel injectors
C. Exhaust gas temperature (EGT) The EGT at different loads on the engine for different
injectors under natural aspiration as well as supercharged conditions are shown in Fig. 4. It is observed that EGT increases with load for all the nozzles. This is attributed to larger quantity of fuel burnt at higher loads. As seen in the figure, EGT is the minimum for 3 hole injector under supercharged condition at all the loads. This is attributed to
smaller injector nozzle orifice of three hole injector, resulting in smaller droplet size and faster evaporation assisted by the denser air due to supercharging leading to combustion taking place at early part of expansion stroke. Also the EGT is highest for 4 and 5 hole injectors under natural aspiration, which may be due to larger droplet size because of larger nozzle hole size and lesser oxygen availability for the larger quantity of fuel injected, resulting in delayed combustion.
IV. CONCLUSIONS The present study was focused on the performance evaluation of a direct injection diesel engine with different fuel injectors having different number of nozzle holes and nozzle hole sizes at natural aspiration as well as with supercharging at 100 kPa gauge pressure. Based on the analysis of experimental results, the following conclusions are drawn:
� Increasing the number of injector holes and nozzle sizes at natural aspiration condition decreases BTE, increases BSFC and EGT.
� Supercharging increases the power output and BTE, decreases BSFC and EGT at all the loads for all the fuel injectors.
� Under natural aspiration, the BTE was maximum at lesser than full load for all injectors, but on supercharging at 100 kPa, the maximum BTE was obtained at 100% load. Therefore further increase in supercharging pressure may result in increased power output and better performance of the engine. In that aspect the 4 hole and 5 hole injectors with larger total injector nozzle hole areas can be used effectively to obtain large increase in the power output by further increasing the supercharging pressure. However, the limit of supercharging pressure for an existing engine may be imposed by the maximum permissible pressure, temperature and thermal stresses in the engine cylinder.
REFERENCES [1] A, Murugesan, C. Umarani, R. Subramanian, N. Nedunchezhian "Bio-
diesel as an alternative fuel for diesel engines — a review," Renewable and Sustainable Energy Reviews, vol. 13, pp. 653-662, 2009.
[2] Helmut Eichlseder, Andreas Wimmer. "Potential of IC-engines as minimum emission propulsion system," Atmospheric Environment, vol. 37, 2003, pp. 5227-5236, 2003.
[3] T.M.Yunuskhan, Irfan Anjum Badruddin, Ahmad Badarudin, N.R.Banapurmath, N.J. Salman Ahmed, G.A.Quadir, Abdullah. A. Rashed, H.M.T.Khaleed , Sarfaraz Kamangar. "Effects of engine variables and heat transfer on the performance of biodiesel fuelled IC engines," Renewable and Sustainable Energy Reviews, vol.44, pp. 682–691, 2015.
[4] Mustafa Canakci. "An experimental study for the effects of boost pressure on the performance and exhaust emissions of a DI-HCCI gasoline engine," Fuel, vol.87, pp.1503–1514, 2008.
[6] G. Amba Prasad Rao, P. Rama Mohan. "Effect of supercharging on the performance of a DI Diesel engine with cotton seed oil," Energy Conversion and Management, vol. 44, pp. 937–944, 2003.
[7] Hermann Hiereth, Peter Prenninger. Charging the Internal Combustion Engine. Springer Wien NewYork, 2003.
Influence of injector nozzle hole number and size on the performance of a supercharged direct injection diesel engine
NMAMIT ANNUAL RESEARCH JOURNAL Vol 6. 2016 26
[8] H. M. Patel, V. H. Chaudhari, S.A.Shah. "Design and Optimization of Fuel Injection System in Diesel Engine Using Biodiesel – A Review," International Journal of Innovations in Engineering and Technology, vol. 2, pp. 70-77, 2013.
[9] Sibendu Soma, I. Anita, Ramirez, E. Douglas, Longma, Suresh K. Aggarwal. "Effect of nozzle orifice geometry on spray, combustion, and emission characteristics under diesel engine conditions," Fuel , vol. 90, pp. 1267–1276, 2011
[10] Chunde Yao, Peilin Geng, Zenghui Yin, Jiangtao Hu, Dalu Chen, Yusheng Ju. "Impacts of nozzle geometry on spray combustion of high pressure common rail injectors in a constant volume combustion chamber," Fuel, vol. 179 , pp. 235–245, 2016.
[11] Cenk Sayin, Metin Gumus, Mustafa Canakci. "Influence of injector hole number on the performance and emissions of a DI diesel engine fueled with biodiesele diesel fuel blends," Applied Thermal Engineering, vol.61, pp.121-128, 2013.
[12] Subhash Lahane, K.A. Subramanian. "Impact of nozzle holes configuration on fuel spray, wall impingement and NOx emission of a diesel engine for biodiesel diesel blend (B20)," Applied Thermal Engineering , vol.64, pp. 307-314, 2014.
[13] Rohit Sharma, Rana Ranjit Singh, Shailendra Kumar Vishwakarma. "Experimental study of the Effect of Fuel Injector nozzle holes on Direct Injection Diesel Engine," IOSR Journal of Mechanical and Civil Engineering, vol. 7, pp. 67-74, 2013.
[14] X. Wang, Z. Huang, W. Zhang, O.A. Kuti, K. Nishida. "Effects of ultra-high injection pressure and micro-hole nozzle on flame structure and soot formation of impinging diesel spray," Applied Energy, vol. 88, pp. 1620-1628, 2011.
[15] Seoksu Moona, Yuan Gao, Suhan Park, Jin Wang, Naoki Kurimoto, Yoshiaki Nishijima. "Effect of the number and position of nozzle holes on in- and near-nozzle dynamic characteristics of diesel injection," Fuel, vol. 150, pp. 112–122, 2015.
[16] D. Montgomery, M. Chan, C. Chang, P. Farrell, R.D. Reitz. Effect of injector nozzle hole size and number on spray characteristics and the performance of a heavy duty D.I. diesel engine. SAE Paper 962002, 1996, doi:10.4271/962002.
[17] Lijo P Varghese, Rajiv Saxena, R.R. Lal. “Analysis of the effect of nozzle hole diameter on CI engine performance using Karanja oil-diesel blends,” International Journal of Mechanical Engineering and Technology, vol. 4, pp. 79-88, 2013.
[18] D.N. Basavarajappa, N. R. Banapurmath, S.V. Khandal, G. Manavendra. “Effect of Combustion Chamber Shapes & Injection Strategies on the Performance of Uppage Biodiesel Operated Diesel Engines,” Universal Journal of Renewable Energy, vol.2, pp. 67-98, 2014.
Influence of injector nozzle hole number and size on the performance of a supercharged direct injection diesel engine
NMAMIT ANNUAL RESEARCH JOURNAL Vol 6. 2016 27
Piezo-actuator based workpiece feeding system using Maxwell inverse hysteresis model
Prasad Prabhu#1, Muralidhara#2 #Department of Mechanical Engineering,
Abstract— In recent years there are plenty of advancement in the piezo-actuator based micro-positioning and Nano-positioning system used for precise and smooth machining operations. This research paper consists of design, fabrication, and testing of piezo-actuator based workpiece feeding system which can be used for micro-milling. The workpiece feeding system was designed in such way that motion of the workpiece is restricted along 2 translational and 3 rotational degrees of freedom. The workpiece is free to move along only one translational degree of freedom. A Flexurally Amplified Piezo actuator(FAP) was designed and fabricated to give feed motion to the workpiece. But the piezo-actuator exhibits hysteresis between the applied voltage and displacement. Therefore, to reduce the hysteresis a mathematical model was developed using Maxwell slip hysteresis equation. Simulation and experiments were conducted on this workpiece feeding system for two different types of input waveform. Keywords—Piezo-actuator, Flexurally Amplified Piezo-actuator(FAP), Linear guideways, Micro-milling.
I. INTRODUCTION Piezoelectricity is a phenomenon by which some materials
convert electrical energy into mechanical energy, reverse is also true. Piezoelectricity is the electric charge which accumulates in some of the solid materials like in crystals, ceramics, in reply to applied mechanical stress. The word piezoelectricity means electricity exhibits from pressure. Piezo actuators are classified into two groups, stripe and stack actuators. The name express stripe actuator is in the design of thin strips. Stack actuators are compound structures done by stacking individually finished piezoelectric materials. Since the displacement produced by the piezo-actuators are very small, but this displacement can be amplified suitably with help of Amplified piezo-actuators.
Fig. 1 Isometric view of assembled Piezo-actuator based workpiece feeding system.
II. DESIGN OF WORKPIECE FEEDING SYSTEM.
Fig. 2 Exploded view of Piezo actuator based workpiece feeding system
Piezo actuator based workpiece feeding system for micro-milling is as shown in the Fig. 1. Here the base block which is rigid and holds the entire setup. C bracket is fixed inside the base block at centre position. The feeding block consist of linear guideways with rails. When the voltage is applied to FAP, it produces displacement by contraction. Since top end of the FAP is fixed to base block with help of C bracket, only bottom end of the FAP will move upwards. Since the bottom end of FAP is connected to feeding block, the linear guideways which are connected to feeding block will guide the feed motion to be occurred in upward direction. The exploded view of workpiece feeding system is shown in Fig. 2.
III. DESIGN OF FLEXURAL AMPLIFIER The dimension of flexural amplifier is of 35 mm in height
and 145mm in width. By considering the cross section of the piezoelectric stack thickness is kept as 10 mm. The material selected is spring steel. The properties of spring steel are shown in the Table 1.
Piezo-actuator based workpiece feeding system using Maxwell inverse hysteresis model
NMAMIT ANNUAL RESEARCH JOURNAL Vol 6. 2016 28
TABLE I MATERIAL PROPERTIES
Property Value Young’s Modulus (GPa) 210 Density(Kg/m3) 7500 Poisson’s ratio 0.3
Fig.3 Isometric view of Flexurally Amplified Piezoactuator. A Piezoelectric actuator converts an electric signal into a
precisely controlled physical displacement. FAP consist of 6 piezoelectric stack actuators each of dimension 10*10*20 mm. The isometric view of FAP is shown in the Fig. 3.
Fig. 4 Voltage and displacement plot for FAP
.
Fig. 5 Hysteresis curve between applied voltage and output displacement of piezo actuator.
Fig 4 shows the graph of voltage and displacement. A
maximum voltage of 150 V is applied to the piezo actuator. From the graph, it is observed that FAP is producing a displacement of 780 μm. Fig. 5 shows the hysteresis curve obtained between input voltage and output displacement of piezo-actuator. From the graph a hysteresis of 50μm is observed. This effect of hysteresis can be reduced by using Maxwell slip hysteresis equation, discussed in chapter 4.
IV. HYSTERESIS MODELLING USING MAXWELL SLIP HYSTERESIS EQUATION.
Maxwell’s slip model for modelling hysteresis is energy based method and hence it can be adopted for various energy levels. In most of the physical systems the hysteresis is mainly due to energy storage. Mechanically, this kind of behaviour could be modelled by using the combination of an ideal spring element and an ideal coulomb friction element.
A. Electro-mechanical Model The electromechanical model for piezo actuator including
hysteresis behaviour and the effect of flexural amplifier can be represented as shown in Fig 6.
Fig. 6 Electromechanical model of piezo actuator
Hysteresis behaviour between electrical charge and the voltage is presented by block H, which resides in the electrical domain. The piezo stacks in the piezo actuator modelled as spring mass damper systems. Flexural amplifier can be modelled as a spring and force generated by spring element. This spring force considered to oppose the displacement of piezo actuator. The piezoelectric effect is represented by the piezoelectric transducer with transformer ratio T. The generalized Maxwell resistive capacitance, which is represented by the MRC element, resides in the electrical domain and therefore relates the element's electrical voltage to charge. The PZT model has two ports of interaction, a voltage-current port on the electrical side and a force-velocity port on the mechanical side. The following equation can be derived for electromechanical model.
q = Tx +CpVt (1) Vi = VH +Vt (2)
Piezo-actuator based workpiece feeding system using Maxwell inverse hysteresis model
NMAMIT ANNUAL RESEARCH JOURNAL Vol 6. 2016 29
VH=H(q) (3) Ft=TVt (4) m x�� + b x� + k x = Ft - Fa (5) where: ‘q’ is the total charge in the ceramic ‘T’ is the electromechanical transformer ratio ‘x’ is the stack endpoint displacement ‘Cp’ is the linear capacitance in parallel with the
transformer ‘Vt’ is the back-emf from the mechanical side ‘Vi’ is the actuator input voltage ‘VH’ is the voltage across the Maxwell capacitor ‘Ft’ is the transduced force from the electrical domain ‘Fa’ is the force applied from flexural arm of an actuator m, b and k are the mass, damping, and stiffness of
the ceramic. The applied voltage Vi is divided into hysteresis voltage
(VH) and voltage for the electromechanical transduction (Vt). Hysteresis model takes charge q as input and gives hysteresis voltage VH as output. The piezoelectric transducer converts voltage Vt to force Ft. The flexural displacement amplifier of actuator considered as spring of stiffness ka which exerts a force of Fa in opposite direction that of Ft. The difference between force Ft and Fa results in actuator displacement x by considering piezo stack material as a spring mass damper system. The displacement amplification provided by the flexural amplifier, which is represented by Da. Since piezo actuator takes voltage as the input to produce displacement, we need to apply specified voltage corresponding displacement. This is done by Inverse model. Inverse model takes displacement as input and produces a voltage for particular input displacement, which in turn applied to actuator.
Fig. 7 Block diagram of the electro mechanical inverse model.
V. SIMULATION OF WORKPIECE FEEDING SYSTEM. Based on Electro-mechanical model of piezo a ctuator using Maxwell slip hysteresis equation, it is possible to simulate the piezo actuator based workpiece feeding system using MATLAB software. Maxwell hysteresis model is used for
simulation with displacement as the input and voltage as the output. Fig.8 shows the block diagram for simulation of workpiece feeding system. The block diagram contains 10 Maxwell slip Hysteresis equation in parallel, to reduce the hysteresis between the voltage and displacement. Input to the block diagram is displacement and output obtained is the voltage. The simulation of workpiece feeding system can be performed for different types of input displacement waveform, like sine, triangular, step, ramp etc. The output obtained is voltage in the corresponding waveform.
Fig. 8 Block diagram for simulation workpiece feeding system
Fig. 9 Simulation result obtained for workpiece feeding system with sine waveform
Fig. 10 Simulation result obtained for workpiece feeding system with ramp waveform
Fig. 9 shows the simulation result obtained for workpiece feeding system with displacement as input in sine wave form.
Piezo-actuator based workpiece feeding system using Maxwell inverse hysteresis model
NMAMIT ANNUAL RESEARCH JOURNAL Vol 6. 2016 30
From figure, it is understood that to get a displacement of 500μm for workpiece feeding system, it is required to apply a voltage of 120V.
Fig. 10 shows the simulation result obtained for workpiece feeding system with displacement as input in ramp wave form. The slope of the ramp wave form was 20 μm/s. From the figure to get a displacement of 600μm for workpiece feeding system it is required to apply a voltage of 135V.
VI. EXPERIMENTS ON WORKPIECE FEEDING SYSTEM.
Fig. 11 Assembled view of Workpiece feeding system
Fig.11 shows the assembled view of workpiece feeding system, the base part rigidly fixed on an aluminium board. For micro-milling operation workpiece, can be held on the top of workpiece feeding system. Flexurally Amplified Actuator is used for controlling the feed rate of the workpiece against the milling tool.
Fig. 12 Block diagram for experiment on workpiece feeding system
Fig.12 shows the block diagram for experiment on
workpiece feeding system. Desired displacement is given as input to the Maxwell hysteresis model, which gives back voltage signal as output. The experiment requires NI-PCI 6221 Data acquisition system with LabVIEW software. Laser displacement sensor is also required for measuring the
displacement produced by the workpiece feeding system for a given input signal. Desired displacement is given as input signal to Inverse Maxwell model, to get voltage as output signal. This output signal is sent to NI-PCI 6221 data acquisition system. DAQ will generate voltage according to the signal received from the Inverse Maxwell Model. The Voltage from DAQ is sent to Linear Voltage amplifier, where the voltage is multiplied or amplified 20 times. This amplified voltage is applied to FAP to control the feed rate of workpiece feeding system. Laser Displacement sensor ILD 2220 with 20μm range is used to measure the displacement produce by the workpiece feeding system. Fig. 13 shows the Experimental setup for the workpiece feeding system.
Fig. 13 Experimental setup for the workpiece feeding system.
Fig. 14 Experimental results obtained for workpiece feeding system for reference input displacement of 300μm Fig.14 shows the experimental results obtained for workpiece feeding for reference input displacement of 300μm to with sine waveform. Here the Output Displacement is the actual displacement of the workpiece feeding system measured using Laser displacement sensor ILD 2220-20. Table II shows the experimental results obtained for workpiece feeding system for sinusoidal waveforms. Experiments from reference displacement of 300μm to 600μm were carried out. From the table, it is observed that the percentage error between the reference displacement and the
Piezo-actuator based workpiece feeding system using Maxwell inverse hysteresis model
NMAMIT ANNUAL RESEARCH JOURNAL Vol 6. 2016 31
actual displacement of the workpiece feeding system is less than 2 percent.
TABLE II EXPERIMENTAL RESULT OBTAINED FOR WORKPIECE
FEEDING SYSTEM FOR SINE WAVEFORM.
Reference Displacement
(m)
Output Displacement
(m)
Error %
300x10-6 294.2x10⁻⁶ 1.93
400x10-6 395.5x10⁻⁶ 1.12
500x10-6 495.7x10⁻⁶ 0.86
600x10-6 596.5x10⁻⁶ 0.58
Fig.15 shows the experimental results obtained for
workpiece feeding for reference input displacement of 500μm for ramp waveform with 20 μm/s slope. Here the Output Displacement is the actual displacement of the workpiece feeding system measured using Laser displacement sensor ILD 2220-20 and the Output voltage is the voltage applied to FAP.
Fig. 15 Experimental results obtained for workpiece feeding system for reference input displacement of 500μm
Table 3 shows the experimental results obtained for
workpiece feeding system for ramped waveforms. Experiments from reference displacement of 300 μm to 600μm were carried out. From the table, it is observed that the percentage error between the reference displacement and the actual displacement of the workpiece feeding system is less than 6 percent.
TABLE III EXPERIMENTAL RESULT OBTAINED FOR WORKPIECE FEEDING
SYSTEM FOR RAMP WAVEFORM.
Reference Displacement
(m)
Output Displacement
(m)
Error %
300x10-6 283.5x10⁻⁶ 5.5
400x10-6 385.1x10⁻⁶ 3.725
500x10-6 488.2x10⁻⁶ 2.36
600x10-6 592.5x10⁻⁶ 1.25
VII CONCLUSIONS Piezo actuator based workpiece feeding system was
designed, fabricated and tested to be used for micro milling machine. The design of workpiece feeding system allows the workpiece to move in only upward direction, all other degrees of freedom are constrained. Flexurally Amplified Piezo actuator plays an important role in feeding the workpiece. Since the piezo actuator exhibits hysteresis, Maxwell slip hysteresis equation was used to reduce the hysteresis behaviour between the applied voltage and displacement. Simulink block diagram of workpiece feeding system was designed with 10 Maxwell slip hysteresis equations in parallel. Simulation was carried out in MATLAB software using two different types of waveform. Experiments on workpiece feeding system are conducted using NI PCI 6221 Data Acquisition System along with LabVIEW software. Different types of waveforms are used for experiment like sinusoidal and ramp wave form as the reference input displacement. For the sinusoidal waveform, the percentage error between the reference displacement and output displacement of the workpiece feeding system was less than 2 percent and for ramp waveform it is less than 6 percent as shown in Table 2 and Table 3.
Wei Zhang “A novel micro-EDM—piezoelectric self-adaptive micro-EDM” International Journal of Advance Manufacturing Technology pp 1-8. 2015.
[2] Yong Li, Min Guo, Zhaoying Zhou, Min Hu “Micro electro discharge machine with an inchworm type of micro-feed mechanism” Journal of the International Societies for Precision Engineering and Nanotechnology 26 pp 7–14. 2002.
[3] Ali Ozgedik, Can Cogun “An experimental investigation of tool wear in electric discharge machining” International Journal of Advance Manufacturing Technology 27 pp 488-500. 2006.
[4] Z.Y. Yu, K. P. Rajurkar and H. Shen “High Aspect Ratio and Complex Shaped Blind Micro Holes by Micro EDM”
[5] Eckart Uhlmann, Markus Roehner “Investigations on reduction of tool electrode wear in micro-EDM using novel electrode materials” CIRP Journal of Manufacturing Science and Technology 1 92–96. 2008.
[6] G. Karthikeyan J. Ramkumar. Dhamodaran “Block Edg: Issues and Applicability in Multiple Pass �ED-Milling” Machining Science and Technology, 18:120–136.
Piezo-actuator based workpiece feeding system using Maxwell inverse hysteresis model
NMAMIT ANNUAL RESEARCH JOURNAL Vol 6. 2016 32
[7] Michael Goldfarb, Nikola Celanovic “Modeling Piezoelectric Stack Actuators for Control of Micromanipulation” IEEE Control Systems, 0272-1708/9 7/1997.
[8] Yanfang Liu, Jinjun Shan, Ulrich Gabbert and Naiming Qi “Hysteresis and creep modeling and compensation for a piezoelectric actuator using a fractional-order Maxwell resistive capacitor approach” Smart Materials And Structures, Smart Mater. Struct. 22 115020 pp 12. 2013.
[9] D.T. Pham, S.S. Dimov, S. Bigot, A. Ivanov, K. Popov “Micro-EDM-recent developments and research issues” Journal of Materials Processing Technology 149 50–57. 2004.
[10] Eckart Uhlmann, Sascha Piltz, Ulrich Doll “Machining of micro/miniature dies and moulds by electrical discharge Machining-Recent development” Journal of Materials Processing Technology 167 488–493. 2005.
[11] U. Maradiaa, M. Boccadorob, J. Stirnimannc, I. Beltramib, F. Kustera, K. Wegenera “Die-sink EDM in meso-micro machining” Procedia CIRP 00000–000. 2011.
[12] Muralidhara, NileshJ.Vasa, Singaperumal Makaram “Investigations on a directly coupled piezoactuated tool feed system for micro-electro-discharge machine” International Journal of Machine Tools & Manufacture.
[13] Veeresha R.K, Muralidhara and Rathnamala Rao “Development of Tool Based Micromilling/Microdrilling Machine with Piezoactuated Workpiece Feeding System” Applied Mechanics and Materials Vols. 592-594. 2014.
[14] Vahid Hassani, Tegoeh Tjahjowidodo and Thanh Nho Do “A Survey on hysteresis modelling, Identification and control” Elsevier 2014.
Piezo-actuator based workpiece feeding system using Maxwell inverse hysteresis model
NMAMIT ANNUAL RESEARCH JOURNAL Vol 6. 2016 33
�
Matching Governance Systems with Performance Frameworks in
Higher Education
K. Sankaran
Director, Justice K. S. Hegde Institute of Management
Nitte, Karkala, Udupi, Karnataka - 574-110, Affiliated to VTU, Belgaum.
This paper argues for seeking a possible match between Higher Education (HE) governance systems that a country could follow and the demands on the performance of the governed. Conversely a mismatch would lead to less that “optimal” performance. In this article we first identity a framework for defining a) Alternative Governance Systems and b) Performance. Then the paper suggests the kind of governance that would fit with the performance matrix expected today from the HE sector.
A.Governance Frameworks
A framework for Alternative governance frameworks for HE is provided by [1]. They suggest that there are five different governance models that are found today, viz. Institutional, Resource Dependence, Agency, Stewardship and Stakeholder models. Table 1 below lists these models and provides description of the underlying assumptions and
approaches that underlie them. The Institutional Model is based on the notion that the regulator, by bureaucratic oversight, can achieve the objective of proper control and change management. It is assumed that the top of the pyramid (say, ministry of education, educational departments and central and state levels etc.) knows when and how to make changes. It is assumed that governance of institutions in HE can be controlled through standard operating procedures (SOPs) and rules of conduct. It further assumes that the “reverse” communication would occur in reporting of best practices that can be popularized by the top of the pyramid where some of the innovative “subjects” or constituents (universities and colleges) may do something different that can be replicated through the “approval” . This is a “rational” model with limited scope for local variations that can be exercised by the constituents. The next one, Resource Dependence Model, is very similar to Institutional model except that the resources (read financial) that are allocated, and the control that comes with such allocation, will provide as an instrument for exercising control over the constituents that receive the financial fund allocations.
Matching Governance Systems with Performance Frameworks in Higher Education
NMAMIT ANNUAL RESEARCH JOURNAL Vol 6. 2016 34
�
TABLE I
CHARACTERISTICS OF GOVERNANCE MODELS
Key Characteristics of Governance models
Governance Models
1 2 3 4 5
Institutional Model Resource Dependence
Model
Agency Model Stewardship Model
Stakeholder Model
Key assumption about change
drivers
Top of the pyramid knows what and how of change
Top of the pyramid knows what and how of change
Principal’s interest should drive change, but principal - agent conflict exists
Players work towards welfare of constituents whose care is vested in them.
Stakeholders will exert pressure for change
Key assumption about how change can be affected
Change can be top-down driven rationally
Change can be top-down driven rationally
Change can be affected through handling conflictual relationship with agent
Change happens through self - order created by actions of samaritans
Stakeholder engagement
How is governance achieved?
Employment & standardization mandated from the top
Mainly through allocative power of finance
External oversight through structures or simply through rules
Through a hands-off processual orientation and self regulation
Multiple demands will gradually reach “optimization” on different interest dimensions
How does change come about?
Through a bureaucratic process
Through resource allocation priorities
Through constant vigil to prevent “violations”
Aligning of aspirations of players with constituents’ welfare
Satisficing multiple demands in creative ways
The third approach, namely, Agency Model, assumes that the government that legitimizes the “academy” (and provides the sustenance through funds) will be in a conflict-laden relationship with the latter. This idea comes from the corporate governance literature [4]. By appropriate mechanisms such as rules of engagement and a system of checks and balances (including structural and processual means), it is assumed that, it is possible to “discipline” those that violate the “covenant”. While in the previous two models it was assumed that the agent would be “benign”, here the agent, having asymmetric knowledge via-a-vis the sponsor, is assumed to work towards selfish instrumental goals unless there are systems and structures in place to prevent this from happening. By this reckoning, the HE institutions, are merely driven by self-interest. This necessarily warrants
strict control by the sponsor (state or government) on the agent (HE institutions).
The next model puts the onus for responsible action on the idea of stewardship. Here the educational institutions are assumed to act responsibly through their own internally-generated positive motivations. Here it is assumed that order comes about in the network of institutions through emergent action [6] and self order. Finally, the Stakeholder Model assumes that there are external forces that push the educational institutions to accommodate the interests of various stakeholders [3], such as students, parents, etc., the interplay of which directs the institution onto appropriate governance trajectories. The stakeholder model assumes that the market, consisting of consumers as a group, is a legitimate stakeholder.
The next question, for the purpose of this paper, is whether we can combine the last two models and create a
stakeholder-mediated stewardship model as suggested by Balakrishnan, Malhotra and Falkenberg (2015). In the
Matching Governance Systems with Performance Frameworks in Higher Education
NMAMIT ANNUAL RESEARCH JOURNAL Vol 6. 2016 35
�
next section we classify performance frameworks in terms of a) output-based systems and b) outcome-based systems. Further we show that the stakeholder-mediated stewardship model would correspond best with outcome-based performance systems.
B. Performance Frameworks
Here we adopt two broad methods of defining performance of education institutions; Viz., Output-based versus Outcome based. Table 2, adopted from Sankaran (2015), contrasts the two.
Providing feedback to students, via grades or marks, in individual courses requires and output orientation. Here the performance of the students in specific courses is the output. Performance is objectively evaluated and communicated to the students. Output measurements have evolved over time through different means such as examinations, tests, quizzes, assignments (and variations within them such as whether through open-book or closed book, surprise or pre-announced) etc.
In addition to this, there is call to take into account outcomes [5] while evaluating the performance of the programs themselves. Programs need to be evaluated from both inside (mainly peer faculty) and outside (by employers, students themselves after a few years of working, parents, society etc.). The means to measure of outcomes and the matrices to be used are still emerging. A more detailed discussion in outcomes is therefore relevant here. As indicated in the Table, outcomes are meant primarily for the non-student constituents of the system (faculty, educational institution, regulators, accrediting agencies etc.) Outcomes measurement may be formative or summative in nature.
An outcome-based system goes beyond individual faculty members and individual courses. The key criterion would be whether the institutional vision is being fulfilled and whether the expectations of various constituents are fulfilled. The faculty members have to
come together and reflect and act upon the institutional goals. Narrow disciplinary boundaries have to be broken down and overall coherence sought. This would also entail new communication among the students, faculty, staff and management for collective performance. There will have to be much intra-institutional dialogue on how results can be achieved. To achieve system-wide results in a knowledge environment (that marks HE institutions) and create systems thinking and learning organizations [9], hierarchical systems and traditional means of influencing behavior of organizational members will have to be challenged. Here peer-to-peer oriented accreditation agencies can play a positive role.
C.Match between Governance and Performance Frameworks
The assessment system(whether internal or external to the educational institution) can promote open and flexible process standards that encourage innovation and diversity and do not prescribe too narrowly what ought to be done or what the output should be. Role of assessment agencies (such as accreditation agencies) would be significant here. They ought to provide enough room for continuous improvement to take hold. This will necessarily require experimentation and term-by-term fine-tuning. Care should be taken if institutions are modeled on the basis of leading best practices and bench-marking [8]. Often, the idea of best practices may militate against experimentation and homegrown innovations. In a post-industrial environment where past institutional practices are being constantly challenged what is required is not one inflexible benchmark but creation of communities of practice [5]. This is precisely what can be achieved through peer-to-peer sharing of good practices. Governance by process requires a different mindset for the regulatory and the accreditation agencies as well as the institutions that are being assessed. A departure from the past for both may not be easy. End-based governance will have to be replaced by process-based governance. Table 3 below shows the differences between the two.
Matching Governance Systems with Performance Frameworks in Higher Education
NMAMIT ANNUAL RESEARCH JOURNAL Vol 6. 2016 36
�
TABLE II
DIFFERENCES BETWEEN OUTPUT BASED SYSTEMS AND OUTCOME BASED SYSTEMS
Aspect Output Based Outcome Based
Basis to check whether intended achievement has been made
Course Objectives (as decided by the university/ faculty members)
Institutional vision and program objectives
Time Span Course Duration Program Duration
The criteria as to whether the objective has been achieved is obtained and who is this information communicated to
Achievement of the students, communicated to the students
Outcomes, communicated to fellow faculty/ accreditation agency etc. In those courses that have one right convergent answers course output and course outcomes could be measured by the same means.
Measurement orientation Unbiased objectivity and communication of the same to the students
Self-reflective (in the institutional sense) and being truthful to the process. May or may not be communicated with the students
Coherence between measurement parameters
Not an issue since course objectives are all generally known to peer/ faculty fraternity
Based on each institution’s mission
TABLE III
CONTRASTING END-BASED AND PROCESS-BASED GOVERNANCE SYSTEMS
Basic Questions that underlie the Assessment
Process End-based Process-based
What is the fundamental question answered?
Has the institution met specified threshold levels of quality?
What is the exalted purpose of the institution being assessed? What is being done to demonstrate that the purpose is being achieved on a time scale?
What constitutes quality? Things demonstrated to be achievable by top institutions in the same category
Defining a purpose and working authentically towards it with measurable landmarks
What is ultimately being measured?
How close is the institution to the threshold or benchmark organization or leader-in-class?
How is the institution moving towards achieving the stated purpose?
What is the relationship between the accreditor and
Inspector-inspected Largely peer-peer
Matching Governance Systems with Performance Frameworks in Higher Education
NMAMIT ANNUAL RESEARCH JOURNAL Vol 6. 2016 37
�
the accredited
What kind of change orientation can be expected?
Top down. The leaders-in-class has to demonstrate change which trickles down over a period of time.
Scope for internal forces to change autonomously and be locally creative. Room for multiple voices.
What will such a system generate in the long run?
Standardized, compliant behavior of institutions.
Pluralism and opportunity for multiple models to thrive at the same time.
What will the relationship between the accreditor and the accredited?
Hierarchical Collegial
What are the likely challenges?
One-size-fits-all syndrome, Compliance orientation, and tendency towards bureaucratization.
Lack of accountability to stakeholders “outside” the system. This can be overcome by not being just stewardship oriented but also being stakeholder oriented
It may be pointed out that process-based systems would allow greater buy-in of the participants for continuously tracking performance (outcomes) and be able to constantly tweak the means to get to the outcomes desired, reminiscent of the Japanese Kaizen philosophy or continuous improvement [10].
II. CONCLUSIONS
This paper argued that the fundamental basis for HE governance need to be carefully considered before choosing the particular form of governance mechanism. This particularly applies to countries such as India which are in a “hurry” to catch up with the western nations such as the United States. It is often tempting to put in regulatory mechanism without taking into account the consequences that such regulatory mechanisms may bring about. Inter-institutional systems do not exactly behave in pre-determined ways. One can expect unintended consequences from governance systems (such as rigidities that militate against knowledge generation or undervaluing the role of incremental improvements that emerge from
flexibilities available at grass-roots level). When this is the case, while designing or redesigning governance systems,
it is important to dwell deeper into various forms of governance theories to explore their paradigmatic underpinnings and their consequences. This paper also considered output and outcome-based systems of HE and suggested that there has to be fit between the form of governance system adopted and the results expected. We suggested that a stakeholder-mediated stewardship model as congruent with outcome-based performance expectations.
REFERENCES
[1] I. Austin, A. J. Jones, Governance of Higher Education: Global
Perspectives, Theories, and Practices, New York, USA: Routledge,
2016.
[2] J. Balakrishnan, A. Malhotra, L. J.Falkenberg, Multi-Level Corporate
Responsibility: A Comparison of Gandhi’s Trusteeship with
Stakeholder and Stewardship Frameworks. Journal of Business Ethics.
doi:10.1007/s10551-015-2687-0, 2015.
[3] W. M. Evan, R. E. Freeman, A stakeholder theory of the modern
corporation: Kantian capitalism. In T. L. Beauchamp & N. Bowie
(Eds.), Ethical Theory and Business (3rd ed.). Englewood Cliffs, NJ,
USA: Prentice Hall.1988.
[4] E. F.Fama, M. C. Jensen, Separation of Ownership and Control .
Journal of Law & Economics, 26(2), 301–325. 1983.
Matching Governance Systems with Performance Frameworks in Higher Education
NMAMIT ANNUAL RESEARCH JOURNAL Vol 6. 2016 38
�
[5] P. FHildreth, C. Kimble, Knowledge Networks: Innovation Through
Communities of Practice. London, U.K.: Idea Group Inc (IGI). 2004.
[6] J. Jeston, , J. Nelis, Management by Process: A Roadmap to
Sustainable Business Process Management. Butterworth Heinemann
Amsterdam 2008.
[7] K. Sankaran, Generating the Right Institutional Environment for
Ethical Behavior in University-Affiliated Institutions in India” at the
conference “Professional Ethics for Higher Education Faculties:
Roles and Responsibilities of Teachers” held by at the Indian Institute
of Technology Madras, Chennai, India. 29tth Aug. 2015.
[8] V. Schray,, (2012). Assuring Quality in Higher Education:
Recommendations for improving Accreditation. Fourteenth in a series
of Issue Papers released at the request of Chairman Charles Miller to
inform the work of the Commission. Washington, DC, USA.
[9] P. Senge, (1994). The Fifth Discipline: The Art and Practice of the
Learning Organization. New York, USA: Currency Doubleday.
[10] D. N Thalner,., (2005). The Practice of Continuous Improvement in
Higher Education. PhD Dissertation, Western Michigan University,
Kalamazoo, Michigan, USA.
Matching Governance Systems with Performance Frameworks in Higher Education
NMAMIT ANNUAL RESEARCH JOURNAL Vol 6. 2016 39
Gut microbiota, short-chain fatty acids and
host gene regulation Prasanna K. Santhekadur
McGuire Research Institute, McGuire Veterans Affairs Medical Center, Research BC-101. Richmond,
in the hypothalamus of the brain through activation
of tricarboxylic acid (TCA) cycle. Acetate also
mediates a microbiome-brain-pancreas axis to
promote gut microbiota-induced metabolic
syndrome. All these three SCFAs (propionate,
butyrate and acetate) activates their receptor
proteins and one such main receptor is GPR43 (also
known as FFAR2) which is activated by acetate and
propionate followed by butyrate. These SCFAs
activates FFAR2 and releases PYY and GLP-1 from
intestinal endocrine L-cells.
Another receptor FFAR3 has also been
identified as a receptor for SCFAs and is mainly
activated by both propionate and butyrate. The
propionate and butyrate activated FFAR3 is also
involved in the expression of neuropeptides such as
PYY- and GLP-1, indicating its role and
involvement in energy homeostasis in similar
fashion that of FFAR2. GPR109A and olfactory
Gut microbiota, short-chain fatty acids and host gene regulation
NMAMIT ANNUAL RESEARCH JOURNAL Vol 6. 2016 44
receptor 78 (OLFR78) are other two receptors which
are associated with beneficial effects of SCFAs.
D. Genetic and epigenetic regulation by SCFAs
The SCFAs plays a major role in both genetic
and epigenetic regulation of genes. Here, one of the
important role of butyrate in transcriptional
regulation is the induction of protein phosphatase
enzyme. This enzyme is very well known in the
transcriptional regulation of various genes. Butyrate
also transcriptionally activates the WAF1/Cip1 gene
promoter through Sp1 transcription factor in p53-
negative human colon cancer cell line (Fig. 2)
Further, it inhibits VEGF gene expression by
inactivating Sp1 transcription factor. It is also
involved in counter-regulatory effect on tumor
necrosis factor-alpha -induced complement C3 and
factor B biosynthesis in human intestinal epithelial
cells. Butyrate, a well-known histone deacetylase
inhibitor has beneficial effect on diabetes mellitus
and inhibits beta-cell proliferation, function, and
glucose homeostasis through modulation of
p38/ERK MAPK and apoptotic signaling pathways
in juvenile diabetic rat. Butyrate also improves
myocardial function and prevents cardiac
remodeling in diabetic mice and ameliorates eNOS,
iNOS and TGF-1-induced fibrogenesis and induces
apoptosis and DNA damage in the kidney of
juvenile diabetic rats. Both SCFAs (butyrate and
propionate) protect against diet-induced obesity and
regulate gut hormones via FFAR-3-independent
mechanisms and butyrate also alleviates adipocyte
inflammation by inhibiting NLRP3 pathway. The
epigenetic effects of butyrate have potential
therapeutic implications in the treatment of various
diseases.
Propionate helps in appetite regulation, body weight
maintenance and adiposity in overweight adults
through colon absorption and increases hepatic
pyruvate cycling and is also involved in the
regulation mitochondrial metabolism. Propionate
also inhibits salmonella invasion through the post-
translational regulation of HilD protein and
stimulates pyruvate oxidation in the presence of
acetate. Further, propionate stimulates GLP-1 and
PYY secretion via FFAR2 in rodent gut and reduces
Akt2 knockout-mediated�dysfunction in myocardial
contractile ability and reduces cancer cell
proliferation in the liver.
The SCFA, acetate functions as an epigenetic
metabolite to promote lipid synthesis under hypoxic
condition and reduces appetite via a central
homeostatic mechanism. Acetate is also a
bioenergetic substrate for human glioblastoma
growth and development which also helps in brain
metastasis. Acetate further modulates inflammatory
cytokines through mitogen-activated protein kinases
in primary astrocytes. It alters expression of genes
involved in adipogenesis in obese mice and might
represent a potential therapeutic agent and useful
target to combat obesity. Recent studies also suggest
that some tumors also depend on acetate for their
metabolic energy source and acetate is also known
to induce apoptosis in colorectal cancer cells which
involves lysosomal membrane permeabilization and
cathepsin D release.
Gut microbiota, short-chain fatty acids and host gene regulation
NMAMIT ANNUAL RESEARCH JOURNAL Vol 6. 2016 45
Fig.2 Schematic representation of gut microbiota mediated short chain fatty acids synthesis and mechanism of SCFA-induced gene regulation.
II. CONCLUSIONS
Recent elegant studies have established strong
direct link between diet, gut microbiota and various
disease including metabolic syndrome and cancers.
These gut bacteria are also involved in activating
and suppressing various immune response
pathways. Many studies have also shown with
strong evidences that SCFAs are beneficial
compounds which helps in maintenance of good
health. Thus probiotics, prebiotics and symbiotics
which are the sources for the production of SCFAs
are used as diet and therapeutic drugs to cure IBD,
colon cancer and metabolic syndrome. The
molecular mechanism behind butyrate, propionate
and acetate actions at cellular level are still elusive
and it is tempting to speculate that these SCFAs
have all the properties of future therapeutic drugs
for various diseases. By considering all these
studies and beneficial effects of SCFAs, this mini
review is a small effort to shed light on recent
advances in the research on gut microbiota and
SCFA.
REFERENCES
[1] E.Nagy, R.M. Rodriguiz, W.C.Wetsel, N.J
MacIver, L.P Hale. “Reproduction and
Growth in a Murine Model of Early Life-
Onset Inflammatory Bowel Disease”. PLoS
One. 5; 11(4): April. 2016.
[2] C.M Guinane, P.D Cotter. “Role of the gut
microbiota in health and chronic
gastrointestinal disease: understanding a
hidden metabolic organ”. Therap Adv
Gastroenterol. 6(4): pp. 295-308, July.
2013.
[3] B.J Marshall, J.R Warren. “Unidentified
curved bacilli in the stomach of patients
with gastritis and peptic ulceration”.
Lancet. 16;1 (8390): pp.1311-5. June.
1984.
[4] B Sánchez, S Delgado, A Blanco-Míguez,
A Lourenço, M Gueimonde, A Margolles.
“Probiotics, gut microbiota, and their
Gut microbiota, short-chain fatty acids and host gene regulation
NMAMIT ANNUAL RESEARCH JOURNAL Vol 6. 2016 46
influence on host health and disease”. Mol
Nutr Food Res. 61(1). January. 2017.
[5] G.P1 Donaldson, S.M1 Lee, S.K1
Mazmanian. “Gut biogeography of the
bacterial microbiota”. Nat Rev Microbiol.
14(1): pp.20-32. January. 2016
[6] G.O Canny, B.A McCormick. “Bacteria in
the intestine, helpful residents or enemies
from within?”. Infect Immun. 76(8): pp.
3360-73. August. 2008.
[7] J. Chow, S.M Lee, Y. Shen, A. Khosravi,
S.K Mazmanian. “Host-bacterial symbiosis
in health and disease”. Adv Immunol; 107:
pp. 243-274. 2010.
[8] Segata N. Gut Microbiome: Westernization
and the Disappearance of Intestinal
Diversity. Curr Biol. 20; 25(14): R611-3.
July. 2015.
[9] R.W Warne. “The micro and macro of
nutrients across biological scales”. Integr
Comp Biol. 54(5): pp. 864-72. November.
2014.
[10] A.R Weseler, A .Bast. “Masquelier's grape
seed extract: from basic flavonoid research
to a well-characterized food supplement
with health benefits”. Nutr J. 19; 16(1):5.
January. 2017
Gut microbiota, short-chain fatty acids and host gene regulation
NMAMIT ANNUAL RESEARCH JOURNAL Vol 6. 2016 47
GUIDELINES FOR AUTHORS
The contributors are expected to highlight their research work with sufficient details & discussion of results.
The original research paper should be limited to 6 and short communication to 3 printed pages of the journal indouble column standard IEEE format. Please refer to IEEE website for the standard format.
Manuscripts must be submitted online to [email protected] in .docx format.
Enough precaution should be taken to make the manuscript error free.
The papers that are not in the standard format may be rejected
Submission of an article implies that the work described has not been published previously (except in the formof an abstract or as part of a published lecture or academic thesis), that it is not under consideration forpublication elsewhere, that its publication is approved by all authors and tacitly or explicitly by the responsibleauthorities where the work was carried out.
Authors of the selected papers have to send the final camera ready paper (both in MS Word &PDF) for finalprint
After the review process, the selected papers will be published in the Journal.
Article structure
Subdivision - numbered sectionsDivide your article into clearly defined and numbered sections. Subsections should be numbered 1.1 (then1.1.1, 1.1.2, ...), 1.2, etc. (the abstract is not included in section numbering). Use this numbering also forinternal cross-referencing: do not just refer to ‘the text’. Any subsection may be given a brief heading. Eachheading should appear on its own separate line.
IntroductionState the objectives of the work and provide an adequate background, avoiding a detailed literature survey ora summary of the results.
Material and methodsProvide sufficient detail to allow the work to be reproduced. Methods already published should be indicated bya reference: only relevant modifications should be described.
Theory/calculationA Theory section should extend, not repeat, the background to the article already dealt with in the Introductionand lay the foundation for further work. In contrast, a calculation section represents a practical developmentfrom a theoretical basis.
ResultsResults should be clear and concise.
DiscussionThis should explore the significance of the results of the work, not repeat them. A combined Results andDiscussion section is often appropriate. Avoid extensive citations and discussion of published literature.
ConclusionThe main conclusions of the study may be presented in a short Conclusions section, which may stand alone orform a subsection of a Discussion or Results and Discussion section.
AppendicesIf there is more than one appendix, they should be identified as A, B, etc. Formulae and equations in appendicesshould be given separate numbering: Eq. (A.1), Eq. (A.2), etc.; in a subsequent appendix, Eq. (B.1) and so on.Similarly for tables and figures: Table A.1; Fig. A.s1, etc.
Welcome!Indian engineering education is at the crossroads.
With the establishment of large number of engineeringcolleges in the country in the last decade, there is nodearth of fresh engineering personnel to meet therequirement of not only the Indian industries but thatof other countries as well. However, quality of all theseyoungsters coming out of these innumerableengineering colleges is questionable, what with largenumber of surveys carried out by various agenciespointing to the low level of employability of ourgraduates. The spirit of questioning, exploring theunknown, and probing for new knowledge which arethe qualities which make a nation great, areconspicuous by their absent.
The arrival of accreditation process like NBAand NAAC were expected to bring in new lease oflife to engineering education, but alas, they only havebeen able to add to the woes of the faculty members,and did nothing much to improve the quality. Thepresent set of ideas prevalent in engineering collegesare expected to keep them as community collegeswhere focus is more on completion of the curriculum,yearlong fun and frolic, and placement in lowly paidcompanies.
There is also the problem of trying to achievefast research parameters and in the process researchcarried out prove to be of low quality and devoid ofpractical application. Semblance of leadership enjoyedby our nation in the area of technology could besustained by very quickly aiming for cutting edgeresearch and very series academic pursuit in thecampuses with focus on innovation and research.
In this issue we have deviated a little by invitingarticles from erudite scholars. However, our usualpractice of publishing original research papers has beenpersisted with.
I am glad to hand you this issue of the journal.Happy reading.
Dr. Sudesh BekalEditor
EDITORIALMEMBERS OF EDITORIAL BOARDEDITOR-IN-CHEIF
Dr. Nirajnjan N. Chiplunkar
NMAM Institute of Technology, Nitte
EDITOR
Dr. Sudesh Bekal
Dean (R&D), NMAM Institute of Technology, Nitte
EDITORIAL BOARD
Dr. S. Y. Kulkarni
Reva University, Bangalore
Dr. N. S. Sriram
Vidya Vikas College of Engineering, Mysore
Dr. C. Vaman Rao
NMAM Institute of Technology, Nitte
Dr. Ashok Babu T. P.
National Institute of Technology Karnataka, Suratkal
Dr. Jaganath Nayak
National Institute of Technology Karnataka, Suratkal
Dr. Shridhara S.
Indian Institute of Technology Bombay, Mumbai
Dr. K. V. V. Murthy
Indian Institute of Technology, Gandhinagar
Dr. Navakanth Bhat
Indian Institute of Science & Communication, Bangalore
Dr. Gopalakrishna Kini
Manipal Institute of Technology, Manipal
Dr. Khalid
Vellur Institute of Technology, Vellur
EDITORIAL ASSISTANTSDr. Vidya S. M., NMAMIT, Nitte.
Dr. Anil Kumar H.S., NMAMIT, Nitte.
NMAM INSTITUTE OF TECHNOLOGY, NITTE – 574110NMAM INSTITUTE OF TECHNOLOGY, NITTE – 574110NMAM INSTITUTE OF TECHNOLOGY, NITTE – 574110NMAM INSTITUTE OF TECHNOLOGY, NITTE – 574110NMAM INSTITUTE OF TECHNOLOGY, NITTE – 574110
NMAM Institute of Technology was started in the year 1986, as a part of Nitte Education
Trust, Mangalore and celebrated its Silver Jubilee in 2011. The Institute is named in fond memory
of Nitte Mahalinga Adyanthaya, a distinguished engineer of the district. It is affiliated to the
Visvesvaraya Technological University, Belgaum, enjoying academic autonomy and is recognized
by the All India Council for Technical Education, New Delhi. It is accredited by the National
Board for Accreditation and is certified to the ISO 9001 – 2008 standards for quality education
by KEMA, Netherlands. The Institute has been recognized as Lead Institute under TEQIP- I Project
of World Bank.
The Institute offers B.E, M.Tech and Ph.D pragrammes in various Engineering and Technology
disciplines. The graduate programs comprise of 7 branches of Engineering – Electronics &
Communication Engineering, Computer Science & Engineeing, Civil Engineering, Electrical &
Electronics Engineering, Information Science & Engineering, Bio-Technology and Mechanical
Engineering. The Institute’s postgraduate programs include, Master of Technology in 13
disciplines, Master of Computer Applications and Master of Business Administration. The
Visvesvaraya Technological University has opened a postgraduate extension centre at NMAMIT,
offering M.Tech in Micro-electronics & Control Systems. Besides these, students also pursue
their M.Sc(Eng.) and Doctoral Programs at the Institute. The Institute got academic autonomy
in the year 2007, bringing in the much needed flexibility to innovate in terms of curriculum,
education delivery and evaluation. Institute entered into collaboration with Penn State University,
Harrisburg, USA and started offering 2+2 twinning program in Engineering since 2011.
Annual Research Journal
Use of PSO optimized Radial Basis Function Neural Network for improved modeling
Vruksha R Shetty, Rashmi P Shetty, Srinivasa Pai P 1
In Vitro Propagation and Molecular Characterization of Local Accessions of Santalum Album
Aparna B, Bharathi A, Yashas K, Rashmi KV 9
Laterite Soil as A Binder in Concrete
Manjunatha M, Gururaj Acharya., Shaik Kabeer Ahamed 13
Smart Surveillance System Using Wireless Sensor Networks: A Survey
Asthik She1, Akarsh V Kumar, Deeksha S, Deeksha S Kotian, K. S. Shivaprakasha 17
Influence of injector nozzle hole number and size on the performance of
a supercharged direct injection diesel engine
Ravinarayana Bhat N. 23
Piezo-actuator based workpiece feeding system using Maxwell inverse hysteresis model
Prasad Prabhu, Muralidhara 28
Matching Governance Systems with Performance Frameworks in Higher Education
K. Sankaran 34
Gut microbiota, short-chain fatty acids and host gene regulation
Prasanna K. Santhekadur 40
NMAMIT
Published by:
NMAM Institute of TechnologyAn Autonomous Institution Under VTU, Belagavi(A Unit of Nitte Education Trust)NITTE - 574 110, UDUPI DIST., KARNATAKAwww.nitte.edu.in/nmamitwww.research.nitte.edu.in