174
Safety of roadside area Analysis of full-scale crash tests and simulations Finnra reports 10/2009

Safety of roadside area
Analysis of full-scale crash tests and simulations
Finnra reports 10/2009


Safety of roadside area
Analysis of full-scale crash tests and simulations
Finnra reports 10/2009
Finnra
Helsinki 2009

Electronic publication pdf (www.tiehallinto.fi/julkaisut)
ISSN 1459-1553
ISBN 978-952-221-142-2
TIEH 3201124E-v
Finnish Road Administration
Central Administration
Opastinsilta 12 A
P.O.Box 33
00521 HELSINKI
Telephone +358 (0) 204 22 11

Marko Kelkka: Safety of roadside area. Analysis of full-scale crash tests and simula-tions. Helsinki 2009. Finnish Road Administration, Central Administration. Finnra reports 10/2009, 161 p. + app. 5 p. ISSN 1459-1553, ISBN 978-952-221-142-2, TIEH 3201124E-v
ABSTRACT
This is a final report of the Nordic project “Utformning av förlåtande sidoom-råde” (Design of forgiving roadside area) which was launched in 2005 by Swedish, Norwegian, Danish and Finnish road authorities.
Main objective of the project was to evaluate the safety of different roadside ditch and slope profiles. For this purpose a number of simulated tests were conducted. The analyses in this report are based on data from these simula-tions together with the results of full-scale tests performed in Finland and Sweden during years 2000-2001. As a background data for the analysis de-tailed statistics of single vehicle accidents and applicable results of earlier research was collected.
The analysis of roadside area includes several ditch profiles with 4.0 m high backslopes, ditch profiles in front of rock or concrete wall, ditch terminations at minor road junctions and embankment slopes (fill slopes). In most cases risk analysis was used to evaluate the safety of tested roadside profiles.
In the analysis the likelihoods and severities were defined for following inci-dents:
Crash into the backslope
Rollover
Crash into rigid obstacle on backslope at height of 1 ,2, 3 or 4 meters
Collision with another vehicle when coming back onto the roadway
The aim was to find answers to the questions like “How to design the ditch if the distance from the edge of the road to the rigid obstacle is 5, 7, 9 or 11 meters?”
For presentation of the results also new methods were developed. Result tables and risk matrices make it possible for the reader to carry out addi-tional or detailed analyses.


FOREWORD
Nordic project “Utformning av förlåtande sidoområde” (Design of forgiving roadside area) was proposed in 2005 by Nordiska vägregelgruppen (Nordic road design guidelines working group). It was launched and financed by Swedish, Norwegian, Danish and Finnish road authorities.
Denmark pulled out of the project at rather early stage because the studied roadside cross-sections in the project are very different from the roadside area in Denmark.
The full-scale tests of V- and U-ditches were conducted by Helsinki Univer-sity of Technology (TKK) and Swedish National Road and Transport Re-search Institute (VTI). The full-scale tests of the ditch terminations were per-formed by TKK.
The finite element simulations in this project were performed by Rune Gladsø from Force Technology Norway AS and DyMesh simulations were performed by Fredrik Sangö from Force Technology Norway AS.
The members in the project group were:
Anders Håkansson, Swedish National Road Administration
Jan Moberg, Swedish National Road Administration
Torgny Bäckström, Swedish National Road Administration
Kari Lehtonen, Finnish National Road Administration
Otto Kleppe, Norwegian Public Roads Administration
Egil Haukås, Norwegian Public Roads Administration
Adrian Schelling, Danish Road Directorate
The analysis of all the results was carried out by Marko Kelkka from Sito Oy, who has also written this final report.
Helsinki, May 2009
Finnish Road Administration
Central Administration


The safety of side ditches 7 INTRODUCTION
Table of contents
1 INTRODUCTION 11
1.1 Background 11
1.2 Objectives 11
1.3 Reader guidelines 11
2 RUN-OFF-THE-ROAD ACCIDENTS IN SCANDINAVIA 12
2.1 Accidents with personal injuries 12
2.1.1 General 12
2.1.2 Finnish data of single vehicle accidents 12
2.1.3 Swedish data of single vehicle accidents 13
2.1.4 Norwegian data of single vehicle accidents 13
2.1.5 Crashed roadside hazards in run-off-the-accidents with personal injuries 13
2.2 Fatal accidents 17
2.3 Accidents in some other European countries 18
3 ENCROACHMENT SPEEDS AND ANGLES 19
3.1 General 19
3.2 Driving conditions before running off the road 20
3.2.1 Risk drivers included 20
3.2.2 Risk drivers excluded 20
3.3 Initial stage of running off the road 22
3.3.1 Direction and position of the vehicle 22
3.3.2 Encroachment speed 25
3.3.3 Encroachment angle 25
3.4 Trajectory of the vehicle after running off the road 28
3.4.1 Position of the vehicle 28
3.4.2 Location of the vehicle 29
3.4.3 Run-off-the-road distances 30
3.5 Effect of Electronic Stability Control (ESC) 35
4 FULL-SCALE TESTS 36
4.1 Full-scale tests in TKK’s crash test area at Pori airport 36
4.1.1 General 36
4.1.2 Ditch profiles 36
4.1.3 Results 39
4.2 Full-scale tests in VTI’s test area in Linköping. 40
4.2.1 General 40
4.2.2 Ditch profiles 40
4.2.3 Results 41
8 The safety of side ditches
INTRODUCTION
5 SIMULATIONS 41
5.1 Simulations within the project 41
5.1.1 V-shaped ditch; foreslope 1:3, backslope 1:2 42
5.1.2 Other modifications of V-ditch 43
5.1.3 Ditch with rounded bottom (U-ditch) 47
5.1.4 Embankment slopes 48
5.1.5 Termination of V-ditch 50
5.2 Earlier simulations of bus running off the road onto the embankment slope 50
6 ANALYSIS OF THE TEST RESULTS 51
6.1 General 51
6.2 Procedure 52
6.3 Likelihood of the incident 53
6.4 Severity of an incident 54
6.4.1 Risk of injuries due to collision 54
6.4.2 Risk of injuries due to rollover 58
6.4.3 Criteria for the severity of the incident 60
6.5 Analysis of the frontal collisions with the backslope 61
6.5.1 V-shaped ditch (Model A) 61
6.5.2 Modified V-shaped ditch (Model B) 64
6.5.3 Modified V-shaped ditch (Models C1 and C2) 65
6.5.4 Modified V-shaped ditch (Models C3 and C4) 68
6.5.5 U-shaped ditch (Models U and Us) 69
6.5.6 Embankment slopes 71
6.6 Analysis of rollovers 72
6.6.1 General 72
6.6.2 V-shaped ditch (Model A) 73
6.6.3 Modified V-shaped ditch (Model B) 76
6.6.4 Modified V-shaped ditch (Model C1) 77
6.6.5 Modified V-shaped ditch (Model C2) 78
6.6.6 Modified V-shaped ditch (Model C3) 79
6.6.7 Modified V-shaped ditch (Model C4) 79
6.6.8 U-shaped ditch (Models U and Us) 80
6.6.9 Model C1 ditch in front of vertical wall 81
6.6.10 Model C2 ditch in front of vertical wall 83
6.6.11 Model C3 ditch in front of vertical wall 84
6.6.12 Model C4 ditch in front of vertical wall 85
6.6.13 Embankment slopes 87
6.7 Analysis of the climb height on backslope 88
6.7.1 General 88
6.7.2 V-shaped ditch (Model A) 88

The safety of side ditches 9 INTRODUCTION
6.7.3 U-shaped ditch (Models U and Us) 97
6.7.4 Modified V-shaped ditch (Model B) 99
6.7.5 Modified V-shaped ditch (Model C1 and C2) 102
6.7.6 Modified V-shaped ditch (Model C3 and C4) 105
6.8 Analysis of vehicle coming back onto the road 109
6.8.1 V-shaped ditch (Model A) 109
6.8.2 U-shaped ditch (Models U and Us) 110
6.8.3 Modified V-shaped ditch (Model B) 111
6.8.4 Modified V-shaped ditch (Model C1) 113
6.8.5 Modified V-shaped ditch (Model C2) 114
6.8.6 Modified V-shaped ditch (Model C3) 115
6.8.7 Modified V-shaped ditch (Model C4) 116
6.8.8 Model C1 ditch in front of vertical wall 117
6.8.9 Model C2 ditch in front of vertical wall 118
6.8.10 Model C3 ditch in front of vertical wall 119
6.8.11 Model C4 ditch in front of vertical wall 119
6.9 Analysis of V-ditch terminations 121
6.10 Analysis of ditch tests with 20 ton bus 123
7 SUMMARY OF ANALYSIS 124
7.1 Risk matrixes 124
7.1.1 Ditch profiles 124
7.1.2 Ditch in front of the vertical wall 131
7.1.3 Embankment slope profiles 137
7.2 Numeric presentation of the results 138
7.2.1 Description of the method 138
7.2.2 Effect of the ditch model and location of an obstacle (height on the backslope) 139
7.2.3 Effect of the ditch model and location of an obstacle (distance from the road) 145
7.2.4 Additional weighting of the results 151
8 EXECUTIVE SUMMARY 155
8.1 Introduction 155
8.2 Analysed roadside cross-sections 155
8.3 Analysis of the ditch profiles 156
8.4 Analysis of the embankment profiles 158
8.5 Analysis of the ditch profiles in front of vertical wall 158
8.6 Analysis of the ditch terminations 158
9 REFERENCES 159

Safety of roadside area 11 INTRODUCTION
1 INTRODUCTION
1.1 Background
Nordic project “Utformning av förlåtande sidoområde” (Design of forgiving roadside area) was launched in 2005 by Swedish, Norwegian, Danish and Finnish road authorities. During the project there were carried out data col-lections, background studies and computer simulations in order to analyse the safety of roadside area in case of run-off-the-road accidents.
This is a final report of the analyses of both simulations conducted during the project and full-scale tests of side ditches performed in Finland and Sweden during years 2000-2001.
1.2 Objectives
Main objective of this analyse was to evaluate the safety of different road-side profiles, which were defined by the management group of the project. The analyses are based on data from simulations and full-scale tests. As a background data for the analysis detailed statistics of single vehicle acci-dents and applicable results of earlier research was collected. The answers were needed for following questions:
Single vehicle accidents in Nordic countries: what are the most com-mon and most harmful hit objects?
What are the speeds, angles and trajectories in run-off-the-road acci-dents?
What kind of full-scale tests were conducted and what were the re-sults?
What kind of simulations was conducted and what were the results? What are the most dangerous incidents for the occupants during run-
off-the-road accident? What are the likelihoods and severities of the incidents for chosen
ditch or slope profiles? What is the overall level of risk for the incident at speed of 80, 100
and 120 km/h when real-life distribution of encroachment angles is taken into account?
1.3 Reader guidelines
In chapter 2 there is reported what are the most common hit objects on roadside area in Norway, Sweden and Finland. From the results the need for better design of road cross-section and especially roadside area can be es-timated.
In chapter 3 some essential results from earlier research is reviewed. These results are needed as a background data for the later analysis.
In chapters 4 and 5 the test matrices and results of full-scale tests and simu-lations are presented.
12 Safety of roadside area RUN-OFF-THE-ROAD ACCIDENTS IN SCANDINAVIA
In chapter 6 there are 70 pages of analysis. Analyses are made separately for four incidents: crash into backslope, rollover, crash into object on back-slope or beyond the ditch and return back onto the road:
The used method is risk analysis, in which the likelihood and the se-verity of an incident are estimated. The level of risk (low, moderate, high, critical) is based on both likelihood and severity.
The criteria for estimation of likelihood and severity are created
The level of risk is estimated for each incident and each ditch profile
Furthermore, the level of risk is estimated for three speeds (80, 100, 120 km/h) and four encroachment angles (5, 10, 15, 20 degrees), which means 12 combinations of speeds and angles
In estimation of levels of risks for 12 combinations extrapolation and interpolation is needed in addition of available test data
Finally the level of risk for each incident on each profile is estimated separately for speeds 80, 100 and 120 km/h. The angles and their distribution are taken into account by weighting the level of risk.
The results and conclusions of the analysis are presented in chapter 7 Summary of analysis
In chapter 8 there is presented an executive summary of the report.
2 RUN-OFF-THE-ROAD ACCIDENTS IN SCANDINAVIA
2.1 Accidents with personal injuries
2.1.1 General
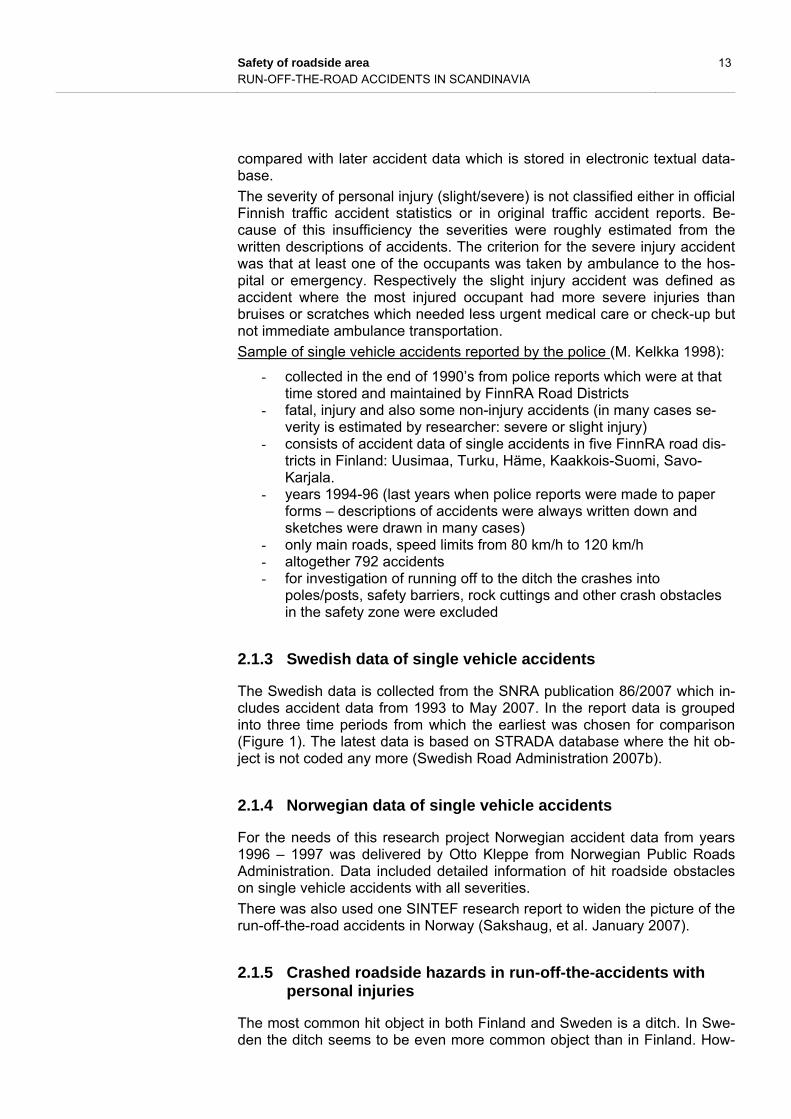
Based on latest official Swedish, Norwegian and Finnish statistics one third of fatalities (35 %) and all injuries (28...32 %) in Nordic road traffic is due to running off the road.
More detailed analysis brings out some differences within these accidents. In Figure 1 there are presented the distributions of hit objects in severe run-off-the-road accidents in Sweden and Finland. The Swedish data is from five year period (years 1993-1997) and the Finnish data is from three year period (1994-1996) of five road districts.
2.1.2 Finnish data of single vehicle accidents
The crashed roadside hazards and ditch-related details of the accident event are not reported in existing statistics of road traffic accidents. For that reason there was taken advantage of existing collected and partly analyzed data of run-off-the-road accidents.
This Finnish single accident data was originally manually collected from the accident reports (paper forms) which are written by police. This data in-cludes reported single injury accidents in five FinnRA road districts during years 1994 – 1996. Only main roads with speed limits from 80 km/h to 120 km/h were taken into account.
The advantage of this data source is that the reports include in many cases sketches of the scene of accident. This gives valuable additional information
Safety of roadside area 13 RUN-OFF-THE-ROAD ACCIDENTS IN SCANDINAVIA
compared with later accident data which is stored in electronic textual data-base.
The severity of personal injury (slight/severe) is not classified either in official Finnish traffic accident statistics or in original traffic accident reports. Be-cause of this insufficiency the severities were roughly estimated from the written descriptions of accidents. The criterion for the severe injury accident was that at least one of the occupants was taken by ambulance to the hos-pital or emergency. Respectively the slight injury accident was defined as accident where the most injured occupant had more severe injuries than bruises or scratches which needed less urgent medical care or check-up but not immediate ambulance transportation.
Sample of single vehicle accidents reported by the police (M. Kelkka 1998):
- collected in the end of 1990’s from police reports which were at that time stored and maintained by FinnRA Road Districts
- fatal, injury and also some non-injury accidents (in many cases se-verity is estimated by researcher: severe or slight injury)
- consists of accident data of single accidents in five FinnRA road dis-tricts in Finland: Uusimaa, Turku, Häme, Kaakkois-Suomi, Savo-Karjala.
- years 1994-96 (last years when police reports were made to paper forms – descriptions of accidents were always written down and sketches were drawn in many cases)
- only main roads, speed limits from 80 km/h to 120 km/h - altogether 792 accidents - for investigation of running off to the ditch the crashes into
poles/posts, safety barriers, rock cuttings and other crash obstacles in the safety zone were excluded
2.1.3 Swedish data of single vehicle accidents
The Swedish data is collected from the SNRA publication 86/2007 which in-cludes accident data from 1993 to May 2007. In the report data is grouped into three time periods from which the earliest was chosen for comparison (Figure 1). The latest data is based on STRADA database where the hit ob-ject is not coded any more (Swedish Road Administration 2007b).
2.1.4 Norwegian data of single vehicle accidents
For the needs of this research project Norwegian accident data from years 1996 – 1997 was delivered by Otto Kleppe from Norwegian Public Roads Administration. Data included detailed information of hit roadside obstacles on single vehicle accidents with all severities.
There was also used one SINTEF research report to widen the picture of the run-off-the-road accidents in Norway (Sakshaug, et al. January 2007).
2.1.5 Crashed roadside hazards in run-off-the-accidents with personal injuries
The most common hit object in both Finland and Sweden is a ditch. In Swe-den the ditch seems to be even more common object than in Finland. How-

14 Safety of roadside area RUN-OFF-THE-ROAD ACCIDENTS IN SCANDINAVIA
ever, it must be taken into account that ‘ditch’ itself was not coded as a hit object in Swedish data. All run-offs (avkörning från vägbanan) were consi-dered as ‘ditch’ -cases after exclusion of all coded hit obstacles (21 different obstacles + ‘other’).
In Finland the portion of safety barrier crashes with injuries is four times big-ger than corresponding portion in Sweden.
In Swedish data the portions of hit objects are quite similar in speed limit areas 70 km/h and 90 km/h (Figure 2)
Figure 1 Distribution of severe injury and fatal run-off-the-road accidents.
Finland: main roads with speed limit 80 km/h and 100 km/h (sample: five road districts). Sweden: public roads with speed limits 70 km/h and 90 km/h (M. Kelkka 1998, Swedish Road Administration 2007b).
Figure 2 Hit objects in severe injury and fatal accidents on Swedish 70 km/h and 90 km/h roads during years 1993-1997 (Swedish Road Administration 2007b).
If the slight injury accidents are included into the examination the number (or portion) of ditch –cases largely increases in Finnish data (Figure 3). Utility poles and guardrails are the next biggest groups before trees and culverts
0 %
10 %
20 %
30 %
40 %
50 %
60 %
Ditch Rock cutting Lighting column, utility
pole
Tree Culvert, minor road junction
Guardrail Underpassing road
Stone Bridge support Stream, lake etc.
Other
Distribution of severe ROR-accidents on undivided roadsFinland: 80…100 km/h main roads, Sweden: 70…90 km/h roads
Finland 1994-1996 Sweden 1993-1997
0 %
10 %
20 %
30 %
40 %
50 %
60 %
Ditch Rock cutting Lighting column, utility
pole
Tree Culvert, minor road
junction
Guardrail Underpassing road
Stone Bridge support
Stream, lake etc.
Other
Distribution of single injury accidentsSweden: 70 and 90 km/h roads
70 km/h 90 km/h
Safety of roadside area 15 RUN-OFF-THE-ROAD ACCIDENTS IN SCANDINAVIA
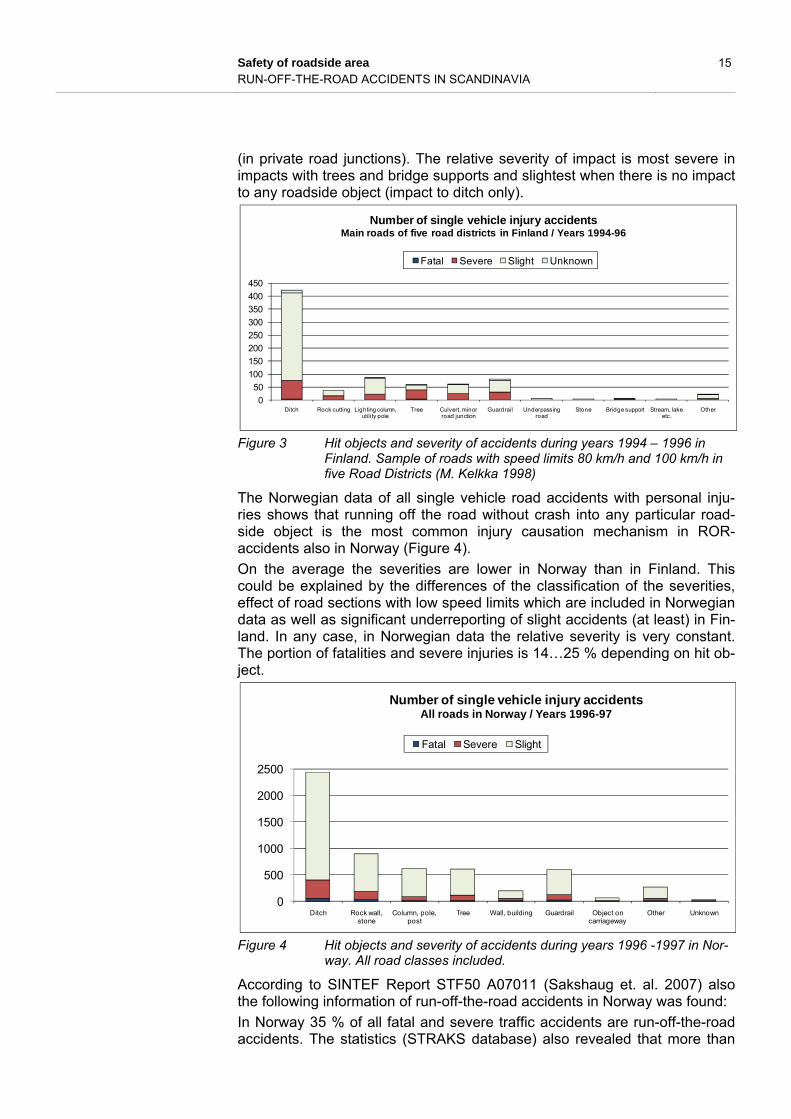
(in private road junctions). The relative severity of impact is most severe in impacts with trees and bridge supports and slightest when there is no impact to any roadside object (impact to ditch only).
Figure 3 Hit objects and severity of accidents during years 1994 – 1996 in
Finland. Sample of roads with speed limits 80 km/h and 100 km/h in five Road Districts (M. Kelkka 1998)
The Norwegian data of all single vehicle road accidents with personal inju-ries shows that running off the road without crash into any particular road-side object is the most common injury causation mechanism in ROR-accidents also in Norway (Figure 4).
On the average the severities are lower in Norway than in Finland. This could be explained by the differences of the classification of the severities, effect of road sections with low speed limits which are included in Norwegian data as well as significant underreporting of slight accidents (at least) in Fin-land. In any case, in Norwegian data the relative severity is very constant. The portion of fatalities and severe injuries is 14…25 % depending on hit ob-ject.
Figure 4 Hit objects and severity of accidents during years 1996 -1997 in Nor-
way. All road classes included.
According to SINTEF Report STF50 A07011 (Sakshaug et. al. 2007) also the following information of run-off-the-road accidents in Norway was found:
In Norway 35 % of all fatal and severe traffic accidents are run-off-the-road accidents. The statistics (STRAKS database) also revealed that more than
0
50
100
150
200
250
300
350
400
450
Ditch Rock cutting Lighting column, utility pole
Tree Culvert, minor road junction
Guardrail Underpassing road
Stone Bridge support Stream, lake etc.
Other
Number of single vehicle injury accidentsMain roads of five road districts in Finland / Years 1994-96
Fatal Severe Slight Unknown
0
500
1000
1500
2000
2500
Ditch Rock wall, stone
Column, pole, post
Tree Wall, building Guardrail Object on carriageway
Other Unknown
Number of single vehicle injury accidentsAll roads in Norway / Years 1996-97
Fatal Severe Slight

16 Safety of roadside area RUN-OFF-THE-ROAD ACCIDENTS IN SCANDINAVIA
20 % fatal or severe injuries are due to crashes into roadside obstacles. The detailed accident analysis showed that actually slightly higher percentage, 25 % of all fatalities and severe injured road users have been drivers or oc-cupants in cars hitting a roadside obstacle. In 80 % of those accidents the obstacle had been worsening the injury. The following results are valid for accidents where the obstacle had been worsening the injury:
41 % of the roadside obstacles have been stones/rocks/rock cuts and 31 % trees.
In 3 % of the accidents (2 accidents), a motorcyclist was injured against a guardrail.
49 % of the obstacles were located closer than 3 meters from road-way edge, and 13 % more than 8 meters away.
Approximately 1/4 of the obstacles have been located outside the safety zone given by the road standards.
On the other hand, 3/4 of the obstacles have been located inside the safety zone.
45 % of the vehicles ran off the road on the outside of a curve, 9 % on the inside and 42 % on straight road sections. Most of the ob-stacles located more than 6 meters away from roadway edge were standing on the outside of a curve.
Table 1. Fatalities and severe injuries in crashes into roadside obstacles in Norway during years 2000-2001. Crashes into ditches without hitting any obstacle are not included (Sakshaug et. al. 2007)
Hit obstacle Vehicle type
Total Light Heavy Moped Mc All other
Traffic sign support 16 1 5 1 23
Wooden lighting column 10 2 1 1 1 15
Steel lighting column 18 2 1 21
Other pole/post 12 1 1 6 20
Tree 104 9 5 3 121
Guardrail, fence 60 7 4 28 1 100
Wall, building 23 1 1 4 29
Stone, rock, rock cutting 115 9 2 8 3 137
Curb 18 1 8 27
Parked vehicle 5 1 1 7
Obstacle on carriageway 1 1
Other 51 2 2 18 2 75
Hit obstacle, total 432 34 12 85 13 576 Portion of all fatalities and severe injuries in traffic 25% 25% 11% 24% 2% 20% Number of all fatalities and severe injuries 1738 134 107 350 572 2901
The proportion of run-offs to ditches and down the embankments can be es-timated from previous figures. If the total proportion of ROR-accidents is 35 % and proportion of crashes into roadside obstacles is between 20…25 % then the proportion of other run-offs is roughly 30…40 % of all ROR-accidents.

Safety of roadside area 17 RUN-OFF-THE-ROAD ACCIDENTS IN SCANDINAVIA
2.2 Fatal accidents
The numbers of fatal run-off-the-road accidents in Finland are based on the report of fatal run-off-the-road accidents in Finland (Kelkka 2002) and analy-sis of corresponding accident data sample created at Helsinki University of Technology (TKK) (Kelkka and Laakso 2008). This data sample called later TKK database of fatal accidents is based on the accident database of fatal motor vehicle accidents which is organized and maintained by the Traffic Safety Committee of Insurance Companies (VALT).
TKK database of fatal accidents:
- based originally on coded data of VALT database and VALT accident reports made by fatal accidents’ investigation teams
- representativeness is almost 100 % - years 1994-99 - basically all road types and classes - includes additional data collected and analysed from VALT accident
reports - altogether 455 fatal run-off-the-road accidents
In Figure 5 there are presented the hit objects in fatal accidents on Finnish and Swedish single carriageway public roads. Because of different time pe-riods the distributions of fatal accidents are calculated. There are more fatal tree crashes in Sweden than in Finland. There are also more fatalities in ditch-accidents in Sweden than in Finland. Altogether, trees and ditches are two most common hit objects in fatal accidents in both countries.
Particularly in Finland, it seems that at private road junctions the culverts which are parallel to the travel lanes are very common hit objects (figures 5 and 6). These specific constructions must be taken into account in design of side ditches.
Figure 5 Distributions of hit objects in fatal run-off-the-road accidents in
Finland during years 1994-1999 and in Sweden during years 1997-2000. (TKK database of fatal accidents, Swedish Road Administration 2002).
0 %
5 %
10 %
15 %
20 %
25 %
30 %
35 %
40 %
45 %
Tre
e
Ditc
h
Po
le, p
ost,
sup
port
Cu
lve
rt, p
riva
te ju
nct
ion
Gu
ard
rail
Sto
ne
Ro
ck c
utti
ng
Bri
dge
pie
r
Un
de
rpas
sin
g ro
ad
Riv
er,
lake
etc
.
Bu
ildin
g, w
all,
fen
ce
Distribution of hit roadside objects in fatal ROR-accidents on public roads (motorways excluded)
Finland, years 1994-1999 Sweden, years 1997-2000

18 Safety of roadside area RUN-OFF-THE-ROAD ACCIDENTS IN SCANDINAVIA
Figure 6 Parallel drainage culvert at recently built minor road junction (photo:
Marko Kelkka)
2.3 Accidents in some other European countries
In EC-funded RISER-project the accident data of run-off-the-road accidents was collected from seven countries. Data included all ROR-accidents in sin-gle carriageway main roads during years 1999-2002. When looking at the results of hit objects it can be seen that there are great differences in the frequency of the object types.
The distribution of RISER injury (fatal, serious, slight) SVA for category hit object is for none object hit between 6 % (France) and 40 % (Spain), for tree between 9 % (Spain) and 33 % (Netherlands), for post between 6 % (France) and 15 % (Great Britain), for safety barrier between 2 % (Spain) and 30 % (Sweden), for ditch between 10 % (Great Britain) and 37 % (Finland), for other natural object between < 1 % (Great Britain) and 10 % (Sweden), for other man made structure it is between 2 % (Great Britain) and 22 % (Sweden), the remaining are unknown or other (19, Figure 7).
For the category ‘hit object’ only data for barrier impact was available for the Austrian statistics.

Safety of roadside area 19 ENCROACHMENT SPEEDS AND ANGLES
Table 2. Hit objects in single vehicle accidents on single carriageway main roads during years 1999-2002. RISER database (Hoschopf 2005).
Hit object RISER injury (fatal, serious, slight) SVA
SWE FIN AUT FRA ESP GB NL Total
None 141 2 812 27 208 3 754 4 052 37 967
Tree 675 140 7 978 5 777 3 488 4 597 22 655
Post 421 153 2 754 3 714 1 412 8 454
Safety Barrier 1 000 145 1 950 10 298 1 288 4 745 2 040 21 466
Ditch 502 14 935 10 405 2 350 28 192
Other natural object 334 36 799 19 163 1 351
Other man made structure 748 256 4 597 6 902 511 964 13 978
Other 193 3 417 15 968 5 716 528 22 825
Total 3 371 1 376 1 950 43 791 68 347 24 297 13 756 156 888
Figure 7 Frequency of hit objects in single vehicle accidents on single car-
riageway main roads during years 1999-2002. RISER database (Hoschopf 2005).
3 ENCROACHMENT SPEEDS AND ANGLES
3.1 General
In this chapter some results of recent research dealing with run-off-the-road accidents is presented. The goal is to deepen the knowledge and the way of thinking of encroachment incident and give some background information related to the full-scale crash tests and simulations.
RISER INJURY (FATAL, SERIOUS, SLIGHT) SVA PER HIT OBJECT
10%6%
40%
15%
29%24%
20%
10% 18%
8%
14%
33%
14%
12% 11% 6%
15%
10%
5%
30%
11%
100%
24%
20%
15%
14%
36%
34%
15%
10%18%10%
3%22%
19%10%
10%
7%
9%
6%
23% 24%
4%
15%
0%
10%
20%
30%
40%
50%
60%
70%
80%
90%
100%
1 SWE 3 FIN 4 AUT 5 FRA 6 ESP 7 GB 8 NL Total
1 None 2 Tree 3 Post 4 Safety Barrier 5 Ditch 6 Other natural object 7 Other man made structure 9 Other

20 Safety of roadside area ENCROACHMENT SPEEDS AND ANGLES
Results of the trajectories and positions of the errant vehicles deal mainly with Finnish main road network where the ditch profile on existing roads on 1990’s was 1:3/1:2 (single carriageway roads) or 1:4/1:2 (motorways). How-ever, results of some essential incidents like e.g. true distributions of the final vehicle positions are only indicative because of the high underreporting in single vehicle accident statistics. It is evident that great number of accidents without rollover or severe injuries is missing from the police data and to-gether with insufficient content of available accident data it shows that some details and events in run-off-the-road incidents still need more research.
Following results are to the appropriate extent taken into account in valida-tion of the test parameters as well as in the analysis of the results of the full-scale tests and simulations.
3.2 Driving conditions before running off the road
3.2.1 Risk drivers included
Most of the run-off-the-road accidents occur in good road conditions. Out of 455 fatal run-off-the-road accidents 293 (64 %) occurred in dry road condi-tions during summer (Figure 8). During winter time in such conditions oc-curred 26 accidents (6 %). All together in dry conditions took place 70 % of fatal run-off-the-road accidents. In snowy or slushy and icy conditions oc-curred 57 accidents (13 %). So in most cases the cause of running-off-the-road is other than difficult driving conditions or slippery road surface (M. Kelkka 2002).
Figure 8 Fatal run-off-the-road accidents vs. road conditions. All fatal single
vehicle accidents in Finland during years 1994-1999 (Kelkka 2002).
3.2.2 Risk drivers excluded
In recent study the “crash violence“ within the traffic system was investigated (Kelkka et al. 2006). The data was based on fatal motor vehicle accidents on Finnish single carriageway main roads investigated by the fatal road acci-
0
50
100
150
200
250
300
Dry, summer Dry, winter Wet Snowy or slushy
Icy Snowy, wheel ruts
clear of snow
Unknown
Safety of roadside area 21 ENCROACHMENT SPEEDS AND ANGLES
dent investigation teams during years 1996-2003. Accidents due to alcohol, failure to wear seatbelts and speeding were excluded, as were those due to sickness or categorised as suicidal. The most harmful event was investi-gated to be a crash into the ditch or rollover in the ditch in only four of all the run-off cases (11 % of all fatalities in single vehicle accidents, N=35) (Kelkka et al. 2006)
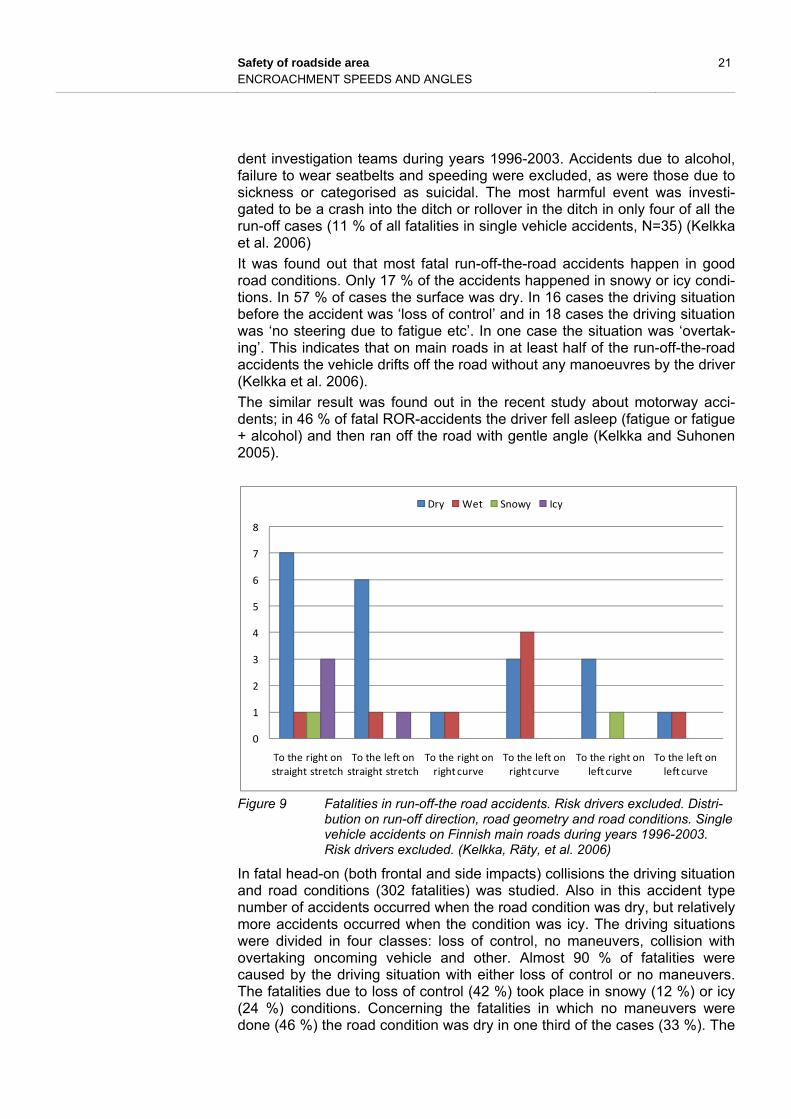
It was found out that most fatal run-off-the-road accidents happen in good road conditions. Only 17 % of the accidents happened in snowy or icy condi-tions. In 57 % of cases the surface was dry. In 16 cases the driving situation before the accident was ‘loss of control’ and in 18 cases the driving situation was ‘no steering due to fatigue etc’. In one case the situation was ‘overtak-ing’. This indicates that on main roads in at least half of the run-off-the-road accidents the vehicle drifts off the road without any manoeuvres by the driver (Kelkka et al. 2006).
The similar result was found out in the recent study about motorway acci-dents; in 46 % of fatal ROR-accidents the driver fell asleep (fatigue or fatigue + alcohol) and then ran off the road with gentle angle (Kelkka and Suhonen 2005).
Figure 9 Fatalities in run-off-the road accidents. Risk drivers excluded. Distri-
bution on run-off direction, road geometry and road conditions. Single vehicle accidents on Finnish main roads during years 1996-2003. Risk drivers excluded. (Kelkka, Räty, et al. 2006)
In fatal head-on (both frontal and side impacts) collisions the driving situation and road conditions (302 fatalities) was studied. Also in this accident type number of accidents occurred when the road condition was dry, but relatively more accidents occurred when the condition was icy. The driving situations were divided in four classes: loss of control, no maneuvers, collision with overtaking oncoming vehicle and other. Almost 90 % of fatalities were caused by the driving situation with either loss of control or no maneuvers. The fatalities due to loss of control (42 %) took place in snowy (12 %) or icy (24 %) conditions. Concerning the fatalities in which no maneuvers were done (46 %) the road condition was dry in one third of the cases (33 %). The
0
1
2
3
4
5
6
7
8
To the right on straight stretch
To the left on straight stretch
To the right on right curve
To the left on right curve
To the right on left curve
To the left on left curve
Dry Wet Snowy Icy

22 Safety of roadside area ENCROACHMENT SPEEDS AND ANGLES
over-taking accidents cover only 3 % and others 9 % of the fatalities (Kelkka, Räty, et al. 2006).
Figure 10 Comparison of drivers’ manoeuvres and road conditions in fatal two-
vehicle head-on collisions: number of fatalities on Finnish single-carriageway main roads during years 1996-2003. Risk drivers ex-cluded. (Kelkka, Räty, et al. 2006)
This result indicates that also in ROR-accidents the main cause of the run-ning off the road in good road conditions (summer) is that no maneuvers are done prior to accident (possibly because of fatigue). In these cases the ve-hicle drifts off the roadway in small angle. In snowy or icy road conditions the main cause is loss of control. Then the vehicle may skid if there is no elec-tronic stability control system (ESC) in use. In these cases the side impact is possible.
3.3 Initial stage of running off the road
3.3.1 Direction and position of the vehicle
In VALT database of all fatal accidents there is collected and coded “the be-haviour of vehicle”. Among code alternatives are running straight to the left or right, turning to the left/right and skidding to the left/right which can be considered as side-slip. The variable ‘behaviour of vehicle’ was checked from 396 accident reports (incl. sketches and photographs) for input to the TKK database of fatal accidents (figure 11). No driver depending limitations were done.
0
20
40
60
80
100
120
Dry Wet Snowy Icy Other
Over‐taking Loss of control No manouveres Other

Safety of roadside area 23 ENCROACHMENT SPEEDS AND ANGLES
Figure 11 Behaviour of the vehicle in the beginning of running off the road.
Straight means the tangential direction of the road in the curve. How-ever it is possible that turn left/right includes also corresponding cases. The data is based on database of the fatal ROR-accidents on all type of roads. N=396. Coding is originally done in VALT, checking of reported movements of vehicle is made at Helsinki University of Technology (Kelkka and Laakso 2008)
If the vehicle was coded as ‘side-slip’ the checking gave the same result. But, if the coding was ’turning to the right’ or ’turning to the left’, the vehicle in many cases was actually skidding (Figure 11). The vehicle had skidded in about half of the cases. The side impacts are more severe than head-on col-lisions so in the data such cases are obviously overrepresented (Kelkka and Laakso 2008).
ROR-accidents occur most often on straight stretches of road (figure 12). In 60…70 % of the personal injury accidents the vehicle runs to the right and in 30…40 % of cases to the left.
0 %
10 %
20 %
30 %
40 %
50 %
60 %
70 %
straight turn to the right/left skidding (sideslip)
Coded
Checked

24 Safety of roadside area ENCROACHMENT SPEEDS AND ANGLES
Figure 12 Direction of the vehicle in run-off-the-road accidents on public single
carriageway main roads in Finland. Sample of police reported single vehicle accidents (injury, fatal) on Finnish main roads during years 1994-96: N=411 accidents. RISER database: N=1439 accidents.(M. Kelkka 1998, Hoschopf 2005)
In Figure 13 there are shown the distributions of run-off directions in both Finnish and Swedish fatal accidents. Both accident data are based on in-depth studies. It is interesting that in Sweden the portions of right and left run-offs are almost equal (52 % / 48 %), whereas in Finland more vehicles tend to run off to the right (61 %).
However, it is more significant to notice that compared with all injury acci-dents (Figure 12) the fatal accidents occur more often in curves. This indi-cates that the risk of severe injuries increases together with increasing en-croachment angle. The consequences are then evidently more often rollover or crash against tree with high speed.
Figure 13 Direction of the vehicle in fatal run-off-the-road accidents on public
single carriageway main roads in Sweden (N=290) and Finland (N=291). (Swedish Road Administration 2002, TKK database of fatal accidents).
0 %
10 %
20 %
30 %
40 %
50 %
60 %
70 %
To the right, straight
To the right, right curve
To the right, left curve
To the left, straight
To the left, right curve
To the left, left curve
Sample of five FinnRA Road Districts, years 1994‐96
RISER / Finland, years 1999‐2003
0 %
5 %
10 %
15 %
20 %
25 %
30 %
35 %
To the right, straight
To the right, right curve
To the right, left curve
To the left, straight
To the left, right curve
To the left, left curve
Sweden; fatal accidents in 1997 ‐ 2000
Finland; fatal accidents in 1991 ‐ 1996
Safety of roadside area 25 ENCROACHMENT SPEEDS AND ANGLES
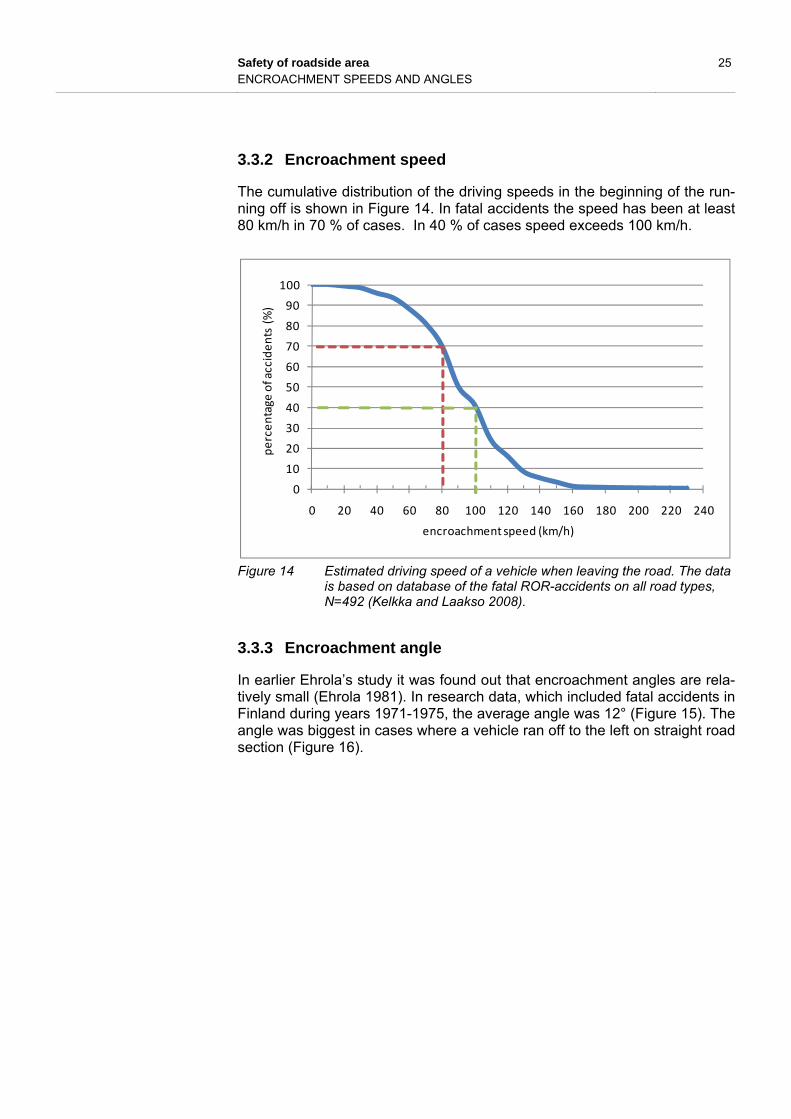
3.3.2 Encroachment speed
The cumulative distribution of the driving speeds in the beginning of the run-ning off is shown in Figure 14. In fatal accidents the speed has been at least 80 km/h in 70 % of cases. In 40 % of cases speed exceeds 100 km/h.
Figure 14 Estimated driving speed of a vehicle when leaving the road. The data
is based on database of the fatal ROR-accidents on all road types, N=492 (Kelkka and Laakso 2008).
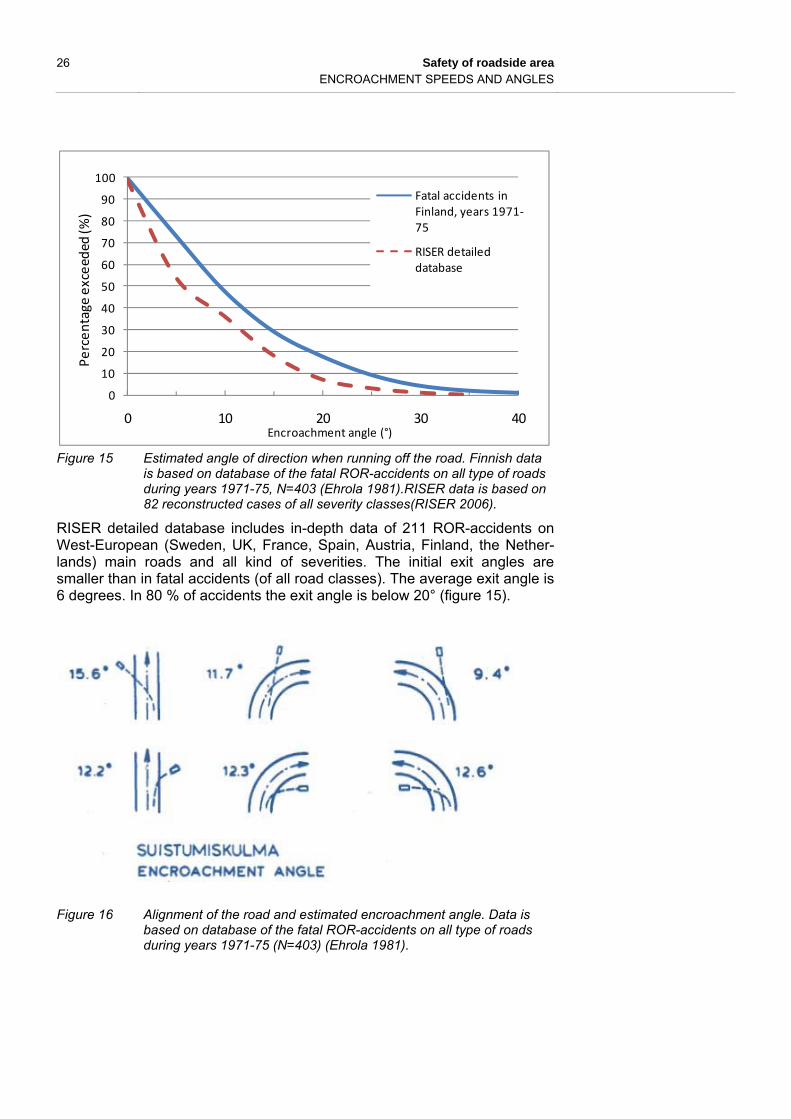
3.3.3 Encroachment angle
In earlier Ehrola’s study it was found out that encroachment angles are rela-tively small (Ehrola 1981). In research data, which included fatal accidents in Finland during years 1971-1975, the average angle was 12° (Figure 15). The angle was biggest in cases where a vehicle ran off to the left on straight road section (Figure 16).
0
10
20
30
40
50
60
70
80
90
100
0 20 40 60 80 100 120 140 160 180 200 220 240
percentage
of accidents (%)
encroachment speed (km/h)
26 Safety of roadside area ENCROACHMENT SPEEDS AND ANGLES
Figure 15 Estimated angle of direction when running off the road. Finnish data
is based on database of the fatal ROR-accidents on all type of roads during years 1971-75, N=403 (Ehrola 1981).RISER data is based on 82 reconstructed cases of all severity classes(RISER 2006).
RISER detailed database includes in-depth data of 211 ROR-accidents on West-European (Sweden, UK, France, Spain, Austria, Finland, the Nether-lands) main roads and all kind of severities. The initial exit angles are smaller than in fatal accidents (of all road classes). The average exit angle is 6 degrees. In 80 % of accidents the exit angle is below 20° (figure 15).
Figure 16 Alignment of the road and estimated encroachment angle. Data is
based on database of the fatal ROR-accidents on all type of roads during years 1971-75 (N=403) (Ehrola 1981).
0
10
20
30
40
50
60
70
80
90
100
0 10 20 30 40
Percentage
exceeded
(%)
Encroachment angle (°)
Fatal accidents in Finland, years 1971‐75
RISER detailed database

Safety of roadside area 27 ENCROACHMENT SPEEDS AND ANGLES
Figure 17 Estimated angle of direction when running off the road. Data is based
on database of the fatal ROR-accidents on all type of roads during years 1991-96 (N=208). Estimation and measurements are done from sketches or photographs (tracks, position of vehicle) which are in-cluded in the investigation teams’ accidents reports (Kelkka and Laakso 2008).
The more recent data in TKK database of fatal accidents proves that there has happened a change in the averages of angles in 20 years. The average angle when running off to the right is 9,0° and the average angle when run-ning off to the left is 9,5° (Figure 17 and Figure 18). In 40 % of cases the en-croachment angle exceeds 10° and in only 10 % of cases the encroachment angle exceeds 15°. Only in 3 % of cases the angle exceeds 20°.
Figure 18 Cumulative distributions of estimated angles of direction when leaving
the road. Data is based on database of the fatal ROR-accidents on all type of roads during years 1991-96 (N=208) (Kelkka and Laakso 2008).
0
2
4
6
8
10
12
14
16
18
20
‐27‐22‐18‐17‐16‐15‐14‐13‐12‐11‐10 ‐9 ‐8 ‐7 ‐6 ‐5 ‐4 ‐3 ‐2 ‐1 1 2 3 4 5 6 7 8 9 10 11 12 13 14 15 17 18 19 20 22 23 25 29
Num
ber of accidents
Encroachment angle (°) left(‐) / right
0
10
20
30
40
50
60
70
80
90
100
0 10 20 30
Percentage
exceeded (%
)
Encroachment angle (°)
right side
left side

28 Safety of roadside area ENCROACHMENT SPEEDS AND ANGLES
The field study of encroachment angles was carried out at Helsinki Univer-sity of Technology in order to find out the angles due to lose of control. The results of small sample show that on average the angles are steeper than those presented above (see Appendix 2). The reason for that is that in field study the focus was on encroachments due to slippery road in wintertime and the accidents due to fatigue were missing. In accidents due to fatigue it is more common that a vehicle drifts off the road with gentle angle.
3.4 Trajectory of the vehicle after running off the road
3.4.1 Position of the vehicle
In most police reported cases (66 %, Finnish main roads during years 1994-1996, sample of 409 single vehicle accidents) there is no evidence of any particular impact to the backslope (Table 3). In one third of the police reports of the cases it could be concluded if the vehicle crashed into the backslope. If there was an impact to the backslope the vehicle overturned onto its roof or side in 49 % of the cases. If there was no impact the vehicle overturned in 72 % of the cases. The latter result is obvious because the data includes only accidents which caused personal injuries. More interesting is that in half of the crashes into the backslope (data covers the main roads with speed limits 80…120 km/h) the car also overturned. There are two main reasons for overturning; rollover in the slope and crash into the slope (M. Kelkka 1998).

Safety of roadside area 29 ENCROACHMENT SPEEDS AND ANGLES
Table 3. Movements of the vehicle during/after the encroachment. Only the accidents in which only the contact with the ditch contributed to the fi-nal position. Sample of police reported single vehicle accidents (in-jury, fatal) on Finnish main roads during years 1994-96.N=409. (M. Kelkka 1998).
Crash into the back-slope
Position of the vehicle 2-lane main road Motorway Total
Unknown
Unknown 72 13 85
No side-slip or rollover 5 1 6
Side-slip, on wheels 13 3 16
Onto left or right side 31 3 34
Rollover (roof impact) 115 13 128
Sum 236 33 269
Yes
Unknown 17 5 22
No side-slip rollover 6 0 6
Side-slip, on wheels 10 1 11
Onto left or right side 4 1 5
Rollover (roof impact) 30 2 32
Sum 67 9 76
No
Unknown 5 2 7
No side-slip or rollover 11 0 11
Side-slip, on wheels 0 0 0
Onto left or right side 10 1 11
Rollover (roof impact) 28 7 35
Sum 54 10 64
Total 357 52 409
3.4.2 Location of the vehicle
On single carriageway main roads the location of the errant vehicle is most often in the ditch when it comes to rest. These results (Table 4) are from Finnish police data which covers the sample of personal injury accidents during years 1994-1996. It is assumed that ‘back to the road’ –cases are un-derreported. The ditch profile on single carriageway main roads is usually v-ditch 1:3/1:2 and on motorways (built before middle of 90’s) 1:4/1:2. If the recovering vehicles are not taken into account it seems that on single car-riageway main roads about in 20 % of cases the errant vehicle runs beyond the ditch. On motorways (right side) the portion is slightly higher, but still about 20 %. (M. Kelkka 1998).

30 Safety of roadside area ENCROACHMENT SPEEDS AND ANGLES
Table 4. Location of the vehicle after encroachment. Sample of police reported single vehicle accidents (injury, fatal) on Finnish main roads during years 1994-96. N=449. (M. Kelkka 1998).
2-lane undivided main roads Most harmful hit object
Final location of the vehicle Ditch/slope
, n=229 Tree, n=37 Culvert1,
n=38 Boulder,
n=5 Total, n=379
In the side ditch 78 % 54 % 84 % 20 % 76 %
Beyond the side ditch 15 % 46 % 11 % 80 % 18 %
Back onto the roadway 7 % - 5 % - 6 %
Total 100 % 100 % 100 % 100 % 100 %
Motorways Most harmful hit object
Final location of the vehicle Ditch/slope
, n=64 Tree, n=6 Culvert1,
n=0 Boulder,
n=0 Total, n=70
In the side ditch 48 % 50 % - - 49 %
Beyond the side ditch 13 % 50 % - - 16 %
Back onto the roadway (from the side ditch)
8 % - - - 7 %
On the median 17 % - - - 16 %
Back onto the roadway (from the median)
3 % - - - 3 #
Crossed the median 11 % - - - 10 5
Total 100 % 100 % - - 100 %
1 culvert: extension of main road side ditch in case of minor road junction
3.4.3 Run-off-the-road distances
Longitudinal distances
On single carriageway main roads the longitudinal run-off distances are in 60 % of cases at least 50 m outside of travelled way and in 25 % of cases at least 100 m (the sum of the longitudinal run-off distances on the ditch slopes and behind the ditch). On motorways the distances are much longer (figures 19 and 20). These figures are based on the cases where an errant vehicle has not crashed into any other object but slope or ground. If the crashes into other fixed or natural obstacles were included the distances would be shorter (M. Kelkka 1998).
In figure 21 there is shown the run-off distance in the ditch before a vehicle travels over the ditch and in figure 22 the travelling distances beyond the ditch. It can be seen that the distances are relatively long also in these cases. (M. Kelkka 1998).

Safety of roadside area 31 ENCROACHMENT SPEEDS AND ANGLES
Figure 19 Longitudinal travel distances of errant vehicles on motorways (n=15)
and single carriageway main roads (n=77). No hits to any fixed or natural objects reported. Sample of police reported single vehicle ac-cidents (injury, fatal) on Finnish main roads during years 1994-96. (M. Kelkka 1998).
Figure 20 Longitudinal travel distances of errant vehicles which remain in the V-ditch (profile typically 1:3/1:2). No hits to any fixed or natural objects reported. Sample of police reported single vehicle accidents (injury, fatal) on Finnish main roads during years 1994-96. N=51. (M. Kelkka 1998).
0 %
20 %
40 %
60 %
80 %
100 %
0 50 100 150 200 250
Motorway Undivided main road
Motorway Undivided main road
0 %
20 %
40 %
60 %
80 %
100 %
0 50 100 150 200
distribution of vehicles
Longitudinal distance in the ditch (m)
32 Safety of roadside area ENCROACHMENT SPEEDS AND ANGLES
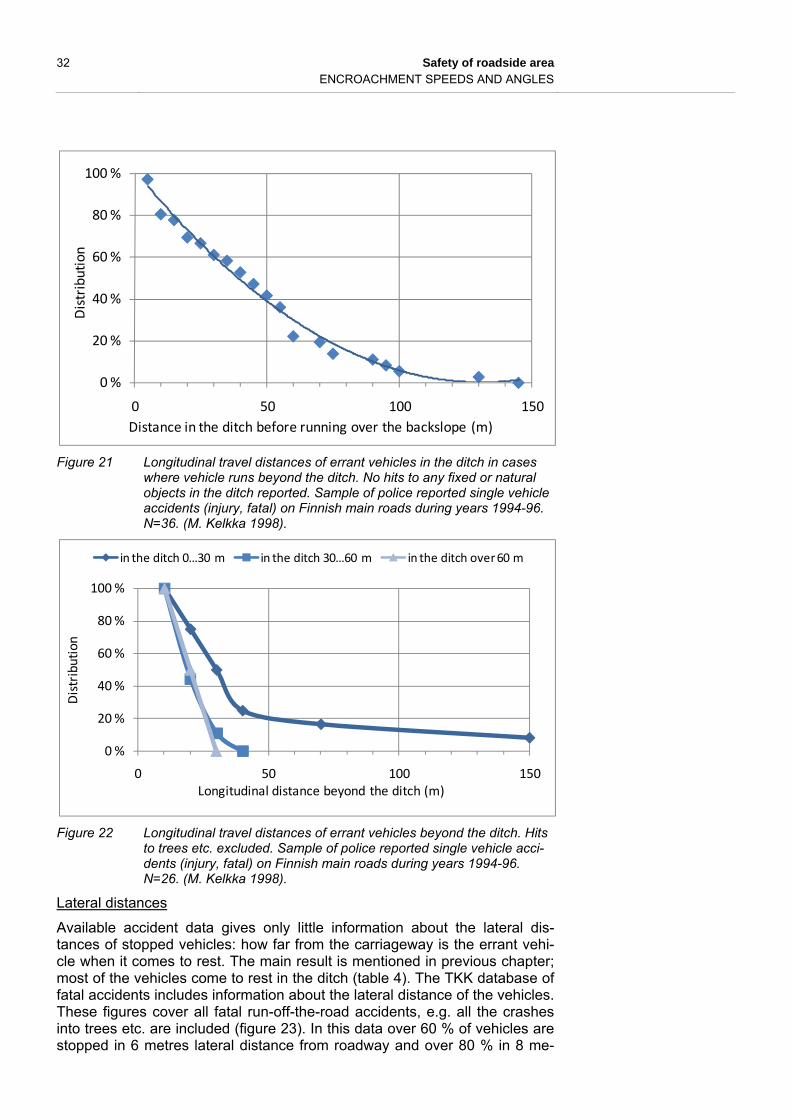
Figure 21 Longitudinal travel distances of errant vehicles in the ditch in cases where vehicle runs beyond the ditch. No hits to any fixed or natural objects in the ditch reported. Sample of police reported single vehicle accidents (injury, fatal) on Finnish main roads during years 1994-96. N=36. (M. Kelkka 1998).
Figure 22 Longitudinal travel distances of errant vehicles beyond the ditch. Hits to trees etc. excluded. Sample of police reported single vehicle acci-dents (injury, fatal) on Finnish main roads during years 1994-96. N=26. (M. Kelkka 1998).
Lateral distances
Available accident data gives only little information about the lateral dis-tances of stopped vehicles: how far from the carriageway is the errant vehi-cle when it comes to rest. The main result is mentioned in previous chapter; most of the vehicles come to rest in the ditch (table 4). The TKK database of fatal accidents includes information about the lateral distance of the vehicles. These figures cover all fatal run-off-the-road accidents, e.g. all the crashes into trees etc. are included (figure 23). In this data over 60 % of vehicles are stopped in 6 metres lateral distance from roadway and over 80 % in 8 me-
0 %
20 %
40 %
60 %
80 %
100 %
0 50 100 150
Distribution
Distance in the ditch before running over the backslope (m)
0 %
20 %
40 %
60 %
80 %
100 %
0 50 100 150
Distribution
Longitudinal distance beyond the ditch (m)
in the ditch 0…30 m in the ditch 30…60 m in the ditch over 60 m

Safety of roadside area 33 ENCROACHMENT SPEEDS AND ANGLES
tres distance from roadway. It has to be taken into account that these cases are fatal accidents, so there has to be rollover or violent crash which causes fatal injuries.
Figure 23 Final lateral distance of the vehicle after running off the road. Data is based on database of the fatal ROR-accidents on all type of roads (N=148). Hits to the roadside obstacles are included (Kelkka and Laakso 2008).
In database of police reported injury accidents there were a few ‘crossed the V-ditch’ -cases in which it was possible to find out the lateral distances. When all the cases with hit to anything else but ground (ditch, slopes) were excluded only 14 cases were left (figure 24). This curve gives a rough esti-mate that 50 % of vehicles that go over the backslope stop in 10 metres lat-eral distance from carriageway and 90 % of vehicles stop in 20 m lateral dis-tance from carriageway.
According to sample data of injury leading single vehicle accidents the por-tion of errant vehicles travelling beyond the ditch is less than one fifth (table 4). Together with the rollovers and crashes in the ditch (shown in the table 4) this indicates that on single carriageway main roads with v-ditches (1:3/1:2) more than 90 % of errant vehicles might stop in 10 m lateral distance from carriageway even without any crash.
0
5
10
15
20
25
30
0 1 2 3 4 5 6 7 8 9 10 11 12 14 15 17 18 20 23 30
Number of accidents
Lateral distance (m)

34 Safety of roadside area ENCROACHMENT SPEEDS AND ANGLES
Figure 24 Lateral extent of those errant vehicles only that travel beyond the
roadside ditch. Data is based on database of the injury ROR-accidents on main roads with speed limits 80…120 km/h (N=14). All cases with hits to any roadside obstacles are excluded. (Kelkka and Laakso 2008).
Respectively, In Geometric Design Guide for Canadian Roads, published by Transportation Association of Canada (TAC), there is presented that in 80 % of all encroachments the vehicles could stay in the clear zone of 10 metres. In the encroachment probability curve the effects of road class, vehicle speeds or slope design are not specified (Hildebrand et al. 2007).
Figure 25 Lateral extent of errant vehicle without crash into any fixed object. TAC encroachment probability curve in Geometric Design Guide for Canadian Roads (Hildebrand et al. 2007).
0,0
0,2
0,4
0,6
0,8
1,0
0 10 20 30 40 50
Distribution of vehicles beyond the ditch
Lateral distance from the carriageway (m)
0
0,1
0,2
0,3
0,4
0,5
0,6
0,7
0,8
0,9
1
0 2 4 6 8 10 12 14 16 18 20
Porbability of exceedence
Lateral extent of encroachment (m)

Safety of roadside area 35 ENCROACHMENT SPEEDS AND ANGLES
In AASHTO Roadside Design Guide the curves are presented separately for single and dual carriageway roads. On single carriageway roads the prob-ability of lateral extent over 10 metres is 10 % (figure 26).
Figure 26 Lateral extent of errant vehicle without crash into any fixed object.
Encroachment probability curve in Roadside Design Guide (AASHTO 2002).
3.5 Effect of Electronic Stability Control (ESC)
Most new cars are equipped with ESC (car manufacturers use brand names like ESP). ESC tends to prevent sideslip of the vehicle but cannot prevent running off the road due to too high speed in the curve or missing steering manoeuvres.
In Swedish study the effectiveness of ESC was estimated based on the real-life road accidents in Sweden during years 1998 – 2004. It was estimated that the effectiveness of ESC for severe and fatal loss-of-control type crashes on wet roads is 56.2 ± 23.5 % and on icy or snowy roads 49.2 ± 30.2 % (Lie et.al. 2006). This means that 16…20 % of all road fatalities could be saved if all cars had ESC.
In Finnish study of fatal accidents during years 2000 – 2006 there was esti-mated if ESC could have prevented an accident or if ESC could have had “significant effect” on the consequences on an accident (Tuononen, Sainio and Hartikainen 2007). In 18 % of fatal accidents ESC would have prevented the accident. Furthermore, in 8 % of cases ESC would have had significant effect on accident, for instance enabling head-on collision instead of side-impact. The effectiveness of ESC in run-off-the-road accidents would have been even 36 %. This means that every third fatal single accident could be avoided if all cars had ESC (compared to situation when none of existing cars had ESC).

36 Safety of roadside area FULL-SCALE TESTS
These results together with previous research results (Kelkka et al. 2006) indicate that ESC will reduce especially loss-of control accidents. One con-clusion could be that the portion of run-off-the road accidents with no yawing or side-slip will increase. These accidents occur mostly on dry or wet sur-face.
4 FULL-SCALE TESTS
4.1 Full-scale tests in TKK’s crash test area at Pori airport
4.1.1 General
During years 2000 – 2001 altogether 16 full-scale tests were carried out by Helsinki University of Technology (TKK). The test track is located at Pori air-port in western Finland.
The test series was financed by Finnish Road Administration (FinnRA) and planned by FinnRA, Swedish Road Administration and Chalmers University of Technology. The tests were part of FinnRA S12 Strategic Programme for Improvement Solutions for Main Roads.
The aim of the test series was to find answers to following questions:
How high onto backslope the obstacle (sign support, bridge pier, rock cutting) should be positioned without risk of impact of errant vehicle and therefore no need for installing the guardrail?
How gentle should the foreslope be to avoid the risk of rollover?
How sharp bottom of V-ditch should be allowed without risk of roll-over or severe crash into backslope?
What is the effect of rounding of the bottom of the ditch on the roll-over or run-off distance of the errant vehicle?
What is the effect of the rounding of the hip of shoulder and foreslope on probability of rollover in foreslope?
Very common risk factor is that a vehicle runs off into the ditch and hits the structures of the minor road (culvert or steep slope). For this reason very detailed solution for the culverts and embankment slopes of minor roads was tested. Could the slope made of wooden columns prevent severe consequences caused by the crash into the minor road structures?
The test conditions and results are reported with more details in FinnRA Re-port 8/2003 (FinnRA 2003).
4.1.2 Ditch profiles
Most tests were driven to typical old V-ditch profile with 1:3 foreslope and 1:2 backslope. The idea was to run the tests with one ditch profile and later simulate first the same test conditions (calibration of the simulation model) and then also other ditch profiles. These simulations were carried out by Chalmers University of Technology.
In addition to tests of V-ditch two other ditch tests were conducted: one into U-ditch with rounded bottom and one into V-ditch with concrete barrier on

Safety of roadside area 37 FULL-SCALE TESTS
the backslope. The purpose of latter was to test one possible solution to pre-vent the errant vehicle to drift beyond the ditch.
The soil in the slopes was gravel. In the bottom of the V-ditch the subsoil (clay) of the test site was uncovered. Both gravel slopes and clay in the bot-tom of the ditch were relatively stiff. The wheel ruts caused by test vehicles could be seen but the depths of the ruts were very small.
In U-ditch the rounding was built by using loose crushed aggregate. The wheel ruts were little bit deeper in the crushed aggregate than in the slopes.
In the tests of wooden slope for the minor junction the ditch profile was v-ditch with foreslope 1:3 and backslope 1:2.
Figure 27 Tested ditch profiles in TKK’s full-scale tests in Pori (FinnRA 2003).

38 Safety of roadside area FULL-SCALE TESTS
Figure 28 Tested V-ditch at Pori test site (FinnRA 2003).
Figure 29 Tested wooden slope for the minor road junctions (FinnRA 2003).
Safety of roadside area 39 FULL-SCALE TESTS
4.1.3 Results
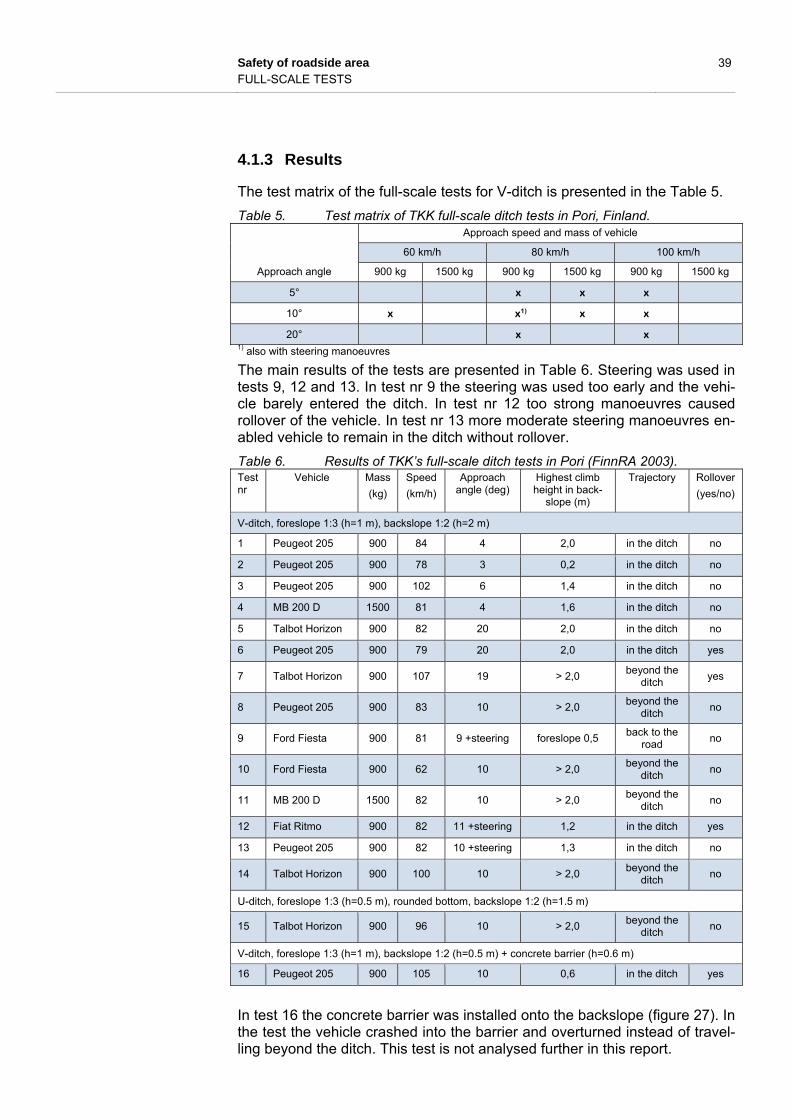
The test matrix of the full-scale tests for V-ditch is presented in the Table 5.
Table 5. Test matrix of TKK full-scale ditch tests in Pori, Finland.
Approach angle
Approach speed and mass of vehicle
60 km/h 80 km/h 100 km/h
900 kg 1500 kg 900 kg 1500 kg 900 kg 1500 kg
5° x x x
10° x x1) x x
20° x x 1) also with steering manoeuvres
The main results of the tests are presented in Table 6. Steering was used in tests 9, 12 and 13. In test nr 9 the steering was used too early and the vehi-cle barely entered the ditch. In test nr 12 too strong manoeuvres caused rollover of the vehicle. In test nr 13 more moderate steering manoeuvres en-abled vehicle to remain in the ditch without rollover.
Table 6. Results of TKK’s full-scale ditch tests in Pori (FinnRA 2003). Test nr
Vehicle Mass
(kg)
Speed
(km/h)
Approach angle (deg)
Highest climb height in back-
slope (m)
Trajectory Rollover
(yes/no)
V-ditch, foreslope 1:3 (h=1 m), backslope 1:2 (h=2 m)
1 Peugeot 205 900 84 4 2,0 in the ditch no
2 Peugeot 205 900 78 3 0,2 in the ditch no
3 Peugeot 205 900 102 6 1,4 in the ditch no
4 MB 200 D 1500 81 4 1,6 in the ditch no
5 Talbot Horizon 900 82 20 2,0 in the ditch no
6 Peugeot 205 900 79 20 2,0 in the ditch yes
7 Talbot Horizon 900 107 19 > 2,0 beyond the
ditch yes
8 Peugeot 205 900 83 10 > 2,0 beyond the
ditch no
9 Ford Fiesta 900 81 9 +steering foreslope 0,5 back to the
road no
10 Ford Fiesta 900 62 10 > 2,0 beyond the
ditch no
11 MB 200 D 1500 82 10 > 2,0 beyond the
ditch no
12 Fiat Ritmo 900 82 11 +steering 1,2 in the ditch yes
13 Peugeot 205 900 82 10 +steering 1,3 in the ditch no
14 Talbot Horizon 900 100 10 > 2,0 beyond the
ditch no
U-ditch, foreslope 1:3 (h=0.5 m), rounded bottom, backslope 1:2 (h=1.5 m)
15 Talbot Horizon 900 96 10 > 2,0 beyond the
ditch no
V-ditch, foreslope 1:3 (h=1 m), backslope 1:2 (h=0.5 m) + concrete barrier (h=0.6 m)
16 Peugeot 205 900 105 10 0,6 in the ditch yes
In test 16 the concrete barrier was installed onto the backslope (figure 27). In the test the vehicle crashed into the barrier and overturned instead of travel-ling beyond the ditch. This test is not analysed further in this report.

40 Safety of roadside area FULL-SCALE TESTS
Four tests were conducted to test the wooden slope as an impact attenuator for parallel drainage culverts. Standard EN1317-3 was adapted for this test series. The mass of the test vehicle was 900 kg and the approach speed was 80 km/h. In the first test the vehicle bounced into the air and fell down beyond the minor road junction without crash or rollover. In other tests the front corner of the vehicle hit the ground after the flight and the vehicle over-turned.
4.2 Full-scale tests in VTI’s test area in Linköping.
4.2.1 General
In November 2000 four full-scale tests to the ditch were carried out by Swed-ish National Road and Transport Research Institute (VTI). Two of the tests were performed to V-ditch and two to U-ditch. The test track is located at Linköping, in the immediate vicinity of the main office of VTI.
The test conditions and results are reported with more details in VTI Report 14-2006 (Vänell 2006).
4.2.2 Ditch profiles
First two tests were performed to the V-ditch which profile was basically identical to the one in TKK’s tests. Last two tests were performed to the U-ditch.
The foreslope was built according to the SNRA regulations for installing the guardrail onto the slope. The soil in the foreslope was compacted gravel (grading 0…32 mm) till vertical depth of 0.8 m. Thickness of the gravel layer was 0.2 m. Also the lower part of the foreslope as well as the backslope was basically no compacted gravel (0…32 mm). The filling for rounding of the U-ditch was also same gravel as in the foreslope. The depth of the rounded U-ditch was 0.7 m and width of the rounding was 2.8 metres.
The ditch profiles are presented in Figures 30 and 31.
Figure 30 V-ditch profile in VTI’s full-scale tests

Safety of roadside area 41 SIMULATIONS
Figure 31 U-ditch profile in VTI’s full-scale tests
4.2.3 Results
In V-ditch tests the vehicle crashed heavily into the backslope and over-turned. In U-ditch tests the vehicle crossed the ditch without rollover (Table 7).
Table 7. Results of VTI’s full-scale ditch tests in Linköping, Sweden. (Vänell 2006)
Test nr Vehicle Mass
(kg)
Speed
(km/h)
Approach an-gle (deg)
Crash into back-slope (yes/no)
Trajectory Rollover
(yes/no)
V-ditch, foreslope 1:3 (h=1 m), backslope 1:2 (h=2 m)
11-02-1 Ford Fiesta
908 80 10 yes in the ditch yes
11-02-2 Volvo 244
1453 80 10 yes in the ditch yes
U-ditch, foreslope 1:3 (h=0.7 m), rounded bottom, backslope 1:2 (h=1.7 m)
11-08-1 Volvo 244
1461 80 10 no (slight contact) on top of
backslope no
11-08-2 Ford Fiesta
932 81 10 no beyond the
ditch no
5 SIMULATIONS
5.1 Simulations within the project
In addition to full-scale crash tests the series of simulations were carried out by financing of Norwegian, Swedish and Finnish Road Administrations. Force Technology Norway AS was chosen to carry out all the simulations. In first stage in spring 2007 altogether 24 simulations to evaluate the safety of side ditches, slopes and terminations were performed – ten of those to V-ditch with slopes 1:3/1:2 (figure 32). Unlinear finite element program LS-Dyna was used for these simulations.
In June 2008 the second stage with 50 new simulations was started. Simula-tions included recommended additional simulations of already tested ditch profiles and also one new ditch profile (See Appendix 1: test matrix). Dy-Mesh computer model was used for these simulations.
In total 74 simulations and 24 full-scale crash tests were performed for the analysis of roadside area.
42 Safety of roadside area SIMULATIONS
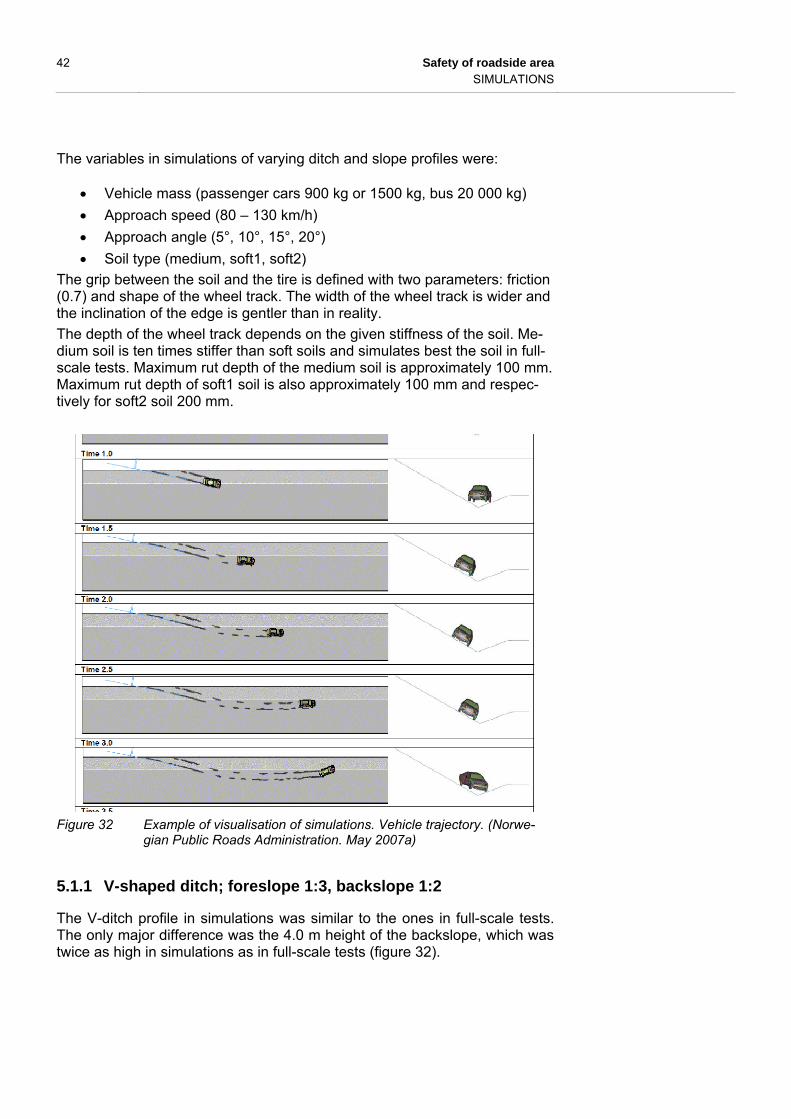
The variables in simulations of varying ditch and slope profiles were:
Vehicle mass (passenger cars 900 kg or 1500 kg, bus 20 000 kg)
Approach speed (80 – 130 km/h)
Approach angle (5°, 10°, 15°, 20°)
Soil type (medium, soft1, soft2)
The grip between the soil and the tire is defined with two parameters: friction (0.7) and shape of the wheel track. The width of the wheel track is wider and the inclination of the edge is gentler than in reality.
The depth of the wheel track depends on the given stiffness of the soil. Me-dium soil is ten times stiffer than soft soils and simulates best the soil in full-scale tests. Maximum rut depth of the medium soil is approximately 100 mm. Maximum rut depth of soft1 soil is also approximately 100 mm and respec-tively for soft2 soil 200 mm.
Figure 32 Example of visualisation of simulations. Vehicle trajectory. (Norwe-
gian Public Roads Administration. May 2007a)
5.1.1 V-shaped ditch; foreslope 1:3, backslope 1:2
The V-ditch profile in simulations was similar to the ones in full-scale tests. The only major difference was the 4.0 m height of the backslope, which was twice as high in simulations as in full-scale tests (figure 32).

Safety of roadside area 43 SIMULATIONS
Figure 33 Profile of V-ditch used in simulations (Norwegian Public Roads Ad-
ministration. May 2007a)
The parameters included varying approach angle, approach speed, soil stiff-ness and vehicle types. The summary of chosen test parameters, arrange-ments and results is presented in Table 8.
Table 8. Summary of simulations of vehicle trajectories in V-ditch. First stage of simulations (LS-Dyna). (Norwegian Public Roads Administration. May 2007a)
Test nr
Vehicle mass (kg)
Approach speed (km/h)
Approach angle (deg)
Soil type Trajectory
A1 900 100 10 Medium Back onto road
A2 1500 80 10 Medium Sideslip, rollover
A3 1500 100 10 Medium Sideslip, back onto road
A4 900 100 10 Soft 1 In the ditch
A5 900 100 15 Medium In the ditch, rollover
A6 1500 80 10 Soft 2 In the ditch, rollover
A7 900 100 10 Soft 2 In the ditch, heavy yawing
A8 1500 130 10 Medium In the ditch, heavy yawing
A9 900 80 10 Soft 2 In the ditch
A10 20 000 90 10 Medium Overturning in backslope
5.1.2 Other modifications of V-ditch
Run-offs to other ditch profiles than traditional V-ditch or U-ditch were also simulated. The profiles of these ditches are shown in figures 34 and 35, and the summary of these tests is presented in tables 9-14.
Two tests were performed into V-ditch with modified backslope. In the first test the angle was 15° (B1) and in the second test the angle was 10° ‘(B2).

44 Safety of roadside area SIMULATIONS
Figure 34 Ditch profile with modified backslope used in simulations (Norwegian
Public Roads Administration May 2007b)
In ditch model C there is a narrow flat bottom and alternative gradients and heights for the backslope. There is also a vertical wall on the top of the backslope, which could be considered as a rock cutting.
Figure 35 Ditch profile with flat bottom used in simulations (Norwegian Public
Roads Administration June 2008)
Safety of roadside area 45 SIMULATIONS
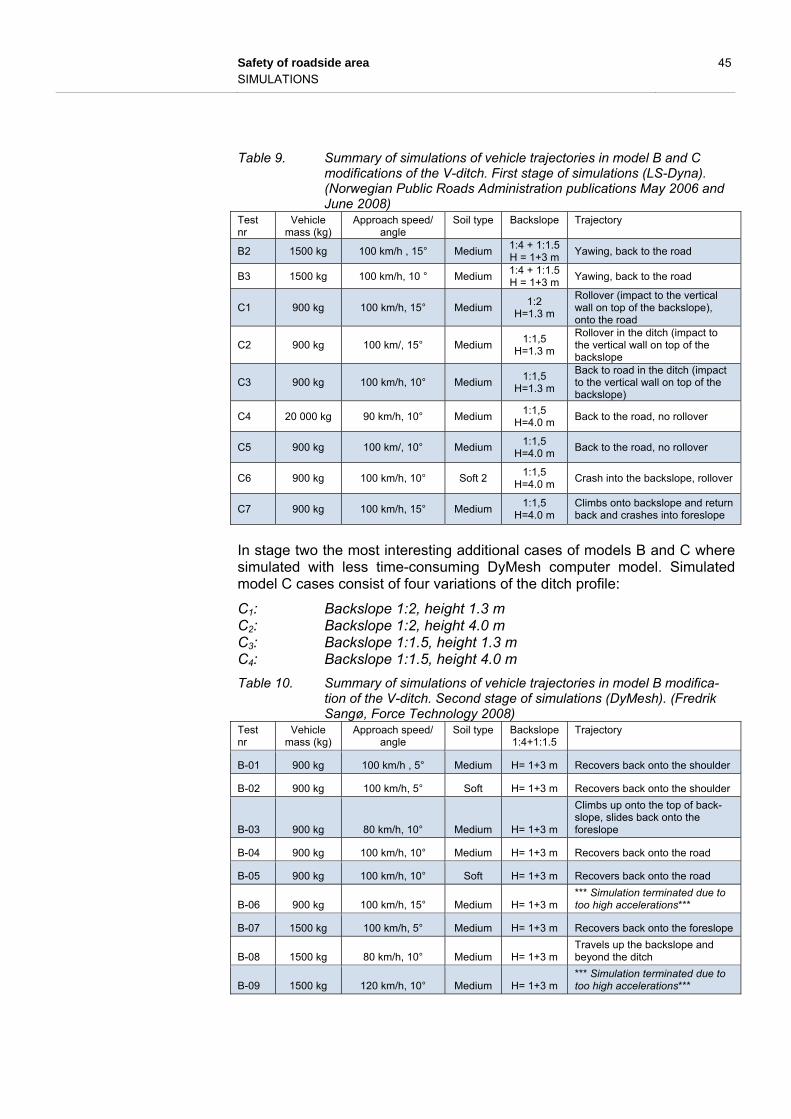
Table 9. Summary of simulations of vehicle trajectories in model B and C modifications of the V-ditch. First stage of simulations (LS-Dyna). (Norwegian Public Roads Administration publications May 2006 and June 2008)
Test nr
Vehicle mass (kg)
Approach speed/ angle
Soil type Backslope Trajectory
B2 1500 kg 100 km/h , 15° Medium 1:4 + 1:1.5 H = 1+3 m
Yawing, back to the road
B3 1500 kg 100 km/h, 10 ° Medium 1:4 + 1:1.5 H = 1+3 m
Yawing, back to the road
C1 900 kg 100 km/h, 15° Medium 1:2
H=1.3 m
Rollover (impact to the vertical wall on top of the backslope), onto the road
C2 900 kg 100 km/, 15° Medium 1:1,5
H=1.3 m
Rollover in the ditch (impact to the vertical wall on top of the backslope
C3 900 kg 100 km/h, 10° Medium 1:1,5
H=1.3 m
Back to road in the ditch (impact to the vertical wall on top of the backslope)
C4 20 000 kg 90 km/h, 10° Medium 1:1,5
H=4.0 m Back to the road, no rollover
C5 900 kg 100 km/, 10° Medium 1:1,5
H=4.0 m Back to the road, no rollover
C6 900 kg 100 km/h, 10° Soft 2 1:1,5
H=4.0 m Crash into the backslope, rollover
C7 900 kg 100 km/h, 15° Medium 1:1,5
H=4.0 m Climbs onto backslope and return back and crashes into foreslope
In stage two the most interesting additional cases of models B and C where simulated with less time-consuming DyMesh computer model. Simulated model C cases consist of four variations of the ditch profile:
C1: Backslope 1:2, height 1.3 m C2: Backslope 1:2, height 4.0 m C3: Backslope 1:1.5, height 1.3 m C4: Backslope 1:1.5, height 4.0 m
Table 10. Summary of simulations of vehicle trajectories in model B modifica-tion of the V-ditch. Second stage of simulations (DyMesh). (Fredrik Sangø, Force Technology 2008)
Test nr
Vehicle mass (kg)
Approach speed/ angle
Soil type Backslope 1:4+1:1.5
Trajectory
B-01 900 kg 100 km/h , 5° Medium H= 1+3 m Recovers back onto the shoulder
B-02 900 kg 100 km/h, 5° Soft H= 1+3 m Recovers back onto the shoulder
B-03 900 kg 80 km/h, 10° Medium H= 1+3 m
Climbs up onto the top of back-slope, slides back onto the foreslope
B-04 900 kg 100 km/h, 10° Medium H= 1+3 m Recovers back onto the road
B-05 900 kg 100 km/h, 10° Soft H= 1+3 m Recovers back onto the road
B-06 900 kg 100 km/h, 15° Medium H= 1+3 m *** Simulation terminated due to too high accelerations***
B-07 1500 kg 100 km/h, 5° Medium H= 1+3 m Recovers back onto the foreslope
B-08 1500 kg 80 km/h, 10° Medium H= 1+3 m Travels up the backslope and beyond the ditch
B-09 1500 kg 120 km/h, 10° Medium H= 1+3 m *** Simulation terminated due to too high accelerations***

46 Safety of roadside area SIMULATIONS
Table 11. Summary of simulations of vehicle trajectories in model C1 modifica-tion of the V-ditch. Second stage of simulations (DyMesh). (Fredrik Sangø, Force Technology 2008)
Test nr
Vehicle mass (kg)
Approach speed/ angle
Soil type Backslope 1:2
Trajectory
C1-01 900 kg 80 km/h , 10° Medium H= 1.3 m
Hits the wall on the top of the backslope, returns back into the ditch, no rollover or side-slip
C1-02 900 kg 100 km/h, 10° Medium H= 1.3 m
Hits the wall on the top of the backslope, returns back into the ditch, no rollover or side-slip
C1-03 900 kg 100 km/h, 10° Soft H= 1.3 m
Hits the wall on the top of the backslope, returns back toward the road
C1-04 1500 kg 100 km/h, 5° Medium H= 1.3 m Travels along the bottom of the ditch, no rollover, no side-slip
C1-05 1500 kg 80 km/h, 10° Medium H= 1.3 m
Hits the wall on the top of the backslope, returns back into the ditch, no rollover or side-slip
C1-06 1500 kg 100 km/h, 10° Medium H= 1.3 m
Hits the wall on the top of the backslope, returns back into the ditch, no rollover or side-slip
C1-07 1500 kg 120 km/h, 10° Medium H= 1.3 m
Hits the wall on the top of the backslope, recovers back onto the carriageway
Table 12. Summary of simulations of vehicle trajectories in model C2 modifica-tion of the V-ditch. Second stage of simulations (DyMesh). (Fredrik Sangø, Force Technology 2008)
Test nr
Vehicle mass (kg)
Approach speed/ angle
Soil type Backslope 1:2
Trajectory
C2-01 900 kg 100 km/h , 5° Medium H= 4.0 m
Hits the wall on the top of the backslope, recovers back onto the carriageway
C2-02 900 kg 100 km/h, 5° Soft H= 4.0 m
Hits the wall on the top of the backslope, recovers back onto the carriageway
C2-03 900 kg 80 km/h, 10° Medium H= 4.0 m
Hits the wall on the top of the backslope, recovers back onto the carriageway
C2-04 900 kg 100 km/h, 10° Medium H= 4.0 m
Hits the wall on the top of the backslope, recovers back onto the carriageway
C2-05 900 kg 100 km/h, 10° Soft H= 4.0 m
Hits the wall on the top of the backslope, recovers back onto the carriageway
C2-06 900 kg 100 km/h, 15° Medium H= 4.0 m
Hits the wall on the top of the backslope, recovers back onto the carriageway
C2-07 1500 kg 100 km/h, 5° Medium H= 4.0 m Travels along the bottom of the ditch, no rollover, no side-slip
C2-08 1500 kg 80 km/h, 10° Medium H= 4.0 m Climbs on the backslope and returns into the ditch
C2-09 1500 kg 100 km/h, 10° Medium H= 4.0 m Climbs on the backslope and returns into the ditch
C2-10 1500 kg 120 km/h, 10° Medium H= 4.0 m
Hits the wall on the top of the backslope, recovers back onto the carriageway

Safety of roadside area 47 SIMULATIONS
Table 13. Summary of simulations of vehicle trajectories in model C3 modifica-tion of the V-ditch. Second stage of simulations (DyMesh). (Fredrik Sangø, Force Technology 2008)
Test nr
Vehicle mass (kg)
Approach speed/ angle
Soil type Backslope 1:1.5
Trajectory
C3-01 900 kg 100 km/h , 5° Medium H= 1.3 m
Hits the wall on the top of the backslope, recovers back onto the carriageway
C3-02 900 kg 100 km/h, 5° Soft H= 1.3 m
Hits the wall on the top of the backslope, recovers back onto the carriageway
C3-03 900 kg 80 km/h, 10° Medium H= 1.3 m
Hits the wall on the top of the backslope, returns back into the ditch, no rollover or side-slip
Table 14. Summary of simulations of vehicle trajectories in model C4 modifica-tion of the V-ditch. Second stage of simulations (DyMesh). (Fredrik Sangø, Force Technology 2008)
Test nr
Vehicle mass (kg)
Approach speed/ angle
Soil type Backslope 1:2
Trajectory
C4-01 900 kg 100 km/h , 5° Medium H= 4.0 m
Hits the wall on the top of the backslope, recovers back onto the carriageway
C4-02 900 kg 100 km/h, 5° Soft H= 4.0 m Hits the wall on the top of the backslope, overturns
C4-03 900 kg 80 km/h, 10° Medium H= 4.0 m
Hits the wall on the top of the backslope, recovers back onto the carriageway
C4-04 900 kg 100 km/h, 15° Medium H= 4.0 m
Hits the wall on the top of the backslope, recovers back onto the carriageway
C4-05 1500 kg 100 km/h, 5° Medium H= 4.0 m Travels along the bottom of the ditch, no rollover, no side-slip
C4-06 1500 kg 80 km/h, 10° Medium H= 4.0 m Travels along the bottom of the ditch, no rollover, no side-slip
C4-07 1500 kg 100 km/h, 10° Medium H= 4.0 m Travels along the bottom of the ditch, no rollover, no side-slip
C4-8 1500 kg 120 km/h, 10° Medium H= 4.0 m Travels along the bottom of the ditch, no rollover, no side-slip
5.1.3 Ditch with rounded bottom (U-ditch)
Seven tests into U-ditch were simulated in second stage with DyMesh. The profile differs slightly from the U-ditch profiles in full-scale tests: the depth of the ditch was 1.0 m and the bottom was rounded by radius of 2.0 m.
Figure 36 U-ditch profile used in simulations

48 Safety of roadside area SIMULATIONS
Table 15. Summary of simulations of vehicle trajectories in model U ditch (rounded bottom). Second stage of simulations (DyMesh). (Fredrik Sangø, Force Technology 2008)
Test nr
Vehicle mass (kg)
Approach speed/ angle
Soil type Backslope 1:2
Trajectory
U-01 900 kg 100 km/h , 5° Medium H= 4.0 m Recovers back onto the car-riageway, then again into ditch
U-02 900 kg 80 km/h, 10° Medium H= 4.0 m Recovers back onto roadway
U-03 900 kg 80 km/h, 20° Medium H= 4.0 m
***Simulation terminated due to too high accelerations*** => crashes into backslope
U-04 900 kg 100 km/h, 15° Medium H= 4.0 m Travels beyond the ditch
U-05 1500 kg 80 km/h, 10° Medium H= 4.0 m Travels beyond the ditch
U-06 1500 kg 100 km/h, 10° Medium H= 4.0 m Travels beyond the ditch
U-07 1500 kg 120 km/h, 10° Medium H= 4.0 m Recovers back onto roadway
5.1.4 Embankment slopes
The profile of model E is a pure embankment slope with no particular ditch included. The embankment is 4.0 metres high and the gradient of the slope is 1:3 (figure 37).
Figure 37 Embankment slope profile used in simulations (Norwegian Public
Roads Administration January 2007e)
In model F the carriageway is on 4 meter high embankment. The gradient of the slope is 1:4 which refers to the heaviest gradient of recoverable slope in Roadside Design Guide. There is a low flat-bottom ditch on the toe of the slope (figure 38).
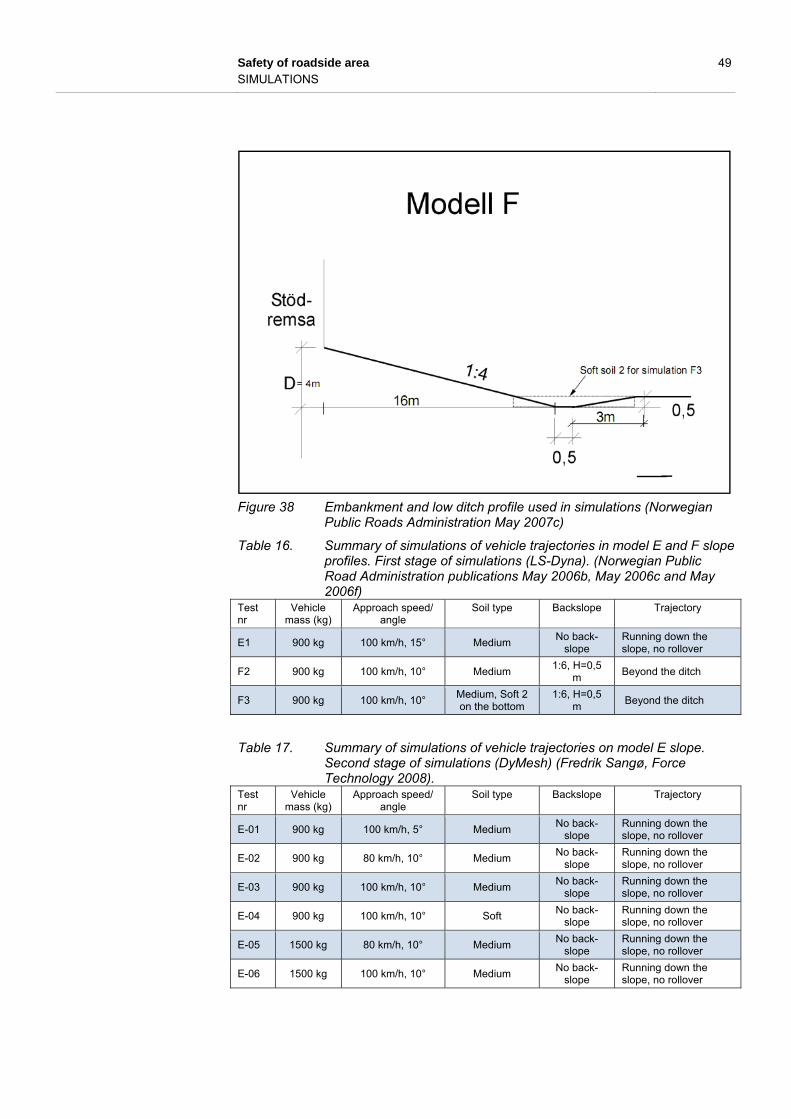
Safety of roadside area 49 SIMULATIONS
Figure 38 Embankment and low ditch profile used in simulations (Norwegian
Public Roads Administration May 2007c)
Table 16. Summary of simulations of vehicle trajectories in model E and F slope profiles. First stage of simulations (LS-Dyna). (Norwegian Public Road Administration publications May 2006b, May 2006c and May 2006f)
Test nr
Vehicle mass (kg)
Approach speed/ angle
Soil type Backslope Trajectory
E1 900 kg 100 km/h, 15° Medium No back-
slope Running down the slope, no rollover
F2 900 kg 100 km/h, 10° Medium 1:6, H=0,5
m Beyond the ditch
F3 900 kg 100 km/h, 10° Medium, Soft 2 on the bottom
1:6, H=0,5 m
Beyond the ditch
Table 17. Summary of simulations of vehicle trajectories on model E slope. Second stage of simulations (DyMesh) (Fredrik Sangø, Force Technology 2008).
Test nr
Vehicle mass (kg)
Approach speed/ angle
Soil type Backslope Trajectory
E-01 900 kg 100 km/h, 5° Medium No back-
slope Running down the slope, no rollover
E-02 900 kg 80 km/h, 10° Medium No back-
slope Running down the slope, no rollover
E-03 900 kg 100 km/h, 10° Medium No back-
slope Running down the slope, no rollover
E-04 900 kg 100 km/h, 10° Soft No back-
slope Running down the slope, no rollover
E-05 1500 kg 80 km/h, 10° Medium No back-
slope Running down the slope, no rollover
E-06 1500 kg 100 km/h, 10° Medium No back-
slope Running down the slope, no rollover

50 Safety of roadside area SIMULATIONS
5.1.5 Termination of V-ditch
Two simulated tests were conducted to test the effect of termination of the side ditch cased by minor road. In both tests the profile of the ditch was V-ditch with foreslope 1:3 and backslope 1:2. The termination was an earth slope (medium soil) with two alternative slopes D1 and D2 (figure 39).
Figure 39 V-ditch termination used in simulations (Norwegian Public Roads
Administration January 2007d)
On first test the vehicle has heavy contact with the sole (ASI > 1.0) before it travels up the slope and bounces into the air. On second test more gentle slope decreases ASI into acceptable level (Table 18).
Table 18. Summary of simulations of vehicle trajectories in model D ditch termi-nation profiles. First stage of simulations (LS-Dyna). (Norwegian Public Roads Administration January 2007d)
Test nr
Vehicle mass (kg)
Approach speed/ angle
Soil type Slope at termination
ASI Trajectory
D1 900 kg 80 km/h, 0° Medium 1:4 1.06 Jump into the height of 3.0 m
D2 900 kg 80 km/h, 0° Medium 1:6 0.58 Jump into the height of 2.0 m
5.2 Earlier simulations of bus running off the road onto the embankment slope
Due to very severe tourist bus run-off-the-road accident on highway E18 in January 2006 in Sweden the re-evaluation of slope design safety for heavy vehicles was carried out by Swedish road authorities. Five simulations with

Safety of roadside area 51 ANALYSIS OF THE TEST RESULTS
20 ton bus were performed: in three simulations the alternative slope de-signs were tested and in two simulations the safety barriers with different performance classes were tested (Table 19). In all the simulations the soil was expected to be not frozen.
Table 19. Summary of simulations of 20 ton bus running off the road. Speed 90 km/h, angle 10 deg. Road on embankment. (Swedish Road Administration 2007)
Simulation nr
Embankment slope
Ditch on the toe of the
slope
Safety barrier on shoulder
Trajectory
BUS1
H=4.5 m, upper part 1:6 (width 6 m), lower part 1:3 (width 10.5 m)
Depth 0.5 m, backslope 1:2
No Heavy crash into the back-slope of the ditch, vault, no rollover
BUS2 H=4.0 m, 1:3 Depth 0.5 m, backslope 1:2
No Heavy crash into the back-slope of the ditch, vault, no rollover
BUS3 H=6.0 m, 1:6 No No No crash, no rollover
BUS4 H=4.5 m, 1:2 No N2 (EN1317) Over the barrier, probable rollover on slope
BUS5 H=4.5 m, 1:2 No H2 (EN1317) Contains on the road
6 ANALYSIS OF THE TEST RESULTS
6.1 General
There are two main factors or mechanisms in run-off accidents which may cause severe consequences despite adaption of clear zone concept:
1) impact of the vehicle
2) rollover of the vehicle
Impact in the ditch may occur if the vehicle hits the backslope in certain posi-tion and angle. The severity of an impact depends on the deceleration of the vehicle, which may be evaluated by the change of the speed during the crash (delta-v), as well as passive safety of the vehicle, stiffness of the backslope and personal human tolerance to impact. It is well known that rollover increases the risk for severe injuries. Rollover and severe crash can both be involved also in the same accident. Usage of restraint systems (safety belt etc.) is essential in both cases when estimating the risk of severe injuries. Furthermore, there is always a risk of impact if an errant vehicle
1) runs beyond the ditch,
2) climbs higher onto the backslope than expected or
3) without control returns back onto the roadway.
If an errant vehicle travels beyond the ditch there is a significant risk of hit-ting a tree, rock or other hazardous obstacle. For this reason a traversable ditch may cause a significant risk although there is only minor risk of rollover or heavy impact in the ditch.

52 Safety of roadside area ANALYSIS OF THE TEST RESULTS
For ditches with high backslopes it is considered important to investigate the maximum climb height of errant vehicle. The question is that is it safe to lo-cate sign supports or other roadside infrastructure onto the backslope with-out significant risk of impact of an errant vehicle.
There is also always a risk of collision with another vehicle if an errant vehi-cle is able to come back onto the roadway. The worst scenario is that a ve-hicle comes back onto the road and collides with an oncoming vehicle. In real-life accidents it is also common that a vehicle is able to come back onto the road because of driver’s aggressive manoeuvre but for the same reason runs off to the other side of the road (multiple run-offs). That is why it is prob-lematic if the ditch or slope should be recoverable or not. Soil characteristics The characteristics of soil in the slope have a consistent influence on the ve-hicle’s behaviour when entering in ditch. In simulation three different types of foundation have been modelled: Medium soil, Soft1soil and Soft2 soil. (Norwegian Public Roads Administration. May 2007a). In the analysis Soft1 soil and Soft2 soil are merged and called soft soil. Being composed of stiff clay, soil at TKK’s crash test facility in Pori has been assessed as the stiffest. Soil at VTI crash test location is instead character-ized by a 0.2 m layer of compacted gravel. Simulated soil layers have been considered to roughly equally stiff (medium) or clearly softer (soft 1 and soft 2) than soils in full scale tests. The maximum track depth recorded in simula-tions varies in a range between 10-200 mm while wheel tracks during full scale tests could barely be seen. Figure 40 illustrates the scale adopted for comparing results from full scale tests and simulations.
Figure 40 Soil stiffness for both simulated and full-scale crash tests
6.2 Procedure
The goal of the analysis is to compare the safety of the tested ditch and em-bankment slope profiles. In the analyses a simple risk matrix is adapted for assessment of the level of risk of tested ditch profiles. The level of risk (threat level) is dependent on both probability of certain exposure to an inci-dent and severity of the consequences (impact) caused by an incident (fig-ure 41).
Pori soilVTI soilMedium
soilSoft1 soil
Soft2 soil
Softer Harder
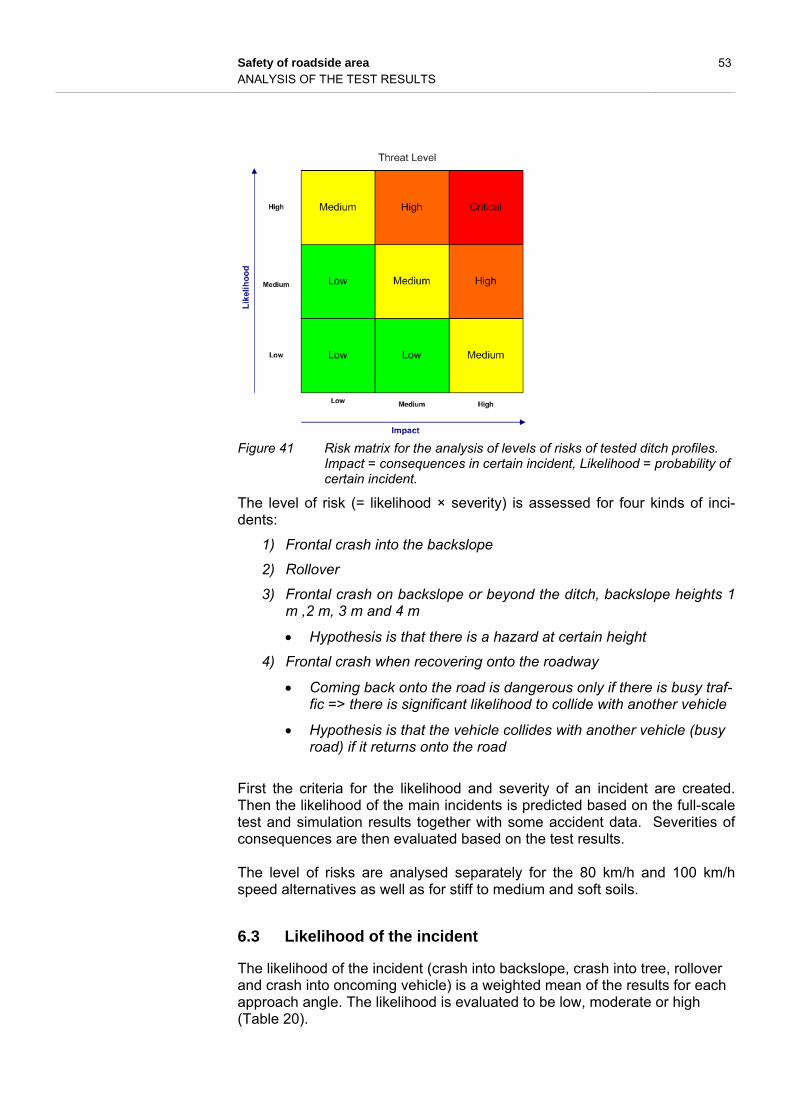
Safety of roadside area 53 ANALYSIS OF THE TEST RESULTS
Figure 41 Risk matrix for the analysis of levels of risks of tested ditch profiles.
Impact = consequences in certain incident, Likelihood = probability of certain incident.
The level of risk (= likelihood × severity) is assessed for four kinds of inci-dents:
1) Frontal crash into the backslope
2) Rollover
3) Frontal crash on backslope or beyond the ditch, backslope heights 1 m ,2 m, 3 m and 4 m
Hypothesis is that there is a hazard at certain height
4) Frontal crash when recovering onto the roadway
Coming back onto the road is dangerous only if there is busy traf-fic => there is significant likelihood to collide with another vehicle
Hypothesis is that the vehicle collides with another vehicle (busy road) if it returns onto the road
First the criteria for the likelihood and severity of an incident are created. Then the likelihood of the main incidents is predicted based on the full-scale test and simulation results together with some accident data. Severities of consequences are then evaluated based on the test results. The level of risks are analysed separately for the 80 km/h and 100 km/h speed alternatives as well as for stiff to medium and soft soils.
6.3 Likelihood of the incident
The likelihood of the incident (crash into backslope, crash into tree, rollover and crash into oncoming vehicle) is a weighted mean of the results for each approach angle. The likelihood is evaluated to be low, moderate or high (Table 20).

54 Safety of roadside area ANALYSIS OF THE TEST RESULTS
The distribution of the initial approach angles (see Figures 15 and 18) affect on the weighting of the results. It is assumed that the distribution for the ini-tial angles in running off the road accidents on 80…120 km/h roads is as fol-lows:
5 deg (<7.5°): 40 % 10 deg (7.5-12.5°): 35 % 15 deg (12.5-17.5°): 15 % 20 deg (>17.5°): 10 %
The likelihood of the incident is defined for all tested ditch and slope profiles, separately for two approach speeds (80 km/h, 100 km/h) and two soil types (medium/stiff, soft). Due to missing or inappropriate results in test matrixes several additional extrapolations and interpolations have been done. The likelihood of collision with another vehicle when coming back onto the carriageway is dependent on the traffic at the moment. In the analysis the worst scenario is estimated: heavy traffic and very obvious collision if an er-rant vehicle returns onto the road.
Table 20. Criteria for the likelihood of the incident for three main incidents caus-ing severe injuries in run-off-the-road accidents into the ditch
Incident
Likelihood of the incident
Low Moderate High
Slight or heavy crash into the backslope
Crash recognised: < 1/3 of cases
Crash recognised: 1/3…2/3 of cases
Crash recognised: > 2/3 of cases
Frontal crash into the tree or rigid pole
Travels up onto certain height: < 1/3 of cases
Travels up onto certain height: 1/3…2/3 of
cases
Travels up onto certain height: > 2/3 of cases
Rollover Risk of real or esti-
mated rollover: < 33 % (mean value)
Risk of real or esti-mated rollover: 33
%...67 % (mean value)
Risk of real or esti-mated rollover: > 67 %
(mean value)
Crash into the oncoming vehicle
Returns back onto carriageway:
< 1/3 of cases
Returns back onto carriageway:
1/3…2/3 of cases
Returns back onto carriageway:
> 2/3 of cases
6.4 Severity of an incident
6.4.1 Risk of injuries due to collision
Risk of occupant injury in collisions can be predicted by estimating the change in vehicle velocity (delta-v) during the crash event. Traditionally the values of delta-v in real world crashes have been estimated by measuring the post-crash damage of the vehicle. In recent studies the data of crash data recorders have been used instead for computing the delta-v.
According to the estimations based on damages in large sample of real-world crashes, in frontal collisions the risk of severe injuries for belted occu-pants starts to increase when delta-v exceeds 20 km/h. According to the same data the risk of fatality begins to increase when delta-v exceeds 40 km/h (Evans 1996, figure 42).
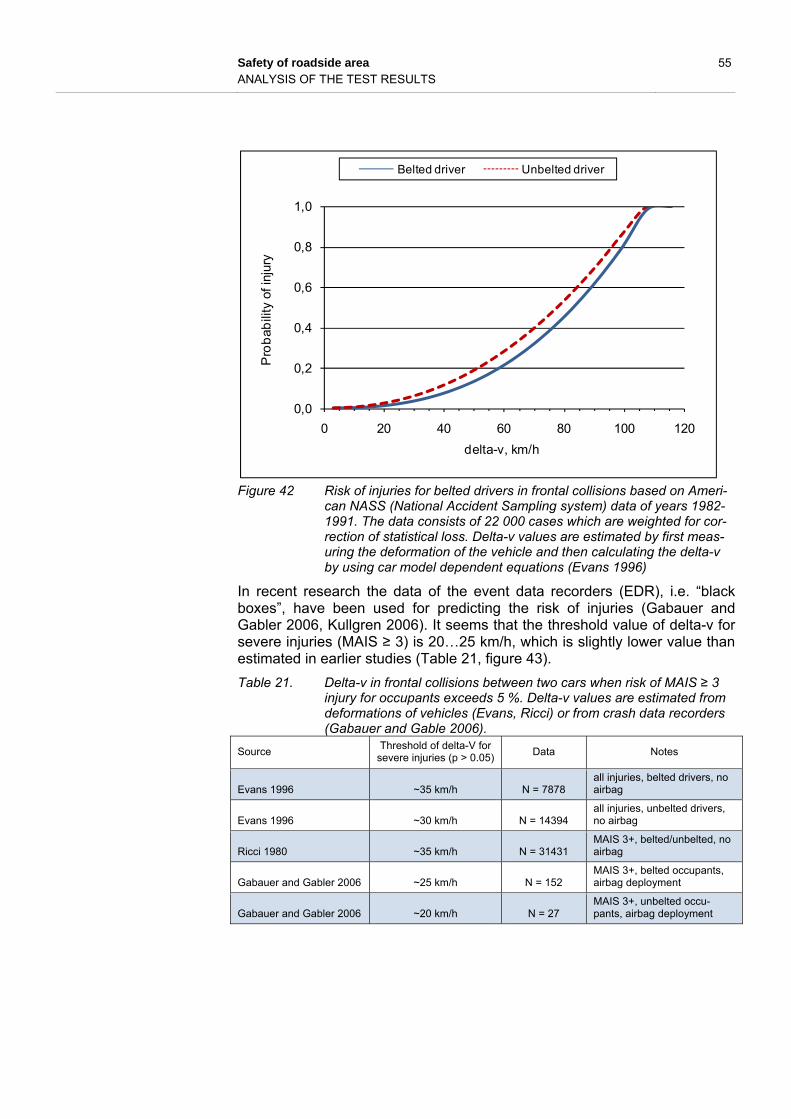
Safety of roadside area 55 ANALYSIS OF THE TEST RESULTS
Figure 42 Risk of injuries for belted drivers in frontal collisions based on Ameri-
can NASS (National Accident Sampling system) data of years 1982-1991. The data consists of 22 000 cases which are weighted for cor-rection of statistical loss. Delta-v values are estimated by first meas-uring the deformation of the vehicle and then calculating the delta-v by using car model dependent equations (Evans 1996)
In recent research the data of the event data recorders (EDR), i.e. “black boxes”, have been used for predicting the risk of injuries (Gabauer and Gabler 2006, Kullgren 2006). It seems that the threshold value of delta-v for severe injuries (MAIS ≥ 3) is 20…25 km/h, which is slightly lower value than estimated in earlier studies (Table 21, figure 43).
Table 21. Delta-v in frontal collisions between two cars when risk of MAIS ≥ 3 injury for occupants exceeds 5 %. Delta-v values are estimated from deformations of vehicles (Evans, Ricci) or from crash data recorders (Gabauer and Gable 2006).
Source Threshold of delta-V for
severe injuries (p > 0.05) Data Notes
Evans 1996 ~35 km/h N = 7878 all injuries, belted drivers, no airbag
Evans 1996 ~30 km/h N = 14394 all injuries, unbelted drivers, no airbag
Ricci 1980 ~35 km/h N = 31431 MAIS 3+, belted/unbelted, no airbag
Gabauer and Gabler 2006 ~25 km/h N = 152 MAIS 3+, belted occupants, airbag deployment
Gabauer and Gabler 2006 ~20 km/h N = 27 MAIS 3+, unbelted occu-pants, airbag deployment
0,0
0,2
0,4
0,6
0,8
1,0
0 20 40 60 80 100 120
Pro
bab
ility
of i
njur
y
delta-v, km/h
Belted driver Unbelted driver

56 Safety of roadside area ANALYSIS OF THE TEST RESULTS
Figure 43 Risk of severe injuries as a function of longitudinal delta-V (NOTE:
unit m/s, 10 m/s = 36 km/h). Only the cases with frontal collision, air-bag deployment and single crash event are included. Data from years 2000-2004, National Highway Traffic Safety Administration EDR Da-tabase (U.S). N=191 (158 belted and 33 unbelted front seat occu-pants). (Gabauer and Gabler 2006)
In side-impacts the risk of severe injuries is much higher than frontal colli-sions. Threshold of crash speed for severe injuries is approximately 10 km/h. On crash speeds 20…40 km/h the probability for severe injuries exceed 30 % and on crash speeds above 60 km/h the risk for severe injuries in side impact exceeds 90 % (Digges et al. 2006, Nordhoff 2005). Ditch crashes Based on the data of crash pulse recorders (event data recorders) there is shown that the average durations of the crash pulses are less than 10 % longer in single vehicle crashes than in crashes between two passenger cars (Stigson, Ydenius and Kullgren 2006). However, average mean accelera-tions and average peak accelerations during the crash are 20…25 % higher in two-vehicle crashes compared to single vehicle crashes into roadside area (impact to trees and other rigid objects excluded). This indicates that also threshold value for delta-v that causes severe injuries could be little bit higher in ditch crashes than in two-vehicle crashes. Furthermore, according to the data of crash pulse recorders, in addition to the peak acceleration also the average acceleration and average duration in the collisions with the deformable (weak-post) safety barriers are much closer to the ditch crashes than two-vehicle crashes. Therefore the test crite-ria for the safety barriers are adapted for the evaluation of ditch crashes. In later analysis it is assumed that the threshold value (p > 0.05) of delta-V to the severe injuries in frontal collisions is 30 km/h. It is also assumed that

Safety of roadside area 57 ANALYSIS OF THE TEST RESULTS
significant increase of risk for severe injuries for the restrained occupants occurs when delta-V exceeds 65 km/h. In crash tests and simulations ASI value (Acceleration Severity Index) is cal-culated from the acceleration data of the centre of gravity of the vehicle. Also THIV (Theoretical Head Impact Velocity, m/s) is calculated from the crash test data. In the European standard for the safety barriers (EN1317-2) the following criteria for ASI and THIV is adopted for approval (Table 22):
Table 22. Speed and acceleration related criteria in the EN-1317-2 norms for the crash testing of the safety barriers (CEN 1317-2, confirmed 1998)
Severity class Criteria
A ASI ≤ 1.0 THIV ≤ 33 km/h
B ASI ≤ 1.4
Crashes into trees and other fixed objects Impacts with various fixed objects cause majority of severe injuries in single vehicle accidents, as there is reported in chapter 2. First step in order to avoid both crashes and severe consequences is the adoption of safety zone concept. Despite this the risk of an impact exists if the errant vehicle climbs up the backslope or travels down the embankment slope. In Nordic countries most common hit obstacles beyond the ditch are trees, stones and rock walls. As hazards beyond the ditch the trees account a vast majority of the hit obstacles leading to severe injuries or death. The relative severity of impact to an object is illustrated in figure 44. Com-parison of these hazards with ditch as a crash object highlights that on aver-age it is significantly more dangerous to crash against tree or rock than stay in the ditch. In this conclusion it is assumed that there are no crash objects like culverts of minor road junctions in the ditch.
Figure 44 Distribution of injury severities vs. hit object in run-off accidents
(n=782, main roads of five road districts in Finland 1994-96). Acci-dents with only property damage are not included (Kelkka 1998).
The average mean acceleration has been found to be similar in crashes into fixed objects, e.g. trees, compared with two-vehicle crashes (Stigson, Ydenius and Kullgren 2006). This indicates that delta-v criteria presented
0 % 10 % 20 % 30 % 40 % 50 % 60 % 70 % 80 % 90 % 100 %
Ditch
Rock cutting
Lighting column, utility pole
Tree
Culvert, minor road junction
Guardrail
Underpassing road
Stone
Bridge support
Stream, lake etc.
Other
Fatal Severe, moderate Slight Unknown

58 Safety of roadside area ANALYSIS OF THE TEST RESULTS
earlier can be applied for trees etc. although they can be considered as point hazards with relatively narrow overlap in frontal collisions. Based on data of RISER detailed database, much of the vehicle's speed is lost during the impact with the tree (figure 45).
Figure 45 Speed at impact and after impact in tree collisions. RISER detailed database.
In later analysis the trees and rock cuttings are considered as rigid non-deformable objects. Based on the review of relationship between risk of in-jury and delta-v it is assumed that the threshold value of delta-V to the se-vere injuries in frontal collisions is 25 km/h. It is also assumed that significant increase of risk of severe injuries for the restrained occupants occurs when delta-V exceeds 55 km/h. In analysis the threshold values are crash speeds 25 km/h and 55 km/h, respectively.
6.4.2 Risk of injuries due to rollover
Correlation between injury severity and rollover severity is well-established. Ejection is a significant factor in fatal cases and is usually related with non-usage of seat belts. Also current seatbelt designs are only partially effective in rollover crashes, providing little restraint against partial ejection and head excursion outside the vehicle and hence risk of severe head injuries (Rechnitzer and Lane 1995).
In figure 43 there are presented the severities of the ROR-accidents on main roads with speed limits 80 or 100 km/h. The number of accidents with per-sonal injuries increases with increasing number of quarter turns. The portion of accidents with moderate or severe consequences is higher when one or more rollovers occur. Fatal accidents are quite rare in data.

Safety of roadside area 59 ANALYSIS OF THE TEST RESULTS
Figure 46 Severities of injuries in run-off accidents to the ditch (n=430, main
roads of five road districts in Finland 1994-96). Wearing a seatbelt is not known. Only the cases in which no other hit obstacles than ground or ditch slopes were reported.
Injury risk is dependent on the number of roof impacts or in more detail, in-creasing number of quarter turns (figures 47 and 48). The increased risk is particularly great when a vehicle rolls more than two complete rolls. Most of-ten injured body regions of belted occupants are thorax and head. Risk of severe injuries is 2…10 times higher for unbelted occupants (figure 48, Moore et.al. 2005).
Figure 47 Risk of severe injuries (MAIS 3+) to belted occupants vs. number of
roof impacts in single vehicle rollovers. Data from rollover events re-corded in NASS-CDS from 1995-2001(Eigen 2005).
0
20
40
60
80
100
120
140
Not known No rollover or skidding Skidding 0.25 rolls 0.5‐0.75 rolls 1.0+ rolls
Fatal Moderate or severe injury Slight injury not known

60 Safety of roadside area ANALYSIS OF THE TEST RESULTS
Figure 48 Risk of severe injury (MAIS 3+) to belted and unbelted occupants in
real-life rollovers. Data from rollover events recorded in NASS-CDS from 1995-2003. N = 4024 vehicles (Moore et.al. 2005)
Based on these results it is assumed that the threshold for severe injuries for the restrained occupant in the passenger car is 1.25 rolls. Furthermore, the risk for severe injuries increases to significantly higher level if there are more than 1.75 rolls.
6.4.3 Criteria for the severity of the incident
It is common that both crash into roadside object (like backslope of the ditch) and rollover occur in the same accident. In the analysis of the simulations and the crash tests these incidents and the risks of consequences are exam-ined separately.
In some cases it is impossible to estimate delta-v and only the ASI values are available. However, estimates of delta-v can be conducted from ASI val-ues. According to Shojaati ASI 1.0 corresponds approximately to AIS < 1 and ASI 1.4 corresponds approximately to AIS 1 (Shojaati 2003). According to Gabauer and Gabler ASI 1.0 corresponds to light injury, if any (probability of AIS 0…AIS 1 is 80 %). Instead ASI 1.4 is calculated to lead to AIS 1 inju-ries on an average, but also to AIS 3 injuries with probability higher than 0.12 (Gabauer and Gabler 2005).
The following criteria are used for the evaluation of the severity of the inci-dent (Table 23). It is assumed that occupants in the vehicle wear a seat belt.
In the analysis there are given two options for the errant vehicles that return back onto the road: very probable crash with another passenger car (busy traffic) and low risk for collision with another car (low-volume road). In latter case the risk for severe consequences is low.
0 %
10 %
20 %
30 %
40 %
50 %
60 %
70 %
80 %
1 Quarter turn
2 Quarter turns
3 Quarter turns
1 Roll 1.25‐1.75 Rolls
2‐2.75 Rolls
3 or more Rolls
Risk of Injury M
AIS
3+
Belted
Un‐Belted
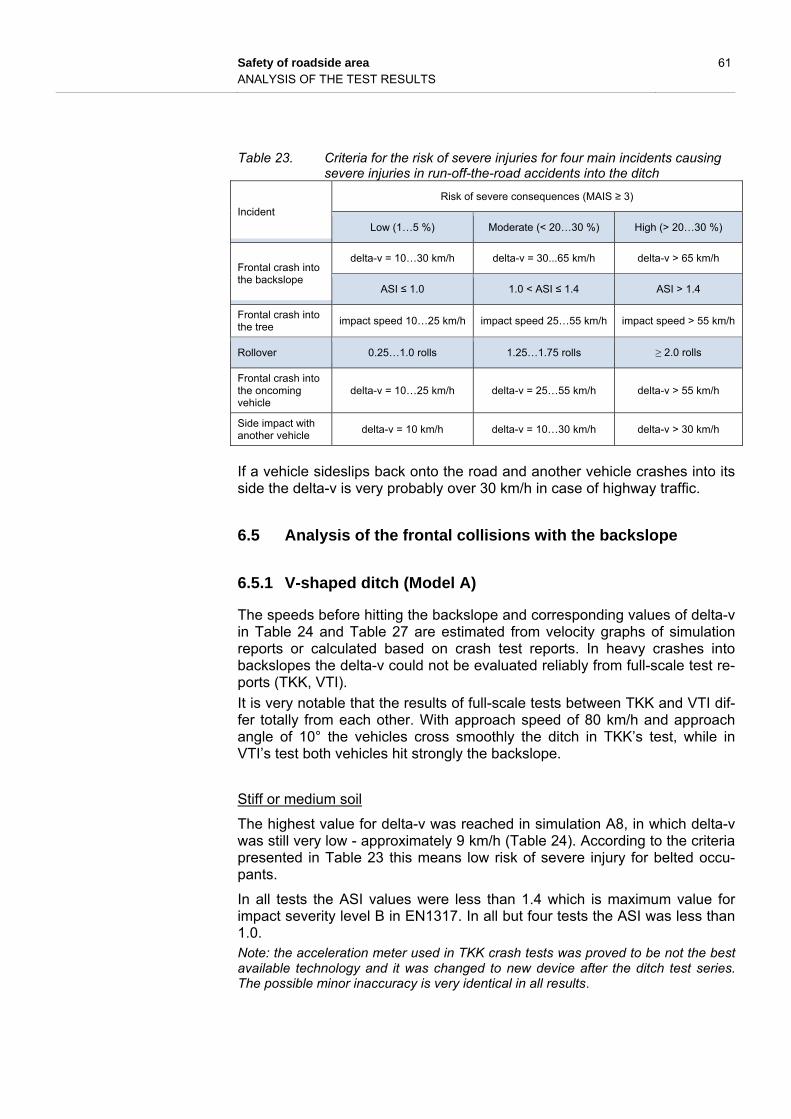
Safety of roadside area 61 ANALYSIS OF THE TEST RESULTS
Table 23. Criteria for the risk of severe injuries for four main incidents causing severe injuries in run-off-the-road accidents into the ditch
Incident
Risk of severe consequences (MAIS ≥ 3)
Low (1…5 %) Moderate (< 20…30 %) High (> 20…30 %)
Frontal crash into the backslope
delta-v = 10…30 km/h delta-v = 30...65 km/h delta-v > 65 km/h
ASI ≤ 1.0 1.0 < ASI ≤ 1.4 ASI > 1.4
Frontal crash into the tree
impact speed 10…25 km/h impact speed 25…55 km/h impact speed > 55 km/h
Rollover 0.25…1.0 rolls 1.25…1.75 rolls ≥ 2.0 rolls
Frontal crash into the oncoming vehicle
delta-v = 10…25 km/h delta-v = 25…55 km/h delta-v > 55 km/h
Side impact with another vehicle
delta-v = 10 km/h delta-v = 10…30 km/h delta-v > 30 km/h
If a vehicle sideslips back onto the road and another vehicle crashes into its side the delta-v is very probably over 30 km/h in case of highway traffic.
6.5 Analysis of the frontal collisions with the backslope
6.5.1 V-shaped ditch (Model A)
The speeds before hitting the backslope and corresponding values of delta-v in Table 24 and Table 27 are estimated from velocity graphs of simulation reports or calculated based on crash test reports. In heavy crashes into backslopes the delta-v could not be evaluated reliably from full-scale test re-ports (TKK, VTI).
It is very notable that the results of full-scale tests between TKK and VTI dif-fer totally from each other. With approach speed of 80 km/h and approach angle of 10° the vehicles cross smoothly the ditch in TKK’s test, while in VTI’s test both vehicles hit strongly the backslope.
Stiff or medium soil
The highest value for delta-v was reached in simulation A8, in which delta-v was still very low - approximately 9 km/h (Table 24). According to the criteria presented in Table 23 this means low risk of severe injury for belted occu-pants.
In all tests the ASI values were less than 1.4 which is maximum value for impact severity level B in EN1317. In all but four tests the ASI was less than 1.0. Note: the acceleration meter used in TKK crash tests was proved to be not the best available technology and it was changed to new device after the ditch test series. The possible minor inaccuracy is very identical in all results.
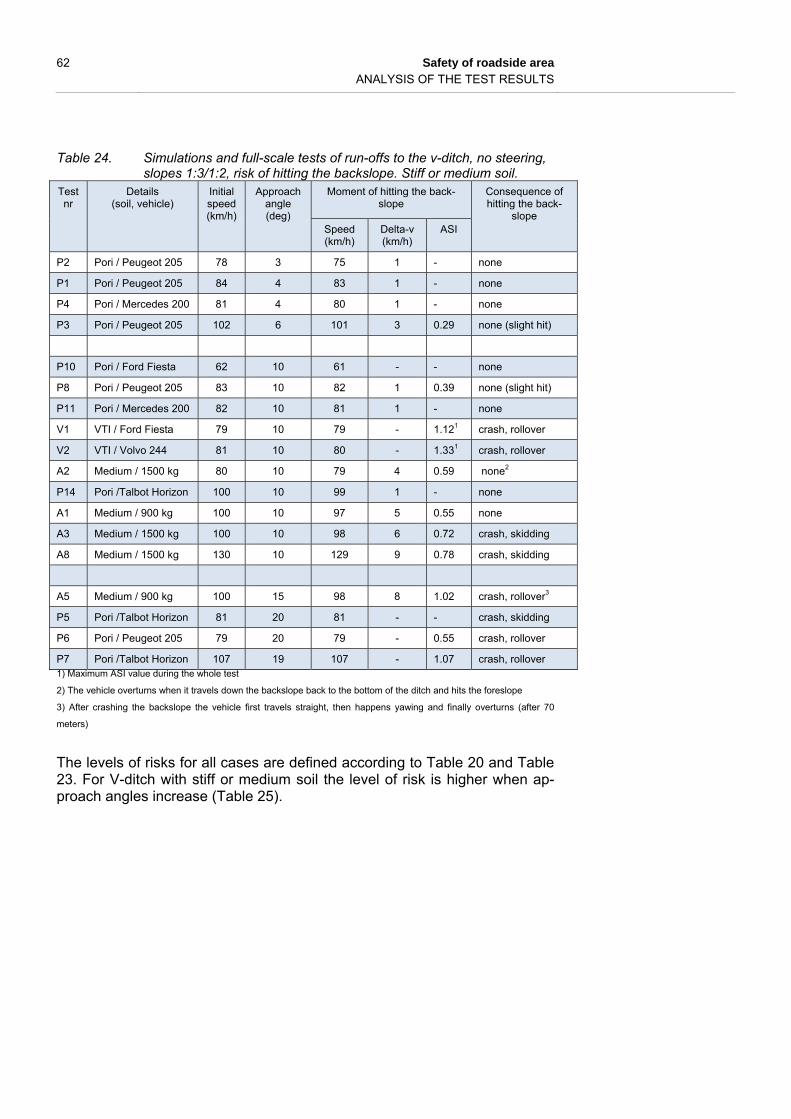
62 Safety of roadside area ANALYSIS OF THE TEST RESULTS
Table 24. Simulations and full-scale tests of run-offs to the v-ditch, no steering, slopes 1:3/1:2, risk of hitting the backslope. Stiff or medium soil.
Test nr
Details (soil, vehicle)
Initial speed (km/h)
Approach angle (deg)
Moment of hitting the back-slope
Consequence of hitting the back-
slope Speed (km/h)
Delta-v (km/h)
ASI
P2 Pori / Peugeot 205 78 3 75 1 - none
P1 Pori / Peugeot 205 84 4 83 1 - none
P4 Pori / Mercedes 200 81 4 80 1 - none
P3 Pori / Peugeot 205 102 6 101 3 0.29 none (slight hit)
P10 Pori / Ford Fiesta 62 10 61 - - none
P8 Pori / Peugeot 205 83 10 82 1 0.39 none (slight hit)
P11 Pori / Mercedes 200 82 10 81 1 - none
V1 VTI / Ford Fiesta 79 10 79 - 1.121 crash, rollover
V2 VTI / Volvo 244 81 10 80 - 1.331 crash, rollover
A2 Medium / 1500 kg 80 10 79 4 0.59 none2
P14 Pori /Talbot Horizon 100 10 99 1 - none
A1 Medium / 900 kg 100 10 97 5 0.55 none
A3 Medium / 1500 kg 100 10 98 6 0.72 crash, skidding
A8 Medium / 1500 kg 130 10 129 9 0.78 crash, skidding
A5 Medium / 900 kg 100 15 98 8 1.02 crash, rollover3
P5 Pori /Talbot Horizon 81 20 81 - - crash, skidding
P6 Pori / Peugeot 205 79 20 79 - 0.55 crash, rollover
P7 Pori /Talbot Horizon 107 19 107 - 1.07 crash, rollover 1) Maximum ASI value during the whole test
2) The vehicle overturns when it travels down the backslope back to the bottom of the ditch and hits the foreslope 3) After crashing the backslope the vehicle first travels straight, then happens yawing and finally overturns (after 70
meters)
The levels of risks for all cases are defined according to Table 20 and Table 23. For V-ditch with stiff or medium soil the level of risk is higher when ap-proach angles increase (Table 25).

Safety of roadside area 63 ANALYSIS OF THE TEST RESULTS
Table 25. Level of risk of hitting the backslope V-ditch, no steering, slopes 1:3/1:2. Stiff or medium soil.
Test nr
Initial speed category (km/h)
Approach angle
category (deg)
Risk of crash into the backslope
Level of risk
Likelihood Severity
P1, P2, P4 80 5 Low Low Low
P3 100 5 Low Low Low
P10 60 10 Low Low Low
P8, P11, V1, V2, A2 80 10 Moderate Moderate Moderate
P14, A1, A3 100 10 Moderate Low Low
A8 120 10 High Low Moderate
A5 100 15 High Moderate High
P5, P6 80 20 High Low Moderate
P7 100 20 High Moderate High
The weighted level of risk is assessed to be moderate when the approach speed is 80…120 km/h (Table 26).
Table 26. Weighted mean of level of risk of crash into backslope in v-ditch (stiff soil, passenger cars, no steering) based on analysis of test results and some additional assumptions (assumptions with italic font).
Speed / angle 5° 10° 15° 20° Level of risk (weighted mean)
Distribution 40 % 35 % 15 % 10 % 100 %
80 km/h Low Moderate Moderate Moderate Moderate
100 km/h Low Low1 High High Moderate
120 km/h Moderate Moderate High Critical Moderate 1 based on the results of approach speed 80 km/h this could be changed to moderate
Soft soil
The highest value for delta-v was reached in simulation A9, in which delta-v was approximately 29 km/h. In all tests with soft soil the ASI values were less than 1.0 (Table 27).
Table 27. Simulations and full-scale tests of run-offs to the v-ditch, no steering, slopes 1:3/1:2, risk of hitting the backslope. Soft soil.
Test nr
Details (soil, vehicle)
Initial speed (km/h)
Approach angle (deg)
Moment of hitting the backslope Consequence of hitting the back-
slope Speed (km/h)
Delta-v (km/h)
ASI
A9 Soft 2 / 900 kg 80 10 79 29 0,74 crash, pitching
A6 Soft 2 / 1500 kg 80 10 79 15 0,45 rollover
A4 Soft 1 / 900 kg 100 10 97 10 0,75 slight pitching
A7 Soft 2 / 900 kg 100 10 96 19 0,77 crash, skidding
For soft soil several approximations are needed. There were only four simu-lated tests for assessment of the levels of risks. The level of risk is moderate when the approach speed is 100 km/h or higher (Table 28). In comparison with stiff soil it must be taken into account that the results of VTI’s tests (stiff

64 Safety of roadside area ANALYSIS OF THE TEST RESULTS
soil) have essential effect on the level of risk in case of 80 km/h approach speed and 10° approach angle.
Table 28. Weighted mean of level of risk of crash into backslope in v-ditch (soft soil, passenger cars, no steering) based on analysis of test results and some additional approximations (approximations with italic font).
Speed / angle 5° 10° 15° 20° Level of risk (weighted mean)
Distribution 40 % 35 % 15 % 10 % 100 %
80 km/h Low Low Moderate Moderate Low
100 km/h Low Moderate Moderate High Moderate
120 km/h Moderate Moderate High High Moderate
6.5.2 Modified V-shaped ditch (Model B)
There were no full-scale tests performed into model B ditch (foreslope 1:2, backslope 1:4 and 1:1.5 (height = 1+3 m). In first stage two LS-Dyna-simulations were carried out, both with medium soil (tests B2 and B3). In second stage nine cases were simulated using DyMesh.
Table 29. Simulations of run-offs to the model B ditch profile, risk of hitting the backslope
Test nr
Details (soil, vehicle)
Initial speed (km/h)
Approach angle (deg)
Moment of hitting the back-slope
Consequence of hitting the back-
slope Speed (km/h)
Delta-v (km/h)
ASI
B2 Medium, 1500 kg 100 15 100 5 0.80 crash, yawing
B3 Medium, 1500 kg 100 10 99 5 0.58 crash, yawing
B-01 Medium, 900 kg 100 5 99 2 0.42 none
B-02 Soft, 900 kg 100 5 99 2 0.41 none
B-03 Medium, 900 kg 80 10 79 2 0.74 crash
B-04 Medium, 900 kg 100 10 99 2 1.32 crash
B-05 Soft, 900 kg 100 10 99 1 1.30 crash
B-06 Medium, 900 kg 100 15 99 - >1.01
Simulation termi-nated due to too high accelerations => crash
B-07 Medium, 1500 kg 100 5 99 1 0.34 none
B-08 Medium, 1500 kg 80 10 79 1 0.22 none
B-09 Medium, 1500 kg 120 10 120 - >1.01
Simulation termi-nated due to too high acceleration => crash
1 estimated by comparison with tests V1, V2, A5 and P7
The level of risk for stiff soil is high if the speeds reach 120 km/h. The level of risk is moderate for approach speed 100 km/h and low for 80 km/h speed (Table 30 and Table 31).
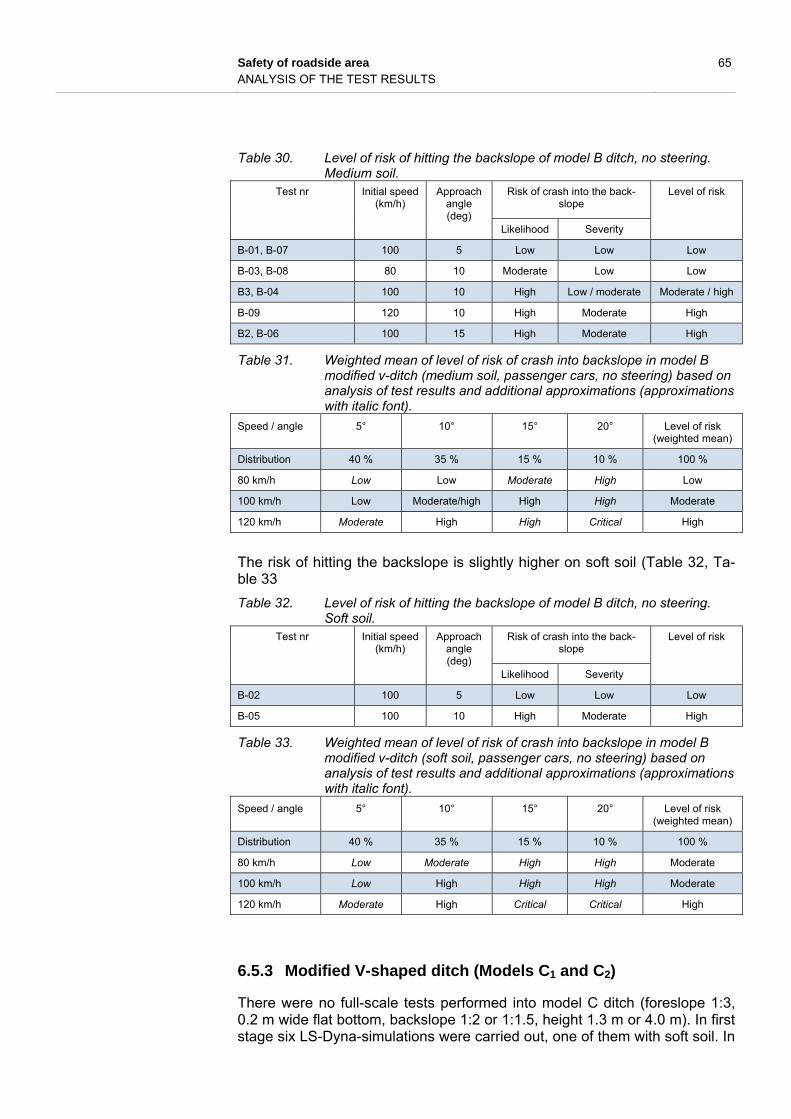
Safety of roadside area 65 ANALYSIS OF THE TEST RESULTS
Table 30. Level of risk of hitting the backslope of model B ditch, no steering. Medium soil.
Test nr
Initial speed (km/h)
Approach angle (deg)
Risk of crash into the back-slope
Level of risk
Likelihood Severity
B-01, B-07 100 5 Low Low Low
B-03, B-08 80 10 Moderate Low Low
B3, B-04 100 10 High Low / moderate Moderate / high
B-09 120 10 High Moderate High
B2, B-06 100 15 High Moderate High
Table 31. Weighted mean of level of risk of crash into backslope in model B modified v-ditch (medium soil, passenger cars, no steering) based on analysis of test results and additional approximations (approximations with italic font).
Speed / angle 5° 10° 15° 20° Level of risk (weighted mean)
Distribution 40 % 35 % 15 % 10 % 100 %
80 km/h Low Low Moderate High Low
100 km/h Low Moderate/high High High Moderate
120 km/h Moderate High High Critical High
The risk of hitting the backslope is slightly higher on soft soil (Table 32, Ta-ble 33
Table 32. Level of risk of hitting the backslope of model B ditch, no steering. Soft soil.
Test nr
Initial speed (km/h)
Approach angle (deg)
Risk of crash into the back-slope
Level of risk
Likelihood Severity
B-02 100 5 Low Low Low
B-05 100 10 High Moderate High
Table 33. Weighted mean of level of risk of crash into backslope in model B modified v-ditch (soft soil, passenger cars, no steering) based on analysis of test results and additional approximations (approximations with italic font).
Speed / angle 5° 10° 15° 20° Level of risk (weighted mean)
Distribution 40 % 35 % 15 % 10 % 100 %
80 km/h Low Moderate High High Moderate
100 km/h Low High High High Moderate
120 km/h Moderate High Critical Critical High
6.5.3 Modified V-shaped ditch (Models C1 and C2)
There were no full-scale tests performed into model C ditch (foreslope 1:3, 0.2 m wide flat bottom, backslope 1:2 or 1:1.5, height 1.3 m or 4.0 m). In first stage six LS-Dyna-simulations were carried out, one of them with soft soil. In

66 Safety of roadside area ANALYSIS OF THE TEST RESULTS
second stage 28 tests were performed using DyMesh. In 24 of simulated cases the parameter for soil stiffness was medium and in four cases soft. The results of analysis are merged into two groups (C1 + C2 and C3 + C4). In every variation of model C ditch profile there is a rigid vertical wall positioned on the top of the backslope. The ASI values in the following results represent the maximum value during the whole test. In following tables the ASI-values in brackets are obviously ones caused by vehicle’s collision with the wall, not the backslope. In some cases the maximum ASI could be recorded when the vehicle returned down the backslope and hit the foreslope. In many cases the severity of hitting the backslope was defined from the es-timated delta-v values (Table 34, Table 35). The ASI values were considered only if the exact ASI value at the moment of hitting the backslope was avail-able.
Table 34. Simulations of run-offs to the model C1 ditch profile, risk of hitting the backslope (backslope 1:2, height 1.3 m)
Test nr
Details (soil, vehicle)
Initial speed (km/h)
Approach angle (deg)
Moment of hitting the back-slope
Consequence of hitting the back-
slope Speed (km/h)
Delta-v (km/h)
ASI
C1 Medium, 900 kg 100 15 98 3 0.83 none
C1-01 Medium, 900 kg 80 10 79 2 0.19 none
C1-02 Medium, 900 kg 100 10 100 3 0.23 none
C1-03 Soft, 900 kg 100 10 100 3 0.43 none
C1-04 Medium, 1500 kg 100 5 99 1 0.32 none
C1-05 Medium, 1500 kg 80 10 78 3 0.41 none
C1-06 Medium, 1500 kg 100 10 100 3 (0.31) none
C1-07 Medium, 1500 kg 120 10 120 3 (0.59) none
Table 35. Simulations of run-offs to the model C2 ditch profile, risk of hitting the backslope (backslope 1:2, height 4.0 m)
Test nr
Details (soil, vehicle)
Initial speed (km/h)
Approach angle (deg)
Moment of hitting the back-slope
Consequence of hitting the back-
slope Speed (km/h)
Delta-v (km/h)
ASI
C2-01 Medium, 900 kg 100 5 99 2 0.23 none
C2-02 Soft, 900 kg 100 5 99 2 0.26 none
C2-03 Medium, 900 kg 80 10 89 3 (1.02) none
C2-04 Medium, 900 kg 100 10 100 3 (1.07) none
C2-05 Soft, 900 kg 100 10 100 3 0.43 none
C2-06 Medium, 900 kg 100 15 80 4 0.72 none
C2-07 Medium, 1500 kg 100 5 100 1 0.32 none
C2-08 Medium, 1500 kg 80 10 99 2 0.19 none
C2-09 Medium, 1500 kg 100 10 99 2 0.25 none
C2-10 Medium, 1500 kg 120 10 120 3 0.39 none

Safety of roadside area 67 ANALYSIS OF THE TEST RESULTS
The level of risk for stiff soil is low at all examined speeds (Table 36 and Ta-ble 37). Respectively the level of risk in case of soft soil is low at speeds 80 and 100 km/h and moderate at speed of 120 km/h (Table 38 and Table 39).
Table 36. Level of risk of hitting the backslope of model C1 or C2 ditch, no steer-ing. Medium soil.
Test nr
Initial speed (km/h)
Approach angle (deg)
Risk of crash into the back-slope
Level of risk
Likelihood Severity
C1-04, C2-01, C2-07 100 5 Low Low Low
C1-01, C1-05, C2-03, C2-08 80 10 Low Low Low
C1-02, C1-06, C2-04, C2-09 100 10 Low Low Low
C1-07, C2-10 120 10 Low Low Low
C1, C2-06 100 15 Low Low Low
Table 37. Weighted mean of level of risk of crash into backslope in model C1 or C2 modified v-ditch (medium soil, passenger cars, no steering) based on analysis of test results and additional approximations (approxima-tions with italic font).
Speed / angle 5° 10° 15° 20° Level of risk (weighted mean)
Distribution 40 % 35 % 15 % 10 % 100 %
80 km/h Low Low Low Low Low
100 km/h Low Low Low Moderate Low
120 km/h Low Low Moderate High Low
Table 38. Level of risk of hitting the backslope of model C1 or C2 ditch, no steer-ing. Soft soil.
Test nr
Initial speed (km/h)
Approach angle (deg)
Risk of crash into the back-slope
Level of risk
Likelihood Severity
C2-02 100 5 Low Low Low
C1-03, C2-05 100 10 Low Low Low
Table 39. Weighted mean of level of risk of crash into backslope in model C1 or C2 modified v-ditch (soft soil, passenger cars, no steering) based on analysis of test results and additional approximations (approximations with italic font).
Speed / angle 5° 10° 15° 20° Level of risk (weighted mean)
Distribution 40 % 35 % 15 % 10 % 100 %
80 km/h Low Low Low Moderate Low
100 km/h Low Low Moderate High Low
120 km/h Low Moderate High High Moderate

68 Safety of roadside area ANALYSIS OF THE TEST RESULTS
6.5.4 Modified V-shaped ditch (Models C3 and C4)
In most cases the severity of hitting the backslope was defined from the es-timated delta-v values (Table 40, Table 41). The ASI values were considered only if the exact ASI value at the moment of hitting the backslope was avail-able.
Table 40. Simulations of run-offs to the model C3 ditch profile, risk of hitting the backslope (backslope 1:1.5, height 1.3 m)
Details (soil, vehicle)
Initial speed (km/h)
Approach angle (deg)
Moment of hitting the back-slope
Consequence of hitting the back-
slope Speed (km/h)
Delta-v (km/h)
ASI
C2 Medium, 900 kg 100 15 98 6 0.88 none
C3 Medium, 900 kg 100 10 98 5 0.77 none
C3-01 Medium, 900 kg 100 5 99 2 0.28 none
C3-02 Soft, 900 kg 100 5 99 2 (0.76) none
C3-03 Medium, 900 kg 80 10 79 3 0.29 none
Table 41. Simulations of run-offs to the model C4 ditch profile, risk of hitting the backslope (backslope 1:1.5, height 4.0 m)
Test nr
Details (soil, vehicle)
Initial speed (km/h)
Approach angle (deg)
Moment of hitting the back-slope
Consequence of hitting the back-
slope Speed (km/h)
Delta-v (km/h)
ASI
C4 Medium, 20 000 kg (bus)
90 10 89 5 - none
C5 Medium, 900 kg 100 10 98 4 0.78 none
C6 Soft 2, 900 kg 100 10 98 22 0.87 crash, rollover
C7 Medium, 900 kg 100 15 98 8 0.86 crash
C4-01 Medium, 900 kg 100 5 99 2 0.28 none
C4-02 Soft, 900 kg 100 5 99 2 0.28 none
C4-03 Medium, 900 kg 80 10 79 3 (0.33) none
C4-04 Medium, 900 kg 100 15 100 5 0.40 slight hit
C4-05 Medium, 1500 kg 100 5 100 1 0.56 none
C4-06 Medium, 1500 kg 80 10 79 2 0.30 none
C4-07 Medium, 1500 kg 100 10 100 3 0.41 slight hit
C4-08 Medium, 1500 kg 120 10 120 5 0.83 slight hit
The level of risk for stiff soil is low at speeds of 80 and 100 km/h and mod-erate at speed of 120 km/h (Table 42 and Table 43). Respectively the level of risk for soft soil is low at speed 80 km/h and moderate at speed of 100 and 120 km/h (Table 44 and Table 45). In case of C6 digging into backslope (1:1.5) and rollover are obviously caused by soft soil. Delta-v is much higher than in other tests but still under 30 km/h.

Safety of roadside area 69 ANALYSIS OF THE TEST RESULTS
Table 42. Level of risk of hitting the backslope of model C3 or C4 ditch, no steer-ing. Medium soil.
Test nr
Initial speed (km/h)
Approach angle (deg)
Risk of crash into the back-slope
Level of risk
Likelihood Severity
C3-01, C4-01, C4-05 100 5 Low Low Low
C3-03, C4-03, C2-06 80 10 Low Low Low
C3, C5, C4-06, C4-07 100 10 Low Low Low
C4-08 120 10 High Low Moderate
C4-04 100 15 High Low Moderate
Table 43. Weighted mean of level of risk of crash into backslope in model C3 or C4 modified v-ditch (medium soil, passenger cars, no steering) based on analysis of test results and additional approximations (approxima-tions with italic font).
Speed / angle 5° 10° 15° 20° Level of risk (weighted mean)
Distribution 40 % 35 % 15 % 10 % 100 %
80 km/h Low Low Low Moderate Low
100 km/h Low Low Moderate High Low
120 km/h Low Moderate High High Moderate
Table 44. Level of risk of hitting the backslope of model C3 or C4 ditch, no steer-ing. Soft soil.
Test nr
Initial speed (km/h)
Approach angle (deg)
Risk of crash into the back-slope
Level of risk
Likelihood Severity
C3-02, C4-02 100 5 Low Low Low
C6 100 10 High Low Moderate
Table 45. Weighted mean of level of risk of crash into backslope in model C3 or C4 modified v-ditch (soft soil, passenger cars, no steering) based on analysis of test results and additional approximations (approximations with italic font).
Speed / angle 5° 10° 15° 20° Level of risk (weighted mean)
Distribution 40 % 35 % 15 % 10 % 100 %
80 km/h Low Low Low Moderate Low
100 km/h Low Moderate High High Moderate
120 km/h Low Moderate High Critical Moderate
6.5.5 U-shaped ditch (Models U and Us)
Altogether three full-scale tests were conducted: two by VTI and one by TKK. The profiles of the tested ditches were in all tests basically the same. The gradients of the upper parts of the slopes were 1:3 (foreslope) and 1:2 (backslope). However, there were some differences; the depth of the ditch was deeper in VTI’s tests (0.7 m) than in TKK’s test (0.5 m).

70 Safety of roadside area ANALYSIS OF THE TEST RESULTS
In simulated tests the depth of the ditch was 1.0 m. Despite this the results are merged for the final analysis.
Table 46. Results of full-scale tests of run-offs to the U-ditch (rounded bottom), risk of hitting the backslope
Test nr
Details (soil, vehicle) Initial speed (km/h)
Approach angle (deg)
Moment of hitting the back-slope
Consequence of hitting the backslope
Speed (km/h)
Delta-v (km/h)
ASI
P15 Pori Soft / Talbot Horizon 100 10 95 ~0 - none
V3 VTI / Volvo 244 80 10 79 - 0.54 slight hit
V4 VTI / Ford Fiesta 80 10 80 ~0 0.701 none 1 Highest ASI value probably due to crash into other structure beyond the ditch
In TKK’s test the soil in the bottom of the ditch was very soft: the depths of the wheel tracks in maximum were 45 mm. The ASI value in VTI’s test V4 seems to be relatively high because the vehicle crossed smoothly the ditch. It could be possible that the measured value is caused by the impact of the vehicle to some constructions of the test site, which happened after crossing the U-ditch.
Table 47. Simulations of run-offs to the U- ditch profile, risk of hitting the back-slope (backslope 1:2, height 4.0 m)
Test nr
Details (soil, vehicle)
Initial speed (km/h)
Approach angle (deg)
Moment of hitting the back-slope
Consequence of hitting the back-
slope Speed (km/h)
Delta-v (km/h)
ASI
U-01 Medium, 900 kg 100 5 100 1 0.13 none
U-02 Soft, 900 kg 80 10 100 0 0.19 none
U-03 Medium, 900 kg 80 20 79 - > 1.0 crash
U-04 Medium, 900 kg 100 15 100 5 1.12 probably slight hit
U-05 Medium, 1500 kg 80 10 100 1 0.17 none
U-06 Medium, 1500 kg 100 10 100 1 0.42 none
U-07 Medium, 1500 kg 120 10 120 2 0.20 none
The level of risk of hitting the backslope is low at speeds 80 and 100 km/h. The level of risk increases when speed grows to 120 km/h. This is due to one simulation (U-03), which was terminated because of too high accelera-tions when vehicle reached backslope. The conclusion was that a vehicle crashed into the backslope and therefore ASI was higher than 1.0 (Table 48 and Table 49).

Safety of roadside area 71 ANALYSIS OF THE TEST RESULTS
Table 48. Level of risk of hitting the backslope U- ditch, no steering. Medium or soft soil.
Test nr
Initial speed category (km/h)
Approach angle cate-gory (deg)
Risk of crash into the back-slope
Level of risk
Likelihood Severity
U-01 100 5 Low Low Low
V3, V4, U-02, U-05 80 10 Low Low Low
P15, U-06 100 10 Low Low Low
U-07 120 10 Low Low Low
U-04 100 15 Moderate Moderate Moderate
U-03 80 20 High Moderate High
Table 49. Weighted mean of level of risk of crash into backslope in U-ditch (medium or soft soil, passenger cars, no steering) based on analysis of test results and additional approximations (approximations with italic font).
Speed / angle 5° 10° 15° 20° Level of risk (weighted mean)
Distribution 40 % 35 % 15 % 10 % 100 %
80 km/h Low Low Moderate High Low
100 km/h Low Low Moderate High Low
120 km/h Low Low High High Moderate
6.5.6 Embankment slopes
The ASI-values are not too high (>1.0) in any tests to model E and F slope profiles (Table 50 and Table 51). Delta-v exceeds 20 km/h in one case and causes minor risk of injuries: in case F3 the soft soil causes heavy crash into the low backslope and hence higher risk of injury.
Table 50. First stage simulations (LS-Dyna) of run-offs to the model E and F embankment slopes, risk of hitting the ground or backslope of the ditch on the toe of the slope
Test nr
Details (soil, vehicle)
Initial speed (km/h)
Approach angle (deg)
Moment of hitting the back-slope / toe of the slope
Consequence of hitting the backslope
Speed (km/h)
Delta-v (km/h)
ASI
E1 Medium, 900 kg 100 15 95 5 0.48 none
F2 Medium, 900 kg 100 10 95 8 0.58 none
F3 Medium/soft1, 900 kg 100 10 93 23 0.71 crash
1 Bottom of the ditch: Soft 2 soil

72 Safety of roadside area ANALYSIS OF THE TEST RESULTS
Table 51. Second stage simulations (DyMesh) of run-offs to the model E em-bankment slope, risk of hitting the ground or backslope of the ditch on the toe of the slope
Test nr
Details (soil, vehicle)
Initial speed (km/h)
Approach angle (deg)
Moment of hitting the toe of the slope
Consequence of hitting the back-
slope Speed (km/h)
Delta-v (km/h)
ASI
E-01 Medium, 900 kg 100 5 100 1 0.13 none
E-02 Medium, 900 kg 80 10 80 1 0.12 none
E-03 Medium, 900 kg 100 10 100 1 0.14 none
E-04 Soft, 900 kg 100 10 100 1 0.15 none
E-05 Medium, 1500 kg 80 10 80 1 0.13 none
E-06 Medium, 1500 kg 100 10 100 1 0.14 none
In summary there is only low level of risk for the frontal crash into the ground or backslope in any of the slope cases with stiff soil. In case of model F3 profile with soft soil in the bottom of the ditch the level of risk is still low, but notably higher than in case of F2.
In earlier project five simulations with 20 ton bus were conducted. These tests were conducted after severe bus accident in Sweden in 2006 and re-ported in SNRA publication 2007:8.
Table 52. Slope simulations with 20 000 kg bus (Swedish National Road Administration 2007).
Test nr Speed and angle
Slope profile Safety barrier
Consequences
Height (m) Slopes Ditch2 Type
1 90 km/h, 10° 4.5 1:6 -> 1:31 yes none
Heavy crash into back-slope of the ditch, pitch
angle 30 deg
2 90 km/h, 10° 4.0 1:3 yes none Heavy crash into back-slope of the ditch, pitch
angle 30 deg
3 90 km/h, 10° 6.0 1:6 no none No crash
4 90 km/h, 10° 4.5 1:2 - N2 Through the barrier
5 90 km/h, 10° 4.5 1:2 - H2 Restrained and redirected
by the safety barrier 1 Upper part of slope 1:6 (width 6 m), lower part of slope 1:3 (width 5 m) 2 Low V-ditch (depth 0.5 m) on the toe of the slope
6.6 Analysis of rollovers
6.6.1 General
The risk of rollover in ditch tests is estimated based on all the results and commentaries in the test reports. In some simulated cases the vehicle did not overturn although there was evident condition for rollover. In these cases it is assumed that rollover may occur if there is possibility of tripping (side-slip, considerable roll angle) and sufficient velocity. The criteria for such cases are presented in Table 53.

Safety of roadside area 73 ANALYSIS OF THE TEST RESULTS
Table 53. Criteria for likelihood and severity of rollover for simulated cases where rollover did not occur
Critical side-slip angle Speed at critical mo-
ment (km/h) Likelihood of rollover
Severity of conse-quences
≥ ± 45 ° ≥ 40 km/h 50 % Low
≥ ± 45 ° ≥ 80 km/h 75 % Moderate
In model C cases with low backslope (1.3 m) the crash against the wall on the top of the slope is reason for possible rollovers. In cases with higher backslope (4 m) and medium soil there is no significant risk of rollover. Softer soil has great effect on consequences and rollover happens again (case C6).
In comparison with model B and model C cases it must be taken into ac-count that vehicles in B cases are large passenger cars (1500 kg) which tend to yaw easily also in simulations of basic V-ditch (slopes 1:3/1:2). The passenger cars in model C simulations are all light cars (900 kg). Even more important is to notice the depth of the ditch in all model C cases is only 0.3 m. In other ditch profiles the depth of the ditch is 1.0 m (exception: full-scale tests to U-ditch; depth 0.5…0.7 m).
The analysis of mode C is divided into four groups: C1, C2, C3 and C4, de-pending on the gradient and height of the backslope. After that also the op-tions without vertical wall on the top of the backslope are analyzed.
6.6.2 V-shaped ditch (Model A)
The risk of rollover in Table 54 and Table 57 is estimated from the photo-graphs, figures and video visualizations of simulations and crash tests. Also the numeric results and commentaries in the test reports are taken into ac-count.
Again the results of full-scale tests between TKK and VTI differ from each other. With approach speed of 80 km/h and approach angle of 10° the vehi-cles crossed a ditch without rollover in TKK’s test, while in VTI’s test both vehicles overturned.

74 Safety of roadside area ANALYSIS OF THE TEST RESULTS
Table 54. Risk of rollover – analysis based on test results for v-ditch (stiff or medium soil)
Test nr
Details (soil, vehicle)
Initial speed (km/h)
1)
Ap-proach angle (deg)1)
Consequence of hitting the backslope
Rollover (360° turns)
Side-slip
angle (deg)
Speed at critical moment (km/h)2)
Risk of rollover
P2 Pori/Peugeot 205 80 5 none 0,0 0 - 0 %
P1 Pori/Peugeot 205 80 5 none 0,0 0 - 0 %
P4 Pori/Mercedes 200 80 5 none 0,0 - - 0 %
P3 Pori/Peugeot 205 100 5 none (slight
hit) 0,0 0 - 0 %
P10 Pori/Ford Fiesta 60 10 none 0,0 0 - 0 %
P8 Pori/Peugeot 205 80 10 none (slight
hit) 0,0 0 - 0 %
P11 Pori/Mercedes 200 80 10 none 0,0 0 - 0 %
V1 VTI/Ford Fiesta 80 10 crash, rollover 1,25 -15 80 100 %
V2 VTI/Volvo 244 80 10 crash, rollover 1,0 -15 80 100 %
A2 Medium/1500 kg 80 10 none > 0,25 -70 45 50 % 4)
P14 Pori/Talbot Hori-zon
100 10 none 0,0 0 - 0 %
A1 Medium/900 kg 100 10 none 0,0 0 - 0 %
A3 Medium/1500 kg 100 10 skidding 0,05 130 50 50 %
A8 Medium/1500 kg 130 10 yawing 0,05 >360 90 75 %
A5 Medium/900 kg 100 15 crash, rollover 0,5 80 75 100 %
P5 Pori/Talbot Hori-zon
80 20 crash, skid-
ding 0,0 90 503) 50 %
P6 Pori/Peugeot 205 80 20 crash, rollover 1,75 - 80 100 %
P7 Pori/Talbot Hori-zon
100 20 crash, rollover 1,5 - 100 100 %
1) Classified speeds and angles 2) Beginning of possible rollover or maximum side-slip angle up to 90° 3) Rough estimate 4) Maximum yawing and rollover due to hitting the foreslope (60 meters after hitting the backslope)
At low angles (5 and 10 degrees) the levels of risks are low. At more abrupt angles (15 and 20 degrees) and at 10° angle with high 120 km/h speed the levels of risks are high (Table 55).
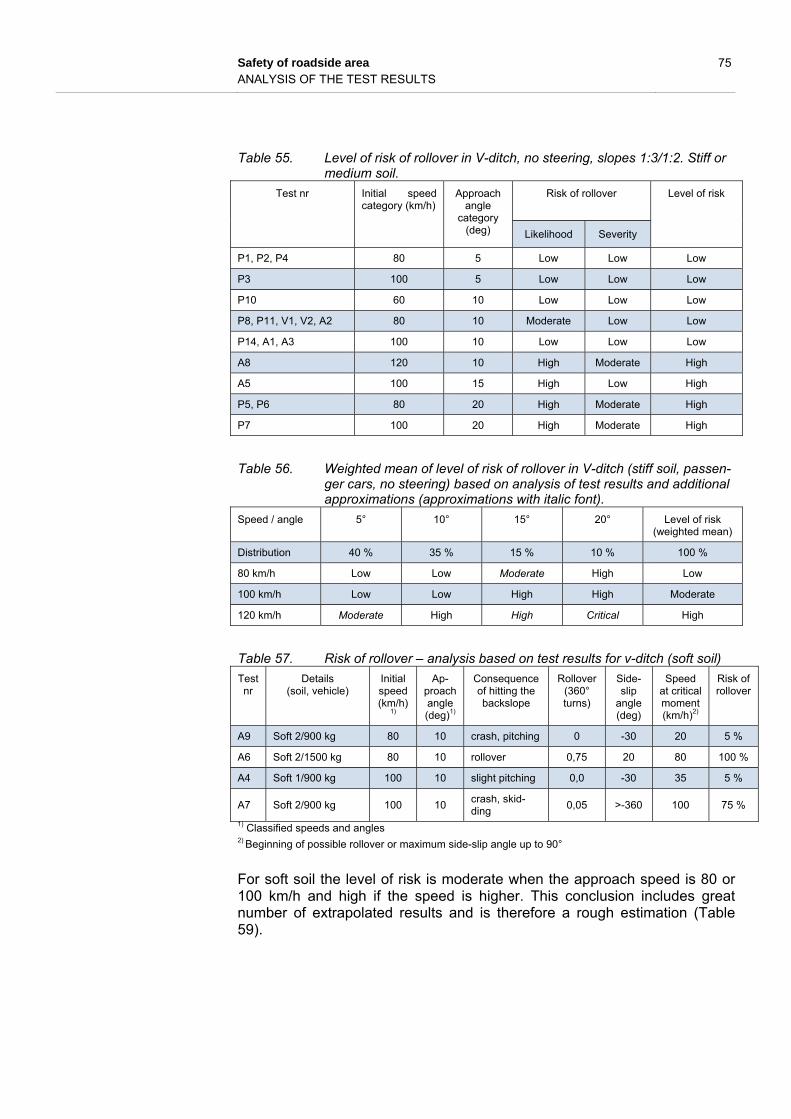
Safety of roadside area 75 ANALYSIS OF THE TEST RESULTS
Table 55. Level of risk of rollover in V-ditch, no steering, slopes 1:3/1:2. Stiff or medium soil.
Test nr
Initial speed category (km/h)
Approach angle
category (deg)
Risk of rollover Level of risk
Likelihood Severity
P1, P2, P4 80 5 Low Low Low
P3 100 5 Low Low Low
P10 60 10 Low Low Low
P8, P11, V1, V2, A2 80 10 Moderate Low Low
P14, A1, A3 100 10 Low Low Low
A8 120 10 High Moderate High
A5 100 15 High Low High
P5, P6 80 20 High Moderate High
P7 100 20 High Moderate High
Table 56. Weighted mean of level of risk of rollover in V-ditch (stiff soil, passen-ger cars, no steering) based on analysis of test results and additional approximations (approximations with italic font).
Speed / angle 5° 10° 15° 20° Level of risk (weighted mean)
Distribution 40 % 35 % 15 % 10 % 100 %
80 km/h Low Low Moderate High Low
100 km/h Low Low High High Moderate
120 km/h Moderate High High Critical High
Table 57. Risk of rollover – analysis based on test results for v-ditch (soft soil)
Test nr
Details (soil, vehicle)
Initial speed (km/h)
1)
Ap-proach angle (deg)1)
Consequence of hitting the backslope
Rollover (360° turns)
Side-slip
angle (deg)
Speed at critical moment (km/h)2)
Risk of rollover
A9 Soft 2/900 kg 80 10 crash, pitching 0 -30 20 5 %
A6 Soft 2/1500 kg 80 10 rollover 0,75 20 80 100 %
A4 Soft 1/900 kg 100 10 slight pitching 0,0 -30 35 5 %
A7 Soft 2/900 kg 100 10 crash, skid-ding
0,05 >-360 100 75 %
1) Classified speeds and angles 2) Beginning of possible rollover or maximum side-slip angle up to 90°
For soft soil the level of risk is moderate when the approach speed is 80 or 100 km/h and high if the speed is higher. This conclusion includes great number of extrapolated results and is therefore a rough estimation (Table 59).

76 Safety of roadside area ANALYSIS OF THE TEST RESULTS
Table 58. Level of risk of rollover in V-ditch, no steering, slopes 1:3/1:2. Soft soil.
Test nr
Initial speed category (km/h)
Approach angle
category (deg)
Risk of rollover Level of risk
Likelihood Severity
A6, A9 80 10 Moderate Moderate Moderate
A4, A7 100 10 Moderate Moderate Moderate
Table 59. Weighted mean of level of risk of rollover in V-ditch (soft soil, passen-ger cars, no steering) based on analysis of test results and additional approximations (approximations with italic font).
Speed / angle 5° 10° 15° 20° Level of risk (weighted mean)
Distribution 40 % 35 % 15 % 10 % 100 %
80 km/h Low Moderate High High Moderate
100 km/h Moderate Moderate Critical Critical Moderate
120 km/h Moderate High Critical Critical High
General conclusion is that the risk of rollover is probable when entering to the V-ditch. The results indicate that sharper angles (15°, 20°), soft soil, and higher speed increase the risk of rollover.
6.6.3 Modified V-shaped ditch (Model B)
According to the test results there is only minor risk of rollover in model B ditch. In cases B2 and B3 there occurs heavy yawing, which causes signifi-cant risk of rollover if the sliding vehicle hits any obstacle etc (Table 60). There are only two tests with soft soil. In these tests the behaviour and tra-jectory of the vehicle is very similar to the one with stiff soil. These two tests do not give enough information for estimation of the levels of risks in soft soil. The results indicate that the levels of risks do not differ significantly from the analysed levels of risks of model B ditch with stiff (or medium) soil.
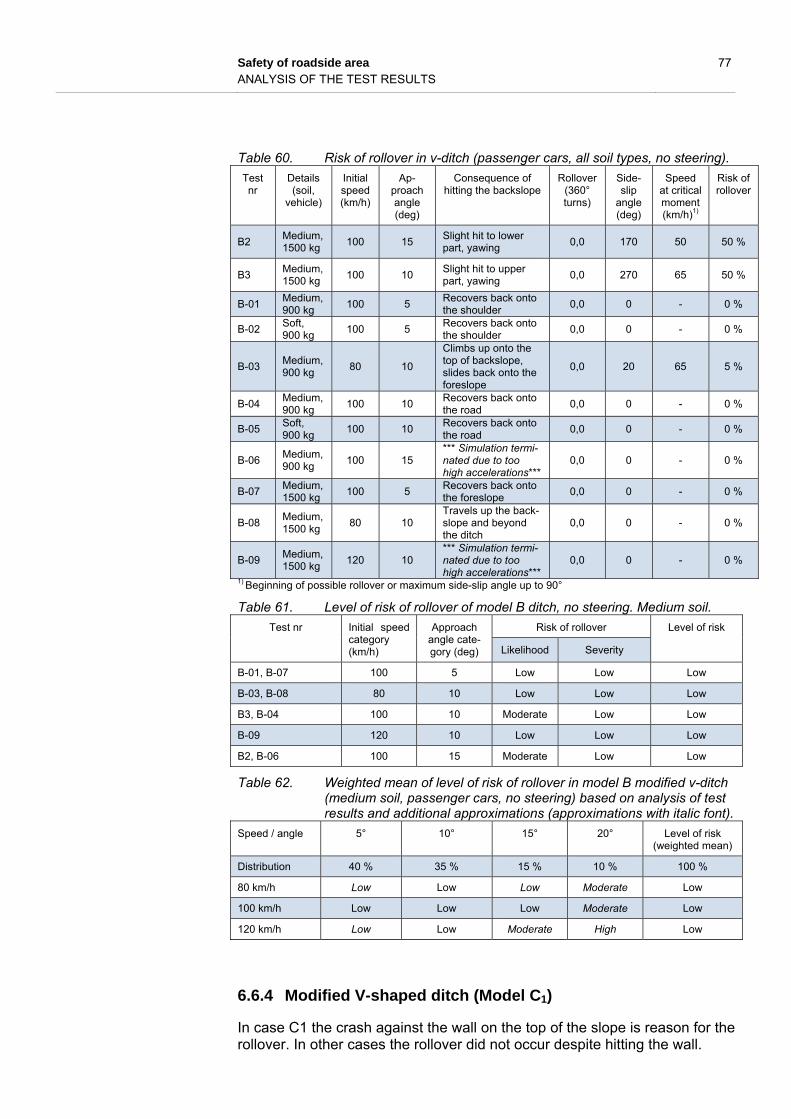
Safety of roadside area 77 ANALYSIS OF THE TEST RESULTS
Table 60. Risk of rollover in v-ditch (passenger cars, all soil types, no steering).
Test nr
Details (soil,
vehicle)
Initial speed (km/h)
Ap-proach angle (deg)
Consequence of hitting the backslope
Rollover (360° turns)
Side-slip
angle (deg)
Speed at critical moment (km/h)1)
Risk of rollover
B2 Medium, 1500 kg
100 15 Slight hit to lower part, yawing
0,0 170 50 50 %
B3 Medium, 1500 kg
100 10 Slight hit to upper part, yawing
0,0 270 65 50 %
B-01 Medium, 900 kg
100 5 Recovers back onto the shoulder
0,0 0 - 0 %
B-02 Soft, 900 kg
100 5 Recovers back onto the shoulder
0,0 0 - 0 %
B-03 Medium, 900 kg
80 10
Climbs up onto the top of backslope, slides back onto the foreslope
0,0 20 65 5 %
B-04 Medium, 900 kg
100 10 Recovers back onto the road
0,0 0 - 0 %
B-05 Soft, 900 kg
100 10 Recovers back onto the road
0,0 0 - 0 %
B-06 Medium, 900 kg
100 15 *** Simulation termi-nated due to too high accelerations***
0,0 0 - 0 %
B-07 Medium, 1500 kg
100 5 Recovers back onto the foreslope
0,0 0 - 0 %
B-08 Medium, 1500 kg
80 10 Travels up the back-slope and beyond the ditch
0,0 0 - 0 %
B-09 Medium, 1500 kg
120 10 *** Simulation termi-nated due to too high accelerations***
0,0 0 - 0 %
1) Beginning of possible rollover or maximum side-slip angle up to 90°
Table 61. Level of risk of rollover of model B ditch, no steering. Medium soil.
Test nr
Initial speed category (km/h)
Approach angle cate-gory (deg)
Risk of rollover Level of risk
Likelihood Severity
B-01, B-07 100 5 Low Low Low
B-03, B-08 80 10 Low Low Low
B3, B-04 100 10 Moderate Low Low
B-09 120 10 Low Low Low
B2, B-06 100 15 Moderate Low Low
Table 62. Weighted mean of level of risk of rollover in model B modified v-ditch (medium soil, passenger cars, no steering) based on analysis of test results and additional approximations (approximations with italic font).
Speed / angle 5° 10° 15° 20° Level of risk (weighted mean)
Distribution 40 % 35 % 15 % 10 % 100 %
80 km/h Low Low Low Moderate Low
100 km/h Low Low Low Moderate Low
120 km/h Low Low Moderate High Low
6.6.4 Modified V-shaped ditch (Model C1)
In case C1 the crash against the wall on the top of the slope is reason for the rollover. In other cases the rollover did not occur despite hitting the wall.
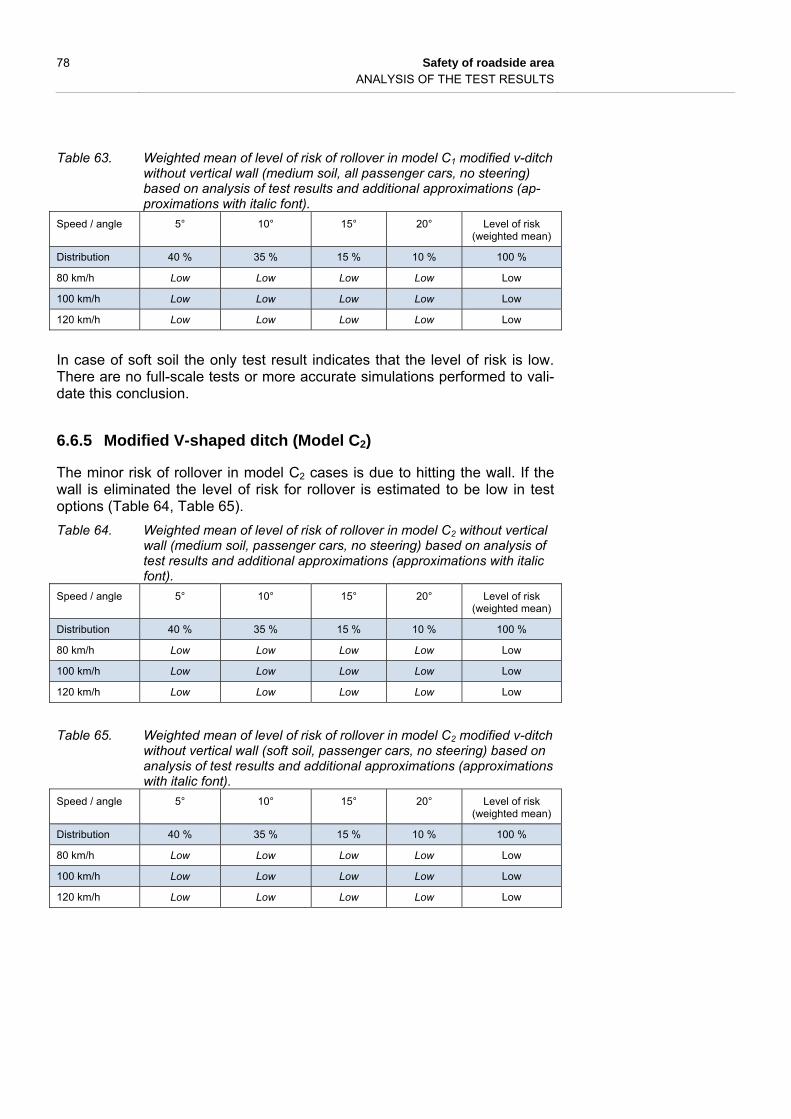
78 Safety of roadside area ANALYSIS OF THE TEST RESULTS
Table 63. Weighted mean of level of risk of rollover in model C1 modified v-ditch without vertical wall (medium soil, all passenger cars, no steering) based on analysis of test results and additional approximations (ap-proximations with italic font).
Speed / angle 5° 10° 15° 20° Level of risk (weighted mean)
Distribution 40 % 35 % 15 % 10 % 100 %
80 km/h Low Low Low Low Low
100 km/h Low Low Low Low Low
120 km/h Low Low Low Low Low
In case of soft soil the only test result indicates that the level of risk is low. There are no full-scale tests or more accurate simulations performed to vali-date this conclusion.
6.6.5 Modified V-shaped ditch (Model C2)
The minor risk of rollover in model C2 cases is due to hitting the wall. If the wall is eliminated the level of risk for rollover is estimated to be low in test options (Table 64, Table 65).
Table 64. Weighted mean of level of risk of rollover in model C2 without vertical wall (medium soil, passenger cars, no steering) based on analysis of test results and additional approximations (approximations with italic font).
Speed / angle 5° 10° 15° 20° Level of risk (weighted mean)
Distribution 40 % 35 % 15 % 10 % 100 %
80 km/h Low Low Low Low Low
100 km/h Low Low Low Low Low
120 km/h Low Low Low Low Low
Table 65. Weighted mean of level of risk of rollover in model C2 modified v-ditch without vertical wall (soft soil, passenger cars, no steering) based on analysis of test results and additional approximations (approximations with italic font).
Speed / angle 5° 10° 15° 20° Level of risk (weighted mean)
Distribution 40 % 35 % 15 % 10 % 100 %
80 km/h Low Low Low Low Low
100 km/h Low Low Low Low Low
120 km/h Low Low Low Low Low

Safety of roadside area 79 ANALYSIS OF THE TEST RESULTS
6.6.6 Modified V-shaped ditch (Model C3)
The vehicles overturn in tests C2 and C3, both due to hit against the wall. Again, if there was no wall the risk for rollover would be low in all of the cas-es (Table 66).
Table 66. Risk of rollover in model C3 modified v-ditch without vertical wall (me-dium soil, all passenger cars, no steering) based on analysis of test results and additional approximations (approximations with italic font).
Speed / angle 5° 10° 15° 20° Level of risk (weighted mean)
Distribution 40 % 35 % 15 % 10 % 100 %
80 km/h Low Low Low Low Low
100 km/h Low Low Low Low Low
120 km/h Low Low Low Low Low
6.6.7 Modified V-shaped ditch (Model C4)
In three model C4 cases the vehicle overturned, one of those was due to hit-ting the wall. In that one soft soil case the vehicle would have travelled beyond the ditch without the wall. Therefore the wall has no effect on the risk of rollover in stiff soil cases but has some effect on the analysis of soft soil cases (Table 67, 0).
Table 67. Weighted mean of level of risk of rollover in model C4 modified v-ditch without vertical wall (medium soil, passenger cars, no steering) based on analysis of test results and additional approximations (approxima-tions with italic font).
Speed / angle 5° 10° 15° 20° Level of risk (weighted mean)
Distribution 40 % 35 % 15 % 10 % 100 %
80 km/h Low Low Low Moderate Low
100 km/h Low Low Moderate High Low
120 km/h Low Moderate High High Moderate
Table 68. Level of risk of rollover in model C4 cases without vertical wall, no steering. Soft soil.
Test nr
Initial speed category (km/h)
Approach angle cate-gory (deg)
Risk of rollover Level of risk
Likelihood Severity
C4-02 100 5 Low Low Low
C6 100 10 High Low Moderate

80 Safety of roadside area ANALYSIS OF THE TEST RESULTS
Table 69. Weighted mean of level of risk of rollover in model C4 modified v-ditch (soft soil, passenger cars, no steering) based on analysis of test re-sults and additional approximations (approximations with italic font).
Speed / angle 5° 10° 15° 20° Level of risk (weighted mean)
Distribution 40 % 35 % 15 % 10 % 100 %
80 km/h Low Low Low Moderate Low
100 km/h Low Moderate Low M Moderate
120 km/h Low Moderate Moderate High Moderate
6.6.8 U-shaped ditch (Models U and Us)
The results of full-scale tests are presented in Table 70. In all three full-scale tests the vehicle travelled on the top of the backslope. In case of light pas-senger car (Talbot Horizon, Ford Fiesta) the vehicle continued travelling be-yond the ditch without any side-slip, intention of rollover or significant decel-eration of speed. In case of large passenger car (Volvo 244) the vehicle stopped on the top of the backslope. There was no side-slip but when the vehicle was climbing to the top of the backslope it seemed for a while that it would overturn. The maximum roll angle at that moment was approximately 60 ° and the speed was very low. One may assume that if the backslope had been higher the vehicle could have overturned.
The soil in TKK’s tests was softer in the bottom (rounded part) of the U-ditch than in V-ditch, so it can be assumed that the stiffness of soil was quite simi-lar in TKK’s and VTI’s tests.
The U-ditch in simulations was significantly deeper (1.0 m) and the profile was sharper compared with ditch profiles in full-scale tests. The ditch profile in simulations is also very close to a corresponding flat bottom ditch in real-ity. In the analysis all the test results were merged. There was one simulated test with soft soil. The results of this test are included in the general analysis of the U-ditch.
Table 70. Analysis of rollover in U-ditch (passenger cars, all soil types, no steer-ing).
Test nr
Details (soil, vehicle)
Initial speed (km/h)
Ap-proach angle (deg)
Conse-quence of
running onto backslope
Rollover (360° turns)
Side-slip
angle (deg)
Speed at critical moment (km/h)1)
Risk of rollover
P15 Pori Soft / Talbot 100 10 None 0.0 0 - 0 %
V3 VTI / Volvo 244 80 10 None 0.15 0 < 40 50 %
V4 VTI / Ford Fiesta 80 10 None 0.0 0 - 0 %
U-01 Medium, 900 kg 100 5 None 0.0 0 - 0 %
U-02 Soft, 900 kg 80 10 None 0.0 0 - 0 %
U-03 Medium, 900 kg 80 20 Crash - - - -
U-04 Medium, 900 kg 100 15 None 0.0 0 - 0 %
U-05 Medium, 1500 kg
80 10 None 0.0 0 - 0 %
U-06 Medium, 1500 kg
100 10 None 0.0 0 - 0 %
U-07 Medium, 1500 kg
120 10 None 0.0 0 - 0 %
1) Beginning of possible rollover or maximum side-slip angle up to 90°

Safety of roadside area 81 ANALYSIS OF THE TEST RESULTS
Table 71. Level of risk of rollover in U-ditch, no steering. Medium soil. Test nr
Initial speed category (km/h)
Approach angle cate-gory (deg)
Risk of rollover Level of risk
Likelihood Severity
U-01 100 5 Low Low Low
V3, V4, U-02, U-05 80 10 Low Low Low
P15, U-06 100 10 Low Low Low
U-07 120 10 Low Low Low
U-04 100 15 Low Low Low
U-03 80 20 - - -
Table 72. Weighted mean of level of risk of rollover in U-ditch (passenger cars, no steering) based on analysis of test results and additional approxi-mations (approximations with italic font).
Speed / angle 5° 10° 15° 20° Level of risk (weighted mean)
Distribution 40 % 35 % 15 % 10 % 100 %
80 km/h Low Low Low Low Low
100 km/h Low Low Low Moderate Low
120 km/h Low Low Moderate Moderate Low
6.6.9 Model C1 ditch in front of vertical wall
The vehicle hits the wall in all of the cases but overturns only in case C1 (Table 73).
Table 73. Analysis of rollover in v-ditch in front of vertical wall, e.g. cutting (pas-senger cars, all soil types, no steering). Model C1 profile (backslope 1:2, H = 1.3 m)
Test nr
Details (soil, vehicle)
Initial speed (km/h)
Ap-proach angle (deg)
Consequence of running onto backslope
Roll-over (360° turns)
Side-slip
angle (deg)
Speed at critical moment (km/h)1)
Risk of rollover
C1 Medium, 900 kg 100 15 Hit against wall, rollover
0,25 0 77 100 %
C1-01 Medium, 900 kg 80 10 Hit against wall 0,0 0 - 5 %
C1-02 Medium, 900 kg 100 10 Hit against wall 0,0 0 - 5 %
C1-03 Soft, 900 kg 100 10 Hit against wall 0,0 0 - 5 %
C1-04 Medium, 1500 kg
100 5 None 0,0 0 - 0 %
C1-05 Medium, 1500 kg
80 10 Hit against wall 0,0 0 - 5 %
C1-06 Medium, 1500 kg
100 10 Hit against wall 0,0 0 - 5 %
C1-07 Medium, 1500 kg
120 10 Hit against wall 0,0 0 - 5 % 1) Beginning of possible rollover or maximum side-slip angle up to 90°
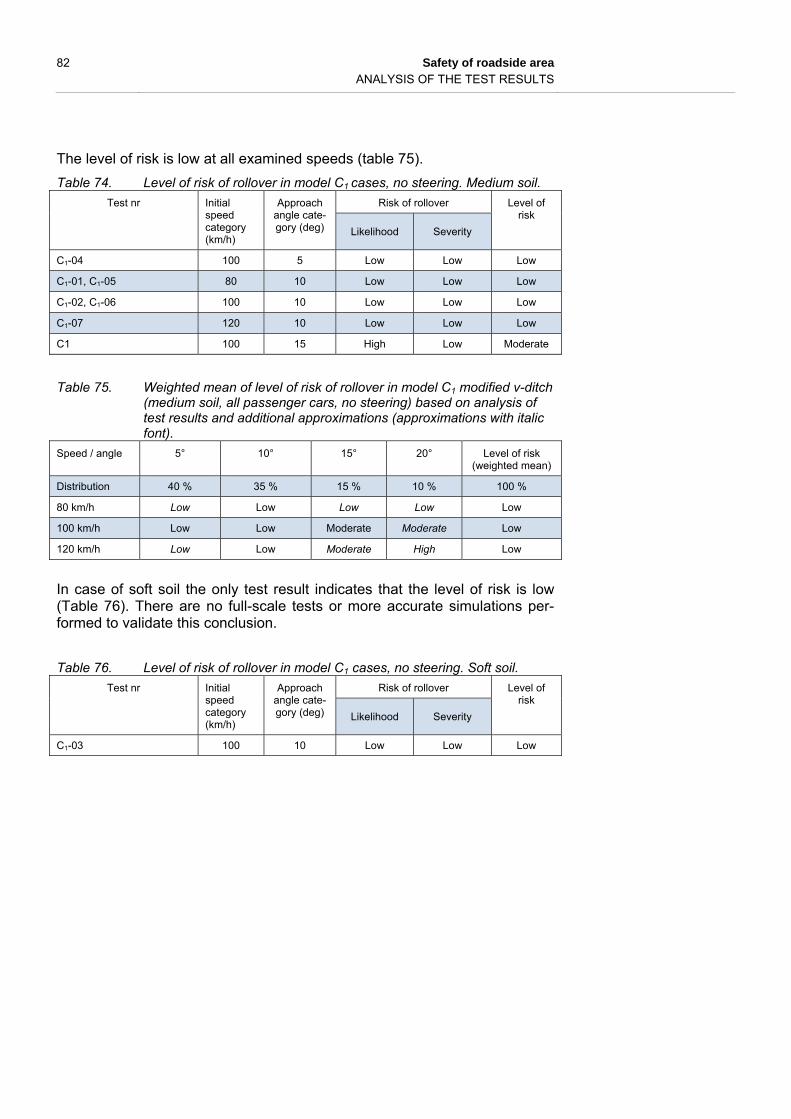
82 Safety of roadside area ANALYSIS OF THE TEST RESULTS
The level of risk is low at all examined speeds (table 75).
Table 74. Level of risk of rollover in model C1 cases, no steering. Medium soil.
Test nr
Initial speed category (km/h)
Approach angle cate-gory (deg)
Risk of rollover Level of risk
Likelihood Severity
C1-04 100 5 Low Low Low
C1-01, C1-05 80 10 Low Low Low
C1-02, C1-06 100 10 Low Low Low
C1-07 120 10 Low Low Low
C1 100 15 High Low Moderate
Table 75. Weighted mean of level of risk of rollover in model C1 modified v-ditch (medium soil, all passenger cars, no steering) based on analysis of test results and additional approximations (approximations with italic font).
Speed / angle 5° 10° 15° 20° Level of risk (weighted mean)
Distribution 40 % 35 % 15 % 10 % 100 %
80 km/h Low Low Low Low Low
100 km/h Low Low Moderate Moderate Low
120 km/h Low Low Moderate High Low
In case of soft soil the only test result indicates that the level of risk is low (Table 76). There are no full-scale tests or more accurate simulations per-formed to validate this conclusion.
Table 76. Level of risk of rollover in model C1 cases, no steering. Soft soil.
Test nr
Initial speed category (km/h)
Approach angle cate-gory (deg)
Risk of rollover Level of risk
Likelihood Severity
C1-03 100 10 Low Low Low

Safety of roadside area 83 ANALYSIS OF THE TEST RESULTS
6.6.10 Model C2 ditch in front of vertical wall
Table 77. Analysis of rollover in v-ditch in front of vertical wall, e.g. cutting (pas-senger cars, all soil types, no steering). Model C2 profile (backslope 1:2, H = 4.0 m)
Test nr
Details (soil, vehicle)
Initial speed (km/h)
Ap-proach angle (deg)
Conse-quence of
running onto backslope
Rollover (360° turns)
Side-slip
angle (deg)
Speed at critical moment (km/h)1)
Risk of rollover
C2-01 Medium, 900 kg 100 5 Hits the wall 0,0 0 - 5 %
C2-02 Soft, 900 kg 100 5 Hits the wall 0,0 0 - 10 %
C2-03 Medium, 900 kg 80 10 Hits the wall 0,0 0 - 5 %
C2-04 Medium, 900 kg 100 10 Hits the wall 0,0 0 - 5 %
C2-05 Soft, 900 kg 100 10 Hits the wall 0,0 0 - 5 %
C2-06 Medium, 900 kg 80 15 Hits the wall 0,0 0 - 5 %
C2-07 Medium, 1500 kg
100 5 None 0,0 0 - 0 %
C2-08 Medium, 1500 kg
80 10 None 0,0 0 - 0 %
C2-09 Medium, 1500 kg
100 10 None 0,0 0 - 0 %
C2-10 Medium, 1500 kg
120 10 Hits the wall 0,0 0 - 5 %
1) Beginning of possible rollover or maximum side-slip angle up to 90°
The level of risk for stiff soil is low at all examined speeds (Table 79). Re-spectively the level of risk in case of soft soil is low at speeds 80 and 100 km/h and moderate at speed of 120 km/h (0).
Table 78. Level of risk of rollover in model C2 cases, no steering. Medium soil. Test nr
Initial speed category (km/h)
Approach angle cate-gory (deg)
Risk of rollover Level of risk
Likelihood Severity
C2-01, C2-07 100 5 Low Low Low
C2-03, C2-08 80 10 Low Low Low
C2-04, C2-09 100 10 Low Low Low
C2-10 120 10 Low Low Low
C2-06 100 15 Low Low Low
Table 79. Weighted mean of level of risk of rollover in model C2 (medium soil, passenger cars, no steering) based on analysis of test results and additional approximations (approximations with italic font).
Speed / angle 5° 10° 15° 20° Level of risk (weighted mean)
Distribution 40 % 35 % 15 % 10 % 100 %
80 km/h Low Low Low Low Low
100 km/h Low Low Low Moderate Low
120 km/h Low Low Moderate High Low

84 Safety of roadside area ANALYSIS OF THE TEST RESULTS
Table 80. Risk of rollover in model C2 cases, no steering. Soft soil.
Test nr
Initial speed category (km/h)
Approach angle cate-gory (deg)
Risk of rollover Level of risk
Likelihood Severity
C2-02 100 5 Low Low Low
C2-05 100 10 Low Low Low
Table 81. Weighted mean of level of risk of rollover in model C2 modified v-ditch (soft soil, passenger cars, no steering) based on analysis of test re-sults and additional approximations (approximations with italic font).
Speed / angle 5° 10° 15° 20° Level of risk (weighted mean)
Distribution 40 % 35 % 15 % 10 % 100 %
80 km/h Low Low Low Moderate Low
100 km/h Low Low Moderate High Low
120 km/h Low Moderate High High Moderate
The level of risk in soft soil is based on two test results and comparison with the test results of stiff soil case and other ditch profiles.
6.6.11 Model C3 ditch in front of vertical wall
Table 82. Analysis of rollover in v-ditch in front of vertical wall, e.g. cutting (all passenger cars, all soil types, no steering). Model C3 profile (back-slope 1:1.5, H = 1.3 m)
Test nr
Details (soil, vehicle)
Initial speed (km/h)
Ap-proach angle (deg)
Conse-quence of
running onto backslope
Rollover (360° turns)
Side-slip
angle (deg)
Speed at critical moment (km/h)1)
Risk of rollover
C2 Medium, 900 kg 100 15 Rollover due to hit against wall
>1,0 0 80 100 %
C3 Medium, 900 kg 100 10 Rollover due to hit against wall
>1,0 -90 80 100 %
C3-01 Medium, 900 kg 100 5 Hits the wall 0,0 0 - 5 %
C3-02 Soft, 900 kg 100 5 Hits the wall 0,0 0 - 5 %
C3-03 Medium, 900 kg 80 10 Hits the wall 0,0 0 - 5 % 1) Beginning of possible rollover or maximum side-slip angle up to 90°
Table 83. Risk of rollover in model C3 cases, no steering. Medium soil.
Test nr
Initial speed category (km/h)
Approach angle cate-gory (deg)
Risk of rollover Level of risk
Likelihood Severity
C3-01 100 5 Low Low Low
C3-03 80 10 Low Low Low
C3 100 10 High Moderate High
C2 100 15 High Moderate High
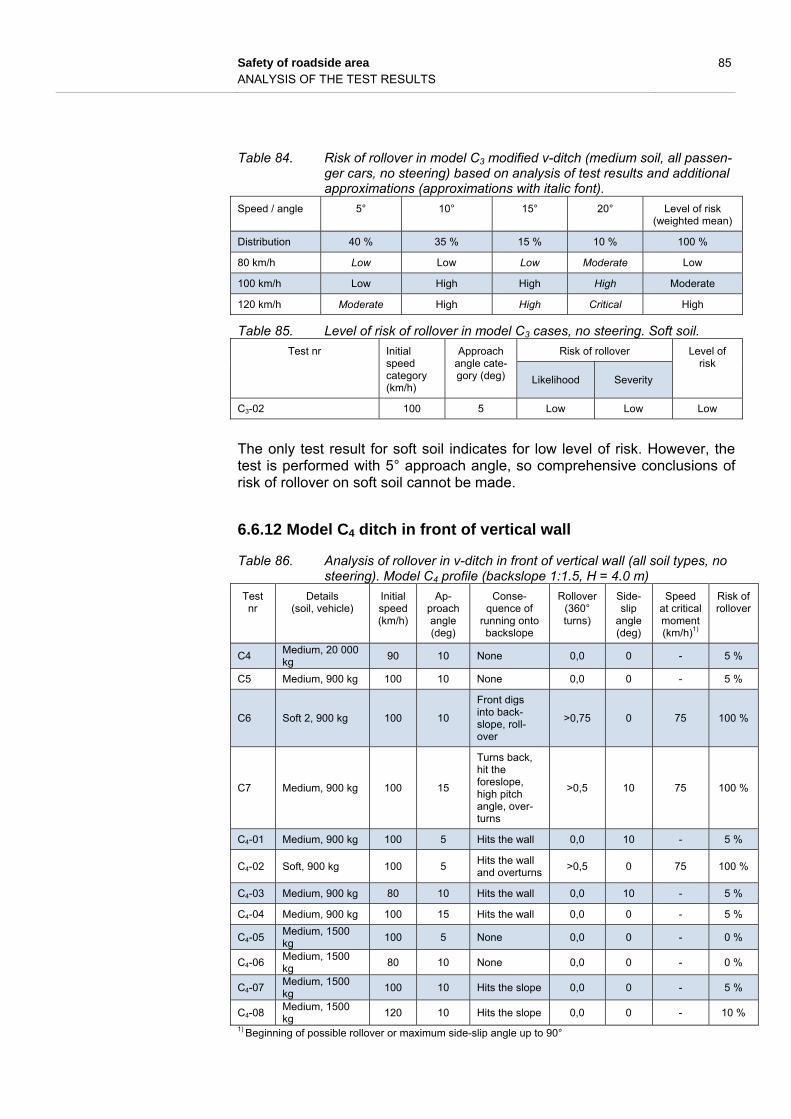
Safety of roadside area 85 ANALYSIS OF THE TEST RESULTS
Table 84. Risk of rollover in model C3 modified v-ditch (medium soil, all passen-ger cars, no steering) based on analysis of test results and additional approximations (approximations with italic font).
Speed / angle 5° 10° 15° 20° Level of risk (weighted mean)
Distribution 40 % 35 % 15 % 10 % 100 %
80 km/h Low Low Low Moderate Low
100 km/h Low High High High Moderate
120 km/h Moderate High High Critical High
Table 85. Level of risk of rollover in model C3 cases, no steering. Soft soil.
Test nr
Initial speed category (km/h)
Approach angle cate-gory (deg)
Risk of rollover Level of risk
Likelihood Severity
C3-02 100 5 Low Low Low
The only test result for soft soil indicates for low level of risk. However, the test is performed with 5° approach angle, so comprehensive conclusions of risk of rollover on soft soil cannot be made.
6.6.12 Model C4 ditch in front of vertical wall
Table 86. Analysis of rollover in v-ditch in front of vertical wall (all soil types, no steering). Model C4 profile (backslope 1:1.5, H = 4.0 m)
Test nr
Details (soil, vehicle)
Initial speed (km/h)
Ap-proach angle (deg)
Conse-quence of
running onto backslope
Rollover (360° turns)
Side-slip
angle (deg)
Speed at critical moment (km/h)1)
Risk of rollover
C4 Medium, 20 000 kg
90 10 None 0,0 0 - 5 %
C5 Medium, 900 kg 100 10 None 0,0 0 - 5 %
C6 Soft 2, 900 kg 100 10
Front digs into back-slope, roll-over
>0,75 0 75 100 %
C7 Medium, 900 kg 100 15
Turns back, hit the foreslope, high pitch angle, over-turns
>0,5 10 75 100 %
C4-01 Medium, 900 kg 100 5 Hits the wall 0,0 10 - 5 %
C4-02 Soft, 900 kg 100 5 Hits the wall and overturns
>0,5 0 75 100 %
C4-03 Medium, 900 kg 80 10 Hits the wall 0,0 10 - 5 %
C4-04 Medium, 900 kg 100 15 Hits the wall 0,0 0 - 5 %
C4-05 Medium, 1500 kg
100 5 None 0,0 0 - 0 %
C4-06 Medium, 1500 kg
80 10 None 0,0 0 - 0 %
C4-07 Medium, 1500 kg
100 10 Hits the slope 0,0 0 - 5 %
C4-08 Medium, 1500 kg
120 10 Hits the slope 0,0 0 - 10 %
1) Beginning of possible rollover or maximum side-slip angle up to 90°

86 Safety of roadside area ANALYSIS OF THE TEST RESULTS
Table 87. Level of risk of rollover in model C4 cases, no steering. Medium soil. Test nr
Initial speed category (km/h)
Approach angle cate-gory (deg)
Risk of rollover Level of risk
Likelihood Severity
C4-01, C4-05 100 5 Low Low Low
C4-03, C4-06 80 10 Low Low Low
C5, C4-07 100 10 Low Low Low
C4-08 120 10 High Low Moderate
C4-04, C7 100 15 High Low Moderate
Table 88. Weighted mean of level of risk of rollover in model C4 modified v-ditch (medium soil, passenger cars, no steering) based on analysis of test results and additional approximations (approximations with italic font).
Speed / angle 5° 10° 15° 20° Level of risk (weighted mean)
Distribution 40 % 35 % 15 % 10 % 100 %
80 km/h Low Low Low Moderate Low
100 km/h Low Low Moderate High Low
120 km/h Low Moderate High High Moderate
Table 89. Level of risk of rollover in model C4 cases, no steering. Soft soil.
Test nr
Initial speed category (km/h)
Approach angle cate-gory (deg)
Risk of rollover Level of risk
Likelihood Severity
C4-02 100 5 High Low Moderate
C6 100 10 High Low Moderate
Table 90. Weighted mean of level of risk of rollover in model C4 modified v-ditch (soft soil, passenger cars, no steering) based on analysis of test re-sults and additional approximations (approximations with italic font).
Speed / angle 5° 10° 15° 20° Level of risk (weighted mean)
Distribution 40 % 35 % 15 % 10 % 100 %
80 km/h Low Low Low Moderate Low
100 km/h Moderate Moderate Moderate High Moderate
120 km/h Moderate Moderate High High Moderate
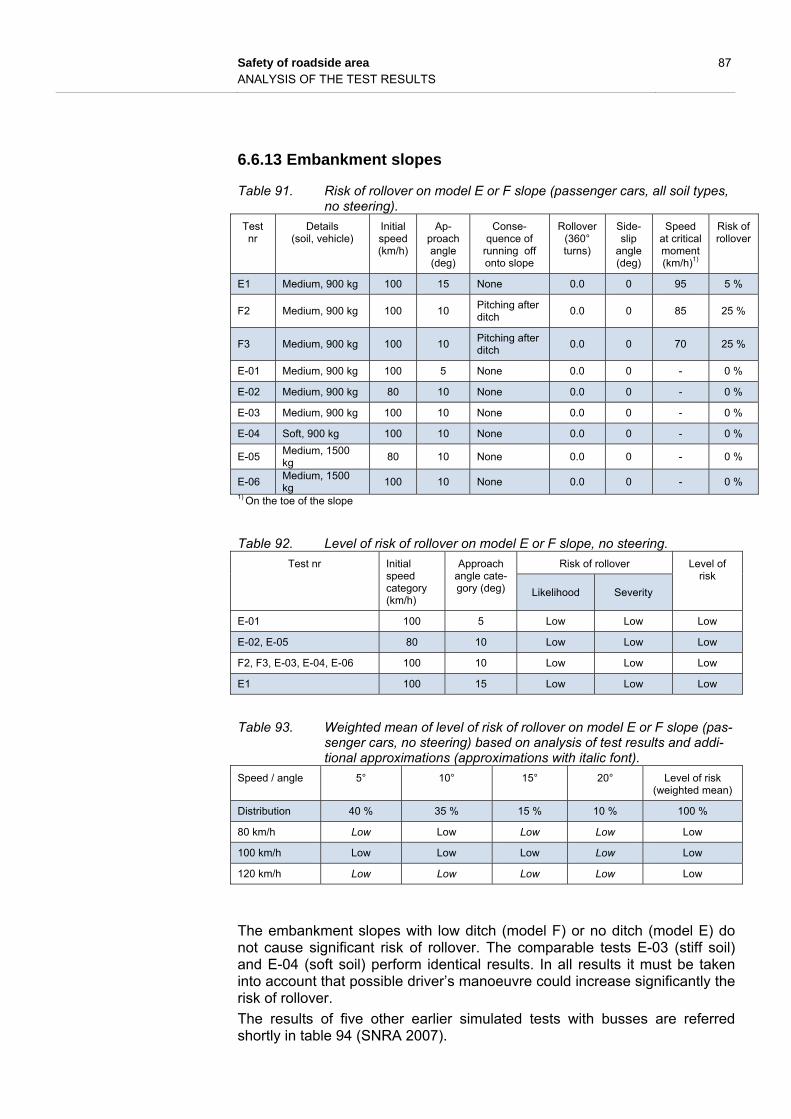
Safety of roadside area 87 ANALYSIS OF THE TEST RESULTS
6.6.13 Embankment slopes
Table 91. Risk of rollover on model E or F slope (passenger cars, all soil types, no steering).
Test nr
Details (soil, vehicle)
Initial speed (km/h)
Ap-proach angle (deg)
Conse-quence of
running off onto slope
Rollover (360° turns)
Side-slip
angle (deg)
Speed at critical moment (km/h)1)
Risk of rollover
E1 Medium, 900 kg 100 15 None 0.0 0 95 5 %
F2 Medium, 900 kg 100 10 Pitching after ditch
0.0 0 85 25 %
F3 Medium, 900 kg 100 10 Pitching after ditch
0.0 0 70 25 %
E-01 Medium, 900 kg 100 5 None 0.0 0 - 0 %
E-02 Medium, 900 kg 80 10 None 0.0 0 - 0 %
E-03 Medium, 900 kg 100 10 None 0.0 0 - 0 %
E-04 Soft, 900 kg 100 10 None 0.0 0 - 0 %
E-05 Medium, 1500 kg
80 10 None 0.0 0 - 0 %
E-06 Medium, 1500 kg
100 10 None 0.0 0 - 0 % 1) On the toe of the slope
Table 92. Level of risk of rollover on model E or F slope, no steering.
Test nr
Initial speed category (km/h)
Approach angle cate-gory (deg)
Risk of rollover Level of risk
Likelihood Severity
E-01 100 5 Low Low Low
E-02, E-05 80 10 Low Low Low
F2, F3, E-03, E-04, E-06 100 10 Low Low Low
E1 100 15 Low Low Low
Table 93. Weighted mean of level of risk of rollover on model E or F slope (pas-senger cars, no steering) based on analysis of test results and addi-tional approximations (approximations with italic font).
Speed / angle 5° 10° 15° 20° Level of risk (weighted mean)
Distribution 40 % 35 % 15 % 10 % 100 %
80 km/h Low Low Low Low Low
100 km/h Low Low Low Low Low
120 km/h Low Low Low Low Low
The embankment slopes with low ditch (model F) or no ditch (model E) do not cause significant risk of rollover. The comparable tests E-03 (stiff soil) and E-04 (soft soil) perform identical results. In all results it must be taken into account that possible driver’s manoeuvre could increase significantly the risk of rollover.
The results of five other earlier simulated tests with busses are referred shortly in table 94 (SNRA 2007).

88 Safety of roadside area ANALYSIS OF THE TEST RESULTS
Table 94. Slope simulations with 20 000 kg bus (Swedish National Road Administration 2007).
Test nr Speed and angle
Slope profile Safety barrier
Consequences
Height (m) Slopes Ditch2 Type
1 90 km/h, 10° 4.5 1:6 -> 1:31 yes none
Heavy crash into back-slope of the ditch, pitch
angle 30 deg, no rollover
2 90 km/h, 10° 4.0 1:3 yes none Heavy crash into back-slope of the ditch, pitch
angle 30 deg, no rollover
3 90 km/h, 10° 6.0 1:6 no none No crash, no rollover
4 90 km/h, 10° 4.5 1:2 - N2 Through the barrier
5 90 km/h, 10° 4.5 1:2 - H2 Restrained and redirected
by the safety barrier 1 Upper part of slope 1:6 (width 6 m), lower part of slope 1:3 (width 5 m) 2 Low V-ditch (depth 0.5 m) on the toe of the slope
6.7 Analysis of the climb height on backslope
6.7.1 General
In case of simulations the speeds and maximum climb heights are defined from photographs and graphs of the test reports. There is some inaccuracy in results because the climb height was measured from the cross-section graphs in which it was possible to measure the height of the upper part of the vehicle whereas the corresponding speeds were measures from the tra-jectory-speed-graph in which only the trajectories of the center of gravity were available instead of the uppermost parts of the vehicles. The climb heights in full-scale tests are measured from the trajectory graphs. The speed estimations are based on the test reports and videos.
6.7.2 V-shaped ditch (Model A)
The speeds are very high when a vehicle reaches the bottom of the v-ditch. In many case a vehicle climbs at height of 2 meters. The speed at that height varies a lot and depends on the seep reduction due to trajectory and possible heavy contact with backslope.
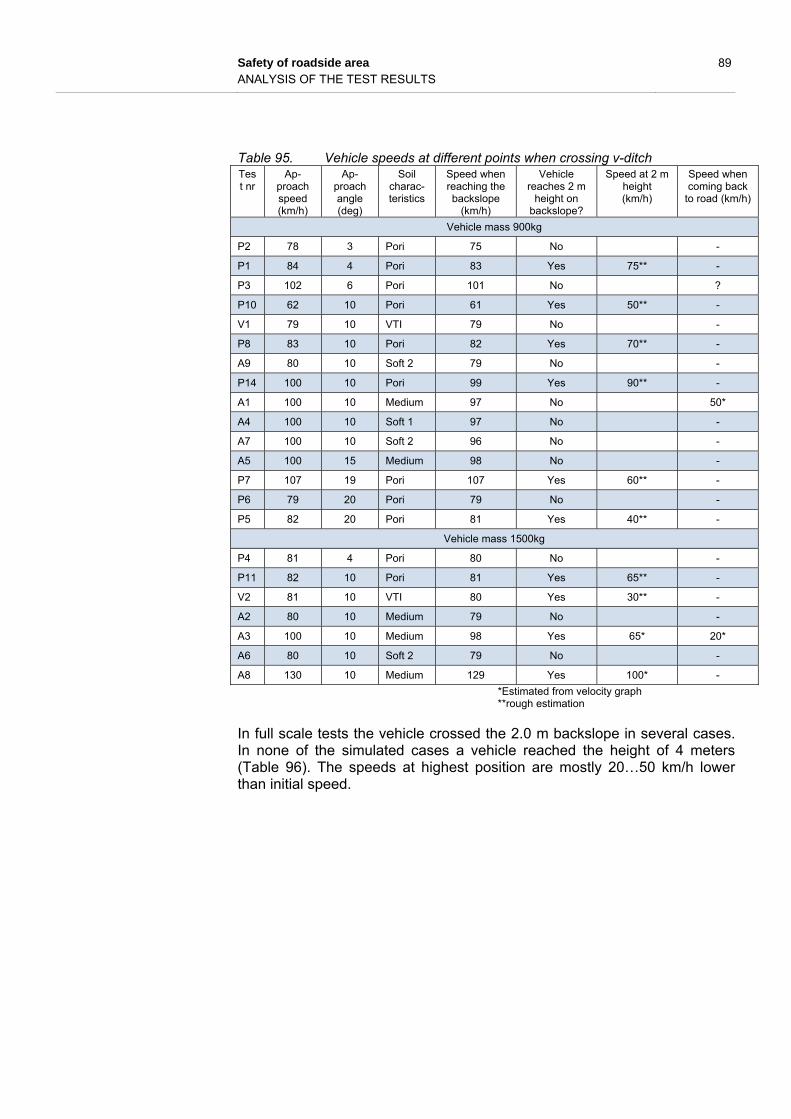
Safety of roadside area 89 ANALYSIS OF THE TEST RESULTS
Table 95. Vehicle speeds at different points when crossing v-ditch Test nr
Ap-proach speed (km/h)
Ap-proach angle (deg)
Soil charac-teristics
Speed when reaching the backslope
(km/h)
Vehicle reaches 2 m
height on backslope?
Speed at 2 m height (km/h)
Speed when coming back
to road (km/h)
Vehicle mass 900kg
P2 78 3 Pori 75 No -
P1 84 4 Pori 83 Yes 75** -
P3 102 6 Pori 101 No ?
P10 62 10 Pori 61 Yes 50** -
V1 79 10 VTI 79 No -
P8 83 10 Pori 82 Yes 70** -
A9 80 10 Soft 2 79 No -
P14 100 10 Pori 99 Yes 90** -
A1 100 10 Medium 97 No 50*
A4 100 10 Soft 1 97 No -
A7 100 10 Soft 2 96 No -
A5 100 15 Medium 98 No -
P7 107 19 Pori 107 Yes 60** -
P6 79 20 Pori 79 No -
P5 82 20 Pori 81 Yes 40** -
Vehicle mass 1500kg
P4 81 4 Pori 80 No -
P11 82 10 Pori 81 Yes 65** -
V2 81 10 VTI 80 Yes 30** -
A2 80 10 Medium 79 No -
A3 100 10 Medium 98 Yes 65* 20*
A6 80 10 Soft 2 79 No -
A8 130 10 Medium 129 Yes 100* -
*Estimated from velocity graph **rough estimation
In full scale tests the vehicle crossed the 2.0 m backslope in several cases. In none of the simulated cases a vehicle reached the height of 4 meters (Table 96). The speeds at highest position are mostly 20…50 km/h lower than initial speed.
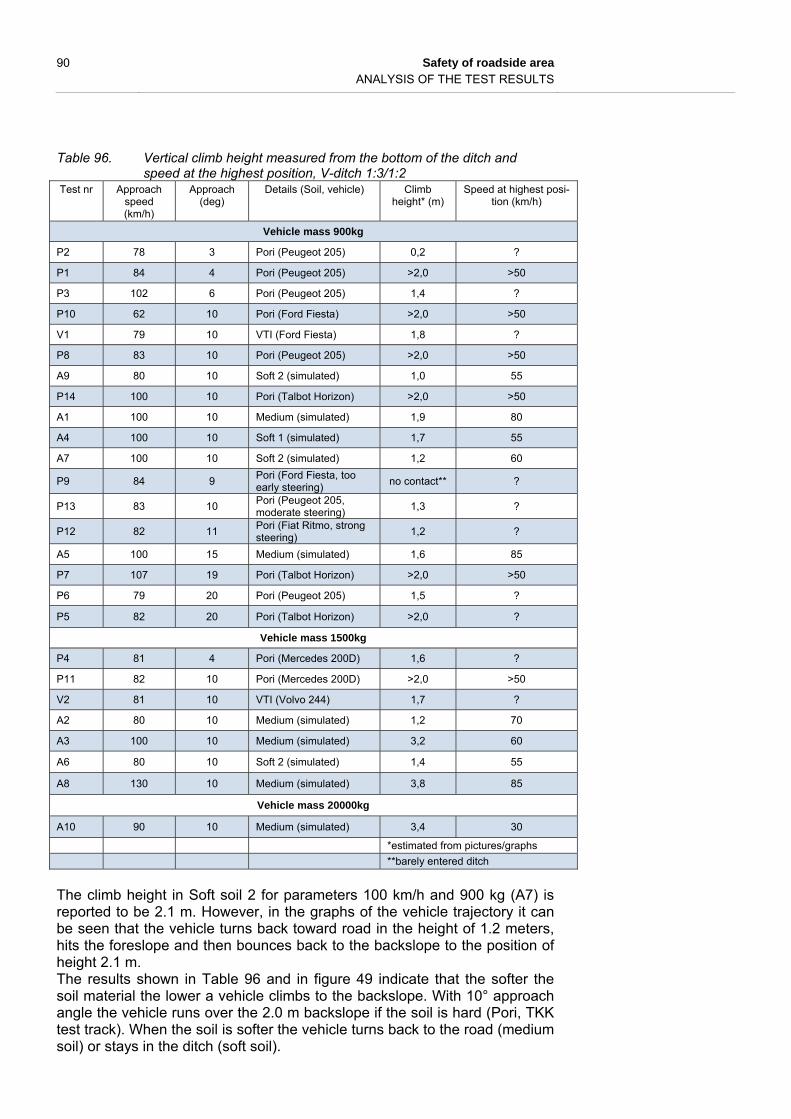
90 Safety of roadside area ANALYSIS OF THE TEST RESULTS
Table 96. Vertical climb height measured from the bottom of the ditch and speed at the highest position, V-ditch 1:3/1:2
Test nr Approach speed (km/h)
Approach (deg)
Details (Soil, vehicle) Climb height* (m)
Speed at highest posi-tion (km/h)
Vehicle mass 900kg
P2 78 3 Pori (Peugeot 205) 0,2 ?
P1 84 4 Pori (Peugeot 205) >2,0 >50
P3 102 6 Pori (Peugeot 205) 1,4 ?
P10 62 10 Pori (Ford Fiesta) >2,0 >50
V1 79 10 VTI (Ford Fiesta) 1,8 ?
P8 83 10 Pori (Peugeot 205) >2,0 >50
A9 80 10 Soft 2 (simulated) 1,0 55
P14 100 10 Pori (Talbot Horizon) >2,0 >50
A1 100 10 Medium (simulated) 1,9 80
A4 100 10 Soft 1 (simulated) 1,7 55
A7 100 10 Soft 2 (simulated) 1,2 60
P9 84 9 Pori (Ford Fiesta, too early steering)
no contact** ?
P13 83 10 Pori (Peugeot 205, moderate steering)
1,3 ?
P12 82 11 Pori (Fiat Ritmo, strong steering)
1,2 ?
A5 100 15 Medium (simulated) 1,6 85
P7 107 19 Pori (Talbot Horizon) >2,0 >50
P6 79 20 Pori (Peugeot 205) 1,5 ?
P5 82 20 Pori (Talbot Horizon) >2,0 ?
Vehicle mass 1500kg
P4 81 4 Pori (Mercedes 200D) 1,6 ?
P11 82 10 Pori (Mercedes 200D) >2,0 >50
V2 81 10 VTI (Volvo 244) 1,7 ?
A2 80 10 Medium (simulated) 1,2 70
A3 100 10 Medium (simulated) 3,2 60
A6 80 10 Soft 2 (simulated) 1,4 55
A8 130 10 Medium (simulated) 3,8 85
Vehicle mass 20000kg
A10 90 10 Medium (simulated) 3,4 30
*estimated from pictures/graphs
**barely entered ditch
The climb height in Soft soil 2 for parameters 100 km/h and 900 kg (A7) is reported to be 2.1 m. However, in the graphs of the vehicle trajectory it can be seen that the vehicle turns back toward road in the height of 1.2 meters, hits the foreslope and then bounces back to the backslope to the position of height 2.1 m. The results shown in Table 96 and in figure 49 indicate that the softer the soil material the lower a vehicle climbs to the backslope. With 10° approach angle the vehicle runs over the 2.0 m backslope if the soil is hard (Pori, TKK test track). When the soil is softer the vehicle turns back to the road (medium soil) or stays in the ditch (soft soil).

Safety of roadside area 91 ANALYSIS OF THE TEST RESULTS
Figure 49 Climb heights on the backslope based on the results of full-scale
tests and simulations. Approach angle 10°: V-ditch with foreslope 1:3 and backslope 1:2 (height 2.0 min full-scale tests, 4.0 m in simula-tions). (Vänell 2006, Norwegian Public Road Administration May 2006a, FinnRA 2003)
When the approach speed of small passenger car was 100 km/h the safest results were reached with 5° approach angle (TKK’s test) and with soft soil (simulations): climb height was less approximately 1.5 m, the errant vehicle did not overturn and it came to rest in the ditch (figure 50).
Figure 50 Climb heights on the backslope based on the results of full-scale
tests and simulations. Small passenger car with approach speed 100 km/h, V-ditch with foreslope 1:3 and backslope 1:2 (height 2.0 m). (Norwegian Public Road Administration May 2006a, FinnRA 2003)
The results with 80 km/h speed and large passenger car are a little bit less succesful: the climb heights are quite similar but in both simulated cases (medium and soft 2 soil) the vehicle overturns.
2,2
1,7
1,0
2,2
1,8
1,21,4
2,21,9
1,7
1,2
3,2
0,0
0,5
1,0
1,5
2,0
Pori soil (hard) VTI soil Medium soil Soft 1 soil Soft 2 soil
hei
gh
t o
f th
e b
acks
lop
e (m
)
"soil stiffness"
Climb height (m) in V-ditch, approach angle 10°
80 km/h, 900 kg 80 km/h, 1500 kg 100 km/h, 900 kg 100 km/h, 1500 kg
0
0,5
1
1,5
2
5° Pori 10° Pori 20° Pori 10° Med 15° Med 10° Soft1 10° Soft2
Climb height in V-ditch (m) vs. approach angle (deg)small vehicle 900 kg, speed 100 km/h
over 2 m backslope
ditch
ditch
rollover
rollover
ditch
back to road

92 Safety of roadside area ANALYSIS OF THE TEST RESULTS
Figure 51 Climb heights on the backslope based on the results of full-scale
tests and simulations. Large passenger car with approach speed 80 km/h, V-ditch with foreslope 1:3 and backslope 1:2 (height 2.0 m). (Norwegian Public Road Administration May 2006a, FinnRA 2003)
0
0,5
1
1,5
2
5° Pori 10° Pori 10° VTI 10° Med 10° Soft2
Climb height in V-ditch (m) vs. approach angle (deg)small vehicle 1500 kg, speed 80 km/h
over 2 m backslope
rollover
rollover
remained in the ditch rollover
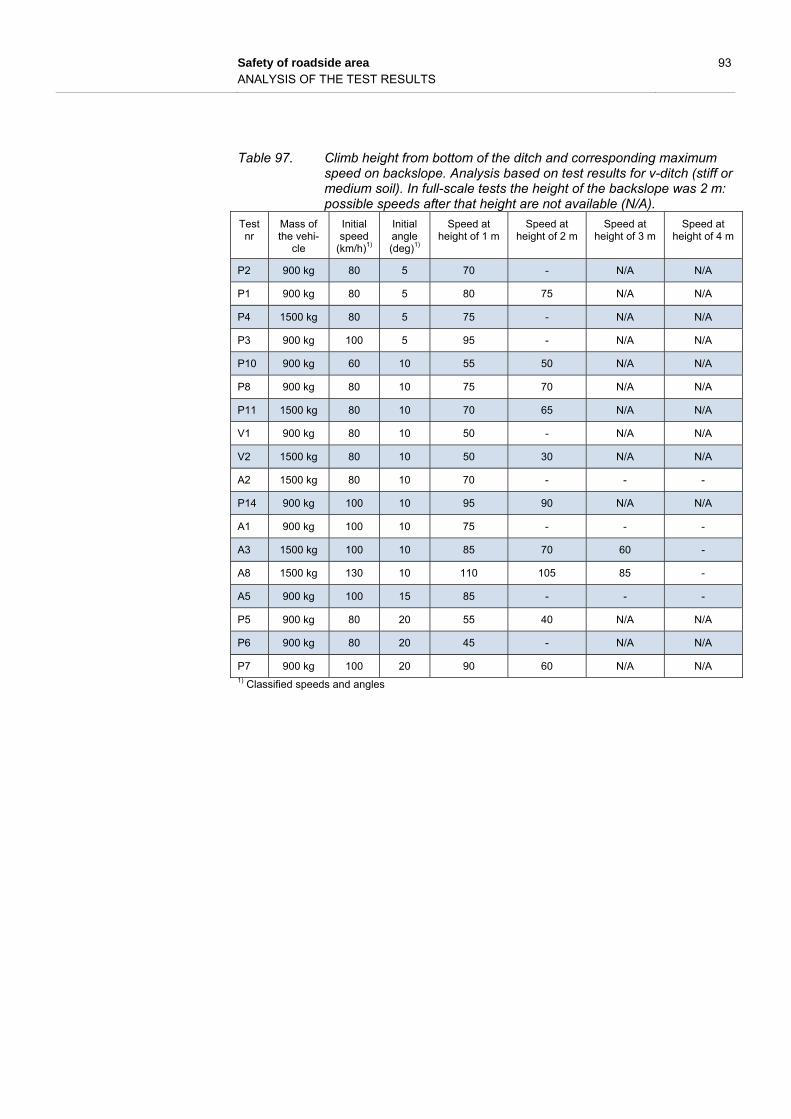
Safety of roadside area 93 ANALYSIS OF THE TEST RESULTS
Table 97. Climb height from bottom of the ditch and corresponding maximum speed on backslope. Analysis based on test results for v-ditch (stiff or medium soil). In full-scale tests the height of the backslope was 2 m: possible speeds after that height are not available (N/A).
Test nr
Mass of the vehi-
cle
Initial speed
(km/h)1)
Initial angle (deg)1)
Speed at height of 1 m
Speed at height of 2 m
Speed at height of 3 m
Speed at height of 4 m
P2 900 kg 80 5 70 - N/A N/A
P1 900 kg 80 5 80 75 N/A N/A
P4 1500 kg 80 5 75 - N/A N/A
P3 900 kg 100 5 95 - N/A N/A
P10 900 kg 60 10 55 50 N/A N/A
P8 900 kg 80 10 75 70 N/A N/A
P11 1500 kg 80 10 70 65 N/A N/A
V1 900 kg 80 10 50 - N/A N/A
V2 1500 kg 80 10 50 30 N/A N/A
A2 1500 kg 80 10 70 - - -
P14 900 kg 100 10 95 90 N/A N/A
A1 900 kg 100 10 75 - - -
A3 1500 kg 100 10 85 70 60 -
A8 1500 kg 130 10 110 105 85 -
A5 900 kg 100 15 85 - - -
P5 900 kg 80 20 55 40 N/A N/A
P6 900 kg 80 20 45 - N/A N/A
P7 900 kg 100 20 90 60 N/A N/A 1) Classified speeds and angles
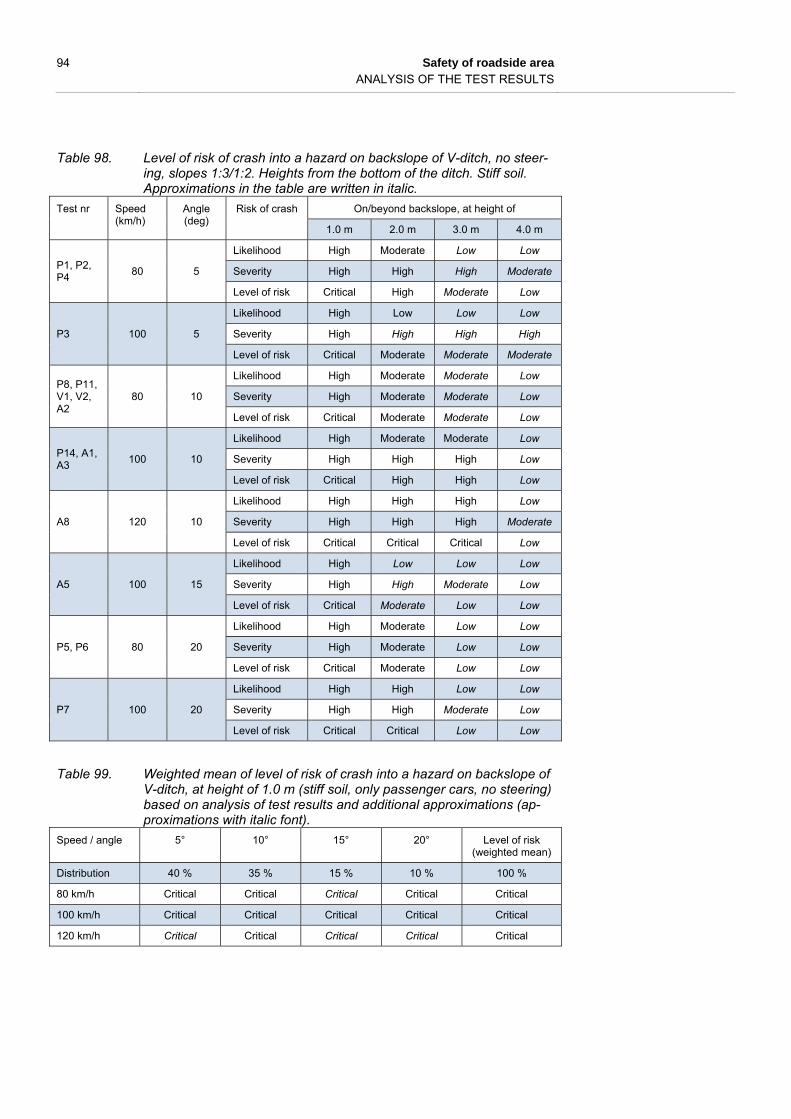
94 Safety of roadside area ANALYSIS OF THE TEST RESULTS
Table 98. Level of risk of crash into a hazard on backslope of V-ditch, no steer-ing, slopes 1:3/1:2. Heights from the bottom of the ditch. Stiff soil. Approximations in the table are written in italic.
Test nr
Speed (km/h)
Angle (deg)
Risk of crash
On/beyond backslope, at height of
1.0 m 2.0 m 3.0 m 4.0 m
P1, P2, P4
80 5
Likelihood High Moderate Low Low
Severity High High High Moderate
Level of risk Critical High Moderate Low
P3 100 5
Likelihood High Low Low Low
Severity High High High High
Level of risk Critical Moderate Moderate Moderate
P8, P11, V1, V2, A2
80 10
Likelihood High Moderate Moderate Low
Severity High Moderate Moderate Low
Level of risk Critical Moderate Moderate Low
P14, A1, A3
100 10
Likelihood High Moderate Moderate Low
Severity High High High Low
Level of risk Critical High High Low
A8 120 10
Likelihood High High High Low
Severity High High High Moderate
Level of risk Critical Critical Critical Low
A5 100 15
Likelihood High Low Low Low
Severity High High Moderate Low
Level of risk Critical Moderate Low Low
P5, P6 80 20
Likelihood High Moderate Low Low
Severity High Moderate Low Low
Level of risk Critical Moderate Low Low
P7 100 20
Likelihood High High Low Low
Severity High High Moderate Low
Level of risk Critical Critical Low Low
Table 99. Weighted mean of level of risk of crash into a hazard on backslope of V-ditch, at height of 1.0 m (stiff soil, only passenger cars, no steering) based on analysis of test results and additional approximations (ap-proximations with italic font).
Speed / angle 5° 10° 15° 20° Level of risk (weighted mean)
Distribution 40 % 35 % 15 % 10 % 100 %
80 km/h Critical Critical Critical Critical Critical
100 km/h Critical Critical Critical Critical Critical
120 km/h Critical Critical Critical Critical Critical

Safety of roadside area 95 ANALYSIS OF THE TEST RESULTS
Table 100. Weighted mean of level of risk of crash into a hazard on backslope of V-ditch, at height of 2.0 m (stiff soil, only passenger cars, no steering) based on analysis of test results and additional approximations (ap-proximations with italic font).
Speed / angle 5° 10° 15° 20° Level of risk (weighted mean)
Distribution 40 % 35 % 15 % 10 % 100 %
80 km/h Low Moderate Moderate Moderate Moderate
100 km/h Moderate High Moderate Critical High
120 km/h High Critical Critical Critical Critical
Table 101. Weighted mean of level of risk of crash into a hazard on backslope of V-ditch, at height of 3.0 m (stiff soil, only passenger cars, no steering) based on analysis of test results and additional approximations (ap-proximations with italic font).
Speed / angle 5° 10° 15° 20° Level of risk (weighted mean)
Distribution 40 % 35 % 15 % 10 % 100 %
80 km/h Moderate Moderate Low Low Moderate
100 km/h Moderate High Low Low Moderate
120 km/h Moderate Critical High Moderate High
Table 102. Weighted mean of level of risk of crash into a hazard on backslope of V-ditch, at height of 4.0 m (stiff soil, only passenger cars, no steering) based on analysis of test results and additional approximations (ap-proximations with italic font).
Speed / angle 5° 10° 15° 20° Level of risk (weighted mean)
Distribution 40 % 35 % 15 % 10 % 100 %
80 km/h Low Low Low Low Low
100 km/h Moderate Low Low Low Low
120 km/h Low Low Low Low Low
Table 103. Climb height from bottom of the ditch and corresponding maximum speed on backslope. Analysis based on test results for v-ditch (soft soil). In full-scale tests the height of the backslope was 2 m: possible speeds after that height are not available (N/A).
Test nr
Mass of the vehi-
cle
Initial speed
(km/h)1)
Initial angle (deg)1)
Speed at height of 1 m
Speed at height of 2 m
Speed at height of 3 m
Speed at height of 4 m
A9 900 kg 80 10 55 - N/A N/A
A6 1500 kg 80 10 55 - N/A N/A
A4 900 kg 100 10 70 - N/A N/A
A7 900 kg 100 10 65 - N/A N/A 1) Classified speeds and angles

96 Safety of roadside area ANALYSIS OF THE TEST RESULTS
Table 104. Level of risk of crash into a hazard on backslope of V-ditch, no steer-ing, slopes 1:3/1:2. Heights from the bottom of the ditch. Soft soil.
Test nr
Speed (km/h)
Angle (deg)
Risk of crash
On/beyond backslope, at height of
1.0 m 2.0 m 3.0 m 4.0 m
A6, A9 80 10
Likelihood High Low Low Low
Severity High Moderate Low Low
Level of risk Critical Low Low Low
A4, A7 100 10
Likelihood High Moderate Low Low
Severity High High Moderate Low
Level of risk Critical High Low Low
Table 105. Weighted mean of level of risk of crash into a hazard on backslope of V-ditch, at height of 1.0 m (soft soil, only passenger cars, no steering) based on analysis of test results and additional approximations (ap-proximations with italic font).
Speed / angle 5° 10° 15° 20° Level of risk (weighted mean)
Distribution 40 % 35 % 15 % 10 % 100 %
80 km/h High High Critical Critical High
100 km/h Critical Critical Critical Critical Critical
120 km/h Critical Critical Critical Critical Critical
Table 106. Weighted mean of level of risk of crash into a hazard on backslope of V-ditch, at height of 2.0 m (soft soil, only passenger cars, no steering) based on analysis of test results and additional approximations (ap-proximations with italic font).
Speed / angle 5° 10° 15° 20° Level of risk (weighted mean)
Distribution 40 % 35 % 15 % 10 % 100 %
80 km/h Low Moderate Moderate Low Moderate
100 km/h Moderate High Moderate Moderate Moderate
120 km/h High High Moderate Moderate High
Table 107. Weighted mean of level of risk of crash into a hazard on backslope of V-ditch, at height of 3.0 m (soft soil, only passenger cars, no steering) based on analysis of test results and additional approximations (ap-proximations with italic font).
Speed / angle 5° 10° 15° 20° Level of risk (weighted mean)
Distribution 40 % 35 % 15 % 10 % 100 %
80 km/h Low Low Low Low Low
100 km/h Low Low Low Moderate Low
120 km/h Moderate High Moderate Low Moderate

Safety of roadside area 97 ANALYSIS OF THE TEST RESULTS
Table 108. Weighted mean of level of risk of crash into a hazard on backslope of V-ditch, at height of 4.0 m (soft soil, only passenger cars, no steering) based on analysis of test results and additional approximations (ap-proximations with italic font).
Speed / angle 5° 10° 15° 20° Level of risk (weighted mean)
Distribution 40 % 35 % 15 % 10 % 100 %
80 km/h Low Low Low Low Low
100 km/h Low Low Low Low Low
120 km/h Low Low Low Low Low
6.7.3 U-shaped ditch (Models U and Us)
In full-scale tests the soil was softer in U-ditch than it was in V-ditch. In the analysis of U-ditch all the results are merged for better representativeness.
Table 109. Vertical climb height measured from the bottom of the ditch and speed at the highest position, U-ditch, rounded bottom
Test nr
Approach speed (km/h)
Approach (deg)
Details (Soil, vehicle) Climb height (m)
Speed at highest posi-tion (km/h)1
P15 96 10 Pori Soft / Talbot Horizon >1,5 90
V3 80 10 VTI / Volvo 244 1,7 30
V4 81 10 VTI / Ford Fiesta >1,7 70
U-01 100 5 Medium, 900 kg 1.1 95
U-02 80 10 Soft, 900 kg 2.1 75
U-03 80 20 Medium, 900 kg 0.0 80
U-04 100 15 Medium, 900 kg 4.0 90
U-05 80 10 Medium, 1500 kg 4.0 70
U-06 100 10 Medium, 1500 kg 4.0 90
U-07 120 10 Medium, 1500 kg 4.0 110
1) rough estimation
Table 110. Climb height from bottom of the ditch and corresponding maximum speed on backslope. Analysis based on test results for U-ditch (stiff or medium soil). In full-scale tests the height of the backslope was 1.5…1.7 m: possible speeds at height of 2 m are estimated.
Test nr
Mass of the vehi-
cle
Initial speed
(km/h)1)
Initial angle (deg)1)
Speed at height of 1 m
Speed at height of 2 m
Speed at height of 3 m
Speed at height of 4 m
P15 900 100 10 95 85 N/A N/A
V3 1500 80 10 70 0 N/A N/A
V4 900 80 10 75 60 N/A N/A
U-01 900 100 5 95 - - -
U-02 900 80 10 80 75 - -
U-03 900 80 20 - - - -
U-04 900 100 15 100 95 95 90
U-05 1500 80 10 80 75 75 70
U-06 1500 100 10 100 95 95 90
U-07 1500 120 10 120 115 110 110 1) Classified speeds and angles
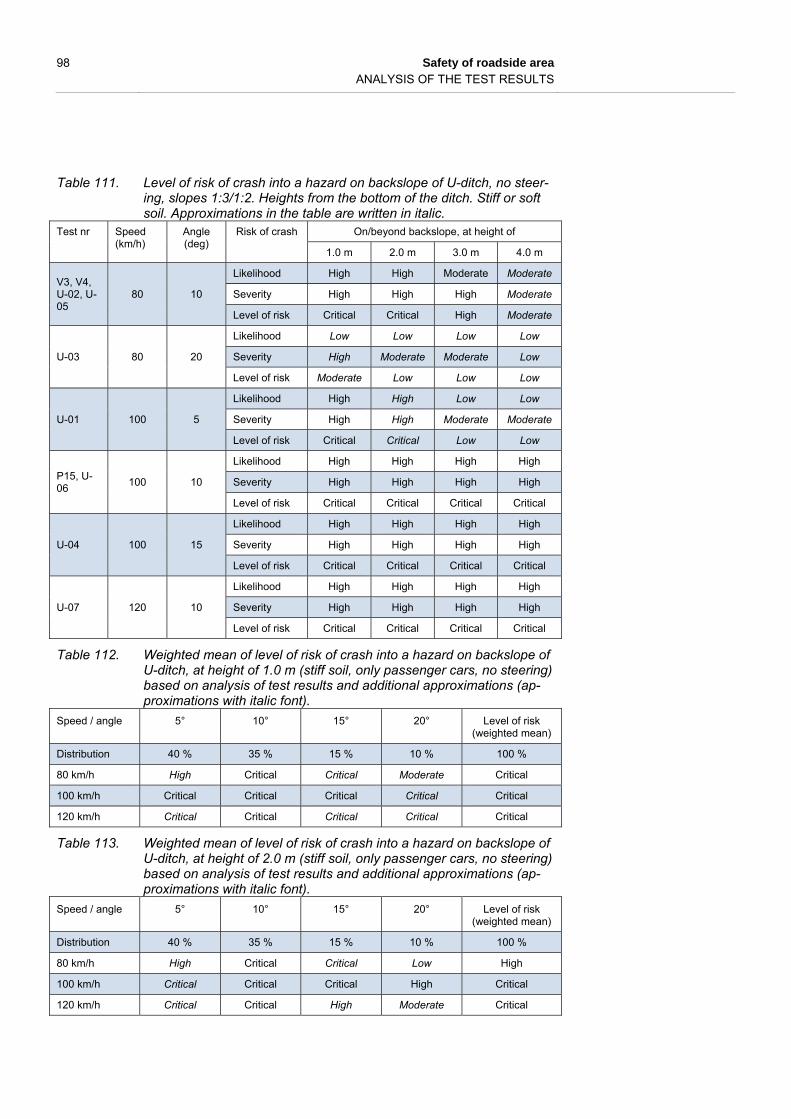
98 Safety of roadside area ANALYSIS OF THE TEST RESULTS
Table 111. Level of risk of crash into a hazard on backslope of U-ditch, no steer-ing, slopes 1:3/1:2. Heights from the bottom of the ditch. Stiff or soft soil. Approximations in the table are written in italic.
Test nr
Speed (km/h)
Angle (deg)
Risk of crash
On/beyond backslope, at height of
1.0 m 2.0 m 3.0 m 4.0 m
V3, V4, U-02, U-05
80 10
Likelihood High High Moderate Moderate
Severity High High High Moderate
Level of risk Critical Critical High Moderate
U-03 80 20
Likelihood Low Low Low Low
Severity High Moderate Moderate Low
Level of risk Moderate Low Low Low
U-01 100 5
Likelihood High High Low Low
Severity High High Moderate Moderate
Level of risk Critical Critical Low Low
P15, U-06
100 10
Likelihood High High High High
Severity High High High High
Level of risk Critical Critical Critical Critical
U-04 100 15
Likelihood High High High High
Severity High High High High
Level of risk Critical Critical Critical Critical
U-07 120 10
Likelihood High High High High
Severity High High High High
Level of risk Critical Critical Critical Critical
Table 112. Weighted mean of level of risk of crash into a hazard on backslope of U-ditch, at height of 1.0 m (stiff soil, only passenger cars, no steering) based on analysis of test results and additional approximations (ap-proximations with italic font).
Speed / angle 5° 10° 15° 20° Level of risk (weighted mean)
Distribution 40 % 35 % 15 % 10 % 100 %
80 km/h High Critical Critical Moderate Critical
100 km/h Critical Critical Critical Critical Critical
120 km/h Critical Critical Critical Critical Critical
Table 113. Weighted mean of level of risk of crash into a hazard on backslope of U-ditch, at height of 2.0 m (stiff soil, only passenger cars, no steering) based on analysis of test results and additional approximations (ap-proximations with italic font).
Speed / angle 5° 10° 15° 20° Level of risk (weighted mean)
Distribution 40 % 35 % 15 % 10 % 100 %
80 km/h High Critical Critical Low High
100 km/h Critical Critical Critical High Critical
120 km/h Critical Critical High Moderate Critical

Safety of roadside area 99 ANALYSIS OF THE TEST RESULTS
Table 114. Weighted mean of level of risk of crash into a hazard on backslope of U-ditch, at height of 3.0 m (stiff soil, only passenger cars, no steering) based on analysis of test results and additional approximations (ap-proximations with italic font).
Speed / angle 5° 10° 15° 20° Level of risk (weighted mean)
Distribution 40 % 35 % 15 % 10 % 100 %
80 km/h Low High Moderate Low Moderate
100 km/h Low Critical Critical High High
120 km/h Moderate Critical High Moderate High
Table 115. Weighted mean of level of risk of crash into a hazard on backslope of U-ditch, at height of 4.0 m (stiff soil, only passenger cars, no steering) based on analysis of test results and additional approximations (ap-proximations with italic font).
Speed / angle 5° 10° 15° 20° Level of risk (weighted mean)
Distribution 40 % 35 % 15 % 10 % 100 %
80 km/h Low Moderate Moderate Low Moderate
100 km/h Low Critical Critical Moderate High
120 km/h Low Critical High Low Moderate
6.7.4 Modified V-shaped ditch (Model B)
Table 116. Vertical climb height measured from the bottom of the ditch and speed at the highest position, model B ditch
Test nr Approach speed (km/h)
Approach angle(deg)
Details (Soil, vehicle) Climb height (m)
Speed at highest posi-tion (km/h)1
B2 100 15 Medium, 1500 kg 3.7 60
B3 100 10 Medium, 1500 kg 2.2 70
B-01 100 5 Medium, 900 kg 1.2 95
B-02 100 5 Soft, 900 kg 1.7 95
B-03 80 10 Medium, 900 kg 4.0 70
B-04 100 10 Medium, 900 kg 2.1 95
B-05 100 10 Soft, 900 kg 2.2 95
B-06 100 15 Medium, 900 kg - -
B-07 100 5 Medium, 1500 kg 2.3 85
B-08 80 10 Medium, 1500 kg 4.0 70
B-09 120 10 Medium, 1500 kg - -

100 Safety of roadside area ANALYSIS OF THE TEST RESULTS
Table 117. Climb height from bottom of the ditch and corresponding maximum speed on backslope. Analysis based on test results for model B ditch (stiff or medium soil).
Test nr
Mass of the vehi-
cle
Initial speed (km/h)
Initial angle (deg)
Speed at height of 1 m
Speed at height of 2 m
Speed at height of 3 m
Speed at height of 4 m
B2 1500 100 15 70 65 60 -
B3 1500 100 10 85 75 - -
B-01 900 100 5 95 - - -
B-02 900 100 5 95 - - -
B-03 900 80 10 75 70 70 65
B-04 900 100 10 95 95 - -
B-05 900 100 10 95 95 - -
B-06 900 100 15 - - - -
B-07 1500 100 5 95 85 - -
B-08 1500 80 10 80 75 75 70
B-09 1500 120 10 - - - -
Table 118. Level of risk of crash into a hazard on backslope of V-ditch, no steer-ing, slopes 1:3/1:2. Heights from the bottom of the ditch. Stiff soil. Approximations in the table are written in italic.
Test nr
Speed (km/h)
Angle (deg)
Risk of crash
On/beyond backslope, at height of
1.0 m 2.0 m 3.0 m 4.0 m
B-03, B-08
80 10
Likelihood High High High High
Severity High High High High
Level of risk Critical Critical Critical Critical
B-01, B-07
100 5
Likelihood High Moderate Low Low
Severity High High High Moderate
Level of risk Critical High Moderate Low
B-02
Soft soil 100 5
Likelihood High Moderate Low Low
Severity High High High Moderate
Level of risk Critical High Low Low
B3, B-04 100 10
Likelihood High High Low Low
Severity High High High High
Level of risk Critical Critical Moderate Moderate
B-05
Soft soil 100 10
Likelihood High High Low Low
Severity High High High Moderate
Level of risk Critical Critical Moderate Low
B2, B-06 100 15
Likelihood High Moderate Moderate Low
Severity High High High Moderate
Level of risk Critical High High Low
B-09 120 10
Likelihood High Low Low Low
Severity High High High High
Level of risk Critical Moderate Moderate Moderate
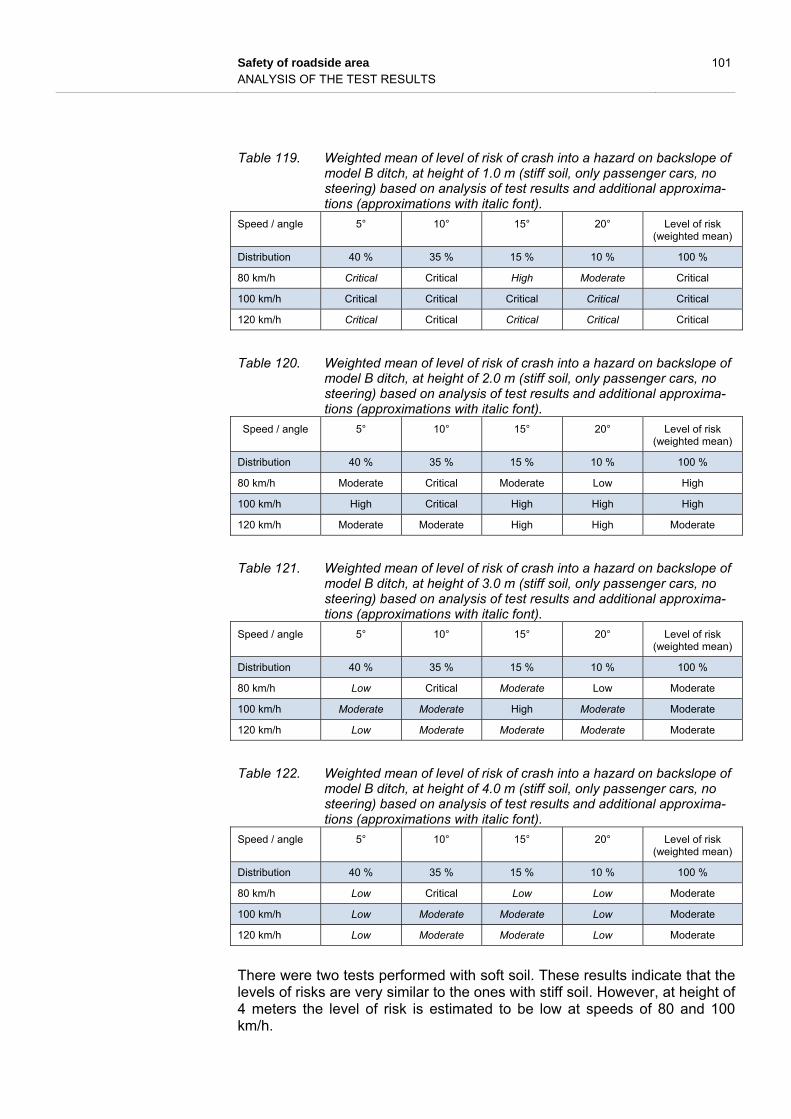
Safety of roadside area 101 ANALYSIS OF THE TEST RESULTS
Table 119. Weighted mean of level of risk of crash into a hazard on backslope of model B ditch, at height of 1.0 m (stiff soil, only passenger cars, no steering) based on analysis of test results and additional approxima-tions (approximations with italic font).
Speed / angle 5° 10° 15° 20° Level of risk (weighted mean)
Distribution 40 % 35 % 15 % 10 % 100 %
80 km/h Critical Critical High Moderate Critical
100 km/h Critical Critical Critical Critical Critical
120 km/h Critical Critical Critical Critical Critical
Table 120. Weighted mean of level of risk of crash into a hazard on backslope of model B ditch, at height of 2.0 m (stiff soil, only passenger cars, no steering) based on analysis of test results and additional approxima-tions (approximations with italic font).
Speed / angle 5° 10° 15° 20° Level of risk (weighted mean)
Distribution 40 % 35 % 15 % 10 % 100 %
80 km/h Moderate Critical Moderate Low High
100 km/h High Critical High High High
120 km/h Moderate Moderate High High Moderate
Table 121. Weighted mean of level of risk of crash into a hazard on backslope of model B ditch, at height of 3.0 m (stiff soil, only passenger cars, no steering) based on analysis of test results and additional approxima-tions (approximations with italic font).
Speed / angle 5° 10° 15° 20° Level of risk (weighted mean)
Distribution 40 % 35 % 15 % 10 % 100 %
80 km/h Low Critical Moderate Low Moderate
100 km/h Moderate Moderate High Moderate Moderate
120 km/h Low Moderate Moderate Moderate Moderate
Table 122. Weighted mean of level of risk of crash into a hazard on backslope of model B ditch, at height of 4.0 m (stiff soil, only passenger cars, no steering) based on analysis of test results and additional approxima-tions (approximations with italic font).
Speed / angle 5° 10° 15° 20° Level of risk (weighted mean)
Distribution 40 % 35 % 15 % 10 % 100 %
80 km/h Low Critical Low Low Moderate
100 km/h Low Moderate Moderate Low Moderate
120 km/h Low Moderate Moderate Low Moderate
There were two tests performed with soft soil. These results indicate that the levels of risks are very similar to the ones with stiff soil. However, at height of 4 meters the level of risk is estimated to be low at speeds of 80 and 100 km/h.

102 Safety of roadside area ANALYSIS OF THE TEST RESULTS
6.7.5 Modified V-shaped ditch (Model C1 and C2)
Table 123. Vertical climb height measured from the bottom of the ditch and speed at the highest position, model C1 ditch profile (vertical wall on the top of the backslope)
Test nr Approach speed (km/h)
Approach (deg)
Details (Soil, vehicle) Climb height (m)
Speed at highest posi-tion (km/h)1
C1 100 15 Medium, 900 kg 1.3 90
C1-01 80 10 Medium, 900 kg 1.3 75
C1-02 100 10 Medium, 900 kg 1.3 95
C1-03 100 10 Soft, 900 kg 1.3 95
C1-04 100 5 Medium, 1500 kg 0.7 100
C1-05 80 10 Medium, 1500 kg 1.3 75
C1-06 100 10 Medium, 1500 kg 1.3 95
C1-07 120 10 Medium, 1500 kg 1.3 115
Table 124. Climb height from bottom of the ditch and corresponding maximum speed on backslope. Analysis based on test results for model C1 ditch (stiff or medium soil).
Test nr
Mass of the vehi-
cle
Initial speed
(km/h)1)
Initial angle (deg)1)
Speed at height of 1 m
Speed at height of 2 m
Speed at height of 3 m
Speed at height of 4 m
C1 900 100 15 90 - - -
C1-01 1500 80 10 75 - - -
C1-02 900 100 10 95 - - -
C1-03 900 100 10 95 - - -
C1-04 1500 100 5 - - - -
C1-05 1500 80 10 75 - - -
C1-06 1500 100 10 95 - - -
C1-07 1500 120 10 115 - - -
Table 125. Vertical climb height measured from the bottom of the ditch and speed at the highest position, model C2 ditch profile (vertical wall on the top of the backslope)
Test nr Approach speed (km/h)
Approach (deg)
Details (Soil, vehicle) Climb height (m)
Speed at highest posi-tion (km/h)1
C2-01 100 5 Medium, 900 kg 4.0 90
C2-02 100 5 Soft, 900 kg 4.0 90
C2-03 80 10 Medium, 900 kg 4.0 70
C2-04 100 10 Medium, 900 kg 4.0 90
C2-05 100 10 Soft, 900 kg 4.0 90
C2-06 80 15 Medium, 900 kg 4.0 90
C2-07 100 5 Medium, 1500 kg 0.7 100
C2-08 80 10 Medium, 1500 kg 1.6 75
C2-09 100 10 Medium, 1500 kg 2.1 95
C2-10 120 10 Medium, 1500 kg 4.0 105

Safety of roadside area 103 ANALYSIS OF THE TEST RESULTS
Table 126. Climb height from bottom of the ditch and corresponding maximum speed on backslope. Analysis based on test results for model C2
ditch.
Test nr
Mass of the vehi-
cle
Initial speed (km/h)
Initial angle (deg)
Speed at height of 1 m
Speed at height of 2 m
Speed at height of 3 m
Speed at height of 4 m
C2-01 900 100 5 100 95 95 90
C2-02 900 100 5 100 95 95 90
C2-03 900 80 10 80 75 75 70
C2-04 900 100 10 100 95 95 90
C2-05 900 100 10 100 95 95 90
C2-06 900 80 15 100 95 95 90
C2-07 1500 100 5 - - - -
C2-08 1500 80 10 80 - - -
C2-09 1500 100 10 100 95 - -
C2-10 1500 120 10 120 115 110 105
Table 127. Level of risk of crash into a point hazard on backslope of model C1,2
ditch, no steering, slopes 1:3/1:2. Heights from the bottom of the ditch.
Test nr
Speed (km/h)
Angle (deg)
Risk of crash
On/beyond backslope, at height of
1.0 m 2.0 m 3.0 m 4.0 m
C2-03, C2-08, (C1-01), (C1-05)
80 10
Likelihood High Moderate Moderate Moderate
Severity High High High High
Level of risk Critical High High High
C2-06, (C1)
100 15
Likelihood High High High High
Severity High High High High
Level of risk Critical Critical Critical Critical
C2-01, C2-07, (C1-04)
100 5
Likelihood Moderate Moderate Moderate Moderate
Severity High High High High
Level of risk Critical High High High
C2-04, C2-09, (C1-02), (C1-06)
100 10
Likelihood High High Moderate Moderate
Severity High High High High
Level of risk Critical Critical High High
C2-02
Soft soil 100 5
Likelihood High High High High
Severity High High High High
Level of risk Critical Critical Critical Critical
C2-05, (C1-03)
Soft soil 100 10
Likelihood High High High High
Severity High High High High
Level of risk Critical Critical Critical Critical
C2-10, (C1-07)
120 10
Likelihood High High High High
Severity High High High High
Level of risk Critical Critical Critical Critical

104 Safety of roadside area ANALYSIS OF THE TEST RESULTS
The climb heights are surprisingly high (table 126). In all light passenger car cases the vehicle climbs onto the top of the 4.0 meter backslope. The speeds are also very high at highest position which means that estimated levels of risks are in many cases critical.
The levels of risks are very similar for stiff and soft soil cases. The reason for higher risk in soft soil cases can be explained by missing large passenger car simulations with soft soil. So the conclusion is that based on the results any significant difference between the levels of risks of stiff and soft soil cannot be presented.
Table 128. Weighted mean of level of risk of crash into a point hazard on back-slope of model C1,2 ditch, at height of 1.0 m (stiff soil, only passenger cars, no steering) based on the analysis of test results and additional approximations (approximations with italic font).
Speed / angle 5° 10° 15° 20° Level of risk (weighted mean)
Distribution 40 % 35 % 15 % 10 % 100 %
80 km/h Critical Critical Critical Critical Critical
100 km/h Critical Critical Critical Critical Critical
120 km/h Critical Critical Critical Critical Critical
Table 129. Weighted mean of level of risk of crash into a point hazard on back-slope of model C2 ditch, at height of 2.0 m (stiff soil, only passenger cars, no steering) based on the analysis of test results and additional approximations (approximations with italic font).
Speed / angle 5° 10° 15° 20° Level of risk (weighted mean)
Distribution 40 % 35 % 15 % 10 % 100 %
80 km/h Moderate High High High High
100 km/h High Critical Critical Critical Critical
120 km/h High Critical Critical Critical Critical
Table 130. Weighted mean of level of risk of crash into a point hazard on back-slope of model C2 ditch, at height of 3.0 m (stiff soil, only passenger cars, no steering) based on the analysis of test results and additional approximations (approximations with italic font).
Speed / angle 5° 10° 15° 20° Level of risk (weighted mean)
Distribution 40 % 35 % 15 % 10 % 100 %
80 km/h Low High Moderate Moderate Moderate
100 km/h High Critical High High High
120 km/h High Critical Critical Critical Critical

Safety of roadside area 105 ANALYSIS OF THE TEST RESULTS
Table 131. Weighted mean of level of risk of crash into a point hazard on back-slope of model C2 ditch, at height of 4.0 m (stiff soil, only passenger cars, no steering) based on the analysis of test results and additional approximations (approximations with italic font).
Speed / angle 5° 10° 15° 20° Level of risk (weighted mean)
Distribution 40 % 35 % 15 % 10 % 100 %
80 km/h Low High Moderate Low Moderate
100 km/h High High Critical High High
120 km/h High Critical High High High
6.7.6 Modified V-shaped ditch (Model C3 and C4)
Table 132. Vertical climb height measured from the bottom of the ditch and speed at the highest position, model C3 ditch profile (vertical wall on the top of the backslope)
Test nr Approach speed (km/h)
Approach (deg)
Details (Soil, vehicle) Climb height (m)
Speed at highest posi-tion (km/h)1
C2 100 15 Medium, 900 kg 1.3 90
C3 100 10 Medium, 900 kg 1.3 90
C3-01 100 5 Medium, 900 kg 1.3 95
C3-02 100 5 Soft, 900 kg 1.3 95
C3-03 80 10 Medium, 900 kg 1.3 75
Table 133. Climb height from the bottom of the ditch and corresponding maxi-mum speed on backslope. Analysis based on test results for model C3 ditch.
Test nr
Mass of the vehi-cle (kg)
Initial speed (km/h)
Initial angle (deg)
Speed at height of 1 m
Speed at height of 2 m
Speed at height of 3 m
Speed at height of 4 m
C2 900 100 15 90 - - -
C3 900 100 10 90 - - -
C3-01 900 100 5 95 - - -
C3-02 900 100 5 95 - - -
C3-03 900 80 10 80 - - -

106 Safety of roadside area ANALYSIS OF THE TEST RESULTS
Table 134. Vertical climb height measured from the bottom of the ditch and speed at the highest position, model C4 ditch profile (vertical wall on the top of the backslope)
Test nr Approach speed (km/h)
Approach (deg)
Details (Soil, vehicle) Climb height (m)
Speed at highest posi-tion (km/h)1
C4 90 10 Medium, 20 000 kg 2.3 85
C5 100 10 Medium, 900 kg 2.5 85
C6 100 10 Soft 2, 900 kg 0.9 75
C7 100 15 Medium, 900 kg 3.0 80
C4-01 100 5 Medium, 900 kg 4.0 65
C4-02 100 5 Soft, 900 kg 4.0 90
C4-03 80 10 Medium, 900 kg 4.0 60
C4-04 100 15 Medium, 900 kg 4.0 80
C4-05 100 5 Medium, 1500 kg 0.8 100
C4-06 80 10 Medium, 1500 kg 1.0 80
C4-07 100 10 Medium, 1500 kg 1.2 95
C4-08 120 10 Medium, 1500 kg 1.6 115
Table 135. Climb height from bottom of the ditch and corresponding maximum speed on backslope. Analysis based on test results for model C4
ditch.
Test nr
Mass of the vehi-cle (kg)
Initial speed (km/h)
Initial angle (deg)
Speed at height of 1 m
Speed at height of 2 m
Speed at height of 3 m
Speed at height of 4 m
C4 20 000 90 10 85 85 - -
C5 900 100 10 90 85 - -
C6 900 100 10 - - - -
C7 900 100 15 90 85 80 -
C4-01 900 100 5 95 85 75 65
C4-02 900 100 5 100 95 95 90
C4-03 900 80 10 75 70 65 55
C4-04 900 100 15 95 90 85 80
C4-05 1500 100 5 - - - -
C4-06 1500 80 10 80 - - -
C4-07 1500 100 10 95 - - -
C4-08 1500 120 10 115 - - -

Safety of roadside area 107 ANALYSIS OF THE TEST RESULTS
Table 136. Level of risk of crash into a point hazard on backslope of model C4
ditch, no steering, slopes 1:3/1:2. Heights from the bottom of the ditch. Approximations in the table are written in italic.
Test nr
Speed (km/h)
Angle (deg)
Risk of crash
On/beyond backslope, at height of
1.0 m 2.0 m 3.0 m 4.0 m
C4-03, C4-06, (C3-03)
80 10
Likelihood High Moderate Moderate Moderate
Severity High High High Moderate
Level of risk Critical High High Moderate
C4 90 10
Likelihood High High Low Low
Severity High High High Moderate
Level of risk Critical Critical Moderate Low
C4-01, C4-05, (C3-01)
100 5
Likelihood High Moderate Moderate Moderate
Severity High High High High
Level of risk Critical High High High
C5, C4-07, C3
100 10
Likelihood High Moderate Moderate Moderate
Severity High High High High
Level of risk Critical High High High
C4-04, C7
100 15
Likelihood High High High Moderate
Severity High High High High
Level of risk Critical Critical Critical High
C4-08 120 10
Likelihood High Low Low Low
Severity High High High High
Level of risk Critical Moderate Moderate Moderate
C4-02, (C3-02)
Soft soil 100 5
Likelihood High Moderate Moderate Moderate
Severity High High High High
Level of risk Critical High High High
C6
Soft soil 100 10
Likelihood Low Low Low Low
Severity High Moderate Moderate Low
Level of risk Critical Low Low Low
The levels of risks are first critical (1.0 m height) and high (2.0 m height). At higher location on the backslope the levels of risks are highest at 100 km/h approach speeds. At lower speeds the consequences of the crash are less severe and at higher speeds heavy initial contact into the backslope reduces the speeds on higher possible locations on the backslope. At five degree angle the climb height and corresponding speeds are very similar between stiff and soft soil cases.

108 Safety of roadside area ANALYSIS OF THE TEST RESULTS
Table 137. Weighted mean of level of risk of crash into a point hazard on back-slope of model C3,4 ditch, at height of 1.0 m (stiff soil, only passenger cars, no steering) based on analysis of test results and additional ap-proximations (approximations with italic font).
Speed / angle 5° 10° 15° 20° Level of risk (weighted mean)
Distribution 40 % 35 % 15 % 10 % 100 %
80 km/h Critical Critical Critical Critical Critical
100 km/h Critical Critical Critical Critical Critical
120 km/h Critical Critical Critical Critical Critical
Table 138. Weighted mean of level of risk of crash into a point hazard on back-slope of model C4 ditch, at height of 2.0 m (stiff soil, only passenger cars, no steering) based on analysis of test results and additional ap-proximations (approximations with italic font).
Speed / angle 5° 10° 15° 20° Level of risk (weighted mean)
Distribution 40 % 35 % 15 % 10 % 100 %
80 km/h High Critical High Moderate High
100 km/h High High Critical High High
120 km/h High Moderate High High High
Table 139. Weighted mean of level of risk of crash into a hazard on backslope of model C4 ditch, at height of 3.0 m (stiff soil, only passenger cars, no steering) based on analysis of test results and additional approxima-tions (approximations with italic font).
Speed / angle 5° 10° 15° 20° Level of risk (weighted mean)
Distribution 40 % 35 % 15 % 10 % 100 %
80 km/h Moderate High Moderate Low Moderate
100 km/h High High Critical Low High
120 km/h Moderate Moderate Low Low Moderate
Table 140. Weighted mean of level of risk of crash into a point hazard on back-slope of model C4 ditch, at height of 4.0 m (stiff soil, only passenger cars, no steering) based on analysis of test results and additional ap-proximations (approximations with italic font).
Speed / angle 5° 10° 15° 20° Level of risk (weighted mean)
Distribution 40 % 35 % 15 % 10 % 100 %
80 km/h Low Moderate Low Low Low
100 km/h High High High Low High
120 km/h Moderate Moderate Low Low Moderate

Safety of roadside area 109 ANALYSIS OF THE TEST RESULTS
6.8 Analysis of vehicle coming back onto the road
6.8.1 V-shaped ditch (Model A)
According to Roadside Design Guide (AASHTO 2002) the foreslopes 1:4 or flatter are recoverable. In full-scale tests none of the test vehicles travelled back onto the road without steering maneuvers. In three cases the steering function was enabled. In case P9 the vehicle got back onto the road be-cause of too early steering maneuver (it barely entered the ditch). In case P12 the vehicle travelled along the bottom of the ditch until the strong steer-ing maneuver caused rollover on the foreslope. In case P13 there was mod-erate steering maneuver which remained the vehicle in the ditch without any intention of rollover. In two simulated cases the vehicle came back onto the road. In both cases the approach speed was 100 km/h, angle 10° and soil type medium. In case A1 the trajectory is very “smooth” and stabile: no side-slip or intention of rol-lover. The had-on collision with oncoming vehicle is very possible. In case A3 the side-slip has started in the ditch and the rollover could have been possible if there had been significant unevenness in the ditch (Table 141). The side-slip continued onto the roadway. The side impact with a vehicle driving in same or opposite direction is possible. The speed of the vehicle is 20 km/h and delta-v in possible crash exceeds 30 km/h.
Table 141. V-ditch simulation cases where a vehicle returns back onto the car-riageway
Test nr
Vehicle mass (kg)
Approach speed (km/h)
Approach angle (deg)
Soil type Trajectory
Speed on the road (km/h)
A1 900 100 10 Medium Back onto the
road 50
A3 1500 100 10 Medium Sideslip, back onto the road
20
Table 142. Level of risk of return onto the carriageway from v-ditch, no steering. Medium soil.
Test nr
Initial speed category (km/h)
Approach angle
category (deg)
Risk of coming back onto the road
Level of risk for heavy traffic
Likelihood Severity
P1, P2, P4 80 5 Low High Moderate
P3 100 5 Low High Moderate
P10 60 10 Low High Moderate
P8, P11, V1, V2, A2 80 10 Low High Moderate
P14, A1, A3 100 10 Moderate High High
A8 120 10 Low High Moderate
A5 100 15 Low High Moderate
P5, P6 80 20 Low High Moderate
P7 100 20 Low High Moderate

110 Safety of roadside area ANALYSIS OF THE TEST RESULTS
According to results of both full-scale and simulated tests the likelihood of coming back onto the road without driver’s maneuver is very low in case of v-ditch. The only exception is simulation with approach speed 100 km/h and approach angle 10 degrees. Hence also the overall level of risk for coming back onto the road after running off into the ditch is low in all speed limits.
Table 143. Weighted mean of level of risk of coming back onto the road from v-ditch (medium soil, passenger cars, no steering) based on analysis of test results and additional approximations (approximations with italic font).
Speed / angle 5° 10° 15° 20° Level of risk for heavy traffic
(weighted mean)
Distribution 40 % 35 % 15 % 10 % 100 %
80 km/h Moderate Moderate Moderate Moderate Moderate
100 km/h Moderate High Moderate Moderate Moderate
120 km/h Moderate Moderate Moderate Moderate Moderate
There are four tests with soft soil available. In none of the tests the vehicle travelled back onto the road. This indicates low likelihood for coming back onto the road and therefore moderate level of risk (severity = high).
6.8.2 U-shaped ditch (Models U and Us)
There were three full-scale tests performed into the U-ditch. The trajectories indicate that the intent of travelling beyond the ditch is predominant. There were also seven simulated tests with higher 4.0 m backslope.
Table 144. Results of tests of the U-ditch (rounded bottom), likelihood of coming back onto the road
Test nr
Details (soil, vehi-cle)
Initial speed (km/h)
Approach angle (deg)
Return onto the road Final position
Yes/no Speed (km/h)
P15 Pori Soft / Talbot H 100 10 No - Beyond the ditch
V3 VTI / Volvo 244 80 10 No - On top of backslope
V4 VTI / Ford Fiesta 80 10 No - Beyond the ditch
U-01 Medium, 900 kg 100 5 No - In the ditch
U-02 Soft, 900 kg 80 10 Yes 70 On road, no sideslip
U-03 Medium, 900 kg 80 20 No - In the ditch
U-04 Medium, 900 kg 100 15 No - Beyond the ditch
U-05 Medium, 1500 kg 80 10 No - Beyond the ditch
U-06 Medium, 1500 kg 100 10 No - Beyond the ditch
U-07 Medium, 1500 kg 120 10 Yes 100 On road, no sideslip
The vehicle came back onto the road only in two tests: one with soft soil and one with medium soil and 120 km/h speed. In soft soil case the climb height on backslope was 2.4 meters and in stiff soil case 4.0 meters.

Safety of roadside area 111 ANALYSIS OF THE TEST RESULTS
In eight cases the vehicle did not return onto the road. The results indicate that a vehicle tends to climb onto the backslope of U-ditch and travel beyond the ditch even when the height of the backslope is 4.0 meters. At five de-grees angle a vehicle stays in the ditch at approach speed of 100 km/h. It is probable that at higher speed a vehicle could return onto the road.
In test U-07 the climb height before coming onto the road is 4.0 meters and in test U-02 2.1 meters. In case of lower backslope (< 2.0 m) the vehicle would travel beyond the ditch and the level of risk would be moderate.
If there were effect of steering taken into account the probability of coming back onto the road could be higher.
Table 145. Level of risk of return onto the carriageway from model U ditch, no steering. Medium soil.
Test nr
Initial speed category (km/h)
Approach angle cate-gory (deg)
Risk of coming back onto the road
Level of risk
Likelihood Severity
U-01 100 5 Low High Moderate
V3, V4, U-02, U-05 80 10 Low High Moderate
P15, U-06 100 10 Low High Moderate
U-07 120 10 High High Critical
U-04 100 15 Low High Moderate
U-03 80 20 Low High Moderate
Table 146. Weighted mean of level of risk of coming back onto the road from model U ditch (medium soil, passenger cars, no steering) based on analysis of test results and additional approximations (approximations with italic font).
Speed / angle 5° 10° 15° 20° Level of risk (weighted mean)
Distribution 40 % 35 % 15 % 10 % 100 %
80 km/h Low Moderate Moderate Moderate Moderate
100 km/h Moderate Moderate Moderate Moderate Moderate
120 km/h High Critical High Moderate High
6.8.3 Modified V-shaped ditch (Model B)
In two stage 1 simulation cases of ditch model B the vehicles tend to come back onto the road. In both cases there is also yawing. This may lead to rol-lover in the ditch, especially in case B3. Both vehicles slide on the bottom of the ditch and slide onto the shoulder and come to rest in the right lane/on shoulder. There is no risk of collision with oncoming vehicle but it is possible to hit with another vehicle traveling in same direction. In stage 2 simulations (B-01…B-09) yawing does not occur. The vehicles come to rest in the bottom of the ditch, except one vehicle which travels beyond the ditch. Thus the stage 2 simulations do not confirm any intention of coming back onto the road.
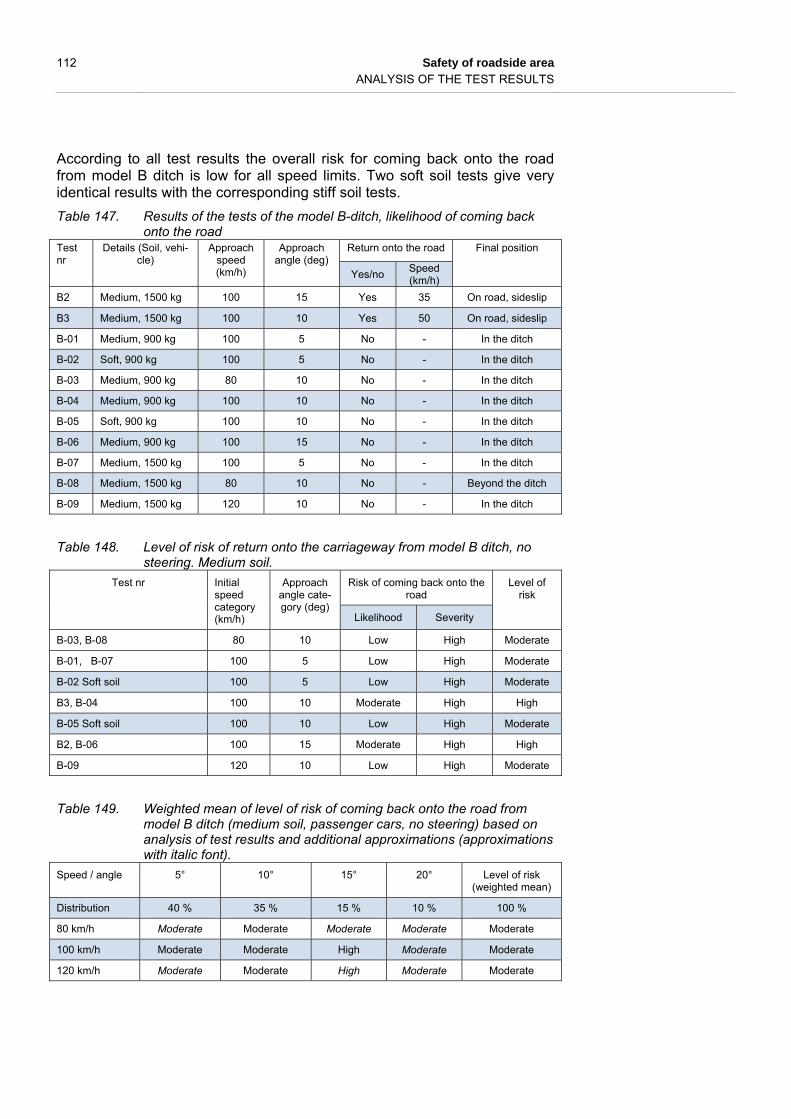
112 Safety of roadside area ANALYSIS OF THE TEST RESULTS
According to all test results the overall risk for coming back onto the road from model B ditch is low for all speed limits. Two soft soil tests give very identical results with the corresponding stiff soil tests.
Table 147. Results of the tests of the model B-ditch, likelihood of coming back onto the road
Test nr
Details (Soil, vehi-cle)
Approach speed (km/h)
Approach angle (deg)
Return onto the road Final position
Yes/no Speed (km/h)
B2 Medium, 1500 kg 100 15 Yes 35 On road, sideslip
B3 Medium, 1500 kg 100 10 Yes 50 On road, sideslip
B-01 Medium, 900 kg 100 5 No - In the ditch
B-02 Soft, 900 kg 100 5 No - In the ditch
B-03 Medium, 900 kg 80 10 No - In the ditch
B-04 Medium, 900 kg 100 10 No - In the ditch
B-05 Soft, 900 kg 100 10 No - In the ditch
B-06 Medium, 900 kg 100 15 No - In the ditch
B-07 Medium, 1500 kg 100 5 No - In the ditch
B-08 Medium, 1500 kg 80 10 No - Beyond the ditch
B-09 Medium, 1500 kg 120 10 No - In the ditch
Table 148. Level of risk of return onto the carriageway from model B ditch, no steering. Medium soil.
Test nr
Initial speed category (km/h)
Approach angle cate-gory (deg)
Risk of coming back onto the road
Level of risk
Likelihood Severity
B-03, B-08 80 10 Low High Moderate
B-01, B-07 100 5 Low High Moderate
B-02 Soft soil 100 5 Low High Moderate
B3, B-04 100 10 Moderate High High
B-05 Soft soil 100 10 Low High Moderate
B2, B-06 100 15 Moderate High High
B-09 120 10 Low High Moderate
Table 149. Weighted mean of level of risk of coming back onto the road from model B ditch (medium soil, passenger cars, no steering) based on analysis of test results and additional approximations (approximations with italic font).
Speed / angle 5° 10° 15° 20° Level of risk (weighted mean)
Distribution 40 % 35 % 15 % 10 % 100 %
80 km/h Moderate Moderate Moderate Moderate Moderate
100 km/h Moderate Moderate High Moderate Moderate
120 km/h Moderate Moderate High Moderate Moderate

Safety of roadside area 113 ANALYSIS OF THE TEST RESULTS
6.8.4 Modified V-shaped ditch (Model C1)
In the following analysis there is assumed that the vertical wall on the top of the slope did not exist in model C simulations. According to this expectation most of the vehicles travel beyond the ditch.
Table 150. Analysis of tests of the model C1-ditch without vertical wall, likelihood of coming back onto the road
Test nr
Details (Soil, vehi-cle)
Approach speed (km/h)
Approach angle (deg)
Return onto the road Final position
Yes/no Speed (km/h)
C1 Medium, 900 kg 100 15 No - Beyond the ditch
C1-01 Medium, 900 kg 80 10 No - Beyond the ditch
C1-02 Medium, 900 kg 100 10 No - Beyond the ditch
C1-03 Soft, 900 kg 100 10 No - Beyond the ditch
C1-04 Medium, 1500 kg 100 5 No - In the ditch
C1-05 Medium, 1500 kg 80 10 No - Beyond the ditch
C1-06 Medium, 1500 kg 100 10 No - Beyond the ditch
C1-07 Medium, 1500 kg 120 10 No - Beyond the ditch
Table 151. Level of risk of return onto the carriageway from model C1-ditch with-out vertical wall, no steering. Medium soil.
Test nr
Initial speed category (km/h)
Approach angle cate-gory (deg)
Risk of coming back onto the road
Level of risk
Likelihood Severity
C1-04 100 5 Low High Moderate
C1-01, C1-05 80 10 Low High Moderate
C1-02, C1-06 100 10 Low High Moderate
C1-07 120 10 Low High Moderate
C1 100 15 Low High Moderate
Table 152. Weighted mean of level of risk of coming back onto the road from model C1 ditch without vertical wall (medium soil, passenger cars, no steering) based on analysis of test results and additional approxima-tions (approximations with italic font).
Speed / angle 5° 10° 15° 20° Level of risk (weighted mean)
Distribution 40 % 35 % 15 % 10 % 100 %
80 km/h Moderate Moderate Moderate Low Moderate
100 km/h Moderate Moderate Moderate Low Moderate
120 km/h Moderate Low Low Low Low
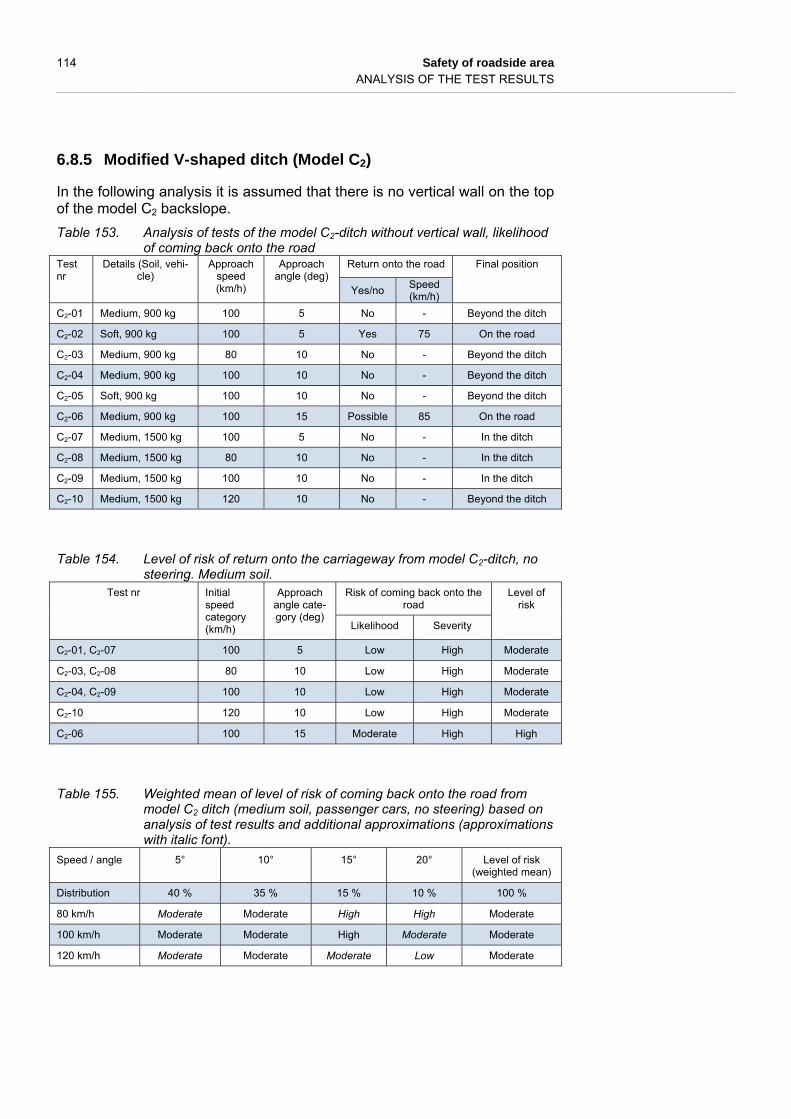
114 Safety of roadside area ANALYSIS OF THE TEST RESULTS
6.8.5 Modified V-shaped ditch (Model C2)
In the following analysis it is assumed that there is no vertical wall on the top of the model C2 backslope.
Table 153. Analysis of tests of the model C2-ditch without vertical wall, likelihood of coming back onto the road
Test nr
Details (Soil, vehi-cle)
Approach speed (km/h)
Approach angle (deg)
Return onto the road Final position
Yes/no Speed (km/h)
C2-01 Medium, 900 kg 100 5 No - Beyond the ditch
C2-02 Soft, 900 kg 100 5 Yes 75 On the road
C2-03 Medium, 900 kg 80 10 No - Beyond the ditch
C2-04 Medium, 900 kg 100 10 No - Beyond the ditch
C2-05 Soft, 900 kg 100 10 No - Beyond the ditch
C2-06 Medium, 900 kg 100 15 Possible 85 On the road
C2-07 Medium, 1500 kg 100 5 No - In the ditch
C2-08 Medium, 1500 kg 80 10 No - In the ditch
C2-09 Medium, 1500 kg 100 10 No - In the ditch
C2-10 Medium, 1500 kg 120 10 No - Beyond the ditch
Table 154. Level of risk of return onto the carriageway from model C2-ditch, no steering. Medium soil.
Test nr
Initial speed category (km/h)
Approach angle cate-gory (deg)
Risk of coming back onto the road
Level of risk
Likelihood Severity
C2-01, C2-07 100 5 Low High Moderate
C2-03, C2-08 80 10 Low High Moderate
C2-04, C2-09 100 10 Low High Moderate
C2-10 120 10 Low High Moderate
C2-06 100 15 Moderate High High
Table 155. Weighted mean of level of risk of coming back onto the road from model C2 ditch (medium soil, passenger cars, no steering) based on analysis of test results and additional approximations (approximations with italic font).
Speed / angle 5° 10° 15° 20° Level of risk (weighted mean)
Distribution 40 % 35 % 15 % 10 % 100 %
80 km/h Moderate Moderate High High Moderate
100 km/h Moderate Moderate High Moderate Moderate
120 km/h Moderate Moderate Moderate Low Moderate
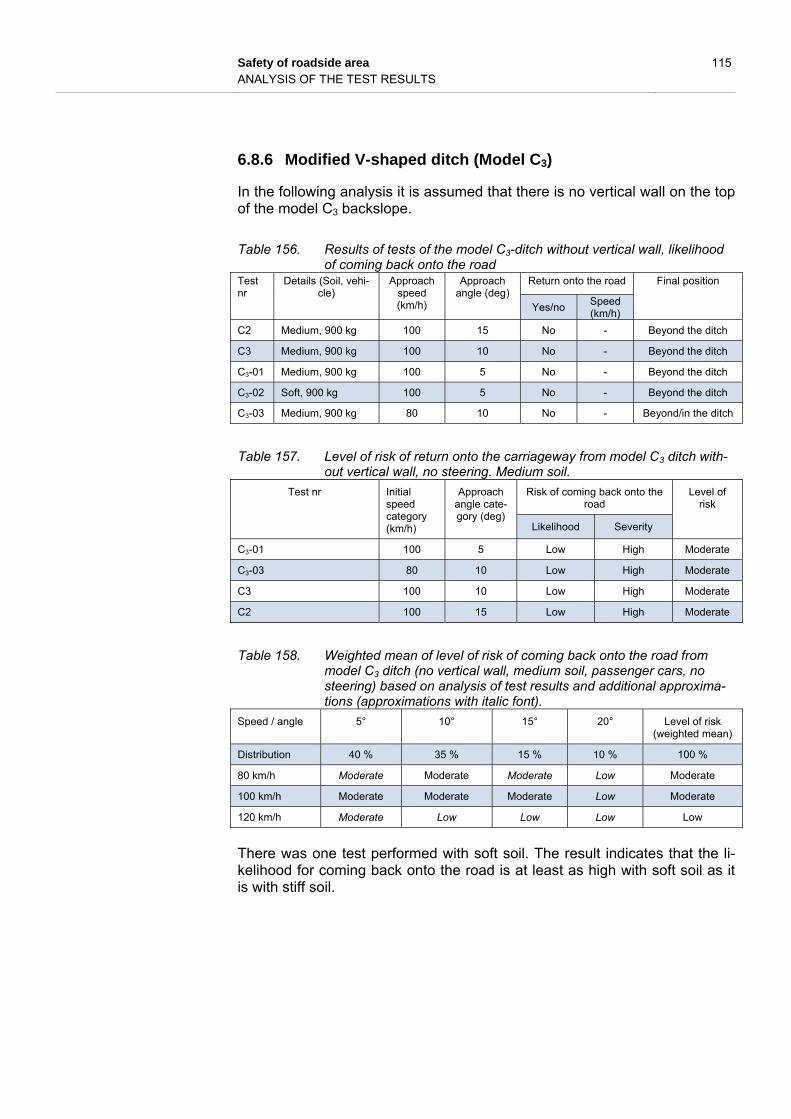
Safety of roadside area 115 ANALYSIS OF THE TEST RESULTS
6.8.6 Modified V-shaped ditch (Model C3)
In the following analysis it is assumed that there is no vertical wall on the top of the model C3 backslope.
Table 156. Results of tests of the model C3-ditch without vertical wall, likelihood of coming back onto the road
Test nr
Details (Soil, vehi-cle)
Approach speed (km/h)
Approach angle (deg)
Return onto the road Final position
Yes/no Speed (km/h)
C2 Medium, 900 kg 100 15 No - Beyond the ditch
C3 Medium, 900 kg 100 10 No - Beyond the ditch
C3-01 Medium, 900 kg 100 5 No - Beyond the ditch
C3-02 Soft, 900 kg 100 5 No - Beyond the ditch
C3-03 Medium, 900 kg 80 10 No - Beyond/in the ditch
Table 157. Level of risk of return onto the carriageway from model C3 ditch with-out vertical wall, no steering. Medium soil.
Test nr
Initial speed category (km/h)
Approach angle cate-gory (deg)
Risk of coming back onto the road
Level of risk
Likelihood Severity
C3-01 100 5 Low High Moderate
C3-03 80 10 Low High Moderate
C3 100 10 Low High Moderate
C2 100 15 Low High Moderate
Table 158. Weighted mean of level of risk of coming back onto the road from model C3 ditch (no vertical wall, medium soil, passenger cars, no steering) based on analysis of test results and additional approxima-tions (approximations with italic font).
Speed / angle 5° 10° 15° 20° Level of risk (weighted mean)
Distribution 40 % 35 % 15 % 10 % 100 %
80 km/h Moderate Moderate Moderate Low Moderate
100 km/h Moderate Moderate Moderate Low Moderate
120 km/h Moderate Low Low Low Low
There was one test performed with soft soil. The result indicates that the li-kelihood for coming back onto the road is at least as high with soft soil as it is with stiff soil.

116 Safety of roadside area ANALYSIS OF THE TEST RESULTS
6.8.7 Modified V-shaped ditch (Model C4)
In the following analysis it is assumed that there is no vertical wall on the top of the model C4 backslope.
Table 159. Analysis of tests of the model C4-ditch without vertical wall, likelihood of coming back onto the road
Test nr
Details (Soil, vehi-cle)
Approach speed (km/h)
Approach angle (deg)
Return onto the road Final position
Yes/no Speed (km/h)
C4 Medium, 20 000 kg 90 10 Yes 70 On the road
C5 Medium, 900 kg 100 10 Yes 80 On the road
C6 Soft 2, 900 kg 100 10 Yes 50 On road, rollover
C7 Medium, 900 kg 100 15 Yes 65 On the road, possi-
ble rollover
C4-01 Medium, 900 kg 100 5 No - Beyond the ditch
C4-02 Soft, 900 kg 100 5 No - Beyond the ditch
C4-03 Medium, 900 kg 80 10 No - Beyond the ditch
C4-04 Medium, 900 kg 100 15 No - Beyond the ditch
C4-05 Medium, 1500 kg 100 5 No - In the ditch
C4-06 Medium, 1500 kg 80 10 No - In the ditch
C4-07 Medium, 1500 kg 100 10 No - In the ditch
C4-08 Medium, 1500 kg 120 10 No - In he ditch
Table 160. Level of risk of return onto the carriageway from model C4 ditch, no steering. Medium soil.
Test nr
Initial speed category (km/h)
Approach angle cate-gory (deg)
Risk of coming back onto the road
Level of risk
Likelihood Severity
C4-01, C4-05 100 5 Low High Moderate
C4-03, C4-06 80 10 Moderate High High
C5, C4-07 100 10 Moderate High High
C4-08 120 10 Low High Moderate
C4-04, C7 100 15 Moderate High High
Table 161. Weighted mean of level of risk of coming back onto the road from model C4 ditch (medium soil, passenger cars, no steering) based on analysis of test results and additional approximations (approximations with italic font).
Speed / angle 5° 10° 15° 20° Level of risk (weighted mean)
Distribution 40 % 35 % 15 % 10 % 100 %
80 km/h Moderate High Moderate Low Moderate
100 km/h Moderate High High Low Moderate
120 km/h Moderate Moderate Moderate Low Moderate

Safety of roadside area 117 ANALYSIS OF THE TEST RESULTS
6.8.8 Model C1 ditch in front of vertical wall
The errant vehicles in the model C1 v-ditch do not tend to return back onto the road if the approach encroachment angle is not more than 10 degrees and soil on the slopes is stiff. In case C1 the angle was 15 degrees and the vehicle hits the wall on the top of the backslope (H = 1.3 m) and bounces back onto the road with rollover. There was only one test with soft soil. For some reason soft soil causes higher likelihood for coming back onto road at speed of 100 km/h and angle 10 degrees. The result cannot be generalized, but it indicates that the likeli-hood for coming back onto the road is not lower with soft soil.
Table 162. Results of tests of the model C1-ditch, likelihood of coming back onto the road
Test nr
Details (Soil, vehi-cle)
Approach speed (km/h)
Approach angle (deg)
Return onto the road Final position
Yes/no Speed (km/h)
C1 Medium, 900 kg 100 15 Yes 75 On road, rollover
C1-01 Medium, 900 kg 80 10 No - In the ditch
C1-02 Medium, 900 kg 100 10 No - In the ditch
C1-03 Soft, 900 kg 100 10 Yes 85 On the road
C1-04 Medium, 1500 kg 100 5 No - In the ditch
C1-05 Medium, 1500 kg 80 10 No - In the ditch
C1-06 Medium, 1500 kg 100 10 No - In the ditch
C1-07 Medium, 1500 kg 120 10 Yes - On the road
Table 163. Level of risk of return onto the carriageway from model C1-ditch, no steering. Medium soil.
Test nr
Initial speed category (km/h)
Approach angle cate-gory (deg)
Risk of coming back onto the road
Level of risk
Likelihood Severity
C1-04 100 5 Low High Moderate
C1-01, C1-05 80 10 Low High Moderate
C1-02, C1-06 100 10 Low High Moderate
C1-07 120 10 High High Critical
C1 100 15 High High Critical
Table 164. Weighted mean of level of risk of coming back onto the road from model C1 ditch (medium soil, passenger cars, no steering) based on analysis of test results and additional approximations (approximations with italic font).
Speed / angle 5° 10° 15° 20° Level of risk (weighted mean)
Distribution 40 % 35 % 15 % 10 % 100 %
80 km/h Moderate Moderate Moderate Moderate Moderate
100 km/h Moderate Moderate Critical High Moderate
120 km/h High Critical High Moderate High

118 Safety of roadside area ANALYSIS OF THE TEST RESULTS
6.8.9 Model C2 ditch in front of vertical wall
In tests for model C2 ditch the vehicles come back onto the road in all the cases where they have reached the top of the 4.0 meter backslope and hit the vertical wall (rock wall). The heavier passenger cars stay in the ditch if the initial speed is 80…100 km/h.
Table 165. Results of tests of the model C2-ditch , likelihood of coming back onto the road
Test nr
Details (Soil, vehi-cle)
Approach speed (km/h)
Approach angle (deg)
Return onto the road Final position
Yes/no Speed (km/h)
C2-01 Medium, 900 kg 100 5 Yes 75 On the road
C2-02 Soft, 900 kg 100 5 Yes 75 On the road
C2-03 Medium, 900 kg 80 10 Yes 55 On the road
C2-04 Medium, 900 kg 100 10 Yes 80 On the road
C2-05 Soft, 900 kg 100 10 Yes 85 On the road
C2-06 Medium, 900 kg 100 15 Yes 85 On the road
C2-07 Medium, 1500 kg 100 5 No - In the ditch
C2-08 Medium, 1500 kg 80 10 No - In the ditch
C2-09 Medium, 1500 kg 100 10 No - In the ditch
C2-10 Medium, 1500 kg 120 10 Yes 100 On the road
Table 166. Level of risk of return onto the carriageway from model C2-ditch, no steering. Medium soil.
Test nr
Initial speed category (km/h)
Approach angle cate-gory (deg)
Risk of coming back onto the road
Level of risk
Likelihood Severity
C2-01, C2-07 100 5 Moderate High High
C2-03, C2-08 80 10 Moderate High High
C2-04, C2-09 100 10 Moderate High High
C2-10 120 10 High High Critical
C2-06 100 15 High High Critical
Table 167. Weighted mean of level of risk of coming back onto the road from model C2 ditch (medium soil, passenger cars, no steering) based on analysis of test results and additional approximations (approximations with italic font).
Speed / angle 5° 10° 15° 20° Level of risk (weighted mean)
Distribution 40 % 35 % 15 % 10 % 100 %
80 km/h Moderate High Critical High High
100 km/h High High Critical High High
120 km/h Critical Critical Critical High Critical

Safety of roadside area 119 ANALYSIS OF THE TEST RESULTS
There were two tests performed with soft soil. The result indicates that the likelihood for coming back onto the road is at least as high with soft soil as it is with stiff soil.
6.8.10 Model C3 ditch in front of vertical wall
In all the cases the test vehicle is a light passenger car and the climb height is 1.3 meters which means crash into the wall on the top of the backslope.
Table 168. Results of tests of the model C3-ditch, likelihood of coming back onto the road
Test nr
Details (Soil, vehi-cle)
Approach speed (km/h)
Approach angle (deg)
Return onto the road Final position
Yes/no Speed (km/h)
C2 Medium, 900 kg 100 15 No - Rollover in the ditch
C3 Medium, 900 kg 100 10 No - Rollover in the ditch
C3-01 Medium, 900 kg 100 5 Yes 90 On the road
C3-02 Soft, 900 kg 100 5 Yes 85 On the road
C3-03 Medium, 900 kg 80 10 No - In the ditch
Table 169. Level of risk of return onto the carriageway from model C3 ditch, no steering. Medium soil.
Test nr
Initial speed category (km/h)
Approach angle cate-gory (deg)
Risk of coming back onto the road
Level of risk
Likelihood Severity
C3-01 100 5 High High Critical
C3-03 80 10 Low High Moderate
C3 100 10 Low High Moderate
C2 100 15 Low High Moderate
Table 170. Weighted mean of level of risk of coming back onto the road from model C3 ditch (medium soil, passenger cars, no steering) based on analysis of test results and additional approximations (approximations with italic font).
Speed / angle 5° 10° 15° 20° Level of risk (weighted mean)
Distribution 40 % 35 % 15 % 10 % 100 %
80 km/h High Moderate Moderate Moderate Moderate
100 km/h Critical Moderate Moderate Low High
120 km/h Critical High Low Low High
There was one test performed with soft soil. The result indicates that the li-kelihood for coming back onto the road is at least as high with soft soil as it is with stiff soil.
6.8.11 Model C4 ditch in front of vertical wall
In ditch model C4 there is higher 4.0 m backslope. The vehicle comes back onto the road in all light passenger car cases. In case C6 the rollover occurs

120 Safety of roadside area ANALYSIS OF THE TEST RESULTS
in the ditch and the vehicle rolls onto the road. In tests with heavy passenger car the climb heights are 0.8-1.6 meters and coming back onto the road do not occur.
Table 171. Results of tests of the model C4-ditch, likelihood of coming back onto the road
Test nr
Details (Soil, vehi-cle)
Approach speed (km/h)
Approach angle (deg)
Return onto the road Final position
Yes/no Speed (km/h)
C4 Medium, 20 000 kg
90 10 Yes 70 On the road
C5 Medium, 900 kg 100 10 Yes 80 On the road
C6 Soft 2, 900 kg 100 10 Yes 50 On road, rollover
C7 Medium, 900 kg 100 15 Yes 65 On the road, possi-
ble rollover
C4-01 Medium, 900 kg 100 5 Yes 65 On the road
C4-02 Soft, 900 kg 100 5 Not known - Rollover in the
ditch
C4-03 Medium, 900 kg 80 10 Yes 50 On the road
C4-04 Medium, 900 kg 100 15 Yes 75 On the road
C4-05 Medium, 1500 kg 100 5 No - In the ditch
C4-06 Medium, 1500 kg 80 10 No - In the ditch
C4-07 Medium, 1500 kg 100 10 No - In the ditch
C4-08 Medium, 1500 kg 120 10 No - In he ditch
Table 172. Level of risk of return onto the carriageway from model C4 ditch, no steering. Medium soil.
Test nr
Initial speed category (km/h)
Approach angle cate-gory (deg)
Risk of coming back onto the road
Level of risk
Likelihood Severity
C4-01, C4-05 100 5 Moderate High High
C4-03, C4-06 80 10 Moderate High High
C5, C4-07 100 10 Moderate High High
C4-08 120 10 Low High Moderate
C4-04, C7 100 15 High High Critical
Table 173. Weighted mean of level of risk of coming back onto the road from model C4 ditch (medium soil, passenger cars, no steering) based on analysis of test results and additional approximations (approximations with italic font).
Speed / angle 5° 10° 15° 20° Level of risk (weighted mean)
Distribution 40 % 35 % 15 % 10 % 100 %
80 km/h High High Moderate Moderate High
100 km/h High High Moderate Low High
120 km/h High Moderate Low Low Moderate
Soft soil causes rollover and vehicle likely returns onto the carriageway.
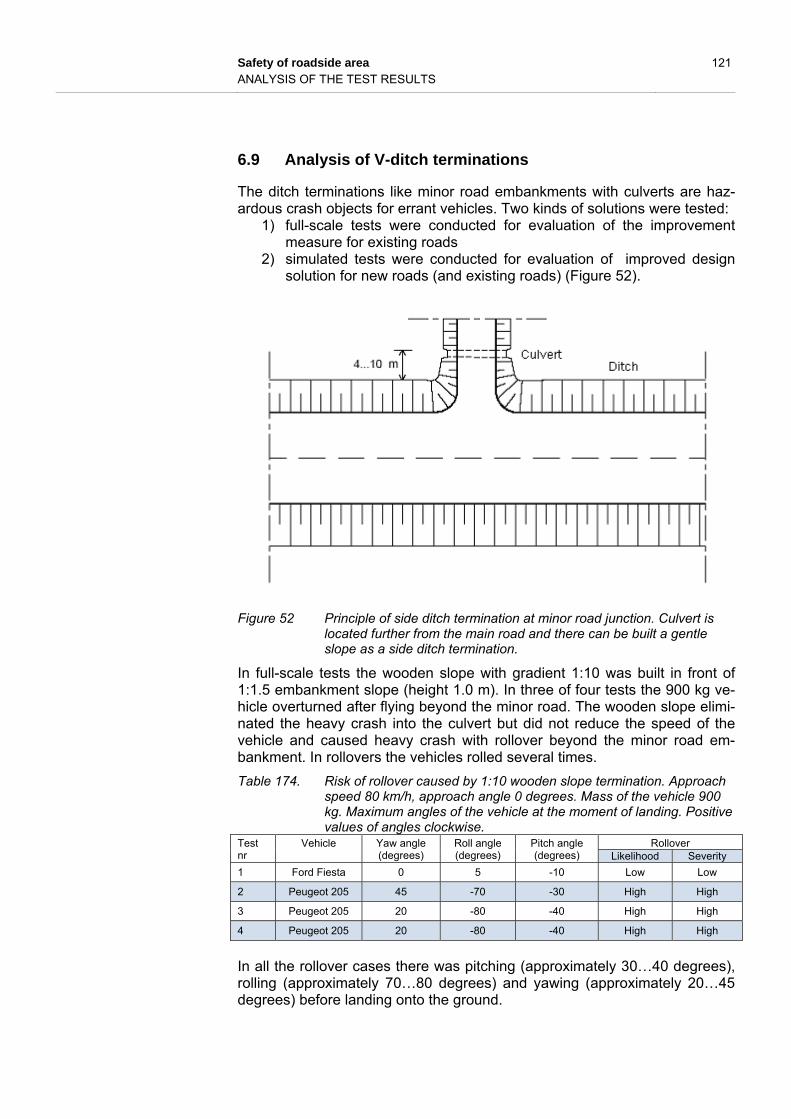
Safety of roadside area 121 ANALYSIS OF THE TEST RESULTS
6.9 Analysis of V-ditch terminations
The ditch terminations like minor road embankments with culverts are haz-ardous crash objects for errant vehicles. Two kinds of solutions were tested:
1) full-scale tests were conducted for evaluation of the improvement measure for existing roads
2) simulated tests were conducted for evaluation of improved design solution for new roads (and existing roads) (Figure 52).
Figure 52 Principle of side ditch termination at minor road junction. Culvert is
located further from the main road and there can be built a gentle slope as a side ditch termination.
In full-scale tests the wooden slope with gradient 1:10 was built in front of 1:1.5 embankment slope (height 1.0 m). In three of four tests the 900 kg ve-hicle overturned after flying beyond the minor road. The wooden slope elimi-nated the heavy crash into the culvert but did not reduce the speed of the vehicle and caused heavy crash with rollover beyond the minor road em-bankment. In rollovers the vehicles rolled several times.
Table 174. Risk of rollover caused by 1:10 wooden slope termination. Approach speed 80 km/h, approach angle 0 degrees. Mass of the vehicle 900 kg. Maximum angles of the vehicle at the moment of landing. Positive values of angles clockwise.
Test nr
Vehicle Yaw angle (degrees)
Roll angle (degrees)
Pitch angle (degrees)
Rollover Likelihood Severity
1 Ford Fiesta 0 5 -10 Low Low
2 Peugeot 205 45 -70 -30 High High
3 Peugeot 205 20 -80 -40 High High
4 Peugeot 205 20 -80 -40 High High
In all the rollover cases there was pitching (approximately 30…40 degrees), rolling (approximately 70…80 degrees) and yawing (approximately 20…45 degrees) before landing onto the ground.

122 Safety of roadside area ANALYSIS OF THE TEST RESULTS
Figure 53 Roll, yaw and pitch angles of the vehicle. During horizontal movement
of the body of the vehicle and without any side-slip (yawing) all the angles are zero degrees (Photo: Helsinki University of Technology).
In the first test the vehicle travelled onto the two columns in the middle of the wooden slope. The following flight was very stabile and the vehicle landed without rollover. In all other tests the vehicle travelled onto two left-hand col-umns. The columns in the edge of the wooden slope were shorter than those in the middle and therefore also more rigid. For this reason in tests 2, 3 and 4 the vehicle bounced into the air with some twist, which caused significant roll and yaw angles leading to landing onto the front corner of the vehicle and rollover. Conclusion is that tested wooden slope causes high risk of rollover with se-vere consequences. The level of risk is critical. In simulations two gradients of termination slope were tested with 1500 kg vehicle (model D1 with 1:4 slope and D2 with 1:6 slope). In comparison with full-scale test some notices can be made:
With 1:4 slope the vehicle bounces significantly higher than in full-scale tests
Roll angles are significantly smaller due to more uniform slope Pitch angles are equal (D1) or smaller (D2) Yaw angles are smaller
Likelihood of significant crash into the slope at termination is estimated to be moderate for D1 and low for D2 (table 173). Based on ASI-values the sever-ity of crash is moderate for D1 and low for D2. Therefore the level of risk of the crash into the termination is moderate for D1 and low for D2.
Table 175. Risk of crash into termination in model D ditch termination. Test nr
Approach speed/ angle
Slope at termi-nation
ASI when hitting the slope
Crash
Likelihood Severity
D1 80 km/h, 0° 1:4 (14 deg) 1.06 Moderate Moderate
D2 80 km/h, 0° 1:6 (9 deg) 0.58 Low Low
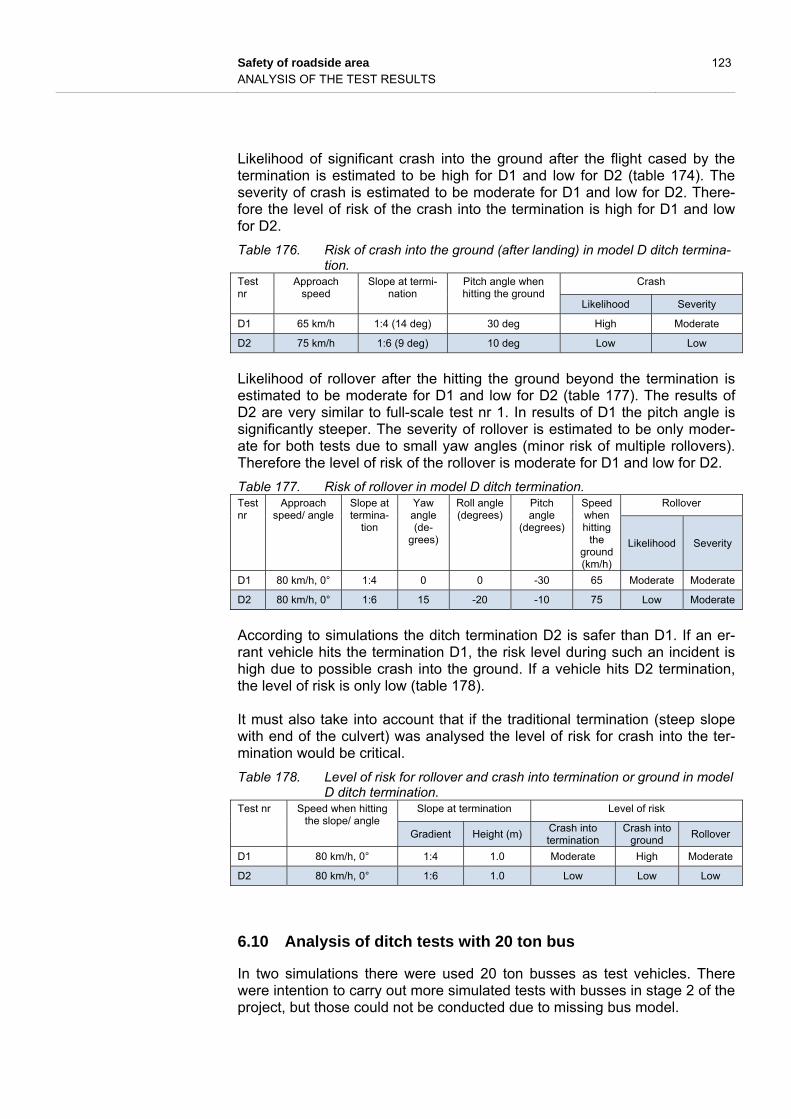
Safety of roadside area 123 ANALYSIS OF THE TEST RESULTS
Likelihood of significant crash into the ground after the flight cased by the termination is estimated to be high for D1 and low for D2 (table 174). The severity of crash is estimated to be moderate for D1 and low for D2. There-fore the level of risk of the crash into the termination is high for D1 and low for D2.
Table 176. Risk of crash into the ground (after landing) in model D ditch termina-tion.
Test nr
Approach speed
Slope at termi-nation
Pitch angle when hitting the ground
Crash
Likelihood Severity
D1 65 km/h 1:4 (14 deg) 30 deg High Moderate
D2 75 km/h 1:6 (9 deg) 10 deg Low Low
Likelihood of rollover after the hitting the ground beyond the termination is estimated to be moderate for D1 and low for D2 (table 177). The results of D2 are very similar to full-scale test nr 1. In results of D1 the pitch angle is significantly steeper. The severity of rollover is estimated to be only moder-ate for both tests due to small yaw angles (minor risk of multiple rollovers). Therefore the level of risk of the rollover is moderate for D1 and low for D2.
Table 177. Risk of rollover in model D ditch termination. Test nr
Approach speed/ angle
Slope at termina-
tion
Yaw angle (de-
grees)
Roll angle (degrees)
Pitch angle
(degrees)
Speed when hitting
the ground (km/h)
Rollover
Likelihood Severity
D1 80 km/h, 0° 1:4 0 0 -30 65 Moderate Moderate
D2 80 km/h, 0° 1:6 15 -20 -10 75 Low Moderate
According to simulations the ditch termination D2 is safer than D1. If an er-rant vehicle hits the termination D1, the risk level during such an incident is high due to possible crash into the ground. If a vehicle hits D2 termination, the level of risk is only low (table 178). It must also take into account that if the traditional termination (steep slope with end of the culvert) was analysed the level of risk for crash into the ter-mination would be critical.
Table 178. Level of risk for rollover and crash into termination or ground in model D ditch termination.
Test nr Speed when hitting the slope/ angle
Slope at termination Level of risk
Gradient Height (m) Crash into termination
Crash into ground
Rollover
D1 80 km/h, 0° 1:4 1.0 Moderate High Moderate
D2 80 km/h, 0° 1:6 1.0 Low Low Low
6.10 Analysis of ditch tests with 20 ton bus
In two simulations there were used 20 ton busses as test vehicles. There were intention to carry out more simulated tests with busses in stage 2 of the project, but those could not be conducted due to missing bus model.
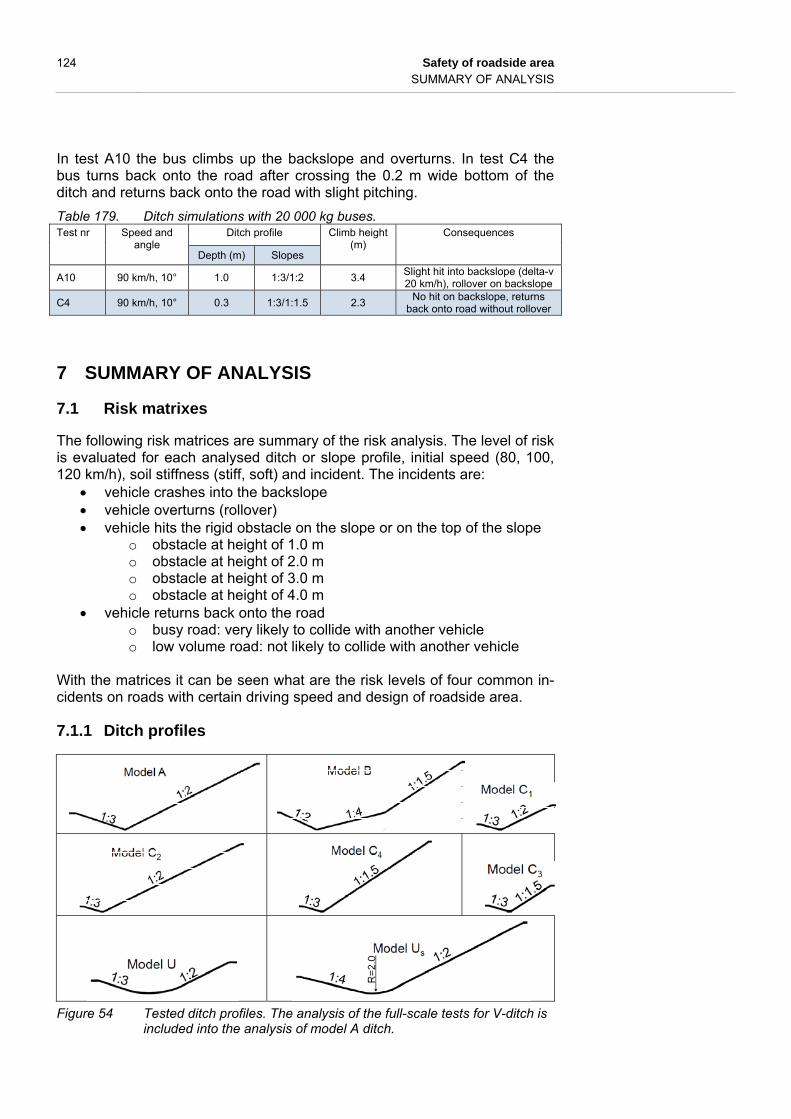
124 Safety of roadside area SUMMARY OF ANALYSIS
In test A10 the bus climbs up the backslope and overturns. In test C4 the bus turns back onto the road after crossing the 0.2 m wide bottom of the ditch and returns back onto the road with slight pitching.
Table 179. Ditch simulations with 20 000 kg buses. Test nr Speed and
angle Ditch profile Climb height
(m) Consequences
Depth (m) Slopes
A10 90 km/h, 10° 1.0 1:3/1:2 3.4 Slight hit into backslope (delta-v 20 km/h), rollover on backslope
C4 90 km/h, 10° 0.3 1:3/1:1.5 2.3 No hit on backslope, returns
back onto road without rollover
7 SUMMARY OF ANALYSIS
7.1 Risk matrixes
The following risk matrices are summary of the risk analysis. The level of risk is evaluated for each analysed ditch or slope profile, initial speed (80, 100, 120 km/h), soil stiffness (stiff, soft) and incident. The incidents are:
vehicle crashes into the backslope vehicle overturns (rollover) vehicle hits the rigid obstacle on the slope or on the top of the slope
o obstacle at height of 1.0 m o obstacle at height of 2.0 m o obstacle at height of 3.0 m o obstacle at height of 4.0 m
vehicle returns back onto the road o busy road: very likely to collide with another vehicle o low volume road: not likely to collide with another vehicle
With the matrices it can be seen what are the risk levels of four common in-cidents on roads with certain driving speed and design of roadside area.
7.1.1 Ditch profiles
Figure 54 Tested ditch profiles. The analysis of the full-scale tests for V-ditch is included into the analysis of model A ditch.

Safety of roadside area 125 SUMMARY OF ANALYSIS
Use of matrix below: Initial speed 80 km/h, stiff soil Summary of risk analysis of roadside ditch pro-files on roads with 80 km/h driving speeds. Matrix shows the level of risk of the roadside ditches (stiff soil material) in terms of four kind of common incidents in run-off-the-road accidents.
Conclusions: There are no huge differences between safeties
of analyzed ditch profiles. At speeds of 80 km/h the level of risk due to the crash into the back-slope is moderate for ditch A, whereas level of risk is low for all the other ditch profiles. On the other hand the level of risk of hitting the obstacle at heights over 1.0 m is lower in ditch A compared to other ditch profiles.
Table 180. Risk matrix of the level of risk of tested ditch profiles. Approach speed 80 km/h, stiff soil material on slopes. Colours describe the interaction of likelihood and average severity of an incident (green=low, yel-low=moderate, brown=high, red=critical).
Ditch profile (stiff soil) Level of risk of the crash (approach speeds 80 km/h)
Ditc
h p
rofil
e
fore
slop
e (g
radi
ent
)
dept
h of
the
ditc
h
(m)
botto
m w
idth
(m
)
back
slop
e (g
radi
ent)
heig
ht o
f bac
kslo
pe
(m)
into back-slope
due to roll-over
into rigid road-side obstacle on (or on top of) the
backslope at height of
due to coming back onto road
1 m
2 m
3 m
4 m
heavy traffic
low traf-fic
Ditch A
1:3 1.0 0,0 1:2 4.0 Mod-erate Low C M M L Moderate Low
Ditch B
1:2 1.0 0.0 1:4 / 1:1.5
1+3
= 4.0 Low Low C H M M Moderate Low
Ditch C1
1:3 0.3 0.2 1:2 1.3 Low Low C - - - Moderate Low
Ditch C2
1:3 0.3 0.2 1:2 4.0 Low Low C H M M Moderate Low
Ditch C3
1:3 0.3 0.2 1:1.5 1.3 Low Low C - - - Moderate Low
Ditch C4
1:3 0.3 0.2 1:1.5 4.0 Low Low C H M L Moderate Low
Ditch U
1:3 0.6 2 1:2 ~1.4 Low Low C H - - Moderate Low
Ditch Us
1:4 1.0 1.0 1:2 4.0 Low Low C H M M Moderate Low
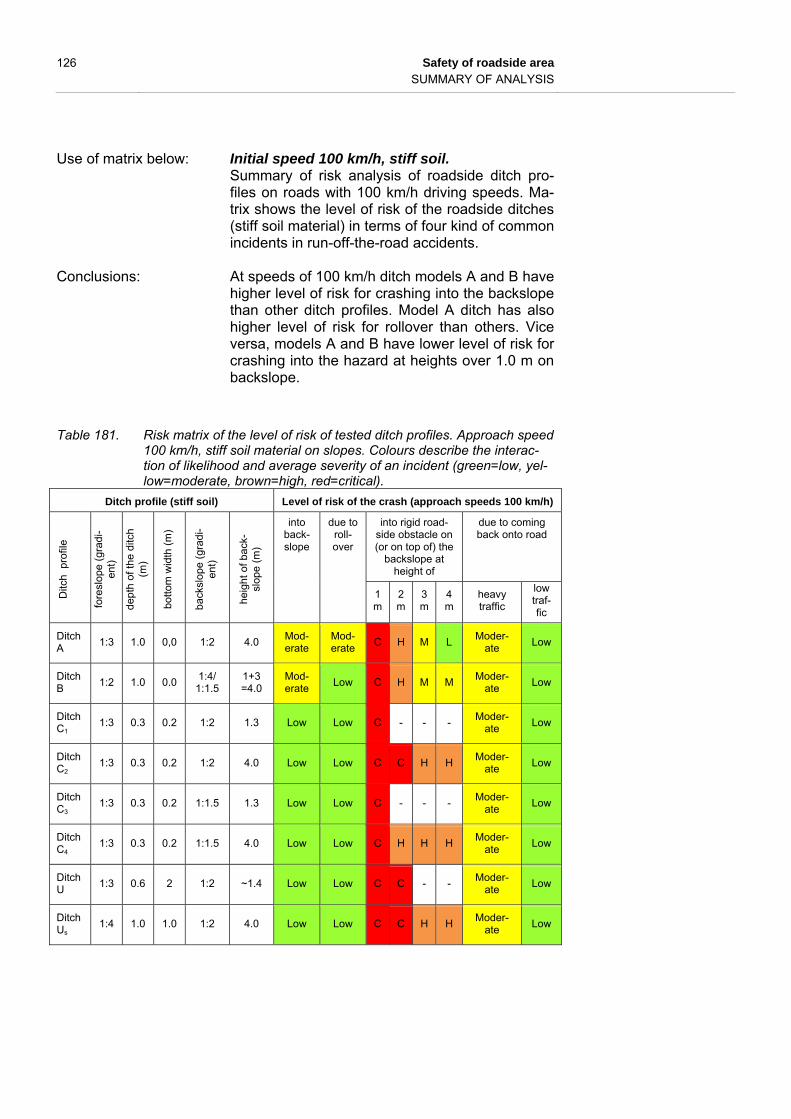
126 Safety of roadside area SUMMARY OF ANALYSIS
Use of matrix below: Initial speed 100 km/h, stiff soil. Summary of risk analysis of roadside ditch pro-files on roads with 100 km/h driving speeds. Ma-trix shows the level of risk of the roadside ditches (stiff soil material) in terms of four kind of common incidents in run-off-the-road accidents.
Conclusions: At speeds of 100 km/h ditch models A and B have
higher level of risk for crashing into the backslope than other ditch profiles. Model A ditch has also higher level of risk for rollover than others. Vice versa, models A and B have lower level of risk for crashing into the hazard at heights over 1.0 m on backslope.
Table 181. Risk matrix of the level of risk of tested ditch profiles. Approach speed 100 km/h, stiff soil material on slopes. Colours describe the interac-tion of likelihood and average severity of an incident (green=low, yel-low=moderate, brown=high, red=critical).
Ditch profile (stiff soil) Level of risk of the crash (approach speeds 100 km/h)
Ditc
h p
rofil
e
fore
slop
e (g
radi
-en
t)
dept
h of
the
ditc
h
(m)
botto
m w
idth
(m
)
back
slop
e (g
radi
-en
t)
heig
ht o
f bac
k-sl
ope
(m)
into back-slope
due to roll-over
into rigid road-side obstacle on (or on top of) the
backslope at height of
due to coming back onto road
1 m
2 m
3 m
4 m
heavy traffic
low traf-fic
Ditch A
1:3 1.0 0,0 1:2 4.0 Mod-erate
Mod-erate
C H M L Moder-
ate Low
Ditch B
1:2 1.0 0.0 1:4/
1:1.5 1+3 =4.0
Mod-erate
Low C H M M Moder-
ate Low
Ditch C1
1:3 0.3 0.2 1:2 1.3 Low Low C - - - Moder-
ate Low
Ditch C2
1:3 0.3 0.2 1:2 4.0 Low Low C C H H Moder-
ate Low
Ditch C3
1:3 0.3 0.2 1:1.5 1.3 Low Low C - - - Moder-
ate Low
Ditch C4
1:3 0.3 0.2 1:1.5 4.0 Low Low C H H H Moder-
ate Low
Ditch U
1:3 0.6 2 1:2 ~1.4 Low Low C C - - Moder-
ate Low
Ditch Us
1:4 1.0 1.0 1:2 4.0 Low Low C C H H Moder-
ate Low
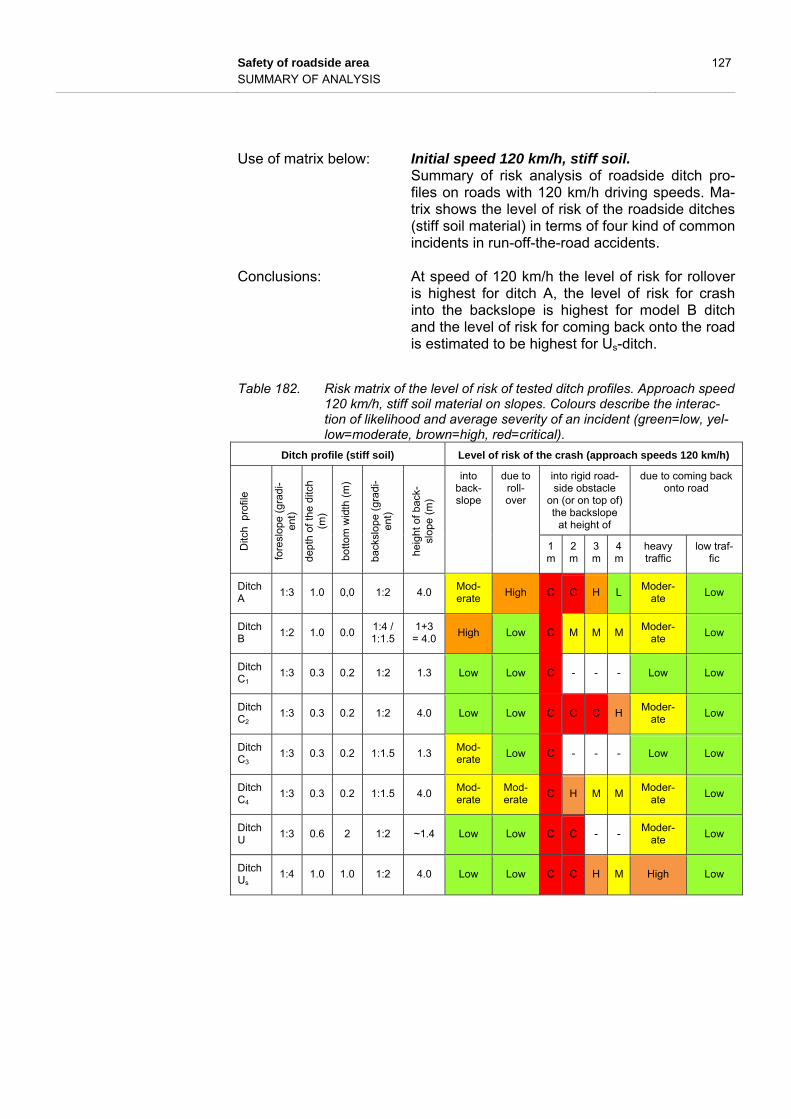
Safety of roadside area 127 SUMMARY OF ANALYSIS
Use of matrix below: Initial speed 120 km/h, stiff soil. Summary of risk analysis of roadside ditch pro-files on roads with 120 km/h driving speeds. Ma-trix shows the level of risk of the roadside ditches (stiff soil material) in terms of four kind of common incidents in run-off-the-road accidents.
Conclusions: At speed of 120 km/h the level of risk for rollover
is highest for ditch A, the level of risk for crash into the backslope is highest for model B ditch and the level of risk for coming back onto the road is estimated to be highest for Us-ditch.
Table 182. Risk matrix of the level of risk of tested ditch profiles. Approach speed 120 km/h, stiff soil material on slopes. Colours describe the interac-tion of likelihood and average severity of an incident (green=low, yel-low=moderate, brown=high, red=critical).
Ditch profile (stiff soil) Level of risk of the crash (approach speeds 120 km/h)
Ditc
h p
rofil
e
fore
slop
e (g
radi
-en
t)
dept
h of
the
ditc
h
(m)
botto
m w
idth
(m
)
back
slop
e (g
radi
-en
t)
heig
ht o
f bac
k-sl
ope
(m)
into back-slope
due to roll-over
into rigid road-side obstacle
on (or on top of) the backslope
at height of
due to coming back onto road
1 m
2 m
3 m
4 m
heavy traffic
low traf-fic
Ditch A
1:3 1.0 0,0 1:2 4.0 Mod-erate High C C H L
Moder-ate
Low
Ditch B
1:2 1.0 0.0 1:4 / 1:1.5
1+3 = 4.0
High Low C M M M Moder-
ate Low
Ditch C1
1:3 0.3 0.2 1:2 1.3 Low Low C - - - Low Low
Ditch C2
1:3 0.3 0.2 1:2 4.0 Low Low C C C H Moder-
ate Low
Ditch C3
1:3 0.3 0.2 1:1.5 1.3 Mod-erate
Low C - - - Low Low
Ditch C4
1:3 0.3 0.2 1:1.5 4.0 Mod-erate
Mod-erate
C H M M Moder-
ate Low
Ditch U
1:3 0.6 2 1:2 ~1.4 Low Low C C - - Moder-
ate Low
Ditch Us
1:4 1.0 1.0 1:2 4.0 Low Low C C H M High Low

128 Safety of roadside area SUMMARY OF ANALYSIS
Use of matrix below: Initial speed 80 km/h, soft soil Summary of risk analysis of roadside ditch pro-files on roads with 80 km/h driving speeds. Matrix shows the level of risk of the roadside ditches (soft soil material) in terms of four kind of com-mon incidents in run-off-the-road accidents.
Conclusions: Ditch A has higher level of risk for rollover than
others, otherwise the results indicate that model A would be the safest profile for 80 km/h roads. For model C ditch profiles the level of risk is low for both crash into the backslope and rollover.
Table 183. Risk matrix of the level of risk of tested ditch profiles. Approach speed 80 km/h, soft soil material on slopes. Colours describe the interaction of likelihood and average severity of an incident (green=low, yel-low=moderate, brown=high, red=critical).
Ditch profile (soft soil) Level of risk of the crash (approach speeds 80 km/h)
Ditc
h p
rofil
e
fore
slop
e (g
radi
-en
t)
dept
h of
the
ditc
h
(m)
botto
m w
idth
(m
)
back
slop
e (g
radi
-en
t)
heig
ht o
f bac
k-sl
ope
(m)
into back-slope
due to roll-over
into rigid road-side obstacle on (or on top of) the
backslope at height of
due to coming back onto road
1 m
2 m
3 m
4 m
heavy traffic
low traffic
Ditch A
1:3 1.0 0,0 1:2 2.0 Low Mod-erate
H M L L Mod-erate
Low
Ditch B
1:2 1.0 0.0 1:4 / 1:1.5
1+3 = 4.0
Mod-erate
Low C H M M Mod-erate
Low
Ditch C1
1:3 0.3 0.2 1:2 1.3 Low Low C - - - Mod-erate
Low
Ditch C2
1:3 0.3 0.2 1:2 4.0 Low Low C H M M Mod-erate
Low
Ditch C3
1:3 0.3 0.2 1:1.5 1.3 Low Low C - - - Mod-erate
Low
Ditch C4
1:3 0.3 0.2 1:1.5 4.0 Low Low C H M L Mod-erate
Low
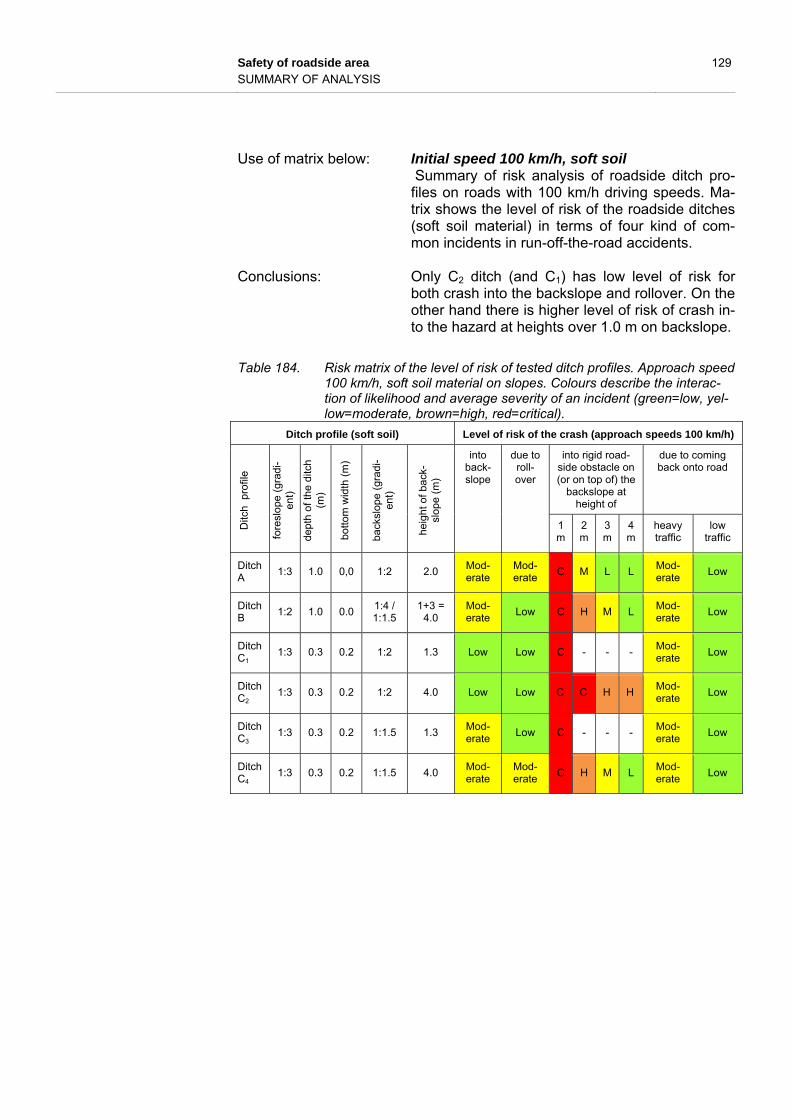
Safety of roadside area 129 SUMMARY OF ANALYSIS
Use of matrix below: Initial speed 100 km/h, soft soil Summary of risk analysis of roadside ditch pro-files on roads with 100 km/h driving speeds. Ma-trix shows the level of risk of the roadside ditches (soft soil material) in terms of four kind of com-mon incidents in run-off-the-road accidents.
Conclusions: Only C2 ditch (and C1) has low level of risk for
both crash into the backslope and rollover. On the other hand there is higher level of risk of crash in-to the hazard at heights over 1.0 m on backslope.
Table 184. Risk matrix of the level of risk of tested ditch profiles. Approach speed 100 km/h, soft soil material on slopes. Colours describe the interac-tion of likelihood and average severity of an incident (green=low, yel-low=moderate, brown=high, red=critical).
Ditch profile (soft soil) Level of risk of the crash (approach speeds 100 km/h)
Ditc
h p
rofil
e
fore
slop
e (g
radi
-en
t)
dept
h of
the
ditc
h
(m)
botto
m w
idth
(m
)
back
slop
e (g
radi
-en
t)
heig
ht o
f bac
k-sl
ope
(m)
into back-slope
due to roll-over
into rigid road-side obstacle on (or on top of) the
backslope at height of
due to coming back onto road
1 m
2 m
3 m
4 m
heavy traffic
low traffic
Ditch A
1:3 1.0 0,0 1:2 2.0 Mod-erate
Mod-erate
C M L L Mod-erate
Low
Ditch B
1:2 1.0 0.0 1:4 / 1:1.5
1+3 = 4.0
Mod-erate
Low C H M L Mod-erate
Low
Ditch C1
1:3 0.3 0.2 1:2 1.3 Low Low C - - - Mod-erate
Low
Ditch C2
1:3 0.3 0.2 1:2 4.0 Low Low C C H H Mod-erate
Low
Ditch C3
1:3 0.3 0.2 1:1.5 1.3 Mod-erate
Low C - - - Mod-erate
Low
Ditch C4
1:3 0.3 0.2 1:1.5 4.0 Mod-erate
Mod-erate
C H M L Mod-erate
Low
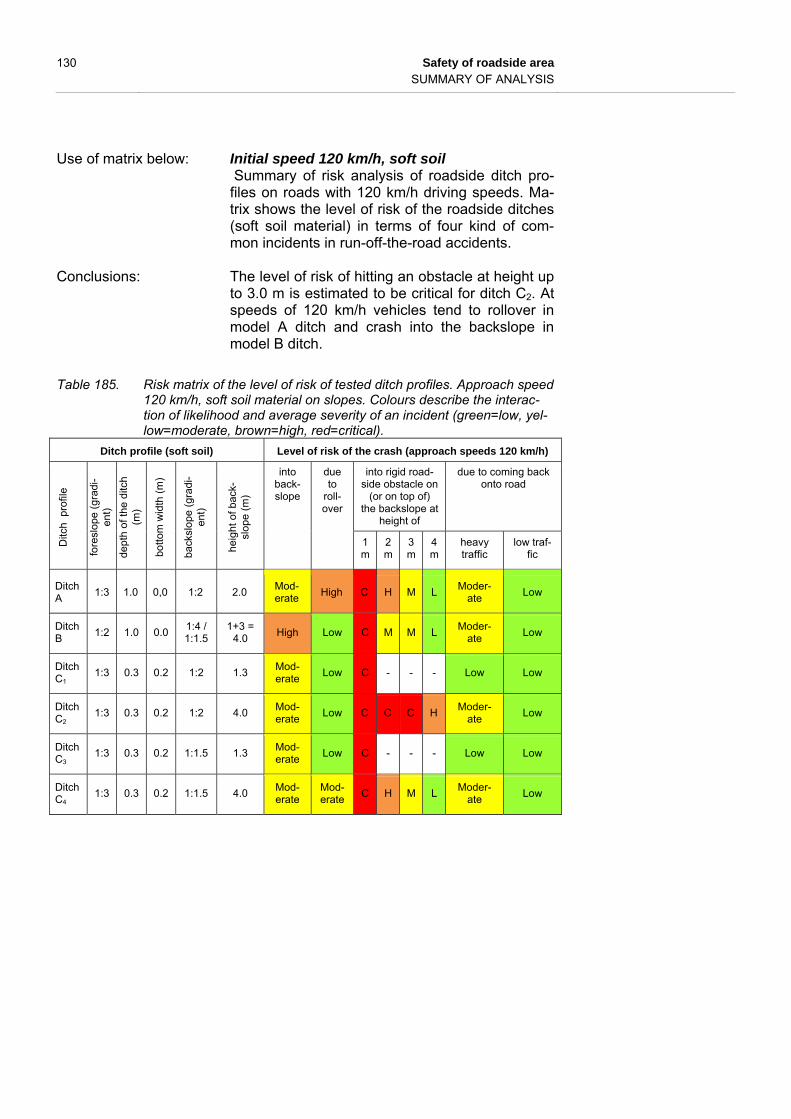
130 Safety of roadside area SUMMARY OF ANALYSIS
Use of matrix below: Initial speed 120 km/h, soft soil Summary of risk analysis of roadside ditch pro-files on roads with 120 km/h driving speeds. Ma-trix shows the level of risk of the roadside ditches (soft soil material) in terms of four kind of com-mon incidents in run-off-the-road accidents.
Conclusions: The level of risk of hitting an obstacle at height up
to 3.0 m is estimated to be critical for ditch C2. At speeds of 120 km/h vehicles tend to rollover in model A ditch and crash into the backslope in model B ditch.
Table 185. Risk matrix of the level of risk of tested ditch profiles. Approach speed 120 km/h, soft soil material on slopes. Colours describe the interac-tion of likelihood and average severity of an incident (green=low, yel-low=moderate, brown=high, red=critical).
Ditch profile (soft soil) Level of risk of the crash (approach speeds 120 km/h)
Ditc
h p
rofil
e
fore
slop
e (g
radi
-en
t)
dept
h of
the
ditc
h
(m)
botto
m w
idth
(m
)
back
slop
e (g
radi
-en
t)
heig
ht o
f bac
k-sl
ope
(m)
into back-slope
due to
roll-over
into rigid road-side obstacle on
(or on top of) the backslope at
height of
due to coming back onto road
1 m
2 m
3 m
4 m
heavy traffic
low traf-fic
Ditch A
1:3 1.0 0,0 1:2 2.0 Mod-erate High C H M L
Moder-ate
Low
Ditch B
1:2 1.0 0.0 1:4 / 1:1.5
1+3 = 4.0
High Low C M M L Moder-
ate Low
Ditch C1
1:3 0.3 0.2 1:2 1.3 Mod-erate
Low C - - - Low Low
Ditch C2
1:3 0.3 0.2 1:2 4.0 Mod-erate
Low C C C H Moder-
ate Low
Ditch C3
1:3 0.3 0.2 1:1.5 1.3 Mod-erate
Low C - - - Low Low
Ditch C4
1:3 0.3 0.2 1:1.5 4.0 Mod-erate
Mod-erate
C H M L Moder-
ate Low
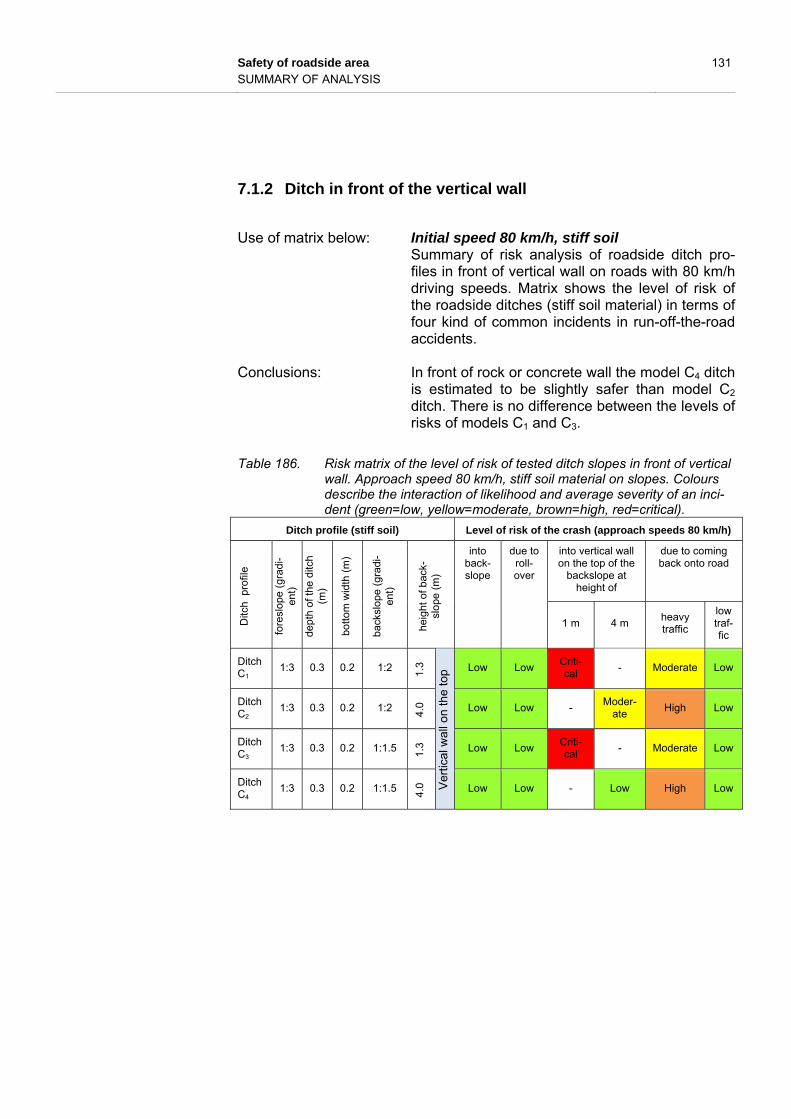
Safety of roadside area 131 SUMMARY OF ANALYSIS
7.1.2 Ditch in front of the vertical wall
Use of matrix below: Initial speed 80 km/h, stiff soil
Summary of risk analysis of roadside ditch pro-files in front of vertical wall on roads with 80 km/h driving speeds. Matrix shows the level of risk of the roadside ditches (stiff soil material) in terms of four kind of common incidents in run-off-the-road accidents.
Conclusions: In front of rock or concrete wall the model C4 ditch
is estimated to be slightly safer than model C2 ditch. There is no difference between the levels of risks of models C1 and C3.
Table 186. Risk matrix of the level of risk of tested ditch slopes in front of vertical wall. Approach speed 80 km/h, stiff soil material on slopes. Colours describe the interaction of likelihood and average severity of an inci-dent (green=low, yellow=moderate, brown=high, red=critical).
Ditch profile (stiff soil) Level of risk of the crash (approach speeds 80 km/h)
Ditc
h p
rofil
e
fore
slop
e (g
radi
-en
t)
dept
h of
the
ditc
h
(m)
botto
m w
idth
(m
)
back
slop
e (g
radi
-en
t)
heig
ht o
f bac
k-sl
ope
(m)
into back-slope
due to roll-over
into vertical wall on the top of the
backslope at height of
due to coming back onto road
1 m 4 m heavy traffic
low traf-fic
Ditch C1
1:3 0.3 0.2 1:2 1.3
Ver
tical
wal
l on
the
top Low Low
Criti-cal
- Moderate Low
Ditch C2
1:3 0.3 0.2 1:2 4.0 Low Low -
Moder-ate
High Low
Ditch C3
1:3 0.3 0.2 1:1.5 1.3 Low Low
Criti-cal
- Moderate Low
Ditch C4
1:3 0.3 0.2 1:1.5 4.0 Low Low - Low High Low

132 Safety of roadside area SUMMARY OF ANALYSIS
Use of matrix below: Initial speed 100 km/h, stiff soil Summary of risk analysis of roadside ditch pro-files in front of vertical wall on roads with 100 km/h driving speeds. Matrix shows the level of risk of the roadside ditches (stiff soil material) in terms of four kind of common incidents in run-off-the-road accidents.
Conclusions: There is no difference between the levels of risks
of models C2 and C4. In case of low backslopes the level of risk for coming back onto the road is higher with model C1 than with C3.
Table 187. Risk matrix of the level of risk of tested ditch slopes in front of vertical wall. Approach speed 100 km/h, stiff soil material on slopes. Colours describe the interaction of likelihood and average severity of an inci-dent (green=low, yellow=moderate, brown=high, red=critical).
Ditch profile (stiff soil) Level of risk of the crash (approach speeds 100 km/h)
Ditc
h p
rofil
e
fore
slop
e (g
radi
-en
t)
dept
h of
the
ditc
h
(m)
botto
m w
idth
(m
)
back
slop
e (g
ra-
dien
t)
heig
ht o
f bac
k-sl
ope
(m)
into back-slope
due to roll-over
into vertical wall on the top of the
backslope at height of
due to coming back onto road
1 m 4 m heavy traffic
low traf-fic
Ditch C1
1:3 0.3 0.2 1:2 1.3
Ver
tical
wal
l on
the
top Low Low
Criti-cal
- Moder-
ate Low
Ditch C2
1:3 0.3 0.2 1:2 4.0 Low Low - High High Low
Ditch C3
1:3 0.3 0.2 1:1.5 1.3 Low Low
Criti-cal
- High Low
Ditch C4
1:3 0.3 0.2 1:1.5 4.0 Low Low - High High Low
1) Height of slope 4.0 m

Safety of roadside area 133 SUMMARY OF ANALYSIS
Use of matrix below: Initial speed 120 km/h, stiff soil Summary of risk analysis of roadside ditch pro-files in front of vertical wall on roads with 120 km/h driving speeds. Matrix shows the level of risk of the roadside ditches (stiff soil material) in terms of four kind of common incidents in run-off-the-road accidents.
Conclusions: At speeds of 120 km/h the level of risk for crash
into the backslope and rollover is higher for ditches C3 and C4 (moderate) than for C1 and C2
(low). However, the level of risk for coming back onto the busy road is critical for ditch C2, but only moderate for C4. There is also higher level of risk for crash into the wall in ditch C2 than in ditch C4.
Table 188. Risk matrix of the level of risk of tested ditch slopes in front of vertical wall. Approach speed 120 km/h, stiff soil material on slopes. Colours describe the interaction of likelihood and average severity of an inci-dent (green=low, yellow=moderate, brown=high, red=critical).
Ditch profile (stiff soil) Level of risk of the crash (approach speeds 120 km/h)
Ditc
h p
rofil
e
fore
slop
e (g
ra-
dien
t)
dept
h of
the
ditc
h (m
)
botto
m w
idth
(m
)
back
slop
e (g
ra-
dien
t)
heig
ht o
f bac
k-sl
ope
(m)
into back-slope
due to roll-over
into vertical wall on the top of
the backslope at height of
due to coming back onto road
1 m 4 m heavy traffic
low traf-fic
Ditch C1
1:3 0.3 0.2 1:2 1.3
Ver
tical
wal
l on
the
top Low Low
Criti-cal
- High Moder-
ate
Ditch C2
1:3 0.3 0.2 1:2 4.0 Low Low - High Critical
Moder-ate
Ditch C3
1:3 0.3 0.2 1:1.5 1.3 Mod-
erate Mod-erate
Criti-cal
- High Moder-
ate
Ditch C4
1:3 0.3 0.2 1:1.5 4.0 Mod-
erate Mod-erate
- Mod-erate
Moder-ate
Low
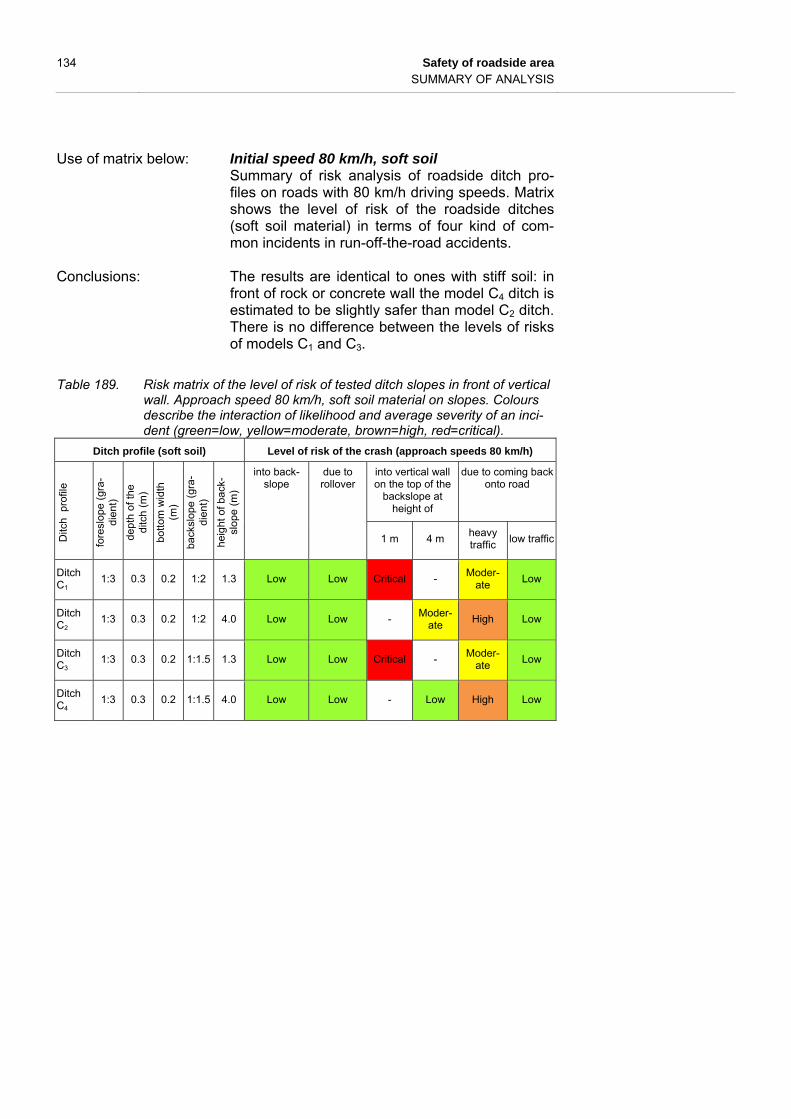
134 Safety of roadside area SUMMARY OF ANALYSIS
Use of matrix below: Initial speed 80 km/h, soft soil Summary of risk analysis of roadside ditch pro-files on roads with 80 km/h driving speeds. Matrix shows the level of risk of the roadside ditches (soft soil material) in terms of four kind of com-mon incidents in run-off-the-road accidents.
Conclusions: The results are identical to ones with stiff soil: in
front of rock or concrete wall the model C4 ditch is estimated to be slightly safer than model C2 ditch. There is no difference between the levels of risks of models C1 and C3.
Table 189. Risk matrix of the level of risk of tested ditch slopes in front of vertical wall. Approach speed 80 km/h, soft soil material on slopes. Colours describe the interaction of likelihood and average severity of an inci-dent (green=low, yellow=moderate, brown=high, red=critical).
Ditch profile (soft soil) Level of risk of the crash (approach speeds 80 km/h)
Ditc
h p
rofil
e
fore
slop
e (g
ra-
dien
t)
dept
h of
the
ditc
h (m
)
botto
m w
idth
(m
)
back
slop
e (g
ra-
dien
t)
heig
ht o
f bac
k-sl
ope
(m)
into back-slope
due to rollover
into vertical wall on the top of the
backslope at height of
due to coming back onto road
1 m 4 m heavy traffic
low traffic
Ditch C1
1:3 0.3 0.2 1:2 1.3 Low Low Critical - Moder-
ate Low
Ditch C2
1:3 0.3 0.2 1:2 4.0 Low Low - Moder-
ate High Low
Ditch C3
1:3 0.3 0.2 1:1.5 1.3 Low Low Critical - Moder-
ate Low
Ditch C4
1:3 0.3 0.2 1:1.5 4.0 Low Low - Low High Low
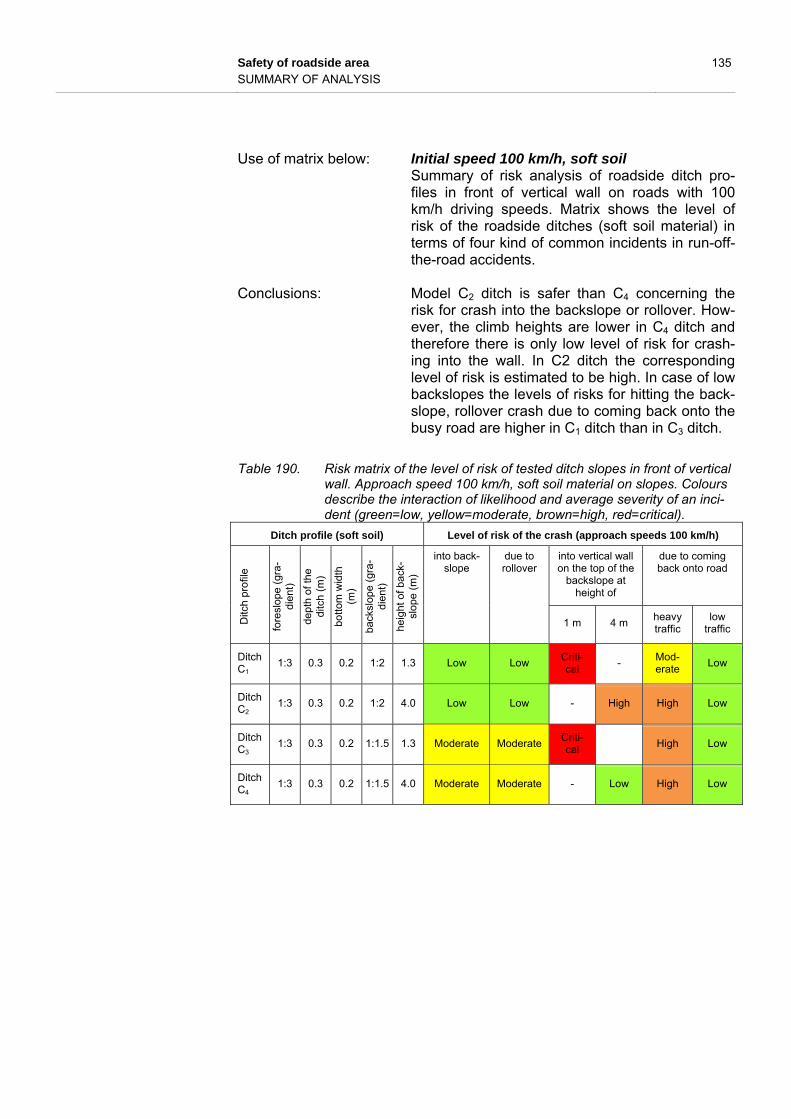
Safety of roadside area 135 SUMMARY OF ANALYSIS
Use of matrix below: Initial speed 100 km/h, soft soil Summary of risk analysis of roadside ditch pro-files in front of vertical wall on roads with 100 km/h driving speeds. Matrix shows the level of risk of the roadside ditches (soft soil material) in terms of four kind of common incidents in run-off-the-road accidents.
Conclusions: Model C2 ditch is safer than C4 concerning the
risk for crash into the backslope or rollover. How-ever, the climb heights are lower in C4 ditch and therefore there is only low level of risk for crash-ing into the wall. In C2 ditch the corresponding level of risk is estimated to be high. In case of low backslopes the levels of risks for hitting the back-slope, rollover crash due to coming back onto the busy road are higher in C1 ditch than in C3 ditch.
Table 190. Risk matrix of the level of risk of tested ditch slopes in front of vertical wall. Approach speed 100 km/h, soft soil material on slopes. Colours describe the interaction of likelihood and average severity of an inci-dent (green=low, yellow=moderate, brown=high, red=critical).
Ditch profile (soft soil) Level of risk of the crash (approach speeds 100 km/h)
Ditc
h pr
ofile
fore
slop
e (g
ra-
dien
t)
dept
h of
the
ditc
h (m
)
botto
m w
idth
(m
)
back
slop
e (g
ra-
dien
t)
heig
ht o
f bac
k-sl
ope
(m)
into back-slope
due to rollover
into vertical wall on the top of the
backslope at height of
due to coming back onto road
1 m 4 m heavy traffic
low traffic
Ditch C1
1:3 0.3 0.2 1:2 1.3 Low Low Criti-cal
- Mod-erate
Low
Ditch C2
1:3 0.3 0.2 1:2 4.0 Low Low - High High Low
Ditch C3
1:3 0.3 0.2 1:1.5 1.3 Moderate Moderate Criti-cal
High Low
Ditch C4
1:3 0.3 0.2 1:1.5 4.0 Moderate Moderate - Low High Low
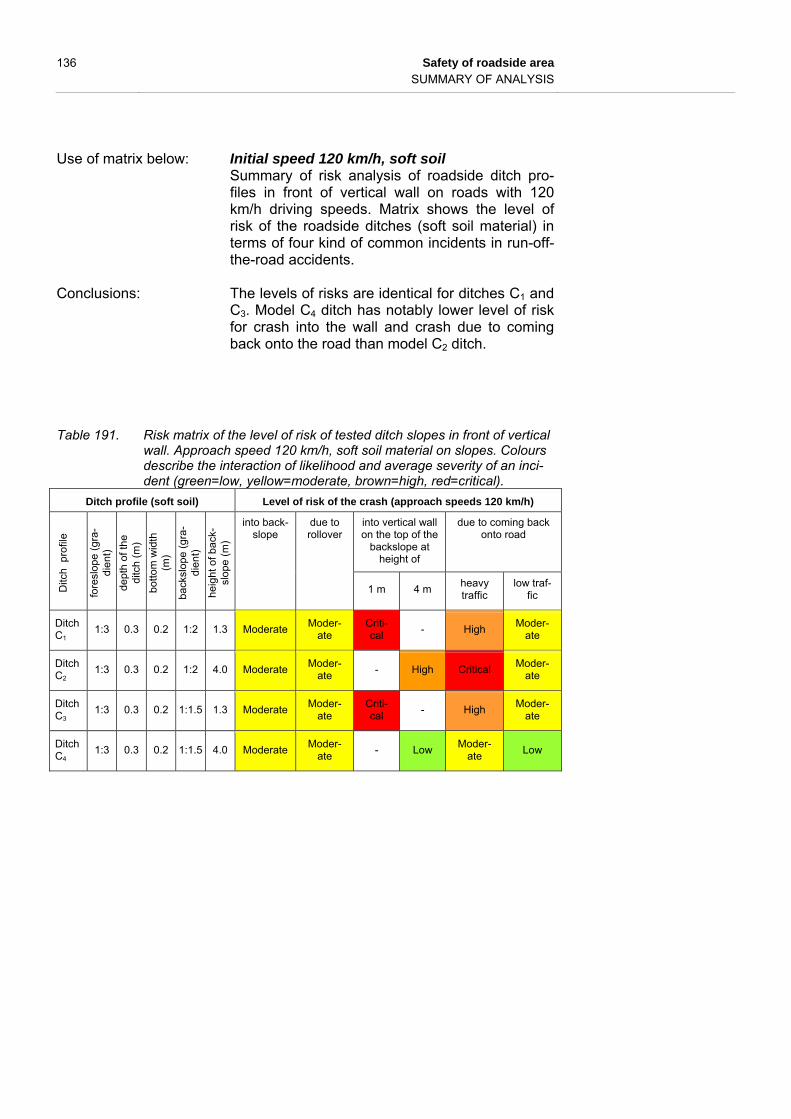
136 Safety of roadside area SUMMARY OF ANALYSIS
Use of matrix below: Initial speed 120 km/h, soft soil Summary of risk analysis of roadside ditch pro-files in front of vertical wall on roads with 120 km/h driving speeds. Matrix shows the level of risk of the roadside ditches (soft soil material) in terms of four kind of common incidents in run-off-the-road accidents.
Conclusions: The levels of risks are identical for ditches C1 and
C3. Model C4 ditch has notably lower level of risk for crash into the wall and crash due to coming back onto the road than model C2 ditch.
Table 191. Risk matrix of the level of risk of tested ditch slopes in front of vertical wall. Approach speed 120 km/h, soft soil material on slopes. Colours describe the interaction of likelihood and average severity of an inci-dent (green=low, yellow=moderate, brown=high, red=critical).
Ditch profile (soft soil) Level of risk of the crash (approach speeds 120 km/h)
Ditc
h p
rofil
e
fore
slop
e (g
ra-
dien
t)
dept
h of
the
ditc
h (m
)
botto
m w
idth
(m
)
back
slop
e (g
ra-
dien
t)
heig
ht o
f bac
k-sl
ope
(m)
into back-slope
due to rollover
into vertical wall on the top of the
backslope at height of
due to coming back onto road
1 m 4 m heavy traffic
low traf-fic
Ditch C1
1:3 0.3 0.2 1:2 1.3 Moderate Moder-
ate Criti-cal
- High Moder-
ate
Ditch C2
1:3 0.3 0.2 1:2 4.0 Moderate Moder-
ate - High Critical
Moder-ate
Ditch C3
1:3 0.3 0.2 1:1.5 1.3 Moderate Moder-
ate Criti-cal
- High Moder-
ate
Ditch C4
1:3 0.3 0.2 1:1.5 4.0 Moderate Moder-
ate - Low
Moder-ate
Low
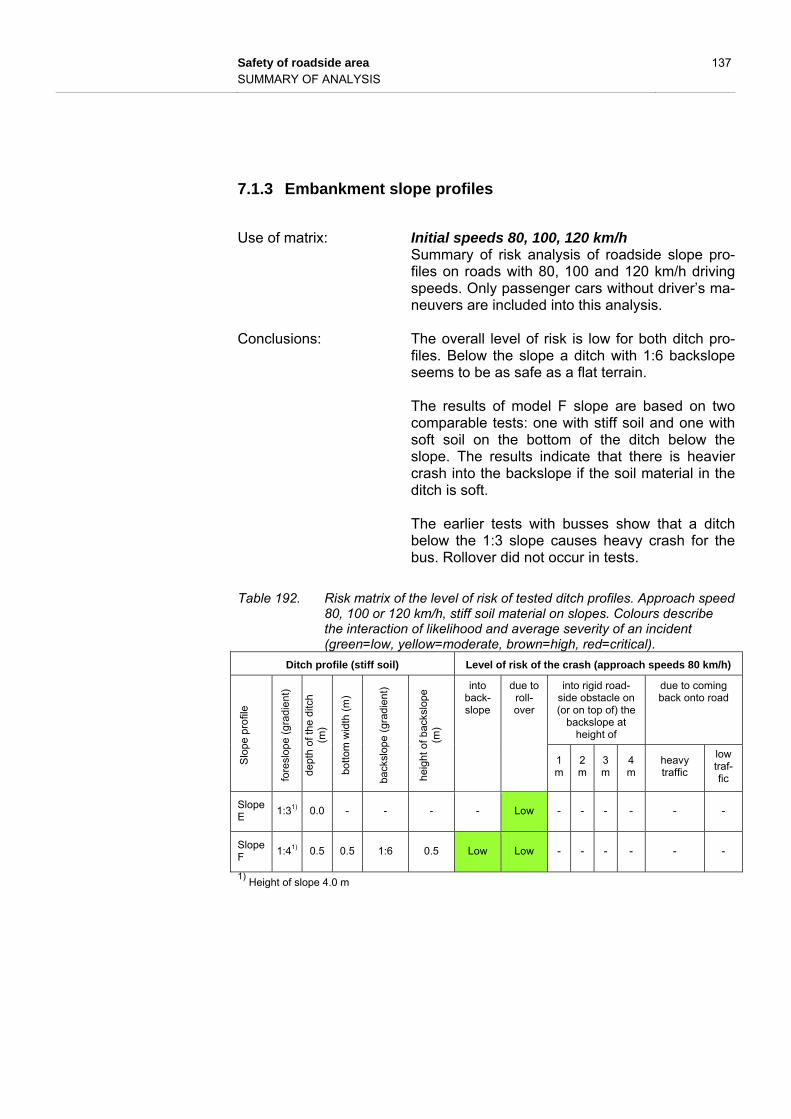
Safety of roadside area 137 SUMMARY OF ANALYSIS
7.1.3 Embankment slope profiles
Use of matrix: Initial speeds 80, 100, 120 km/h
Summary of risk analysis of roadside slope pro-files on roads with 80, 100 and 120 km/h driving speeds. Only passenger cars without driver’s ma-neuvers are included into this analysis.
Conclusions: The overall level of risk is low for both ditch pro-
files. Below the slope a ditch with 1:6 backslope seems to be as safe as a flat terrain.
The results of model F slope are based on two
comparable tests: one with stiff soil and one with soft soil on the bottom of the ditch below the slope. The results indicate that there is heavier crash into the backslope if the soil material in the ditch is soft.
The earlier tests with busses show that a ditch
below the 1:3 slope causes heavy crash for the bus. Rollover did not occur in tests.
Table 192. Risk matrix of the level of risk of tested ditch profiles. Approach speed 80, 100 or 120 km/h, stiff soil material on slopes. Colours describe the interaction of likelihood and average severity of an incident (green=low, yellow=moderate, brown=high, red=critical).
Ditch profile (stiff soil) Level of risk of the crash (approach speeds 80 km/h)
Slo
pe p
rofil
e
fore
slop
e (g
radi
ent
)
dept
h of
the
ditc
h
(m)
botto
m w
idth
(m
)
back
slop
e (g
radi
ent)
heig
ht o
f bac
kslo
pe
(m)
into back-slope
due to roll-over
into rigid road-side obstacle on (or on top of) the
backslope at height of
due to coming back onto road
1 m
2 m
3 m
4 m
heavy traffic
low traf-fic
Slope E
1:31) 0.0 - - - - Low - - - - - -
Slope F
1:41) 0.5 0.5 1:6 0.5 Low Low - - - - - -
1) Height of slope 4.0 m

138 Safety of roadside area SUMMARY OF ANALYSIS
7.2 Numeric presentation of the results
7.2.1 Description of the method
In following tables the results (=levels of risks) for incidents are presented as numeric series instead of verbal terms. The idea is to describe the results of the analysis in more details than just one verbal term for level of the risk of certain incident. In the method the different approach speeds are merged for generalisation of the results. The results are presented as numeric series which include weighted sums of different levels of risks for each approach speed and approach angle. The first number in series is a count of all ‘lows’, second one is a count of ‘mod-erates’ next one is a count of ‘highs’ and the last one is a count of ‘criticals’. For example, in the table below there are three ‘lows’, five ‘moderates’, three ‘highs’ and one ‘critical’ for crash into the backslope in model A ditch. This gives series: 3-5-3-1, which represents the number of levels of risks but does not take into account the distribution of the encroachment angles in real-world accidents. For this reason the numbers are also weighted. The factors are simplified from the distribution of the angles: 40 % = 4, 35 % = 3, 15 % = 2 and 10 % = 1. This gives series: (4+4+3=) 11 lows, (4+3+3+2+1=) 13 moderates, (2+2+1=) 5 highs, 1 criticals = 11-13-5-1
Table 193. Weighted mean of level of risk of crash into backslope in model A ditch (stiff soil, passenger cars, no steering) based on analysis of test results and some additional assumptions (assumptions with italic font).
Speed / angle 5°
(factor 4x)
10°
(factor 3x)
15°
(factor 2x)
20°
(factor 1x)
Level of risk (weighted mean)
Distribution 40 % 35 % 15 % 10 % 100 %
80 km/h Low Moderate Moderate Moderate Moderate
100 km/h Low Low High High Moderate
120 km/h Moderate Moderate High Critical Moderate
In next four tables and figures the results are presented as described above. The difference between the tables is the location of the possible obstacle on the backslope. For that reason the tables are answer for the question: How to design the ditch (height of backslope 4.0 m) if there is rigid obstacle at the height of 1, 2, 3 or 4 meters?? The more there are ‘lows’ (and ‘moderates’) the safer is the ditch model. Vice versa, the more there are ‘criticals’ (and ‘highs) the more risky is the ditch model.
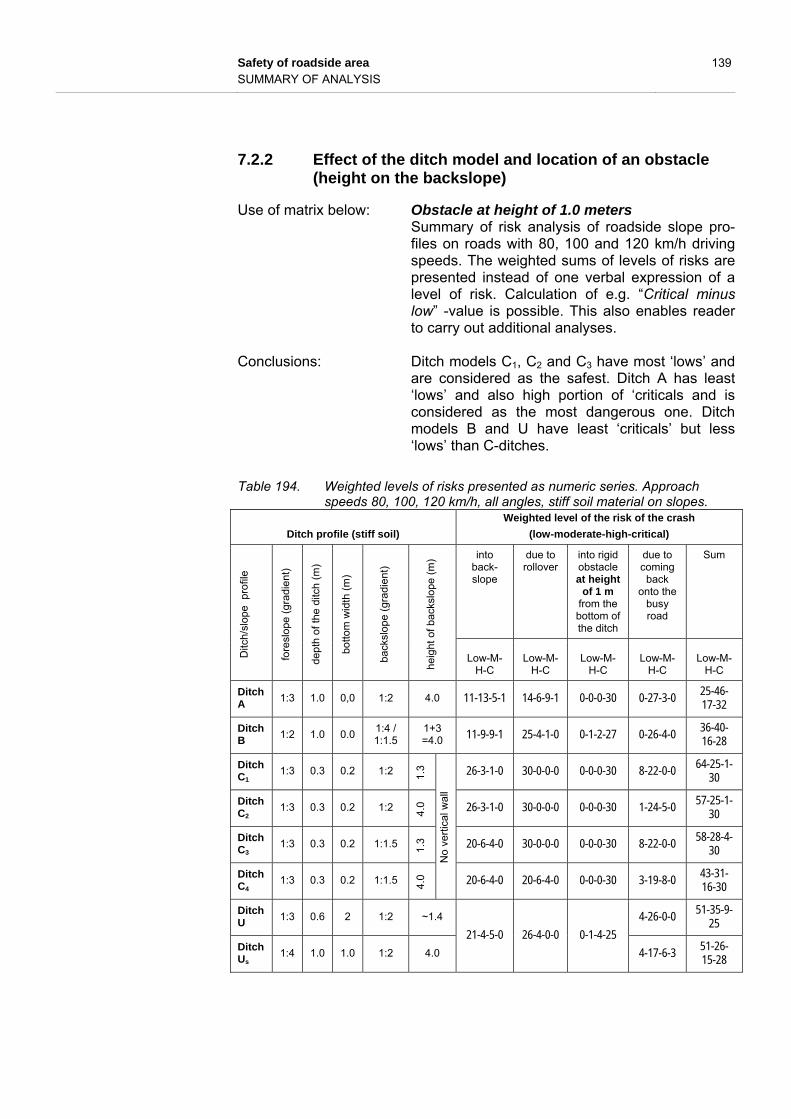
Safety of roadside area 139 SUMMARY OF ANALYSIS
7.2.2 Effect of the ditch model and location of an obstacle (height on the backslope)
Use of matrix below: Obstacle at height of 1.0 meters Summary of risk analysis of roadside slope pro-files on roads with 80, 100 and 120 km/h driving speeds. The weighted sums of levels of risks are presented instead of one verbal expression of a level of risk. Calculation of e.g. “Critical minus low” -value is possible. This also enables reader to carry out additional analyses.
Conclusions: Ditch models C1, C2 and C3 have most ‘lows’ and
are considered as the safest. Ditch A has least ‘lows’ and also high portion of ‘criticals and is considered as the most dangerous one. Ditch models B and U have least ‘criticals’ but less ‘lows’ than C-ditches.
Table 194. Weighted levels of risks presented as numeric series. Approach speeds 80, 100, 120 km/h, all angles, stiff soil material on slopes.
Ditch profile (stiff soil)
Weighted level of the risk of the crash
(low-moderate-high-critical)
Ditc
h/sl
ope
pro
file
fore
slop
e (g
radi
ent
)
dept
h of
the
ditc
h (
m)
botto
m w
idth
(m
)
back
slop
e (g
radi
ent)
heig
ht o
f bac
kslo
pe (
m) into
back-slope
due to rollover
into rigid obstacle at height
of 1 m from the bottom of the ditch
due to coming
back onto the
busy road
Sum
Low-M-H-C
Low-M-H-C
Low-M-H-C
Low-M-H-C
Low-M-H-C
Ditch A
1:3 1.0 0,0 1:2 4.0 11-13-5-1 14-6-9-1 0-0-0-30 0-27-3-0 25-46-17-32
Ditch B
1:2 1.0 0.0 1:4 / 1:1.5
1+3 =4.0 11-9-9-1 25-4-1-0 0-1-2-27 0-26-4-0
36-40-16-28
Ditch C1
1:3 0.3 0.2 1:2 1.3
No
vert
ical
wal
l
26-3-1-0 30-0-0-0 0-0-0-30 8-22-0-0 64-25-1-
30
Ditch C2
1:3 0.3 0.2 1:2 4.0 26-3-1-0 30-0-0-0 0-0-0-30 1-24-5-0
57-25-1-30
Ditch C3
1:3 0.3 0.2 1:1.5 1.3 20-6-4-0 30-0-0-0 0-0-0-30 8-22-0-0
58-28-4-30
Ditch C4
1:3 0.3 0.2 1:1.5 4.0 20-6-4-0 20-6-4-0 0-0-0-30 3-19-8-0
43-31-16-30
Ditch U
1:3 0.6 2 1:2 ~1.4
21-4-5-0 26-4-0-0 0-1-4-25
4-26-0-0 51-35-9-
25
Ditch Us
1:4 1.0 1.0 1:2 4.0 4-17-6-3 51-26-15-28
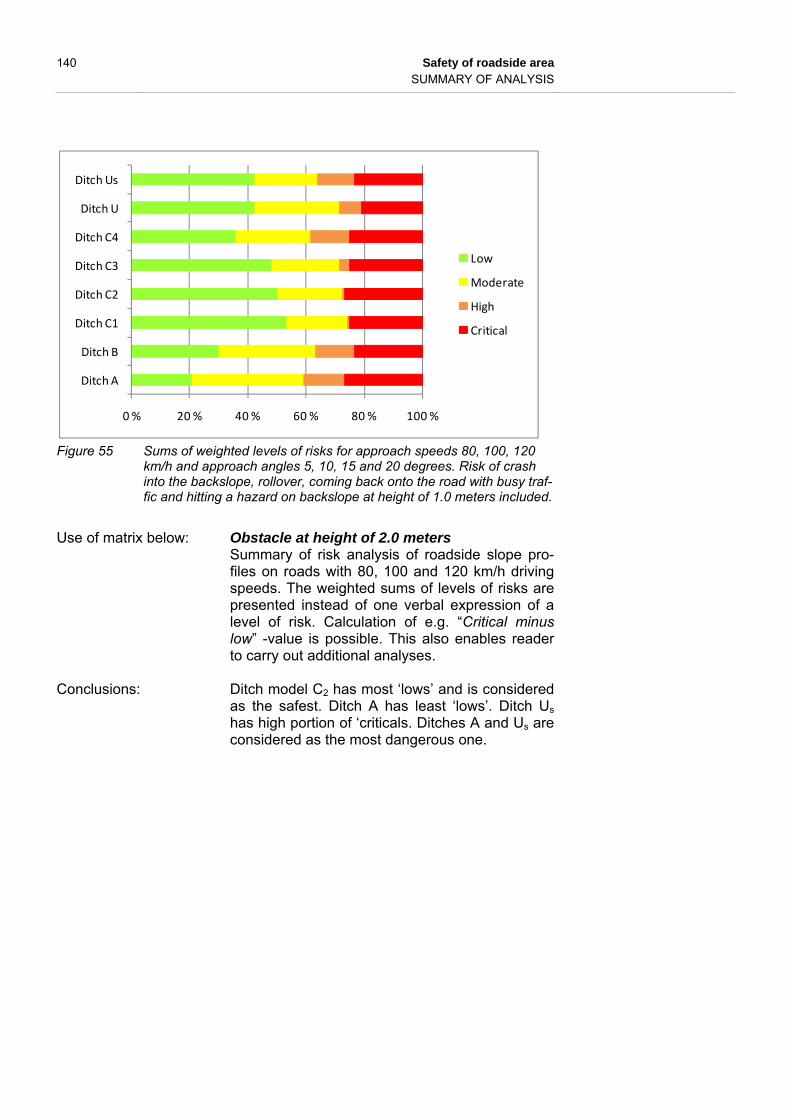
140 Safety of roadside area SUMMARY OF ANALYSIS
Figure 55 Sums of weighted levels of risks for approach speeds 80, 100, 120
km/h and approach angles 5, 10, 15 and 20 degrees. Risk of crash into the backslope, rollover, coming back onto the road with busy traf-fic and hitting a hazard on backslope at height of 1.0 meters included.
Use of matrix below: Obstacle at height of 2.0 meters
Summary of risk analysis of roadside slope pro-files on roads with 80, 100 and 120 km/h driving speeds. The weighted sums of levels of risks are presented instead of one verbal expression of a level of risk. Calculation of e.g. “Critical minus low” -value is possible. This also enables reader to carry out additional analyses.
Conclusions: Ditch model C2 has most ‘lows’ and is considered
as the safest. Ditch A has least ‘lows’. Ditch Us has high portion of ‘criticals. Ditches A and Us are considered as the most dangerous one.
0 % 20 % 40 % 60 % 80 % 100 %
Ditch A
Ditch B
Ditch C1
Ditch C2
Ditch C3
Ditch C4
Ditch U
Ditch Us
Low
Moderate
High
Critical
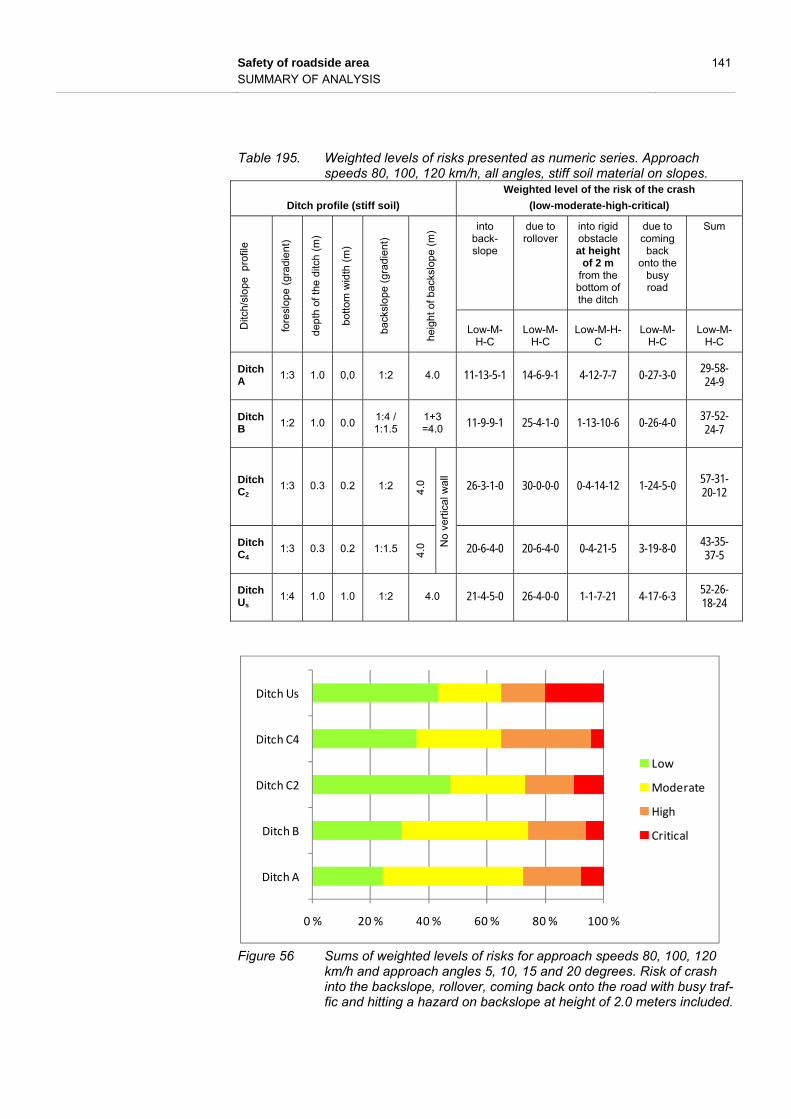
Safety of roadside area 141 SUMMARY OF ANALYSIS
Table 195. Weighted levels of risks presented as numeric series. Approach speeds 80, 100, 120 km/h, all angles, stiff soil material on slopes.
Ditch profile (stiff soil)
Weighted level of the risk of the crash
(low-moderate-high-critical)
Ditc
h/sl
ope
pro
file
fore
slop
e (g
radi
ent
)
dept
h of
the
ditc
h (
m)
botto
m w
idth
(m
)
back
slop
e (g
radi
ent)
heig
ht o
f bac
kslo
pe (
m) into
back-slope
due to rollover
into rigid obstacle at height
of 2 m from the bottom of the ditch
due to coming
back onto the
busy road
Sum
Low-M-H-C
Low-M-H-C
Low-M-H-C
Low-M-H-C
Low-M-H-C
Ditch A
1:3 1.0 0,0 1:2 4.0 11-13-5-1 14-6-9-1 4-12-7-7 0-27-3-0 29-58-24-9
Ditch B
1:2 1.0 0.0 1:4 / 1:1.5
1+3 =4.0 11-9-9-1 25-4-1-0 1-13-10-6 0-26-4-0
37-52-24-7
Ditch C2
1:3 0.3 0.2 1:2 4.0
No
vert
ical
wal
l
26-3-1-0 30-0-0-0 0-4-14-12 1-24-5-0 57-31-20-12
Ditch C4
1:3 0.3 0.2 1:1.5 4.0 20-6-4-0 20-6-4-0 0-4-21-5 3-19-8-0
43-35-37-5
Ditch Us
1:4 1.0 1.0 1:2 4.0 21-4-5-0 26-4-0-0 1-1-7-21 4-17-6-3 52-26-18-24
Figure 56 Sums of weighted levels of risks for approach speeds 80, 100, 120
km/h and approach angles 5, 10, 15 and 20 degrees. Risk of crash into the backslope, rollover, coming back onto the road with busy traf-fic and hitting a hazard on backslope at height of 2.0 meters included.
0 % 20 % 40 % 60 % 80 % 100 %
Ditch A
Ditch B
Ditch C2
Ditch C4
Ditch Us
Low
Moderate
High
Critical

142 Safety of roadside area SUMMARY OF ANALYSIS
Use of matrix below: Obstacle at height of 3.0 meters Summary of risk analysis of roadside slope pro-files on roads with 80, 100 and 120 km/h driving speeds. The weighted sums of levels of risks are presented instead of one verbal expression of a level of risk. Calculation of e.g. “Critical minus low” -value is possible. This also enables reader to carry out additional analyses.
Conclusions: Ditch models C2 and Us have most ‘lows’. How-
ever, ditch Us has also high portion of ‘criticals. Ditches C2, C4, Us and also B are considered sa-fer than ditch A.
Table 196. Weighted levels of risk presented as numeric series. Approach speeds 80, 100, 120 km/h, all angles, stiff soil material on slopes.
Ditch profile (stiff soil)
Weighted level of the risk of the crash
(low-moderate-high-critical)
Ditc
h/sl
ope
pro
file
fore
slop
e (g
radi
ent
)
dept
h of
the
ditc
h (
m)
botto
m w
idth
(m
)
back
slop
e (g
radi
ent)
heig
ht o
f bac
kslo
pe (
m) into
back-slope
due to rollover
into rigid obstacle at height
of 3 m from the bottom of the ditch
due to coming
back onto the
busy road
Sum
Low-M-H-C
Low-M-H-C
Low-M-H-C
Low-M-H-C
Low-M-H-C
Ditch A
1:3 1.0 0,0 1:2 4.0 11-13-5-1 14-6-9-1 6-16-5-3 0-27-3-0 31-62-22-5
Ditch B
1:2 1.0 0.0 1:4 / 1:1.5
1+3 =4.0 11-9-9-1 25-4-1-0 9-16-2-3 0-26-4-0
45-55-16-4
Ditch C2
1:3 0.3 0.2 1:2 4.0
No
vert
ical
wal
l
26-3-1-0 30-0-0-0 4-3-14-9 1-24-5-0 61-30-20-9
Ditch C4
1:3 0.3 0.2 1:1.5 4.0 20-6-4-0 20-6-4-0 5-13-10-2 3-19-8-0
48-44-26-2
Ditch Us
1:4 1.0 1.0 1:2 4.0 21-4-5-0 26-4-0-0 9-7-6-8 4-17-6-3 60-32-17-11

Safety of roadside area 143 SUMMARY OF ANALYSIS
Figure 57 Sums of weighted levels of risks for approach speeds 80, 100, 120
km/h and approach angles 5, 10, 15 and 20 degrees. Risk of crash into the backslope, rollover, coming back onto the road with busy traf-fic and hitting a hazard on backslope at height of 3.0 meters included.
Use of matrix below: Obstacle at height of 4.0 meters
Summary of risk analysis of roadside slope pro-files on roads with 80, 100 and 120 km/h driving speeds. The weighted sums of levels of risks are presented instead of one verbal expression of a level of risk. Calculation of e.g. “Critical minus low” -value is possible. This also enables reader to carry out additional analyses.
Conclusions: There are not so clear differences between the ditch models. Considerable is that model C4 has no ‘criticals’ while ditch Us has relatively high por-tion of ‘criticals’. Ditch C2 seems to be slightly safest together with Us.
0 % 20 % 40 % 60 % 80 % 100 %
Ditch A
Ditch B
Ditch C2
Ditch C4
Ditch Us
Low
Moderate
High
Critical

144 Safety of roadside area SUMMARY OF ANALYSIS
Table 197. Weighted levels of risk presented as numeric series. Approach speeds 80, 100, 120 km/h, all angles, stiff soil material on slopes.
Ditch profile (stiff soil)
Weighted level of the risk of the crash
(low-moderate-high-critical)
Ditc
h/sl
ope
pro
file
fore
slop
e (g
radi
ent
)
dept
h of
the
ditc
h (
m)
botto
m w
idth
(m
)
back
slop
e (g
radi
ent)
heig
ht o
f bac
kslo
pe (
m) into
back-slope
due to rollover
into rigid obstacle at height
of 4 m from the bottom of the ditch
due to coming
back onto the
busy road
Sum
Low-M-H-C
Low-M-H-C
Low-M-H-C
Low-M-H-C
Low-M-H-C
Ditch A
1:3 1.0 0,0 1:2 4.0 11-13-5-1 14-6-9-1 26-4-0-0 0-27-3-0 51-50-17-2
Ditch B
1:2 1.0 0.0 1:4 / 1:1.5
1+3 =4.0 11-9-9-1 25-4-1-0 17-10-0-3 0-26-4-0
53-49-14-4
Ditch C2
1:3 0.3 0.2 1:2 4.0
No
vert
ical
wal
l
26-3-1-0 30-0-0-0 5-2-18-5 1-24-5-0 62-29-24-5
Ditch C4
1:3 0.3 0.2 1:1.5 4.0 20-6-4-0 20-6-4-0 11-10-9-0 3-19-8-0
54-41-25-0
Ditch Us
1:4 1.0 1.0 1:2 4.0 21-4-5-0 26-4-0-0 14-6-2-8 4-17-6-3 65-31-13-11
Figure 58 Sums of weighted levels of risks for approach speeds 80, 100, 120
km/h and approach angles 5, 10, 15 and 20 degrees. Risk of crash into the backslope, rollover, coming back onto the road with busy traf-fic and hitting a hazard on backslope at height of 4.0 meters included.
0 % 20 % 40 % 60 % 80 % 100 %
Ditch A
Ditch B
Ditch C2
Ditch C4
Ditch Us
Low
Moderate
High
Critical

Safety of roadside area 145 SUMMARY OF ANALYSIS
7.2.3 Effect of the ditch model and location of an obstacle (distance from the road)
In the following four tables (tables 198-201) the column “risk of crash into hazard” is changed: instead of height of the hazardous obstacle the risk is evaluated based on the lateral distance of the hazard. The purpose of this is to find answer for the question: How to design the ditch if the distance from the edge of the road to the haz-ard is 5, 7, 9 or 11 meters? In the tables 198-202 the result is also presented as one simplified figure (count of lows minus count of criticals) to make easier for reader to see the differences between safeties of the ditch profiles. The bigger the figure the safer is the ditch. Similar figures can be calculated from previous tables and from separate incidents for comparison. All ‘Low minus critical’-values in ta-bles 194-202 are comparable. In table 202 there is presented a result for the question: How to design the ditch if there is no rigid obstacles on backslope? Notice that the height of the backslope is in following tables always 4.0 me-ters which affect especially on the likelihood of coming back onto the road.

146 Safety of roadside area SUMMARY OF ANALYSIS
Use of matrix below: Obstacle at distance of 5 meters Summary of risk analysis of roadside slope pro-files on roads with 80, 100 and 120 km/h driving speeds. The weighted sums of levels of risks are presented instead of one verbal expression of a level of risk. Calculation of e.g. “Critical minus low” -value is possible. This also enables reader to carry out additional analyses.
Conclusions: Ditch models C2 and C4 have most ‘low minus
criticals’ and are considered as the safest. Ditch A has lowest ranking and is considered as the most dangerous one.
Table 198. Weighted levels of risk presented as numeric series. Approach speeds 80, 100, 120 km/h, all angles, stiff soil material on slopes.
Ditch profile (stiff soil)
Weighted level of the risk of the crash
(low-moderate-high-critical)
Ditc
h/sl
ope
pro
file
fore
slop
e (g
radi
ent
)
dept
h of
the
ditc
h (
m)
botto
m w
idth
(m
)
back
slop
e (g
radi
ent)
heig
ht o
f bac
kslo
pe (
m)
into back-slope
due to
roll-over
into rigid obstacle at dis-
tance of 5 m
from the edge of the road
due to com-ing
back onto the
busy road
Sum Sub-trac-tion: Low
minus Criti-cal
(L-C=)
Low-M-H-
C
Low-M-H-
C Low-M-
H-C Low-
M-H-C Low-
M-H-C
Ditch A
1:3 1.0 0.0 1:2 4.0 11-13-
5-1 14-6-9-1
0-0-0-30 0-27-3-
0 25-46-17-32
-7
Ditch B
1:2 1.0 0.0 1:4 / 1:1.5
1+3 =4.0
11-9-9-1
25-4-1-0
0-1-2-27 0-26-4-
0 36-40-16-28
8
Ditch C2
1:3 0.3 0.2 1:2 4.0 26-3-1-0
30-0-0-0
0-4-14-12
1-24-5-0
57-31-20-12
45
Ditch C4
1:3 0.3 0.2 1:1.5 4.0 20-6-4-0
20-6-4-0
5-13-10-2
3-19-8-0
48-44-26-2
46
Ditch Us
1:4 1.0 1.0 1:2 4.0 21-4-5-0
26-4-0-0
0-0-0-30 4-17-6-
3 51-25-11-33
18

Safety of roadside area 147 SUMMARY OF ANALYSIS
Use of matrix below: Obstacle at distance of 7 meters Summary of risk analysis of roadside slope pro-files on roads with 80, 100 and 120 km/h driving speeds. The weighted sums of levels of risks are presented instead of one verbal expression of a level of risk. Calculation of e.g. “Critical minus low” -value is possible. This also enables reader to carry out additional analyses.
Conclusions: Ditch models C2 and C4 have again most ‘low mi-
nus criticals’ and are considered as the safest. Ditches A and Us have lowest ranking and are considered as the most dangerous ones.
Table 199. Weighted levels of risk presented as numeric series. Approach speeds 80, 100, 120 km/h, all angles, stiff soil material on slopes.
Ditch profile (stiff soil)
Weighted level of the risk of the crash
(low-moderate-high-critical)
Ditc
h/sl
ope
pro
file
fore
slop
e (g
radi
ent
)
dept
h of
the
ditc
h (
m)
botto
m w
idth
(m
)
back
slop
e (g
radi
ent)
heig
ht o
f bac
kslo
pe (
m)
into back-slope
due to
roll-over
into rigid obstacle at dis-
tance of 7 m
from the edge of the road
due to com-ing
back onto the
busy road
Sum Sub-trac-tion: Low
minus Critical
(L-C=)
Low-M-H-
C
Low-M-
H-C Low-M-
H-C Low-
M-H-C Low-
M-H-C
Ditch A
1:3 1.0 0.0 1:2 4.0 11-13-
5-1 14-6-9-1
4-12-7-7 0-27-3-
0 29-58-24-9
20
Ditch B
1:2 1.0 0.0 1:4 / 1:1.5
1+3 =4.0
11-9-9-1
25-4-1-0
1-13-10-6
0-26-4-0
37-52-24-7
30
Ditch C2
1:3 0.3 0.2 1:2 4.0 26-3-1-0
30-0-0-0
4-3-14-9 1-24-5-
0 61-30-20-9
52
Ditch C4
1:3 0.3 0.2 1:1.5 4.0 20-6-4-0
20-6-4-0
11-10-9-0
3-19-8-0
54-41-25-0
54
Ditch Us
1:4 1.0 1.0 1:2 4.0 21-4-5-0
26-4-0-0
0-1-4-25 4-17-6-
3 51-26-15-28
23

148 Safety of roadside area SUMMARY OF ANALYSIS
Use of matrix below: Obstacle at distance of 9 meters Summary of risk analysis of roadside slope pro-files on roads with 80, 100 and 120 km/h driving speeds. The weighted sums of levels of risks are presented instead of one verbal expression of a level of risk. Calculation of e.g. “Critical minus low” -value is possible. This also enables reader to carry out additional analyses.
Conclusions: Ditch model C2 has most ‘low minus criticals’ and
is considered as the safest together with esti-mated ranking of C4. Ditches A and Us have low-est ranking and are considered as the most dan-gerous ones.
Table 200. Weighted levels of risk presented as numeric series. Approach speeds 80, 100, 120 km/h, all angles, stiff soil material on slopes.
Ditch profile (stiff soil)
Weighted level of the risk of the crash
(low-moderate-high-critical)
Ditc
h/sl
ope
pro
file
fore
slop
e (g
radi
ent
)
dept
h of
the
ditc
h (
m)
botto
m w
idth
(m
)
back
slop
e (g
radi
ent)
heig
ht o
f bac
kslo
pe (
m)
into back-slope
due to
roll-over
into rigid obstacle at dis-
tance of 9 m
from the edge of the road
due to com-ing
back onto the
busy road
Sum Sub-trac-tion: Low
minus Critical
(L-C=)
Low-M-H-
C
Low-M-
H-C Low-M-
H-C Low-
M-H-C Low-
M-H-C
Ditch A
1:3 1.0 0.0 1:2 4.0 11-13-
5-1 14-6-9-1
6-16-5-3 0-27-3-
0 31-62-22-5
26
Ditch B
1:2 1.0 0.0 1:4 / 1:1.5
1+3 =4.0
11-9-9-1
25-4-1-0
9-16-2-3 0-26-4-
0 45-55-16-4
41
Ditch C2
1:3 0.3 0.2 1:2 4.0 26-3-1-0
30-0-0-0
5-2-18-5 1-24-5-
0 62-29-24-5
57
Ditch C4
1:3 0.3 0.2 1:1.5 4.0 20-6-4-0
20-6-4-0
- 3-19-8-
0 - (~59)
Ditch Us
1:4 1.0 1.0 1:2 4.0 21-4-5-0
26-4-0-0
1-1-7-21 4-17-6-
3 52-26-18-24
28

Safety of roadside area 149 SUMMARY OF ANALYSIS
Use of matrix below: Obstacle at distance of 11 meters Summary of risk analysis of roadside slope pro-files on roads with 80, 100 and 120 km/h driving speeds. The weighted sums of levels of risks are presented instead of one verbal expression of a level of risk. Calculation of e.g. “Critical minus low” -value is possible. This also enables reader to carry out additional analyses.
Conclusions: C ditches are assumed to reach the ranking val-
ues over 60 and are therefore considered as the safest. There are no differences between the oth-er ditch models. The further the rigid obstacle from the road the relatively safer is ditch A in comparison with others.
Table 201. Weighted levels of risk presented as numeric series. Approach speeds 80, 100, 120 km/h, all angles, stiff soil material on slopes.
Ditch profile (stiff soil)
Weighted level of the risk of the crash
(low-moderate-high-critical)
Ditc
h/sl
ope
pro
file
fore
slop
e (g
radi
ent
)
dept
h of
the
ditc
h (
m)
botto
m w
idth
(m
)
back
slop
e (g
radi
ent)
heig
ht o
f bac
kslo
pe (
m)
into back-slope
due to
roll-over
into rigid obstacle at dis-
tance of 11 m
from the edge of the road
due to com-ing
back onto the
busy road
Sum Sub-trac-tion: Low
minus Critical
(L-C=)
Low-M-H-
C
Low-M-
H-C Low-M-
H-C Low-
M-H-C Low-
M-H-C
Ditch A
1:3 1.0 0.0 1:2 4.0 11-13-
5-1 14-6-9-1
26-4-0-0 0-27-3-
0 51-50-17-2
49
Ditch B
1:2 1.0 0.0 1:4 / 1:1.5
1+3 =4.0
11-9-9-1
25-4-1-0
17-10-0-3
0-26-4-0
53-49-14-4
49
Ditch C2
1:3 0.3 0.2 1:2 4.0 26-3-1-0
30-0-0-0
- 1-24-5-
0 - -
Ditch C4
1:3 0.3 0.2 1:1.5 4.0 20-6-4-0
20-6-4-0
- 3-19-8-
0 - -
Ditch Us
1:4 1.0 1.0 1:2 4.0 21-4-5-0
26-4-0-0
9-7-6-8 4-17-6-
3 60-32-17-11
49
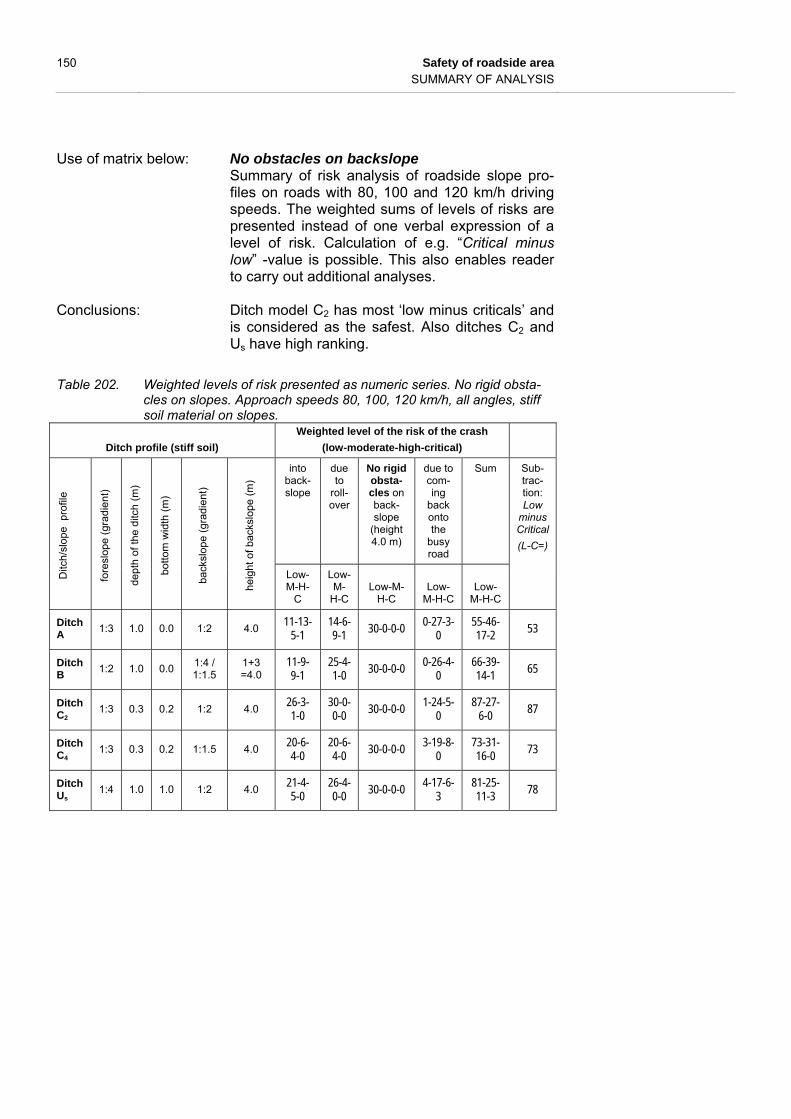
150 Safety of roadside area SUMMARY OF ANALYSIS
Use of matrix below: No obstacles on backslope Summary of risk analysis of roadside slope pro-files on roads with 80, 100 and 120 km/h driving speeds. The weighted sums of levels of risks are presented instead of one verbal expression of a level of risk. Calculation of e.g. “Critical minus low” -value is possible. This also enables reader to carry out additional analyses.
Conclusions: Ditch model C2 has most ‘low minus criticals’ and
is considered as the safest. Also ditches C2 and Us have high ranking.
Table 202. Weighted levels of risk presented as numeric series. No rigid obsta-cles on slopes. Approach speeds 80, 100, 120 km/h, all angles, stiff soil material on slopes.
Ditch profile (stiff soil)
Weighted level of the risk of the crash
(low-moderate-high-critical)
Ditc
h/sl
ope
pro
file
fore
slop
e (g
radi
ent
)
dept
h of
the
ditc
h (
m)
botto
m w
idth
(m
)
back
slop
e (g
radi
ent)
heig
ht o
f bac
kslo
pe (
m)
into back-slope
due to
roll-over
No rigid obsta-cles on back-slope
(height 4.0 m)
due to com-ing
back onto the
busy road
Sum Sub-trac-tion: Low
minus Critical
(L-C=)
Low-M-H-
C
Low-M-
H-C Low-M-
H-C Low-
M-H-C Low-
M-H-C
Ditch A
1:3 1.0 0.0 1:2 4.0 11-13-
5-1 14-6-9-1
30-0-0-0 0-27-3-
0 55-46-17-2
53
Ditch B
1:2 1.0 0.0 1:4 / 1:1.5
1+3 =4.0
11-9-9-1
25-4-1-0
30-0-0-0 0-26-4-
0 66-39-14-1
65
Ditch C2
1:3 0.3 0.2 1:2 4.0 26-3-1-0
30-0-0-0
30-0-0-0 1-24-5-
0 87-27-
6-0 87
Ditch C4
1:3 0.3 0.2 1:1.5 4.0 20-6-4-0
20-6-4-0
30-0-0-0 3-19-8-
0 73-31-16-0
73
Ditch Us
1:4 1.0 1.0 1:2 4.0 21-4-5-0
26-4-0-0
30-0-0-0 4-17-6-
3 81-25-11-3
78
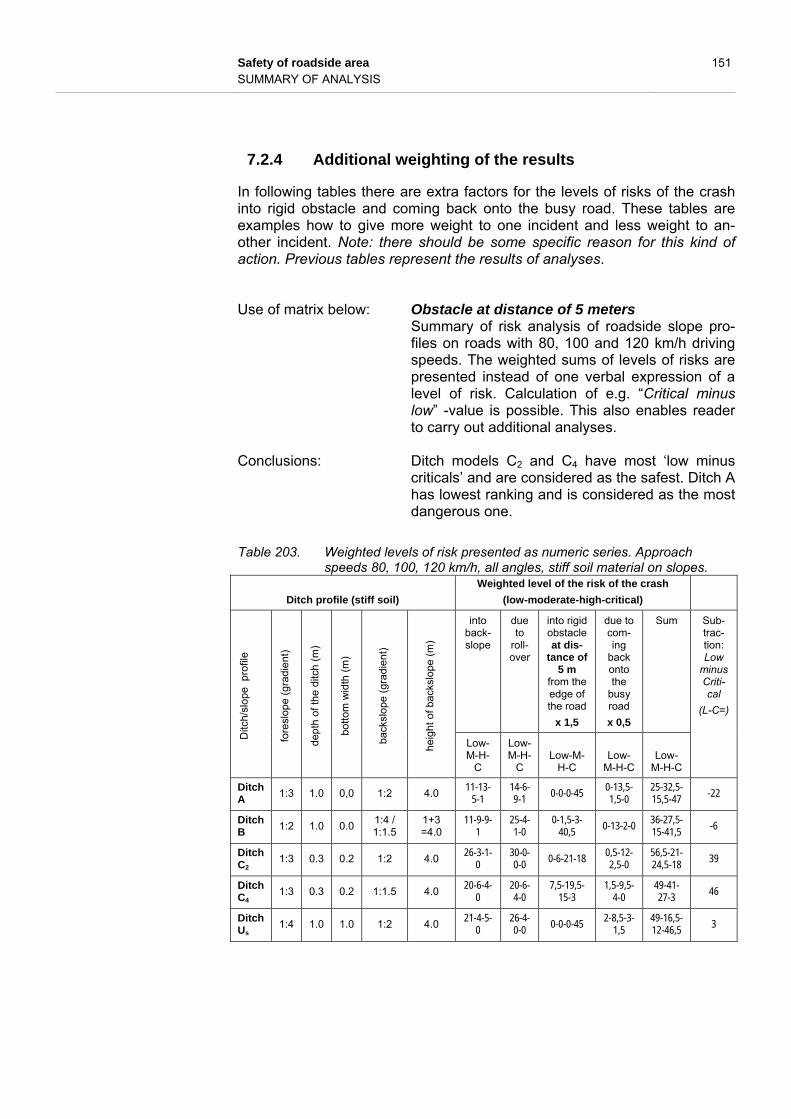
Safety of roadside area 151 SUMMARY OF ANALYSIS
7.2.4 Additional weighting of the results
In following tables there are extra factors for the levels of risks of the crash into rigid obstacle and coming back onto the busy road. These tables are examples how to give more weight to one incident and less weight to an-other incident. Note: there should be some specific reason for this kind of action. Previous tables represent the results of analyses. Use of matrix below: Obstacle at distance of 5 meters
Summary of risk analysis of roadside slope pro-files on roads with 80, 100 and 120 km/h driving speeds. The weighted sums of levels of risks are presented instead of one verbal expression of a level of risk. Calculation of e.g. “Critical minus low” -value is possible. This also enables reader to carry out additional analyses.
Conclusions: Ditch models C2 and C4 have most ‘low minus
criticals’ and are considered as the safest. Ditch A has lowest ranking and is considered as the most dangerous one.
Table 203. Weighted levels of risk presented as numeric series. Approach speeds 80, 100, 120 km/h, all angles, stiff soil material on slopes.
Ditch profile (stiff soil)
Weighted level of the risk of the crash
(low-moderate-high-critical)
Ditc
h/sl
ope
pro
file
fore
slop
e (g
radi
ent
)
dept
h of
the
ditc
h (
m)
botto
m w
idth
(m
)
back
slop
e (g
radi
ent)
heig
ht o
f bac
kslo
pe (
m)
into back-slope
due to
roll-over
into rigid obstacle at dis-
tance of 5 m
from the edge of the road
x 1,5
due to com-ing
back onto the
busy road
x 0,5
Sum Sub-trac-tion: Low
minus Criti-cal
(L-C=)
Low-M-H-
C
Low-M-H-
C Low-M-
H-C Low-
M-H-C Low-
M-H-C
Ditch A
1:3 1.0 0,0 1:2 4.0 11-13-
5-1 14-6-9-1 0-0-0-45
0-13,5-1,5-0
25-32,5-15,5-47 -22
Ditch B
1:2 1.0 0.0 1:4 / 1:1.5
1+3 =4.0
11-9-9-1
25-4-1-0
0-1,5-3-40,5 0-13-2-0
36-27,5-15-41,5 -6
Ditch C2
1:3 0.3 0.2 1:2 4.0 26-3-1-
0 30-0-0-0 0-6-21-18
0,5-12-2,5-0
56,5-21-24,5-18 39
Ditch C4
1:3 0.3 0.2 1:1.5 4.0 20-6-4-
0 20-6-4-0
7,5-19,5-15-3
1,5-9,5-4-0
49-41-27-3 46
Ditch Us
1:4 1.0 1.0 1:2 4.0 21-4-5-
0 26-4-0-0 0-0-0-45
2-8,5-3-1,5
49-16,5-12-46,5 3

152 Safety of roadside area SUMMARY OF ANALYSIS
Use of matrix below: Obstacle at distance of 7 meters Summary of risk analysis of roadside slope pro-files on roads with 80, 100 and 120 km/h driving speeds. The weighted sums of levels of risks are presented instead of one verbal expression of a level of risk. Calculation of e.g. “Critical minus low” -value is possible. This also enables reader to carry out additional analyses.
Conclusions: Ditch models C2 and C4 have again most ‘low mi-
nus criticals’ and are considered as the safest. Ditch Us has lowest ranking and is considered as the most dangerous one.
Table 204. Weighted levels of risk presented as numeric series. Approach speeds 80, 100, 120 km/h, all angles, stiff soil material on slopes.
Ditch profile (stiff soil)
Weighted level of the risk of the crash
(low-moderate-high-critical)
Ditc
h/sl
ope
pro
file
fore
slop
e (g
radi
ent
)
dept
h of
the
ditc
h (
m)
botto
m w
idth
(m
)
back
slop
e (g
radi
ent)
heig
ht o
f bac
kslo
pe (
m)
into back-slope
due to
roll-over
into rigid obstacle at dis-
tance of 7 m
from the edge of the road
x 1,5
due to com-ing
back onto the
busy road
x 0,5
Sum Sub-trac-tion: Low
minus Critical
(L-C=)
Low-M-H-
C
Low-M-
H-C Low-M-
H-C Low-
M-H-C Low-
M-H-C
Ditch A
1:3 1.0 0,0 1:2 4.0 11-13-
5-1 14-6-9-1
6-18-10,5-10,5
0-13,5-1,5-0
31-50,5-26-12,5
19
Ditch B
1:2 1.0 0.0 1:4 / 1:1.5
1+3 =4.0
11-9-9-1
25-4-1-0
1,5-19,5-15-9
0-13-2-0
37-52-24-7
30
Ditch C2
1:3 0.3 0.2 1:2 4.0 26-3-1-
0 30-0-0-0
6-4,5-21-13,5
0,5-12-2,5-0
62,5-19,5-24,5-13,5
49
Ditch C4
1:3 0.3 0.2 1:1.5 4.0 20-6-4-
0 20-6-4-0
16,5-15-13,5-0
1,5-9,5-4-0
58-36,5-25,5-0
58
Ditch Us
1:4 1.0 1.0 1:2 4.0 21-4-5-
0 26-4-0-0
0-1,5-6-37,5
2-8,5-3-1,5
49-18-14-39
10
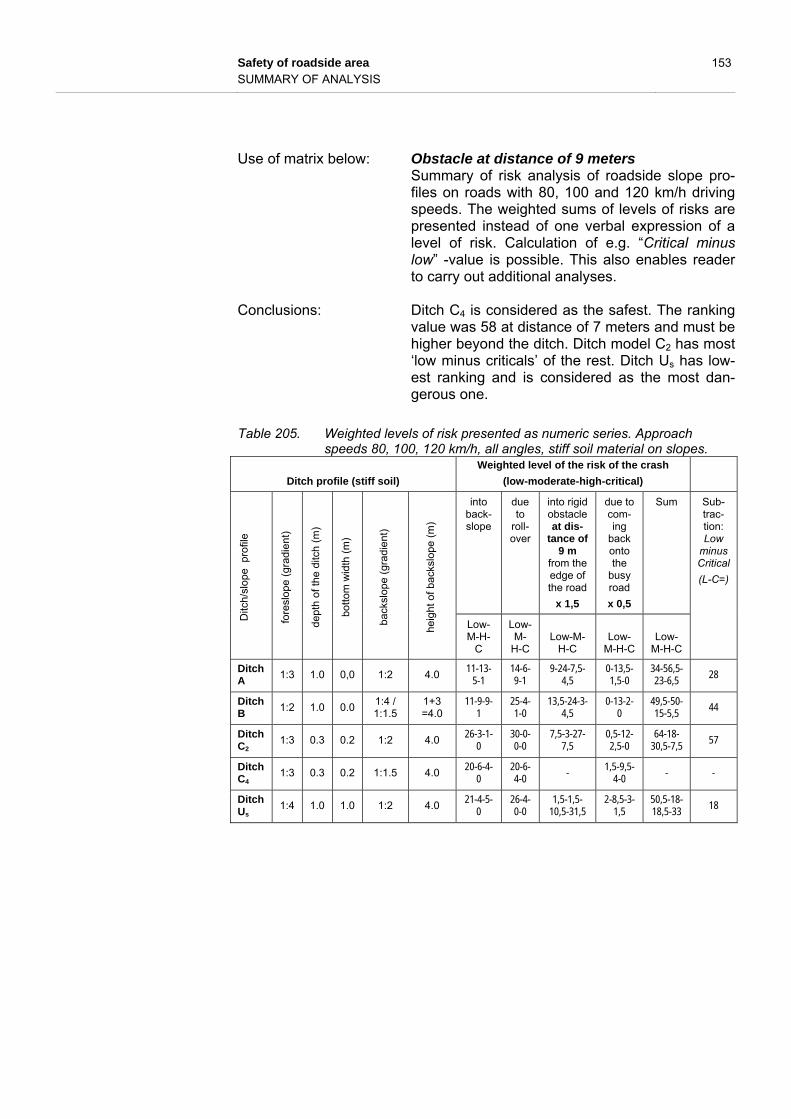
Safety of roadside area 153 SUMMARY OF ANALYSIS
Use of matrix below: Obstacle at distance of 9 meters Summary of risk analysis of roadside slope pro-files on roads with 80, 100 and 120 km/h driving speeds. The weighted sums of levels of risks are presented instead of one verbal expression of a level of risk. Calculation of e.g. “Critical minus low” -value is possible. This also enables reader to carry out additional analyses.
Conclusions: Ditch C4 is considered as the safest. The ranking
value was 58 at distance of 7 meters and must be higher beyond the ditch. Ditch model C2 has most ‘low minus criticals’ of the rest. Ditch Us has low-est ranking and is considered as the most dan-gerous one.
Table 205. Weighted levels of risk presented as numeric series. Approach speeds 80, 100, 120 km/h, all angles, stiff soil material on slopes.
Ditch profile (stiff soil)
Weighted level of the risk of the crash
(low-moderate-high-critical)
Ditc
h/sl
ope
pro
file
fore
slop
e (g
radi
ent
)
dept
h of
the
ditc
h (
m)
botto
m w
idth
(m
)
back
slop
e (g
radi
ent)
heig
ht o
f bac
kslo
pe (
m)
into back-slope
due to
roll-over
into rigid obstacle at dis-
tance of 9 m
from the edge of the road
x 1,5
due to com-ing
back onto the
busy road
x 0,5
Sum Sub-trac-tion: Low
minus Critical
(L-C=)
Low-M-H-
C
Low-M-
H-C Low-M-
H-C Low-
M-H-C Low-
M-H-C
Ditch A
1:3 1.0 0,0 1:2 4.0 11-13-
5-1 14-6-9-1
9-24-7,5-4,5
0-13,5-1,5-0
34-56,5-23-6,5
28
Ditch B
1:2 1.0 0.0 1:4 / 1:1.5
1+3 =4.0
11-9-9-1
25-4-1-0
13,5-24-3-4,5
0-13-2-0
49,5-50-15-5,5
44
Ditch C2
1:3 0.3 0.2 1:2 4.0 26-3-1-
0 30-0-0-0
7,5-3-27-7,5
0,5-12-2,5-0
64-18-30,5-7,5
57
Ditch C4
1:3 0.3 0.2 1:1.5 4.0 20-6-4-
0 20-6-4-0
- 1,5-9,5-4-0
- -
Ditch Us
1:4 1.0 1.0 1:2 4.0 21-4-5-
0 26-4-0-0
1,5-1,5-10,5-31,5
2-8,5-3-1,5
50,5-18-18,5-33
18
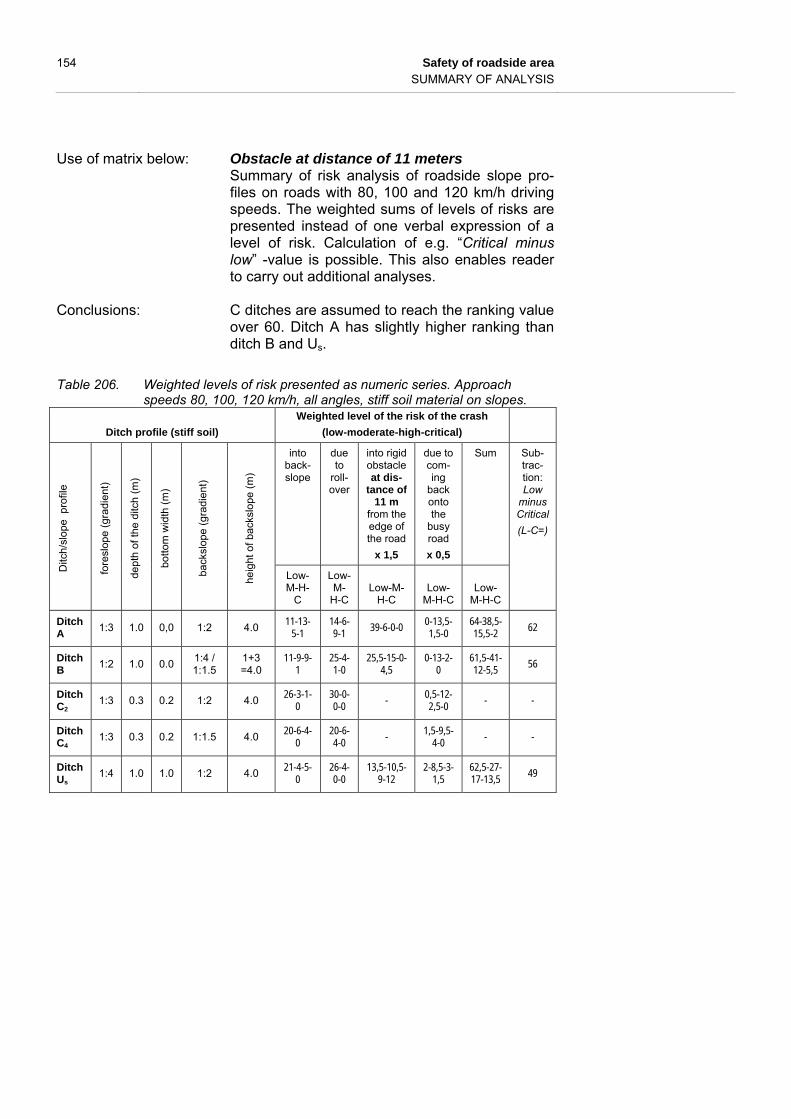
154 Safety of roadside area SUMMARY OF ANALYSIS
Use of matrix below: Obstacle at distance of 11 meters Summary of risk analysis of roadside slope pro-files on roads with 80, 100 and 120 km/h driving speeds. The weighted sums of levels of risks are presented instead of one verbal expression of a level of risk. Calculation of e.g. “Critical minus low” -value is possible. This also enables reader to carry out additional analyses.
Conclusions: C ditches are assumed to reach the ranking value
over 60. Ditch A has slightly higher ranking than ditch B and Us.
Table 206. Weighted levels of risk presented as numeric series. Approach speeds 80, 100, 120 km/h, all angles, stiff soil material on slopes.
Ditch profile (stiff soil)
Weighted level of the risk of the crash
(low-moderate-high-critical)
Ditc
h/sl
ope
pro
file
fore
slop
e (g
radi
ent
)
dept
h of
the
ditc
h (
m)
botto
m w
idth
(m
)
back
slop
e (g
radi
ent)
heig
ht o
f bac
kslo
pe (
m)
into back-slope
due to
roll-over
into rigid obstacle at dis-
tance of 11 m
from the edge of the road
x 1,5
due to com-ing
back onto the
busy road
x 0,5
Sum Sub-trac-tion: Low
minus Critical
(L-C=)
Low-M-H-
C
Low-M-
H-C Low-M-
H-C Low-
M-H-C Low-
M-H-C
Ditch A
1:3 1.0 0,0 1:2 4.0 11-13-
5-1 14-6-9-1
39-6-0-0 0-13,5-1,5-0
64-38,5-15,5-2
62
Ditch B
1:2 1.0 0.0 1:4 / 1:1.5
1+3 =4.0
11-9-9-1
25-4-1-0
25,5-15-0-4,5
0-13-2-0
61,5-41-12-5,5
56
Ditch C2
1:3 0.3 0.2 1:2 4.0 26-3-1-
0 30-0-0-0 -
0,5-12-2,5-0 - -
Ditch C4
1:3 0.3 0.2 1:1.5 4.0 20-6-4-
0 20-6-4-0
- 1,5-9,5-4-0
- -
Ditch Us
1:4 1.0 1.0 1:2 4.0 21-4-5-
0 26-4-0-0
13,5-10,5-9-12
2-8,5-3-1,5
62,5-27-17-13,5
49

Safety of roadside area 155 EXECUTIVE SUMMARY
8 EXECUTIVE SUMMARY
8.1 Introduction
Nordic project “Utformning av förlåtande sidoområde” (Design of forgiving roadside area) was proposed in 2005 by Nordiska vägregelgruppen (the Nordic road design guidelines working group) and launched by Swedish, Norwegian, Danish and Finnish road authorities. The purpose of the project was to compare the safety of different roadside cross-sections.
In Nordic countries the most common hit roadside obstacles in single vehicle accidents are ditches (20…30 % of fatalities), trees (10...40 % of fatalities), rock walls (5…20 % of fatalities) and minor road junctions (5…15 % of fatali-ties). This study covers the assessment of the risks of travelling beyond the ditch (20 % of errant vehicles), crash into the backslope of the ditch (50…60 %), rollover (60...70 %) and coming back onto the busy road.
8.2 Analysed roadside cross-sections
Figure 59 Tested roadside cross-sections. Model Cn with or without vertical wall.
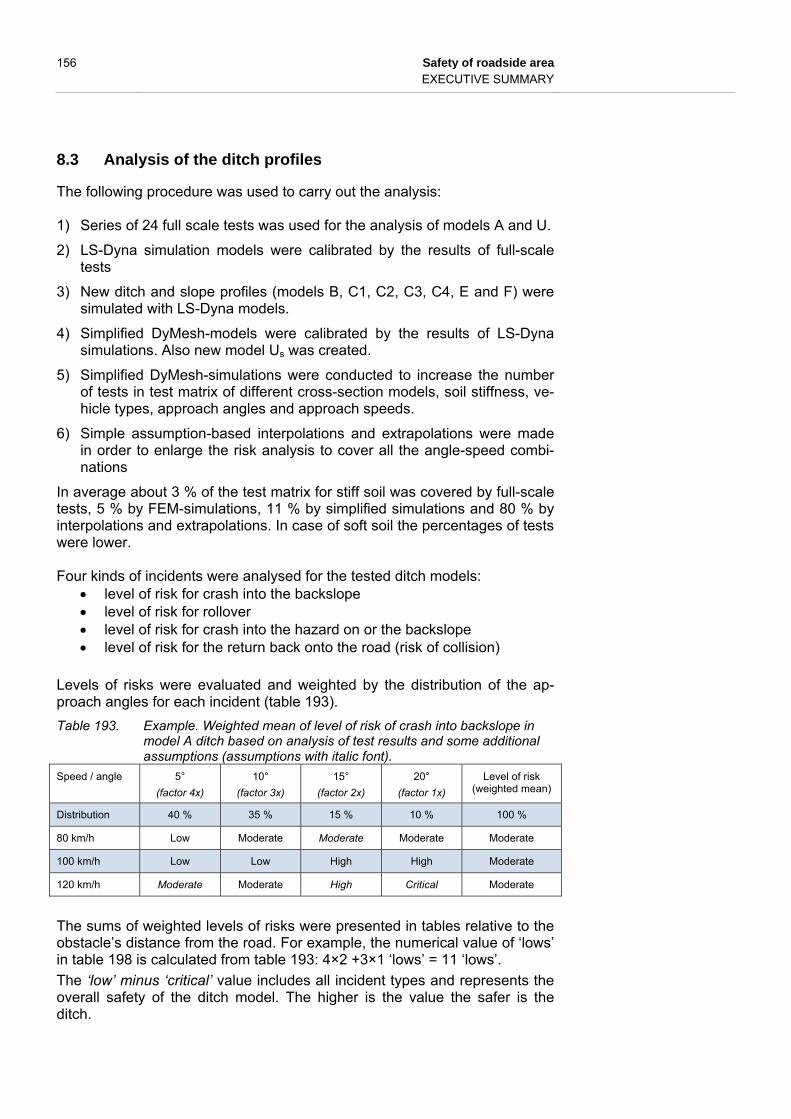
156 Safety of roadside area EXECUTIVE SUMMARY
8.3 Analysis of the ditch profiles
The following procedure was used to carry out the analysis: 1) Series of 24 full scale tests was used for the analysis of models A and U.
2) LS-Dyna simulation models were calibrated by the results of full-scale tests
3) New ditch and slope profiles (models B, C1, C2, C3, C4, E and F) were simulated with LS-Dyna models.
4) Simplified DyMesh-models were calibrated by the results of LS-Dyna simulations. Also new model Us was created.
5) Simplified DyMesh-simulations were conducted to increase the number of tests in test matrix of different cross-section models, soil stiffness, ve-hicle types, approach angles and approach speeds.
6) Simple assumption-based interpolations and extrapolations were made in order to enlarge the risk analysis to cover all the angle-speed combi-nations
In average about 3 % of the test matrix for stiff soil was covered by full-scale tests, 5 % by FEM-simulations, 11 % by simplified simulations and 80 % by interpolations and extrapolations. In case of soft soil the percentages of tests were lower. Four kinds of incidents were analysed for the tested ditch models:
level of risk for crash into the backslope level of risk for rollover level of risk for crash into the hazard on or the backslope level of risk for the return back onto the road (risk of collision)
Levels of risks were evaluated and weighted by the distribution of the ap-proach angles for each incident (table 193).
Table 193. Example. Weighted mean of level of risk of crash into backslope in model A ditch based on analysis of test results and some additional assumptions (assumptions with italic font).
Speed / angle 5°
(factor 4x)
10°
(factor 3x)
15°
(factor 2x)
20°
(factor 1x)
Level of risk (weighted mean)
Distribution 40 % 35 % 15 % 10 % 100 %
80 km/h Low Moderate Moderate Moderate Moderate
100 km/h Low Low High High Moderate
120 km/h Moderate Moderate High Critical Moderate
The sums of weighted levels of risks were presented in tables relative to the obstacle’s distance from the road. For example, the numerical value of ‘lows’ in table 198 is calculated from table 193: 4×2 +3×1 ‘lows’ = 11 ‘lows’.
The ‘low’ minus ‘critical’ value includes all incident types and represents the overall safety of the ditch model. The higher is the value the safer is the ditch.

Safety of roadside area 157 EXECUTIVE SUMMARY
Table 198. Example. Weighted levels of risks presented as numeric series. Ap-proach speeds 80, 100, 120 km/h, all angles, stiff soil material.
Ditch profile (stiff soil)
Weighted level of the risk of the crash
(low-moderate-high-critical)
Ditc
h/sl
ope
pro
file
fore
slop
e (g
radi
ent
)
dept
h of
the
ditc
h (
m)
botto
m w
idth
(m
)
back
slop
e (g
radi
ent)
heig
ht o
f bac
kslo
pe (
m) into
back-slope
due to rollover
into rigid obstacle at dis-
tance of 5 m
from the edge of the road
due to com-ing
back onto the
busy road
Sum Sub-trac-tion: Low
minus Criti-cal
(L-C=)
Low-M-H-C
Low-M-H-C
Low-M-H-C
Low-M-H-C
Low-M-H-C
A 1:3 1.0 0.0 1:2 4.0 11-13-5-
1 14-6-9-1 0-0-0-30
0-27-3-0
25-46-17-32
-7
B 1:2 1.0 0.0 1:4 / 1:1.5
1+3 =4.0
11-9-9-1 25-4-1-0 0-1-2-27 0-26-4-
0 36-40-16-28
8
C2 1:3 0.3 0.2 1:2 4.0 26-3-1-0 30-0-0-0 0-4-14-
12 1-24-5-
0 57-31-20-12
45
C4 1:3 0.3 0.2 1:1.5 4.0 20-6-4-0 20-6-4-0 5-13-10-
2 3-19-8-
0 48-44-26-2
46
Us 1:4 1.0 1.0 1:2 4.0 21-4-5-0 26-4-0-0 0-0-0-30 4-17-6-
3 51-25-11-33
18
The level of risk for rollover is lowest for ditch C2 (table 198). The level of risk for crashing into the backslope is lowest for ditch C2. The level of risk for crash into the rigid obstacle is lowest for ditch C4
up to distance of 7 meters from the road The level of risk for coming back onto the busy road is rather equal
for the ditch models - slightly lower for ditches A, B and C2.
The following table is the summary table of tables 198-201. The last column from e.g. table 198 is copied to the table 207 as a column ‘at distance of 5 m’. The levels of risks for all the incidents are included in the Ranking of safety -values. The value varies only due to the distance of the rigid obsta-cle.
Table 207. Ranking of weighted levels of risks. The higher the value the safer the ditch. Approach speeds 80, 100, 120 km/h, all angles, stiff soil mate-rial on slopes.
Ditch profile (stiff soil)
Ranking of safety
(‘Low minus critical’ level of risk -value)
Ditc
h pr
ofile
fore
slop
e (g
radi
ent)
dept
h of
the
ditc
h (m
)
botto
m w
idth
(m
)
back
slop
e (g
radi
ent)
heig
ht o
f ba
cksl
ope
(m)
rigid obsta-cles at dis-tance of 5 m from the edge of the road
rigid obsta-cles at dis-tance of 7 m from the edge of the
road
rigid obsta-cles at dis-tance of 9 m from the edge of the
road
rigid obsta-cles at dis-tance of 11 m from the edge of the
road
A 1:3 1.0 0,0 1:2 4.0 -7 20 26 49
B 1:2 1.0 0.0 1:4 / 1:1.5
4.0 8 30 41 49
C2 1:3 0.3 0.2 1:2 4.0 45 52 57 -
C4 1:3 0.3 0.2 1:1.5 4.0 46 54 - -
Us 1:4 1.0 1.0 1:2 4.0 18 23 28 49

158 Safety of roadside area EXECUTIVE SUMMARY
C2 and C4 ditches are considered as the safest if the distance of the ob-stacle is not over 9 meters from the road. The further is the rigid obstacle from the road the relatively less safer are ditches C2 and C4.
Final conclusions
Ditch models C2 and C4 are clearly the safest ones.
On soft soil the results change slightly - in lateral direction from the road the vehicles do not travel as far as on stiff soil due to lower climb heights on backslope.
On steep backslopes there is higher risk for rollover.
The major uncertainty in the results is that driver’s manoeuvres are not included in the simulations because those kinds of simulations were not able to be done.
Earlier performed few full-scale tests indicate that at 10 degrees ap-proach angle the steering keeps vehicle in the ditch or causes roll-over. At 5 degrees angle the vehicle will probably remain in the ditch or return back onto the road.
steep backslope (C4) turns a vehicle more likely towards the road
8.4 Analysis of the embankment profiles
In general it is assumed that a ditch below the slope causes rollover. Two kinds of simulations were performed:
Model E slope, height 4 m, no ditch below the slope
Model F slope, height 4 m, 0.5 m deep ditch with 1:6 backslope
The 1:6 ditch did not cause significant risk for rollover for passenger car. Ac-cording to other simulated test the 1:6 ditch did not overturn the 20 ton bus.
8.5 Analysis of the ditch profiles in front of vertical wall
Four modifications of model C ditch were tested with a vertical wall (e.g. even rock or concrete wall) on the top of the backslope. The conclusions of the corresponding profiles without the wall apply to these tests with following exceptions:
the wall of the 1.3 high slope overturns the vehicle
the vehicles tend to hit the wall and return back onto the road
In Finland there are number of rock cuttings with slopes rather similar to C1. Severe crashes into the rock walls are not common.
8.6 Analysis of the ditch terminations
The ditch terminations at minor road junctions with culverts are hazardous crash objects for errant vehicles. Three kinds of solutions were tested:
1:10 slope made of four wooden columns (full-scale tests)
1:6 slope made of soil material (simulated test D2)
1:4 slope made of soil material (simulated test D1)
Three kind of incidents were analysed: crash into the slope, second crash into the ground beyond the slope and rollover after the second crash.
Wooden 1:10 slope causes high risk for second crash and rollover
1:6 slope does not cause significant risk for crashes or rollover.
1:4 slope causes significant risk for second crash and rollover.
Safety of roadside area 159 REFERENCES
9 REFERENCES
1317-2, EN. “Road restraint systems. Part 2: Performance classes, impact test acceptance criteria and test methods for safety barriers.” Confirmed 1998-08-17.
AASHTO. Roadside Design Guide. American Association of State Highway and Transportation Officials, 2002.
Digges, K, R Morgan, and H. Gabler. Opportunities for Reducing Casualties in Far-side Crashes. SAE. 2005.
Ehrola, E. Running off the road. A study of car encroachment accidents and road conditions in Finland 1971-75. Series C, Technica No. 19, Oulu: University of Oulu, 1981.
Eigen, A. M. Rollover Crash Mechanisms and Injury Outcomes. NHTSA Technical Report HS 809 894, Washington, DC: NHTSA’s National Center for Statistics and Analysis, 2005.
Evans, L. ”Safety belt effectiveness: The Influence of crash severity and selective recruitment.” Accident Analysis and Prevention 28, nro 4 (1996).
FinnRA. ”Crash tests to side ditches, years 2000 and 2001. FinnRA S12 Strategic Programme for Improvement Solutions for Main Roads.” Finnish Road Administration Reports 8/2003, Helsinki, 2003.
Gabauer, D. J., and H. C. Gabler. “Comparison of delta-V and occupant impact velocity crash severity metrics using event data recorders.” Annual proceedings. Association for the Advancement of Automotive Medicine, 2006.
Gabauer, D., and H. C. Gabler. Evaluation of the Acceleration Severity Index Threshold Values Utilizing Event Data Recorder Technology. Vol. Volume 1904 / 2005, in Transportation Research Record: Journal of the Transportation Research Board, 37-45. Transportation Research Board of the National Academies, 2005.
Hildebrand, E, P Lougheed, and T Hanson. “Relating roadside collisions to the highway clear zone width.” University of New Brunswick, Transportation Group, 2007.
Hoschopf, H. Database analysis. Road Side Infrastucture fo Safer European Roads (RISER). Internal report 31.01.2005, Graz: Graz University of Technology, 2005.
Kelkka, M. Performance of guardrails and the requirements for guardrail development. Report TKK-A53 (in Finnish), Espoo: Laboratory of Highway Engineering. Helsinki University of Technology, 2002.
Kelkka, M. ”Database of single accidents on main roads reported by police.” Uusimaa, Turku, Häme, Kaakkois-Suomi and Savo-Karjala road districts, years 1994-96. Unpublished, 1998.
Kelkka, M., and K. Laakso. Some results from real-world accidents for the modelling of running off to the ditch. Helsinki University of Technology, Laboratory of Highway Engineering, 9 May 2008.
160 Safety of roadside area REFERENCES
Kelkka, M., and K. Suhonen. Motorway accidents in Finland. The safety potential of the shoulder rumble strips. FinnRA Reports 24/2005, Helsinki: Finnish Road Administrarion, 2005.
Kelkka, M., E. Räty, S. Olkkonen, M-T. Juurinen, T. Kari, and K. Laakso. Crash violence within the traffic system. Risks and their reduction in road traffic on two-lane main roads in Finland. LINTU Reports 3/2006 (in Finnish), Helsinki: Ministry of Transport and Communications, 2006.
Kullgren, A. Crash recorders – opening up the box. eSafety that matters. ETSC Best in Europe Conference 2006, Autoworld, Parc Cinquantenaire, Brussels. 21-22. February 2006.
Lie, A., C. Tingvall, M. Krafft, and A. Kullgren. “The effectiveness of Electronic Stability Control (ESC) in Reducing Real Life Crashes and Injuries.” Traffic Injury Prevention Volume 7, no. 1 (March 2006): 38-43.
Moore, T., V. Vijayakumar, D. Steffey, K. Ramachandran, and C. Corrigan. “Biomechanical Factors and Injury Risk in High Severity Rollovers.” 49th Annual Proceedings. Association for the Advancement of Automotive Medicine, September 12-14, 2005. 133-150.
Nordhoff, L. Motor Vehicle Collision Injuries: Biomechanics, Diagnosis, and Management. Jones & Bartlett Publishers, 2005.
Norwegian Public Roads Administration. Vehicle impacts in ditches. Model F, main report. TR 2007-0008-Rev C, Force Technology, May 2007c.
Norwegian Public Roads Administration. Vehicle impacts in ditches. Model E, main report. TR 2006-0010-Rev B, Force Technology, January 2007e.
Norwegian Public Roads Administration. Vehicle impacts in ditches. Model B, main report. TR 2006-0007-Rev C, Force Technology, May 2007b.
Norwegian Public Roads Administration. Vehicle impacts in ditches. Model D, main report. TR-2007-0009-Rev B, Force Technolohy, January 2007d.
Norwegian Public Roads Administration. Vehicle impacts in dtches. Model C, main report. TR 2007-0008-Rev E, Force Technology, June 2008.
Norwegian Public Roads Administration. Vehicle impacts in ditches. Model A, main report. TR 2006-0112-Rev C, Force Technology, May 2007a.
Rechnitzer, and Lane. Rollover Crash Study. Vehicle Design and Occupant Injuries. Report No. 65, Melbourne: Monash University, Accident Research Centre, 1995.
Ricci, L. L. NCSS Statistics: passenger cars. DOT-HS-805-531, Highway Safety Research Institute, University of Michigan, 1980.
RISER. Critical vehicle and infrastructure interactions. Deliverable 03, Roadside Infrastructure fo Safer European Roads (RISER), funded by European Community under the Competitive and Sustainable Growth Programme (1998-2002), Chalmers University of Technology, 2005.
RISER. European Best Practise for European Road Design: Guidelines for Roadside Infrastructure on New and Existing Roads. Deliverable 06, Roadside Infrastructure fo Safer European Roads (RISER), funded by European Community under the Competitive and Sustainable Growth Programme (1998-2002), Chalmers University of Technology, 2006.

Safety of roadside area 161 REFERENCES
Sakshaug, K., T. Enge, L. Lervåg, T. Linland, and I. Ytrehus. The Influence of Roadside Area Characteristics on Accident Risk and Injury Cost. Report STF50 A07011, Trondheim: SINTEF, January 2007.
Shojaati, M. ”Correlation between injury risk and impact severity index ASI.” The Third Swiss Transport Research Conference 19th-21st March 2003. Ascona, 2003.
Stigson, H., A. Ydenius, and A. Kullgren. “Variation of crash severity and injury risk depending on collisions with different vehicle types and objects.” 2006 international IRCOBI conference on the biomechanics of impact, Madrid, Spain, 20-22 September. 2006.
Swedish National Road Administration. Consideration of safety of busses in design of slopes and safety barriers. Publication 2007:8 (in Swedish), Swedish National Road Administration, 2007.
Swedish Road Administration. Analysis of fatal single accidents on state road network, excluding motorways, years 1997-2000. Swedish Road Administration Publication 2002:109 (in Swedish), Borlänge: SRNA, 2002.
Swedish Road Administration. Design of slopes and safety barriers related to safety of busses. Swedish Road Administration Publication 2007:86 (in Swedish), SNRA, 2007.
Swedish Road Administration. Documentation of crashed roadside objects during years 1993-2007. Swedish Road Administration Publication 2007:86 (in Swedish), Borlänge: SNRA, 2007b.
Tuononen, A., P. Sainio, and L. Hartikainen. Driving control and accident risks of vehicles on basis of fatal road accidents in Finland. Report Nr. 13/2007, Helsinki: Finnish Vehicle Administration AKE, 2007.
Vänell, Jan. Terminals and ditches. Impact tests performed 1999-2000. VTI report 14-2006 (in Swedish), Linköping: Swedish National Road and Transport Research Institute, 2006.


Safety of roadside area Appendix 1
APPENDIX 1: TEST MATRIX

Appendix 2 Safety of roadside area
APPENDIX 2: FIELD STUDY OF ENCROACHMENT ANGLES AND TRAJECTORIES

Safety of roadside area Appendix 2

Appendix 2 Safety of roadside area

Safety of roadside area Appendix 2


ISSN 1459-1553
ISBN isbn-nro
TIEH tieh-nro


