Page 1
1
NMR Analysis of Metabolic Responses to Extreme Growing Conditions of the 1
Temperature-Dependent Coral Pathogen Vibrio coralliilyticus 2
Arezue F. B. Boroujerdi†, Stephen S. Jones
†, and Daniel W. Bearden
†* 3
†Analytical Chemistry Division, National Institute of Standards and Technology, Hollings 4
Marine Laboratory, Charleston, South Carolina 29412 5
*Corresponding author, [email protected] . 6
To be submitted as a Letter to: ACS Chemical Biology. 7
ABSTRACT Recent metabolomics research on the temperature-dependent coral pathogen 8
Vibrio coralliilyticus has led to the discovery of several compounds produced by the organism as 9
a response to high-density, low nutrient growing conditions. Three compounds identified in the 10
stressed metabolome are maltose, ethanolamine, and the first report of the production of the 11
bioplastic-type compound (BTC) 2-buteonic acid, 2-carboxy-1-methylethyl ester by V. 12
coralliilyticus. The presence of maltose and ethanolamine indicate a state of acute nutrient 13
limitation; therefore, we hypothesize that the cell’s metabolism turned to its own cell wall, or 14
perhaps neighboring cells, for sources of carbon and nitrogen. The presence of the BTC also 15
supports the acute nutrient limitation idea due to the parallels with polyhydroxyalkanoate (PHA) 16
production in other Gram-negative bacteria including other Vibrio species. PHAs are industrially 17
manufactured via fermentation of bacteria in which certain nutrients are limited once cell density 18
has reached a substantial level. The result is a bioplastic polymeric material or PHA formed as a 19
defense mechanism of the bacterial cell to store nutrients in the form of granular polyesters. 20
Although nuclear magnetic resonance (NMR) and mass spectroscopy (MS) data indicate that the 21
BTC produced by V. coralliilyticus is a single unit (as opposed to the polymeric PHA), its 22
structure is common with the repeated ester monomer of PHAs. The three metabolites along with 23
the NMR 1H metabolic fingerprints of the nutrient-limited samples are proposed to serve as 24
metabolic markers for extremely stressful growing conditions of V. coralliilytiucs. 25
26
The temperature dependent coral pathogen Vibrio coralliilyticus has been shown to cause coral 27
bleaching (specifically in Pocillopora damicornis) at temperatures above 24.5 !C and coral lysis 28
above 27 !C (1-6). A hypothesized relationship between virulence of V. coralliilyticus and 29
elevated sea water temperatures (3, 6) fueled an NMR-based metabolomics investigation of the 30
Page 2
2
organism in its virulent and non-virulent states. Recently reported metabolic profiles of the 31
organism (in the form of 1D 1H NMR spectra) consistently showed metabolic differences 32
between the two states via principal components analysis (PCA); however, an unexpected 33
separation in the PCA data indicated biological variability between parallel bacterial cultures (7). 34
Several compounds consistently emerged as the cause of the separations, in both inter- and intra-35
batch comparisons. These were betaine, glutamate, and succinate; metabolites responsible for 36
cellular osmoregulation and involved in various metabolic pathways such as the citric acid cycle 37
and amino acid production or metabolism (7, 8). These compounds, along with many others, are 38
characteristic of normal, healthy V. coralliilyticus growth and produce a distinctive 1D 1H NMR 39
metabolic profile for the organism. Here, we report on the discovery of several new compounds 40
produced by the organism as a response to high-density, low nutrient growing conditions. Three 41
compounds identified in the stressed metabolome are maltose, ethanolamine, and the first report 42
of the production of the bioplastic-type compound (BTC) 2-buteonic acid, 2-carboxy-1-43
methylethyl ester (CAS: 20638-00-0) (9-14) by V. coralliilyticus. The 1D 1H NMR metabolic 44
profile for the organism as a result of poor growth conditions was dominated by large signals 45
from these newly identified compounds. 46
The differences between typical V. coralliilyticus endometabolome spectra (or metabolic 47
profiles) and those from acutely stressed samples (Figure 1) indicate two different metabolic 48
profiles for the organism. Four samples from a batch growth referred to as “batch 5” were 49
stressed during lyophlization of the quenched and salt-washed cell pellets. The stress involved a 50
complete thawing of the frozen cell pellet prior to or during lyophlization. During this time the 51
cells resumed metabolism that was previously quenched with liquid nitrogen; however, their 52
environment was dramatically different than during cell culture in glycerol artificial sea water 53
Page 3
3
(GASW) media. The cells were in an extremely nutrient-limited environment as the cell pellet 54
thawed, and as a consequence, the cells’ metabolism was stressed before the lyophilization was 55
completed. The stressed lyophilized cell pellets were a shiny, gel-like dry material while 56
unstressed lyophilized cell material is flakey and powdery. The 1H NMR spectra collected for the 57
four stressed samples showed the presence of new peaks in very high concentrations compared to 58
the usual peaks in the metabolic fingerprint of unstressed V. coralliilyticus. The metabolic 59
profiles of the 12 samples in batch 5 (Figure 1a) in the form of one dimensional proton NMR 60
spectra which were collected on a 700 MHz Bruker instrument exhibit visually obvious spectral 61
variations in samples B05_2009_27_03, _04, _05, and _06, with these spectra exhibiting 62
excessively large peaks not present in the spectra of the un-stressed samples. 63
Identification and chemical shift assignments for the new peaks in the spectra of the 64
stressed samples verified the presence of three distinct metabolites: 2-butenoic acid, 2-carboxy-65
1-methylethyl ester (the BTC), maltose, and ethanolamine (Figure 1b). Structural determination 66
of the BTC was achieved via several NMR experiments and validated with empirical 67
calculations of chemical shifts using ChemBioDraw software (version 12.0 CambridgeSoft, Inc.) 68
which resulted in a structure with a chemical formula of C8H12O4 (Figure 2). The 69
stereochemistry in the predicted name of the BTC, (E)-3-(but-2-enoyloxy)butanoic acid, given 70
by ChemBioDraw was the result of the hydrogens on carbons 6 and 7 being in the trans position 71
across the double bond. The predicted chemical shifts for the trans (E) stereochemistry are in 72
better agreement with the experimental chemical shifts than those of the cis (Z) conformation. 73
Confirmative assignment information for the metabolites was obtained from 1H,
13C, HSQC and 74
HMBC spectra (Figure 3 and Table 1; integrations are given in Supplementary Figure 1). The 75
integrated peaks conform to the stated molecular formula. The 1H-
13C HSQC spectrum (Figure 76
Page 4
4
3a) provides 1H and
13C assignments and the
1H-
13C HMBC spectrum (Figure 3b) shows 77
connectivities between H’s and C’s in each spin system. LC-UV-MS analysis of the aqueous 78
extract confirmed the mass (The dominant peak at 195 m/z can be attributed to the adduct of (E)-79
3-(but-2-enoyloxy)butanoic acid with sodium (23 + 172).) and identification of the BTC (see 80
Supplemental Information). 81
The three metabolites identified in the microbial stress V. coralliilyticus sample all point 82
to the cells coping with a very stressful event: acute nutrient limitation. Maltose, a disaccharide, 83
is formed from two glucose units by an !(1"4) linkage and results from the breakdown of starch 84
for a food source (15). The presence of maltose in the stressed V. coralliilyticus sample indicates 85
that when the quenched and frozen cells thawed and resumed their metabolism in their now 86
extremely nutrient-limited environment, they began using their own starch stores as a carbon 87
source. Phosphatidylethanolamine (PE) is the major phospholipid in Gram-negative bacteria 88
membranes (16). Ethanolamine, which makes up the head group of the PE phospholipid, can be 89
used by bacteria as a carbon, nitrogen, and energy source (17). However, the presence of 90
ethanolamine in the stressed V. coralliilyticus sample could suggest a breakdown of one or more 91
utilization pathways such as glycerophospholipid metabolism or phosphonate and phosphinate 92
metabolism (8). Ethanolamine is produced in these pathways as an end product in phosphonate 93
and phosphinate metabolism and for subsequent use in glycolysis or pyruvate metabolism in 94
glycerophospholipid metabolism. Perhaps the limited resources available to V. coralliilyticus 95
cells when they thawed caused the cells to produce a buildup of ethanolamine via phosphonate 96
and phosphinate metabolism; or a breakdown of the activity of the enzymes in 97
glycerophospholipid metabolism responsible for converting ethanolamine into acetaldehyde used 98
in glycolysis or pyruvate metabolism (8).. Finally, the largest peaks in the spectrum of the 99
Page 5
5
stressed V. coralliilyticus correspond to a bioplastic-type compound (BTC). Very few literature 100
references for this compound were found (9, 10), and one identifies the compound as 2-butenoic 101
acid, 2-carboxy-1-methylethyl ester (racemic CAS: 172471-84-0) (14). The compound is 102
referred to as an isomer of a crotonic acid dimer by one report (trans (E) stereochemistry CAS: 103
20638-00-0) (9). Other similar structures have been reported, for example, as the result of 104
thermal degradation of PHBs (polyhydroxybutyrate) (18), in relation to cyclic dimers (19), and 105
as bacterial biomarkers (14, 20). The BTC is similar in structure to a polyhydroxyalkanoate 106
(PHA). PHAs are produced by bacterial fermentation usually due to very stressful events in 107
which normal nutrient or environmental conditions are altered (21). Upon an occurrence of 108
limited nutrients, the bacteria produce light-refracting granular polyesters as storage devices for 109
carbon and energy to be used for survival (22). The shiny, gel-like lyophilized cell material for 110
the stressed V. coralliilyticus samples and the presence of the BTC in the NMR data indicates a 111
similar condition. The assigned structure (Figure 2) with the chemical formula of C8H12O4 is 112
composed of two units of the base structure for a PHA, making it a medium-chain length (C5-113
C14) PHA (22). 114
Subsequent efforts to grow V. coralliilyticus for investigations of biological metabolic 115
variability are ongoing and have thus far resulted in evidence of the presence of the newly 116
identified stress metabolites in batches that did not grow properly. These batches did not grow 117
properly for as yet undetermined reasons; however, the possibility of nutrient limitation is a 118
present and common theme, which leads to the hypothesis that these compounds could be used 119
as biomarkers for stress in V. coralliilyticus cultures. 120
In conclusion, the observation of a bioplastic-type compound produced by Vibrio 121
coralliilyticus has shown that this organism produces three distinct metabolites in response to 122
Page 6
6
extreme nutrient limitation for a prolonged period of time. All three metabolites are present 123
consistently in stressed V. coralliilyticus bacterial cultures and, therefore, provide an indication 124
of stressful growing conditions. The stressful conditions produced in this study are similar to the 125
fermentation of bacteria and production of PHAs, which has a large industrial base and is the 126
foundation for several companies (21). The type of PHA produced is strain (and species) specific 127
(22) and, to the best of our knowledge, this is the first report of the BTC 2-butenoic acid, 2-128
carboxy-1-methylethyl ester (or maltose or ethanolamine, for that matter) produced by V. 129
coralliilyticus. 130
131
METHODS 132
The procedure described in the Sample Preparation section was performed multiple times and 133
each iteration is referred to as a batch. The details for two batches denoted as B05_2009 and 134
B09_2009 (grown as a control material) are discussed below. The four B05_2009 samples 135
discussed were grown at 27 °C, as was the control material batch B09_2009. The numbering 136
scheme for a batch is Bbb_yyyy_TT_ss with bb being a particular growth batch, yyyy denoting 137
the year of growth, TT denoting the growing temperature and ss representing a specific sample in 138
that batch. 139
140
Sample Preparation 141
Cell Growth. V. coralliilyticus growths were started from a (thawed) -80 °C freezer stock and 142
inoculated onto two Glycerol Artificial Seawater (GASW) agar plates. One plate was grown at 143
24 °C and the other at 27 °C for 24 h in the dark. Further cell growth was accomplished using 144
GASW growth media. For each growth temperature, six individual colonies from each plate 145
Page 7
7
were transferred into six individual 250 ml flasks with 50 ml GASW and grown in shakers (at 146
200 rpm) at their respective temperatures for 24 h in the dark. At this point cell pellets were 147
harvested and collected as six individual samples for each temperature. B05_2009 and B09_2009 148
were grown as described here; however, B09_2009 was grown at 27 °C only with all samples 149
combined and homogenized into one large pellet and used for quality control and microbial 150
stress testing purposes. 151
152
Quality Control of Growth. To ensure contamination-free growth of the V. coralliilyticus 153
cultures, GASW plates (referred to as purity plates) were streaked with 20 µl of the final growth 154
(prior to quenching) and left in the incubator (27 °C) for at least 24 h. Healthy colonies are small, 155
round, and somewhat transparent. Some cell cultures for subsequent cell growth trials exhibited 156
very little or no growth indicating that the particular sample’s growth was hindered. 157
158
Cell Quenching and Collection. The cell cultures’ metabolism was quenched and cell pellets 159
collected as described previously (7). Ten milliliters of spent media for each cell culture was 160
reserved after quenching and stored at -40 !C. The final cell pellets were flash frozen in liquid 161
nitrogen and stored at -80 °C for 3 h. Finally, the cells were lyophilized overnight and stored at 162
-80 °C until extraction. Four B05_2009 samples (B05_2009_27_03, B05_2009_27_04, 163
B05_2009_27_05, and B05_2009_27_06) were thawed to room temperature prior to complete 164
lyophilization. The twelve B09_2009 cell cultures (all at 27 °C) were combined after quenching 165
and prior to centrifugation in order to achieve a homogeneous batch growth which we use as a 166
control material (CM). 167
168
Page 8
8
Endometabolite Extraction. Polar endo-metabolites were extracted from the lyophilized V. 169
coralliilyticus cells as described previously (7) for all batches with one exception. The 170
temperature of the solvent extraction for the 2010 samples and B09_2009 (control material) was 171
changed to 50 °C after additional methods development showed this temperature gave more 172
consistent results. 173
NMR Data Acquisition 174
One- and two-dimensional high-resolution 1H NMR spectra were acquired on a Bruker 175
700 MHz spectrometer equipped with a TCI cryoprobe as described previously (7). Experiments 176
used for metabolite identification purposes include the one-dimensional (1D) 1H (noesypr1dpr 177
Bruker pulse sequence) and 13
C (zgpg30 Bruker pulse sequence); and the two-dimensional (2D) 178
13C-HSQC (hsqcedetgpsisp2.2 Bruker pulse sequence),
13C-HMBC (hmbcgpl2ndqf Bruker pulse 179
sequence), and 13
C-HSQC-TOCSY (hsqcdiedetgpsisp.1 Bruker pulse sequence). 180
181
LC-UV-MS Data Acquisition 182
Samples of the extract (20 µL injections) were eluted through an Agilent Zorbax Eclipse 183
XDB-C18 4.6 x 150 mm, 5 µm column at 35°C. Chromatographic mobile phase flow was 0.5 184
ml/min with a linear gradient profile from 30% acetonitrile/ 70% water to 70% acetonitrile/30% 185
water over 10 minutes. Data were collected from time 1 to 10 minutes. Mass spectral detection 186
(MSD) was performed with a Bruker Esquire 6000 ion trap mass spectrometer with an 187
electrospray ionization source. Masses were calibrated by the manufacturer's method as defined 188
in the Hystar software using a test mixture of substituted phosphazines in acetonitrile infused 189
directly into the ESI source. 190
191
Page 9
9
Metabolite Identification 192
Ethanolamine and maltose were identified in the microbial stress samples using 193
comparisons between processed one-dimensional (1D) 1H NMR spectral libraries of standard 194
spectra: one developed in-house, SBASE-1-1-2 from AMIX (version 3.8.3, Bruker Biospin 195
GmbH), Chenomx 700 MHz standard library (Chenomx NMR Suite v 6.1 (Chenomx, Inc.)), and 196
online databases (such as the MMC Database (23) and HMDB (24)). The third metabolite 197
produced in the microbial stress incident samples was the BTC identified to be 2-butenoic acid, 198
2-carboxy-1-methylethyl ester (trans (E) stereochemistry CAS: 20638-00-0) after its structure 199
was determined using 13
C, 13
C-HSQC, 13
C-HMBC, and 13
C-HSQC-TOCSY spectra. These 200
spectra provided carbon chemical shifts and H-C correlations that allowed for structure 201
determination. ChemBioDraw software (version 12.0 CambridgeSoft, Inc.) provided 202
confirmation of the extrapolated structure. 203
204
Acknowledgments: We acknowledge the support of the Hollings Marine Laboratory NMR 205
Facility. V. coralliilyticus samples were grown by our microbiologist partners Maria I. Vizcaino 206
and Pamela J. Morris at the Hollings Marine Laboratory. Commercial equipment or materials are 207
identified in this paper to specify adequately the experimental procedure. Such identification 208
does not imply recommendation or endorsement by NIST, nor does it imply that the materials or 209
equipment identified are necessarily the best available for the purpose. 210
211
Supporting Information Available: This material is available free of charge via the Internet. 212
213
REFERENCES 214
Page 10
10
1. Ben-Haim, Y., Rosenberg, E. (2002) A novel Vibrio sp. pathogen of the coral Pocillopora 215
damicornis, Mar. Biol. 141, 47-55. 216
217
2. Ben-Haim, Y., Thompson, F. L., Thompson, C. C., Cnockaert, M. C., Hoste, B., Swings, J., 218
Rosenberg, E. (2003) Vibrio coralliilyticus sp. nov., a temperature-dependent pathogen of the 219
coral Pocillopora damicornis, Int. J. Syst. Evol. Microbiol. 53, 309-15. 220
221
3. Ben-Haim, Y., Zicherman-Keren, M., Rosenberg, E. (2003) Temperature-regulated bleaching 222
and lysis of the coral Pocillopora damicornis by the novel pathogen Vibrio coralliilyticus, Appl. 223
Environ. Microbiol. 69, 4236-4242. 224
225
4. Sussman, M., Mieog, J. C., Doyle, J., Victor, S., Willis, B. L., Bourne, D. G. (2009) Vibrio 226
zinc-metalloprotease causes photoinactivation of coral endosymbionts and coral tissue lesions, 227
PLoS ONE 4, e4511. 228
229
5. Sussman, M., Willis, B. L., Victor, S., Bourne, D. G. (2008) Coral pathogens identified for 230
White Syndrome (WS) epizootics in the Indo-Pacific, PLoS ONE 3, e2393. 231
232
6. Rosenberg, E., Koren, O., Reshef, L., Efrony, R., Zilber-Rosenberg, I. (2007) The role of 233
microorganisms in coral health, disease and evolution, Nat. Rev. Microbiol. 5, 355-62. 234
235
7. Boroujerdi, A. F. B., Vizcaino, M. I., Meyers, A., Pollock, E. C., Huynh, S. L., Schock, T. B., 236
Morris, P. J., Bearden, D. W. (2009) NMR-Based Microbial Metabolomics and the Temperature-237
Dependent Coral Pathogen Vibrio coralliilytiucs, Environ. Sci. Technol. 43, 7658-7664. 238
239
8. Kanehisa, M., Goto, S. (2000) KEGG: kyoto encyclopedia of genes and genomes, Nucleic 240
Acids Res. 28, 27-30. 241
242
9. Hocking, M. B. (1969) Structure of crotonic acid dimers and higher polymers with partial 243
stereochemistry of the dimers, Can. J. Chem. 47, 821-830. 244
245
10. Skau, E. L., Saxton, B. (1930) The effect of heat upon crotonic acid, J. Am. Chem. Soc. 52, 246
335-341. 247
248
11. Thackrah. Dissertation. 1891. 249
250
12. Wislicenus, J. A. (1893) Chem. Zentr. I, 413. 251
252
13. Wislicenus, J. A. (1897) Chem. Zentr. II, 259. 253
254
14. Smith, P. R. GENERATION OF BIOMARKERS FROM ANTHRAX SPORES BY 255
CATALYSIS AND ANALYTICAL PYROLYSIS. Brigham Young University, 2005. 256
257
15. Voet, D., Voet, J. G., Pratt, C. W., Fundamentals of Biochemistry. John Wiley & Sons, Inc.: 258
New York, 1999. 259
Page 11
11
16. Murzyn, K., Rog, T., Pasenkiewicz-Gierula, M. (2005) Phosphatidylethanolamine-260
Phosphatidylglycerol Bilayer as a Model of the Inner Bacterial Membrane, Biophys. J. 88, 1091-261
1103. 262
263
17. Tsoy, O., Ravcheev, D., Mushegian, A. (2009) Comparative Genomics of Ethanolamine 264
Utilization, J. Bacteriol. 191, 7157-7164. 265
266
18. Grassie, N., Murray, E. J. (1984) The Thermal Degradation of Poly(-(D)-B-Hydroxybutyric 267
Acid): Part 3 - The Reactaion Mechanism, Polymer Degradation and Stability 6, 127-134. 268
269
19. Seebach, D., Hoffmann, T., Kuhnle, F. N. M., Kinkel, J. N., Schulte, M. (1995) 117. 270
Preparation, Structure, and Properties of All Possible Cyclic Dimers (Diolides) of 3-271
Hydroxybutanoic Acid, Helvetica Chemica Acta 78, 1525-1540. 272
273
20. Snyder, A. P., Dworzanski, J. P., Tripathi, A., Maswadeh, W. M., Wick, C. H. (2004) 274
Correlation of Mass Spectrometry Identified Bacterial Biomarkers from a Fielded Pyrolysis-Gas 275
Chromatography-Ion Mobility Spectrometry Biodetector with the Microbiological Gram Stain 276
Classification Scheme, Anal. Chem. 76, 6492-6499. 277
278
21. Chen, G. (2009) A microbial polyhydroxyalkanoates (PHA) based bio- and materials 279
industry, Chem. Soc. Rev. 38, 2434-2446. 280
281
22. Luengo, J. M., Garcia, B., Sandoval, A., Naharro, G., Olivera, E. R. (2003) Bioplastics from 282
microorganisms, Curr. Opin. Microbiol. 6, 251-260. 283
284
23. Cui, Q., Lewis, I. A., Hegeman, A. D., Anderson, M. E., Li, J., Schulte, C. F., Westler, W. 285
M., Eghbalnia, H. R., Sussman, M. R., Markley, J. L. (2008) Metabolite identification via the 286
Madison Metabolomics Consortium Database, Nat. Biotechnol. 26, 162-4. 287
288
24. Wishart, D. S., Tzur, D., Knox, C., Eisner, R., Guo, A. C., Young, N., Cheng, D., Jewell, K., 289
Arndt, D., Sawhney, S., Fung, C., Nikolai, L., Lewis, M., Coutouly, M. A., Forsythe, I., Tang, P., 290
Shrivastava, S., Jeroncic, K., Stothard, P., Amegbey, G., Block, D., Hau, D. D., Wagner, J., 291
Miniaci, J., Clements, M., Gebremedhin, M., Guo, N., Zhang, Y., Duggan, G. E., Macinnis, G. 292
D., Weljie, A. M., Dowlatabadi, R., Bamforth, F., Clive, D., Greiner, R., Li, L., Marrie, T., 293
Sykes, B. D., Vogel, H. J., Querengesser, L. (2007) HMDB: the Human Metabolome Database, 294
Nucleic Acids Res. 35, D521-6. 295
296
297
298
299
Page 12
12
Figure 1. a) 1H metabolic profiles of B05_2009. b)
1H spectral comparison of a normal and a 299
stressed sample (B05_2009_24_01, red and B05_2009_27_06, blue). Stressed sample includes 300
maltose, ethanolamine, and the BTC. 301
302
303
304 305
306 307
Page 13
13
Figure 2. BTC structure and predicted 1H and
13C NMR spectra. See also Table 1. 307
308
309 310
311
312
313
314
315
Page 14
14
Figure 3. a) 1H-
13C HSQC of a stressed V. coralliilyticus sample (blue: CH3 and CH; green: CH2) 315
showing chemical shift assignments for (E)-3-(but-2-enoyloxy)butanoic acid, maltose, and 316
ethanolamine. b) 1H-
13C HMBC spectrum a stressed V. coralliilyticus sample showing 317
connectivities (via blue lines) and two spin systems for (E)-3-(but-2-enoyloxy)butanoic acid. 318
Numbering system is from the predicted structure shown in Figure 2 (and further described in 319
Table 1), which includes predicted chemical shifts that correspond to the actual chemical shifts 320
in the spectrum. External projections for a) and b): (top) 1H spectrum of a stressed V. 321
coralliilyticus sample and (left) 13
C spectrum of an stressed V. coralliilyticus sample. 322
323
324
325
Page 15
15
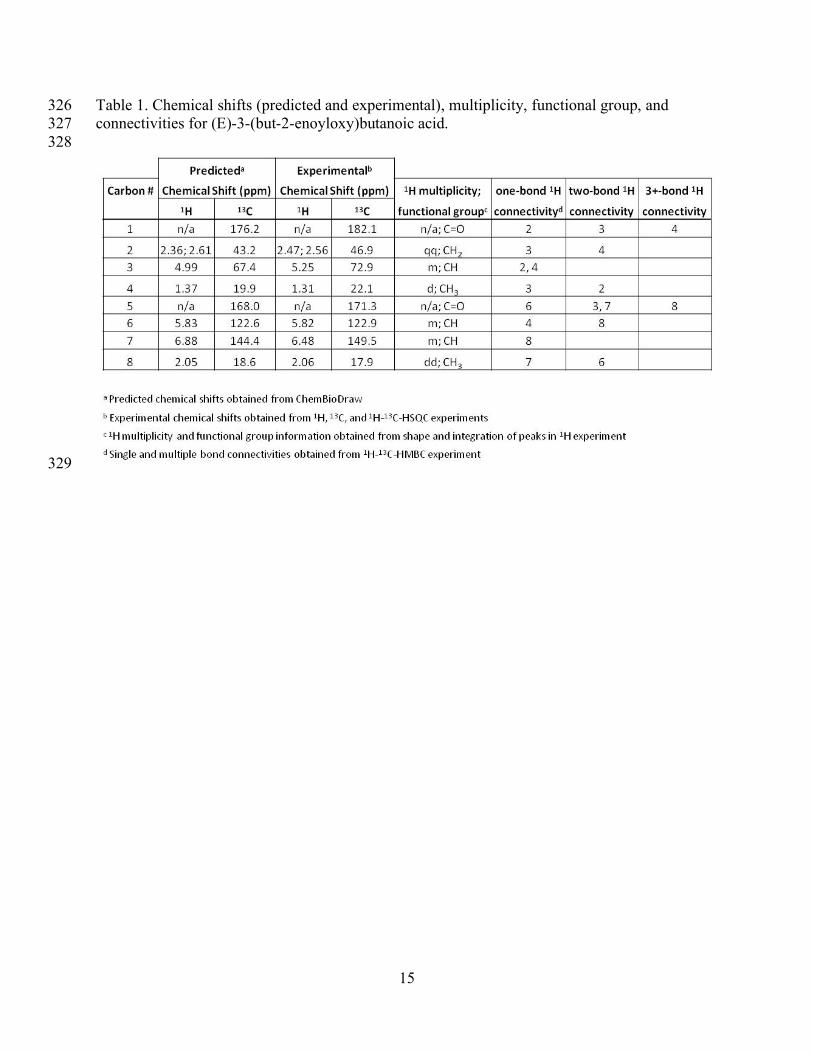
Table 1. Chemical shifts (predicted and experimental), multiplicity, functional group, and 326
connectivities for (E)-3-(but-2-enoyloxy)butanoic acid. 327
328
329
Page 16
Supplemental Information !"""#
!""!#
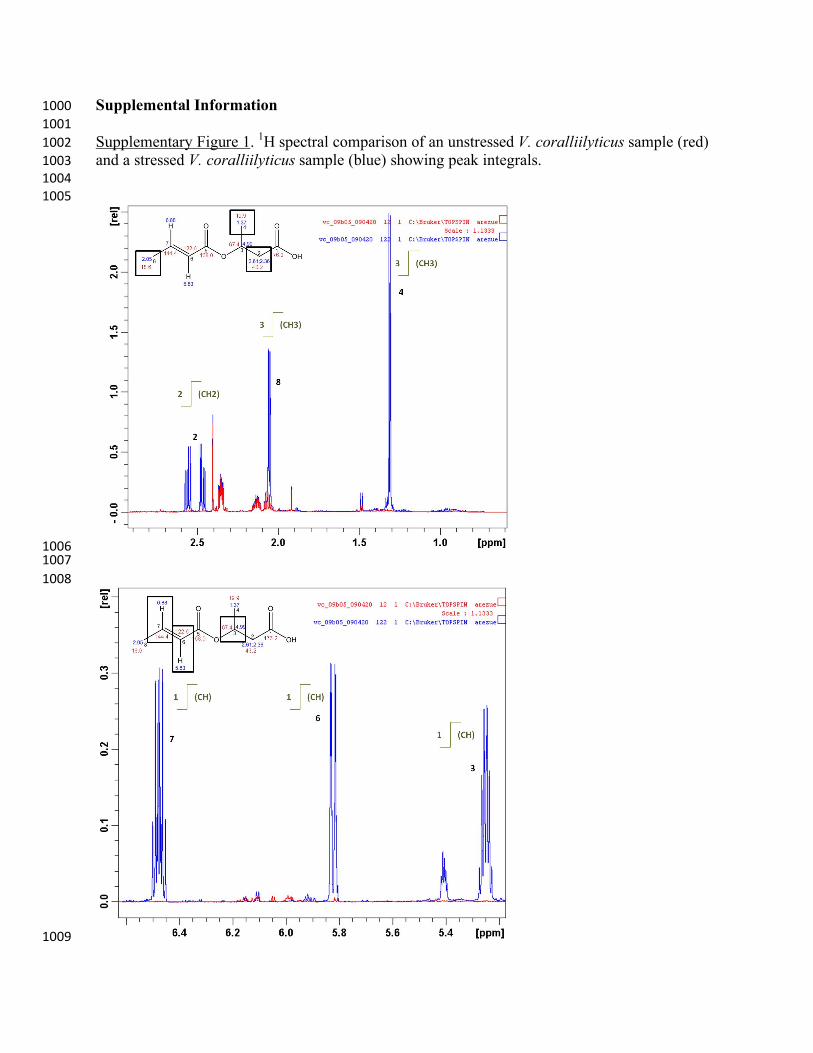
Supplementary Figure 1. 1H spectral comparison of an unstressed V. coralliilyticus sample (red) !""$#
and a stressed V. coralliilyticus sample (blue) showing peak integrals. !""%#
####!""&#
#!""'#
### #!""(##!"")#
!""*#
!""+#
Page 17
LC-UV-MS analysis of the aqueous extract. !"!"#
In repeated liquid chromatography runs of the aqueous extract solution, elution yielded !"!!#
one peak at 3.5 minutes as seen in the UV chromatogram (!max = 200 nm). Observing in the MS !"!$#
positive ionization mode, two chromatographic peaks were observed. A small peak at 3.1 !"!%#
minutes shows a base peak at 262.9 m/z and a peak at half the intensity at 142.9 m/z. The vastly !"!&#
larger chromatographic peak as seen in the MSD has a base peak of 195.0 m/z. Replicate runs !"!'#
scanning to 600 m/z and to 3000 m/z yielded identical results. The mass of 195 m/z can be !"!(#
attributed to the adduct of (E)-3-(but-2-enoyloxy)butanoic acid with sodium (23 + 172). !"!)#
Observing in the MS positive mode with automatic MS2, the base mass of 195.3 (±0.1) m/z was !"!*#
isolated from the primary chromatographic peak. Fragmenting at 1 volt, all runs yielded a mass !"!+#
of 109.3 (±0.1) m/z. Three of four runs also yielded a mass of 236.0 (±0.1) m/z. The fragment !"$"#
mass of 109 m/z can be attributed to a mass fragment corresponding to half of the dimeric !"$!#
compound coordinating with sodium (23 + 172/2). In negative ionization mode MS runs, no !"$$#
reproducible peaks were found. !"$%#
!"$&#
#!"$'#