22
nnf)0 ') Vu\ ,{,,,, J

nnf)0 ') Vu\ ,{,,,, J

Minnesota Department of Natural Resources Investigational Report 478, 1999
ATTITUDES OF MINNESOTA .... '-LJ~_, .... .A.J.LJJ.
ABOUT FISHERIES ISSUES1
Peter C. Jacobson Tracy L. Close
Charles S. Anderson Timothy J. Kelly
Minnesota Department of Natural Resources Section of Fisheries 500 Lafayette Road St. Paul, MN 55155
Abstract.-- Data from a 1998 survey of Minnesota residents about opinions and attitudes was analyzed with two objectives: 1) to measure changes in angler preferences and opinions that occurred between a 1987 survey and the 1998 survey; and 2) to develop a detailed analysis of attitudes on fisheries issues from the 1998 survey. The analysis explored the influence that characteristics such as area of residence (DNR Region), age, gender, income, education, lakeshore ownership and angling participation have on Minnesota residents' attitudes towards habitat protection, fishing to~umaments, Minnesota DNR performance, and other fisheries management issues, in addition to a comparison of the questions common to the 1987 and 1998 surveys.
Introduction
Information on the opinions and attitudes of constituents is required for effective and responsible fisheries management. Fisheries managers must understand the desires, preferences, and opinions of the public in order to effectively implement management programs. Although phone conversations, personal visits, letters, and public input meetings will always be important methods ·of obtaining public input, these sources are not always representative of the views of constituents. A system that relies on these informal methods of contact may not adequately assess current preferences and attitudes. Miranda and Frese ( 1991) found that fisheries scientists correctly
predicted angler preferences and values only 54 % of the time. Formal, quantitative surveys of constituents are required to accurately measure public opinions and attitudes.
The first Minnesota D NR statewide survey of anglers was administered in 1972 (Scidmore and Wroblewski 1973). The survey was limited to questions about general fishing activities such as fishing in the winter, for trout, and by wives, and a few questions about species preferences and opinions. A second Minnesota DNR statewide survey of anglers was administered in 1987 (Leitch and Baltezore 1987), and analyzed further by Cunningham and Anderson (1992). The 1987 survey was more extensive than the 1972 survey, and provided a baseline for information on species
1This project was funded in part by the Federal Aid in Sport Fish Restoragion (Dingell-Johnson) Program. Completion Report, Study 620, D-J Project F-26-R Minnesota.
1
This document is made available electronically by the Minnesota Legislative Reference Library as part of an ongoing digital archiving project. http://www.leg.state.mn.us/lrl/lrl.asp (Funding for document digitization was provided, in part, by a grant from the Minnesota Historical & Cultural Heritage Program.)

preferences, agency performance, information sources and other fisheries management issues. A third survey, administered in 1998 (Anthony 1998), asked many of the same questions as the 1987 survey in order to measure changes in preferences and opinions. Also, the 1998 survey expanded the scope of the survey to include all residents of Minnesota (not just anglers). The 1998 survey asked questions on current issues such as fishing tournaments, habitat protection, regulations, and other fisheries management techniques.
The present analysis had two objectives: 1) to measure changes in angler preferences and opinions that occurred between the 1987 and 1998 surveys; and 2) to develop a detailed analysis of attitudes on fisheries issues from the 1998 survey. Cunningham and Anderson ( 1992) analyzed differences in preferences and opinions of fisheries managers, anglers that belonged to an organized fishing club, nonresidents, and resident anglers. The present analysis explored the influence that characteristics such as area of residence (DNR Region), age, gender, income, education, lakeshore ownership, and angling participation have on their attitudes towards habitat protection, fishing tournaments, Minnesota DNR performance, and other fisheries management issues (in addition to a comparison of the questions common to the 1987 and 1998 surveys). The analysis used a multivariate approach to explore the effects of these characteristics on fisheries issues attitudes. Although information from responses to individual questions is valuable to fisheries administrators (and available in Anthony 1998), general attitudes about issues · are often better measured with a multivariate approach that integrates the responses of several related questions into an attitude score (McKennel 1977). The grouping of questions reduces the relative impact of poorly worded or biased questions. The calculated score is dependent on several related questions that allows for further quantitative analysis of factors that affect attitudes. The analysis of attitude scores based on several grouped questions also has the potential to identify relationships that may not
2
be evident in the responses to individual questions (Mc Kennel 1977).
Methods
The details of the survey procedures and methods are reported in Anthony ( 1998). In summary, a mail questionnaire was developed with questions on fisheries issues identified and prioritized by Minnesota D NR Area Fisheries Supervisors. The survey was administered by the Minnesota Center for Survey Research at the University of Minnesota in Minneapolis. Questionnaires were sent to 3, 500 randomly selected households (stratified by DNR Region - 500 each to Regions 1 through 5 and 1,000 to Region 6); Figure 1. A cover letter requested that the survey be completed by a person within the household who was 16 · years or older and had the most recent birthday. A first mailing went out 11 June 1998, a second mailing consisting of a reminder postcard went out on 18 June 1998, and a third mailing with cover letter and another copy of the survey was sent on 2 July 1998. The overall response rate after adjustment for nondeliverable addresses, deceased or underage respondents, and nonresidents was 51 % . The survey data was weighted by DNR Region based on the sample stratification and the 1995 Census (as detailed in Anthony 1998). The survey data was further weighted for a biased response (anglers and males were more likely to respond to the survey than expected from their proportions in the population older than 16 in Minnesota in the 1995 census). The bias corrected data was only used for the 1987I1998 comparison. Uncorrected data was used in the attitude analysis because angling participation and gender were variables to be anaiyzed.
Attitude Analysis
Many of the questions were designed to explore the attitudes of Minnesota residents about habitat protection, fisheries management, Minnesota DNR Section of Fisheries performance, and fishing tournament issues (Table 1). All of these questions measured attitudes

Figure 1. Minnesota DNR Region boundaries.
on a 5 point Likert scale. Only questions asked of all survey respondents (anglers and nonanglers) were considered for the attitude portion of the analysis. Questions were first grouped into these four defined a priori categories. Principle Components Analysis (PCA) was then used within each category to help define related groups of questions that could produce quantitative attitude scores that could be further analyzed. The number of related groups of questions (components) was generally determined by the loading matrix of a Varimax Rotation with eigenvalues that were less· than one. Interpretability of the components estimated by _PCA was also considered, and some of the sets of related questions were adjusted manually (while maintaining high component loading scores).
Attitude scores consisted of the mean of individual question Likert scale scores for each group (with the direction of the Like rt score for a question based on the sign of the component loadings in the rotated matrix).
3
Mean Likert scores were used instead of summed Likert scores because of missing data (not all respondents answered every question in a group of questions). PCA scores could have also been used, which would have produced identical results because the potential range of scores (5 point Likert scales) were identical for every question. Mean Likert scores were a more interpretable attitude measurement than PCA scores.
Mean Likert scores were generally distributed normally without transformation. The influence of respondent characteristics affecting attitude scores such as angling participation (bought a fishing license in 1997 or not), age, gender, education, income, region (DNR Region of residence), and lakeshore ownership were measured using a General Linear Model (SYSTAT 8.0, SPSS Inc.) with cx=0.05. Age, education and income were treated as continuous variables, and angling participation, lakeshore ownership, gender and region were treated as categorical variables.

Table 1. Text of questions as they appeared in the survey and the assigned question summary phrase. Range of answer types (5 point Likert scales) appear in italics after the introductory text (bold) for each set of questions.
Question Text
Do you agree or disagree with these statements about fisheries management issues in Minnesota? (strongly agree - strongly disagree)
Aquatic plants are weeds and have no value to the lake. Regulations on the alteration of lake bottoms and banks to protect shoreline habitat should be more restrictive. Aquatic plants are so important to lakes that they should be completely left alone. Chemical removal of the fish in a lake to replace them with other kinds of fish that people prefer to catch is acceptable to me as long as it's done so that people are safe. Permanent concrete or steel structures (such as fish traps and fish ladders built in streams to make fishing better) should be used even if they don't look natural. Lakeshore owners should have the right to alter the shoreline any way they want. Only exotic plant species, such as Eurasian Water Milfoil, should be removed from lakes. The Minnesota Department of Natural Resources should use a management practice beneficial to fish, even if the public does not believe it would be beneficial. Aquatic plants are important to the lake, and should be managed like other natural resources. Too many fish are being kept which is making fish smaller.
Heavy fishing pressure is reducing the numbers of fish in lakes and streams.
Underwater video cameras should not be allowed when fishing. Underwater video cameras should only be allowed when there is no fishing equipment in the boat. GPS Units (Global Positioning Systems) should not be allowed when fishing.
Below are statements about the Minnesota Department of Natural Resources (DNR) Section of Fisheries. Do you agree or disagree with these statements? The Minnesota DNR Section of Fisheries: (strongly agree - strongly disagree)
answers questions honestly. has staff that are well trained to do their jobs. listens to anglers' concerns. responds to anglers' concerns. manages fisheries for special interests. adequately manages Minnesota's fishing waters. listens to the concerns of people that don't fish. responds to the concerns of people that don't fish. spends public money effectively. needs more funding to do a better job. needs more funding from general tax revenue (not fishing licenses) to do a better job should allow greater angler participation in making fish management decisions. should continue stocking walleye in lakes even where stocking has not increase walleye numbers. should manage lakes to have many fish, though the average size would be smaller. should manage lakes to have big fish, though the number of fish harvested would be less. should manage your favorite lake to have big fish, though the number of fish harvested would be less. should manage lakes individually, though the regulations may become more complicated.
4
Question Summary
value of aquatic plants restrictive habitat regulations
protection of aquatic plants chemical removal of fish
permanent concrete and steel structures lakeshore alterations aquatic plant removal
unpopular fisheries management practices
importance of aquatic plants
smaller fish from excessive exploitation fewer fish from excessive exploitation underwater video camera #1 underwater video camera #2
GPS units
honesty well trained listens to anglers' concerns responds to anglers' concerns manages for special interests adequate fisheries management listens to nonanglers responds to nonanglers effective fiscal management
. more funding General Fund contribution
greater angler participation ineffective walleye stocking
management for numbers of fish management for size of fish
not in my back yard
individual waters management

Table 1. Continued
Question Text Listed below are fisheries-related activities that the Minnesota Department of Natural Resources performs. How important is each of these activities to you? (very important - very unimportant)
Educating people on how they can help protect lakes and streams.
Developing effective regulations to improve fishing.
Developing understandable fishing regulations.
Improving lake and stream habitat. Stocking fish into lakes and streams. Providing information to people so that they can decide where to fish.
Restoring fish such as sturgeon to lakes and streams where they once lived.
Purchasing land or easements to provide more places to fish.
Protecting the land surrounding lakes and streams. Providing a good value for a fishing license.
Educating people on ethical conduct and sportsmanship. Educating people on the biology and conservation of fish.
Now, for the same list of fisheries-related activities, please rate the performance of the Minnesota DNR. (very good - very poor)
Educating people on how they can help protect lakes and streams.
Developing effective regulations to improve fishing.
Developing understandable fishing regulations.
Improving lake and stream habitat. Stocking fish into lakes and streams. Providing information to people so that they can decide where to fish.
Restoring fish such as sturgeon to lakes and streams where they once lived.
Purchasing land or easements to provide more places to fish.
Protecting the land surrounding lakes and streams.
Providing a good value for a fishing license.
Educating people on ethical conduct and sportsmanship. Educating people on the biology and conservation of fish.
We are interested in your opinion about competitive fishing tournaments in Minnesota. The Minnesota DNR: (strongly agree - strongly disagree)
Should not allow so many fishing tournaments. Should allow fewer anglers in each tournament. Should allow fewer days in each tournament. Should not allow off-site weigh-ins (where fish are transported to another location for weighing). Should only allow catch and release tournaments. Should only allow catch, measure for length, and immediate release tournaments.
5
Question Summary
watershed protection education -importance effective fishing regulations -importance understandable fishing regulations -importance habitat improvement - importance stocking - importance information on where to fish -importance nongame fisheries restoration -importance land easement purchasing -importance watershed protection - importance value of a fishing license -importance ethics education - importance ecological education - importance
watershed protection education -performance effective fishing regulations -performance understandable fishing regulations -performance habitat improvement - performance stocking - performance information on where to fish -performance nongame fisheries restoration -performance land easement purchasing -performance watershed protection -performance value of a fishing license -performance ethics education - performance ecological education - performance
number of tournaments number of anglers in tournaments number of days in tournaments off-site weigh-ins
catch and release tournaments catch, measure and immediate release tournaments

1987 /1998 Comparison
Only data from anglers (respondents who purchased a fishing license in 1997) in the 1998 survey were used to compare with the 1987 survey of resident anglers. Questions from the 1987 survey used a 7 point Likert scale. The 1998 survey used a 5 point Likert scale in an effort to simplify the answers. Although this change makes comparisons less accurate, future trends based on the simpler 5 point scales will be superior. Also, the poor wording in the 1987 survey of the neutral Likert category "Does not Matter" (which is not neutral) was changed to "Neither Agree or Disagree. " For comparisons in this portion of the study, the Likert scales were compressed to a 2 point scale by combining all of the agree responses (Slightly Agree, Agree, and Strongly Agree) into one Agree category and combining all of the disagree responses (Slightly Disagree, Disagree, and Strongly Disagree) into one Disagree category. The neutral categories were not used. This categorization system is equivalent to the statement "Of the respondents who had an opinion .... " Full comparisons of all the categories (including the neutral category) in the future should be done with the newly established 5 point Likert scale. Statistical significance of changes from the 1987 to the 1998 survey were calculated with chisquare tests of 2x2 contingency tables of frequencies of weighted responses.
Results
Attitude Analysis
Fisheries Management Issues.
The 22 questions associated with fisheries management issues were separated into 7 groups using PCA (Table 2). These 7 components explained a total of 59. 3 % of the total variance in the fisheries management issues questions.
The first component consisted of questions regarding the attitudes of Minnesota residents towards the "Fishing Ethics and
6
Education" (Table 2). The questions concerning fishing regulations were considered to be associated with fishing ethics. The question "value of a fishing license - importance" did not fit into this category and was eliminated. Two variables were significant in the General Linear Model - angler and gender (Table 3). Anglers placed higher importance on the Minnesota D NR' s efforts to promote fishing ethics and educating the public (the least squares mean for anglers was higher than nonanglers -Table 4). Females placed higher importance on the Minnesota D NR' s fishing ethics promotion and education efforts than did males. The coefficients for the continuous variables for the General Linear Model are presented in Table 5 (none of the continuous variables were significant).
The second component of the fisheries management issues concerned the use of technologies such as video cameras and GPS (Global Positioning Satellites) while fishing (Table 2). The wording of the questions resulted in higher mean Likert scores that were associated with opposition to the use of technology. Older residents were more likely to be opposed to the use of technology than young residents (Table 3). Nonanglers were also more likely to feel that this technology was unfair to fish than anglers (Table 4). There were statistically significant regional differences, with Regions 2, 3 and 6 being most opposed. The regional differences were not consistent in any Metro/Non-Metro manner.
Questions relating to management for large fish comprised the third component of fisheries management issues. Education was a significant variable associated with this component (Table 3). More education was associated with less desire for large fish management (Table 5). Income was also significant with more income associated with more desire for large fish management - which is interesting because income and education are commonly highly correlated. Regional differences were also significant with the Metro Region having the strongest support for large fish management, and the northern regions (1 and 2) having the least support.

Table 2. Principle components and the V ARIMAX rotated loading matrix of survey questions on fisheries management issues. Variables with the highest loadings are in bold.
Ethics & Large Fishing Question Education Technology Fish Stocking Pressure Artificiality Confidence
understanding fishing regulations - importance 0.731 -0.005 -0.048 -0.112 0.083 0.038 0.057 effective fishing regulations - importance 0.718 0.062 0.012 0.004 0.168 0.146 0.081 ethics education -importance 0.648 0.070 -0.020 -0.125 0.107 -0.130 0.242 value of a fishing license - importance 0.645 0.001 0.054 0.052 -0.040 0.218 -0.190 ecological education - importance 0.635 0.025 -0.077 -0.139 0.117 -0.170 0.312 information on where to fish - importance 0.581 -0.027 0.118 0.283 -0.176 -0.150 -0.053 underwater video camera # 1 0.036 0.820 -0.024 -0.083 0.079 -0.034 0.094 underwater video camera #2 0.045 0.809 0.043 -0.011 0.014 0.113 0.091 GPS units 0.003 0.679 0.014 0.054 0.026 -0.281 -0.061 management for size of fish 0.029 0.010 0.905 -0.046 0.090 0.056 0.055 not in my back yard 0.027 0.025 0.903 -0.002 0.113 0.071 0.058 ineffective walleye stocking -0.002 -0.068 0.124 0.749 0.015 0.116 0.052 management for numbers of fish -0.036 0.032 -0.223 0.718 0.047 -0.050 0.031 smaller fish from excessive exploitation 0.039 0.004 0.164 0.052 0.830 -0.012 0.047 fewer fish from excessive exploitation 0.082 0.108 0.037 0.017 0.818 0.007 0.140 permanent concrete and steel structures 0.051 -0.126 0.019 0.030 -0.029 0.780 0.073 chemical removal of fish 0.060 -0.007 0.092 0.056 0.026 0.769 -0.025 individual waters management 0.062 -0.009 0.084 -0.005 0.061 0.143 0.730 unpopular fisheries management practices 0.103 0.112 0.007 0.039 0.129 -0.031 0.628 nongame fisheries restoration - importance 0.399 0.021 0.075 0.247 -0.129 -0.219 0.403 land easement purchasing - importance 0.488 O.ot8 0.073 0.173 -0.131 0.236 0.139 stocking - importance 0.485 -0.017 0.065 0.444 0.079 0.323 -0.055
Percent of total variance explained 15.0 8.4 8.2 6.9 7.0 7.7 6.3
Table 3. P-values ofa General Linear Model ofresident characteristics and mean Likert scores for principle components of fisheries management issues questions. Bold values are significant (P<0.05).
Ethics and Large Fishing
Variable Education Technology Fish Stocking Pressure Artificiality Confidence
Angler 0.001 0.002 0.956 0.008 0.823 0.000 0.110
Lakeshore Owner 0.760 0.963 0.861 0.289 0.419 0.901 0.226
Region 0.771 0.029 0.029 0.002 0.094 0.635 0.049
Gender 0.005 0.142 0.320 0.779 0.358 0.000 0.825
Age 0.454 0.000 0.790 0.087 0.905 0.000 0.439
Education 0.222 0.238 0.000 0.003 0.784 0.583 0.004
Income 0.390 0.461 0.050 0.142 0.892 0.004 0.102
7

Table 4. Adjusted least square means of principle component mean Likert scores for categorical variables of a General Linear Model of resident characteristics for fisheries management issues questions.
Ethics and Large Fishing
Variable Education Technology Fish Stocking Pressure Artificiality Confidence
Angler= Yes 4.093 2.780 2.822 3.319 3.232 2.971 3.439
Angler= No 3.989 2.608 2.819 3.220 3.221 2.572 3.376
Lakeshore Owner = Yes 4.036 2.693 2.816 3.292 3.204 2.768 3.381
Lakeshore Owner= No 4.047 2.696 2.825 3.248 3.250 2.775 3.434
Region= I 4.043 2.637 2.709 3.389 3.301 2.816 3.360
Region= 2 4.044 2.877 2.734 3.324 3.178 2.823 3.382
Region= 3 4.024 2.71 l 2.887 3.200 3.343 2.788 3.377
Region= 4 4.005 2.686 2.800 3.251 3.129 2.721 3.383
Region= 5 4.086 2.553 2.892 3.280 3.177 2.780 3.424
Region= 6 4.044 2.701 2.901 3.175 3.232 2.701 3.517
Gender = Male 3.989 2.742 2.848 3.276 3.254 3.038 3.402
Gender= Female 4.093 2.646 2.793 3.264 3.200 2.505 3.412
Table 5. Coefficients for the continuous variables of a General Linear Model ofresident characteristics and mean Likert scores for principle components of fisheries management issues questions.
Ethics and Large
Variable Education Technology Fish Age 0.001 -0.011 0.000
Education 0.021 0.036 -0.094
Income -0.005 0.008 O.oI8
The fourth component of fisheries management issues consisted of questions related to stocking (although the question "management for numbers of fish" asked about size/number management tradeoffs). The wording of the stocking questions resulted in mean Likert scores that were higher when respondents advocated fish stocking (and favored many/small fish management). Anglers, Non-Metro, and less educated residents were more likely to support fish stocking (Tables 3, 4, and 5).
The impact of fishing pressure on fish populations was the subject of questions comprising the fifth component. Attitudes concerning this issue were similar across all groups as little of the variation in mean Likert scores were explained by the respondent's characteristics (Table 3).
8
Fishing
Stocking Pressure Artificiality Confidence 0.002 0.000 0.015 -0.001
-0.061 0.008 -0.017 0.063
-0.011 0.001 0.032 -0.012
The sixth component consisted of attitudes rt?lated to the artificiality of fisheries management techniques such as chemical rehabilitation and concrete/steel structures in streams. Anglers were significantly more accepting of artificial techniques than were nonanglers (Table 3). Males, older residents, and residents with more income were also more accepting of artificial fisheries management techniques.
The last fisheries management component consisted of questions related to public's trust in progressive fisheries management activities of the Minnesota DNR such as sturgeon rehabilitation, experimental regulations, and confidence in the department to implement unpopular but effective management. People with more education and from the Metro Region were more likely to support progressive

fisheries management activities than other people (Tables 3, 4, and 5).
Habitat Issues
The nine questions associated with aquatic habitat issues were separated into three components using PCA (Table 6). No cohesive relationships either within or between groups of questions were evident. Also, no relationship was apparent with a PCA that forced the questions into two components. Therefore, the analysis was conducted with all 9 of the questions as one large habitat component. The direction of the Likert scores were assigned to result in a calculated mean Likert score that was higher for an attitude that favored habitat protection (the range of scores for "value of aquatic plants" and "lakeshore alterations" were the opposite direction from the other questions).
Higher values of the combined habitat attitude scores can be interpreted as respondents who value fisheries habitat and its protection higher than other respondents. The only variable that significantly related to the habitat attitude score was region (Table 7). Metro Region residents tended to value fisheries habitats and their protection higher than others (Table 8). Although not significant, anglers and people with more education tended to place higher values on fisheries habitats (Tables 8 and 9).
Minnesota DNR Section of Fisheries Peiformance
The 24 questions associated with the performance of the Minnesota D NR Section of Fisheries were separated into 6 groups using PCA (Table 10). These six components explained 61 % of the total variance in the Section performance questions.
The first group of questions concerned the performance of management activities (e.g. stocking, regulation setting, information and education) that the Section is involved with (Table 10). Females were generally more satisfied with this aspect of the· Section's performance than males (Tables 11 and 12). Metro residents were also more satisfied while Region 3 residents were the least satisfied.
The second component consisted of questions that measured the proficiency of the Section's fisheries management efforts such as having well trained staff, listening and responding to angler concerns, adequately managing the state's waters, and spending public money
- effectively. Older people and residents of the Metro Region were the most satisfied with the proficiency of the Section (Tables 12 and 13). Residents of the northern Regions (Regions 1 and 2) were the least satisfied.
Questions related to the performance of the Section in addressing nonangler concerns comprised the third component. Nonanglers were less satisfied than anglers in the Section's performance in addressing their concerns
Table 6. Principle components and the V ARIMAX rotated loading matrix of survey questions on habitat issues. Variables with the highest k>adings are in bold.
Question 2 3 watershed protection education - importance 0.818 0.013 0.060 habitat improvement - importance 0.792 0.006 0.153 watershed protection - importance .0.722 0.148 0.240 protection of aquatic plants 0.029 0.801 -0.006 aquatic plant removal -0.034 0.682 -0.071 restrictive habitat regulations 0.316 0.565 0.276 value of aquatic plants -0.014 0.195 -0.764 lakeshore alterations -0.151 -0.136 -0.671 importance of aquatic plants 0.290 0.094 0.571
Percent of total variances explained 22.5 16.8 16.9
9

Table 7. P-values of a General Linear Model of resident characteristics and mean Likert scores for combined habitat attitudes questions. Bold values are significant (P<0.05).
Habitat Variable Score
Angler 0.076
Lakeshore Owner 0.109
Region 0.007
Gender 0.388
Age 0.388
Education 0.072
Income 0.166
Table 8. Adjusted least square means of principle component mean Like1t scores for categorical variables of a General Linear Model of resident characteristics for combined habitat questions.
Habitat
Variable Score
Angler= Yes 3.813
Angler= No 3.765
Lakeshore Owner= Yes 3.764
Lakeshore Owner= No 3.813
Region= 1 3.804
Region= 2 3.717
Region= 3 3.774
Region= 4 3.776
Region= 5 3.789
Region= 6 3.871
Gender= Male 3.775
Gender= Female 3.802
Table 9. Coefficients for the continuous variables of a General Linear Model ofresident characteristics and mean Likert scores for combined habitat questions.
Variable
Age
Education
Income
Habitat
Score
-0.001
~0.007
0.027
10
(Tables 12 and 13). None of the other characteristics were significant.
The need for more funding was the main theme of the fourth component. Anglers and younger residents tended to support more funding for Section programs than nonanglers and older residents (Tables 11, 12, and 13). Metro residents also were likely to support more funding than Non-Metro residents.
The fifth component assessed the performance of the Section in regards to constituent input into decision making. This component loaded negatively, therefore younger, less educated, residents with lower incomes and nonanglers were less likely to be satisfied with the Section's efforts in gathering input from a diverse group of constituents for decision making (Tables 12 and 13).
No obvious relationship between the three questions of the sixth component could be defined, so the component was not analyzed.
Tournament Issues
The six questions associated with the fishing tournaments were separated into two components using PCA (Table 14). The two components explained 77 % of the total variance in the fishing tournament questions.
The first component consisted of questions that were related to the magnitude of fishing tournaments and their impact on nontournament anglers (Table 14). The only significant variable influencing the component attitude score was age - older residents were more likely to agree with limiting the magnitude of fishing tournaments (fewer and smaller tournaments - Tables 15, 16 and 17). Interestingly, lakeshore owners were not significantly more interested in tournament magnitude reductions than were non-lakeshore owners.
The second component· consisted of questions related to the procedures allowed during tournaments such as off-site weigh-ins and fish release requirements such as total release or catch, measure, and immediate release events. Anglers were more interested in limiting off-site weigh-ins and requiring

Table 10. Principle components and the VARIMAX rotated loading matrix of survey questions on Minnesota DNR Section of Fisheries performance. Variables with the highest loadings are in bold.
Management Management Nonangler Angler Not Question Activity Proficiency Response Funding Input Used
ecological education - performance 0.788 0.059 0.057 -0.049 -0.039 0.148 ethics education - performance 0.773 0.130 0.038 -0.030 -0.031 0.126 watershed protection education - performance 0.695 0.225 0.071 0.011 0.016 0.078 understandable fishing regulations - performance 0.593 0.170 0.002 0.252 0.102 0.114 effective fishing regulations - performance 0.580 0.340 0.028 0.129 0.199 0.182 habitat improvement - performance 0.556 0.328 0.027 -0.081 0.087 0.286 information on where to fish - performance 0.503 -0.042 0.128 0.193 0.111 0.448 respond to angers' concerns 0.108 0.816 0.070 0.044 0.101 0.093 listens to anglers' concerns 0.112 0.803 0.103 0.045 0.048 0.071 well trained 0.135 0.729 0.028 0.145 -0.104 0.035 honesty 0.174 0.703 0.045 0.144 -0.009 -0.065 adequate fisheries management 0.200 0.679 0.034 0.054 0.011 0.186 effective fiscal management 0.187 0.598 0.038 0.288 0.241 0.034 responds to nonanglers 0.056 0.104 0.927 0.075 -0.069 0.030 listens to nonanglers 0.093 0.111 0.924 0.070 -0.045 0.019 general fund contribution 0.007 0.164 0.093 0.854 -0.073 -0.006 more funding 0.052 0.283 0.057 0.850 0.024 0.047 greater angler participation 0.083 -0.090 0.088 0.109 -0.745 -0.291 manages for special interests -0.174 -0.051 0.043 -0.058 -0.652 0.320 land easement purchasing - performance 0.238 0.086 -0.061 -0.024 -0.119 0.693 nongame fisheries restoration - performance 0.361 0.007 0.146 0.074 0.020 0.662 stocking - perforn1ance 0.273 0.339 -0.033 -0.031 0.263 0.513 watershed protection - performance 0.493 0.213 0.000 -0.142 -0.253 0.328 value of a fishing license - performance 0.398 0.342 -0.074 0.169 0.083 0.316
Percent of total variance explained 15.9 16.2 7.6 7.7 5.4 8.4
Table 11. P-values of a General Linear Model of resident characteristics and mean Likert scores for principle components of Minnesota DNR performance questions. Bold values are significant (P <0.05).
Management Management Nonangler Angler
Variable Activities Proficiency Responsiveness Funding Impact
Angler 0.299 0.709 0.000 0.000 0.000
Lakeshore Owner 0.583 0.837 0.267 0.921 0.957
Region 0.000 0.001 0.689 0.046 0.116
Gender 0.014 0.406 0.858 0.577 0.167
Age 0.773 0.014 0.312 0.000 0.000
Education 0.162 0.957 0.790 0.113 0.000
Income 0.496 0.420 0.747 0.194 0.022
11

Table 12. Adjusted least square means of principle component mean Likert scores for categorical variables of a General Linear Model of res.ident characteristics for Minnesota DNR performance questions.
Management Management Nonangler Angler
Variable Activities Proficiency Responsiveness Funding Impact
Angler= Yes 3.740 3.305 3.308 3.170 3.404
Angler= No 3.771 3.291 3.136 2.932 3.262
Lakeshore Owner = Yes 3.766 3.294 3.198 3.048 3.334
Lakeshore Owner= No 3.750 3.302 3.247 3.054 3.332
Region= l 3.785 3.228 3.195 3.003 3.360
Region= 2 3.682 3.203 3.290 2.981 3.386
Region= 3 3.675 3.246 3.200 2.928 3.316
Region= 4 3.780 3.341 3.195 3.082 3.267
Region= 5 3.784 3.373 3.224 3.152 3.394
Region= 6 3.840 3.399 3.229 3.160 3.276
Gender = Male 3.720 3.280 3.218 3.069 3.363
Gender= Female 3.795 3.316 3.226 3.033 3.303
Table 13. Coefficients for the continuous variables of a General Linear Model of resident characteristics and mean Likert scores for principle components of Minnesota DNR performance questions.
Management Management Non angler Angler
Variable Activities Proficiency Responsiveness Funding Impact
Age 0.000 0.003 0.001 -0.006 -0.005
Education -0.020 0.001 0.006 0.049 -0.085
Income -0.003 -0.006 0.002 -0.014 -0.017
Table 14. Principle components and the VARI MAX rotated loading matrix of survey questions on .tournament issues. Variables with the highest loadings are in bold.
Question
number of anglers in tournaments number of tournaments number of days in tournaments catch and release tournaments catch, measure and immediate release tournaments off-site weigh-ins
Percent of total variance explained
Magnitude
0.904 0.896 0.878 0.107 0.231 0.239
41.9
12
Procedures
0.206 0.178 0.258 0.909 0.842 0.638
34.7

Table 15. P-values of a General Linear Model ofresident characteristics and mean Likert scores for principle components of fishing tournament questions. Bold values are significant. (P<0.05).
Variable Magnitude Procedures
Angler 0.359 0.000
Lakeshore Owner 0.586 0.940
Region 0.289 0.308
Gender 0.141 0.350
Age 0.000 0.084
Education 0.873 0.304
Income 0.630 0.162
Table 16. Adjusted least square means of principle component mean Likert scores for categorical variables of a General Linear Model of resident characteristics for fishing tournament questions.
Variable Magnitude Procedures Angler= Yes 3.273 3.873
Angler=No 3.224 3.630
Lakeshore Owner = Yes 3.265 3.749
Lakeshore Owner= No 3.232 3.754
Region= l 3.174 3.746
Region= 2 3.201 3.743
Region= 3 3.358 3.863
Region= 4 3.207 3.674
Region= 5 3.307 3.708
Region= 6 3.245 3.774
Gender= Male 3.202 3.779
Gender= Female 3.295 3.724
Table 17. Coefficients for the continuous variables of a General Linear Model of resident 'characteristics and mean Likert scores for principle components of fishing tournament questions.
Age
Education
Income
Variable Magnitude
0.008
-0.005
0.005
release-oriented tournaments than were nonanglers (Tables 16 and 17). None of the other variable were significant.
1987 /1998 Comparison
Species Preferences
Minnesota resident anglers in the· 1998 survey expressed less interest in traditional
13
Procedures
0.003
-0.029
0.014
species such as walleye and northern pike, and shifted the number of the days they fished to more nontraditional (yet desirable as food) species such as yellow perch and sauger (Tab]e 18). Walleye were still the most sought after species of fish by anglers, however, the percentage of total days spent fishing for walleye declined significantly from 25 % in the 1987 survey to 20 % in the 1998 survey. The percentage of total days fished for northern pike
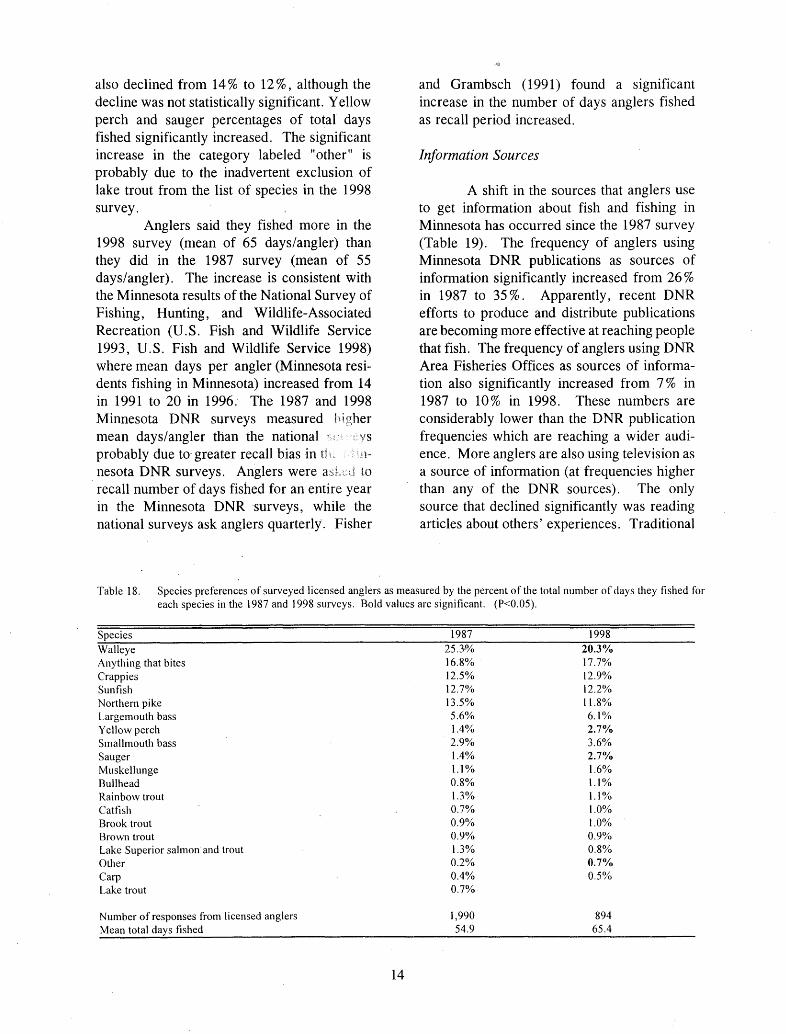
also declined from 14 % to 12 % , although the decline was not statistically significant. Yell ow perch and sauger percentages of total days fished significantly increased. The significant increase in the category labeled "other" is probably due to the inadvertent exclusion of lake trout from the list of species in the 1998 survey.
Anglers said they fished more in the 1998 survey (mean of 65 days/angler) than they did in the 1987 survey (mean of 55 days/angler). The increase is consistent with the Minnesota results of the National Survey of Fishing, Hunting, and Wildlife-Associated Recreation (U.S. Fish and Wildlife Service 1993, U.S. Fish and Wildlife Service 1998) where mean days per angler (Minnesota residents fishing in Minnesota) increased from 14 in 1991 to 20 in 1996: The 1987 and 1998 Minnesota DNR surveys measured higher mean days/angler than the national vs probably due to- greater recall bias in nesota D NR surveys. Anglers were to recall number of days fished for an entire year in the Minnesota DNR surveys, while the national surveys ask anglers quarterly. Fisher
and Grambsch ( 1991) found a significant increase in the number of days anglers fished as recall period increased.
Information Sources
A shift in the sources that anglers use to get information about fish and fishing in Minnesota has occurred since the 1987 survey (Table 19). The frequency of anglers using Minnesota DNR publications as sources of information significantly increased from 26 % in 1987 to 35 % . Apparently, recent DNR efforts to produce and distribute publications are becoming more effective at reaching people that fish. The frequency of anglers using DNR Area Fisheries Offices as sources of information also significantly increased from 7 % in 1987 to 10% in 1998. These numbers are considerably lower than the DNR publication frequencies which are reaching a wider audience. More anglers are also using television as a source of information (at frequencies higher than any of the D NR sources). The only source that declined significantly was reading articles about others' experiences. Traditional
Table 18. Species preferences of surveyed licensed anglers as measured by the percent of the total number of days they fished for each species in the 1987 and 1998 surveys. Bold values are significant. (P<0.05).
Species 1987 1998
Walleye 25.3% 20.3% Anything that bites 16.8% 17.7% Crappies 12.5% 12.9% Sunfish 12.7% 12.2% Northern pike 13.5% 11.8% Largemouth bass 5.6% 6.1% Yellow perch 1.4% 2.7% Smallmouth bass 2.9% 3.6% Sauger 1.4% 2.7% Muskellunge 1.1% 1.6% Bullhead 0.8% 1.1% Rainbow trout 1.3% 1.1% Catfish 0.7% 1.0% Brook trout 0.9% 1.0% Brown trout 0.9% 0.9% Lake Superior salmon and trout 1.3% 0.8% Other 0.2% 0.7% Carp 0.4% 0.5% Lake trout 0.7%
Number of responses from licensed anglers 1,990 894 Mean total days fished 54.9 65.4
14

Table 19. Frequency of sources of information about fish and fishing in Minnesota for resident anglers from surveys in 1987 and 1998. Bold values are significant. (P<0.05).
Source Reading technical articles about fish Television programs Educational programs or workshops Reading articles about others' experiences Minnesota DNR area fisheries office Minnesota DNR publications Minnesota DNR Conservation Officers Friends and relatives My own experience Other
Number of responses from license anglers
sources, such as friends and relatives, and the angler's own experiences did not change significantly, but remained high (over 70 % of anglers use these sources). The frequency of anglers that use Minnesota D NR Conservation Officers as sources of information about fish and fishing did not change significantly and remained relatively low (at about the same frequency as DNR Area Fisheries Offices -approximately 10 % ) .
Effectiveness of Fisheries Management Techniques
Table 20 contains the results of questions designed to track angler opinions on the effectiveness of several important techniques that may affect fish populations. Significantly more anglers feel that size limits are effective at protecting fish populations. Widespread Minnesota DNR experiments with size limit regulations in the past 10 years have apparently increased angler expectations that size limits will work. The number of anglers that feel that using conservation to reduce soil erosion will improve fishing increased significantly since the 1987 survey. Controlling wetland drainage to improve fishing also was regarded by more anglers to be an effective technique but not statistically significant. Angler perception of the effectiveness of other techniques such as stocking walleye and managing shoreline did not change significantly.
1987 33.4% 50.9% N.A.
53.1% 6.7%
25.9% 10.2% 72.2% 73.7%
4.8%
1,990
15
1998 35.6% 57.9% 12.1% 43.2% 9.8%
35.3% 9.5%
75.1% 75.3% 10.1%
894
Minnesota DNR Section of Fisheries Pelformance
The majority of anglers that expressed an opinion agreed that the Minnesota DNR Section of Fisheries is doing a good job in most areas - as they did in 1987 (Table 21). However, the numbers of anglers who perceive that the D NR Section of Fisheries listens and responds to anglers' concerns declined signifi-cantly since the 1987 survey .. The number of anglers who think the Minnesota D NR manages for special interests also increased significantly. A majority of anglers in both the 1987 and 1998 surveys, that expressed an opinion, feel that the D NR Section of Fisheries adequately manages Minnesota's fishing waters and needs more funding to do a better job (no significant changes}. Although not specifically related to Section performance, there were two questions that addressed the tradeoff between numbers and size of fish. The percentage of anglers who thought that the D NR Section of Fisheries should manage lakes for smaller but more abundant fish remained about the same, while the percentage of anglers who thought lakes should be managed for bigger but fewer fish significantly declined.
Discussion
Differences in the attitudes of anglers versus nonanglers were detected. Anglers generally placed a higher importance on fishing ethics and education, were more likely to

Table 20. Percent of Minnesota resident anglers that stated that the following activities were effective from surveys in 1987 and 1998. Bold values are significant. (P<0.05}.
It is my understanding that: stocking walleye in a lake to increase walleye populations is ... using size limits to protect fish populations is ... managing shoreline to protect fish spawning sites is ...
1987 1998 92.4% 91.4% 90.7% 96.6% 94.9% 95.3%
using conservation to reduce soil erosion to improve fishing is ... controlling wetland drainage to improve fishing is ...
91.9% 89.6%
94.9% 92.5%
Table 21. Percent of Minnesota resident anglers that agreed with the following statements about fisheries management issues from surveys in 1987 and 1998. Bold values are significant. (P<0.05).
The Minnesota DNR Section of Fisheries: listens to anglers' concerns. responds to anglers' concerns. manages fisheries for special interests. adequately manages Minnesota's fishing waters. needs more funding to do a better job.
1987 84.2% 80.8% 53.9% 66.0% 62.9%
1998 78.8% 69.5% 62.5% 71.3% 64.8%
should allow more angler participation in making fish management decisions 84.6% 86.5% should manage lakes to have many fish, though the average size would be smaller should manage lakes to have big fish, though the number of fish harvested would be less
67.3% 53.4%
65.9% 43.6%
support fish stocking, were more accepting of artificial fisheries management techniques, placed a higher value on aquatic habitats, supported more funding, and were for more restrictive fishing tournament regulations than were nonanglers. Nonanglers were more concerned about the effects of fishing technology than were a·11glers, and tended to be less satisfied with constituent input processes. Several significant differences were measured in attitudes of Metro versus Non-Metro residents. Metro residents were more likely to favor management for large fish, less likely to advocate fish stocking, more likely to support progressive fisheries management activities, placed a higher value on aquatic habitats, were more satisfied with the performance of the Minnesota DNR Section of Fisheries, and supported more funding for the Section. This support for progressive fisheries management from Metro residents was encouraging in light of recent trends of increased urbanization within the state. The reduced support for habitat protection and progressive fisheries management in the Non-Metro regions may be a manifestation of the general attitude of humans to appreciate natural resources less when they have more. A 1998 survey of Minnesota
16
residents (Anderson et al. 1998) also noted that people in the northern regions expressed less support for lake habitat management solutions to perceived lake problems than did other residents of the state.
Surprisingly, lakeshore ownership was not a significant variable in explaining differences in attitudes about any of the fisheries and habitat issues. Even attitudes concerning fishing tournament conflicts and lakeshore habitat r~gulations were not significantly different between residents who owned lakeshore and those that didn't. Apparently, lakeshore owners have a relatively similar composition of attitudes as non-lakeshore owners. The Anderson et al. (1998) survey also found similarities in attitudes of lakeshore and non-lakeshore owners on many issues, although they did measure differences in support for some regulatory solutions such as protection of shoreland trees and shrubs, minimum lake lot size, enforcement of existing shoreland protection laws, and for solutions that involve more public land purchases to protect shoreland areas.
Age, gender, education, and income were significant variables in only a few attitudes. Few general observations about those four variables could be made. One general

observation that could be made about all of the variables was the overall relative consistency in attitudes. Although the survey was able to detect many significant relationships between attitudes and the characteristics of residents, the magnitude of the differences was generally small. For example, the mean Likert scores for the habitat questions were very similar among groups of survey respondents (Table 8). Even with the significant differences that were detected, there was general agreement among all groups that fisheries habitats are important and that they need protecting. Although the survey measured support for the protection of fisheries habitats, a more detailed analysis of the tradeoffs people are willing to make in order to implement the required restrictions would be interesting to explore in future surveys.
The recent increased interest in the yellow perch fisheries in large lakes such as Mille Lacs, Winnibigoshish and Leech, and the expansion of the winter sauger fishery on Lake of the Woods probably account for much of the shift in preference since 1987 away from traditional species such as walleye and northern pike. However, the decrease in preference for walleye has probably not resulted in less fishing pressure on walleye populations because of the increase in mean days per angler. The 20 % decline in percent days fished for walleye was offset by the 19 % increase in mean days per angler. The net result is that fishing pressure on walleye populations has probably remained constant since 1987.
The 1972 survey by Scidmore and Wroblewski (1973) also contained species preference information. Although the question was formatted differently ("Which kinds of fish did you fish for most often in 1971? "), the relative order of species preferences is comparable. The 1972 survey found that walleye and northern pike were tied for the highest species preference followed by sunfish, crappie, largemouth bass, bullhead, smallmouth bass, trout and salmon, and then muskellunge. Yell ow perch and sauger were not on the list.
The decline since 1987 in the percentage of anglers who were willing to accept the
17
tradeoff of managing for bigger fish over numbers of fish was surprising, considering the publicity of recent DNR Section of Fisheries experimental regl,llation efforts. However, the 1998 survey used the phrase "though the number harvested would be less", while the 1987 survey used "though the number caught would be · 1ess". Although the change was made to have a more biologically correct statement in the question, the difference in the frequency of anglers who agreed with the statement could be attributed to the wording change and not a change in angler preferences.
Although the Minnesota D NR Section of Fisheries continued to receive high marks from the majority of anglers on performance questions, several of the trends since the 1987 survey should be cause for concern. Although the percentage of anglers who expressed an opinion in the 1998 survey that the DNR Section of Fisheries listens to anglers' concerns (79 % ) and that the DNR Section of Fisheries
-responds to anglers' concerns (70 % ) remains high, the values were significantly lower than in the 1987 survey. This suggests that the Section needs to improve the process for gathering public input. Related to this issue was the majority of anglers who suggested that the Section should allow more angler participation in making fish management decisions (although no significant change from the 1987 survey). Also of concern, was the increased percentage of anglers since the 1987 survey that feel that the DNR Section of Fisheries manages for special interests. The Section needs to do a better job of explaining to the public that we manage fisheries for .all interest groups.
Future Survey Reconm:iendations
The analysis for this study was based on an a priori grouping of questions that were part of a larger survey that had more objectives than measuring. attitudes. Future surveys would benefit from the development of questions specifically designed to measure attitudes in a multivariate statistical setting. Although many of the questions in this survey served the purpose of an attitude analysis well, specifi-

cally 4esigned questions using formal social science techniques of question development such as the use of focus groups and presurveys (McKennel 1977) would be useful in developing efficient attitude surveys.
Timing of future surveys should be coordinated with the National Survey of Fishing, Hunting, and Wildlife-Associated Recreation. The nati0nal survey's estimate of total days fished can be used with Minnesota DNR survey species preference data to estimate actual total days fished for each species. The question about total days fished should be asked in 2001 when the next National Survey is conducted. A larger statewide survey could be done in 2006 to coincide with the following National Survey.
Question language should maintain the standards set in the 1998 survey for future consistency.
Literature Cited
Anderson, K. A., T. J. Kelly, R. M. Sushak, _C. A. Hagley, D. A. Jensen, G. M. Kreag. 1998. Public perceptions of the · impacts, use, and future of Minnesota lakes. Minnesota Sea Grant Summary Report, Duluth.
Anthony, K. 1998. 1998 Survey of Minnesota residents about fisheries management. Final Project Report to the Minnesota Department of Natural Resources. Minnesota Center for Survey Research, University of Minnesota, Minneapolis.
Cunningham, P. K., and C. S. Anderson. Opinions of angler groups and fisheries professionals in Minnesota. Minnesota Department of Natural Resources Investigational Report 422, St. Paul.
Grambsch, A. E., and W. L. Fischer. Improving surveys: Lessons from the National Survey. American Fisheries Society Symposium 12:5-12.
18
Leitch, J. A., and J. F. Baltezore. 1987. Attitudes of Minnesota anglers. Final · Project Report to the Minnesota Department of Natural Resources. Center for Environmental Studies, North Dakota State University, Fargo.
Miranda, L. E., and W. Frese. 1991. Can fishery scientists predict angler preferences? American Fisheries Society Symposium 12:375-379.
McKennel, A. C. 1977. Attitude scale construction. Pages 183-220 in C. A. O'Muicheartaigh, and C. Payne, editors. The analysis of survey data. John Wiley and Sons, New York.
Scidmore, W. J., and L. Wroblewski. Mail survey of Minnesota resident fishermen - 1972. Minnesota Department of Natural Resources Investigational Report 320, St. Paul.
U. S. Fish and Wildlife Service. 1993. 1991 National survey of fishing, hunting, and wildlife-associated recreation. U. S. Fish and Wildlife Service, Washington, D. C.
U. S. Fish and Wildlife Service. 1998. 1996 National survey of fishing, hunting, and wildlife-associated recreation. U. S. Fish and Wildlife Service, Washington, D. C.


Acknowledgments
P .J. Wingate and R. Shushak assisted with the development of questions and survey design. Rossana Armson, Director of the Minnesota Center of Survey Research at the University of Minnesota was instrumental in the administration of the survey in a timely and organized manner. We were very satisfied with the quality of service the Center provided.
Edited by: P. J. Wingate, Fisheries Research Manager


