February 2018 Discussion Paper No. 82 The opinions expressed in this discussion paper are those of the author(s) and should not be attributed to the Puey Ungphakorn Institute for Economic Research.
Transcript
February 2018
Discussion Paper
No. 82
The opinions expressed in this discussion paper are those of the author(s) and should not be
attributed to the Puey Ungphakorn Institute for Economic Research.
1
Dynamic Connectedness in Emerging Asian Equity Markets*
Pym Manopimokea, Suthawan Prukumpai
b and Yuthana Sethapramote
c
Abstract
Abstract: This paper examines dynamic connectedness among emerging Asian
equity markets as well as explores their linkages vis-à-vis other major global markets.
We find that international equity markets are tightly integrated. Measuring
connectedness based on a generalized Vector Autoregressive model, more than half of
all total forecast error variance in equity return and volatility shocks come from other
markets as opposed to country own shocks. When examining the degree of
connectedness over time, we find that international stock markets have become
increasingly connected, with a gentle upward trend since the Asian financial crisis but
with a rapid burst during the global financial crisis. Despite the growing importance
of Asian emerging markets in the world economy, we find that their influence on
advanced economies is still relatively small, with no significant increase over time.
During the past decade, advanced markets have been consistently net transmitters of
shocks while emerging Asian markets act as net receivers. Based on the nature of
equity shock spillovers, we also find that advanced countries are still tightly
connected amongst themselves while intraregional connectedness within Asia remains
strong. By investigating whether uncertainty plays an important role in explaining the
degree of stock market connectedness, we find that economic policy uncertainty from
the US is an important source of financial shock spillover for the majority of
international equity markets. In contrast, US financial market uncertainty as proxied
by the VIX index drives equity market spillovers only among advanced economies.
Keywords: emerging Asia financial integration, financial spillovers, generalized
VAR, stock market, uncertainty
* Corresponding Author (Manopimoke) E-mail: [email protected]. a Principal Economist, Puey Ungphakorn Institute for Economic Research, Bank of Thailand b Assistant Professor, Faculty of Business Administration, Kasetsart University c Associate Professor, School of Development Economics, National Institute of Development
Administration
2
1. Introduction
One of the most striking global developments over the past two decades has
been the rapid trade and financial integration of emerging Asia into the world
economy and financial system. Emerging Asia exports now account for more than a
third of world trade flows, up sharply from about 20 percent since the early 1990s.
During the same time, intraregional trade within Asia also grew at twice the pace as
those seen in other regions. Capital markets in emerging Asia have also deepened. On
top of significant foreign direct investments, portfolio inflows to the region have
surged over past decades, particularly due to lower interest rates and declining asset
investment returns in advanced economies. More recently, capital outflows from
emerging Asia have also been substantial, increasing by tenfold since the mid 1990s
to over $500 billion US dollars in 2007.
As trade and financial linkages are known to be important determinants of
stock market interdependence (see Chen and Zhang, 1997; Johnson and Soenen,
2002; Forbes and Chinn, 2004; IMF, 2016), this paper joins a growing literature in
examining dynamic connectedness for international equity markets with a focus on
emerging Asia. While a voluminous body of research finds that global equity markets
are integrated (see Sharma, 2012 for a comprehensive review), most studies focus on
examining interconnectedness among developed markets. For studies that examine
cross-border linkages between mature and emerging markets in Asia, their focus has
mostly been on the East Asian financial crisis (AFC) in 1997 and the global financial
crisis (GFC) in 2007 (Yang, Kolari and Min, 2002; Chiang, Jeon and Li, 2007;
Yoshida, 2010; Huyghebaert and Wang, 2010)4. However, the recent plunge in world
stock markets after the announcement of a change in the Renminbi exchange rate
regime on August 24, 2015, or how equity markets reacted to the Brexit vote on June
23, 2016 makes it evident that spillover of financial shocks to and from the emerging
Asia region can be triggered by events that occur during non-crises periods as well.
Against this backdrop, this paper addresses two main questions. First, how
have equity market spillovers to and from emerging market economies in Asia
evolved over the past two decades? Are there any upward or downward trends, or any
bursts during crisis periods? To study connectedness of emerging Asia equity markets
vis-à-vis other major equity markets, we utilize the Diebold and Yilmaz (2009, 2012)
approach which is based on generalized variance decompositions of a Vector
Autoregressive (VAR) model to construct spillover indices for weekly returns and
volatilities in 15 international equity markets. Other major approaches used to
examine connectedness include cross-market correlation coefficients (Lee and Kim,
1993; King and Wadhwani, 1994; Forbes and Rigobon, 2002), multivariate ARCH
and GARCH models (Hamao, Masulis and Ng, 1990; Berben and Jansen, 2005;
Bartram, Taylor and Wang, 2007), and cointegration techniques (Kasa, 1992; Longin
and Solnik 1995). However, the pairwise correlation approach has limited value in
4 Studies that focus on crises periods mostly analyze contagion. While there is still disagreement about
the terminology, contagion in this paper is defined as a significant increase in cross-market linkages
after a shock occurs to a country or a region. If the two markets exhibited strong linkages before the
crisis and continue to show strong ties afterwards, this situation is referred to as interconnectedness or
interdependence.
3
financial market contexts where spillovers should be analyzed as a system,
multivariate ARCH and GARCH models require many parameters for estimation, and
the cointegration method is a long-run approach that fails to capture the fluid nature of
stock market dynamics. Not only does the Diebold and Yilmaz approach overcome
these challenges, but it also provides information about the direction of spillover from
one market to another, which is particularly useful towards analyzing the source of
equity market spillovers.
The second question that we examine in this paper pertains to the underlying
determinants of stock market connectedness. During recent years, it has become
increasingly apparent that discussions over fiscal challenges, trade agreement
annulments and re-negotiations, as well as the impact of major elections in the US has
delivered strong synchronized movements across equity markets worldwide. The
financial market collapse in 2007 that originated from the US also caused ripple
effects across global equity markets. We therefore examine the extent in which the
intensity of stock market spillover received by international equity markets can be
explained by US financial as well as economic policy uncertainty (EPU) shocks. To
measure broad financial market uncertainty, we employ the VIX index, while we
utilize the EPU index as constructed from newspaper coverage frequency by Baker,
Bloom and Davis (2016) to measure the level of EPU in the US5.
Related to our research is a large literature that studies the influence of
uncertainty on general stock market movements. However, the majority of past
studies restrict their analysis to the US (Fleming, Ostdiek and Whaley, 1995;
Connolly, Stivers and Sun, 2005; Giot, 2005 for the VIX and Sum and Fanta, 2012;
Antonakakis et al., 2013; Kang and Ratti, 2013; Liu and Zhang, 2015 for the EPU).
Limited attention has been attributed to analyzing the relationship between
uncertainty and the nature of equity market spillover across countries. Exceptions are
Beirne, Caporale, Schulze-Ghattas and Spagnolo (2009), whom find that conditional
correlations and financial spillovers from mature to developing markets rise when the
VIX index level is high during turbulent periods. Tsai (2017) analyzes the influence
of the EPU originating from China, Japan, Europe and the US on the dynamic
correlation and conditional volatility of 22 global stock markets. He finds that apart
from the EPU effect from China, there is limited evidence that EPU shocks from the
US, Europe and Japan influences equity market spillovers in global markets.6
However, one drawback is that their analysis is based on monthly data. In our study,
5 Based on this measure, many studies have found the EPU to be an important determinant of domestic
economic activity such as output, unemployment, consumption and investment (Baker et al. 2016;
Gulen and Ion, 2016; Arbatli, Davis, Ito, Miake and Saito, 2017). 6 Many studies also examine the cross-country implications of EPU on stock market returns. Lam and
Zhang (2014) show that global policy uncertainty in general has a significant effect on equity market
returns in a sample of 49 countries during 1995 to 2006. Sum (2012a, b) find that US EPU shocks do
not significantly affect stock returns in China, Brazil and India, while it negatively affects Japan and
Russia. Momin and Masih (2015) find limited evidence that policy uncertainty from the US impacts
BRICS equity markets. Christou, Cunado, Gupta and Hassapis (2017) finds a significant negative
relationship between US EPU shocks and stock market returns in Canada, China, Japan and Korea.
4
we base our analysis on weekly data which should be able to better capture the fluid
and fast response of financial shock spillovers to changes in uncertainty conditions.
As a preview of our empirical findings, we find that first, international equity
markets are tightly integrated. Based on the generalized VAR framework, more than
half of all total forecast error variance in equity return and volatility shocks come
from other markets as opposed to country own shocks. Second, international stock
markets have become more connected over time, with a slowly increasing trend since
the AFC and a rapid burst during the GFC. Third, advanced countries have been
consistently net transmitters of shocks while emerging Asian markets act as net
receivers, with no major shift in terms of net shock givers and receivers over time.
Fourth, despite the growing importance of emerging market economies, particularly
China, we find that the influence of financial shocks from emerging Asia on advanced
economies is still relatively small. Advanced countries tend to be more connected
among themselves, while the degree of intraregional connectedness within Asia is
particularly strong. Finally, by investigating whether uncertainty plays an important
role in explaining the degree of stock market spillovers, we find that EPU from the
US has a significant impact on market connectedness for the majority of countries. On
the other hand, financial market uncertainty in the US as measured by the VIX index
only drives shock spillovers among advanced economies.
This paper is organized as follows. Section 2 explains the empirical
methodology, data and findings on dynamic connectedness for international equity
markets. Section 3 outlines the model to explore whether uncertainty that originates
from the US is a key determinant of financial shock spillovers received by
international equity markets and discusses the empirical results. Section 4 concludes.
2. Equity Market Returns and Volatility Spillovers
2.1 Measuring Connectedness
Connectedness across international equity markets is measured based on the
spillover index of Diebold and Yilmaz (2009, 2012). The original measure in the
authors’ earlier work is based on variance decompositions of forecast errors
associated with VAR models. In particular, for each asset 𝑖, connectedness is
measured as the sum of the shares of asset 𝑖′𝑠 forecast error variance coming from
shocks to asset 𝑗, for all 𝑗 ≠ 𝑖. In this paper, we use the improved spillover index in
the authors’ latter study which measures connectedness based on the generalized
VAR framework of Koop, Pesaran and Potter (1996) and Pesaran and Shin (1998).
Unlike the original measure, the forecast error variance decompositions used to
calculate the spillover index is invariant to different orderings of the variables in the
Cholesky decomposition. Moreover, the generalized VAR approach allows for
correlated shocks.
To gain insight on the spillover index, consider the following covariance
stationary N-variable VAR with p lags:
𝑋𝑡 = Φ1𝑋𝑡−1 + ⋯ + Φ𝑝𝑋𝑡−𝑝 + 𝜀𝑡
where 𝑋𝑡 = {𝑋1,𝑡, 𝑋2,𝑡, … , 𝑋𝑁,𝑡} is a matrix of endogenous variables and 𝜀𝑡~(0, ∑) is
a vector of disturbance terms with as a variance matrix of error terms that are
5
assumed to have contemporaneous correlation with each other but are independently
and identically distributed over time. When the variances in the VAR system are
covariance stationary, one can rewrite the system into a moving average
representation as:
𝑋𝑡 = ∑ 𝐴𝑖𝜀𝑡−𝑖∞𝑖=0
where 𝐴𝑖 is the N x N coefficient matrix that obeys the recursion 𝐴𝑖 = Φ1𝐴𝑖−1 +Φ2𝐴𝑖−2 … + Φ𝑝𝐴𝑖−𝑝. Then, based on the generalized VAR framework, the H-step
ahead forecast error variance decomposition can be calculated as:
𝜃𝑖𝑗(𝐻) =𝜎𝑖𝑖
−1 ∑ (𝑒𝑖′𝐴ℎ∑𝑒𝑗)2𝐻−1
ℎ=0
∑ (𝑒𝑖′𝐴ℎ∑𝐴ℎ
′ 𝑒𝑖)𝐻−1ℎ=0
where 𝜎𝑖𝑖 is the standard deviation of the error term for the ith equation and ei is the
Nx1 selection vector with one as the i-th element and zeros elsewhere. Accordingly,
𝜃𝑖𝑗(𝐻) can be interpreted as the contribution of the H-step-ahead error variance in
forecasting Xi that comes from a one-standard deviation shock to Xj for each
i,j=1,2,…,N, where ∀𝑖 ≠ 𝑗.
Finally, Diebold and Yilmaz (2012) normalize each entry of the variance
decomposition matrix by the row sum as follows:
�̃�𝑖𝑗(𝐻) =𝜃𝑖𝑗(𝐻)
∑ 𝜃𝑖𝑗(𝐻)𝑁𝑗=1
which allows VAR innovations to be contemporaneously correlated while ensuring
that the sum of the contributions to the variance of the forecast error sums to one, i.e.
∑ �̃�𝑖𝑗(𝐻)𝑁𝑗=1 = 1, ∑ �̃�𝑖𝑗(𝐻)𝑁
𝑖,𝑗=1 = 𝑁.
Based on the volatility contributions from the above variance decompositions,
the various spillover indices can be calculated as follows:
Total Spillovers: measures the contribution of spillovers across the N variables to the
total forecast error variance:
𝑇𝑆(𝐻) =∑ �̃�𝑖𝑗(𝐻)𝑁
𝑖,𝑗=1,𝑖≠𝑗
∑ �̃�𝑖𝑗(𝐻)𝑁𝑖,𝑗=1
× 100 = ∑ �̃�𝑖𝑗(𝐻)𝑁
𝑖,𝑗=1,𝑖≠𝑗
𝑁× 100.
Directional Spillovers: measures volatility spillovers transmitted by i to all other
markets j (𝐷𝑆𝑖→∙(H)), and volatility spillovers received by i from all other markets j
(𝐷𝑆∙→𝑖(H)):
𝐷𝑆𝑖→∙(𝐻) = ∑ �̃�𝑗𝑖(𝐻)𝑁
𝑗=1,𝑗≠𝑖
∑ �̃�𝑗𝑖(𝐻)𝑁𝑖,𝑗=1
× 100 = ∑ �̃�𝑗𝑖(𝐻)𝑁
𝑗=1,𝑗≠𝑖
𝑁× 100,
𝐷𝑆∙→𝑖(𝐻) = ∑ �̃�𝑖𝑗(𝐻)𝑁
𝑗=1,𝑗≠𝑖
∑ �̃�𝑖𝑗(𝐻)𝑁𝑖,𝑗=1
× 100 = ∑ �̃�𝑖𝑗(𝐻)𝑁
𝑗=1,𝑗≠𝑖
𝑁× 100.
Note that directional spillovers are calculated by decomposing total spillovers into
those coming from, or spread to, a particular source. Directional spillovers can only
be computed within the generalized VAR framework because the variance
decompositions are invariant to the ordering of variables.
6
Net Spillovers: is the difference between volatility shocks that are transmitted to and
received from all other markets, defined as:
𝑁𝑆(𝐻) = 𝐷𝑆𝑖→∙(𝐻) − 𝐷𝑆𝑖→∙(𝐻).
2.2 Equity Market Return and Volatility Data
To study dynamic connectedness between emerging Asia and other major
global equity markets, spillover indices are calculated for the following 15 countries,
which are categorized into three groups according to their region and level of
development: (1) Emerging Asia: China (CHN), India (IND), Indonesia (IDN),
Malaysia (MYS), Philippines (PHL), and Thailand (THA); (2) Advanced Asia:
Australia (AUS), Hong Kong (HKG), Japan (JPN), South Korea (KOR) and Taiwan
(TAI); and (3) Other advanced economies: France (FRA), Germany (GER), the
United States (US), and the United Kingdom (UK). For ease of reference, we list the
corresponding country abbreviations in parentheses.
The underlying data used to compute stock market returns are daily nominal
local-currency stock market indexes taken from Datastream. Following Yilmaz
(2010), we compute weekly returns as the change in Friday-to-Friday log prices,
where Thursday data is used if Friday is a holiday7. Weekly returns for market 𝑖 are
then annualized as 𝑟𝑖𝑡 = 52 × 100 × (∆𝑙𝑛𝑃𝑖𝑡). Based on the assumption that volatility
is fixed within the week period, the weekly variance for stock market 𝑖 is estimated
where 𝐻 is the Monday to Friday high, 𝐿 is the Monday to Friday low, 𝑂 is the
Monday open and 𝐶 is the Friday close, all in natural logarithms. Then, the
corresponding estimate of the annualized weekly volatility can be computed is �̂�𝑖𝑡2 =
100√52 �̃�𝑖𝑡2 . Unfortunately, 𝐻 and 𝐿 data in Datastream for some countries in our
sample are only available from April 1, 2000 through November 30, 2017. Therefore,
the weekly volatility series can only be calculated for this shorter subsample, while
weekly return series span the longer January 1, 1992 to November 30, 2017 period8.
Descriptive statistics for weekly returns and volatilities are reported in Table
1. Some observations are as follows. First, based on the average annualized returns in
Panel A, Indonesia has the highest weekly average return of 11.72%, followed by
India at 9.33%. Japan gives the lowest return at 0.61%. The remaining equity market
average returns are more or less comparable. Similarly, the standard deviation of
weekly returns for all markets is within the same range, with the exception of China.
Thus, the variance of weekly returns in developed equity markets are not necessarily
lower when compared to those in emerging market ones. The return distribution of all
equity markets is negatively skewed, except for the Chinese and Malaysian stock
7 With higher frequency data such as daily data, it becomes difficult to interpret the directional and
causal relationships of the movement of markets with different trading periods due to time zone
differences. To avoid this issue, studies often use two-day averaging of daily returns or weekly returns. 8 High and low data for Singapore is even shorter and is only available from January 2008 onwards.
For this reason, we exclude Singapore from our analysis.
7
markets. Kurtosis is in general high, particularly for China, displaying evidence of
non-normal distribution for stock returns. Last, turning to analyze Panel B, the
German, Chinese and French stock markets are the most volatile, while the Malaysian
and the Philippines markets are the least. Thus, while high volatility tends to be
thought of as a distinguishing feature of emerging economy equity markets and
Harvey, 1997), it is not the case for our particular dataset and time period of study.
2.3 Full Sample Analysis: Spillover Tables
To examine overall connectedness of international equity markets, we begin
by analyzing the intensity of stock returns and volatility spillovers over the full
sample. In doing so, we estimate the generalized VAR with 4 lags and calculate the
spillover index based on 8-day-ahead forecast errors in the generalized variance
decomposition9. The results are reported in Tables 2 and 3, where the contents of the
table is to be read as follows. First, the ij-th entry represents the estimated
contribution to the forecast error variance of country i, coming from innovations to
country j. Therefore, the off diagonal column sums (contribution to others) or row
sums (contribution from others) are the “to” and “from” directional spillovers and the
“from minus to” differences are the net volatility spillovers. The total volatility
spillover index is reported in the lower right corner of the spillover table, calculated as
the sum of all off-diagonal column sums (or row sums) relative to the sum of all
column sums including diagonals, expressed in percent.
According to Tables 2 and 3, the total spillover index is 67 and 71 percent
over the full sample for equity market returns and volatility respectively. This finding
suggests that for our sample of 15 countries, more than half of all total forecast error
variance are shocks from other markets as opposed to country own shocks. Our
finding of high spillover intensity among markets is similar to Guimarães-Filho and
Hong (2016), whom for a slightly larger set of countries report total return and
volatility spillover indices of 81 and 78 percent respectively during 1996-2015.
However, based on a similar selection of countries to these authors, Diebold and
Yilmaz (2009) find that the return and volatility spillover indices are lower at only 36
and 40 percent respectively. However, their analysis excludes the GFC period,
suggesting that international equity market connectedness measures may have
increased significantly during that period.
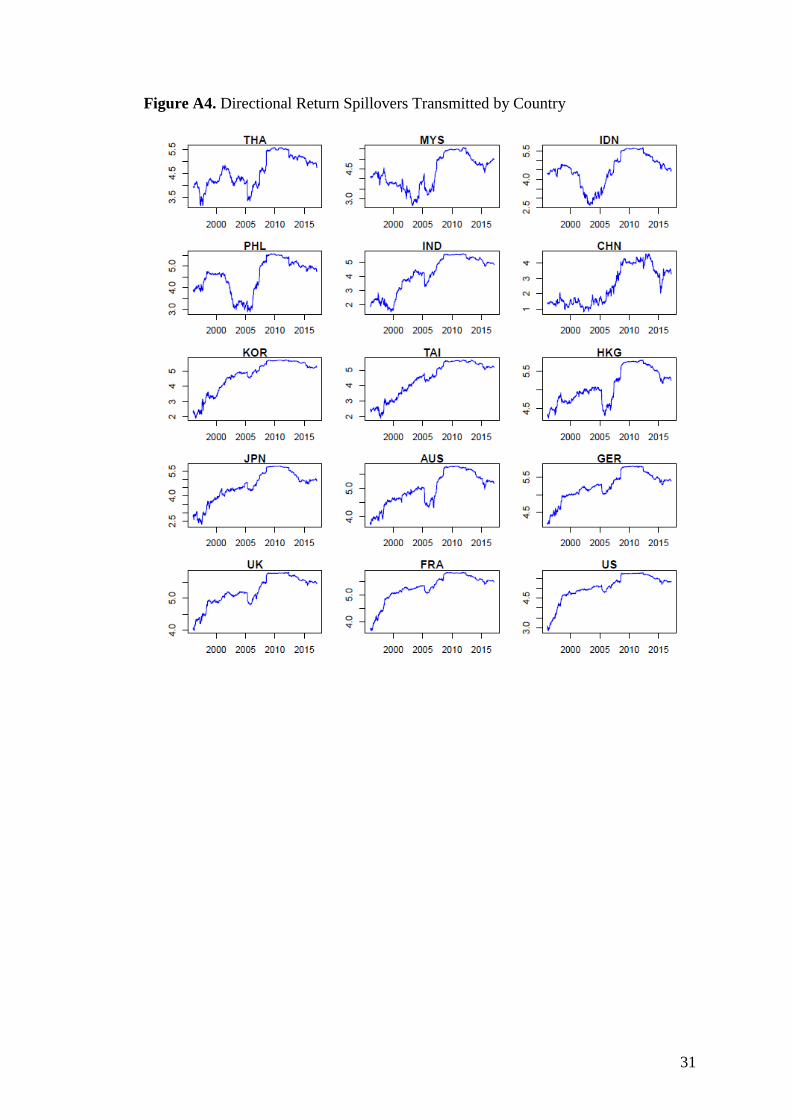
Next, the directional spillovers figures in the second to last row and the last
column suggest that the intensity of return and volatility spillovers to others are much
higher for advanced countries than emerging market ones. The contribution of
spillovers from others on the other hand, are more or less comparable for all countries,
whether it be for return or volatility spillovers. Then, examining the magnitude of the
off diagonal elements, advanced economies also appear to be much more connected
among themselves. For countries within emerging Asia, intraregional connectedness
also appears to be strong, especially for equity returns, consistent with findings of
Masih and Masih (1999) and Dekker, Sen and Young (2001). We also do not find that
financial shocks from the US for emerging Asia markets necessarily dominate those
from other advanced economies such as from Hong Kong, which is known to be a
market leader in the region. Furthermore, similar to Yang et al. (2002), but in contrast
to Ghosh, Saidi and Johnson (1999) and Masih and Masih (2001), the influence of
9 Results are robust to different lags and forecasting horizon specifications.
8
financial shocks from Japan on emerging Asia does not appear to be particularly
substantial.
In general, the full sample analysis suggests that the stock markets of all
countries display strong linkages with the rest of the world. This contrasts with some
studies that have identified certain emerging Asian markets as isolated markets, such
as Indonesia (Janakiramanan and Lamba, 1998), the Philippines (Dekker, Sen and
Young, 2001), Taiwan and Thailand (Ghosh et al., 1999; Dekker et al., 2001). The
only isolated market in our analysis is China, which displays exceptionally low
contribution of shocks both to and from others. Therefore, despite the growing
presence of China in the world economy alongside the large size of its stock market,
our initial results here suggest that China’s tight capital controls still insulate their
markets from the rest of the world. However, the growing importance of China’s
economy for world growth as well as its ongoing liberalization efforts may have
increased its integration with world equity markets during recent periods. To further
examine this issue, we move from a static full-sample analysis to a time-varying
rolling-sample one.
2.4 Rolling-sample Analysis: Spillover Plots
To examine the time-varying intensity of return and volatility spillovers, we
follow Diebold and Yilmaz (2009) and calculate spillover indices over a 200-week
rolling window. As shown in Figure 1, there has been significant time variation in
both total equity return and volatility connectedness. Over the duration of the sample,
both indices rose from approximately 50 to 70 percent, reflecting stronger cross-
country linkages over time.
Next, examining the behavior of connectedness during crises periods, we
observe different characteristics during the AFC and GFC. Similar to Diebold and
Yilmaz (2009), we find that there is a gentle increase in the trend for equity returns
prior to the GFC, indicating a steady rise in the degree of financial market integration
over time. However, consistent with Guimarães-Filho and Hong (2016), both
connectedness measures peaked during the GFC, with sharp rises and falls, especially
for dynamic volatility. This evidence of clear bursts are consistent with the sizeable
shocks during the crisis and also indicate that the spread in volatility transmits much
more rapidly across financial markets.
Turning to examine the directional spillover of equity market returns, Figure 2
plots the rolling net return spillovers averaged across the three country groups.
Focusing on the first half of the sample, the group of other advanced economies
increasingly became net transmitters of shocks, while emerging Asia increasingly
became net receiver of shocks. The importance of other advanced economies as net
givers peaked in the early 2000s, which corresponded to a period of low interest rates
in those economies as well as the introduction of the Euro. Countries in the advanced
Asia group were mildly net receivers, most likely because during that time the Korean
and Taiwanese stock markets were relatively less mature when compared to other
advanced economies.
During the second part of the sample, advanced economies have been
consistently net givers while emerging economies have been net receivers of shocks.
In other words, since the GFC, there have been no substantial changes in the role of
net givers or receivers of shocks. This finding contrasts with those of Guimarães-
Filho and Hong (2016), whom show via a similar analysis but with a shorter dataset
9
that during past decades, emerging Asia markets have moved from a net receiver to a
net transmitter of shocks due to its growing importance in global markets. They also
find that net connectedness of returns in advanced economies are declining over time
while it is increasing for emerging Asia. Finally, turning to examine the behavior of
net volatility connectedness, Figure 3 suggests that similar to the behavior of net
returns, the group of other advanced economies is consistently net givers of shocks
while emerging Asian markets are net receivers. Advanced Asia is on average mild
net givers of financial shocks.
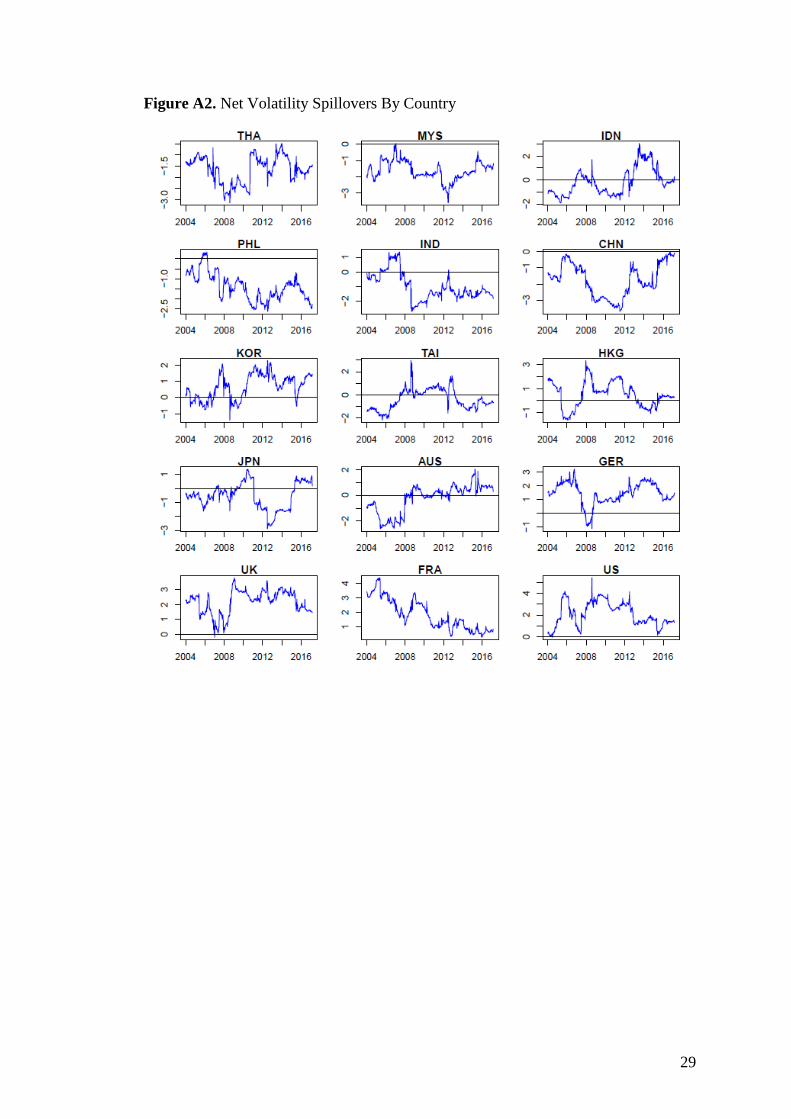
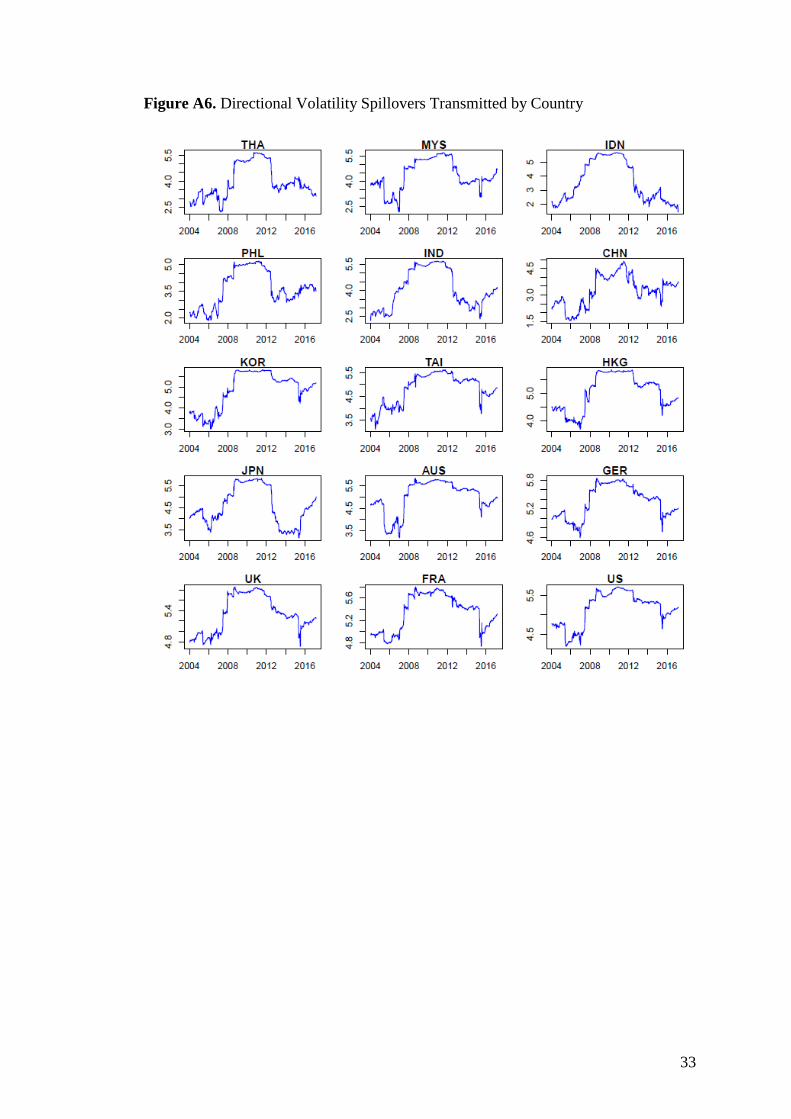
So far, we have analyzed total and net dynamic connectedness based on
country groups. To ensure that we are not drawing any broad generalizations, we plot
the net and directional spillover indices for individual equity market returns and
volatilities in Appendix A. Overall, net return and volatility connectedness behavior
on a country-by-country basis more or less fits with the overall description for its
corresponding group. Nevertheless, the country analysis reveals the following
interesting insights.
First, financial shocks both to and from China intensified significantly since
the GFC, consistent with the findings of Glick and Hutchinson (2013) whom find that
as China increasingly liberalizes its financial markets, the Chinese stock market has
become more integrated with international equity markets. However, China is still a
receiver of return and volatility shocks because while the spillover of shocks from
China approximately doubled, shocks to the country increased by even more. In fact,
its role as a net receiver of shocks rose by more than threefold since the global
financial crisis. In the post crisis period however, we observe China’s role as a net
receiver of shocks to be gradually declining. Based on similar spillover indices,
Guimarães-Filho and Hong (2016) also advocates the growing importance of China as
the net source of financial shocks, although they find that this substantial increase
started later, that is, only from the year 2015 onwards.
A second observation that emerges from the country-by-country analysis is
that unlike other major advanced economies, Japan became a net receiver of volatility
shocks around the year 2012, which corresponded to the period in which Prime
Minister Shinzo Abe started to conduct various monetary and fiscal stimuli to boost
the economy. His policies, also known as Abenomics, spurred a 20 percent decline in
the yen and record growth in its domestic stock market, which may have attracted
volatility spillovers from abroad especially as other advanced economies were
experiencing tepid growth during their recovery from the global financial crisis.
Last, it can be observed that Indonesia was the only net giver of volatility
shocks among all emerging Asia markets. This occurred during the 2013 to 2015
period, which corresponded to a time when the value of rupiah weakened by
approximately 40 percent against the US dollar. This is because as the Federal
Reserve started its quantitative tapering program in 2013, the dollar strengthened
against many currencies in emerging Asia, but the weakened rupiah subsequently
caused the most severe capital outflows out of Indonesia given its wide current deficit,
high inflation, and slowing economic growth. Overall, these findings highlight the
importance of country fundamentals as well as financial, economic and political
uncertainty as major driving factors for equity market return and volatility spillover
dynamics.
10
3. The Role of Uncertainty on Dynamic Connectedness
Identification of the underlying determinants of international stock market
connectedness is important, not only for making sense of important issues such as the
equity home bias puzzle (French and Poterba, 1991; Lewis, 1999), but also for
practical concerns such as the development of proper market monitoring measures. A
large literature explores this issue and finds that the main determinants of cross-
country financial interdependence include trade intensity (Chinn and Forbes, 2004;
Shinagawa, 2014), the degree of financial liberalization and globalization (Beine and
Candelon, 2011; IMF, 2016), the level of financial development (Dellas and Hess,
2005), and geographical variables (Flavin, Hurley and Rousseau, 2002). Other
macroeconomic determinants that have been found to influence stock market
spillovers include interest rate and inflation differentials, exchange rate risk, and
various global risk factors (Pretorius, 2002; Sun and Psalida, 2009; Syllignakis and
Kourestas, 2011; Hwang, Kim and Kim, 2013; Narayan, Sriananthakumar and Islam,
2014).
Since the GFC, it has become increasingly apparent that the degree of uncertainty
in advanced economies has led to synchronized movements in equity markets
worldwide. For example, global stock markets plunged following the Lehman
Brothers Collapse in 2007, the Eurozone debt crisis in 2009, the United States debt-
celling crisis of 2011, as well as the Brexit vote in 2016. Therefore, in this section, we
aim to explore how the degree of spillovers received by international equity markets
are driven by uncertainty in the US, which is inarguably one of the main exporters of
international uncertainty shocks to the world economy (Yin and Han, 2014; Klößner
and Sekkel, 2015)10. Since different types of uncertainty can deliver varied effects, we
differentiate between broad financial market uncertainty and economic policy
uncertainty (EPU) and focus on examining their implications for the nature of
spillovers received by international markets, especially those of emerging Asia.
3.1 Empirical Model and Data
We measure the impact of uncertainty on the return spillovers received in each
of the countries by estimating the following VAR for each country i:
𝑌𝑖𝑡 = Φ1𝑌𝑖,𝑡−1 + ⋯ + Φ𝑝𝑌𝑖,𝑡−𝑝 + 𝜀𝑡,
where 𝑌𝑖𝑡 is a matrix of endogenous variables that includes the estimated time-varying
total return spillover index for country i that is received from all other markets, and
measures of financial market and policy uncertainty in the US11. The lags in the VAR
are chosen based on minimizing the Akaike Information Criterion (AIC) during
estimation. Note that due to the short sample, we only focus on analyzing return but
not volatility spillovers.
10 Note that while we would like to study the spillover effects due to uncertainty originating in other
major economies, we only focus on the US due to data limitations that will be described later.
However, we believe that the US case study in itself can offer interesting insights given that it is one of
the foremost trading partners and major suppliers of capital to the majority of countries in the world. 11 Based on Augmented Dickey-Fuller tests, we cannot reject the null hypothesis of a unit root for each
of the country’s total time-varying return spillover index while we reject the null hypothesis that the
uncertainty measures have a unit root. Therefore, in the empirical VAR, the return spillover indices
enter as first differences while the uncertainty measures enter in levels.
11
To measure the degree of broad financial market uncertainty, we use the
weekly Chicago Board Options Exchange Market Volatility (VIX) index available
from Bloomberg, calculated as the 30-day period implied volatility in the S&P 500
index. To measure US EPU, we take the weekly average of the US daily EPU index
as constructed by Baker et al. (2016). The series is developed based on newspaper
coverage frequency of terms that reflect economic policy uncertainty (the relative
frequency of newspaper articles that refer to “uncertainty”, “economy”, and “policy”),
available from the website www.policyuncertainty.com for the January 1, 1992 to
November 30, 2017 sample period. Note that while the website contains EPU indices
for other countries as well, they are only available at the monthly frequency, which
we believe is at a frequency too low to adequately capture the dynamic relationship
between EPU shocks and stock market spillovers.
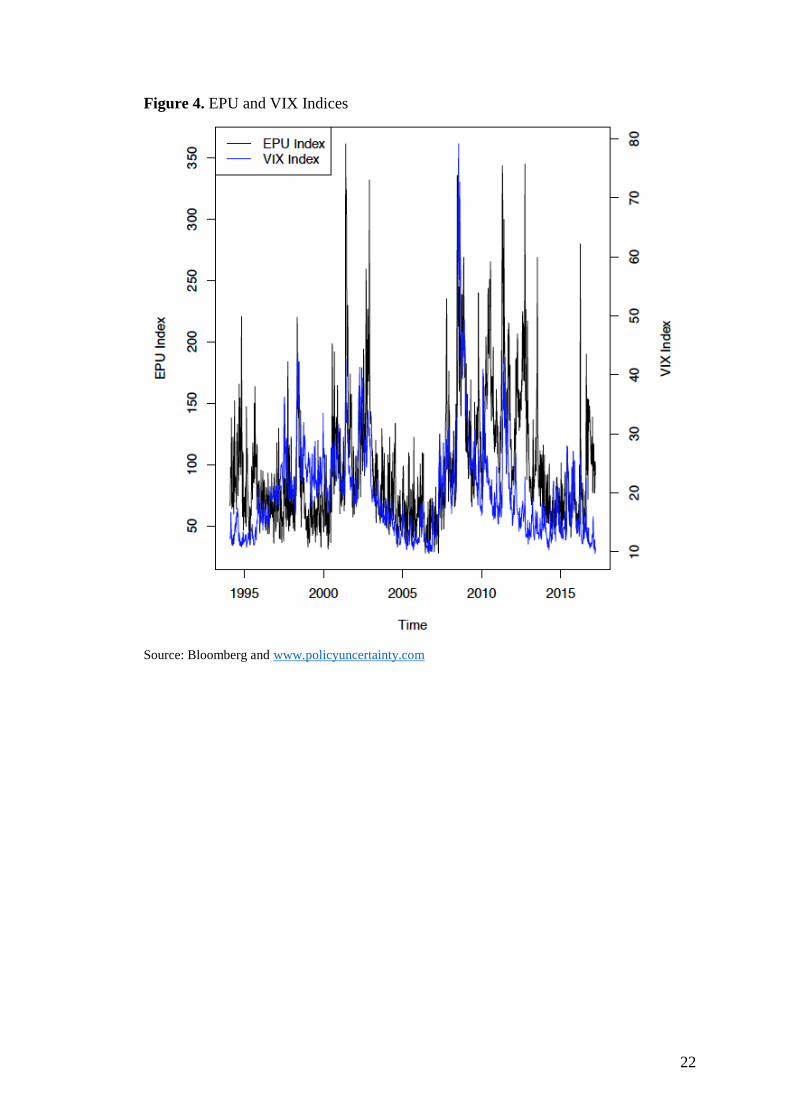
As an initial exploration of the data, Figure 4 contains plots of the weekly VIX
and EPU. As shown, the two indices generally move together, but also contain distinct
variation. The VIX reacts more strongly to events that have strong financial
associations such as the AFC, the Worldcom Fraud and the Lehman Brothers
collapse. The EPU index on the other hand, responds stronger to events that involve
major policy concerns with implications on stock market volatility such as the
election of a new president, political battles over taxes and government spending. It
can be observed that the EPU measure increased sharply after several events such as
the 9/11 attack, the 2nd Gulf War, and the 2011 debt-ceiling dispute. Other
discrepancies between the two series as highlighted by Baker et al. (2016) is that the
VIX reflects implied volatility over a 30-day look ahead period while the EPU index
has no explicit horizon; the VIX pertains to uncertainty about equity returns for only
publicly traded firms while the EPU index is more broad and reflects general policy
uncertainty, and is therefore not only limited to equity returns.
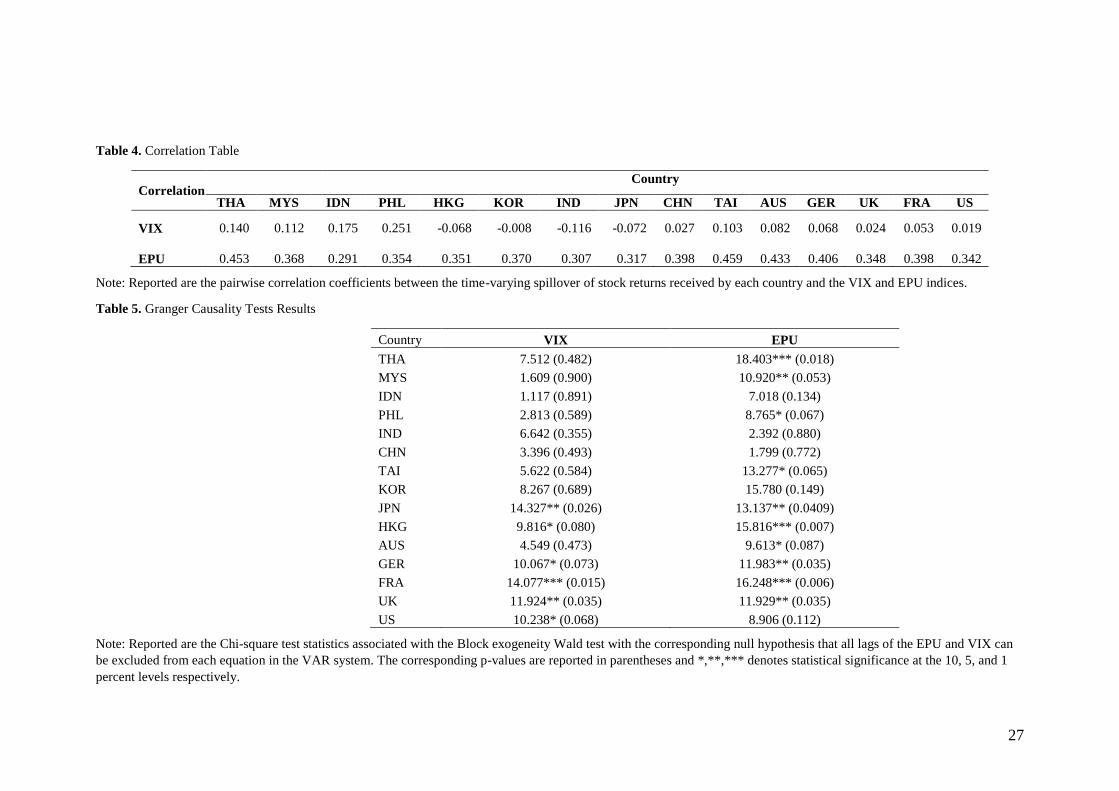
Next, Table 4 reports the pairwise correlations between the spillovers of
shocks received for each country and the EPU and VIX indices. As shown, EPU is
positively correlated with the country measures of stock market connectedness,
implying that US EPU is potentially an important determinant of stock market return
spillovers. The correlations with the VIX, on the other hand, are not as strong.
However, even if the VIX has low or no implications for the degree of financial
market spillovers, we view that including the VIX in the VAR framework is
important. Over the sample, the correlation between the VIX and EPU indices is 0.50,
and therefore the VIX can be treated as a control variable to ensure that the EPU will
only capture the influence of policy uncertainty and not financial market uncertainty.
3.2 Empirical Findings
To examine whether US uncertainty shocks are important determinants of
stock market interdependence, we calculate the Granger Causality or block
exogeneity Wald test with the corresponding null hypothesis that all lags of the VIX
and EPU variables can be excluded from each equation in the VAR system. Table 5
reports the corresponding Chi-square test statistics and p-values in parentheses. Two
key findings emerge as discussed below.
First, US EPU can explain spillovers received for the majority of equity
markets in our sample. This finding implies that policy uncertainty in the US causes
increasing spillovers across international stock markets. The Chinese and Indian stock
Note: Reported are the pairwise correlation coefficients between the time-varying spillover of stock returns received by each country and the VIX and EPU indices.
Table 5. Granger Causality Tests Results
Country VIX EPU
THA 7.512 (0.482) 18.403*** (0.018)
MYS 1.609 (0.900) 10.920** (0.053)
IDN 1.117 (0.891) 7.018 (0.134)
PHL 2.813 (0.589) 8.765* (0.067)
IND 6.642 (0.355) 2.392 (0.880)
CHN 3.396 (0.493) 1.799 (0.772)
TAI 5.622 (0.584) 13.277* (0.065)
KOR 8.267 (0.689) 15.780 (0.149)
JPN 14.327** (0.026) 13.137** (0.0409)
HKG 9.816* (0.080) 15.816*** (0.007)
AUS 4.549 (0.473) 9.613* (0.087)
GER 10.067* (0.073) 11.983** (0.035)
FRA 14.077*** (0.015) 16.248*** (0.006)
UK 11.924** (0.035) 11.929** (0.035)
US 10.238* (0.068) 8.906 (0.112)
Note: Reported are the Chi-square test statistics associated with the Block exogeneity Wald test with the corresponding null hypothesis that all lags of the EPU and VIX can
be excluded from each equation in the VAR system. The corresponding p-values are reported in parentheses and *,**,*** denotes statistical significance at the 10, 5, and 1
percent levels respectively.
28
Appendix A
Figure A1. Net Return Spillovers By Country
29
Figure A2. Net Volatility Spillovers By Country
30
Figure A3. Directional Return Spillovers Received by Country
31
Figure A4. Directional Return Spillovers Transmitted by Country
32
Figure A5. Directional Volatility Spillovers Received by Country
33
Figure A6. Directional Volatility Spillovers Transmitted by Country