30
NO COUNTRY LEFT BEHIND (NCLB) NACC STRATEGY Victor Hernandez RO ATM/SAR ASBU Implementation Workshop for the NAM/CAR Regions Mexico City, Mexico, 22 – 26 August 2016

NO COUNTRY LEFT BEHIND (NCLB) NACC STRATEGY
Victor HernandezRO ATM/SARASBU Implementation Workshop for the NAM/CAR Regions Mexico City, Mexico, 22 – 26 August 2016

OutlineThe NACC NCLB Strategy
Implementation of NACC NCLB Strategy
Implementation status, projects and challenges

NACC NCLB Strategy
http://www.icao.int/about‐icao/NCLB/Pages/default.aspx

The ICAO No Country Left Behind (NCLB) Strategy
Initiated on February 2015 in response to the ICAO NCLB Campaign
Assist States in implementing ICAO Standards
and Recommended
Practices (SARPs)
Also promote ICAO’s efforts to
resolve Significant
Safety Concerns (SSCs)
Allow States to benefit from the socio‐economic
contributions of safe and reliable air transport

Performance management Commitment of high level management
Systemic assistance programme to NAM/CAR States
Effective implementation of ICAO SARPS
Strategic planning, objectives, priorities
Data analysis, Risk Management
Results oriented
Development and implementation of tailored Projects / Corrective action plan based on States needs
Participation of all stakeholders
Project Management
Continuous monitoring
ISO 9001:2015
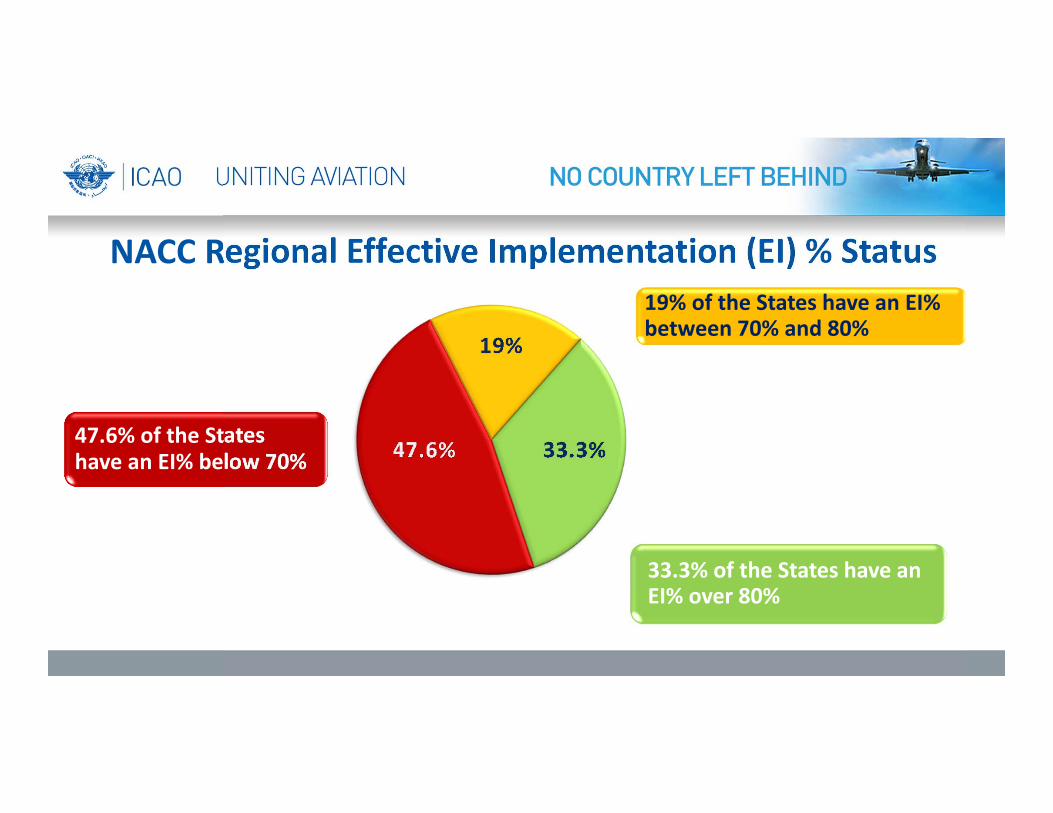
NACC Regional Effective Implementation (EI) % Status
47.6% of the States have an EI% below 70%
19% of the States have an EI% between 70% and 80%
33.3% of the States have an EI% over 80%

4 Phases of the NACC NCLB StrategyI
Senior Management commitment
Establish of Assistance MethodologyEvolution of Internal and External organizational cultureRD Accountability To Foster Political Will
IIIntelligence gathering
and analysis
Sending Data ‐ USOAP‐CMA, GANDD, PoS, RPBANIP, etc.
Teleconferences NACC Office & CAA Tech Teams
Actualization of States closed/open PQs etc.
IIIImplementation
NCLB Multidisciplinary TEAM visit – in situ Verification of PQ resolutions
Develop joint NACC‐CAA Action / implementation Plan
Strategic coordination of priorities between RD and DG (on‐going)
IVMeasuring & Monitoring
Monthly Teleconference NACC & CAA Tech teams
Quarterly Video Brief to RD & DG/Minister
Biannual Implementation Progress Review

NCLB Goals and Outcomes
Short Term (expected outcome)
Year 1 –Development, initiation and
validation of the ICAO NACC NCLB
Strategy
Medium Term(expected outcome)
Year 2 – all States at NACC NCLB
Phase IIand increase EI of at least 3 States to
80% +
Year 3 – all States at NACC NCLB
Phase IIIand
increase EI of at least 3 States to
80% +
Long Term(expected outcome)
Year 4 ‐ increase EIof at least 3 States
to 80% +GOAL: No more than 2 States
below 80% of EI

Progress on NACC EI

Tracking achievements and challengesSTATE PHASE I PHASE II PHASE III PHASE IV REMARKS
Bahamas X X TEAM Jun 2016 / CSA 4Q 2017Barbados X XBelize X X Off‐site Validation 4Q 2016Canada X XCosta Rica X X TEAM 2016 pendingCuba X XDominican Republic X XEl Salvador X X X X Off‐site Validation 3Q 2016Guatemala X X X TEAM May 2016Haiti X X X TEAM Sep 2015 completedHonduras X X X X TEAM 2015 completed / CSA 4Q 2016
Jamaica X X X X ICVM June 2016Mexico X X X X Off‐site Validation 4Q 2016Nicaragua X XTrinidad and Tobago X X X TEAM 2016 completed / ICVM 4Q 2017
United States X XEastern Caribbean Civil Aviation Authority / ECCAA (OECS; Antigua and Barbuda, Grenada, Saint Kitts and Nevis, Saint Lucia and Saint Vincent and the Grenadines)
X X
• Follow-up to USOAP and USAP audits• Implementation projects / corrective action plans• State’s Civil Aviation Authorities capacity building• SARPS, regulations and procedures• Training
Hand-holding assisting States

Projects & Stakeholders
StatesANSPs, ASPs &
OTHERs
Financial institutions
ICAO (ROs, ANB, ATB, LEB)
MARB, AUDITs
Regional Organizations
Projects
24/08/2016
• SAFETY OVERSIGHT PROJECT
• ANS PROJECT
• AGA PROJECT
• AVSEC PROJECT

NAM/CAR RPBANIPAir navigation Implementation
guidelinesOperational improvements (RPOs)ASBU (technologies)Develop under NCLB Strategy: Air Navigation Project(s) AGA Project
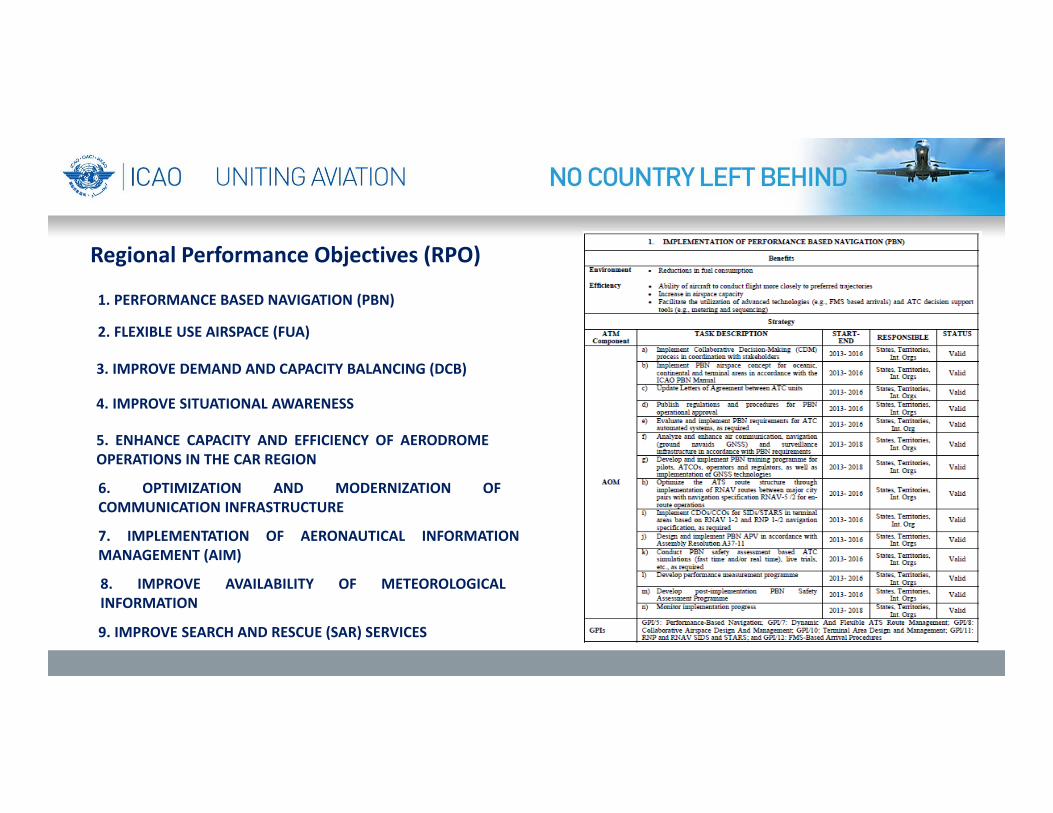
Regional Performance Objectives (RPO)
1. PERFORMANCE BASED NAVIGATION (PBN)
2. FLEXIBLE USE AIRSPACE (FUA)
3. IMPROVE DEMAND AND CAPACITY BALANCING (DCB)
4. IMPROVE SITUATIONAL AWARENESS
5. ENHANCE CAPACITY AND EFFICIENCY OF AERODROMEOPERATIONS IN THE CAR REGION
6. OPTIMIZATION AND MODERNIZATION OFCOMMUNICATION INFRASTRUCTURE
7. IMPLEMENTATION OF AERONAUTICAL INFORMATIONMANAGEMENT (AIM)
8. IMPROVE AVAILABILITY OF METEOROLOGICALINFORMATION
9. IMPROVE SEARCH AND RESCUE (SAR) SERVICES

ASBU
RPO
PIA1 Airport Operations PIA2
SWIM PIA3
Global Collaborative ATM PIA4
Trajectory-based Operations
B015 RSEQ
B0 65 APTA
B070 WAKE
B075 SURF
B0 80 ACDM
B025 FICE
B030 DAIM
B0105 AMET
B010 FRTO
B035 NOPS
B084 ASUR
B085 ASEP
B086 OPFL
B0101 ACAS
B102 SNET
B005 CDO
B020 CCO
B040 TBO
PBN Implementation X X X X FUA X DCB X X X X ATM Situational Awareness X X X X X Improve SAR Improve Cap/Efficiency Aerodrome Operations
X X
COM X X XAIM X MET X
RPO and ASBU Block 0 relationship

Implementation of NACC NCLBStrategy
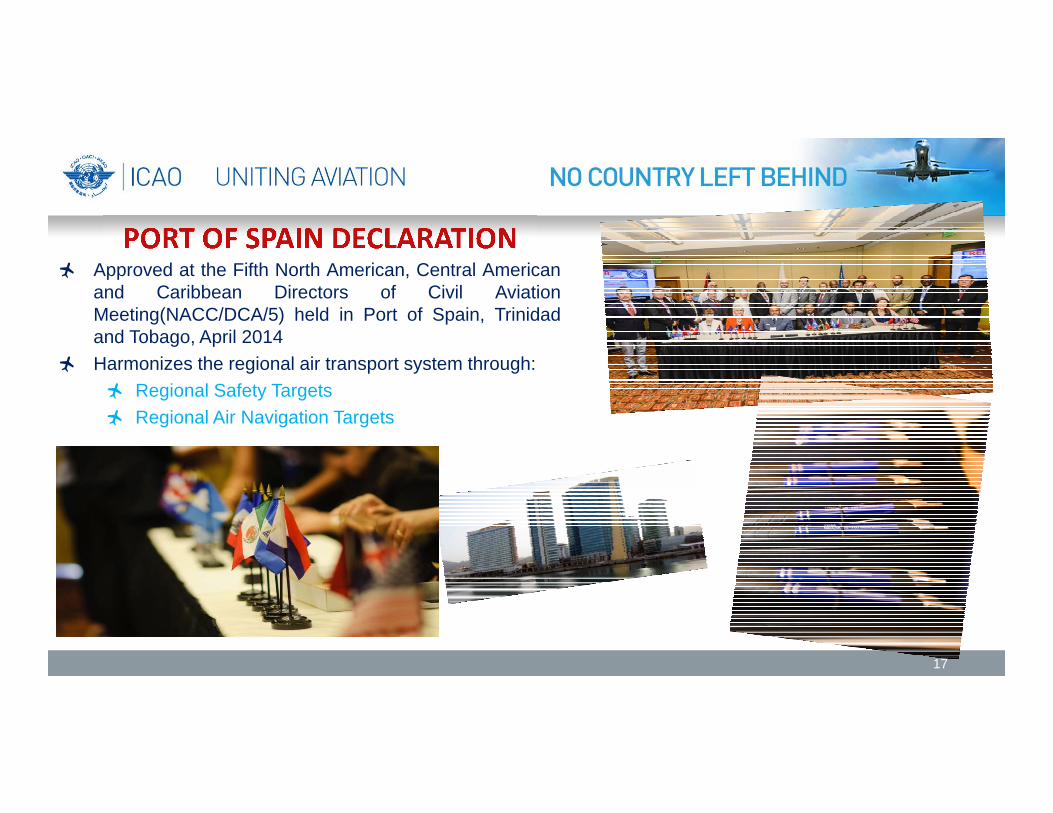
Approved at the Fifth North American, Central Americanand Caribbean Directors of Civil AviationMeeting(NACC/DCA/5) held in Port of Spain, Trinidadand Tobago, April 2014
Harmonizes the regional air transport system through: Regional Safety Targets Regional Air Navigation Targets
17

NAM/CAR Safety IndicatorsINDICATOR VALUE
State Safety Oversight ‐ Group AverageAverage USOAPOverall EI(% )
68.9%
State Safety Oversight ‐ State LevelsPercentage of States with USOAPOverall EI above 60%
61.9%
Significant Safety Concerns (SSCs)Number of SSCs
1
Accident RateNumber of accidents per mil. departures over preceding 5 years
3.11
IOSA ‐ AirlinesNumber of IOSA certified airlines in the region
58
IOSA ‐ State LevelsPercentage of States with IOSA certified airlines
52.38%
EU Safety ListNumber of States with restrictions
0
FAA IASANumber of States rated as Category 2
1

Regional Safety Targets1 Safety Oversight
• 80% Effective Implementation (EI) regional average by December 2016• No State in the Region to have EI of ICAO USOAP Critical Element 3 (CAA Staff) and Critical Element 4
(Inspector Competency) below 70% by December 2016
2 Accidents• Using 2010 as the baseline, reduce fatality risk for accidents in the CAR Region for Part 121 or like
commercial air transport operations by 50% by the year 2020
3 Runway Excursions• Reduce runway excursions by 20% relative to the 2007‐2012 regional average by December 2016
4 Aerodrome Certification• 48% of international aerodromes in the CAR Region to be certified by December 2016
5 State Safety Programme (SSP)/ Safety Management System (SMS) Implementation• 60% of States to have SSP ‐ Phase 1 implemented, service provider SMS safety performance indicators
accepted, and an initial Acceptable Level of Safety Performance (ALoSP) established by December 2016• 60% of service providers to have Phase 1 of their SMS implemented with a minimum of Reactive Phase
functional risk management procedures by December 2016
19

Regional Air Navigation Targets1 Approach ‐ Performance‐Based Navigation (PBN)
• 80% of instrument approach runways to have Approach Procedures with Vertical Guidance (APV) with Barometric Vertical Navigation (Baro VNAV) implemented by service providers and users by December 2016
2 Air Traffic Flow Management (ATFM)• 100% of Flight Information Regions (FIRs) within which all Area Control Centres (ACCs) to have ATFM
measures available by December 2018
3 Aeronautical Information Management Transition (AIM) • 100% of Aeronautical Information Services (AIS) to implement AIM Roadmap ‐ Phase I required elements
by December 2016 4 Ground‐Ground Digital Coordination/Transfer
• 50% of FIRs within which all applicable ACCs to have implemented at least one interface to use Air Traffic Services Inter‐Facility Data Communication (AIDC)/On‐Line Data Interchange (OLDI) with neighbouring ACCs by December 2016
5 Environmental Benefit• Reduce regional CO2 emissions by 40,000 tons per year through
PBN implementation by December 2016
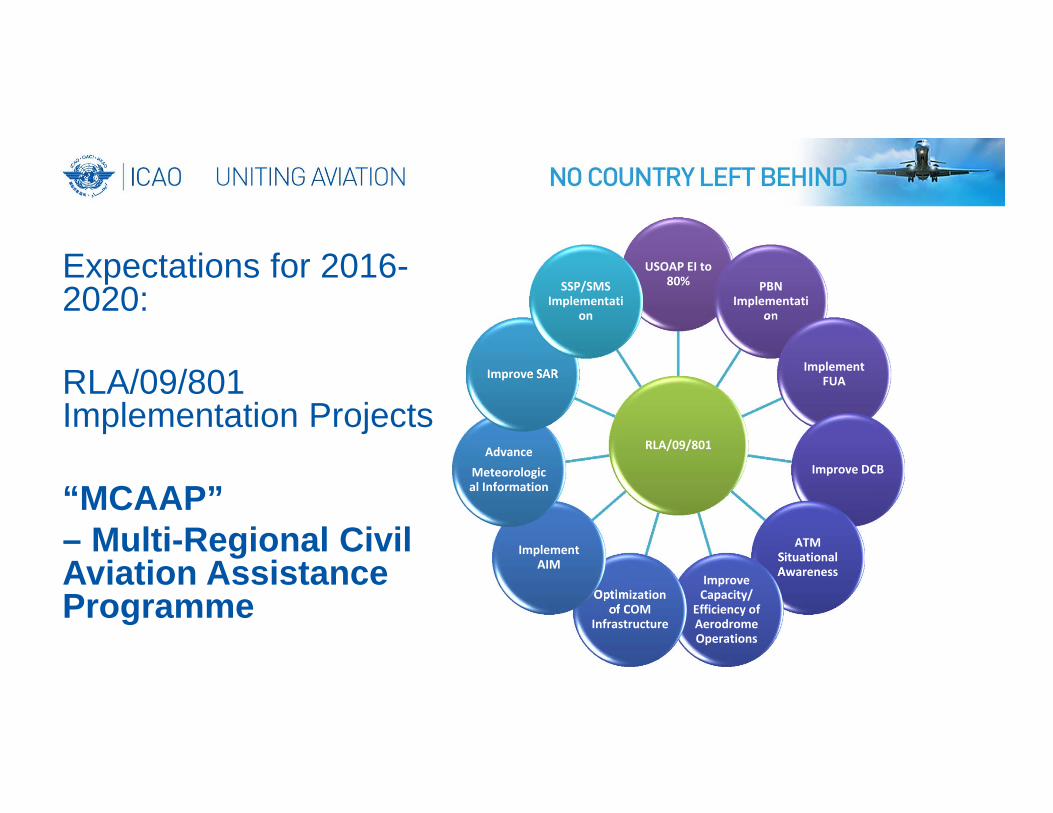
RLA/09/801
USOAP EI to 80% PBN
Implementation
Implement FUA
Improve DCB
ATM Situational AwarenessImprove
Capacity/ Efficiency of Aerodrome Operations
Optimization of COM
Infrastructure
Implement AIM
Advance Meteorological Information
Improve SAR
SSP/SMS Implementati
on
Expectations for 2016-2020:
RLA/09/801 Implementation Projects
“MCAAP” – Multi-Regional Civil Aviation Assistance Programme

Source: ICAO SPACE iSTARS 2.0
NACC Regional EI View by Critical Element (CE)

Source: ICAO SPACE iSTARS 2.0
NACC Regional EI View by Area

NAM/CAR USOAP ChallengeLEG ORG PEL OPS AIR AIG ANS AGA
CE‐1 42 6 14 46 19 3CE‐2 58 36 43 140 83 100 189CE‐3 36 21 30 16 83 351 47CE‐4 6 57 56 51 52 387 65CE‐5 13 3 18 61 155 289 63 131CE‐6 59 202 113 353 540CE‐7 43 68 44 261 235CE‐8 17 24 18 128 79 98
Protocol Questions (PQs) by Areaand Critical Element (CE):1. AGA / CE‐6: 540 (48% of States)2. ANS / CE‐4: 3873. AIG / CE‐5: 289
Number of States with open PQs byArea and CE
LEG ORG PEL OPS AIR AIG ANS AGA
CE‐1 16 6 13 19 10 3CE‐2 20 17 17 19 18 19 20CE‐3 14 7 10 8 18 17 17CE‐4 4 15 19 15 15 19 18CE‐5 12 3 7 14 19 21 14 19CE‐6 15 20 19 21 21CE‐7 16 18 16 21 19CE‐8 10 9 8 21 17 18
July 2016 NCLB 24

Outstanding priority “U” Deficienciesby field in the CAR Region
Outstanding Deficienciesin the CAR Region
Ene2013
Ene2015
Feb 2015 –Jun 2016
U 27 22 12
A 600 495 451
B 145 123 99
772 640 562
GANDD

CAR Aerodrome Certification status (Target 48% by Dec 2016)
CAR Region No of Aerodromes(Doc. 8733)
CertifiedAerodromes
Total of Certified
Aerodromes
Total of Aerodromes that may be certified (2016‐2019)
Aerodromes facing major challenge for
certification
Central America 13 2 1.4% 6 (4%) 5
CentralCaribbean
101 32 21.7% 67 (45%) 12
Eastern Caribbean 34 19 12.9% 15 (10%) 8
Total 149 53 36.0 % 88 (59%) 25

AVSEC Global average (USAP 2nd Cycle Audit by June 2013) Effective Implementation (EI) by CE: 69.30%AVSEC NACC average 2nd Cycle E.I. by CE: 60.83% vs Five States audited Sep2014‐Nov2015 CMA 81%
86.4478.37
85.01
66.6 64.9 62.2452.38
58.48
82.2373.43
81.25
56.08 54.849.55
40.3548.97
8693.33 92.57
80.79 78.98
65.6971.77
78.42
0102030405060708090
100
CE‐1Primary Aviation
Security Legislation
CE‐2Aviation SecurityProgrammes and
Regulations
CE‐3State AppropiateAuthority for
Aviation Securityand its
Responsibilities
CE‐4Personnel
qualifications andtraining
CE‐5Provision of
Technical Guidance,Tools and Security‐Critical Information
CE‐6Certification and
ApprovalObligations
CE‐7Quality ControlObligations
CE‐8Resolution of
Security Concerns
Global avge 69.30% NACC avge 60.83% USAP‐CMA Average

STATE “X” – PROJECT MANAGEMENT

Regional Safety Opportunities
Strengthen collaboration between ICAO, States, RSOOs, and Industry ‐ Oct 2105
Agreement for implementation of NACC NCLB Strategy ‐Mid 2016
Achieve aviation system effectiveness and benefits for each member State‐ Dec 2016
Transition from NCLB to future MCAAP – Jan 2017
With the strength of all, eliminate the challenges of each


![4/17/2013 9:28:31 AM Controller PIA3 ESD · Module-Defined AB:1756_AI6_Float:C:0 ... 1756-IF16 AI_11_05 [6] ... ESD PLC 1 Manual Constant No External Access: Read/Write](https://static.documents.pub/doc/80x56/5b0429757f8b9a41528c11e3/4172013-92831-am-controller-pia3-esd-ab1756ai6floatc0-1756-if16-ai1105.jpg)


