23
© G. A. Motter, 2006 & 2008 ECE 480 Six Sigma Overview & Introduction to Design for Six Sigma
© G. A. Motter, 2006 & 2008
ECE 480
Six Sigma Overview &
Introduction to
Design for Six Sigma

© G. A. Motter, 2006 & 2008
Six Sigma Companies
3M ADT Security Air Products
Allied Signal American Standard Americhem
Armstrong Armstrong World Industries Asahi Kasai
Astrazeneca AT&T Avery Denison
Avnet Bank of America BASF
Bayer BC Hydro Becton Dickenson
Black & Decker Boeing Bombardier
Boston Financial Services Calloway Golf Caterpillar
Celanese City Bank Chlorox
Conoco Corning Cott Beverages
Covenant Health Crompton Dannon
Decoma Degussa Dell
Delphi Deutsche Bank Dow Chemical
Dow Corning DuPont Eastman Chemical
Eastman Kodak Eaton Corp. Eli Lily
Emerson Energizer Florida Light & Power
Ford Fortis Health General Electric
General Motors Georgia Pacific Gillette
GlaxoSmithKline Goodrich Goodyear
Harley Davidson HP Hitachi

© G. A. Motter, 2006 & 2008
More Six Sigma Companies
Honeywell IBM Intel
ITT Industries ITW John Deere
Johns Manville Corp. Johnson & Johnson Kellogg
Kohler Corp. LG Chemical Lockheed Martin
Lord Lubrizol Maytag
Mckesson Moog Motorola
National Semiconductor NBC News NCR Corp.
Noranda Northrop Grumman Noveon
Omnova Solutions Owens Corning Phillips
Pitney Bowes PPG Industries Praxair
Raytheon Rogers Corp. Rhom & Haas
Royal Bank of Canada Saint-Gobain Samsung
SAS Inst. Scott Seeds Seagate Technologies
Sherwin Williams Siemens Silicon Graphics
Sony Sprint Square D
Schlumberger Sunbeam Swagelok
Timken Toyota Trane
Transfreight TRW US Filter
Visteon WR Grace Xerox

© G. A. Motter, 2006 & 2008
Six Sigma “Belts”
“Belt” Responsibilities
Master
Black Belt
• Develop and update training
materials
• Train Black Belts
• Mentor and Certify Black Belts
Black Belt • Execute Projects utilizing Six
Sigma
• Train Green Belts
Green
Belt
• Project Team Members under
Black Belt Leadership

© G. A. Motter, 2006 & 2008
Lecture Six Sigma ‘Tour’ Lecture Title
1 WOWing Customers with Six Sigma Products - DFSS
2Understanding the Customer’s Viewpoint - VOC
Homework Assignment
3 Quality Function Deployment (QFD) – Customer Driven Development
4Function Definition & Analysis – Powerful Problem Analysis Technique
Homework Assignment
5 Six Sigma Optimization - MAIC
© G. A. Motter, 2006 & 2008

© G. A. Motter, 2006 & 2008
WOWing Customers with Six
Sigma Products . . .
via Design for Six Sigma

© G. A. Motter, 2006 & 2008
DFSS Discussion
Objectives
• Define Quality, Defect, and Sigma Level
• Describe generic DFSS Process flow
• Highlight the DFSS Process with an example
• Explain “What’s different about DFSS” from
traditional Engineering Design approach?
© G. A. Motter, 2006 & 2008
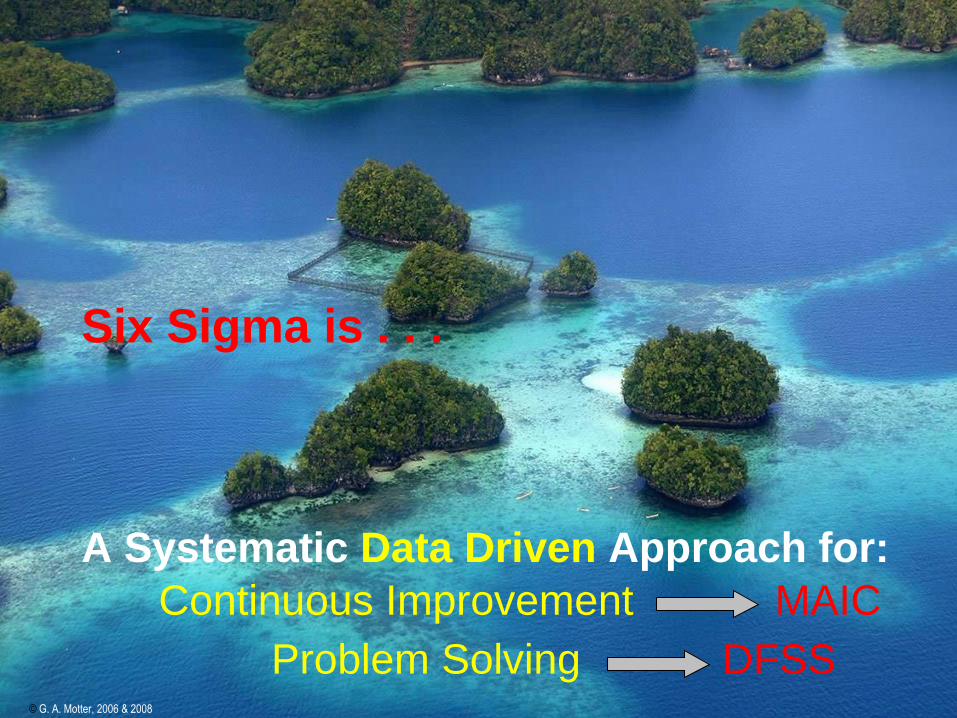
Six Sigma is . . .
A Systematic Data Driven Approach for:
© G. A. Motter, 2006 & 2008
Continuous Improvement MAIC
Problem Solving DFSS

© G. A. Motter, 2006 & 2008
Quality and Sigma Level Defined
• “Quality”: degree of excellence of a Product, Process, Software,
IT System, or Service . . . . from the Customer’s Viewpoint
• Every process has Variation. If the performance is too far from
target value (beyond a spec. limit), a Defect occurs
• Standard deviation is a measure of statistical variation (spread)
about the mean
• Sigma Level of a process is an indication of how often defects are
likely to occur
Sigma = Spec. Width / 2 (Std. Deviation)
© G. A. Motter, 2006 & 2008
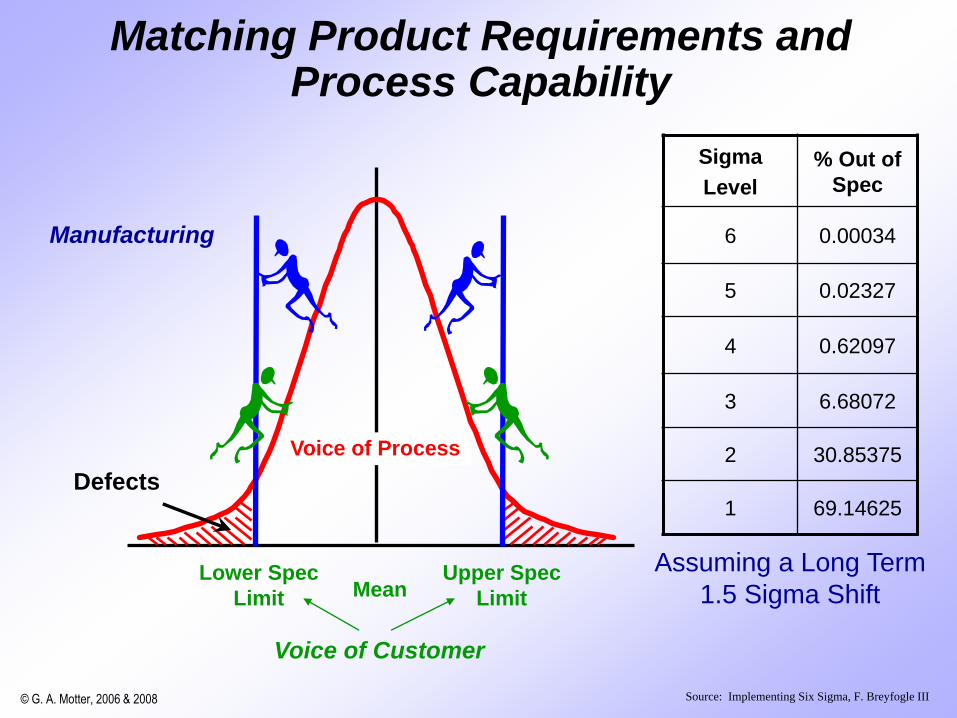
Matching Product Requirements and Process Capability
Sigma
Level
% Out of
Spec
6 0.00034
5 0.02327
4 0.62097
3 6.68072
2 30.85375
1 69.14625
Defects
Lower Spec
Limit
Upper Spec
Limit
Manufacturing
Voice of Customer
Voice of Process
Mean
Source: Implementing Six Sigma, F. Breyfogle III
Assuming a Long Term
1.5 Sigma Shift

© G. A. Motter, 2006 & 2008
Optimize or Design?Define
the Project
Product
Exist?
Top Bus.
Oppty?
Breakthru
Needed?
D
F
S
S
D
M
A
I
C
Yes
Yes
No
No
No
Std. Engin.
Design
No
Source: Six Sigma for Growth, E. Abramowich© G. A. Motter, 2006 & 2008

© G. A. Motter, 2006 & 2008
Define
the
Project
Identify
CCRs
• Charter
• Voice of Customer
• House of Quality Identify
Conceptual
Design
• Function Analysis
• Solution Selection Matrix
• Design Proposal
Build
Prototype
Analyze
Prototype
Perf.
Optimize
Design
• Proof-of-Concept
• Bread Board Circuit
• Discrete
Components
• Wire Wrap Board
• Collect data
• Statistically
Analyze Data
• Design Meet
CCRs?
• Surface Mount Chips
• Optimized Power
• PC Boards
• Manufacturability
• Robustness
Test &
Validate
Design • Collect Data
• Statistically Analyze Data
• Run Charts
Package
Design
Document
Design
• Survive Use
Environment
• Heat Management
• Shock & Vibration
• Final Report
• Sponsor Docs.
DFSS
Process Flow
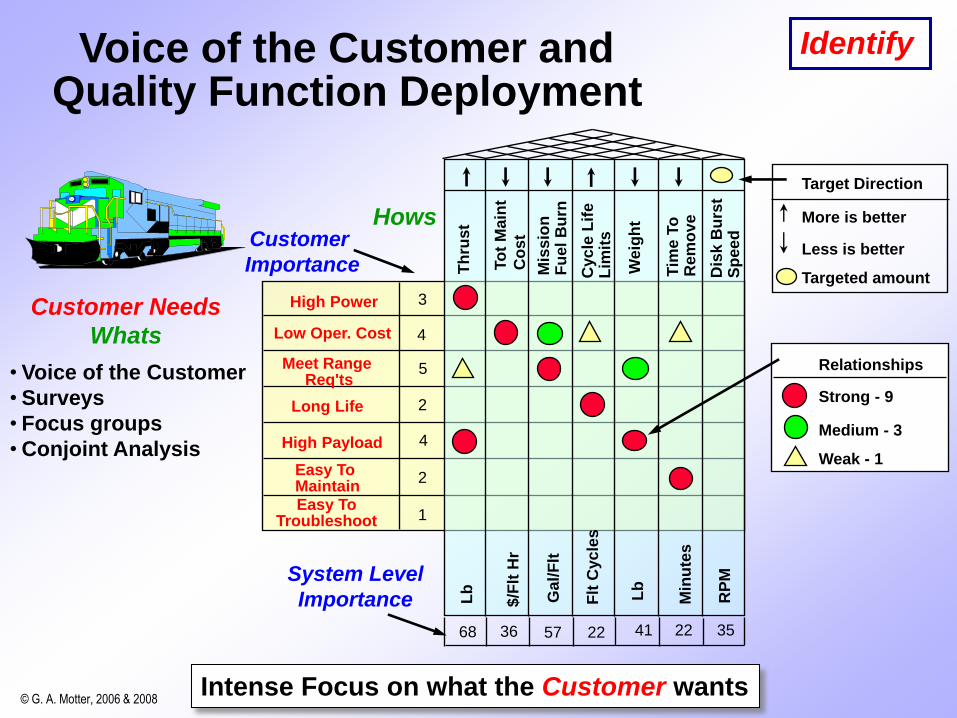
© G. A. Motter, 2006 & 2008Intense Focus on what the Customer wants
Relationships
Strong - 9
Medium - 3
Weak - 1
HowsCustomer
Importance
System Level
Importance
Th
rust
Weig
ht
To
t M
ain
t
Co
st
Mis
sio
n
Fu
el
Bu
rn
Cycle
Lif
eL
imit
s
Tim
e T
oR
em
ove
Dis
k B
urs
t S
peed
Lb
$/F
lt H
r
Gal/
Flt
Flt
Cycle
s
Lb
Min
ute
s
RP
M
Target Direction
More is better
Less is better
Targeted amount
1
4
5
3
2
4
2
3522573668 2241
Customer Needs
Whats
High Power
Low Oper. Cost
Meet Range Req'ts
Long Life
High Payload
Easy ToMaintainEasy To
Troubleshoot
• Voice of the Customer
• Surveys
• Focus groups
• Conjoint Analysis
IdentifyVoice of the Customer and Quality Function Deployment

© G. A. Motter, 2006 & 2008
Requirements ‘Flow Down’ from Customer
and Design Capabilities ‘Flow Up’
Subsystem Design
System Design
Assembly Design
Part Design
Customer
Source: Design for Six Sigma, C. Creveling

© G. A. Motter, 2006 & 2008
System Design
Locomotive
Platform Engine Generator Inverter TruckTraction
Coupler SanderControl Console
System
Subsystems
Assemblies
Parts
• Customers buy System Performance and Reliability
• Design Decisions are made at Subsystem, Assembly and Parts
• Systems engineering allows
– Flow Down of Customer Requirements to lower design levels
– Rational Design Decisions to achieve system-level goals
Design

© G. A. Motter, 2006 & 2008
Quantify relationships between CCRs & Design Parameters– First principles models
– Numerical models (finite elements, lumped parameter, …)
– Designed experiments (DOE)
– QFD
Design for Robust Performance
DOE Main Effects Plot
Octane Level Air Temp
X1
X2
Y = 50
9080
7060
Response Surface
Steep gradient,
high sensitivity
to variabilities
in X’s
Optimum
• Regression to obtain Transfer Function:
Y = f(X1, X2, X3) @ a0 + a1X1 + a2X2 + a3X3 + a4X1X2 + a5X1X3 + a6X2X3 + ...
2-Way InteractionsMain Effects
Capture knowledge in Transfer Function libraries & design templates
Optimize

© G. A. Motter, 2006 & 2008
Statistical vs Deterministic Design:Switching Power Supply Example
Baseline design
• Isolated switching converter/
feedback section
• Low cost, combine power MOSFET
and control circuit in a 3-pin package
R2
R1CTRL
Vo
PWM IC
OPTO
Vref
Ib
••
R1
Input
Filter
Isolated Switching
Converter
Feedback
Vo = 5 Vdc, +/- 5%Vin = 85 - 275 Vac
System Requirements:• Vin: 85 - 275 V
• Vo: 5 V, +/- 5%
• 6s quality
• Low cost
© G. A. Motter, 2006 & 2008
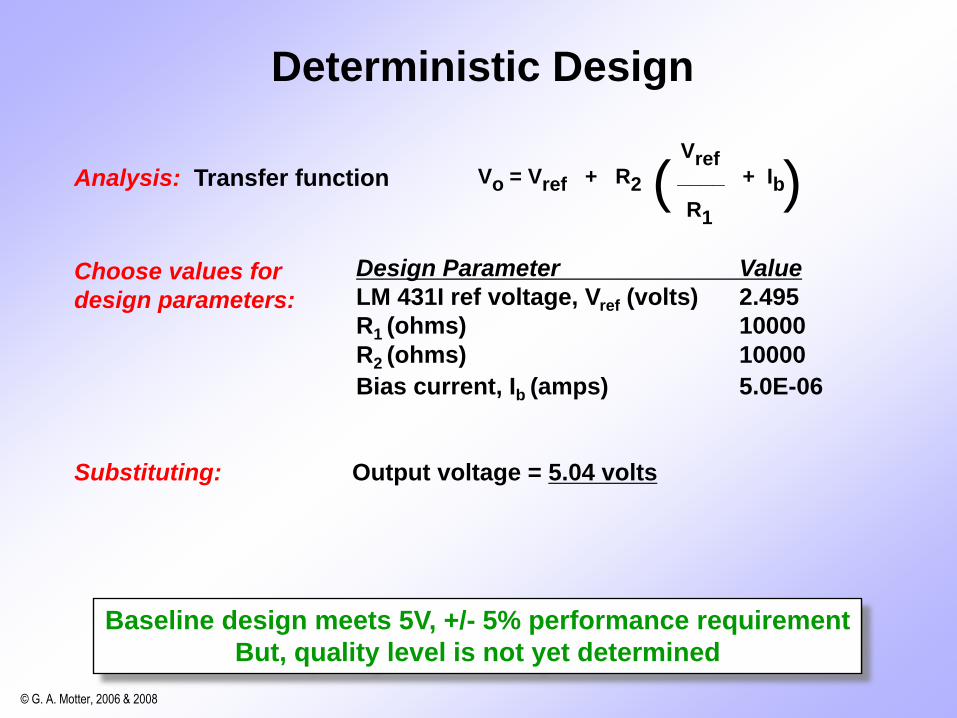
Deterministic Design
Analysis: Transfer function
Choose values for
design parameters:
Substituting: Output voltage = 5.04 volts
Baseline design meets 5V, +/- 5% performance requirement
But, quality level is not yet determined
Design Parameter Value
LM 431I ref voltage, Vref (volts) 2.495
R1 (ohms) 10000
R2 (ohms) 10000
Bias current, Ib (amps) 5.0E-06
Vref Vo = Vref + R2 ____ + Ib
R1
( )

© G. A. Motter, 2006 & 2008
Statistical Design
Design Parameter Mean Std Dev Tolerances
Lower Upper
LM 431I Vref (volts) 2.495 0.0283 0.085 0.085
R1 (ohms) 10000 33.3333 1% 1%
R2 (ohms) 10000 33.3333 1% 1%
Bias current, Ib (amps) 5.0E-06 1.15E-06 2.00E-06 2.00E-06
Analysis: Transfer Function
Design parameters are statistical.
Engineer selects mean values and a
measure of variability (e.g., standard
deviation, based on component
tolerance).
Baseline design meets 5V, +/- 5% performance
But quality level is only 5s
Do a statistical analysis (e.g., Monte
Carlo), using Transfer Function and
statistical parameter values
Results:• Vo mean 5.04 volts
• Vo std dev 0.059 volts
• Defects/million 188 (5.06s)
Vref Vo = Vref + R2 ____ + Ib
R1
( )
Volts4.75 4.875 5.00 5.125 5.25
.000
.009
.017
.026
.035
Pro
bab
ilit
y
© G. A. Motter, 2006 & 2008
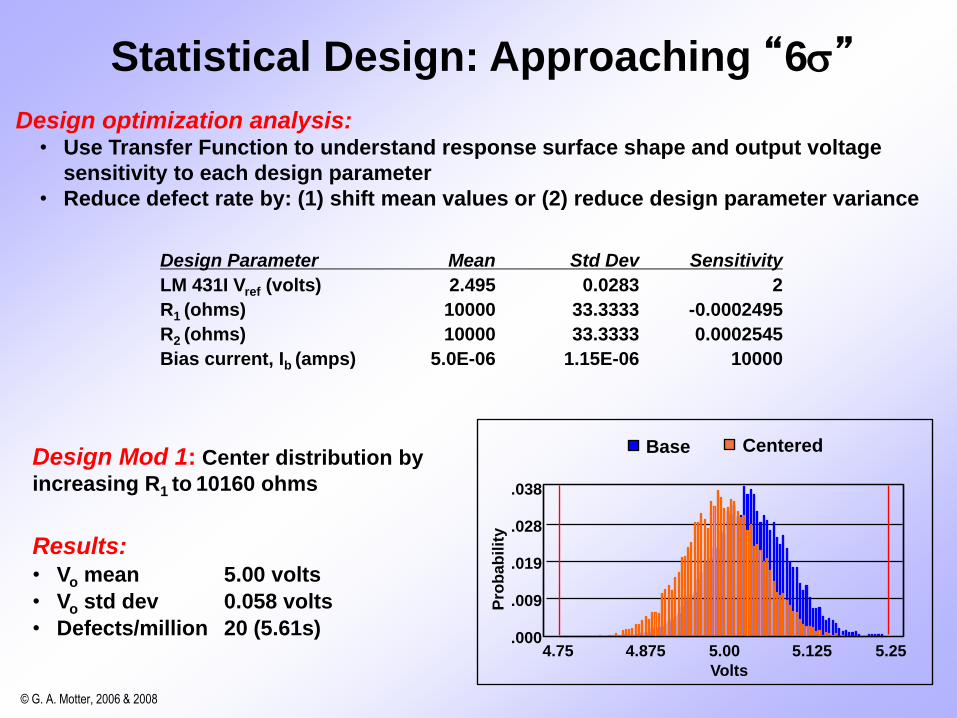
Design optimization analysis:• Use Transfer Function to understand response surface shape and output voltage
sensitivity to each design parameter
• Reduce defect rate by: (1) shift mean values or (2) reduce design parameter variance
Statistical Design: Approaching “6s”
Design Parameter Mean Std Dev Sensitivity
LM 431I Vref (volts) 2.495 0.0283 2
R1 (ohms) 10000 33.3333 -0.0002495
R2 (ohms) 10000 33.3333 0.0002545
Bias current, Ib (amps) 5.0E-06 1.15E-06 10000
Design Mod 1: Center distribution by
increasing R1 to 10160 ohms
Results:• Vo mean 5.00 volts
• Vo std dev 0.058 volts
• Defects/million 20 (5.61s)4.75 4.875 5.00 5.125 5.25
Base Centered
.000
.009
.019
.028
.038
Volts
Pro
bab
ilit
y

© G. A. Motter, 2006 & 2008
Statistical Design: Reaching “6s”
Design Mod 2: Mod 1 plus reduce
variance by using 0.1% resistors
Design Mod 3: Mod 2 plus LM 431AI
MOSFET to reduce Vref variance
Summary
Statistical design enables prediction of performance,
quality and cost during the design process
4.75 4.875 5.00 5.125 5.25
Base 0.1% Resistors MOSFET Upgrade
.000
.012
.025
.037
.050
Volts
Pro
bab
ilit
y
Centered 0.1% Resistors
.000
.009
.019
.028
.038
4.75 4.875 5.00 5.125 5.25
Volts
Pro
bab
ilit
y
Mean Std Dev DPMO ZST Cost
Baseline Design 5.04 0.059 189 5.06 100%
Mod 1: Centered via R1
5.00 0.058 20 5.61 100%
5.00 0.057 13 5.7 101%
Mod 3: LM 431AI 5.00 0.041 ~0 7.58 105%
Mod 2: 0.1% Resistors

© G. A. Motter, 2006 & 2008
What’s Different About DFSS?
• Disciplined, comprehensive process applicable to all Designs
• “Line of Sight” from Customer Needs to all System Design levels
• Statistical design to understand . . . and reduce Variation
• “New” tools: QFD, Function Analysis, TRIZ, DOE, DFM,
statistical tolerance, Robust Design, multi-variable optimizations
• Quality prediction throughout development
• Dedicated Team can develop a Breakthrough Design in months
But, does not replace need for sound
Engineering Judgment

© G. A. Motter, 2006 & 2008
Questions
&
Discussion


