30
June 2013

June 2013
Color
Scheme
162 216 255
80 30 140
77 77 79
137 216 65
0 51 102
227 25 50
150 150 150
0 102 204
2
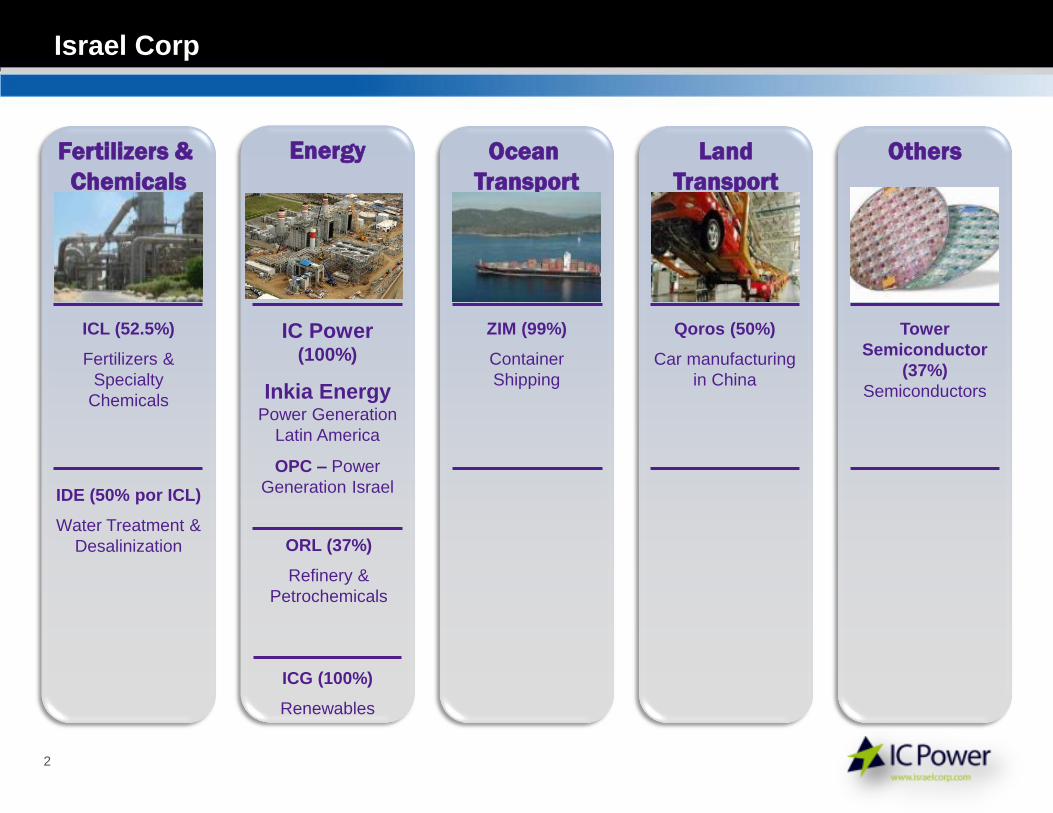
Israel Corp
Energy
ORL (37%)
Refinery &
Petrochemicals
IC Power (100%)
Inkia Energy
Power Generation
Latin America
OPC – Power
Generation Israel
ICG (100%)
Renewables
Fertilizers &
Chemicals
IDE (50% por ICL)
Water Treatment &
Desalinization
ICL (52.5%)
Fertilizers &
Specialty
Chemicals
Ocean
Transport
ZIM (99%)
Container
Shipping
Others
Tower
Semiconductor
(37%)
Semiconductors
Land
Transport
Qoros (50%)
Car manufacturing
in China

Overview of IC Power

Color
Scheme
162 216 255
80 30 140
77 77 79
137 216 65
0 51 102
227 25 50
150 150 150
0 102 204
4
IC Power
* Under construction
OPC Rotem *
440 MW
Ownership: 80%
Israel
Nejapa
140 MW
Ownership: 71%
El Salvador
Cardones
155 MW
Ownershp:75%
Chile
Kallpa
870 MW
Ownership: 75%
Cerro del Aguila*
510 MW
Ownership: 75%
EDEGEL
1,668 MW
Ownership: 21%
Peru
COBEE
229 MW
Ownership: 100%
Bolivia
JPPC
58 MW
Ownership: 16%
Jamaica
CEPP
67 MW
Ownership: 97%
Dominican Rep.
Pedregal
54 MW
Ownership: 21%
Panama
TOTAL: 4,191 MW

Color
Scheme
162 216 255
80 30 140
77 77 79
137 216 65
0 51 102
227 25 50
150 150 150
0 102 204
5
Shareholder Structure
80%
74.9% 21% 100% 97% 21.2% 15.6% 71%
Peru Jamaica Panama Bolivia Peru Rep.
Dominicana El Salvador
Israel
1,668 MW 68 MW 54 MW 229 MW 870 MW 67 MW 140 MW
440 MW
100%
Chile
155 MW
86.6%
100%
74.9%
Peru
510 MW
SCPP

Color
Scheme
162 216 255
80 30 140
77 77 79
137 216 65
0 51 102
227 25 50
150 150 150
0 102 204
6
1. Includes projects under construction
2007 2006 2008
Kallpa II
2009
Israel Corp.
Strategic Decision
to Acquire Inkia
2012 2010 2011 2013 2014 2015 2016
Kallpa I
Kallpa III
Kallpa CCGT
OPC
Edegel
holding
increase
Cerro del Aguila
All projects completed
ON deadline and
BELOW budget
4,000+ MW 2,200 MW 3,500 MW
Project Development and Finance
Tierra
Amarilla
Chile
Inkia
$88m local bond
Inkia
$300m intl’ bond
Kallpa
$55m lease
Kallpa
$68m lease Kallpa
$75m lease
Kallpa
$277m Cerro del Aguila
$591m club deal Cardones $60m
local loan
OPC
$480m loan
FX
Swap
FX
Swap
2002
SCPP
$50m
Acquisiton
bonds
Libor
Swaps
TOTAL INVESTMENT POST-ACQUISITION: ~$2.2bn1

Peru - Kallpa

Color
Scheme
162 216 255
80 30 140
77 77 79
137 216 65
0 51 102
227 25 50
150 150 150
0 102 204
8
Kallpa

Color
Scheme
162 216 255
80 30 140
77 77 79
137 216 65
0 51 102
227 25 50
150 150 150
0 102 204
9
Kallpa
Color
Scheme
162 216 255
80 30 140
77 77 79
137 216 65
0 51 102
227 25 50
150 150 150
0 102 204
10
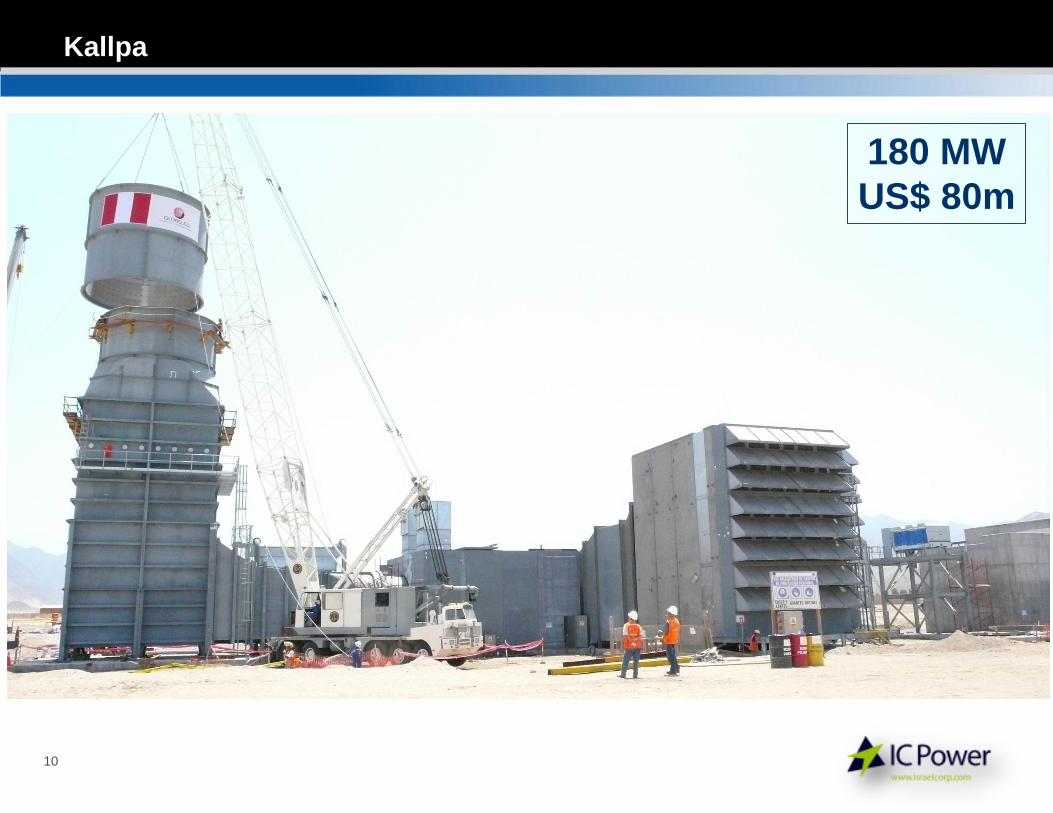
Kallpa
180 MW
US$ 80m

Color
Scheme
162 216 255
80 30 140
77 77 79
137 216 65
0 51 102
227 25 50
150 150 150
0 102 204
11
Kallpa
374 MW
US$170m

Color
Scheme
162 216 255
80 30 140
77 77 79
137 216 65
0 51 102
227 25 50
150 150 150
0 102 204
12
Kallpa

Color
Scheme
162 216 255
80 30 140
77 77 79
137 216 65
0 51 102
227 25 50
150 150 150
0 102 204
13
Kallpa
870 MW
US$670m
Largest power plant in Peru

Color
Scheme
162 216 255
80 30 140
77 77 79
137 216 65
0 51 102
227 25 50
150 150 150
0 102 204
14
Combined Cycle Financing
3 Kallpa Leasings
$200 m
Bonds
US$172m
Loan Syndication
$105 m
2008 2009
EPC Cost
Finance
Cost
ROPPIA
AAA
Defferred disbursements
Not deep enough
Last day pricing
Difficult syndication
Certain flexibility
Scotia, BCP, Cofide, DEG
Existing Structure
3 Leasings
Citi, BCP, Scotia
2 units in operation,
1 unit under construction
Financial Crisis
3 Kallpa Leasings
$200 m
Bonds
US$172m
Loan Syndication
$105m
25% Equity
Pension Funds
vs.
Quimpac

Color
Scheme
162 216 255
80 30 140
77 77 79
137 216 65
0 51 102
227 25 50
150 150 150
0 102 204
15
EBITDA (US$ m)
$5
$12
$24
$48
$61
$92
21%
22%
25%25%
33%
0%
5%
10%
15%
20%
25%
30%
35%
$0
$10
$20
$30
$40
$50
$60
$70
$80
$90
$100
2007 2008 2009 2010 2011 2012
Kallpa: Strong cash flow generation
Kallpa I
operational
in July
Kallpa II
operational
in June
Kallpa III
operational
in March
Kallpa CC
operational in
August
EB
ITD
A M
arg
in
EB
ITD
A

Israel – OPC Rotem

Color
Scheme
162 216 255
80 30 140
77 77 79
137 216 65
0 51 102
227 25 50
150 150 150
0 102 204
17
OPC Rotem
440 MW
US$550m
First IPP in Israel

Color
Scheme
162 216 255
80 30 140
77 77 79
137 216 65
0 51 102
227 25 50
150 150 150
0 102 204
18
OPC Rotem
Syndicated Loan
Loan Amount: US$ 482 million
Leverage: 85%
Lenders:
Bank Leumi
Clal Insurance Co.
Hafenix Insruance Co.
Harel Insurance Co.
Amitim Pension Fund
Term of Loan : 18 years
Fixed Rate: 4.9% - 5.4%

Peru – Cerro del Aguila

Color
Scheme
162 216 255
80 30 140
77 77 79
137 216 65
0 51 102
227 25 50
150 150 150
0 102 204
20
Cerro del Aguila
Cerro del Aguila

Color
Scheme
162 216 255
80 30 140
77 77 79
137 216 65
0 51 102
227 25 50
150 150 150
0 102 204
21
Underground Powerhouse
1,200 msnm
6km
Tunnel
Dam
1,500 msnm
76m
264m
Cerro del Aguila
510 MW
US$ 910m
Largest Power Project in 40 years

Color
Scheme
162 216 255
80 30 140
77 77 79
137 216 65
0 51 102
227 25 50
150 150 150
0 102 204
22
Cerro del Aguila
Color
Scheme
162 216 255
80 30 140
77 77 79
137 216 65
0 51 102
227 25 50
150 150 150
0 102 204
23
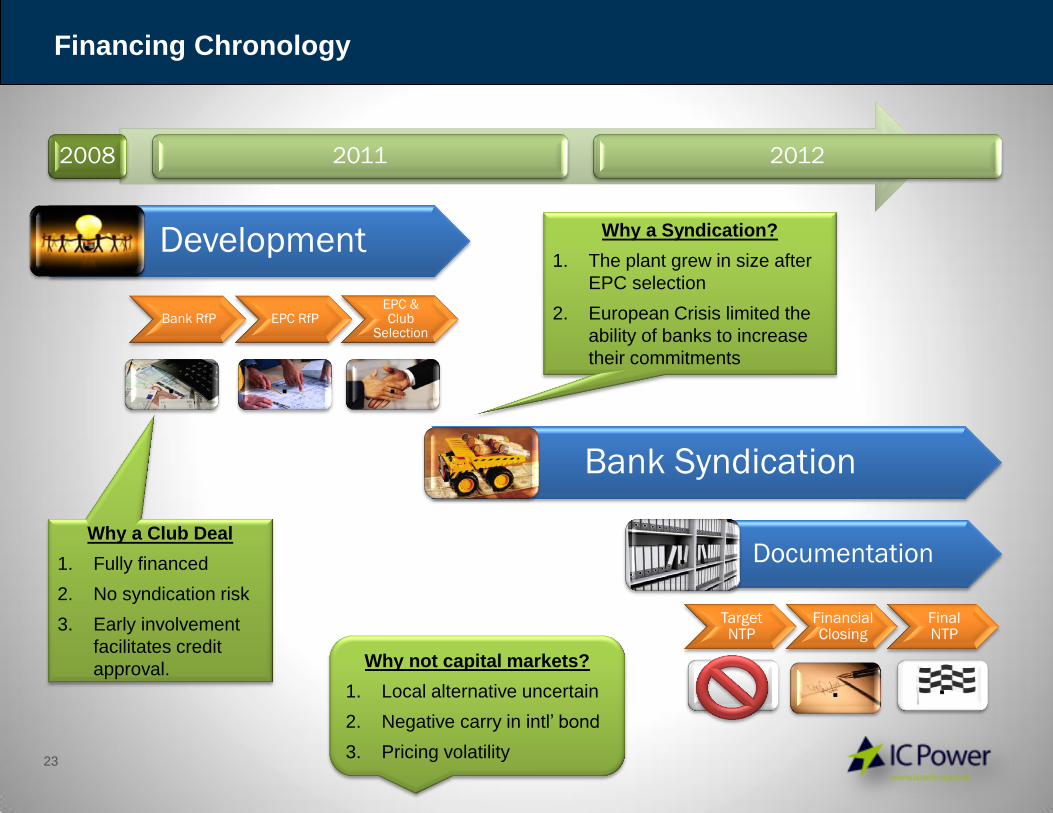
Financing Chronology
Development
2008 2011 2012
Target NTP
Financial Closing
Final NTP
Bank Syndication
Bank RfP EPC RfP EPC & Club
Selection
Documentation
.
. . .
.
.
. .
Why a Syndication?
1. The plant grew in size after
EPC selection
2. European Crisis limited the
ability of banks to increase
their commitments
Why a Club Deal
1. Fully financed
2. No syndication risk
3. Early involvement
facilitates credit
approval. Why not capital markets?
1. Local alternative uncertain
2. Negative carry in intl’ bond
3. Pricing volatility

Color
Scheme
162 216 255
80 30 140
77 77 79
137 216 65
0 51 102
227 25 50
150 150 150
0 102 204
24
Bank Map
Commitments
US$m Previous
Relationship
HSBC 74 IC
Scotia Capital 70 $
FMO 35*
BCP 67 $
SMBC/SACE 65
Cofide 65 $
BBVA 60
Interbank 30*
Societé Generale 50
Intesa 45
DEG 30 $
TOTAL 591
(*) Same amount fuded by Cofide
Drop-outs
Credit Agricole
Bancolombia
Supportive
IFC
IDB
CAF
Barclays
DNB Nord
Timed-out
West LB

Color
Scheme
162 216 255
80 30 140
77 77 79
137 216 65
0 51 102
227 25 50
150 150 150
0 102 204
25
Financing Nations
$591m HSBC SACE
November 2011
IC POWER Financial Performance

Color
Scheme
162 216 255
80 30 140
77 77 79
137 216 65
0 51 102
227 25 50
150 150 150
0 102 204
27
IC POWER Financial Performance
70
100
129
170
198
2008 2009 2010 2011 2012
Annual Proportional EBITDA (MUSD)
70
100
129
170
198
400+
2008 2009 2010 2011 2012 2016

November 2011
Closing Discussion Points

Color
Scheme
162 216 255
80 30 140
77 77 79
137 216 65
0 51 102
227 25 50
150 150 150
0 102 204
29
Ad-hoc
Financing
Project
financing vs.
Corporate
risk?
Local bond
markets aren’t
deep enough
International
Project
Bonds?
Negative carry
on construction
Basel III:
Lower bank
participation
Club deal vs.
syndicated loan
Smaller
projects?

Color
Scheme
162 216 255
80 30 140
77 77 79
137 216 65
0 51 102
227 25 50
150 150 150
0 102 204
30
Gracias


![collisions using iSALE 102 10 100 102 101 100 10 102 101 a- 100 10 0.0 s 200 400 600 Temperature [ C] 180 150 120 90 60 30 180 150 — 120 90 60 30 180 150 120 90 60 30 1m 100 50 -50](https://static.documents.pub/doc/80x56/5ce27be888c993ab258be677/impactwikiisalecpluginplanetesimal-collisions-using-isale-102-10-100-102.jpg)


