NOAA Technical Memorandum NWS HYDR0-20 STORM TIDE FREQUENCY ANALYSIS FOR THE GULF COAST OF FLORIDA FROM CAPE SAN BLAS TO ST. PETERSBURG BEACH Francis P. Ho and Robert J. Tracey Office of Hydrology Silver Spring, Md. April 1975 UNITED STATES /NATIONAL OCEANIC AND / National Weather DEPARTMENT OF COMMERCE ATMOSPHERIC ADMINISTRATION Service Frederick B. Dent, Secretar1 Robert M. White, Administrator George P, Cressman, Director
Transcript
NOAA Technical Memorandum NWS HYDR0-20
STORM TIDE FREQUENCY ANALYSIS
FOR THE GULF COAST OF FLORIDA
FROM CAPE SAN BLAS TO ST. PETERSBURG BEACH
Francis P. Ho and Robert J. Tracey
Office of Hydrology Silver Spring, Md. April 1975
UNITED STATES /NATIONAL OCEANIC AND / National Weather DEPARTMENT OF COMMERCE ATMOSPHERIC ADMINISTRATION Service Frederick B. Dent, Secretar1 Robert M. White, Administrator George P, Cressman, Director
1.
2.
3.
4.
5.
CONTENTS
Introduction. • • • • • • •
1.1 Objective and scope •• 1.2 Authorization •• 1.3 Study method ••
Summary of historical hurricanes ••
2.1 Hurricane tracks 2.2 Historical notes
Climatology of hurricane characteristics.
3.1 Frequency of hurricane tracks •••. 3.2 Probability distribution of hurricane intensity. 3.3 Probability distribution of radius of maximum winds. 3.4 Probability distribution of speed and direction of
forward motion • . • • • • • • • •
Hurricane surge • • • •
4.1 Surge model ••• 4.2 Shoaling factor ••
Tide frequency analysis by joint probability method •
5.1 The joint probability method • 5.2 Astronomical tides ••••••
5.2.2 Astronomical tide • • • •.• 5.3 Prestorm water level ••••••. 5.4 Tide frequencies • • • • . • ••• 5.5 Adjustment along coast ••••••.•••.•••. 5.6 Comparison of frequency curves with observed tides
and high-water marks • • • • • • • • • • • . 5.7 Relation of this report to disaster planning . Table 7. Hurricane high-water marks reported and
estimated at Cedar Key , Fla • • . • • • . 5.8 Coordination •••••••••.•••.
Appendix ••
References •
Figures
i
. . . .
1
1 1 2
2
2 3
8
8 8 9
9
9
9 10
10
10 11 11 12 13 14 15 16 17 19 19 19 19
20 20
21 22 23
24
26
STORM TIDE FREQUENCY ANALYSIS FOR THE GULF COAST OF FLORIDA, FROM CAPE SAN BLAS TO ST. PETERSBURG BEACH
A report on work for the Federal Insurance Administration, Department of Housing and Urban Development by National Oceanic and Atmospheric Administration, Department of Commerce.
ABSTRACT
Storm tide height frequency distributions are developed on the Gulf coast of Florida from Cape San Blas to St. Petersburg Beach for the National Flood Insurance program by computing storm tides from a full set of climatologically representative hurricanes, using the National Weather Service hydrodynamic storm surge model. Tide levels are shown in coastal profile between annual frequencies of 0.10 and .002. This report is intended for use in estimating actuarial risk to buildings from coastal floods and in land use management.
1. INTRODUCTION
1.1 Objective and Scope
The Federal Insurance Administration- (FIA), Department of Housing and Urban Development (HUD), requested the National Oceanic and Atmospheric Administration (NOAA) to study flood levels from storm tides on the coast of Florida from Cape San Blas to St. Petersburg Beach. This includes the coast of Franklin, Wakulla, Jefferson, Taylor, Dixie, Levy, Citrus, Hernando, Pasco, and Pinellas Counties. The assignment is limited to determining storm tide frequencies at the open coast on a common regional basis. Modifications of storm tide levels in bays and estuaries and over land are not included. These modifications have to be assessed by separate investigations, using the present study as a baseline.
The tide frequencies are of still water levels that would be measured in a stilling well or tide gage house excluding wave action. The destructive effects of waves on the beach front must be taken into account separately.
1.2 Authorization
The National Flood Insurance Act of 1968, Title XIII, Public Law 90-448, enacted August 1, 1968, authorizes and directs the Secretary of Housing and Urban Development to establish and carry out a National Flood Insurance Program. The Secretary is authorized to secure the assistance of other Federal Departments on a reimbursement basis in assessing flood frequencies. Authorization for this particular study is Project Order No. 6, dated May 2, 1973, under Agreement No. IAA-H-5-73 between the Federal Insurance Administration and NOAA.
2
1.3 Study Method
The technique used in the tide frequency analysis is basically the same as that developed earlier for the New Jersey coast [1] and applied to Long Beach Island and adjoining mainland of Ocean County, New Jersey [2]. Updates and revisions from the 1970 procedure are explained in a recent report [3].
First, the behavior of hurricanes along the coast was assessed from past records. Factors analyzed included depression of the atmospheric pressure at the storm center below the surrounding value, forward speed and direction of motion of the storm, and distance from the storm center to the band of maximum winds. All these factors relate to a storm's potential to produce high tides.
The second step in the tide frequency analysis is to calculate the coastal tide levels that each of a number of hypothetical but representative hurricanes, from various combinations of the hurricane parameters, would produce. For this a dynamic calculation method is used that has been demonstrated to reproduce observed storm tides of past hurricanes within acceptable tolerances.
Finally, the computed storm surges were combined with the astronomical tide variation by using a joint probability method to obtain a frequency distribution of the resulting total tide.
Tide frequencies were computed at several selected points on the coast of the study area. Frequency profiles along the coast were then constructed by interpolation, taking into account water-depth variations ("shoaling factor," defined in par. 4.2) and trend along the coast in the hurricane climatology parameters.
2. SUMMARY OF HISTORICAL HURRICANES
2.1 Hurricane Tracks
This section summarizes the hurricanes that have moved across the upper portion of the west coast of Florida since 1800. A few of the lesser storms are omitted. The tracks of hurricanes since 1871 are shown in figure 1, and dates are given along the respective tracks with dates of major hurricanes underlined. A dashed-line track indicates that the intensity had decreased to that of a tropical storm with maximum winds of 34 to 63 knots. The information on hurricane tracks is taken from the charts of North Atlantic tropical cyclones compiled by Cry [4] for the years 1871 to 1963. For 1964-73, similar tracks are published in the Monthly Weather Review.
2.2 Historical Notes
Brief notes on the history of hurricanes and damages caused by them are abstracted from published papers.
August 31, 1837
3
The most severe storm in the northeast Gulf of Mexico since the settlement of Florida was felt on August 30 at Cape St. George, Fla. This "Apalachee Bay Storm" struck Apalachicola and St. Marks on the morning of the 31st. At Apalachicola the high water was estimated to have reached from ten to fifteen feet above normal ~ow water. General damage estimates in the Apalachicola Gazette ran as high as $200,000. High tide of about 10 ft above mean sea level (msl) was reported at the St. Marks lighthouse. The local correspondent of the Tallahassee Floridian gave further details: "The storm was considered the severest gale ever felt on that section of the coast since the settlement of Florida by the Americans. The schooner Washington was torn from its moorings and driven into the pine woods a half-mile from the river. A storm wave ten feet high hit the lighthouse, sweeping away all buildings except that of the keeper and drowning eight persons there. Several houses were dashed to pieces as the village was inundated to a depth of seven feet" [5].
September 30-0ctober 6, 1842
This hurricane originated in the Gulf of Campeche west of the Yucatan Peninsula in the last days of September. Its center moved northeastward across the Gulf of Mexico. The effects of the gale were felt in the middle Gulf from 100 miles east of the mouth of the Rio Grande to about 40 miles south of the Mississippi Delta, as well as eastward to within 100 miles of the Tortugas. The landfall of the hurricane eye in the extreme northeastern Gulf, close to the seaport of St. }.1arks may be traced to a report of the skipper of the Brig Sampson. Excerpts from Ludlam [5] follow:
"Damage to land installations along the northern sector of the hurricane was heavy as extreme wind speeds mounted offshore. At Apalachicola the wind blew 'A perfect hurricane' and was 'thought to be one of the severest gales on record'. The lighthouse at East Pass was ruined when 20 to 30 feet, of the tower blew down. As the keeper's house was swept off the island, his wife was drowned along with several other residents of low-lying areas nearby. The press reported the wind peak at 1600 on the 5th when many houses in Apalachicola were unroofed by the force of the gale. At Tallahassee first damage estimates ran as high as $500,000 as the hurricane tore off roofs, smashed walls, and shattered windows. Roads in all directions from the Florida capital were blocked with thousands of fallen trees. The damaging winds did not reach as far west as Pensacola where there were northerly winds on the 4th and an easterly flow on the 5th as the storm passed almost 200 miles to the east.
4
"To the south of the stonn track enormous tides took their usual toll. At Cedar Keys the hurricane commenced on the 4th from E. and S.E. and continued on the 5th, from S.E. and S. with heavy rain until late at night. On the 6th cloudy with high winds from the northeast. The water is stated to have risen twenty feet above low water mark, and within six feet of covering the island.
The storm's path through the northern part of the peninsula took the center across the Suwanee River watershed, probably over the Okefenokee Swamp, to emerge on the south Georgia coast just north of the St. Marys River."
September 25, 1848
A severe tropical storm entered the west coast of Florida in the vicinity of Tampa Bay on September 25.. A minimum barometric pressure of 954 mb was recorded at Tampa and a high tide was estimated at about 14 ft msl. High winds and tides destroyed all of the wharves and most of the public buildings at a military post located at Tampa. Excerpts from Ludlum [5] give further details:
"Nothing about the origin or previous course of the storm has been uncovered. To the south it was reported light at Key West, but at Charlotte Harbor near Ft. Myers 'considerable damage' resulted. To the north at Cedar Keys a brig was dismasted when off that point and within 80 miles of St. Marks in Apalachee Bay. Nearby Tampa the sugar works on the Manatee River were completely destroyed by the onslaught of wind and waves.
We have two estimates of the magnitude of the tidal influx: 'water out of the bay rose 10 to 12 feet higher than ever known,' and 'the tide rose 15 feet above low water.' The latter estimate, submitted by the post surgeon at Ft. Brooke, also stated that 'the water commenced rising very fast at 10 A.M. and continued to rise until 2 P.M.' All accounts seem to agree that the peak of the storm came between 1400 and 1500. The surgeon's report quoted above noted the fall of the barometer from a prestorm reading of 30.12 in at 0900/24th and 29.92 in at 2100 to a low of 28.18 in sometime prior to 1500/25th, indicative of a storm of the severest type. By 1500 the glass had recovered to 28.55 in and the wind was coming out of the south. Observations were then discontinued due 'to the exposed condition of the barometer,' i.e., the building was unroofed, the doors blown in, and the windows demolished."
August 20-24, 1851
The August hurricane of 1851 gave the Florida west coast a good sideswipe before roaring inland near Apalachicola.. Key West had its "August gale" on the 20th. A strong wind varying from southeast to southwest continued
5
for 24 hours on the 22-23rd and raised a very high tide at Fort Brooke on Tampa Bay. The storm center moved inland just west of Apalachicola, then headed northeastward through Georgia. The following excerpt from Ludlum [5] describes storm damage at Apalachicola:
"This city was visited on the night of the 23rd ult., by the most destructive storm it has ever witnessed. The wind blew for about twenty hours with a violence that nothing could resist, the town was flooded by water from the Bay, houses of all materials and all sizes leveled with the earth, stores washed away with their contents, leaving the inhabitants without shelter and almost without food. Not one building on Water Street remains uninjured, the Exchange buildings, the offices over the Hydraulic press, the building lately occupied by the Charleston Bank Agency, all in ruins. The store occupied as a Custom-House almost down; from that position of the town every house on Front or Commerce Street is in ruins. At the upper end of the town the wharves and small buildings are all gone. The Episcopal Church is almost a wreck and the Presbyterian Church totally demolished. At the Bluff the houses are all washed down. The steamer Falcon was washed off the ways; driven up the river by the tide and storm, and capsized on an island. All three of the lighthouses are blown down or washed away. At Dog Island five lives were lost; at Cape San Blas a Spanish brig-of-war was stranded on the beach and several lives lost."
September 21-0ctober 5, .1877
Very little is known concerning the details of this storm. It had a similar path as the storm of 1851. A high tide of 11.3 ft msl occurred at St. Marks [6].
October 8-12, 1888
This hurricane developed on the western Gulf of Mexico on October 8. Its center moved northeastward and entered the coast just north of Cedar Key. It was reported that the sea rose 9 feet in 30 minutes [7].
September 22-29, 1896
This hurricane formed near Guadeloupe and moved westward. It recurved over western Cuba, moved in the Gulf, and entered Florida near Cedar,Key, moving northeastward. It continued northward as a dangerous storm as far as Pennsylvania, claiming over 100 lives. Seven million dollars damage was done in Florida. At Cedar Key, 28 lives were lost and damages were estimated at about $3 million. Most of the town was destroyed by high tides, waves, and fire; over 100 fishing and shrimping boats were lost. "Oldtimers" estimate the tide to have been from 8 to 9 feet, or about 2 feet higher than it had risen in previous hurricanes [7].
October 20-29, 1921
This full-fledged hurricane entered the Florida coast north of Tarpon Springs on October 25. Its center moved across the peninsula and over the
6
Atlantic coast, south of St. Augustine, Fla., on October 26. At Tarpon Springs, barometric pressure fell to 952.3 mb (28.12 in) [8~ and the wind speed was estimated at 70-90 kt. The Florida west coast from Fort Myers to Tarpon Springs experienced tides from 7 to 10 ft msl. In the Tampa area the storm caused the highest tides since 1848. A tide height of 9.6 ft was observed on the tide gage in Hillsborough Bay [7]. Five or six lives were lost in this storm. Property damage in Florida was placed at $3 million.
August 29-September 10, 1935
A hurricane of very small diameter, but one of the most intense of record, crossed the Florida Keys late on September 2. This storm is known as the "Labor Day Hurricane." It was first sighted east of Turks Island moving towards the Florida Keys. At Long Key and Matecumbe Key, Fla., the storm was accompanied by a tide of about 18ft msl or more [9]. The lowest barometer reading, 892.3 mb (26.35 in) near the northern end of Long Key, is the record sea-level value for the western hemisphere. After leaving the Keys, the storm skirted the Florida west coast on a broad recurve, and moved inland near Cedar Key. Eyewitnesses claim the tide was over Main Street on Cedar Key and many sponge docks and boats were demolished.
October 3-14, 1941
After crossing the Bahama Islands in a west-northwestward direction, this small but fully developed hurricane entered the east coast of Florida just south of Miami. Continuing its course inland, the storm crossed the Everglades and moved into the Gulf of Mexico between Everglades City and Fort Myers. The storm tu~ned slowly to a northward direction and reentered the coast near Carrabelle, Fla., on October 7. Winds of 65 kt were recorded at Carrabelle. High tides of 6.4 ft msl were reported at St. Marks, Fla. [7].
September 1-7, 1950- EASY
Hurricane EASY developed in the northwestern Caribbean Sea south of the Isle of Pines on September 1. Its center moved north-northwestward after crossing Cuba near Havana. The storm barely maintained its hurricane intensity as it passed between Key West and Dry Tortugas. It moved about parallel to the west coast of Florida at a distance of 30 to 50 miles off shore. The path of the storm was remarkable in that it made two wellsubstantiated loops--figure 1. In making the second loop the calm center moved over the town of Cedar Key from the southeast and then away toward the south [10]. This fishing village of about 1,000 population was badly wrecked. Half of the houses were destroyed, and 90 percent of the remainder were damaged. The fleet of fishing boats which was the principal source of livelihood for the community was completely destroyed. After completing its second loop, the hurricane moved southward to a point about 30 miles north of Tampa where it turned eastward and finally northward. Extremely
heavy rainfall occurred in connection with this storm over central and northeast Florida. The lowest pressure reported was 958.3 mb (28.30 in)
7
at Cedar Key where the maximum winds reached 110 kt [10]. Tides were noted as being over the bridge leading to the town of Cedar Key and the bridge approaches were badly eroded by the overflow.
June 4-14, 1966 - ALMA
Originated from the Gulf of Honduras, hurricane ALMA moved across western Cuba and passed between Dry Tortugas and Key West on June 8. The lowest pressure recorded at Dry Tortugas was 970 .. 2 mb (28.65 in) and the highest wind 110 kt. The storm weakened slightly just before landfall in the Apalachee Bay area.
Besides the structural damage in the Lower Keys and in West Florida, the mango crop in the southwestern portion of the state and the grapefruit crop around Pinellas County were hard hit. The wind caused considerable damage to tobacco in northern Florida. Tides were variable on the west coast of Florida, ranging up to 10 ft above normal. Highest reported tides were in the New Port Richey, Red Level (Crystal River), and Cedar Key areas. A large portion of Cedar Key was inundated. An excerpt from the Gainesville Sun describes the high waters there: "The backlash of Hurricane Alma, which skirted the coast about 60 miles out on the Gulf, pushed tides about 12 ft above normal up into the streets of Cedar Key. Bridge approaches to the island were covered with water, and Cedar Key was isolated from the mainland."
June 15-22, 1972
Hurricane AGNES developed from a disturbance that moved eastward from the Yucatan Peninsula on June 14. The storm turned northward off the western tip of Cuba and headed into the Gulf of Mexico. It attained hurricane intensity with sustained winds of 75 kt on June 19. Its center entered the Gulf coast near Panama City, Fla., on June 19~ AGNES weakened as it moved inland and became part of a complex low-pressure system which moved through North Carolina, Virginia, Maryland and Pennsylvania. Its associated excessive rainfall caused the most damaging floods ever recorded in the United States. Property damage in the United States attributed to AGNES was near $3.1 billion, of which two-thirds occurred in Pennsylvania [11].
Damages from coastal flooding along the Gulf Coast of Florida caused directly by the storm were rather light. The Corps of Engineers, in a post storm survey, determined that tides along the west coast of Florida increased from Lee County northward. Tides were about 2 ft above normal in Lee County, 2 to 3 ft above normal in Charlotte and Sarasota Counties, and 3 to 6 ft above normal in Manatee and Pinellas Counties. A high tide of about 10ft msl was reported at Cedar Key [12]. High-water marks
8
collected by the National Ocean Survey show 9&5 ft msl and 8.3 ft msl at Carrabelle, 8.4 ft msl near Panacea, 8.3 ft msl at Alligator Point,and 705 ft msl on Sts George Island.
3. CLIMATOLOGY OF HURRICANE CHARACTERISTICS
This section describes important characteristics of hurricane parameters that are needed for calculating tide levels on the coast~ Basic parameters of hurricanes affecting the U.S. coast, including central pressures, radius of maximum winds, speed of forward motion, and other factors affecting storm tide-producing capability, were published in 1959 [13]. This compendium of hurricane characteristics has been updated by the National Weather Service and adapted to the needs of the Flood Insurance Program, including specification of probability distributions of the individual parameters. These data used in this and other flood insurance studies by NOAA have been prepared for publication in a separate report [14]. The specific values adopted for tide frequency computations in the present study are presented in par. Sel.
3.1 Frequency of Hurricane Tracks
The overall frequency of hurricane occurrences is basic to calculating the resulting tide frequencies. The tide frequency analysis in this study treats landfalling and storms moving alongshore separately. The frequency with which hurricanes and tropical storms have entered the coast and moved parallel to the coast ("alongshore") was assessed in [14] by counting tracks and smoothing the count along the coast& These counts were used in this study, except that a special count of alongshore storms was made for Apalachicola from the track charts to secure more detail.
Hurricanes also exit the coast of the study region after crossing the Florida Peninsula, ·but these contribute little to the frequency of high storm tides in the areas Because of hydrodynamic factors,a hurricane of given intensity if exiting gives half or less the surge height that the same storm would if landfalling. This can be seen in figure 3 of [16]. Exiting storms are not considered further in this report.
3.2 Probability Distribution of Hurricane Intensity
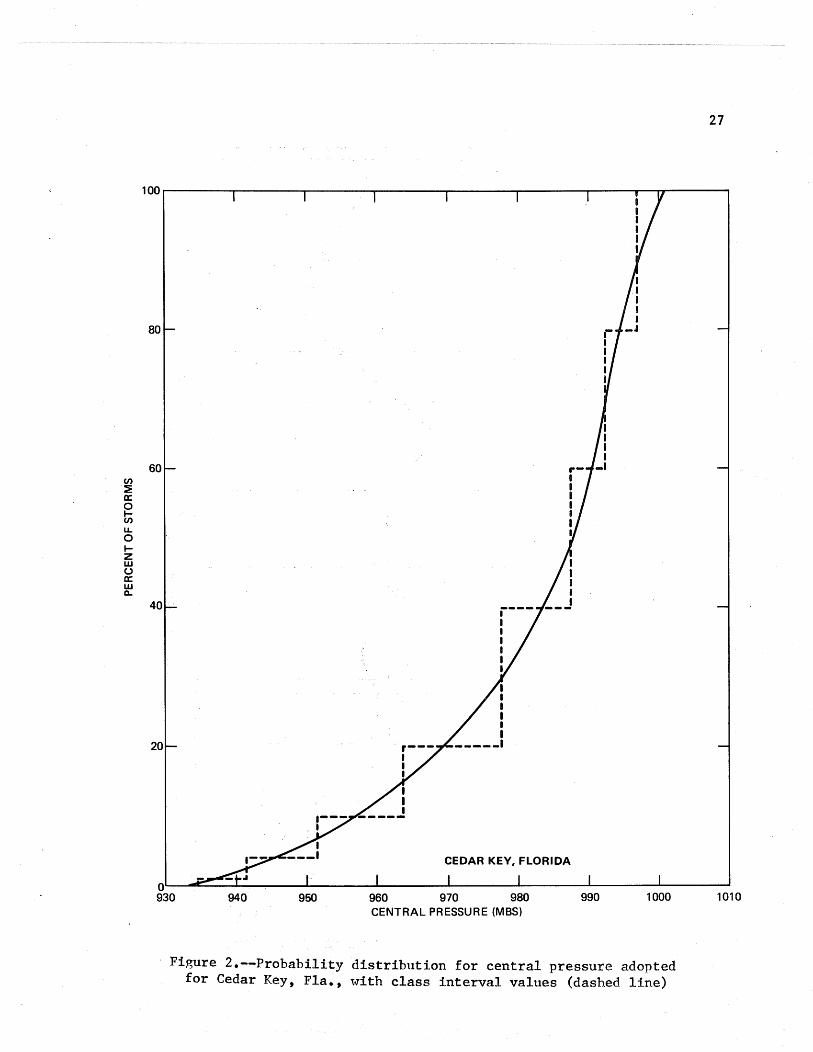
Storm surges vary directly with the strength of the wind that is putting stress on the water surface. A measure of this wind stress in hurricanes is the intensity of the storm as measured by the depression of the storm's central pressure below representative peripheral pressure. The probability distribution of hurricane central pressures near Cedar Key, Fla., based on
9
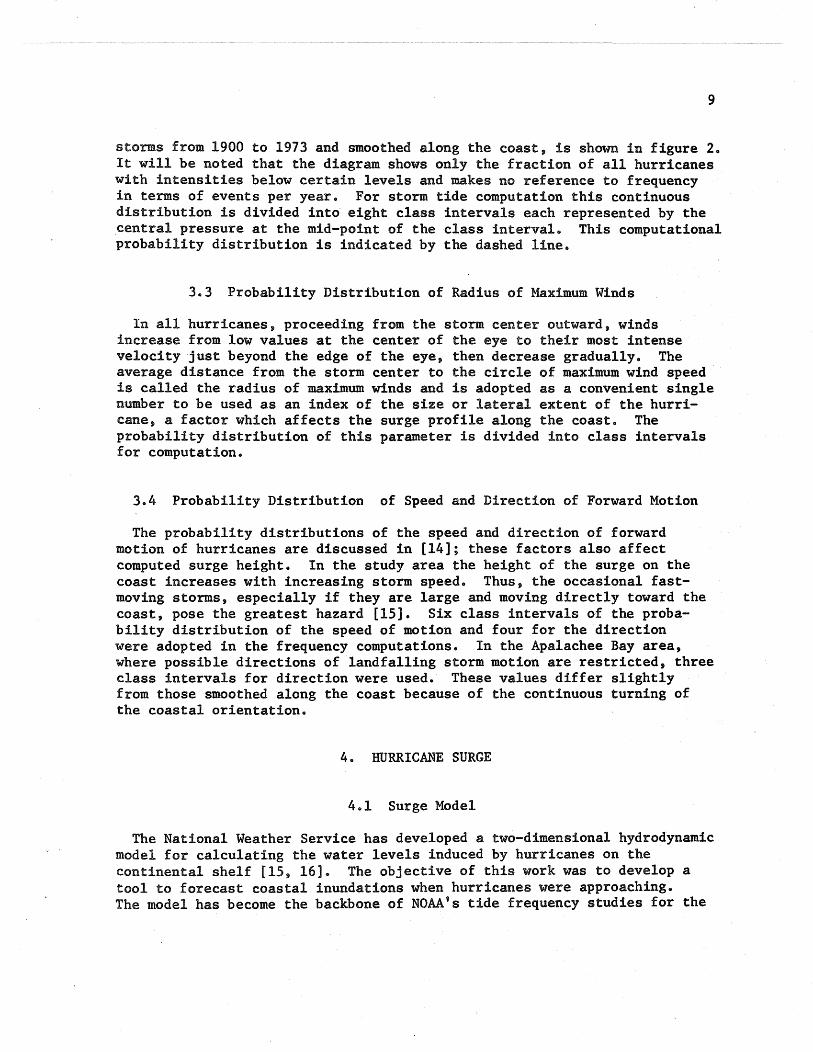
storms from 1900 to 1973 and smoothed along the coast, is shown in figure 2. It will be noted that the diagram shows only the fraction of all hurricanes with intensities below certain levels and makes no reference to frequency in terms of events per year. For storm tide computation this continuous distribution is divided into eight class intervals each represented by the .central pressure at the mid-point of the class interval. This computational probability distribution is indicated by the dashed line.
3.3 Probability Distribution of Radius of Maximum Winds
In all hurricanes, proceeding from the storm center outward, winds increase from low values at the center of the eye to their most intense velocity just beyond the edge of the eye, then decrease gradually. The average distance from the storm center to the circle of maximum wind speed is called the radius of maximum winds and is adopted as a convenient single number to be used as an index of the size or lateral extent of the hurricane, a factor which affects the surge profile along the coast. The probability distribution of this parameter is divided into class intervals for computation.
3.4 Probability Distribution of Speed and Direction of Forward Motion
The probability distributions of the speed and direction of forward motion of hurricanes are discussed in [14]; these factors also affect computed surge height. In the study area the height of the surge on the coast increases with increasing storm speed. Thus, the occasional fastmoving storms, especially if they are large and moving directly toward the coast, pose the greatest hazard [15]. Six class intervals of the probability distribution of the speed of motion and four for the direction were adopted in the frequency computations. In the Apalachee Bay area, where possible directions of landfalling storm motion are restricted, three class intervals for direction were used. These values differ slightly from those smoothed along the coast because of the continuous turning of the coastal orientation.
4. HURRICANE SURGE
4.1 Surge Model
The National Weather Service has developed a two-dimensional hydrodynamic model for calculating the water levels induced by hurricanes on the continental shelf [15, 16]. The objective of this work was to develop a tool to forecast coastal inundations when hurricanes were approaching. The model has become the backbone of NOAA's tide frequency studies for the
10
flood-insurance program.. The development of the model is described in [15] and operational application in [16] .. Limitations of the model and its verification are described in the references. Replications of surges produced by past hurricanes along this stretch of the coast agree quite well with observed tides and high-water marks. The model computes the surge, the difference between the local sto~induced water level and the normal water levels for the area. Thus, the computed storm surge must be added to the predicted astronomical tidea
Running this model requires a large computer.. The model program is at present in residence at NOAA's computer complex at Suitland, Md.. Inputs to a computer calculation of a hurricane surge are the storm central pressure, radius of maximum winds, storm direction of motion and forward speed, and ocean depth at a series of grid points. The hurricane climatology just described is oriented toward providing these parameters. The computer program generates the needed moving sea-level pressure and wind fields from the basic parameters by predetermined relations.
4.2 Shoaling Factor
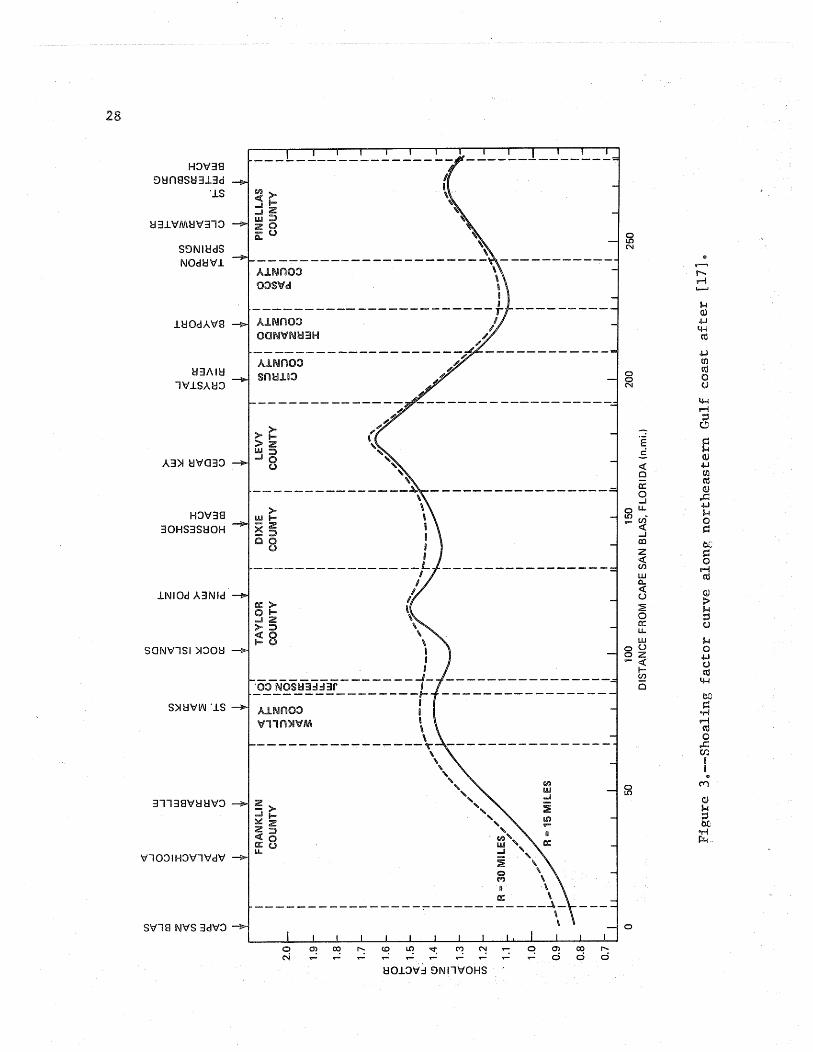
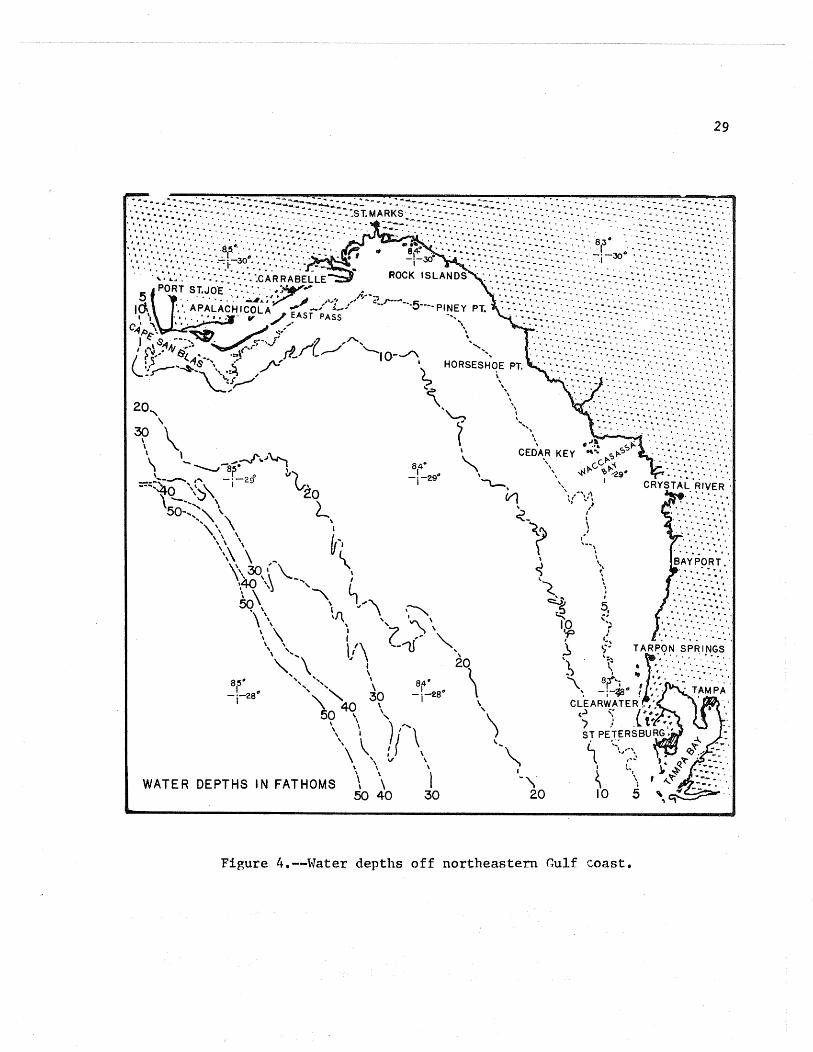
The capacity of a hurricane of given characteristics to produce· a coastal surge depends on the slope and depth of the continental shelf. The shallower the coastal water the higher the surge. This variation along the Gulf coast is depicted in figure 11 of [17], showing the ratio of the surge that would be produced at each coastal point by a prescribed hurricane compared to that over a continental shelf of average slope ("standard basin"). This ratio is called the shoaling factor. It is generated by computing surges by the model that has been described at the various coastal points and over the "standard basin," and taking ratios of the peak surges. Thewest Florida portion of this diagram is reproduced in figure 3. The shoaling factor is implicit in ca+culations of hurricane surge by the model at selected coastal points, since the sloping depths of the continental shelf are introduced by input data to the calculation. The shoaling factor curve is a primary guide to interpolating tide frequencies between coastal computation points. The shoaling factor reaches a maximum in Levy County on Wacassa Bay.
The water depths as depicted on National Ocean Survey Nautical Charts. are shown in figure 4e Techniques for smoothing this for input to the computer are given in [17].
5. TIDE FREQUENCY ANALYSIS BY JOINT PROBABILITY METHOD
5.1 The Joint Probability Method
The first step in the joint probability method is to divide the hurricane parameters into class intervals for the landfalling storms and read out the mid-point value of each class interval, as indicated in figure 2. These
11
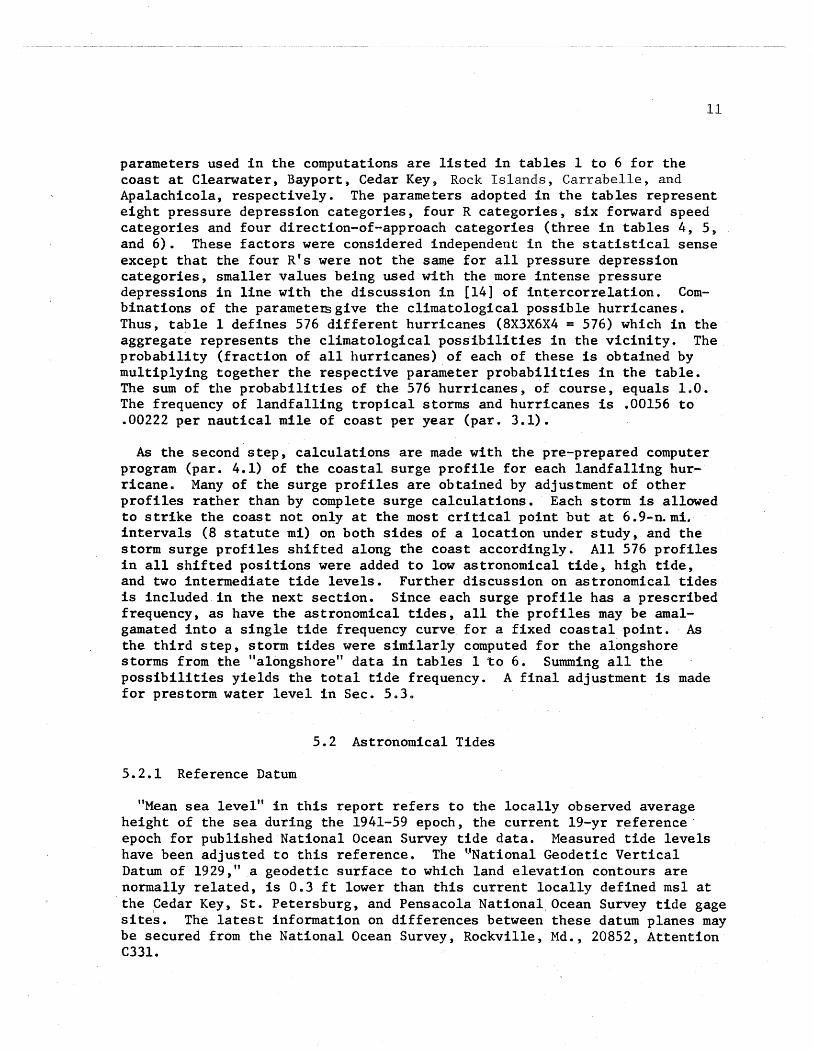
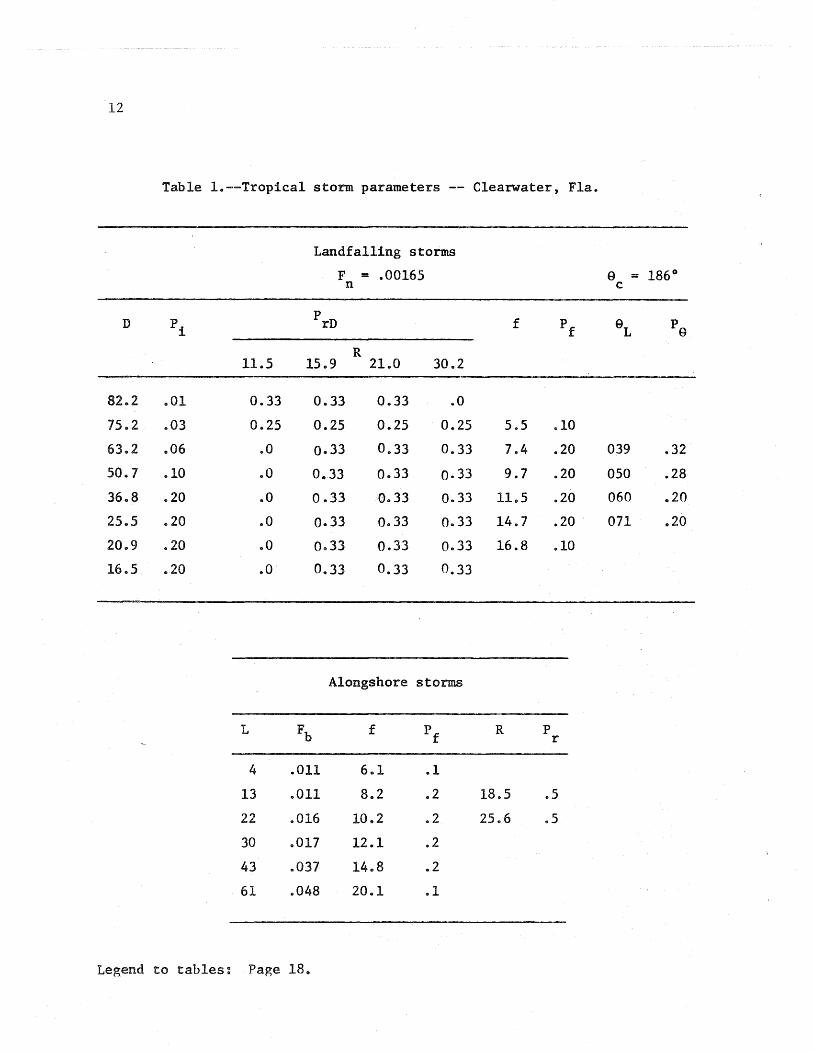
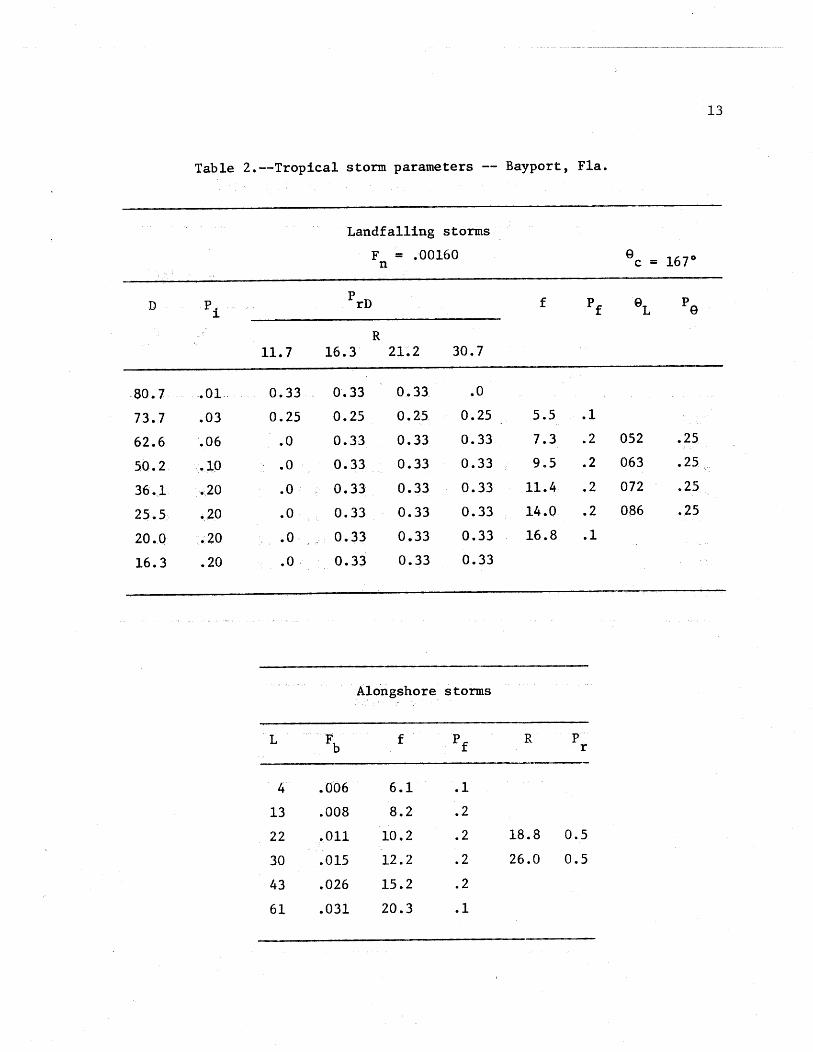
parameters used in the computations are listed in tables 1 to 6 for the coast at Clearwater, Bayport, Cedar Key, Rock Islands, Carrabelle, and Apalachicola, respectively. The parameters adopted in the tables represent eight pressure depression categories, four R categories, six forward speed categories and four direction-of-approach categories (three in tables 4, 5, and 6). These factors were considered independent in the statistical sense except that the four R's were not the same for all pressure depression categories, smaller values being used with the more intense pressure depressions in line with the discussion in [14] of intercorrelation. Combinations of the paramete~give the climatological possible hurricanes. Thus, table 1 defines 576 different hurricanes (8X3X6X4 = 576) which in the aggregate represents the climatological possibilities in the vicinity. The probability (fraction of all hurricanes) of each of these is obtained by multiplying together the respective parameter probabilities in the table. The sum of the probabilities of the 576 hurricanes, of course, equals 1.0. The frequency of landfalling tropical storms and hurricanes is .00156 to .00222 per nautical mile of coast per year (par. 3.1).
As the second step, calculations are made with the pre-prepared computer program (par. 4.1) of the coastal surge profile for each landfalling hurricane. Many of the surge profiles are obtained by adjustment of other profiles rather than by complete surge calculations. Each storm is allowed to strike the coast not only at the most critical point but at 6.9-n.mi. intervals (8 statute mi) on both sides of a location under study, and the storm surge profiles shifted along the coast accordingly. All 576 profiles in all shifted positions were added to low astronomical tide, high tide, and two intermediate tide levels. Further discussion on astronomical tides is included in the next section. Since each surge profile has a prescribed frequency, as have the astronomical tides, all the profiles may be amalgamated into a single tide frequency curve for a fixed coastal point. As the third step, storm tides were similarly computed for the alongshore storms from the "alongshore" data in tables 1 ito 6. Summing all the possibilities yields the total tide frequency. A final adjustment is made for prestorm water level in Sec. 5.3.
5.2 Astronomical Tides
5.2.1 Reference Datum
"Mean sea level" in this report refers to the locally observed average height of the sea during the 1941-59 epoch, the current 19-yr reference· epoch for published National Ocean Survey tide data. Measured tide levels have been adjusted to this reference. The '·'National Geodetic Vertical Datum of 1929," a geodetic surface to which land elevation contours are normally related, is 0.3 ft lower than this current locally defined msl at the ,Cedar Key, St. Petersburg, and Pensacola National. Ocean Survey tide gage sites. The latest information on differences between these datum planes may be secured from the National Ocean Survey, Rockville, Md., 20852, Attention C331.
= Proportion of total storms with indicated D value.
=Forward speed of storm (kt).
= Proportion of storms with indicated f value.
= Distance from center of storm to principal belt of maximum winds (n. mi.).
= Proportion of storms with indicated R value.
= Proportion of storms in D class with indicated R value.
= Orientation of coast, measured clockwise from north (deg.)
=Direction of entry, measured clockwise from the coast (deg.).
= Proportion of storms with indicated e1
value.
= Effective distance perpendicularly outward from coast to storm track (n.mi~.
= Average number of storms per year that pass at distance L.
= Frequency of landfalling storm tracks cr~ssing coast (storm tracks per n.mi.of coast per year).
Alongshore storms have the same values of D and Pi as those for landfalling ..
5.2.2 Astronomical Tide
Most of the combinations of forces producing the astronomical tide are experienced during a 19-yr cycle. There is also a seasonal variation in the mean water level with a maximum in September - October. The month of September is taken to represent the hurricane season. Astronomical high tides for the base epoch were recalculated and their September frequency summarized. Low tides were estimated indirectly. The frequency distribution of all astronomical tide levels with which hurricane surges might combine in a random manner is approximated by the frequency distribution of high tides just described, of low tides and, for this study area, of the frequency distribution of two intermediate values.
5.3 Prestorm Water Level
Hurricanes in the Gulf of Mexico tend to raise the water level on the Gulf coast while still distant from the shore. This phenomenon in the western Gulf was pointed out by Harris [18] in connection with storms of July 1934, August 1942, Hurricane AUDREY of June 1957, and Hurricane CARLA of September 1961. Tide gage data at Cedar Key, Fla., recorded since 1938 were examined to identify the influence of Gulf hurricanes on local sea level. A similar study had been made earlier at Pensacola.
19
The magnitude of the effect was evaluated to average +1.0 ft at Pensacola, +0.7 ft at Cedar Key, and to be less than +0.5 ft south of the study area. The +0.7 ft was used from Franklin County to Levy County then decreased to negligible southward.
5.4 Tide Frequencies
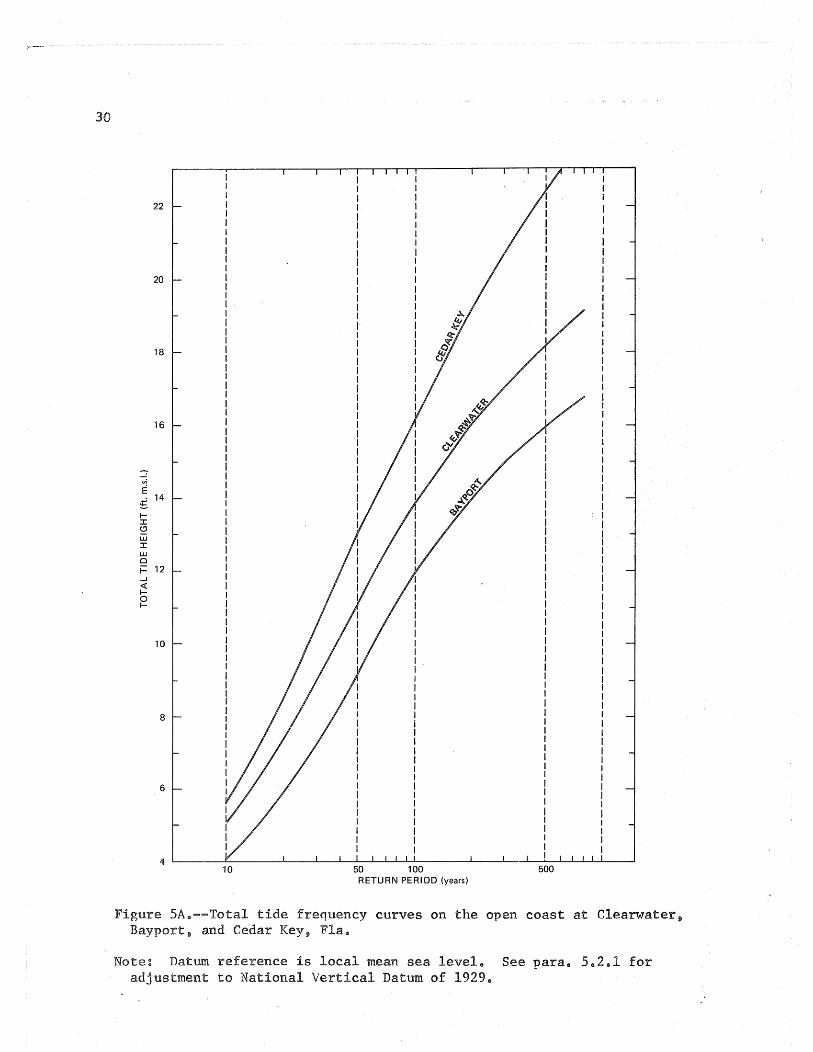
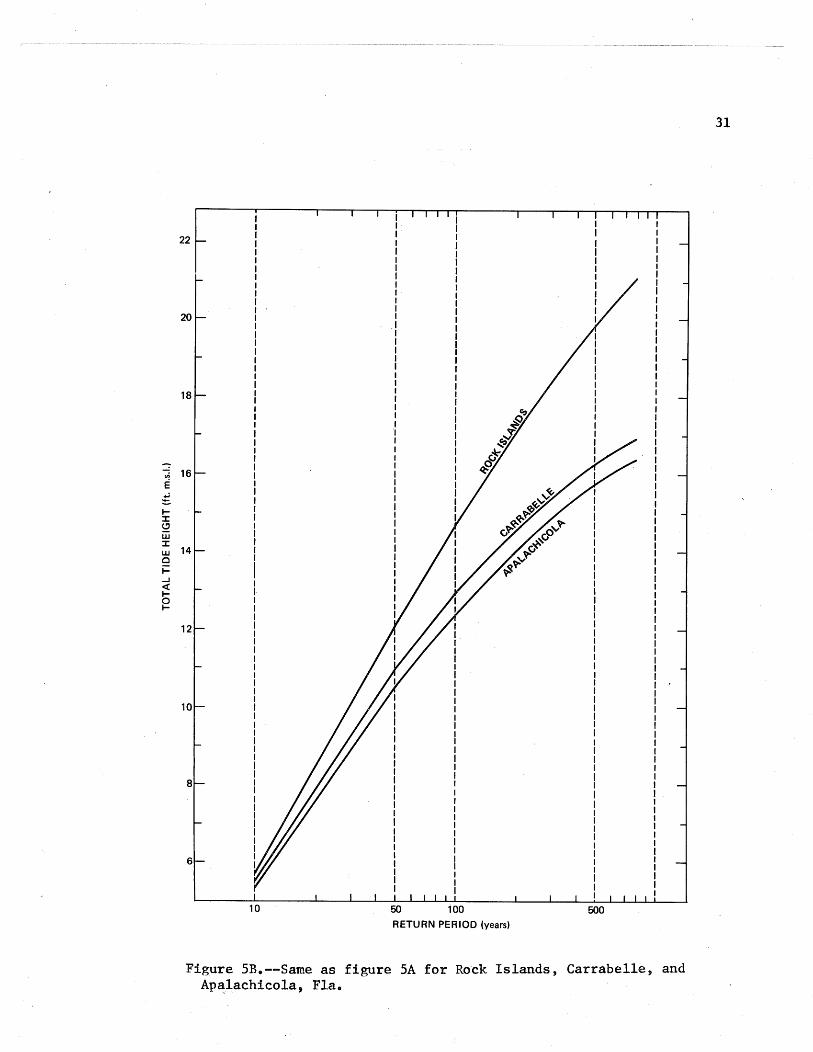
Figure SA shows the resultant total tide frequency curves on the open coast opposite Clearwater, Bayport, and Cedar Key, Fla. Similar curves for Rock Island, Carrabelle, and near Apalachicola are shown in figure SB. Details on interpretation of "open coast" at these places are given in the appendix. It should be said again that these frequency values are of · still-water levels that would be measured in a tide gage house or other enclosure, excluding wave action. The destructive effects of waves on the beach front must be taken into account separately. In insurance rating this is taken into account by the ocean front "velocity zone."
5.5 Adjustment Along Coast
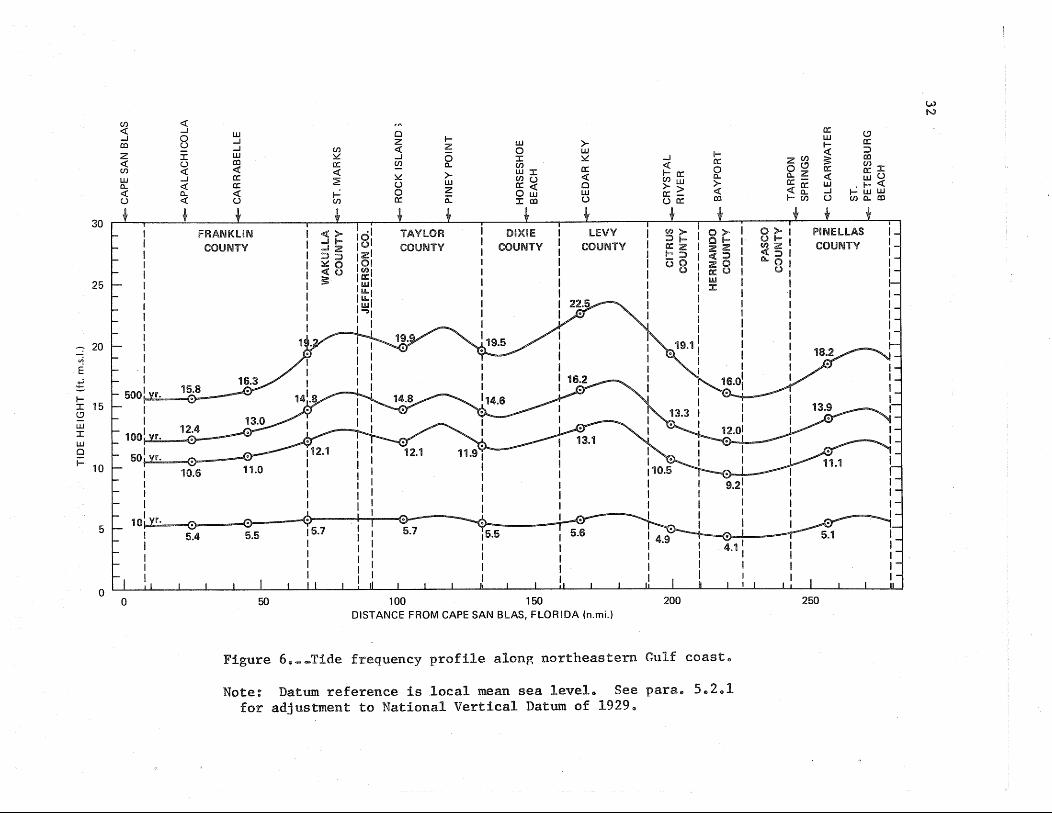
Tide frequencies for locations between those selected for computation along this stretch of the coast were obtained by interpolation. The interpolation was based on the frequency of storms, the shoaling factor (fig. 3), and trend in the hurricane climatology parameters along the coast. Figure 6
20
shows the variation of the total tide heights along the coast for the 10-~ 50-,100-,and 500-yr return periods, scaled from these diagrams and frequency curves for other selected locations and interpolated between by reference to the shoaling factor (par. 4.2) and the hurricane climatology.
5.6 Comparison of Frequency Curves with Observed Tides and High-water Marks
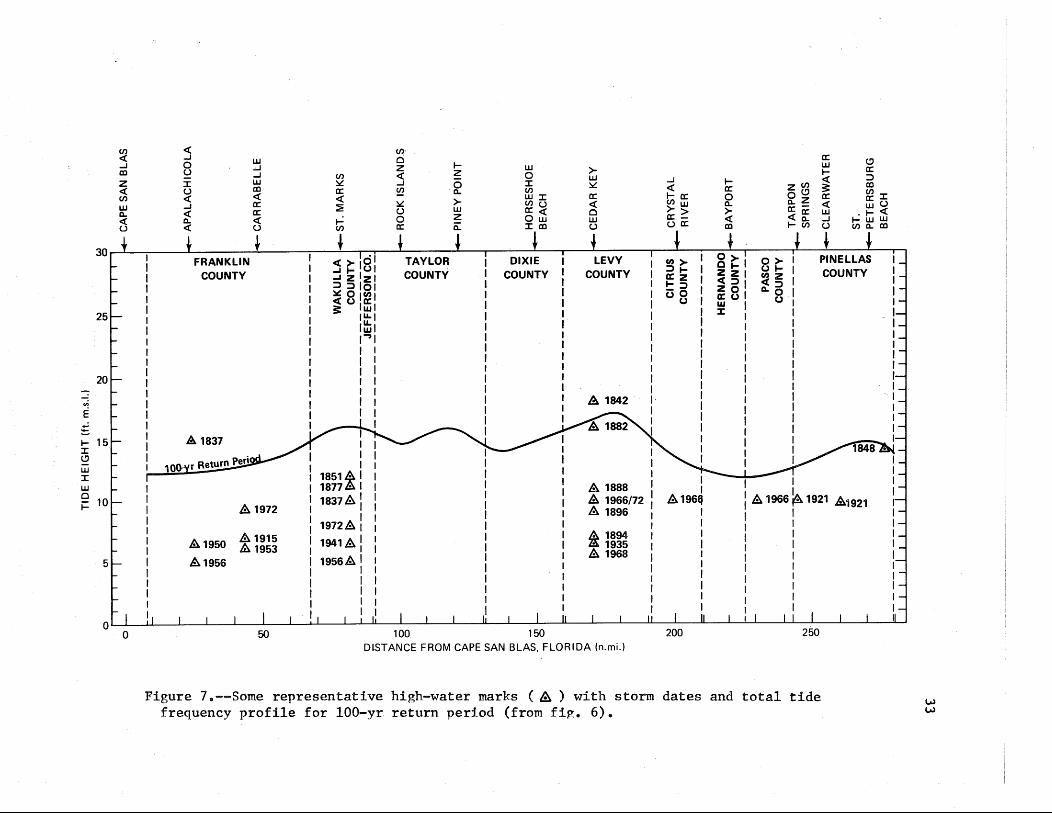
Figure 7 shows representative high water marks of observed storm tides along the coast in comparison to the 100-yr return period values of this study. As expected, during the period of observed data some coastal points experienced hurricane tides higher than the "100-yr" level, while others either did not reach this level or it was not observed. The 100-yr level is to be construed as the tide level having a probability of occurrence each year of 0.01.
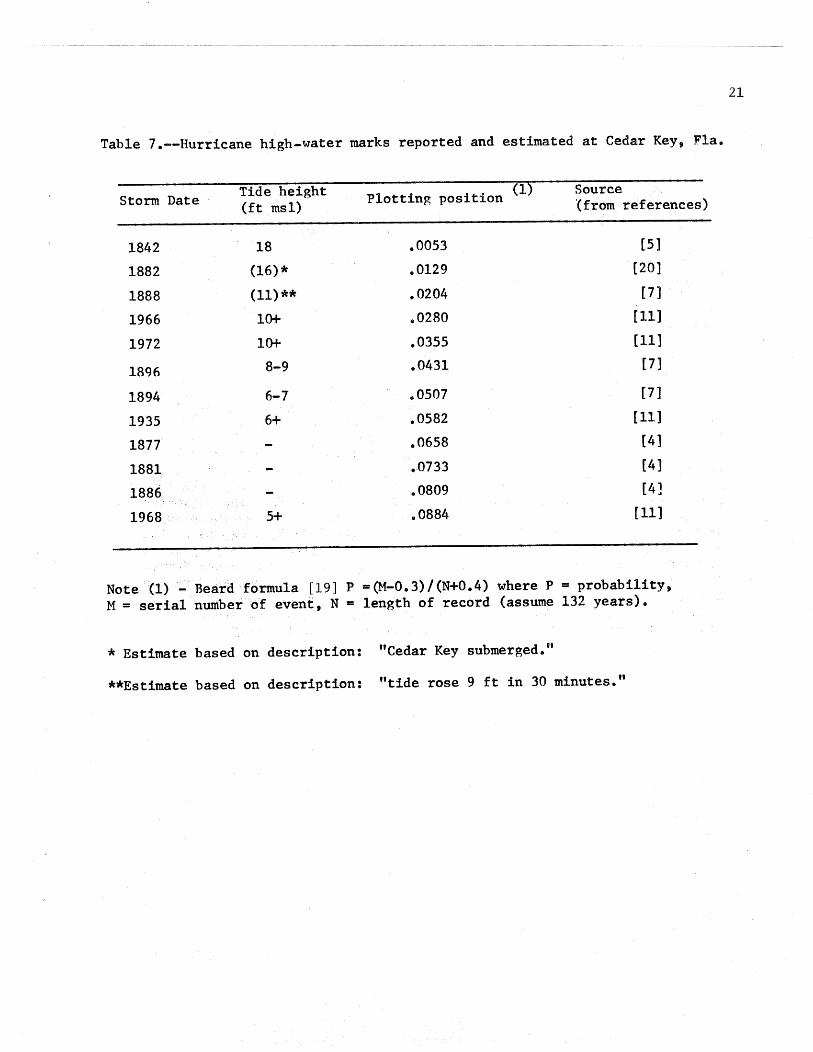
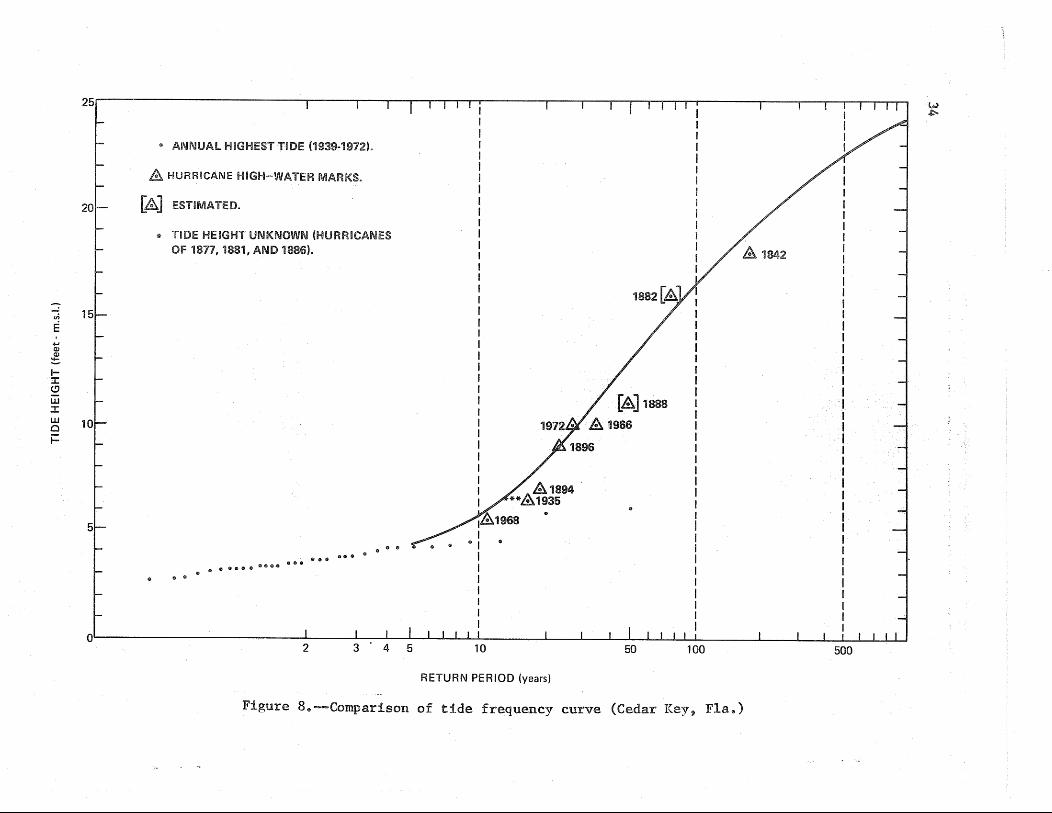
Figure 8 shows yearly highest tides from the NOS tide gage data recorded at Cedar Key, Fla .. , since 1938 with plotting positions calculated by the formula proposed by Beard [19]. Most of these were not generated by hurricanes. Their principal purpose here is to extend the lower end of frequency curve. Observed high-water marks and estimated tides generated by hurricanes at Cedar Key are listed in Table 7 and are also plotted in figure 8.. The length of the data series was taken as 132 years, from' 1842 through 1973, for this plot.. There is no information on high tides caused by the hurricanes of 1877, 1881, and 1886 which entered the coast within 20 n.mi.of Cedar Key (see figure 1). It is assumed that the tides in these hurricanes were not as high as that caused by the hurricane of 1888 .. There is no·attempt to fit a frequency curve using these estimated tide data. The purpose here is to verify the reasonableness of the computed frequency curve which is reproduced from figure SA.
5.7 Relation of this Report to Disaster Planning
The most recent disastrous display of hurricane forces on the Gulf of Mexico coast was by CAMILLE which struck the Bay St. Louis - Pass Christian - Gulfport - Biloxi, Miss. area in 1969. According to high-water marks, the storm tide reached a level of 24.6 ft above mean sea level. The central pressure at landfall was about 908 mb. An even more intense but smaller hurricane crossed the Florida Keys on Labor Day, 1935 with central pressure detected at 892 mb. There was a substantial loss of life in both of these hurricanes. Other disasters could also be recounted, including AUDREY at Cameron, La. in 1957 and the Galveston, Tex. hurricane of 1900. All of the Gulf of Mexico coast is exposed to hurricanes equal to these. The National Weather Service recommends a repeat of CAMILLE, the worst hurricane to strike the mainland~ as a disaster planning objective without regard to the statistical frequency of such a storm at an individual point. So far as disaster planning is concerned there's no important difference in the liklihood of a CAMILLE intensity hurricane anywhere in the study area as compared to the Mississippi coast where the storm did strike. Such a storm on a critical path for the west end of the study area of this report would submerge St. George Island and Dog Island except for the very few highest points, and would make the single evacuation causeway from St. George Island imp~ssable early in the storm. If farther to the east, such a storm
Table 7.--Hurricane high-water marks reported and estimated at Cedar Key, Fla.
Storm Date Tide height Plotting position (1) Source (ft msl) (from references)
1842 18 .0053 [5]
1882 (16)* .0129 [20]
1888 (11)** .0204 [7]
1966 10+ .0280 [11]
1972 10+ .0355 [11]
18q6 8-9 .0431 [7]
1894 6-7 .0507 [7]
1935 6+ .0582 [11]
1877 .0658 [4]
1881 .0733 [4]
1886 .0809 [41
1968 5+ .0884 [11]
Note (1} - Beard formula [19] P =(M-0.3}/(N+0.4} where P = probability, M =serial nunibero£ event, N =length of record (assume 132 years).
* Estimate based on description: "Cedar Key submerged."
**Estimate based on description: "tide rose 9 ft in 30 minutes."
21
22
would fill up Apalachee Bay to a height of more than 20 ft. Still farther to the east, Cedar Keys, or any other point in the study area below 20 ft, would be submerged.
The central purpose of this report is to develop actuarial frequencies for insurance rating and related uses; therefore all frequencies, includinp. the coastal profiles of figure 6, are stated in terms of probabilities or mean recurrence intervals at points. The likelihood of CAMILLE or any other given intensity of storm somewhere within the study area in any given year is much greater than the point recurrence interval for the same storm, a difference that needs to be taken into account in regional plannin~ against disasters. Regional disaster planning should be based on studies for that particular purpose.
5.8 Coordination
The resultant tide frequency values (figs SA, SB, and 6) of this report have been reviewed by the U. S. Geological Survey and the Jacksonville District Office of the u. s. Army Corps of Engineers. The Corps' "Flood Plain Information" report for Levy County, Fla. [12], f!ives the "Intermediate Regional Tidal Flood" an elevation of 16.5 ft. (This is with respect to the National Geodetic Vertical Datum of 1929, and equals 16.2 ft at Cedar Key with respect to local msl datum.) This agrees with the 100-yr tide frequency value near Cedar Key (fig 6). This 100-yr value estimated in the present study drops to 15 ft and 15.5 ft msl at the southern and northern border of Levy County, respectively. The tide frequencies on the open coast of Pinellas County in this report agree with the results of the Flood Insurance Study for Pinellas County made by U. S. Geological Survey. The tide frequency on the southern end of Pinellas County and at Cape San Blas 9 respectively,in this report are the same as reported earlier in the Manatee County, Fla., [21] and in the northwest Florida tide frequency study prepared by NOAA for the Federal Insurance Administration.
Appendix
DEFINITION OF OPEN COAST
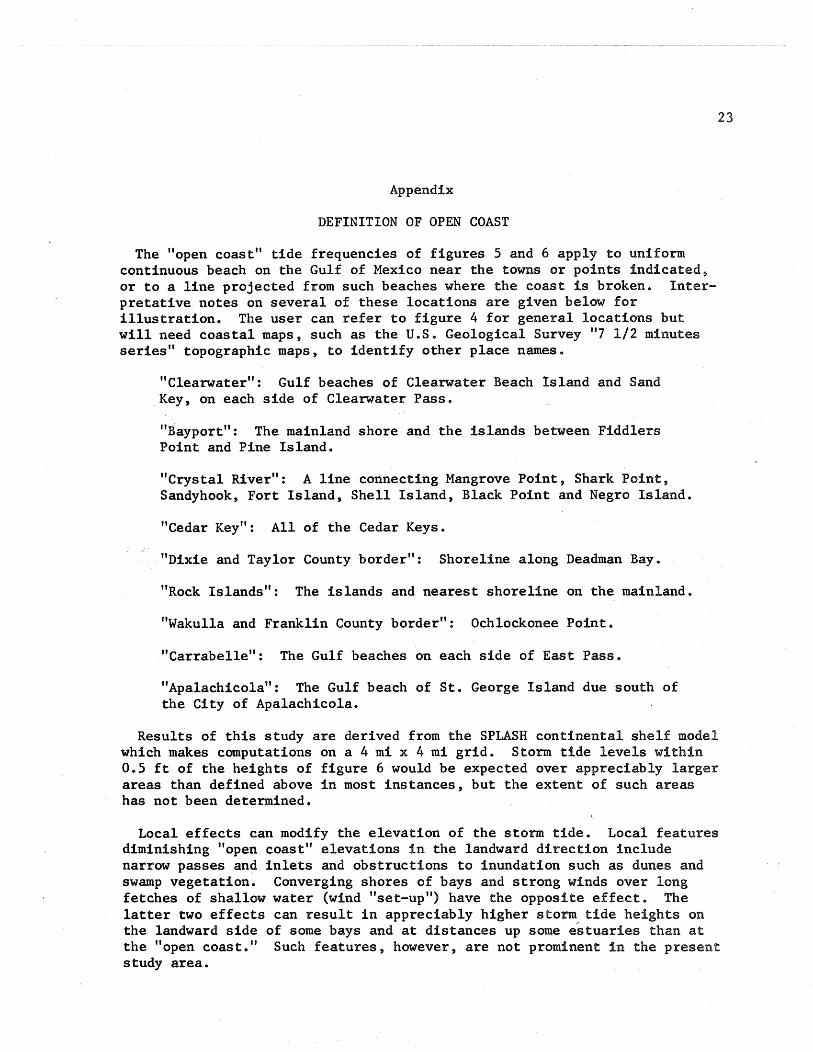
The "open coast" tide frequencies of figures 5 and 6 apply to uniform continuous beach on the Gulf of Mexico near the towns or points indicated, or to a line projected from such beaches where the coast is broken. Interpretative notes on several of these locations are given below for illustration. The user can refer to figure 4 for general locations but will need coastal maps, such as the U.S. Geological Survey "7 1/2 minutes series" topographic maps, to identify other place names.
"Clearwater": Gulf beaches of Clearwater Beach Island and Sand Key, on each side of Clearwater Pass.
"Bayport": The mainland shore and the islands between Fiddlers Point and Pine Island.
"Crystal River": A line connecting Mangrove Point, Shark Point, Sandyhook, Fort Island, Shell Island, Black Point and Negro Island.
"Cedar Key": All of the Cedar Keys.
"Dixie and Taylor County border": Shoreline along Deadman Bay.
"Rock Islands": The islands and nearest shoreline on the mainland.
"Wakulla and Franklin County border": Ochlockonee Point.
"Carrabelle": The Gulf beaches on each side of East Pass.
"Apalachicola": The Gulf beach of St. George Island due south of the City of Apalachicola.
23
Results of this study are derived from the SPLASH continental shelf model which makes computations on a 4 mi x 4 mi grid. Storm tide levels within 0.5 ft of the heights of figure 6 would be expected over appreciably larger areas than defined above in most instances, but the extent of such areas has not been determined.
Local effects can modify the elevation of the storm tide. Local features diminishing "open coast" elevations in the landward direction include narrow passes and inlets and obstructions to inundation such as dunes and swamp vegetation. Converging shores of bays and strong winds over long fetches of shallow water (wind "set-up") have the opposite effect. The latter two effects can result in appreciably higher storm tide heights on the landward side of some bays and at distances up some est~aries than at the "open coast." Such features, however, are not prominent in the present study area.
24
REFERENCES
1(/) Department of Commerce, ESSAll "Coastal Flooding - Long Beach Island and Adjoining Mainland, Ocean County, New Jersey," A Study for the Federal Insurance Administration, Department of Housing and Urban Development, April 1970.
2. Myers, Vance A,., "Joint Probability Method of Tide Frequency Analysis Applied to Atlantic City and Long Beach Island, N.J.," ESSA Technical Memorandum liBTM HYDRO 11, Environmental Science Services Administration, Silver Spring, Md., April 1970.
3* Myers, Vance A., "Storm Tide Frequencies on the South Carolina ·coast," NOAA Technical Report (to be published).
4e Cry, George W., "Tropical Cyclones of the North Atlantic Ocean", Ue s. Weather Bureau Technical Paper No. 55, U. s. Weather Bureau, Department of Commerce, Washington, D. C., 1965.
5. Ludlum, David M., Early American Hurricanes 1492-1870, American Meteorological Society, Boston, Mass.,~ 1963.
60 U~~~ S, Army Engineer District, Mobile, "Hurricane Survey of Northwest Florida Coast", December 1964.
7. U .. s. Army Engineer District 11 Jacksonville, "Survey Report, Analysis of Hurricane Problems in Coastal Areas of Florida", September 1961.
8. Day, Wilfred P., "Summary of the Hurricanes of 1919, 1920 and 1921," Monthly Weather Review, Vol. 49, December 1921, pp 658-659.
9., DUNN, George E., and staff, "Florida Hurricanes," ESSA Technical Memorandum WBTM-SR-38, Environmental Science Services Administration, Weather Bureau, Southern Region Headquarters, Fort l-Yorth, Tex., November 1967.
10"' Norton)ll Grady, nHurricanes of the 1950 Season", Monthly Weather Review Vol. 79, January 1951, pp 8-15.
11., Patterson, J .. L., Jo F. Baily, and J. L. H. Paulhus, "Hurricane Agnes Rainfall and Floods, June-July 1972," u. s .. Geological Survey Professional Paper (to be published).
12. Ue S .. Army Engineer District, Jacksonville, "Flood Plain Information, Coastal Areas, Levy County, Florida 1/' June 1973.
13.. Graham, Howard Ee 9 and Dwight E. Nunn, "Meteorological Considerations pertinent to Standard Project Hurricane, Atlantic and Gulf Coasts of the United States," National Hurricane Research Project Report No. 33, U. s. Weather Bureau and Corps of Engineers, Washington, D. c., November 1959.
25
14. Ho~ F. P., R. w. Schwerdt, and H. V. Goodyear, "Some Climatolo~ical Characteristics of Hurricanes and Tropical Storms, Gulf and East Coasts of the United States," NOAA Technical Report (to be published).
15. Jelesnianski, Chester P.~ "Numerical Computations of Storm Surges With Bottom Stress,u Monthly Weather Review, Vol .. 95, November 1967, pp 740 to 756 ..
16.. Jelesnianski, Chester P .. , "SPLASH- (Special Program to List Amplitudes of Surges from Hurricanes) I. Landfall Storms," NOAA Technical Memorandum NWS TDL-46, Techniques Development LaboratOry, Systems Development Office, ~TWS, NOAA, Silver Spring, Md., April 1972 ..
17.. Barrientos, Celso s., and Chester P. Jelesnianski, "Storm Surge Shoaling Corrections Along the Gulf Coast," Techniques Development Laboratory, Systems Development Office, NWS, NOAA, Silver Spring, Md., Report to Department of Housing and Urban Development, December 1973 ..
18.. Harris, D. Lee, "Characteristics of the Hurricane Storm Surge," u. s. l-1eather Bureau Technical Paper No. 48~ U .. S .. ~Jeather Bureau, Department of Commerce~ Washington, D. c., 1963.
19. Beard~ Leo R .. , "Statistical Methods in Hydrology," U. s. Army Engineer District, Sacramento, Calif., Corps of Engineers, January 1962 ..
20.. Sugg, Arnold L., and Robert L. Carrodus, "Memorable Hurricanes of the United States since 1873", ESSA Technical Memorandu~ WBTM-SR-42, Environmental Science Services Administration, Weather Bureau, Southern Region Headquarters, Fort Worth, Tex., January 1969.
21. Department of Commerce, NOAA, "Flood Insurance Study, Manatee, Sarasota,and Charlotte Counties, Florida," Study for Federal Insurance Administration, u .. s. Department of Housing and Urban Development, 1973 ..
26
0
lEGEND
HURRICANE
TROPICAl STORM
0 1 AM lEST POSITiON
8 1 PM EST POSITION
COUNTY BOUNDA
Figure le--Tracks of hurricanes affecting northeastern Gulf toast, 1871-1973e
Figure 2.--Probability distribution for central pressure adopted for Cedar Key, Fla., with class interval values (dashed line)
28
H~V38
n~nss~3J..3d
"J..S
SDNI~dS
NOdl:IV.l
l.l:IOciAV8
83/\ll:l lV.lSAl:l8
H~V38
30HS3S80H
.lNIOd A3Nid
SONVlSi >1~08
S>ltiVIAl "J..S
3ll38V88V~
VlO~IH~VlVdV
S\fl8 N\fS 3d\t:)
"'" ~
' \:
d!!l ~~
.... .... " .... '\':
---------------~ -----------------\ \
' ' B g I
----------------L ----------------1 I
I I.
' ~ \ \
\
' ' I ---------------~-'03 NOSl:l3:1:13r I ----------------~
I A.lNOO~ I '1110)1\fM \
\ ----------------~
\ \
' ' ' ' ' .......... ' ..... ' ' ~ .........
...I ..... ,
~ \ \ \ \
0 M
a: \ ----------------------------4-
0 N
. \ \
80.1.~\t::J 9Nil\tOHS
,.--. ,..... r-1
H (l,l +-1 ~ ro +J trl ro 0 (.)
~ r-1 :::1 0
.E e .s (1.) <( +J 0 fl.l ro
(l,l ..c: +-1 H 0 s::: oc ~ 0
r-1 ro (!)
> H :::1 (.)
H 0 .w u ro ~
00 ~
<r-1 r-1 cU 0 ..c:
Cf.)
I I ..
('"f)
(l,l H ::s 0(;
•r-1 ~
.... :- . .. .. ~ .
-...... .. .. ·.. . ... .. ... -. . . .. . .. . .
I -'\' 20
Figure 4.--Water depths off northeastern Gulf coast.
29
... · .. ' .. • • • I;
. .. · ..... ,. • • .. t I
... ·. · ......
. ..
30
22
20
18
16
.n E E. 14
1-::c (.'J
UJ ::c UJ Cl i= 12 ....1 <( 1-0 1-
10
8
6
10 50 100 RETURN PERIOD (years)
Figure 5A.--Total tide frequency curves on the open coast at Clearwater, Bayport, and Cedar Key, Fla.
Note: Datum reference is local mean sea level. See parae 5e2.1 for adjustment to National Vertical Datum of 1929.
1-J: 5:2 w J:
22
w 14 0 i= ....1 <( 1-
~
RETURN PERIOD (years)
Figure 5B.--Same as figure SA for Rock Islands, Carrabelle, and Ap~lachicola, Fla.
31
en <( <( .....1 w .....1 0 .....1 co () .....1 z I UJ <( () aJ (/) <( <C w .....1 a: Q.. <( a: <( Q.. <( () <( ()
0 0:: (!) 1- w z z UJ >- 1- 0::
en <( 0 UJ 1- <( :::> ~ .....1 0 I ~ .....1 aJ a: (/) Q.. (/) <( a: ZCI) S; cni <( - LUI a: 1-o:: 0 o<.!J a:
~ ~ >- (/)(_) <( cnw Q.. a..Z <( ~() () w 0::<( 0 >- c:c- w . 1- <(
r..: 0 z Ow w >-> <( <(a: .....1 1-WW 0::- t-55 (/) 0:: 0: IaJ u ()0:: aJ u (1)0..00
30 ~
FRANK UN COUNTY
~ I I I
25
_j_ <> i o1 TAYlOR I DIXIE I lEVY I ~ > : 0 > I O>i PINEllAS ..J .... 1ul COUNTY I COUNTY I COUNTY I ..... c .... ,. ~ !i: I COUNTY ..J;z I I f=Z lzz I ::J:> 1z1 I _:> 1<=> <::> ~0 1o1 I I I ug 1 zo I CL.o <((.) ,~, I I I lffi 0 I u $:
1wl I I I I :I: ,~, I I I I 1wl I
~ -,I I I I
I I I I l I ~ I I
-:- 20 I
19.11 .,;
E I I
~ j: 15 t:J UJ I w 0
i= 10
5
0 I I I I I I I I I I I I I II I I I " I I " I I I! I b I I I I I I I I II I
0 50 100 150 200 DISTANCE FROM CAPE SAN BLAS, FLORIDA (n.mi.)
Figure 6.--Tide frequency profile along northeastern Gulf coaste
Note: Datum reference is .local mean sea level. See parae So2.1 for adjustment to National Vertical Datum of 1929e
250
w N
.,;
E ~ 1-J: (.!)
w J: w 0 i=
~ ...J a:l
z <( U'J w a.. <( u
<( ...J 0 u J: u <( ...J <( a.. <(
FRANKLIN COUNTY
A 1837
A 1972
A 1915 &. 1950 !A 1953
&1956
U'J ~ a: <( ~
t;;
~ I ·i <( ~ i81 j z lzl ::J ::J lo 1 ~ 01~1 "<( u lwl 3: 1u.1
l:fil ..,I
I I I I I I
~
I I
1851A 1877A 1837A
1972A
1941A
1956&
U'J• ci z <( ...J ~ ~ u 0 a:
1-z 0 a.. >w z 0::
w 0 J: en WJ: cnu 0:::<( Ow J:a:l
>w ~
a: <( 0 w u
COUNTY
A 1888 A 1966/72 A 1896
/A 1894 ~ 1935 A 1968
...J <( I- a: U'Jw >-> 0:::ua:::
(1))::lta:z 1-::J -o uu
A 196EJ I I I I I I I I I I
1-a::: 0 a.. ><( a:l
zU'J o<.? a..Z a:::<(0::: .... es
I I
<.? a: ::J a:l
~:I: wu . 1- <(
.... ww CJ)Q..a:l
I I A 1966 ~ 1921 &1921 I I I I I I I I I I I I I I I I I I I I 1
1 I I I I I •1 1 I I I II I II I I I I h I I I I I I I I I h I 0 I I II I I I 100 150 200 250 0 50
DlSTANCE FROM CAPE SAN BLAS, FLORIDA (n.mi.)
Figure 7.--Some representative high-water marks ( ~) with storm dates and total tide frequency profile for 100-yr return period (from fig. 6).
(.A)
w
en
E ...... Q) Q)
!::. 1-J: (.!)
w J: w .Q
i=
25 1
" ANNUAl HIGHEST TIDE {1939-1972).
A, HURRICANE HIGH-WATER MARKS.
[&] ESTIMATED.
* TIDE HEIGHT UNKNOWN (HURRICANES OF 1877, 1881, AND 1886).
e e see 8
eeee e&o e:oe
00 e C9
" "
I I I I I I I I I I I I I I I I I I I I I I I I I I I I I I I I
~I A ·
~1894 &1935
1~1968 I
"I I I I I I I I
0 3 4 5 1 0 50 1 00 500 2
RETURN PERIOD (years)
Figure B.--Comparison of tide frequency curve (Cedar Key, Fla .. )