NOAA Technical Memorandum NWS WR-105 FORECASTING THE MONO WIND Charles P. Ruscha, Jr. Weather Service Forecast Office Seattle, Washington February 1976 UNITED STATES I NATIONAL OCEANIC AND y NATIONAL WEATHER DEPARTMENT OF COMMERCE ATMOSPHERIC ADMINISTRATION / SERVICE Rogers C. B. Morten, Secretary Robert M. White, Administrator George Cressman, Director
Transcript
NOAA Technical Memorandum NWS WR-105
FORECASTING THE MONO WIND
Charles P. Ruscha, Jr.
Weather Service Forecast Office Seattle, Washington February 1976
UNITED STATES I NATIONAL OCEANIC AND y NATIONAL WEATHER DEPARTMENT OF COMMERCE ATMOSPHERIC ADMINISTRATION / SERVICE Rogers C. B. Morten, Secretary Robert M. White, Administrator George P~ Cressman, Director
TABLE OF CONTENTS
List of Figures iii
I . Introduction
II. The Sierra Nevada
II I. Type 1--The Great Basin High Mono 1-2
IV. Type I 1--The Jet-Stream Mono 2
v. Case Study of A Jet-Stream Mono 2-3
VI. Mono Winds and Fire Season 3-4
VII. Forecasters' Check I i st
A. Check I i st for a Mono Watch 4-5
B. Check I i st for a Mono Warning 5-6
V Ill. Acknowledgments 6
IX. B i b I i og rap hy 6-7
i i
LIST OF FIGURES
Figure I. Schematic Topographic Chart of Central California
Figure 2. Surface and 500-mb Charts, October 13 -15, 1954, I I lustrating the Great Basin High Type of Mono Wind
Figure 3. Cross Section Through San Joaquin Basin and Author's Conception of Wave Structure of Northeast-Southwest Flow During Strong Jet-Stream
8
9
Mono Wind 10
Figure 4. Twelve-Hour Positions of Centerline of Jet Stream at 500-mb Level Beginning 1200 GMT, December 5, 1971 CA) Through 1200Z December 8, 1971 CG) I I
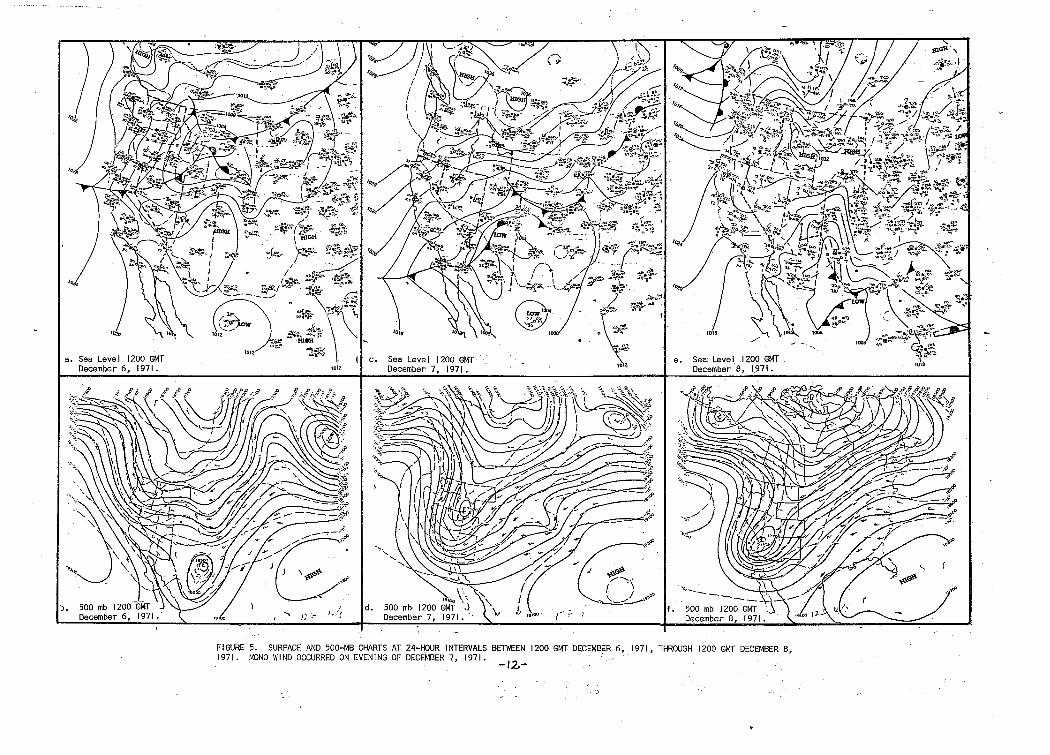
Figure 5. Surface and 500-mb Charts at 24-Hour Intervals Between 1200 GMT December 6, 1971, Through 1200 GMT December 1971 12
Figure 6. 500-mb Chart Over \'Jestern States for 0000 GMT December 8, 1971 13
Figure 7. Primitive Equation Six-Level 36-Hour 500-mb Prognostic Chart Valid at 1200 GMT December 8, 1971 14
Figure 8. Primitive Equation Six-Level 12- and 24-Hour 500-mb Prognostic Charts Valid at 0000 GMT December 8, 1971 15
Figure 9. Badger Pass, Yosemite National Park and Ski Lift, After Mono Wind of December 7, 1971 16
Figure 10. Twelve-Hour Positions of Centerline of Jet at 500-mb Level Beginning 1200 GMT October 1969, Through 1200 GM~ October 4, 1969
Figure I I. Twelve-Hour Positions of Centerline of Jet at 500-mb Level Beginning 1200 GMT Octoper Through 1200 GMT October I I, 1969
iii
Stream I ,
17
Stream 9, 1969,
18
FORECASTING THE MONO WIND
I. INTRODUCTION
In the western United States there are many foehn-type winds that occur near mountain ranges. Some of the strong, dry downslope winds are named and others are not. On the western slopes of th~ high Sierra Nevada (Figure 1), the northeasterly foehn winds are cal led the Mono. Mono is from the. name of an Indian tribe that I ived in the area. Mono winds have seemed quite mysterious in the past because the winds suddenly swoop down the west slopes of highest ranges of the Sierra Nevada to their lowest slopes.
Over the years, there have been several Mono episodes which have occurred in the Sierra, but these winds do not always occur at the same spot. Fortunately, for forest managers and fire crews, this wind does not occur during the summer months June through August, the most critical months for fire suppression. The Mono can occur near the end of fire season from September on, however, creating very dangerous conditions. Mono wind episodes average about one or two a year; some years they do not occur at alI. In October 1969 two strong Monos occurred over the Sierra National Forest separated in time by only one week, The strongest Mono winds in recent years have occurred in December and January. There are basically two types of Mono situations over the Sierra Nevada. One type is closely associated with the Great Basin surface high and the other with the polar jet-stream.
I I. THE SIERRA NEVADA
The mountain peaks in the Sierra Nevada from Lake Tahoe southward to just south of Mount Whitney are the highest sections of the range, and extend 175 miles in length. Mount Whitney, the highest peak, is at an elevation of 14,495 feet, and there are several peaks wei I over 13,000 feet. The terrain south of Mount Whi~ney gradually drops to four- or six-thousand feet at the extreme south end of the range. The slopes on the west side of the Sierra Nevada are not as steep as the slopes on the east side. On the east side, the mountains rise abruptly to the crest in about five miles, hut on the west side there are ridges and slopes extending 30 miles from the crest to the southwest at elevations of seven to twelve thousand, and southwest another 20 miles the terrain has an elevation of two- to six-thousand feet. One of the largest basins on the western slopes of the Sierras is the upper San Joaquin River Basin. On the cirest above the basin, Mammouth Pass has an elevation of 9200 feet, and is one of the lower passes among the higher Sierra.
I I I. TYPE I--THE GREAT BASIN HIGH MONO
The Great Basin High type Mono occurs after the passage of a cold front and its short-wave upper-level trough, A surface high-pressure area bui Ids over the Great Basin and the resulting strong pressure gradient between the
surface high and the thermal trough in California causes a Mono situation (Figure 2), Temperatures are mild and low relative humidities combined with strong local winds produce extreme fire danger. Usually the high fire danger lasts only a couple.of days, Quite often the pressure gradient pattern first develops a northerly wind in the upper Sacramento Valley, "then a northeasterly to easterly wind occurs over the Sierra Nevaoa, e~nd f ina I I y sett I es into an easter I y wind (Santa Ana) over southern Ca I i fornl a. The polar jet stream rs wei I east of the Sierra Nevada under this type of. Mono. Coo I air from a northeast f I ow a I oft in the I ower. I eve Is . is steered. into the Great Basin and across the Sierras by' the I ow-l eve I pressure gra-, dient. The winds·aloft are often quite light~ 20 knots or less above 7000 feet. The hJ gher ranges of the S i er:-ra b I ock fhe east f I ow so that most .of· the east winds are noticed in the northern Sierra arid in the extreme sowthern portions where the crest of the Sierra is lower, Even though the western slopes of the high Sierra Nevadas do not have much of the. east ~ind with this type of Mono, the humidity drops and the nighttime drainage wi~ds in the larger valleys are usually a. little stronger than normal.
I V •. TYPE I 1 .... ..., THE JET -STREAM MONO i'
The ·jet-stream Mono occurs over the highest peaks of .~he Sierra Nevada and their western slopes. When the polar jet is oriented north-south, or nearly so, over central California, a Mono is usually occur~ing or about to. The polar jet-stream type is Rreceded by the passage of a cold front and its short-wave trough. There is a surface high-pressure area over the Pacific Northwest or the Great Basin. The more perpendicular the polar jet flow becomes to the Sierra Nevada, the stronger the Mono. The strong flow aloft carries the cold air mass over the Great Basin and down the western slopes. Although thermodynamic heating occurs on the lower slopes, the temperatures are usually below .normal; but humidities are extremE?IY low and combined.with locally very strong winds produce extreme fire danger.
When the flow crosses the high Sierra, mountain waves develop on the lee slopes. These· mountain waves and their amp I itude are dependent on the wind profile aloft, air temperature, the static stabi I ity, and the mountain terrain. During the day, the jet-stream Mono hits mainly the high ridge tops and passes. At night the winds strike the lower ridges and lee slopes. These northeast winds are quite localized and hit with great force. The chatacter of the winds has.been observed to be quite gusty at nlght with speeds estimated at ~0 mph or more. A mile or two away the winds can be nearly calm .. These s~rong winds at the lower elev~tions do not normally last more than a few hours, but can be quite destructive. The San Joaquin Basin is a preferred area tor the Type I I, When a jet stream occurs over· this basin, a strong mountain wave undoubtedly sets up aloft over Shuteye Peak (Figure 3). The Mono winds at Base L:ake and Goat Mountain have been estimated.to be up to 80 mph at times,
V. CASE STUDY OF A JET-STREAM MONO
A strong Mono on the evening of December 7, 1971, followed a typical sequence of synoptic events. In Figure 4, the 500-mb jet-stream centerline has been plotted for successive 12-hour ihtervals with wind speeds of 65
-2-
knots or more. The jet center! ine on 12Z December 5, 1'971, was positioned north of 45 degrees North Latitude and entering central Oregon. A strong thermal gradient was located at point "A", Twelve hours later, at OOZ December 6, 1971, the jet has rotated clockwise with warm-air advection at the tai I of the 65-knot isotach. The following 12-hour intervals continue to rotate the jet clockwise and southeastward. The points of strongest
'thermal gradient on jet centerline are located at points A, B, C, D, E, F, and G. The Jet center! ine at OOZ December 8, 1971, is located nearly northsouth over central California with a maximum wind speed of 100 knots.
The surface and 500-mb charts of 12Z December 6, 1971 (Figures 5a-5b) show a cold front moving through California and Nevada with an upper level trough moving through the Pacific Northwest. At 12Z December 7, 1971 (Figure 5d), the 500-mb chart shows winds at Oakland at 80 knots. The upper level ridge of high pressure continues to build over Alaska with warm advection continuing at the top of the ridge. The surface chart, Figure 5c, shows a front now into Arizona with a strong pressure gradient running the length of California <Medford~Needles =22.9mb), At 0000 GMT 8 December (Figure 6), winds at the 500-mb ~evel are 100 knots at Oakland and Winnemucca and the closed low has moved into northwest tip of Arizona. By 12Z December 8 (Figure 5e-5f), the surface pressure gradient has weakened over California, and the 500-mb closed low has moved over the lower Colorado River.
With the advent and progress in Numerical Weather Prediction CNWP), it is now feasible to forecast these relatively rare and, in the past, mysterious winds. In this case, for example, the 36-hour PE 6-level 500-mb prognostic chart (Figure 7) was remarkably accurate--with the low center over lower Colorado River Val ley and 80 knot northeasterly flow over central California, As the time of the event comes closer, the 12- and 24-hour 500-mb progs (Figure 8) continue to show a very strong contour gradient over the. Sierra Nevadas with a northeasterly flow.
During the ev~ning of December 7, 1971, the U. S. National Park Service in Yosemite estimated wind speeds of over 70 mph. Over 200 trees were blown down in Yosemite and several trees downed in the Northfork and Big Creek· areas in Sierra National Forest, The ski I ift at Badger Pass in Yosemite Park was severely damaged (Figure 9), Other examples of strong Type I I Mono winds occurred during the evening of March 26, 1970, and December 12, 1967. At Mi I lerton Lake, about 15 miles northeast of Fresno, wind gusts were estimated at over 70 mph in both cases, buring the December 12, 1967, event Bass Lake had over one mi I I ion dol Iars of property damage when these winds hit a populated area,
VI. MONO WINDS AND FIRE SEASON
A Mono can occur toward the end of fire season during the fa I I months. By September a Mono can push fire indexes to critical levels in a short time.
In late September of 1970 a type I Mono persisted during the Red Mountain fire. Strong east winds and low humidities fanned this fire over 25,000 acres and destroyed eight mi I I ion dol Iars in timber, During the same period, September 25th through October 3, 1970, major fires spread over thousands of acres of land in southern California under Santa Ana conditions.
-3-
In October 1969, two Type I I Mono winds hit the Sierra National Forest. On October 3, 1969, winds of 40 tb 60 mph were eatimated in the uppe~ Sari Joaquin· Basin, and fire indexes soared to criti ca I I eve Is. On· October II, 1969, another jet-stream Mono occurred, The shutters on Goat Mounta. in ,Lookout were blown off during the nighttime hours. Fortuna-tely no major fires occurred during these two strohg Monos, The 500-mb jet-stream cenferl iri€;1 tracks of these October Mono episodes followed the pattern described in the previous section (figures 10 and' II); but the October II Mono was faster i n the rotation of the jet stream and deve I opment of the riorthe r I y flow.
It is interesting for the forecaster to note that when a strong Type 1.1 Mono occurs in December or January~ 'a hard freeze can be expected in'the· San Joaquin Valley the following night. On the night of De.cember 13,. 1967, minimum temperatures fell to the upper teens and.low 20s in the citrus belts, resulting in widespread frost damage.
VI I , FORECASTERS 1 CHECKLIST
The following rules, or check! ists, were developed from the study of only a relatively smaiJ number of known Mono situations, The negative check has not been made, i.eq the relative frequency with which the conditioi"),S are met and Monos do not occur has not been determined, lri addition, if has not been e.stab I ished that the strong north-to-northeast winds a I oft, which are a necessary condition for the Type I I Mono, cannot develop in other ways than that implied by the rules, The check! ists are intended, therefore, to alert and guide the forecaster in recognizing situations in wh 1 ch the probab il i ty of a Mono occurrence is undoubted I y high, .1 n any event, the key to successfully forecasting these strong winds is a reasonably accurate numerical prognostic chart.
A. Checklist for a Mono Watch:
I. First ~ake an isotach analysis of the 500-mb chart over the western United States and eastern Pacific. Sketch in the centerline of the polar jet and note the position of the 65-knot isotach along this center I i ne,
Check the 500-mb analysis for the following:
a. A strong northwest f I ow ( 65 knots or more) I ocated near the Oregon coast.
b. A short-wave trough along the jet and upstream from the coast.
c. A ridge bui I ding between 130 and 150 degrees west longitude.
d. Warm-air advection at the top of the ridge near the tai I of the northwest end of the 65-knot isotach,
-4-
e. Strong temperature gradient perpendicular to the 500-mb jet.
f. Cold-air advection on the southeast end of the 65-knot isotach.
g. Center I ine of the jet rotating Clockwise from Its previous position.
2. Make a Close Inspection of the 500-mb Baroclinlc Progs:
a. Check for a maximum contour gradient (jet) over central California.
b. The flow and orientation of the jet near the Sierra Nevadas should be from 310 to 060 degrees.
c. A cut-off low may from, but if it forms upstream from central California, it wi I I terminate the chances of a Mono.
3. Check the Surface Chart for the Following:
a. A cold front (sometimes weak) across the Pacific Northwest moving southeastward.
b. The pressure gradient fairly weak over California in comparison to the gradient behind the front,
B. Checklist for a Mono Warning:
A Mono warning can be made by the forecaster 12 to 18 hours prior to the Mono; check! ist follows, Again the baroclinic progs are the most important tool for the forecaster,
I . On the current and immediate past 500-mb charts, I ook for the fo I I ow i ng:
a. The center I ine of the jet has entered northern California and I ies west of the Sierra Nevada,
b, The jet stream is oriented nearly north-south and rotating clockwise as it moves southward in time,
c. Warm-air advection is wei I to the north or northwest and upstream from central California, Warm-air advection already entering northern California and Nevada for some reason has been unfavorable for strong Mono winds on the western slopes although mountain waves probably occur,
2. Make a check of the 12- and 24-hour 500-mb progs. Again check the flow and orientation of the contour gradient over central California.
-5-
3. Check the surface chart for the following:
cL A strong pre'ssure gradient across most of California running the entire length from north to south .. The pressure difference between
· .. Medford arid Ne'edles should be about' 16mb or· more.
b. A surface' low has formed near the lower Colorado River.
c. A weak, dry cold front has already moved southward)across the Great Basin.
There are two types of Mono winds, Type I is associated with aGreat Basin surface high-pressure area, and Type II is closely associated with the polar jet stream. ·Both Mono winds are ·associated with cool air which has spread into the Great Basin from the north or northwest.
The jet-stream Mono has the' colder temperature. Air descending on the lee sides undergoes thermodynamic heating, but the tempera~ures do not warm above nbrinal while the relative humidity become~ extremely low. The jet-stream Mono can be quite strong at night and hit a seemingly protected val ley for a few hours with destructive force, In forecasting the Type I I Mono, -the 500-mb barocl inic prog should be watched closely to ·find a strong north-to-northeasterly flow 6ver central California, A strong wind cannot be pinpointed, but a Mono Warning can be issued for an area the size of a natio~al forest.
A short-wave trough, the Great Basin high developed behind the trough, and the surface pressure gradient across the Sierra Nevada are the essentials in forecasting a Type I Mono.
VI I I . ACKNOWLEDGMENTS
I would I ike to express my appreciat'ion to Mr. Woodrow w~ Dickey and Mr. Leonard W. Snel lmanJ Scientific Se~Vices DiVision, Weste~n Region Head
·qua·rters, and Mr. Lester P. Mallory, Meteorological Services pivlsion, Western Region Headquarters~ for their comments and suggestions. A special thanks to Dr. Richard Reed, Professor in the 'Department of Atmospheric Sciences, University of Washington, for his encouragement. Also thanks to Mrs. Lenor:e G.i ebe I haus for her typing assistance.
I X. B I BL I OGRAPHY
I. MALONE, THOMAS F. Compendium of Meteorology, American Meteorological Society, pp. 667-671, 1951,
2. SCHROEDER, MARK, et a I. Synoptic Weather Types Associated with CriticaZ Fire Weather. Office of C i vi I Defense, page, 246, 1964,
-6-
3. SCHROEDER, MARK and CHARLES C. BUCK. Fire Weather Agriculture Handbook 360, U. S. Department of Agriculture, Forest Service, pp. 63, 102-103, 1970.
4. WMO TECHNICAL NOTE NO. 34. The Airj1ow Over Mountains, pp. 44, 47; 1960.
-7-
Figure I. Schematic Topographic Chart. of Central Catifornia.
-8-
FIGURE 2. SURFACE AN D 500-MB CHARTS OCTOBER 13 - 15 1954,
_q_
4000
San Joaquin B'asin 2000 ft,
0 5 10 20 30 miles
Southwest MONO WIND Northeast
CROSS SECTION SW-NE THROUGH SAN JOAQUIN BASIN
Note: Higher mountains riorth of basin are shown as a dashed line.
Figure 3. Cross-Section Through San Joaquin Basin and Author's Conception of Wave Structure of Northeast-Southwest Flow During Strong JetStream Mono Wind.
/
-10-
.\ . Point·of Strongest Thermal Gradient on
Jet Centerline.
~Leading Edge of Warm Air Advection on 17" Jet Centerline.
t Figure 4. Twelve-Hour Positions of Center! ine of Jet Stream at 500-rnb
Level Beginning 1200 GMT, December 5, 1971 CA) Through 1200Z December 8, 1971 (G). Mono Wind Occurred on the Evening of December 7, 1971 (Fo I I owing 0000 GMT Dec8rr,ber 8, Line F) •
' ----..,.__, I -Jr--1~+--1---+--L-~-----+-, Jo·..J.---1-~-+--+----t-
• . :P~. , ~- 'l :::a?f ~\ '1 "" . ~ "'*-"'·"''' 101' 1008 ~e~~ ...-\ m
1016 / -· .... I <> 'i:.:-.. Sea Leve I 1200 GMT December ·a, 1.971.
"'1o' 1012
,.
FIGURE 5. SURFACE AND 500-MB CHARTS AT 24-HOUR INTERVALS BETWEEN 1200 GMT DECEMBER 6, 1971, THROUGH 1200 GMT DECEMBER 8, 1971 • ~ONO WIND OCCURRED ON EVENING OF DECEMBER 7, 1971 • -!2. _
I
-g GZ
·-
.".;
500MB oo;; Dec 8, \Cf1r· .--
_/
Figure 6. 500-mb Chart Over Western States for 0000 GMT December 8, 1971. Note 100-Knot Winds at Winnemucca, Nevada, ard Santa Maria, Cal ifornla. Mono Wind Occurred During Hours Following This Time. -i.)-
3tQ \-\""' sool"S\=izot.~· (p-\...E'I"''-\3F1=0-' ,J\ G
Figure 8. -t-
12.. HR 500MB PRo Vo~c..,T-"-1
B~~oG,~\N\C..
Q<z.~
24-HR 500MB R '-J 0 "t<:\ \C.\ -r,l I 'l *!:
£3-~·iR. 0 C.\-\ N \ G 12jcaL-r1 Pri~itive Equation Six-Level, 12- and 24-Hour 500-mb Prognostic Charts Va I i .d at COCO GMT anci 1200 GMT December 8, 1971 .
-15-
Figure 9. Badger Pass, Yosemite National Park and Ski Lift, After Mono Wind of December 7, 1971.
-16-
135• 130•
~ Point of Strongest The rma I Gradient on Jet Center! ine.
f"'-....... Leading Edge of Warm Air Advection on P" Jet Centerline.
1 T
Figure 10. Twelve-Hour Positions of Centerline of Jet Stream at 500-mb Level Beginning 1200 GMT October I, 1969, Through 1200 GMT October 4, 1969. Mono Wind Occurred on the Evening of October 3, 1969.
-17-
'
l _'"':'"\_
'
J. Point of Strongest Thermal Gradient on r Jet Cehterl ine.
r-.....Leading Edge of Warm Air Advection on ·~ Jet Centerline .
"' -, Figure I I. Twelve-Hour Positions of Center/ ine of Jet Stream at 500-mb Level Beginning 1200 GMT October 9, 1969, Through 1200 GMT October I I, 1969. Mono Wind Occurred on the Evening of October I I, 1969.