NOAA Technical Report NOS CO-OPS 055 Ocean Systems Test and Evaluation Program noaa National Oceanic and Atmospheric Administration U.S. DEPARTMENT OF COMMERCE National Ocean Service Center for Operational Oceanographic Products and Services Visibility Sensors Implementation Plan Silver Spring, Maryland December 2009
Transcript
NOAA Technical Report NOS CO-OPS 055
Ocean Systems Test and Evaluation Program
noaa National Oceanic and Atmospheric Administration
U.S. DEPARTMENT OF COMMERCE National Ocean Service Center for Operational Oceanographic Products and Services
Visibility Sensors Implementation Plan
Silver Spring, Maryland December 2009
ii
Center for Operational Oceanographic Products and Services National Ocean Service
National Oceanic and Atmospheric Administration U.S. Department of Commerce
The National Ocean Service (NOS) Center for Operational Oceanographic Products and Services (CO-OPS) provides the National infrastructure, science, and technical expertise to collect and distribute observations and predictions of water levels and currents to ensure safe, efficient and environmentally sound maritime commerce. The Center provides the set of water level and tidal current products required to support NOS’ Strategic Plan mission requirements, and to assist in providing operational oceanographic data/products required by NOAA’s other Strategic Plan themes. For example, CO-OPS provides data and products required by the National Weather Service to meet its flood and tsunami warning responsibilities. The Center manages the National Water Level Observation Network (NWLON), a national network of Physical Oceanographic Real-Time Systems (PORTS®) in major U. S. harbors, and the National Current Observation Program consisting of current surveys in near shore and coastal areas utilizing bottom mounted platforms, subsurface buoys, horizontal sensors and quick response real time buoys. The Center: establishes standards for the collection and processing of water level and current data; collects and documents user requirements which serve as the foundation for all resulting program activities; designs new and/or improved oceanographic observing systems; designs software to improve CO-OPS’ data processing capabilities; maintains and operates oceanographic observing systems; performs operational data analysis/quality control; and produces/disseminates oceanographic products.
Ocean Systems Test & Evaluation Program
The CO-OPS Ocean Systems Test and Evaluation Program (OSTEP) facilitates the transition of new technology to an operational status, selecting newly developed sensors or systems from the research and development community and bringing them to a monitoring setting. OSTEP provides quantifiable and defensible justifications for the use of existing sensors and methods for selecting new systems. The program establishes and maintains field reference facilities where, in cooperation with other agencies facing similar challenges, devices are examined in a non-operational field setting. Through OSTEP, sensors are evaluated, quality control procedures developed, and maintenance routines generated. The quality of the reference systems used in the field is assured by both rigorous traceable calibrations and redundant sensors.
The Ocean Systems Test & Evaluation Advisory Board consists of:
Mark Bushnell, NOAA/NOS/CO-OPS Karen Earwaker, NOAA/NOS/CO-OPS
Warren Krug, NOAA/NOS/CO-OPS Philip Libraro, REMSA Consultant W. Douglas Wilson, NOAA/CBO
Bill Burnett, NOAA/NDBC Kent Hathaway, USACE/WES
NOAA Technical Report NOS CO-OPS 055
Ocean Systems Test and Evaluation Program
U.S. DEPARTMENT OF COMMERCE Gary Locke, Secretary
National Oceanic and Atmospheric Administration Dr. Jane Lubchenco Undersecretary of Commerce for Oceans and Atmosphere and NOAA Administrator
National Ocean Service John H. Dunnigan, Assistant Administrator
Center for Operational Oceanographic Products and Services Michael Szabados, Director
Visibility Sensors Implementation Plan
Eddie Roggenstein
Mark Bushnell
Warren Krug
December 2009
iv
NOTICE
Mention of a commercial company or product does not constitute an endorsement by NOAA. Use of information from this publication for publicity or advertising purposes concerning proprietary products or the tests of such products is not authorized.
v
TABLE OF CONTENTS
List of Tables ................................................................................................................................. vi
Acknowledgments......................................................................................................................... vii
Executive Summary ....................................................................................................................... ix
4.0 Implementation Steps......................................................................................................... 11 4.1 System Data Integration ................................................................................................. 11
4.1.1 OSTEP Requirements and Responsibilities .......................................................... 12 4.1.2 ISD Requirements and Responsibilities................................................................ 12 4.1.3 Oceanographic Division Requirements ................................................................ 12
4.2 Site Selection .................................................................................................................. 12 4.3 Development of Deployment Standards ........................................................................ 13 4.4 Maintenance ................................................................................................................... 13 4.5 Startup and Sensor Check .............................................................................................. 14
5.0 Continuing Collaboration................................................................................................... 17 5.1 Current Test Locations ................................................................................................... 17 5.2 Power Requirements ...................................................................................................... 17 5.3 FAA Acquisition of the Vaisala FS11............................................................................ 17 5.4 Additional Documentation ............................................................................................. 17
6.0 Summary and Recommendations ...................................................................................... 19
List of Appendices ........................................................................................................................ 22 Appendix A. Visibility Sensors Analysis Belfort Instrument Model 6000......................... A-1 Appendix B. Visibility Analysis of Belfort 6100 ............................................................... B-1 Appendix C. Visibility Sensor Analysis: VM100 Compared to a Belfort ASOS
Standard ......................................................................................................... C-1 Appendix D. High Visibility OCT Evaluation .................................................................... D-1 Appendix E. Visibility Accuracy: What’s Realistic? EnviroTech Sensors Report ............. E-1 Appendix F. Microsoft Project Plan – Visibility Sensor Installation .................................. F-1 Appendix G. Software Requirements Document for Visibility Sensor .............................. G-1 Appendix H. Federal Meteorological Handbook – Chapter 6 ............................................ H-1 Appendix I. Vaisala Users Manual: Chapter 3 .................................................................... I-1
The authors thank CO-OPS contractors Karen Grissom, Tammy Graff, and Jennifer Dussault for their contributions to our visibility effort.
Thanks also to Kathy Egan and Bruce Servary, who reviewed and provided valuable input to this implementation plan.
We also appreciate the cooperation and assistance from FAA employees and contractors Steve Burnley, Sean Jenkins, Mike McKinney, Joe Goslin, David Burnham, Leo Jacob, and Lesley Duncan, as well as Tom Seliga at the John A. Volpe National Transportation Systems Center. Special thanks to Ralph Hoar at the Otis ANG WTF.
Also, thanks to USCG personnel Michael Zemaitis, Rusty Doggett, John Doggett, Shawn Aussey, and Al Davis; and to USACE and Kent Hathaway for his assistance in testing at the Field Research Facility.
We thank Vaisala representatives Ken Goss and Janne Rasanen for their technical support.
We also thank our technical writer/editor, Helen Worthington (REMSA, Inc.) for her assistance in preparing this report.
Finally, we acknowledge with gratitude the efforts of Tom Keefer of Sutron Corporation to our visibility and other efforts requiring data collection platform integration and are saddened to hear of his June 2009 passing.
ix
EXECUTIVE SUMMARY
The Federal Aviation Administration (FAA) has used visibility sensors at major airports for many years, but the requirement within the maritime industry came in 1980, when the MV Summit Venture hit the Sunshine Skyway Bridge over Florida’s Tampa Bay. The disaster, in part due to lack of adequate visibility, was the impetus for the present day Physical Oceanographic Real-time System (PORTS®) system, and prompted much interest in and research on visibility sensors. The addition of visibility sensors to the PORTS® suite of instruments offers users another valuable tool to increase efficiency and to help avoid disasters that could cause loss of life and extensive property damage.
The Center for Operational Oceanographic Products and Services (CO-OPS) became involved in testing visibility sensors in 1999, after signing a Memorandum of Understanding (MOU) with the National Weather Service (NWS) to test Belfort Model 6100 visibility sensors at the Sterling Research and Development Center in Sterling, VA. Several other visibility sensors were tested from 1999 through 2003.
Since 1999, the Ocean Systems Test and Evaluation Program (OSTEP), has evaluated eight different sensors at five separate locations. These eight sensors represent four different kinds of technologies, and the evaluations have been conducted in cooperation with five Federal agencies. None of the sensors tested seemed to meet all 15 standards set forth by the NWS in the Federal Meteorological Handbook (FMH) #1; however, an FAA requirement for a new visibility sensor provided an excellent interagency opportunity to partner in the test and evaluation of the latest technology.
Based on a six-month FAA test conducted at the John A. Volpe National Transportation Systems Center at the Otis Weather Test Facility at Cape Cod, MA, the FAA selected the Vaisala FS11, which uses forward scatter technology, as its sensor of choice. OSTEP found that results from several other tests suggest that the Vaisala FS11 is also the best sensor for marine applications. Additionally, OSTEP is participating with the U. S. Coast Guard (USCG) in a joint test of six sensors in a long-term field test that began in March 2008 at U.S. Army Corps of Engineers (USACE) Field Research Facility (FRF) in Duck, NC. OSTEP is evaluating two Vaisala FS11 sensors to determine the optimal maintenance schedule, including how often the sensor lens must be cleaned, as well as to determine how the FS11 sensor readings compare with those of the other sensors.
In addition to the sensors at the FRF, OSTEP is also testing a Vaisala FS11 located in the courtyard at the CO-OPS Chesapeake facility. This fully functional sensor has performed well, has done a good job of monitoring itself, and has been interfaced successfully to a Sutron Xpert data collection platform (DCP). The sensor is now generating data, and, although the data are not ingested into the CO-OPS system, they are being transmitted on the GOES test channel.
The steps toward full implementation of an operational visibility sensor system include data system integration, site reconnaissance and selection of a specific PORTS® location, development of deployment standards, site preparation, development of a proper maintenance schedule, and performance of preliminary installation and startup. Additionally, as the visibility product is fully developed, users must be educated and a Web interface must be built to enable ease of use.
x
User education is critically important to achieve the desired results. Because visibility data often represent a small geographic area, users and product developers should consider placing multiple sensors within an operational visibility system so that users can observe the appropriate range of existing conditions.
Continuing efforts are needed to address issues such as power requirements for the FS11 and long-term field tests. Visibility sensors consume significant power due to hood and lens heaters, and presently require access to 110-Volt service to deliver accurate and reliable information. Sensors that are currently in the field at the USACE FRF and at the Chesapeake facility offer an ideal way to conduct long-term tests that provide more information about power requirements, corrosion, and maintenance issues.
Collaboration with other agencies is in the forefront of this visibility effort and has the potential to improve the technology. For example, the FAA has continued testing the FS11 and has worked with Vaisala to make modifications that improve its function within the aviation application. These changes have led Vaisala to offer the FS11 as a unique FAA sensor with its own part number; however the modifications do not make a significant difference for maritime use. Even so, the FAA keeps CO-OPS apprised of the status of modifications through distribution of a PowerPoint presentation, and the opportunity for partnership with the FAA and other agencies remains. Interagency cooperation may play a role in finding a solution to challenging issues, such as the visibility sensor’s large power requirements.
1
1.0 BACKGROUND
Tragedy often precedes progress and accelerates the development and improvement of modern technology. For example, the freighter MV Summit Venture’s devastating collision with the Sunshine Skyway Bridge over Florida’s Tampa Bay in May 1980 was the impetus for the development of the National Oceanic and Atmospheric Administration’s (NOAA) Physical Oceanographic Real-Time System (PORTS®), a suite of instruments that measure and disseminate real-time observations of water levels, currents, air gap (bridge clearance), physical oceanographic parameters (salinity, and water temperature), and meteorological parameters (wind, air temperature, and barometric pressure).
The technology to help the MV Summit Venture’s captain navigate in high winds, heavy rains and zero visibility was not well developed in the 1980s. If accurate air gap measurements and visibility sensors had been in place at the time, it may have helped the Summit Venture avoid areas with visibility so poor that the captain could barely see the ship’s bow. Visibility sensors are widely used and essential for aviation and are becoming more critical for maritime applications as well; however, the requirements for maritime use are different than those for aviation. In many harbors marine pilots require a stated number of miles of visibility in order to proceed, and while the intent of the rule is clear, the specific requirements are vague.
The PORTS® network, which presently consists of 57 stations, located at 19 of the Nation’s largest ports, does not yet contain visibility sensors, but demand for the technology remains strong. In response to user requests for the inclusion of visibility sensors in PORTS®, the NOAA Center for Oceanographic Operational Products and Services (CO-OPS, formerly Ocean Products and Services Division) signed a Memorandum of Understanding (MOU) with the National Weather Service (NWS) in 1999 to test visibility sensors at the Sterling Research and Development Center in Sterling, VA. The Ocean Systems Test and Evaluation Program (OSTEP) conducted tests of the Belfort models 6000 and 6100 sensors, comparing them to NWS Automated Surface Observing Systems (ASOS) standards in 2001 - 2003 (appendix A and appendix B).
OSTEP entered into a cooperative effort with the U.S. Coast Guard (USCG) C2CE Portsmouth, VA in March 2001 to test the Belfort visibility sensor models 6000 and 6100. Although the USCG was working with the Fidelity Technologies VM100 sensor, they were interested in the Belfort sensor and how well it and the VM100 met the NWS standards.
By late 2003, OSTEP had completed test and evaluation of Belfort sensors and had concluded that the tests did not demonstrate agreement with NWS standards for automated visibility sensors (appendix A and appendix B).
Visibility sensors are widely used by the Federal Aviation Administration (FAA) and the NWS for Runway Visual Range (RVR) and the ASOS, respectively. These agencies selected the Belfort sensor for their programs and procured them in large quantities in the 1990s. After a request for PORTS® visibility data, OSTEP attempted to buy the identical model used by the NWS to conduct the requested tests; however, Belfort no longer supported that model—so OSTEP purchased the closest available model—the Belfort 6100. (The NWS Automated Weather Interactive Processing System or AWIPS uses the Belfort Model 6230b.) OSTEP also
2
examined the Fidelity Technologies VM100, comparing it to NWS standards Belfort Model 6230b, but concluded that it also did not meet NWS standards (appendix C).
The interest in visibility sensors continued, and in August 2003, the Department of Commerce (DOC) funded Phase I and part of a Phase II Small Business Innovation Research (SBIR) project for video-based visibility sensor system (V2S2) technology. International Electronic Machines (IEM) Corporation completed Phase I of the project and was awarded Phase II to continue work on a prototype. Even though Phase II did not receive the full appropriated funding, IEM developed a prototype. V2S2 technology is more fully discussed in Section 2.
During late 2003 and early 2004, CO-OPS was involved in two visibility sensor tests. One was a January 2004 deployment and test of the Vaisala FD12 sensor (purchased before the FS11 became available) at Billy Mitchell Airport at Cape Hatteras. Following that deployment, CO-OPS participated in a joint test with the FAA and the USCG at the John A. Volpe National Transportation Systems Center at the Otis Weather Test Facility at Cape Cod, MA. A six-month operational test of low-cost forward-scatter visibility sensors for the RVR system was conducted using beam transmissometers as a reference (FAA 2006). Sensors from several vendors were tested for FAA requirements, and CO-OPS was able to include Aanderaa and EnviroTech devices as well. This tri-agency group adopted the Vaisala FS11 sensor as their sensor of choice in the spring of 2005. Based on the findings at the Volpe Weather Test Facility (appendix D), the FAA awarded a contract to Vaisala.
OSTEP used FY 2005 year-end funds to procure two Vaisala FS11 sensors. The test of these sensors was outsourced to the U.S. Army Corps of Engineers (USACE) Field Research Facility (FRF), but the MOU permitting the transfer of funds was not completed until FY 2007. This joint test, which began in March 2008, included six different forward scatter sensors being tested side by side, two procured by CO-OPS and the rest by the USCG. USACE established a Web site for viewing and retrieving data sets (http://frf.usace.army.mil/airvis/av.shtml). So far the CO-OPS intercomparison of the two FS11 sensors has yielded a satisfactory stability during long periods of neglect. Table 1 shows the sensors that are part of this joint test.
Table 1. Sensors Tested at the FRF
VM100 PWD 22
Belfort 6000 FS11-1 FS11-3
Envirotech
Over the past eight years OSTEP has tested eight different visibility sensors that represent four different technologies. These tests, conducted at five separate locations, include cooperative evaluations with five other agencies. Table 2 outlines OSTEP efforts to select the best technology and sensor for operational consideration.
3
Table 2. OSTEP Efforts to Select the Best Visibility Technology
Belfort 6100 Volpe National Transportation Systems Center
Belfort 6000 Sterling Research and Development Center
Test data from both the Volpe test and the FRF have also lead OSTEP to conclude that the Vaisala FS11 visibility sensor best meets maritime user requirements. These data, as well as a report prepared by John D. Crosby of EnviroTech (appendix E), have also been major factors in the selection of this sensor. The EnvironTech report argues that unattainable standards will not result in better sensor performance, and may even encourage vendors to manipulate data to meet the accuracy requirements. It should be noted that OSTEP was unable to demonstrate successful performance in accordance with FMH-1 automated visibility stands for any of the sensors tested.
The following sections describe the OSTEP implementation of visibility sensor technology. Section 2.0 provides an overview of the technologies that were considered, Section 3.0 describes the OSTEP sensor selection process, Section 4.0 outlines the steps taken to ensure successful implementation, Section 5.0 discusses other issues that affect sensor implementation, and Section 6.0 outlines the recommended steps to achieve a successful transition to operational status.
For questions about how the sensor operates, consult the Vaisala Web site. For questions concerning this OSTEP implementation of the Vaisala FS11 sensor, contact the CO-OPS Chesapeake Field Office at 757.842.4400.
5
2.0 VISIBILITY TECHNOLOGY OVERVIEW
Visibility sensors, like other observation-based systems, offer a snapshot of conditions from a specific point at a specific time. The visibility could be a mile or more in an open river but may quickly deteriorate as a ship moves closer toward harbor. Visibility can vary widely within the same general location. For this reason, PORTS® users may request multiple sensors to ensure an accurate visibility reading over a specific range. Therefore, the proper positioning of the sensor or group of sensors is critical to obtaining an accurate enough visibility reading to justify the need for sensors.
Visibility technology is widely used in both aviation and maritime applications. Visibility sensors are part of the Runway Visual Range (RVR) systems, a suite of instruments that provide the basis for pilots to land at airports around the world. The RVR is an instrumentally derived value that represents the horizontal distance a pilot may see down the runway. The runway visual range is the maximum distance at which the runway, or the specified lights or markers delineating it, can be seen from a position above a specified point on its center line. This value is normally determined by visibility sensors located alongside and higher than the center line of the runway. RVR is calculated from visibility, ambient light level, and runway light intensity. (Federal Meteorological Handbook (FMH) No. 1, September 2005).
The FAA has used beam transmissometers to measure visibility in aviation applications since the 1980s. Some are still used today as references at major airports. The disadvantage of these early instruments was that contamination from environmental sources such as dust and precipitation residue accumulated on the sensor lens. Newer tranmissometers contain an automated function that keeps the instruments clean between maintenance visits. Maintaining precise long-baseline alignment was/is an on-going challenge as well.
Forward Scatter Technology Over the last six to eight years, the FAA has converted to visibility sensors that use forward scatter technology, which measures the extinction coefficient—the sum of the absorption and scattering properties of light in the atmosphere. It does this by transmitting a narrow beam of light from a light-emitting diode (LED), which then scatters particles of light into a receiver. This receiver has an infrared detector that produces electrical energy equal to the amount of light received by the detector. The transmitter and receiver are aimed toward each other at an angle. If the air is clear, the transmitted infrared beam will pass by the receiver and no light will be detected. If the air becomes hazy or if precipitation is present, the beam will be scattered. The receiver will detect some of the scattered infrared light, proportional to the amount of haze or precipitation. The input to the receiver passes through an infrared filter to reduce the effects of other light. To further reduce extraneous effect, the transmitted beam is modulated at 4 kHz and receiver output voltage passes through a 4 kHz filter. (FAA, December 2006). The sensors also incorporate several techniques that reduce the maintenance needed and ensure that the sensor remains reliable between maintenance visits.
Video-Based Technology The Small Business Innovative Research (SBIR) program has funded a promising technology that mimics the complex processing done by the human eye. International Electronic Machines (IEM) Corporation was awarded Phase I and Phase II SBIR grants for the Video-based Visibility
6
Sensor System (V2S2). The technology uses multiple, video-based algorithms that result in reliable, accurate, and repeatable observations during documented tests conducted both day and night in all kinds of weather. The algorithms include methods such as intensity variation, contrast changes, edge detection, DCT (discrete cosine transform) frequency distribution measurement, wavelet transforms, and lamp counts. The sensor uses multiple methods to measure visibility, switching between them and automatically determining the optimal method (IEM 2005).
Although IEM was awarded the Phase II portion, the final funding was $100,000 less than the approved amount. Despite this unfortunate occurrence, IEM produced a functional prototype. The technology could be promising for CO-OPS once it moves from the research mode to an operational capability.
7
3.0 SENSOR SELECTION
In cooperation with the FAA and the USCG at the Volpe Test Center Weather Test Facility on the Otis Air National Guard Base, OSTEP tested a variety of forward scatter visibility sensors. Of all the sensors tested, the Vaisala FS11 best meets NWS performance standards (Table 3).
Besides being the closest sensor to meeting performance standards, the Vaisala FS11 also performs internal quality assurance by examining its own lens for contamination and making corrections as needed. When the corrections become too extreme, the sensor generates an error message and stops generating data. Vaisala also claims a tighter specification for sensor-to-sensor agreement than do other manufacturers, a claim supported so far by OSTEP field tests. Table 4 contains a subset of the sensor specifications that are germane to the CO-OPS implementation of visibility systems.
OSTEP test and evaluation efforts are in progress for two Vaisala FS11 sensors. Sensor one (S/N A31301) is located at the USACE FRF at Duck, NC and will remain at the FRF for long-term testing. Although sensor two (S/N A31302) was initially installed at the FRF, it was struck by lightning during July-August 2008, retrieved from the FRF in December 2008, and returned to the Chesapeake facility. The sensor was repaired, its main board replaced, and was successfully interfaced to a Sutron Xpert data collection platform (DCP). The new test location is the Chesapeake facility courtyard. The sensor is now generating data and, despite the lightning strike, the system is performing well. Both test sensors have done a good job of self-monitoring. Although data from the test sites are not ingested into the CO-OPS system, they are being transmitted on the GOES test channel using a two-byte flag, and are generating PORTS® tags. An example of this is shown in Table 5.
A CO-OPS Requirement Request (CRR), which describes the project, its deliverables, and resources needed for implementation, has been submitted to meet the requirement for visibility sensors to be integrated into the PORTS® network.
8
Table 4. FS11 Specifications Pertinent to OSTEP Test Installations
Property Description/Value
Operational Measurement range of MOR 5…75 000 m with 1.3.and 10 minute
Accuracy ±10% range 5 … 10 000 m
Optical FS11 General Optical Specifications
Operating principle Forward scatter measurement
Scattering angle 42°
FS11 Transmitter Optical Specifications
Light source Near infrared Light Emitted Diode
Peak wavelength 875 nm
Optical monitoring Light source stability control
Optical path blockage measurement
Window contamination measurement and compensation circuitry
Power consumption 300 VA maximum (60VA + 240 VA defrosting heaters) with options
220 VA minimum (30 VA + 190 VA defrosting heaters) without options
Outputs Serial data line RS232 or opto-isolated RS485 (2-wire) or optional data modem
Separate maintenance line RS232 +12 VDC max 0.8 A output for option powering
Output data Automatic or polled visibility and sensor status data message with selectable message interval
Mechanical Dimensions (h × 0.9 × d) 1) 2.8 m × 0.9 m × 0.5 m
Environmental Operating temperature −40 …+65 °C, optional −55…+65 °C
Operating humidity 0…100%
9
Table 5. Sample PORTS® Tag from Chesapeake Facility Visibility Sensor
Login user: p Password: NOS 99999241 12/10/2009 16:06:00 O1 –O 25.283 0 D1 4 8.2 I1 9 55.4 L1 < 13.0 DAT 0.000 SNS 0.000
REPORT COMPLETE
NOS O1 First Visibility Sensor in the DCP -O Visibility GOES flag (2 byte) 25.283 MOR value in km 0 Error flag ( can be 0-4) D1 First Temperature Sensor in the DCP 4 Temperature GOES flag 8.2 Temperature value I1 First RH sensor in the DCP 9 RH GOES flag 55.4 RH value in % L1 First battery voltage reading in the DCP ( DCP battery) < Battery Voltage GOES flag 13.0 Battery Voltage value in Volts DC DAT Not Used for Visibility SNS Not Used for Visibility
OSTEP selected quality assurance/quality control (QA/QC) criteria using data from field test deployments and generated QA/QC parameters. Data are checked for no data input, flat line, illegal value, etc. Table 6 shows one of the QA/QC parameters associated with alarms status codes for the FS11. The identical table in the Vaisala Users Manual has three columns: the sensor code, an explanation of the code, and a reason why each code might be displayed. A fourth column has been added to Table 6 to accommodate the code that the Sutron Xpert DCP generates for the Vaisala error code. The Vaisala error code contains numbers and letters; however, since the GOES code will not accommodate letters, they must be converted to numbers in order to use the code as a flag.
10
Table 6. Alarm Codes for the Vaisala Visibility Sensor
DCP Code
Sensor Code
Explanation Reasons
1 W Warning (visibility measurement value still valid and shown)
Window contamination increased Transmitter LED aging Backup battery voltage low
2 E Error (visibility measurement value NOT shown, replaced with ////
Sensor missing Memory error
3 A Alarm (visibility measurement value NOT shown, replaced with ////
Communication error in the sensor Internal monitoring alarm value
exceeded Measurement signal saturated or
outside valid range Surface temperature measurement
has failed
4 I Indication of some abnormal situation (measurement value valid and shown)
Mains (AC) off, operating on battery 12Vdc output in short-circuit Hood or dew heater problem
0 (zero) 0 (zero) NO alarm or warning (alarm is OFF)
11
4.0 IMPLEMENTATION STEPS
The transition of the Vaisala FS11 visibility sensor to an operational status is a challenging process. Even after sensor selection is complete, a lengthy and detailed effort is required to create an operational capability.
Sensors for the selected location must be purchased, which requires that a budget code be generated. The next most critical element is obtaining detailed requirements from any and all partners. CO-OPS/OSTEP personnel solicit feedback from users so that products can be effectively developed. The meteorological team also discusses internal products that may be required. Although functional sensors are in the field, several additional steps are necessary before fully operational systems can be deployed. These steps include:
Develop data products (both internal & external) Inform users and introduce data products Document operational information (prepare a draft Field Installation Guide,
Reconnaissance Report, etc.) Train CORMS Train deployment/maintenance field personnel and contractors Respond to queries from field personnel, users, CO-OPS operators Transfer financial and operating responsibilities from OSTEP to CIL.
These developmental steps are critical and do not include responses to unforeseen events, which may require additional tests or renegotiation of requirements, thus, delaying the transition to an operational status.
The OSTEP-developed Microsoft Project Plan (appendix F) guides the implementation of operational visibility capability. The Project Plan requires development of a Microsoft Project task list, which includes data ingestion, product development, maintenance routines, site reconnaissance, and preparation of a Visibility Sensor Field Installation Guide that describes the installation process and other tasks. The plan also contains a milestone template.
The Requirements Team, including the Chesapeake project lead Eddie Roggenstein and Silver Spring project lead Kathy Egan, determines the output format of the message. For example, the sensor output is in meters (m), but the report to the users is in nautical miles (nm). Reporting uses a 3-minute average; the visual range is limited to 0-10 km. The sensor output message selected is msg 4, which transmits the 3-minute average and the alarm code (see Section 3.0, Table 5). Sensor lenses are cleaned monthly for the first three months, and then reduced based on results of visual inspections and alarm codes readings.
4.1 System Data Integration
Working with Sutron, OSTEP successfully interfaced the Vaisala FS11 sensor to the Sutron DCP by modifying the existing Sutron code, which now works with the Sutron Xpert 9210B to provide the selected data set. This task was not difficult, as Sutron selected the FS11 sensor for their airport system. Close coordination with the PORTS® manager in Silver Spring is essential to involve other CO-OPS divisions and product users in the implementation process.
12
4.1.1 OSTEP Requirements and Responsibilities OSTEP is currently working with Sutron to lay the ground work that will enable ISD to begin data integration by designing and testing the:
Two-byte GOES format PORTS® tag
4.1.2 ISD Requirements and Responsibilities The next critical step is implementation of the two-byte flag as part of the system data integration. This step is critical when the visibility sensor becomes part of the PORTS® network because, without the two-byte flag, the GOES message cannot differentiate the Vaisala FS11 from other sensors within the suite—it can only identify it as part of the suite. The two-byte flag is an overlay that expands the number of sensors that are available for use. Once this is accomplished, the Information Systems Division (ISD) begins the data integration effort. The following tasks are essential to achieving high quality data from the Vaisala FS11, and OSTEP and the Engineering Division (ED) are available to assist ISD as needed:
Two-byte flag DAS ingestion Implementation of Quality Assurance/Quality Control criteria at the DAS Implementation of QA/QC flags for CORMS AI Construction of web PICS, text files, PUFFF files, and voice files Development of database ingest and retrieval processes Poll the DCP for PORTS® tags
Completion of these tasks will enable ISD to demonstrate data ingestion and product display. OSTEP, ISD, and ED can accomplish these tasks concurrently while performing site reconnaissance, developing deployment standards, preparing the Visibility Sensor Field Installation Guide, and documenting maintenance routines. More detailed information can be found in appendix G. The following sections describe a few of these tasks.
4.1.3 Oceanographic Division Requirements The Oceanographic Division (OD) performs the groundwork for product output display within the user interface. Reported visibility data is restricted to 10 km; therefore, any measurement exceeding that maximum value is displayed as 5.40 nm (10 km). NWS guidelines for reportable visibility values can be found in Chapter 6 of the FMH (appendix G). Working with OSTEP, OD follows the recommendation to report the actual visibility value as reported by the sensor, as opposed to a range of values.
4.2 Site Selection
Site selection includes a site survey that identifies three requirements that must be met for successful location:
1. Must be representative of surrounding weather conditions 2. Must be free of obstacles and reflective surfaces 3. Must have access to power and communications
13
The Operational Engineering Team (OET) develops a Visibility Reconnaissance template, conducts reconnaissance using the template, and develops the site selection criteria for visibility sensors. The site selection team determines the best location for the visibility sensors. OET reads the instrument manual and works with OSTEP to develop a template for the site selection and reconnaissance document.
4.3 Development of Deployment Standards
Vaisala provides a rigorous description of deployment considerations (appendix H, Chapter 3 of the Vaisala Users Manual). In concert with these considerations, OET develops deployment standards. The OET assessment considers decisions about mounting height, orientation, potential interferences, and maintenance requirements. These standards are developed concurrently with site selection and preparation.
Once the location is identified, either a new foundation is constructed or an existing one is prepared. The installation team may be responsible for construction, or the PORTS® site representative may arrange for construction or site preparation. The FS11 is mounted according to the deployment standards developed by the OET.
4.4 Maintenance
Determining the optimal maintenance interval is site-specific and depends upon several factors, such as whether the sensor is sited near shore or in an especially high spray environment. The Vaisala FS11 at the FRF has worked for six months without lens cleaning. Based on this test and other observations, OSTEP recommends that lenses be cleaned every two months unless the sensor is transmitting erroneous data. The field test at the USACE FRF offers clear evidence that the FS11 produces visibility data that generally agree with adjacent maintained sensor, even when the sensor lens is dirty.
The following status output is from the FS11-1 deployed at the FRF. Although the sensor has not been cleaned in over five months, which is apparent from the readout, it still yields data that generally agree with reference sensors.
14
Last Status: airVis.USCG -- FS11-1 2009 2 10 12:51: 1 UTC
Once the sensors are deployed, it is wise to inspect them monthly for the first three months. After verifying that the installation is correct and no damage has occurred, personnel then determine the sensors’ optimal maintenance interval based on the monthly inspections.
4.5 Startup and Sensor Check
Though not officially part of the Implementation Plan, this section provides several examples of how the field installation guide for the visibility sensor will look. A Visibility Sensor Field Installation Guide will be developed concurrently with the sensor installation and will document procedures for installing the sensor system.
Prior to installation and startup, it is imperative that personnel read the Vaisala FS11 Users Manual and the FMH #1 to ensure a thorough understanding of the sensor’s operational requirements, how to assemble the FS11 and connect the power and communication cables, and standards of quality for measuring visibility.
After installation of the sensor, the following procedure from the Vaisala FS11 Users Manual illustrates the proper sensor startup. This text will be in the Visibility Sensor Field Installation Guide but is included here to demonstrate that sufficient information exists to support the creation of the installation guide. Table 6 shows the system default settings.
1. Connect sensor to RS232. 2. Set baud rate to 9600 bps and data frame to contain 8 data bits, 1 stop bit, and no
parity. 3. Turn on main switch of FS11 – if a backup battery, turn it on as well
15
4. The red LED on the CPU board should be lit for a few seconds, then the green status LED should start giving a long flash at approximately 1 Hz
5. After the startup, the FS11 outputs the following: FS11 v. n.nn (mm dd yyyy hh:mm:ss)
6. After one minute, enter the command mode with the command OPEN. Enter the STATUS CHECK command and ensure that no hardware errors or warnings are detected.
7. If connected to a data port, type CLOSE and check that a message appears on the display every 15 seconds.
8. To shut down the unit, turn off both the main and battery switches.
Table 7. Initial (Default) Settings:
Setting Default
Baud rate 9600 baud
Communication parameters 8N1
Mode RS232
Polled or automatic mode, message type
Automatic mode, message 1 interval 15
Message Port Data
Sensor ID No ID set
Additional requirements may be found in the Vaisala Users Manual and the FMH #1. This procedure describes how to test the sensor to ensure that it works properly. It does not include the procedure for connecting or testing the sensor through the CO-OPS DCP.
Other activities associated with a fully operational deployment, such as Standard Operating Procedures (SOPs), Field Installation Guide, and E-Site report, will likely commence but may not be fully completed before the first PORTS® installation. The first installation may serve as a way to learn the best way to transition to full operational capability.
17
5.0 CONTINUING COLLABORATION
Even after moving forward with the initial installation of the Vaisala FS11, there are several issues that will require ongoing attention: the test sensors currently in the field, power requirements, and the recent decision by the FAA to develop a hybrid sensor based on the Vaisala FS11. The following paragraphs discuss the most recent activities concerning these issues.
5.1 Current Test Locations
The FS11 sensors currently located at the FRF and the Chesapeake facility will likely remain for long-term evaluation, which will be invaluable for obtaining more detailed information about the sensor’s ability to withstand harsh environmental conditions, especially at the FRF. Having FS11 sensors at the FRF will provide the opportunity to monitor the long-term effect of corrosion, as well as for continuing to compare sensor maintenance intervals.
5.2 Power Requirements
Power consumption is generally a challenging issue, whether for a long-term field test or an operational system. A visibility sensor needs special consideration due to the high power requirements of its hood and lens heaters. Although the installation of solar panels may help, power demand tends to occur during periods of dense fog, and solar panels may not be adequate or reliable sources of energy. The sensor can only run for approximately seven minutes on the battery; therefore, access to 110-V service is critical. Investigation of this issue will be ongoing.
5.3 FAA Acquisition of the Vaisala FS11
The FAA has continued its evaluation of the Vaisala sensor beyond the initial test conducted at the Volpe Center, described in Section 1.0 of this implementation plan. After selecting the FS11 for use at airports around the US, the FAA has worked with Vaisala to modify the FS11 for optimal performance. For example, Vaisala developed a filter so that the flashing xenon lights on service vehicles will not interfere with the sensor and also changed a lens component to eliminate a problem caused by stray glare. As a result, Vaisala now offers the FS11 with modifications as a unique FAA sensor with its own part number. The modifications, along with setting changes made during instrument calibration, will result in greater accuracy for FAA facilities at distances of 10 km or less. Although these FS11 changes do not offer any known benefits for maritime applications, continuing collaboration with the FAA and other agencies may reveal other opportunities for interagency technology transfer.
5.4 Additional Documentation
OSTEP prepares a suite of documents as part of the visibility sensor project. These include a Reconnaissance Report, an E-Site Report, Visibility Test and Acceptance Report, CORMS SOP, a User Guide to CO-OPS Visibility Observations, an Initial Operational Deployment Report, and a Field Installation Guide.
The Reconnaissance Document describes the process for identifying a site that meets the requirements for locating a specific sensor/system. The E Site Report is submitted submit to ISD before sensor installation. The Visibility Sensor Test/Acceptance SOP is completed a maximum
18
of two months after receipt of the visibility sensors to ensure that all sensors are functioning properly prior to deployment. Other pre-deployment documents include the CORMS SOP, which contains an explanation of what to expect from the visibility sensor system, such as quality control, and the User Guide to CO-OPS Visibility Observations, which provides general information about visibility sensors, including what results users can expect from them.
The Initial Operational Deployment Report describes the first operational installation of the visibility sensor system “as built” and is an official NOS Technical Document. Upon completion, which is approximately two months after deployment of the first sensor in Mobile, the document is posted on the CO-OPS publication Web site upon completion.
The Field Installation Guide is for field crews and contractors and describes how future FS11 visibility sensors are to be deployed, and is also completed about two months after the initial deployment of the visibility sensor.
19
6.0 SUMMARY AND RECOMMENDATIONS
Visibility observations are made from an electronic sensor at a specific point. Because visibility conditions can vary widely within a relatively short distance, multiple visibility sensors may be needed to adequately cover potential PORTS® locations. For localized weather conditions, the Vaisala FS11 seems to be the best visibility sensor choice for PORTS® applications. The FAA has accepted the unit (with modifications) for use within the RVR system at airports throughout the U.S. and is in the process of procuring additional sensors.
OSTEP has conducted a year-long field test and evaluation of the Vaisala FS11 and has demonstrated its capability to achieve data throughput. However, the participation of other CO-OPS divisions is required to further implement a visibility system for PORTS®.
The purchase of at least two Vaisala FS11 visibility sensors sets in motion the steps outlined in Section 4.0 of this plan. CO-OPS divisions should identify and develop the appropriate implementation tasks. For example, ISD should begin work on the data ingestion process. The PORTS® manager and the Meteorological Team should also become involved. OSTEP should develop several documents, including a Microsoft Project Plan (Appendix F) to implement operational visibility capability, along with a Microsoft Project task list, which will include data ingestion, product development, maintenance routines, and a milestone template. Also required is a Visibility Sensor Field Installation Guide that outlines specific implementation procedures that will be used by OSTEP, ED, OD, Field Operations Division (FOD), and ISD personnel to facilitate the transition of the sensor to a full operational PORTS® deployment.
Prior to installation of the PORTS® operational system, ISD should write software enabling ingestion of (2-byte) data integration. Other requirements include ISD demonstration of data ingestion and product display while working with OD on product development based on PORTS® users’ requirements. Also needed is the development of a Web site where users can access documentation, and outreach to users, including education about the benefits of having visibility data and how to retrieve data.
The transition of air gap and ATON ADCP sensors to an operational status has demonstrated that the level of effort required prior to declaring an operational capability is likely to be underestimated. Therefore, the Microsoft Project Plan, the milestone template, and the project task list should consider and plan for contingencies.
Continuing issues include long-term testing at Duck to the extent that this is feasible and addressing power requirements for visibility sensors. Although a nominal amount of funding might be necessary (perhaps $10K per year), maintaining a long-term test site will have several benefits, including the ability to observe the impact of corrosion on visibility sensors. Because the visibility sensors require a reliable source of power, access to 110-V service should be considered during sensor site selection.
Partnering with the FAA and other agencies and monitoring evolving technologies remain extremely important. Although the FAA modifications do not seem to be relevant to maritime applications at this time, continuing to work with FAA and Vaisala will help us to understand and monitor sensor improvements. Video-based technology may emerge as an appropriate alternative to forward scatter as it migrates from research to operations.
20
The addition of visibility sensors to the PORTS® suite of instruments can offer PORTS® users another valuable tool to increase efficiency and help to avoid disasters that could cause loss of life and extensive property damage.
21
REFERENCES
Federal Aviation Administration 6560.31, Maintenance of RVR Equipment, December 2006 http://www.faa.gov/documentLibrary/media/Order/ND/6560.311.pdf
Federal Meteorological Handbook No. 1, Chapter 7, Runway Visual Range. September 2005 http://www.ofcm.gov/fmh-1/pdf/G-CH7.pdf
Federal Aviation Administration, Points of Pride, FY 2006, RVR p.3 http://www.volpe.dot.gov/infosrc/docs/pop06.pdf
U.S. Coast Guard/National Oceanic and Atmospheric Administration Air Visibility Study. U.S. Army Corps of Engineers Field Research Facility. http://frf.usace.army.mil/airvis/av.shtml
IEM, Video-based Visibility Sensor System, Phase II SBIR Final Report http://www.iem.net/index80b7.html?products&imaging
Appendix A Visibility Sensors Analysis Belfort Instrument Model 6000
Appendix B Visibility Sensors Analysis Belfort Instrument Model 6100
Appendix C Visibility Sensor Analysis: VM100 Compared a Belfort ASOS Standard
Appendix D High Visibility OCT Evaluation
Appendix E Visibility Accuracy: What’s Realistic? EnviroTech Sensors Report
Appendix F Microsoft Project Plan – Visibility Sensor Installation
Appendix G Software Requirements Document for Visibility Sensor
Appendix H Federal Meteorological Handbook – Chapter 6
Appendix I Vaisala Users Manual, Chapter 3
Ocean Systems Test and Evaluation Program
A-1
Appendix A. Visibility Sensors Analysis Belfort Instrument Model 6000
Visibility Sensors Analysis Belfort Instrument Model 6000 Karen Grissom, November 2003 NOAA/NOS, Center for Operational Oceanographic Products and Services Ocean Systems Test and Evaluation Program
The raw data for the Belfort 6000 test sensors is output as ASCII files, with the visibility and extinction coefficients paired with a date and time stamp. Whereas, the raw ASCII files for the Belfort ASOS standards lack a date column, and the extinction and visibility values are output in separate files. All the files contain data gaps and non-uniform characters. Because of these discontinuities, primarily within the Belfort 6000 files, concatenating and importing the data resulted in a shortened time series, from 100 days (Figure 1 and Figure 2) to 35 days. To process the data, all the files were combined into one matrix, which was then duplicated. Since NOS/CO-OPS is only interested in low visibility conditions, one matrix was filtered to remove Belfort ASOS visibility values greater than 5 statute miles, and the other greater than 7 miles (Figure 3). For each matrix the corresponding Belfort 6000 values were also removed during data filtering. This method of filtering the data prevents skewing the results in favor of the test sensors.
Figures 4 and Figure 5 are a comparative time series of the visibility difference between the ASOS standard and the Belfort 6000, for the 5 and 7 mile upper limit respectively. Note the mean value for ASOS standards agree 100 times better when compared to each other than a similar comparison for the Belfort 6000 test sensors. These differences are very evident when comparing the test sensors to the ASOS standards (Figure 4), the mean difference is 0.75 miles. The poor agreement is more pronounced in Figure 5, the 7 mile upper limit, with a mean difference of 2.89 miles. Figure 6 shows the distribution of the absolute value of visibility difference as a function of reportable range. Only 69.9% agree within 1 mile for the 5 mile cut (Fig. 6a), and 55.5% for the 7 mile cut (Fig. 6b).
Next, Figure 7 and Figure 8 shows the correlation for visibility at the 5 and 7 mile cutoff. Since the NOS Belfort 6000's consistently report visibility an order of magnitude greater than the NWS ASOS sensors, the correlation coefficients between them are low. Yet, the high correlation between two like sensors suggests a calibration problem with the Belfort 6000 which could be compensated for in post-processing.
Conformance with the manufacturer’s specifications of accuracy is shown in Figure 9 and Figure 10. Part A of each figure is the percent error between like sensors, and both pass the stated ± 10% accuracy. More realistic is part B, which assumes the Belfort ASOS is the true value. When compared to the ASOS percent error is consistent with the visibility difference shown in Figure 4 and Figure 5, up to 2 orders of magnitude larger than acceptable. Also of note in Figures 9 and 10 is the distribution of percent error for the reportable visibility, the largest error is centered around 0.5 miles.
Lastly, Table 1 and Table 2 show the results of the Federal Meteorological Handbook (Dec. 1995) for accuracy of automated visibility sensors. Once again, the 6000's fail when compared to an ASOS standard, yet pass when compared to each other.
A-2
Ocean Systems Test and Evaluation Program
A-3
A-4
Ocean Systems Test and Evaluation Program
A-5
A-6
Ocean Systems Test and Evaluation Program
A-7
A-8
Ocean Systems Test and Evaluation Program
A-9
A-10
Ocean Systems Test and Evaluation Program
A-11
A-12
Table 1a. Accuracy Results for Belfort ASOS NWS207 Compared to Belfort ASOS NWS547
Table 1b. Accuracy Results for Belfort 6000 NOS132 Compared to Belfort ASOS NWS547
Table 1c. Accuracy Results for Belfort 6000 NOS133 Compared to Belfort ASOS NWS547
Table 1d. Accuracy Results for Belfort 6000 NOS132 Compared to Belfort 6000 NOS133
Table 1: ASOS values greater than 5 mi were removed, and corresponding Belfort 6000 values. Standardsgiven by Federal Meteorological Handbook (Dec. 1995).
Ocean Systems Test and Evaluation Program
A-13
Table 2: ASOS values greater than 7 mi were removed, and corresponding Belfort 6000 values. Standards given by Federal Meteorological Handbook (Dec. 1995).
Table 2a. Accuracy Results for Belfort ASOS NWS207 Compared to Belfort ASOS NWS547
Table 2c. Accuracy Results for Belfort 6000 NOS133 Compared to Belfort ASOS NWS547
Table 2d. Accuracy Results for Belfort 6000 NOS132 Compared to Belfort 6000 NOS133
Table 2b. Accuracy Results for Belfort 6000 NOS132 Compared to Belfort ASOS NWS547
Ocean Systems Test and Evaluation Program
B-1
Appendix B. Visibility Analysis of Belfort 6100
B-2
Ocean Systems Test and Evaluation Program
B-3
B-4
Ocean Systems Test and Evaluation Program
B-5
B-6
Ocean Systems Test and Evaluation Program
B-7
B-8
Ocean Systems Test and Evaluation Program
B-9
B-10
Table 1: The visibility standards given by the Federal Meteorological Handbook (Dec. 1995). Note only NOS success is sensor B189, in the 0 - 1 1/4 range. The number of observations range from 1126 - 4362.
Table 1a. Accuracy Results for NOS B071 Automated Visibility Sensor
Table 1c. Accuracy Results for NWS B207 Automated Visibility Sensor
Table 1b. Accuracy Results for NOS B189 Automated Visibility Sensor
Visibility from Standard NWS B207 (mi.)
Percentage of Data within or Exceeding Given Range At least 80% within
Appendix C. Visibility Sensor Analysis: VM100 Compared to a Belfort ASOS Standard
The raw data for both VM100's, and the Belfort ASOS standard, is output as an ASCII file, where each visibility measurement is paired with a date and time stamp. Due to discontinuities within the time series, and missing data for the VM100 sensors, the usable data was smaller than anticipated, from almost two months to 11 days (Figure 1).
To process the data all files were combined into one matrix, containing the date/time stamp, and visibility. Since NOS/CO-OPS is only interested in low visibility conditions, the matrix was filtered, first all standard values greater than 10 nautical miles were removed, along with the corresponding VM100 measurements (Figure 2), and a second time at 5 nautical miles (Figure 3). This filtering method prevents skewing the data in favor of the test sensors. As can be seen in both Figure 2 and Figure 3, both test sensors repeatedly measure visibility in excess of the Belfort ASOS standard.
Figure 4 is a histogram showing the percent frequency distribution of the difference between the sensors. The values are reported according to the Federal Meteorological Handbook, Reportable Visibility Values. If the actual visibility falls between two reportable values, the lower value is used. Note that the shape of the distribution curves are far from the hoped for exponential distribution.
The strength of the linear correlation between the sensors is shown in Figure 5 and Figure 6. The coefficient didn’t improve significantly between the VM100 sensors for the different filtering methods, only 0.0310. Since both correlation coefficients between the VM100's is less than ideal, and the coefficient change is small, this could be the result of an inherent difference between the sensors versus a decreased accuracy at higher visibilities. The small coefficient change for the VM100-1 and the standard (0.0324) points toward an overall calibration problem, whereas the larger change of 0.0969 for the VM100-2 and the standard points toward a calibration problem at mid-range.
Table 1 and Table 2 list the results for accuracy of automated visibility sensors, filtered at 10 nm and 5 nm respectively. Due to the shortened time series, and filtering process, very few points were available for comparison, an average of 25 samples per bin, with the exception of the last bin for Table 1. Yet, given the failure of the sensors for the previous tests, it is reasonable to assume a larger sample group would not significantly change the results. The two VM100's failed in all reportable ranges, even when compared to each other. Because of these failures, further tests of the VM100's are not suggested.
C-2
Ocean Systems Test and Evaluation Program
C-3
Figure 2: Visibility measurement after removal of Belfort ASOS values greater than 10 nm and the corresponding VM100 samples: A) is a comparison of the filtered data, and B) is the visibility difference between the VM100’s and the Belfort, the mean and standard deviation are calculated from the absolute value.
C-4
Figure 3: Visibility measurements after removal of Belfort ASOS values greater than 5 nm and the corresponding VM100 samples; A) is a comparison of the filtered data, and B) is the visibility difference between the VM100’s and the Belfort, the mean and standard deviation are calculated from the absolute value.
Ocean Systems Test and Evaluation Program
C-5
C-6
Ocean Systems Test and Evaluation Program
C-7
C-8
Table 1: The visibility standards as given by the Federal Meteorological Handbook (Dec.1995).
Ocean Systems Test and Evaluation Program
C-9
Table 2: The visibility standards as given by the Federal Meteorological Handbook (Dec. 1995).
Ocean Systems Test and Evaluation Program
D-1
Appendix D. High Visibility OCT Evaluation
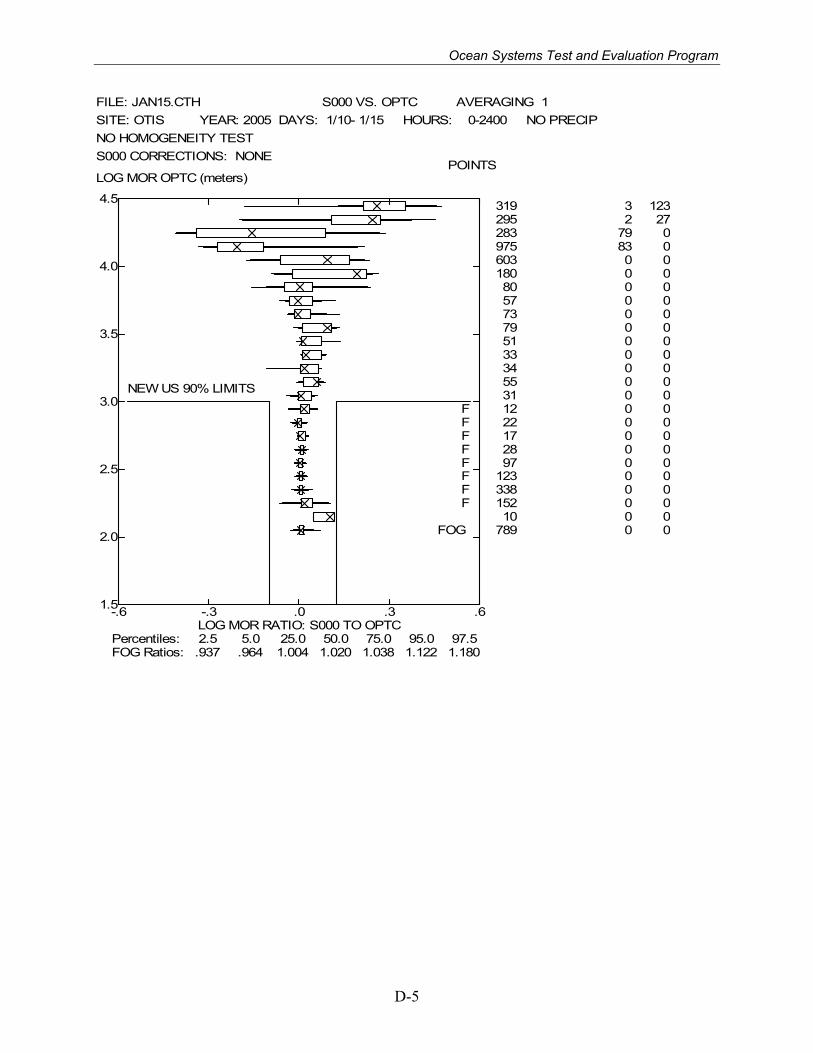
2/7/05 D. Burnham Plot Changes The box plot program was modified to cover a higher range of meteorological optical range: log10 (MOR) from 2.0 (0.1 km) to 4.5 (30 km or 20 mi). The ratio axis is also extended to log10 (Ratio) from –0.6 to +0.6 (Ratios from 0.25 to 4.0). Data 1/10-15/05 The period 1/10-15/05 contained homogeneous, fairly dense fog as well as a variety of higher values of MOR. As normal, the transmissometers were calibrated against the reference HSS scattermeter (HSB1) whenever the MOR was above 20 mi. The following 4 box plots show how the four transmissometers (TAVE (average of T300 & T500), T300, T500 and S000 (1000-foot unit with no visible light filter) compare with the 1000-foot Optec transmissometer (OPTC). The following results are noted:
1. TAVE: The fog calibration differs by 7.2% between TAVE and OPTC. The reason is not obvious.
2. T300: The boxes are mostly narrow below log10(MOR)=3.7 (MOR=5 km) and reasonable narrow below log10(MOR)=4.8
3. T500: The boxes are mostly narrow below log10 (MOR)=4.8 and reasonably narrow below log10(MOR)=4.1. This difference between T500 and T300 represents (a) the longer baseline of T500 and (b) the fact that the T500 baseline coincides with half the baseline of OPTC.
4. S000: although the baselines of S000 and OPTC are identical, they have wider MOR ratio distributions than the T500-OPTC comparisons for log10(MOR) between 3.0 and 4.9 and much wider distributions above log10(MOR)=4.9. This difference is undoubtedly due to the difference in optical wavelength (much red and infrared light in S000), which gives quite different extinction coefficients in haze. Note that the OPTC and S000 (with identical baselines) median fog responses differ by only 2.0%, which is much smaller than the 7.2% for OPTC and TAVE. Because the fog extinction coefficient is not expected to vary much with wavelength, these results suggest that the baseline lengths should be remeasured for all baselines.
Appendix E. Visibility Accuracy: What’s Realistic? EnviroTech Sensors Report
21 August 2002
Visibility Accuracy: What’s Realistic?
EnviroTech Sensors, Inc. 10833 Braeburn Road Columbia, MD 21044
http://www.envirotechsensors.com
E-2
Introduction to the Visibility Accuracy Question
Visibility accuracy is a term misunderstood by many, even those who specify and use visibility sensors. However, the measurement of visibility need not be a confusing subject. Being savvy regarding visibility data begins with understanding what is realistic. To define accurate visibility, we will look at several key points.
• the data believed achievable by leading meteorological organizations and the visibility accuracy requirements of various weather systems in use today • sensor manufacturer statements and claims about their own sensor accuracy • real word test results • • other factors effecting the measurement
Finally, using these four key points, the author will explain the accuracy you can reasonably expect from electro-optical visibility sensors.
Visibility Accuracy Requirements
Understanding visibility accuracy does not require studying the history or theory of visibility sensing since this information is not needed to specify or make use of the sensor. Visibility sensors have been tested for decades, especially in support of the aviation user. In general, the needs of the aviation community are more stringent than the needs of the typical road weather information system (RWIS) user. Airports must land aircraft loaded with hundreds of people in all weather conditions, so visibility is of critical importance to them. Therefore, we can transfer their knowledge and apply it to the road weather field with confidence.
The major meteorological organizations and systems in use around the world have defined the accuracy of visibility measurements. Below is a list of these organizations such as the WMO and ICAO. Each specifies the attainable accuracy of visibility observations. Also included are the accuracies of visibility sensors in automated weather systems with thousands of sensors installed worldwide.
WMO Guide to Meteorological Instruments and Methods of Observations
Achievable operational accuracy:
• +/- 10-20% over the field range
ICAO Manual of Aeronautical Meteorological Practice
Currently attainable accuracy:
• +/- 100m up to 1000m
• +/- 200m between 1000m and 2000m
• +/- 20% between 2000 m and 10 km
Ocean Systems Test and Evaluation Program
E-3
ICAO Manual of Runway Visual Range Observing and Reporting Practices
Operationally desirable accuracies:
• +/- 25m up to 150m • +/- 50m between 150 and 500m • +/- 100m between 500 and 1000m • +/- 200m above 1000m
FAA New Generation Runway Visual Range (NGRVR) System
• 15% Root Mean Square Error (RMSE) up to 300m • 20% RMSE between 300m and 2000m
Automated Weather Systems including:
FAA Automated Weather Observing System (AWOS) FAA Automated Weather Sensors System (AWSS) NWS/FAA/U.S. Navy, U.S. Air Force Automated Weather Observing System (ASOS)
U.S. Air Force Observing System – 21st
Century (OS-21)
At least 80% of the data shall be within these limits:
• +/- ¾ mi up to 1-¾ miles • + ¼/- ½ mi between 1-½and 1-¾ miles • +/- ½ mi between 2 and 2-½ miles • + ½/- 1 mi between 3 and 3-½ miles • +/- 1 Reportable visibility Increments (RI) between 4 and 10 miles
Sensor Manufacturer Accuracy Specifications
The manufacturers of the most common visibility sensors in use today are listed below in alphabetical order. Model number, stated accuracy, range, and applicable notes are included.
Aanderaa Instruments A/S
• Model 3340 <20% from 20m to 3 km range
Belfort Instrument
• Model 6000 +/- 10% from 20 ft to 10 miles range
• Model 6100 +/- 10% from 20 ft to 10 miles range
• Model 6230 +/- 10% from 17 ft to 30 miles range
E-4
Note: Belfort states the same accuracy for all of their sensors even though they range from $4K to $12K in price.
Biral, LTD
• Model VF-500 +/- 5% from 3m to 16 km range
Note: Biral now manufactures the HSS VR-301 sensor.
Jaycor, Inc.
• Model JVS-1200A Accuracy not stated, range from 50 to 2000 ft
Optical Scientific, Inc.
• Model OWI-130 +/- 20% from 1m to 3 km range
Qualimetrics, Inc.
• Model 6364-E +/- 10% from 10m to 32 km range Vaisala, Inc.
• Model FD12 +/- 4% variability between units from 10 to 50,000m range • Model PWD11 +/- 5% optical measurement consistency from 10 to 2000m range • Model PWD21 +/- 10% from 10m to 10 km, +/- 15% from 10 km to 20 km range
Note: Vaisala does not specify accuracy for the FD12 and PDW11 sensors. They instead use the terms “variability between units” or “optical measurement consistency.” Unfortunately, inexperienced buyers believe that this is the same as “accuracy.” When these users write the system specifications, the visibility accuracy is often misstated as 4-5%.
Vaisala originally published a four-page brochure on the FD12 that demonstrated the results of comparing the FD12 to their own transmissometer. The brochure stated “As a result, the FD12 measured a visibility figure with more than 80% of the measuring points within +/- 20% of the transmissometer’s readings.” This data clearly shows the real world performance of measuring visibility. To a meteorologist, this data is quite good but apparently to Vaisala, it was not good enough so they no longer publish these figures.
Real World Test Results
Data from several published visibility studies is included in this section. All sensors are of the forward scatter type and are currently in use today. Two observations can be made from the graphs. First, the overall linearity of the data is quite good. Second, there is significant scatter in the data. The Vaisala FD 12 shows the largest amount of scatter, but the data is believable because of real world conditions and remains accurate by industry standards.
Ocean Systems Test and Evaluation Program
E-5
Vaisala FD12 sensor compared to one Vaisala MITRAS Transmissometer.
Note: The X & Y axes are plotted from increasing to decreasing values (MOR is 'meteorological optical range'). Other graphs provided in this paper show data with increasing values rather than decreasing values.
Example from Vaisala testing of the FD12 (data from their FD12 brochure):
E-6
:
HSS VR-301 sensor compared to one IR Transmissometer.
Note: This data graph uses a log scale instead of a traditional linear graph. The log scale helps to illustrate the data over a wide dynamic range but tends to reduce the appearance of data scatter.
Example from Canada AES testing of HSS (now Biral) VR-301 sensor:
Ocean Systems Test and Evaluation Program
E-7
Belfort 6200 Series compared to two IR Transmissometers for visibility < 1¼ and two Visible Light Transmissometers for visibility > 1¼ miles.
Note: The numbers in the grid spaces represent the number of data points (10 minute average) that was in each particular grid increment.
Example from NWS testing of Belfort ASOS sensor:
E-8
EnviroTech Sentry™ sensor compared to one Belfort 6200 Series ASOS sensor for two events, one in fog and haze (top) and the other in rain (bottom).
Example from EnviroTech Sensors, Inc. testing of the Sentry™ sensor
Ocean Systems Test and Evaluation Program
E-9
Other Factors Effecting Visibility Test Results The accuracy of visibility sensors is further complicated by the fact that the reference transmissometers used as standards may have as much as 10% disagreement and still be acceptable. During data collection for most testing, if the transmissometers do not agree within 10%, the data for that period is not used. Add to this the various systematic and random errors inherent in electro-optic sensors as well as the uncontrolled nature of testing outdoors. It is amazing that most sensors can measure with 20% accuracy! If you add a qualified weather observer in the measurement mix, he/she will only add to the data scatter since each human interprets visibility differently. For further reading on this topic, the WMO Guide to Meteorological Instruments and Methods of Observation, Sixth Edition, WMO-No. 8 and the OFCM An Overview of Applied Visibility Fundamentals, FCM-R3-1982 have excellent descriptions of the measurement of visibility.
Guidelines For Making A Realistic Choice Of Visibility Accuracy
Believe that 10-20% RSME error is realistic and achievable. Asking for higher accuracies will not result in better system performance. Overly stringent accuracy specification demands may result in vendors manipulating data to be compliant with the specification.
In the world of optical visibility sensing, a vendor that claims accuracy to less than 10% is probably not telling the whole story.
• Ask the vendor for test data in various weather conditions. Make sure you know what sensor(s) is being used as a reference. The report should contain hundreds of hours of data.
• Be wary of sensor data sheets that disguise accuracy with specifications like “consistency” or “variability.” Sensor consistency is a useful parameter but is not a substitute for defining a sensors ability to make accurate measurements in real world conditions.
E-10
About the Author
Mr. John D. Crosby, Vice President, EnviroTech Sensors, Inc.
John Crosby started his own company, EnviroTech Sensors Inc., Clarksville, MD, in March 2001. The new company specializes in product development & applications, technical documentation, and field service for the environmental industry. In addition to developing an infrared, forward scatter sensor for measuring atmospheric visibility (Sentry™, he has recently completed a number of projects including:
• A study of chemical & biological warfare sensing technologies
• A study of road weather temperature prediction models
• Wrote software test procedures and performed all testing for the newest FAA weather system
• Wrote the meteorological sensor section of a proposal for the US Navy SMOOS program
• Consulted on a graphical user interface design and implementation for a Kuwait weather network
• Wrote the INFOSEC documentation for an FAA computer system that displays weather data
Prior to starting EnviroTech Sensors, Inc., he was Vice President of Operations at Optical Scientific (formerly Scientific Technology) for eight-years. John was responsible for day-to-day operation of the company, managing the development, production, sales and marketing, and customer service of the company’s optical-electronic products. He not only guided the company into environmental sensing market with an optical airflow sensor, he also provided key customer field support for road weather, airport weather, and environmental applications around the world. At AAI Systems Management, John was the Senior Meteorologist responsible for sensor development and testing for the FAA/NWS Automated Surface Observing System (ASOS) program. More than 900 ASOS systems are now installed around the world. While employed at Belfort Instrument, he managed the design and development of microprocessor-based wind and visibility sensors for ASOS. At the Goddard Space Flight Center for Northrop, John selected flight instrumentation, performed qualification and calibration tests, wrote procedures, and integrated instrumentation hardware for Delta Rocket and Space Shuttle payloads. He also provided support at NASA launch facilities and contractors across the country. John has an MBA from Loyola College and a BS in Atmospheric Science from the State University of New York at Albany. He is a member of the American Meteorological Society and Instrument Society of America and has published several trade journal articles.
Related published papers include:
• Visibility Techniques Improve RWIS, Better Roads Magazine, May 1997. • ASOS Sensor Performance - An Update, Eighth AMS Symposium Proceedings, January 1993. • Sensor Qualification in the ASOS Environment, Seventh AMS Symposium Proceedings, January
1991. • Visibility Measurement: An Assessment of Two Techniques, Sensors Magazine, October 1988.
Ocean Systems Test and Evaluation Program
F-1
Appendix F. Microsoft Project Plan – Visibility Sensor Installation
F-2
CO-OPS Software Requirements Document Version 1.0 July 11, 2008
Appendix G. Software Requirements Document for Visibility Sensor
Revision History Name Date Reason For Changes Version
G-4
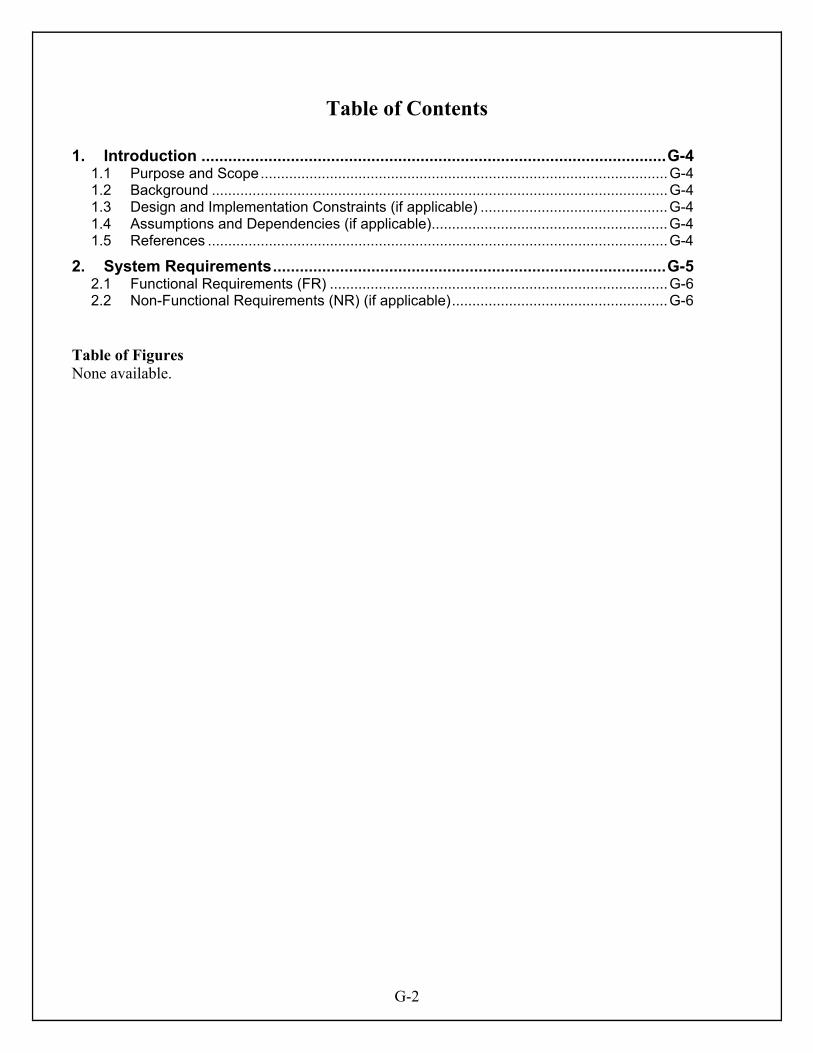
Introduction
Purpose and Scope
This project will provide for the inclusion of visibility sensor data into the CO-OPS data and product stream. All phases will be addressed: acquisition, decoding, QC, ingestion and dissemination.
Background
There has been a requirement for a visibility sensor as part of PORTS since PORTS inception, however a visibility sensor that will work in a marine environment, that meets NWS standards has not been available until recent years. CO-OPS visibility sensor testing began about 2000. By 2003 we had established that multiple sensors (Belfort 6100, Belfort 6000, Fidelity Technologies VM100, etc.) did not appear to meet NWS standards for automated visibility sensors. They failed badly, meeting 1-2 of 15 criteria, and we determined that the NWS standards could not be used. We began our cooperative test effort with the FAA and the USCG in late 2003. Tests at the Volpe Weather Test Facility on the Otis Air Force Base at Cape Cod were conducted during 2004 and 2005. In the spring of 2005 we identified the Vaisala FS-11 as the sensor of choice, and using 2005 year-end funds CO-OPS procured two sensors. In planning for 2006 it was decided that further testing to establish service intervals in a marine environment would be outsourced to the USACE/FRF, but it took until the end of FY2007 to implement an MOU permitting the transfer of funds. Testing began in early 2008 and a web site http://frf.usace.army.mil/airvis/av.shtml was created for viewing/retrieving data sets from the 5 different sensors. The FS11 sensor performance during long periods of neglect indicates a satisfactory stability.
With this sensor selected for meeting requirements, we now have the task if integrating it into our systems. This purpose of this project is to incorporate the Vaisala FS11 visibility sensor into CO-OPS infrastructure. This will include installation procedures, integration with a DCP, transmit capabilities, new ingestion code, new database tables and new dissemination products. This project will be successful when we can offer and be able to install a visibility sensor as part of PORTS.
Design and Implementation Constraints (if applicable)
The Visibility Sensor effort will comply with Section 508 compliance, SQL and database standards, web application security guidelines, etc. Refer to the ROS Step 3 Wiki Section 3.2.5 Application Development References.
Assumptions and Dependencies (if applicable)
The Visibility Sensor data is very similar to most data type which CO-OPS collects and disseminates. Unless otherwise noted the visibility data type should be handled in a similar manner as other data types.
Software Requirements Document for C-MIST Phase 3
G-5
References List any CO-OPS or other relevant documents. Common references include the project Vision and Scope document or Project Plan. REF-# References (REF) REF-1 REF-2 REF-3
System Requirements The Visibility Sensor This purpose of this project is to incorporate the Vaisala FS11 visibility sensor into CO-OPS infrastructure. This will include installation procedures, integration with a DCP, transmit capabilities, new ingestion code, new database tables and new dissemination products. This project will be successful when we can offer and be able to install a visibility sensor as part of PORTS.
This section contains the list of detailed requirements identified during the analysis which expand upon the Major Features (MF) defined in the Vision and Scope Document and the SOPS (see the reference section 1.5) developed by the PSD/CECAT team The goal is to identify requirements at a much greater level of detail than the Major Features.
MF-# Major Features (MF) MF-1 Enhance the DIS software to handle visibility data MF-2 Enhance DAS software to handle visibility data MF-3 Enhance the DMS to handle visibility data MF-4 Provide for the QC of visibility data MF-5 Enhance the suite of CO-OPS data products to handle visibility data MF-6 Enhance CORMS products to handle visibility data MF-7 Enhance metadata products and tools to handle visibility data
G-6
Functional Requirements (FR)
This section enumerates functional requirements. Functional requirements can be described as a set of inputs, the behavior, and outputs. Functional requirements usually do not include any constraints – these are usually part of the non-functional requirements. The major goal of the requirements document is to list the functional requirements of the system to be developed.
Module Name
Major Feature (MF)
Functional Requirement
#
Description
Acquisition MF-1 FR-10.001 Modify DIS acquisition software to handle visibility sensor data
MF-2 FR-10.002 Modify the DAS acquisition software to handle visibility data
MF-1 FR-10.003 Determine the sensor ID to be associated with visibility data
Decode
MF-1 FR-20.001 Modify the GOES decoder to handle visibility data
MF-2 FR-20.002 Modify the DAS acquisition software to handle visibility data
MF-1 FR-20.003 Modify decoder to handle to byte sensor code
QC
MF-7 FR-30.001 Modify the CCP to handle visibility data
MF-5 FR-30.002 Modify the diagtool to handle visibility data
Ingestion
MF-3 FR-40.001 Modify the DB structure to handle visibility data
MF-3 FR-40.002 Modify insert program to handle visibility data
MF-3 FR-40.003 Modify any standard reports to handle visibility data
Dissemination
MF-6 FR-50.001 Modify the TAC website to handle visibility data
MF-6 FR-50.002 Modify MYPORTS for visibility data
MF-6 FR-50.003 Modify Text/PDA for visibility data
MF-6 FR-50.004 Modify the voice system for visibility data
Metadata MF-8 FR-60.001 Modify PB to handle visibility data
MF-8 FR-60.002 Modify E-site to handle visibility data
Non-Functional Requirements (NR) (if applicable)
There are no non-functional requirements.
Ocean Systems Test and Evaluation Program
H-1
Appendix H. Federal Meteorological Handbook – Chapter 6
Visibility is a measure of the opacity of the atmosphere. An automated, instrumentally-derived visibility value is a sensor value converted to an appropriate visibility value using standard algorithms and is considered to be representativeof the visibility in the vicinity of the airport runway complex. A manually-derived visibility value is obtained using the "prevailing visibility" concept. In this chapter, the term "prevailing visibility" shall refer to both manual and instrumentderived visibility values.
6.1 General
6.4 Visibility Observing Standards. Visibility may be manually determined at either the surface, the tower level, orboth. If visibility observations are made from just one level, e.g., the airport traffic control tower, that level shall beconsidered the "usual point of observation" and that visibility shall be reported as surface visibility. If visibilityobservations are made from both levels, the visibility at the tower level may be reported as tower visibility.
Visibility may be automatically determined by sensors operating in accordance with the Federal Standard Algorithmsfor Automated Weather Observing Systems Used for Aviation Purposes. This visibility algorithm calculates a mean visibility which is the sensor equivalent of prevailing visibility. The visibility data during the period of observation are examined to determine if variable visibility shall be reported.
6.4.1 Observing Sites. Where the observer's view of the horizon is obstructed, the observer shall move to as manylocations as necessary and practicable within the time allotted for the observation to view as much of the horizon as possible. In this respect, natural obstructions, such as trees, hills, etc., are not obstructions to the horizon. These naturalobstructions define the horizon.
For automated weather observing stations, the visibility sensor shall be located, in accordance with the Federal Standard for Siting Meteorological Sensors at Airports.
6.4.2 Manual Observing Aids. Agencies shall establish procedures to ensure that insofar as possible, dark or nearly dark objects viewed against the horizon sky shall be used during the day, and unfocused lights of moderate intensity (about 25 candela) shall be used during the night as reference points for manually determining visibility. In addition, visibility sensors may be used to assist the observer in the evaluation.
September 2005 Federal Meteorological Handbook No.16-1
The visibility parameters are:
6.3 Visibility Parameters
This chapter describes the standards for observing and reporting visibility.
6.2 Scope
d. Tower visibility. The prevailing visibility determined from the airport traffic control tower (ATCT)at stations that also report surface visibility.
c. Surface visibility. The prevailing visibility determined from the usual point of observation.
b. Sector visibility. The visibility in a specified direction that represents at least a 45 degree arc of the horizon circle.
a. Prevailing visibility. The visibility that is considered representative of visibility conditions at the station; the greatest distance that can be seen throughout at least half the horizon circle, not necessarily continuous.
H-2
6.4.3 Observer Adaptation to Ambient Light Conditions. Agencies shall establish procedures to ensure that observer's eyes shall be accustomed to the ambient lighting conditions before manual visibility observations aretaken.
6.4.4 Visibility. Manually-derived visibility shall be evaluated as frequently as practicable. All available visibilityreference points shall be used. The greatest distances that can be seen in all directions around the horizon circleshall be determined. When the visibility is greater than the distance to the farthest reference point, the greatestdistance seen in each direction shall be estimated. This estimate shall be based on the appearance of the mostdistant visible reference points. If they are visible with sharp outlines and little blurring of color, the visibility ismuch greater than the distance to them. If they can barely be seen and identified, the visibility is about the same asthe distance to them. After visibilities have been determined around the entire horizon circle, they shall be resolved into a single value for reporting purposes. To do this, the greatest distance that can be seen throughout atleast half the horizon circle, not necessarily continuous shall be used; this is prevailing visibility. If the visibility is varying rapidly during the time of the observation, the average of all observed values around the horizon circleshall be used for reporting purposes.
6.4.5 Variable Prevailing Visibility. If the prevailing visibility rapidly increases and decreases by 1/2 statute mile or more, during the time of the observation, and the prevailing visibility is less than 3 miles, the visibility isconsidered to be variable.
6.4.6 Sector Visibility. When the manually-derived visibility is not uniform in all directions, the horizon circle shall be divided into arcs that have uniform visibility and represent at least one eighth of the horizon circle (45degrees). The visibility that is evaluated in each sector is sector visibility.
6.5 Visibility Reporting Standards
6.5.1 Unit of Measure. Visibility shall be reported in statute miles.
6.5.2 Prevailing Visibility. Prevailing visibility shall be reported in all weather observations. The reportable values forvisibility are listed in Table 6-1. If the actual visibility falls halfway between two reportable values, the lower valueshall be reported (see paragraph 12.6.6).
6.5.3 Variable Prevailing Visibility. Variable prevailing visibility shall be reported if the prevailing visibility is lessthan 3 miles and rapidly increases or decreases by 1/2 statute mile or more during the time of observation. Theminimum and maximum visibility values observed shall be reported in remarks section (see paragraph 12.7.1.g).
6.5.4 Tower Visibility. Tower visibility shall be reported, in accordance with agency procedures (see paragraph12.7.1.f).
6.5.5 Surface Visibility. Surface visibility shall be the prevailing visibility from the surface at manual stations or thevisibility derived from sensors at automated stations (see paragraph 12.7.1.f).
6.5.6 Visibility At Second Location. When an automated station uses a meteorological discontinuity visibility sensor,remarks shall be added to identify visibility at the second location which differ from the visibility in the body of the report (see paragraph 12.7.1.i).
6.5.7 Sector Visibility. Sector visibility shall be reported in remarks when it differs from the prevailing visibility byone or more reportable values and either the prevailing or sector visibility is less than 3 miles(see paragraph 12.7.1.h).
Federal Meteorological Handbook No.1 September 20056-2
Ocean Systems Test and Evaluation Program
H-3
Table 6-1. Reportable Visibility Values
Table 6-2. Summary of Visibility Observing and Reporting Standards and Procedures
Type of Station
Visibility Automated Manual
Surface Represents 10-minutes of sensor
outputs. Visual evaluation of visibility around the horizon.
Variable Reported when the prevailing visibility varies by 1/2 mile or more and the
visibility is less than 3 miles.
Tower Augmented. Reported at stations with an ATCT.
a. These values may not be reported by some automated stations. b. Further values in increments of 5 statute miles c, 50, be reported, i.e., 40, 45, 50, etc.
Before you begin to install FS11 Visibility Sensor, make a plan of the installation steps. The following is an exemplary plan describing how to organize the installation process.
1 Perform site survey: -Find the most representative measurement site -Determine the orientation of the visibility sensor
2 Prepare cabling plan: -Grounding cabling layout and cable type -Power supply cabling layout and cable type -Modem/signal cabling layout and cable type
3 Order the construction materials and cables
4 Do the digging for cables and foundation
5 Cast the concrete
6 Install the base plate and the pole mast: -Install the base plate on the concrete block with the bolts -Level the plate -Mount the pole mast on the base plate
7 Connect the cables:
-Install the interface and measurement units of FS11 to the pole mast
-Connect the modem/signal line to the host computer, display, and other such equipment
9. Perform startup tests for the system.
8. Perform final installation:
I-2
Location and Orientation
The main requirements for the location of FS11 are presented in the following:
1. The FS11 sensor should be sited in such a way that the measurements will be representative of the surrounding weather conditions.
-FS11 should be located at a minimum distance of 100 m from any large buildings or other constructions that radiate heat and/or obstruct precipitation droplets. The shade of trees should also be avoided because trees may cause changes in the microclimate.
2. The site should be free of obstacles and reflective surfaces that will disturb the optical measurement, as well as obvious sources of contamination.
-It is recommended that there are no obstacles in the line-of-sight of the transmitter and receiver units (see Figure 2 on page 21). If the transmitter beam is reflected back to the receiver unit from obstacles, the sensor will indicate too low MOR values because the reflected signal cannot be distinguished from the real scatter signal. Harmful reflections can be detected by rotating the measurement unit. These reflections change depending on the measurement unit orientation and the visibility reading will change accordingly.
Ocean Systems Test and Evaluation Program
I-3
Figure 2 Recommended Location of FS11 with FSFM250 or FSAM250
-The receiver and transmitter optics should not point towards powerful light sources or, in bright daylight, towards reflective surfaces such as snow or sand. It is recommended that the receiver point north in the northern hemisphere and south in the southern hemisphere. (The transmitter and receiver heads can be identified by first locating the surface temperature probe, which is closer to the transmitter.) The receiver circuit may become saturated in bright light, in which case the built-in diagnostics will indicate a warning.
-The transmitter and receiver should face away from any obvious source of contamination such as spray from passing vehicles. Excessive contamination is automatically detected by the sensor.
-There should be no bright flashing lights near the sensor or in the receiver's field of view.
-If Background Luminance Sensor is to be installed it needs a clear view of the sky in its preferred viewing direction (normally north in the northern hemisphere and south in the southern hemisphere, see section LM21 Background Luminance Sensor on page 56).
3. Power supply and communication lines must be available.
-When siting the FS11 sensor, consideration must be given to the available power supply and communication lines, as this influences the amount of work and accessories needed, and hence the actual cost of the installation.
ACRONYMS AI artificial intelligence
ASOS Automated Surface Observing System
AWIPS Automated Weather Interactive Processing System
ATON ADCP Aid-to-navigation acoustic Doppler current profiler
CIL Chesapeake Instrument Laboratory
CO-OPS Center for Operational Oceanographic Products and Services
CORMS Continuous Operational Real-Time Monitoring System