Page 1
Noise Immission from Wind FarmsMaster’s Thesis in the Master’s programme in Sound and Vibration
HANNES FURUHOLM
KRISTOFFER HULTBERG
Department of Civil and Environmental Engineering
Division of Applied Acoustics
Chalmers Vibroacoustics group
Chalmers University of Technology
Gothenburg, Sweden 2011-2013
Master’s Thesis 2013:112
Page 2
Noise Immission from Wind Farms
© HANNES FURUHOLM & KRISTOFFER HULTBERG, 2011-2013
Master’s Thesis 2013:112
Department of Civil and Environmental Engineering
Division of Applied Acoustics
Vibroacoustics Group
Chalmers University of Technology
SE-41296 Goteborg
Sweden
Tel. +46-(0)31 772 1000
Reproservice / Department of Civil and Environmental Engineering
Goteborg, Sweden 2013
Page 3
Noise Immission from Wind Farms
Master’s Thesis in the Master’s programme in Sound and Vibration
HANNES FURUHOLM & KRISTOFFER HULTBERG
Department of Civil and Environmental Engineering
Division of Applied Acoustics
Vibroacoustics Group
Chalmers University of Technology
Abstract
The noise from wind turbines at surrounding dwellings is not yet fully investigated with
respect to noise level distribution, directivity or subjective experience. In the matter of
noise, a single wind turbine is however relatively simple to describe in comparison to
wind farms. In the literature it is possible to find examples of both a subjectively better
situation with less amplitude modulation and a subjectively worse situation with higher
noise levels. Thus there is a need to study how wind turbines standing close to each
other radiate noise.
The work is based on measurements and recordings on a real wind farm with 5 large
wind turbines. Additionally, the work includes development of methods to measure and
evaluate immission levels from unattended measurements.
The research done in this report shows that prediction models of today may not be
fully accurate when investigating wind farms. The farm investigated shows a completely
different spectrum shape and higher sound pressure levels than calculated.
iii CHALMERS, Master’s Thesis 2013:112
Page 4
Contents
Abstract iii
Contents iv
Acknowledgements vi
1. Introduction 1
1.1. Thesis background . . . . . . . . . . . . . . . . . . . . . . . . . . . . . . . 1
1.2. Thesis aim . . . . . . . . . . . . . . . . . . . . . . . . . . . . . . . . . . . . 2
1.3. Previous work . . . . . . . . . . . . . . . . . . . . . . . . . . . . . . . . . . 2
2. Theory and background 3
2.1. Noise from the wind turbine . . . . . . . . . . . . . . . . . . . . . . . . . . 3
2.1.1. Aerodynamic noise . . . . . . . . . . . . . . . . . . . . . . . . . . . 4
2.1.2. Mechanical noise . . . . . . . . . . . . . . . . . . . . . . . . . . . . 4
2.2. Outdoor Sound Propagation . . . . . . . . . . . . . . . . . . . . . . . . . . 5
3. Measurements and evaluation 6
3.1. Measurement site . . . . . . . . . . . . . . . . . . . . . . . . . . . . . . . . 6
3.2. Long term immission measurements . . . . . . . . . . . . . . . . . . . . . 7
3.3. Measurement of noise emission levels . . . . . . . . . . . . . . . . . . . . . 8
3.3.1. Proceeding of measurements and sight descriptions . . . . . . . . . 9
4. Data processing - Spectral analysis 13
4.1. Calculating the expected SPL at the immission point . . . . . . . . . . . . 13
4.2. Comparing the calculated SPL at the immission point with the actual
measurements . . . . . . . . . . . . . . . . . . . . . . . . . . . . . . . . . . 13
4.3. Evaluating the possible wind turbine noise . . . . . . . . . . . . . . . . . . 15
5. Results 17
5.1. Emission measurements . . . . . . . . . . . . . . . . . . . . . . . . . . . . 17
5.2. Spectral analysis . . . . . . . . . . . . . . . . . . . . . . . . . . . . . . . . 18
5.2.1. Reference curve of measurements . . . . . . . . . . . . . . . . . . . 18
5.2.2. Reference curve of grading . . . . . . . . . . . . . . . . . . . . . . . 18
iv
Page 5
5.2.3. How much of the total amount of noise is wind turbine noise? . . . 19
5.2.4. Wind data . . . . . . . . . . . . . . . . . . . . . . . . . . . . . . . 20
6. Discussion 24
6.1. Why does the calculated and measured values not correlate at the immis-
sion point? . . . . . . . . . . . . . . . . . . . . . . . . . . . . . . . . . . . 24
6.2. Is it reliable to measure the emission levels according to standard and use
them in a prediction method such as SEPA:s? . . . . . . . . . . . . . . . . 25
7. Conclusions 26
References 27
A. Appendix 28
v CHALMERS, Master’s Thesis 2013:112
Page 6
Acknowledgements
Pontus Thorsson, Akustikverkstan/Chalmers
Our supervisor who gave us the idea for the project and aided us with measurement
equipment, guidance and advices.
Henrik Lundgren, Akustikverkstan
Helped us during the measurements.
Eolus Vind AB
Who let us investigate the wind farm at Kalleberg for the thesis.
Johan Scheuer, WSP
Took interest in the project and helped us with the questions we had.
Jens Forssen, Chalmers
Even though he was not involved in the project, he willingly helped us with our questions
regarding wind turbine noise.
Dan Sandros and Pia Hjalmarsson, Stena Renewable
Brought a good insight in the work of planning wind farms. Good coffee!
Malin Bryngelsson, Goteborg Energi
Our first close-up with a wind turbine, thanks Malin!
Borje Wijk, Chalmers
Who helped us with everything at the department.
Christoffer Janco, Student
Agitator
vi
Page 7
1. Introduction
1.1. Thesis background
The Swedish advisory referendums on nuclear power on March 23, 1980, lead to the de-
cision that nuclear power in Sweden should be phased out and no further nuclear power
expansion was to take place. ’Linje 2’ which got the most votes stated that ’Research
and development of renewable energy sources shall be pursued under the leadership of
the community’. This has lead to extensive research regarding renewable energy sources
such as wind power.
As of today, a large wind farm near Pitea, Sweden, is in the planning stage. The farm
would consist of 1101 turbines placed on an area of 15 square kilometres. However, this
will only produce about the same effect as two of the ten nuclear reactors in commercial
operation in Sweden today. If wind power should be a feasible alternative to nuclear
power, there is a need for more wind farms.
Noise pollution from wind turbines is an important public health issue, and strict reg-
ulations regarding noise levels for nearby residents to a wind farm is a necessity. The
fact that more turbines equals higher noise levels constitutes a problem, an expansion of
turbines is needed but the nearby residents should not be affected. The Swedish envi-
ronmental protection agency (SEPA) provides in the ’Swedish standard for wind turbine
noise’ regulations and prediction methods of noise from wind turbines; which estimates
the noise immission levels from a wind turbine. Applying this method for a whole wind
farm would give a summation of the noise immission levels for each turbine in a single
immission point.
1
Page 8
1.2. Thesis aim
The thesis aims to investigate and discuss two main points:
� How to identify wind turbine noise from unattended measurements, enabling to
evaluate the immission levels
� By using the identified and measured wind turbine noise - is it possible to investi-
gate if the prediction methods correlate with the measurements?
The work will be based on measurements and recordings on a real wind farm consisting
of five turbines. The measured imission levels will be compared to the SEPA’s prediction
method.
1.3. Previous work
At the third international meeting of wind turbine noise in Denmark, June 2009, Bull-
more et al. presented an article which stated that ’The large scale of modern wind farms
means that seemingly small conservatism in the prediction of noise immission levels can
translate to substantial lost development opportunities’. Bullmore further notes that a
worst case assessment on a wind farm would mean that for instance all turbines experi-
ence the same wind conditions as the first upwind turbine, the ground is a hard reflecting
surface and that all turbines emit higher sound power than test levels. In practice this
is, according to Bullmore, an unlikely scenario.
Furthermore, Wagner (1996) shows in his book ”Wind turbine noise” a dipole-like ra-
diation pattern of a wind turbine, directly translated from the trailing edge noise of
a helicopter rotor. The method of SEPA considers a pure spherical noise propagation
approach of wind turbines.
In an article by Prospathopoulus (2007) the interaction between wind turbines in a
farm is discussed. It is stated that depending on the wind direction and the carriage
shadowing or non-shadowing of a nearby standing tower, the level of noise can increase
or decrease substantially. This is due to the amount of atmospheric turbulence which
the second tower is forced to operate in, a maximum shadowing between the wind tur-
bines would increase the amplitude modulation and thereby create a higher quantity of
disturbing noise.
CHALMERS, Master’s Thesis 2013:112 2
Page 9
2. Theory and background
When estimating the noise emission from a wind turbine and the corresponding sound
pressure levels in nearby points, one must consider both the directivity of the sound
emitting from the turbine as well as the external factors influencing the propagating
sound wave. This chapter will present the main phenomena which affects the final
sound pressure level in an arbitrary immission point, near the turbine.
2.1. Noise from the wind turbine
The sound power from a wind turbine emits from several different components of the
structure. The table below lists the different parts and their noise characteristics to the
total sound pressure level [Wag 96].
� Aerodynamic
Noise associated with the interaction of turbulence with the blade surface. Mainly
noise originated from the trailing edge of the blades
� Auxiliaries
Noise from oil coolers and hydraulic power packs for blade pitch, air borne.
� Blade tips
Noise radiating from the tip of the blades, connected to the tip turbulence. Noise
emitted from the tip is in the region of 500-1000Hz.
� Gearbox (airborne)
The air borne noise from the gearbox is not considered as influencing as its struc-
ture borne.
� Gearbox (structure borne)
Mechanical noise, structure borne
� Generator
Mechanical noise, including cooling fans etc.
� Hub
Mechanical noise from the rotor part of the tower, the hub is located in the centre
of the tower where the blades are fixed. Structure borne.
3
Page 10
� Tower
Structure borne sound from the tower.
As of today, according to SEPA [Nat 10], the sound emission of the blades and their
aerodynamics together with the eventual mechanical noise of the gearbox; are the most
contributing systems to the total sound emission level of the wind turbine.
2.1.1. Aerodynamic noise
Aerodynamic noise is the main cause of complaint regarding modern wind turbines. Its
characteristics can be similar to the ones for regular wind noise and can therefore often
be masked by heavy wind, but aerodynamic noise from a wind turbine can also take a
”swoosh-swoosh” characteristic. This type of noise is a modulation of frequencies in the
mid- and high frequency region, with its peak frequency in the region of 500-1500 Hz.
This amplitude modulation increases the audibility of the noise and thus decreases the
possibility of natural masking by the wind noise [Nat 10].
The modulation can be derived from the existence of turbulent flow near the blades.
If turbulent eddies are apparent close to a sharp edge (e.g. a wind turbine blade) it in-
creases the eddies efficiency as a sound source. This is referred to as turbulent boundary
layer trailing edge interaction noise, or Trailing Edge Noise [Sal 01].
A turbulent environment, see figure 2.1, for the sound propagation can emerge in several
different situations, atmospheric turbulence arises when there is a rapid fluctuation of
the wind or temperature in the atmosphere. By placing the wind turbine blades on
the downwind side of the tower, turbulent flows arise due to the tower shading of the
wind - a rapid fluctuation of the wind speed directly behind the tower. This enables
an unnecessary turbulent work environment for the wind turbine, which can result in
a radiated sound with strong amplitude modulation and a large low frequency content.
Most turbines of today places the blades on the upwind side of the tower to avoid this
problem.
2.1.2. Mechanical noise
The characteristic of the mechanical noise, at the same noise level, from the wind turbine
is often considered more disturbing than the aerodynamic noise. It mainly radiates in
frequencies around 20-100 Hz. Mechanical noise from wind turbines is however rarely
considered as a problem for modern wind turbines since it has been a well known problem
for many years, and therefore a lot of development and research has been done on the
subject [Nat 10].
CHALMERS, Master’s Thesis 2013:112 4
Page 11
Figure 2.1.: The blades of a turbine naturally creates turbulence in the wake of the tower
[Ver 03]
2.2. Outdoor Sound Propagation
Besides the natural decay with distance, there is a wide range of parameters influencing
the final sound pressure level in an immission point. Highly influential factors for wind
turbine noise propagation are presented below.
� Ground effect - Which is described by the reflection factor, given by the difference
in ground and air impedance. The roughness of the ground is also influential on
the sound propagation.
� Refraction - The refraction of the sound waves is created by the differences in
wind direction and speed. In downwind conditions, the sound waves are refracted
towards the ground in a more direct angle of attack which minimizes the ground
effect on the sound propagation. For upwind conditions, the upward refraction
causes the sound waves to approach the ground in a more gracing angle which
increases the contribution from the ground effect.
� Temperature and humidity - The absorption coefficient is described by the air
temperature and relative humidity, air absorption increases with frequency.
� Atmospheric turbulence - This causes variations in the phase and amplitude of
the sound waves. For upward and downward refraction of the sound rays, the
atmospheric turbulence causes scattering of the rays which affects the sound field.
For a downward refracting turbulent atmosphere this effect reduces the interference
between direct and reflected sound waves. This gives a considerable reduction in
sound attenuation compared to a non turbulent atmosphere where the sound waves
interfere [Sal 01].
5 CHALMERS, Master’s Thesis 2013:112
Page 12
3. Measurements and evaluation
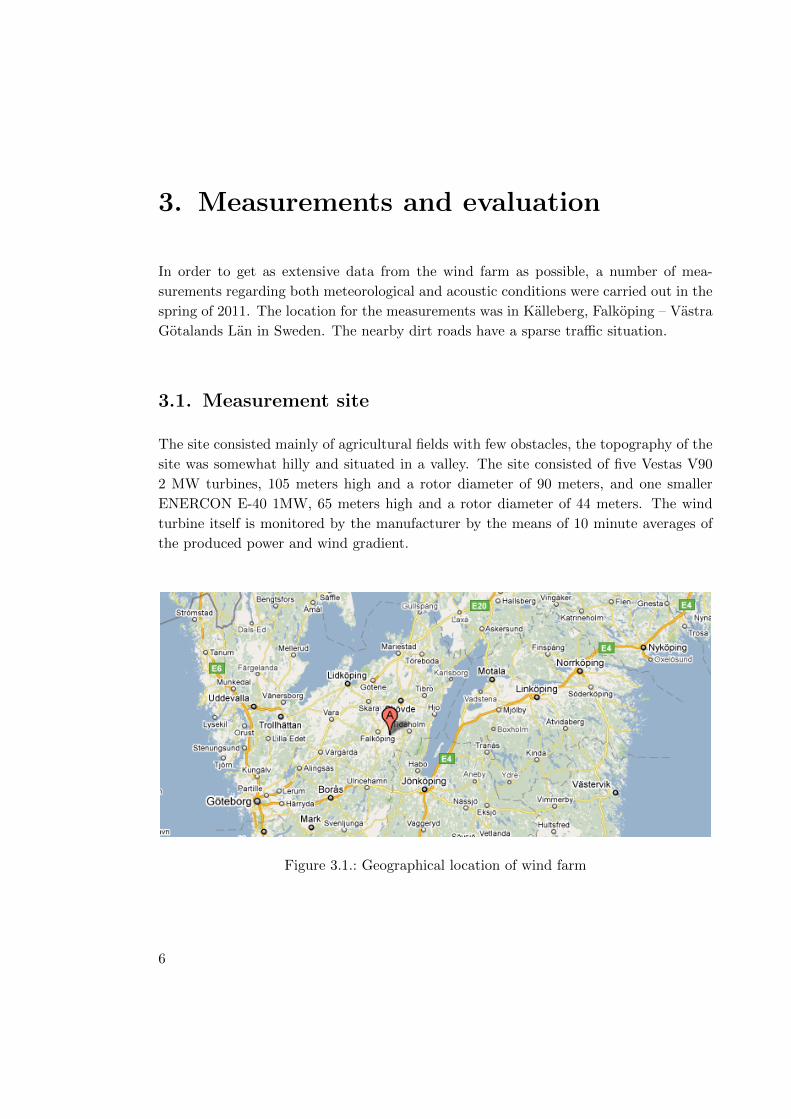
In order to get as extensive data from the wind farm as possible, a number of mea-
surements regarding both meteorological and acoustic conditions were carried out in the
spring of 2011. The location for the measurements was in Kalleberg, Falkoping – Vastra
Gotalands Lan in Sweden. The nearby dirt roads have a sparse traffic situation.
3.1. Measurement site
The site consisted mainly of agricultural fields with few obstacles, the topography of the
site was somewhat hilly and situated in a valley. The site consisted of five Vestas V90
2 MW turbines, 105 meters high and a rotor diameter of 90 meters, and one smaller
ENERCON E-40 1MW, 65 meters high and a rotor diameter of 44 meters. The wind
turbine itself is monitored by the manufacturer by the means of 10 minute averages of
the produced power and wind gradient.
Figure 3.1.: Geographical location of wind farm
6
Page 13
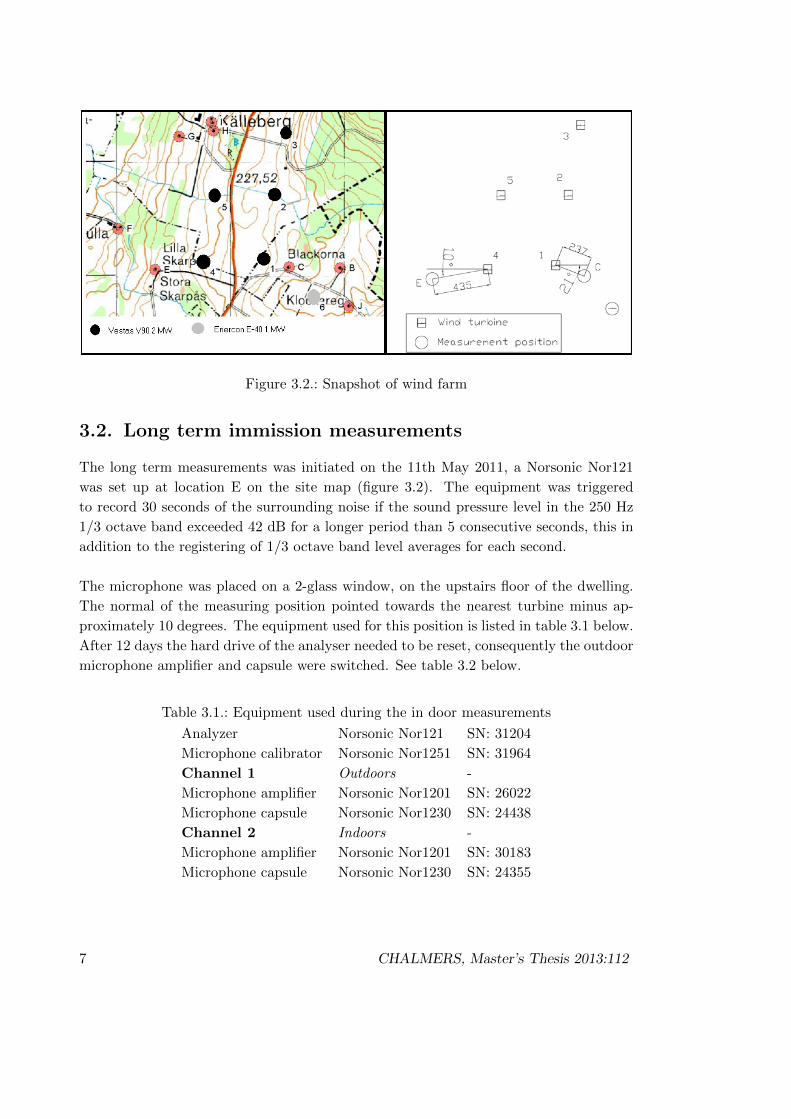
Figure 3.2.: Snapshot of wind farm
3.2. Long term immission measurements
The long term measurements was initiated on the 11th May 2011, a Norsonic Nor121
was set up at location E on the site map (figure 3.2). The equipment was triggered
to record 30 seconds of the surrounding noise if the sound pressure level in the 250 Hz
1/3 octave band exceeded 42 dB for a longer period than 5 consecutive seconds, this in
addition to the registering of 1/3 octave band level averages for each second.
The microphone was placed on a 2-glass window, on the upstairs floor of the dwelling.
The normal of the measuring position pointed towards the nearest turbine minus ap-
proximately 10 degrees. The equipment used for this position is listed in table 3.1 below.
After 12 days the hard drive of the analyser needed to be reset, consequently the outdoor
microphone amplifier and capsule were switched. See table 3.2 below.
Table 3.1.: Equipment used during the in door measurements
Analyzer Norsonic Nor121 SN: 31204
Microphone calibrator Norsonic Nor1251 SN: 31964
Channel 1 Outdoors -
Microphone amplifier Norsonic Nor1201 SN: 26022
Microphone capsule Norsonic Nor1230 SN: 24438
Channel 2 Indoors -
Microphone amplifier Norsonic Nor1201 SN: 30183
Microphone capsule Norsonic Nor1230 SN: 24355
7 CHALMERS, Master’s Thesis 2013:112
Page 14
Table 3.2.: New equipment
Channel 1 Outdoors -
Microphone amplifier Norsonic Nor1201 SN: 23686
Microphone capsule Norsonic Nor1230 SN: 48106
A Sigicom INFRA Master was set up at location C of the map (figure 3.2) – this is a
simpler type of equipment which only registered the total sound pressure level at the
measuring point. The microphone was placed on a 2-glass window, on the downstairs
floor of the dwelling. The normal of the measuring position pointed towards the nearest
turbine minus approximately 21 degrees.
Data regarding wind speed and direction for the time of the measurements was later
gathered from the wind turbines and correlated with the acoustic data from the mea-
suring equipment.
3.3. Measurement of noise emission levels
The following section is a brief summary on how to perform an emission measurement
for a wind turbine according to standard IEC 61400-11. Consequently it consists of
extracts from the standard IEC 61400-11, Wind turbine generator systems – Part 11:
Acoustic noise measurement techniques.
Equipment:
The measurement shall be performed using equipment in accordance to the standard.
Wind speed and direction measurements:
The wind speed and direction measurement device is mounted at 10 m height in the
upwind direction of the wind turbine. The distance from the measured turbine shall be
at a length between two and four rotor diameters. I.e. for a Vestas V90, which has a
rotor diameter of 90 meters, the wind speed and direction measurement device shall be
placed between 180 and 360 meters in front of the turbine.
Acoustic measurements:
Two different sound level measurements are performed in the same position, which is at
a direct downwind distance equal to the total height - nacelle height plus rotor radius -
of the tower. One measurement consists of the sound level with the turbine active and
one measurement consists of the background noise, with the turbine deactivated. The
measurements shall include the following information regarding the wind speed 6, 7, 8,
CHALMERS, Master’s Thesis 2013:112 8
Page 15
9 and 10 m/s at 10 m height and a roughness length of 0,05 m.
� The apparent A-weighted sound power level LWA
� The one-third octave band sound power levels
� The tonality
During measurements of the background noise, efforts shall be made to ensure that the
background noise measurements are representative of the background noise that occurred
during the wind turbine noise emission measurements.
Evaluation:
The gathered data from the emission measurements is evaluated according to IEC 61400-
11. By that, the following assumptions are made:
� The evaluation is made in 1 minute intervals
� All measurements are carried out in the same 1/3-octave band spectra interval
� The time resolution of both the sound and meteorological data is based upon the
same and even 1 minute interval.
With permission, the evaluation files used are signed Pontus Thorsson, Akustikverkstan.
Modification of the original time resolution in the file is made. This in order to alter
the time resolution by command and compare data of both 1 and 10 minute averages,
in this case.
The fileset lets the user evaluate eventual disturbances according to notes and spec-
tras of the measurements, and eliminate those minutes that is considered to be not
valid. By this, the only data evaluated in the operation is truly correct and valid data.
This representing both the actual measurement as well as the background noise.
Meteorological data is also synchronized with the acoustic measurements, telling the
user if the measured sound data corresponds to valid weather circumstances – regarding
wind speed, temperature and air pressure.
By these means, evaluated and presented data by the fileset corresponds to the sound
power level of the wind turbine considered at all wind speeds that have measurement
data that is valid according to the standard.
3.3.1. Proceeding of measurements and sight descriptions
Equipment used for each measurement can be seen in table 3.3.
9 CHALMERS, Master’s Thesis 2013:112
Page 16
Table 3.3.: Equipment used during all five measurements
Analyzer Norsonic Nor140 SN: 1403782
Microphone amplifier Norsonic Nor1209 SN: 13098
Microphone capsule Norsonic Nor1225 SN: 106957
Microphone calibrator Norsonic Nor1251 SN: 32505
Weather station Reinhardt MWS 5MV SN: 1017775
The actual measurements inferred that the microphone was placed strictly downwind
from the tower, on a hard board of 0.95x1.05 square meters and at a distance from the
tower corresponding to the tower height plus the rotor radius. See figures in table 3.4.
By the means of the standards described in the previous section, 6 dB was withdrawn
from the measured immission levels. For each measurement all other wind turbines than
the studied were switched off.
Kalleberg 1313-38440 - 1:
Table 3.4.: Photos from measurements of Kalleberg 1314, 2011-05-25
Wind turbine Kalleberg 1313 was measured the 24th of May 2011. The microphone and
analyser were placed 150 meters downwind of the wind turbine, the weather station 215
meters upwind. The weather was cloudy with decreasing air pressure - finally result-
ing in rain. The measurements of the wind turbine started at 09:10 and lasted for 70
minutes. Directly afterwards the background noise levels were measured for 80 minutes.
During the measurements of the background noise the rain started about 20 minutes in
and lasted for about 25 minutes.
CHALMERS, Master’s Thesis 2013:112 10
Page 17
The surroundings of the measurements can be described as flat fields with some growth.
In the position of the microphone the grass were of about 30 cm of height - which gen-
tly was stomped flat to the ground, though still may causing some disturbances to the
measurements. The wind direction altered some degrees during the proceedings, though
still within range of standards. The roughness length was estimated to 0,05 meters.
Kalleberg 1314-38441 - 2:
The wind turbine Kalleberg 1314 was measured in the morning of 25th of May 2011.
Microphone and analyser were placed 162 meters downwind, the weather station 220 me-
ters upwind. Measurements of wind turbine started at 09:17 and lasted for 90 minutes.
Disturbances during the measurement were caused by rain of 5 minutes and an owner
of the wind turbines for about 10 minutes. A total of 15 minutes possible disturbance.
The background noise measurement was undisturbed except for the strong wind and
the fluctuations of it. Background noise measurement started 10:56 and lasted for 90
minutes.
Surroundings was open fields with minimal amount of growth, not causing any dis-
turbance. Though, some trees in the area may influenced some deviations in the mea-
surements because of the heavy wind at the day. The roughness length was estimated
to 0,05 meters.
Kalleberg 1315-38442 - 3:
Wind turbine Kalleberg 1315 was measured the 30th of May 2011. The weather station
was placed 220 meters upwind, microphone and analyser 140 meters downwind in a low
gradient slope. Terrain could be considered as quite lively, with growth and trees in the
surroundings. Following was twitter of birds and some disturbances of heavy trucks in
the area.
The measurement of the wind turbine was started at 10:55 and lasted for 80 minutes.
Subsequently the measurement of the background noise was started at 12:30 and lasted
for 80 minutes. During this measurement both air traffic and heavy wheel traffic occurred
and which may influenced the measurements. The roughness length was estimated to
0,05 meters.
Kalleberg 1316-38443 - 4:
The emission levels of wind turbine Kalleberg 1316 (wind turbine n:o 4 in figure 3.2)
in Kalleberg Vindpark was measured during the day of the 17th of May 2011. By the
means of acceptable wind and weather, the circumstances were considered to be within
a reasonable range of the standards. The weather station was placed 230 meters up-
11 CHALMERS, Master’s Thesis 2013:112
Page 18
wind, microphone and analyser 150 meters downwind. Measurement of the wind turbine
started at 13:10 and lasted for 90 minutes. After about 60 minutes a tractor started
ploughing the field - lasted for 15 minutes. Otherwise no particular disturbance. Subse-
quently the background noise measurement was started and lasted for 70 minutes. No
particular disturbances except for a small amount of lightweight traffic in the area. The
surroundings can be described as a homogeneous field without growth. Small gravel road
about 100 meters away from the microphone with light traffic. The roughness length
was estimated to 0,05 meters.
Subsequent to this an additional measurement was made by turning on wind turbine
1313 (1) in the same farm. Same positions and set-up as described above, though with
two (1313 and 1316) wind turbines running. This by the means of interpret eventual
influence of each turbine to the total radiated sound power. No disturbances except for
the light traffic.
Kalleberg 1317-38444 - 5:
Wind turbine Kalleberg 1317 was measured the 25th of May 2011. The microphone
and analyser were placed 150 meters downwind, the weather station 200 meters upwind.
The measurement of the wind turbine was initiated at 14:10 and lasted for 100 minutes.
The microphone position was fairly close to a small gravel road with some light traffic
that caused unwanted noise. Further, next to the road a parkway of trees moved quite
intensely because of the heavy wind of the day causing some disturbances as well. The
background noise measurement was started 16:04 and lasted for 80 minutes. Again,
some disturbances by traffic as well as some air traffic. The surroundings were otherwise
mainly flat fields without growth. The roughness length was estimated to 0,05 meters.
CHALMERS, Master’s Thesis 2013:112 12
Page 19
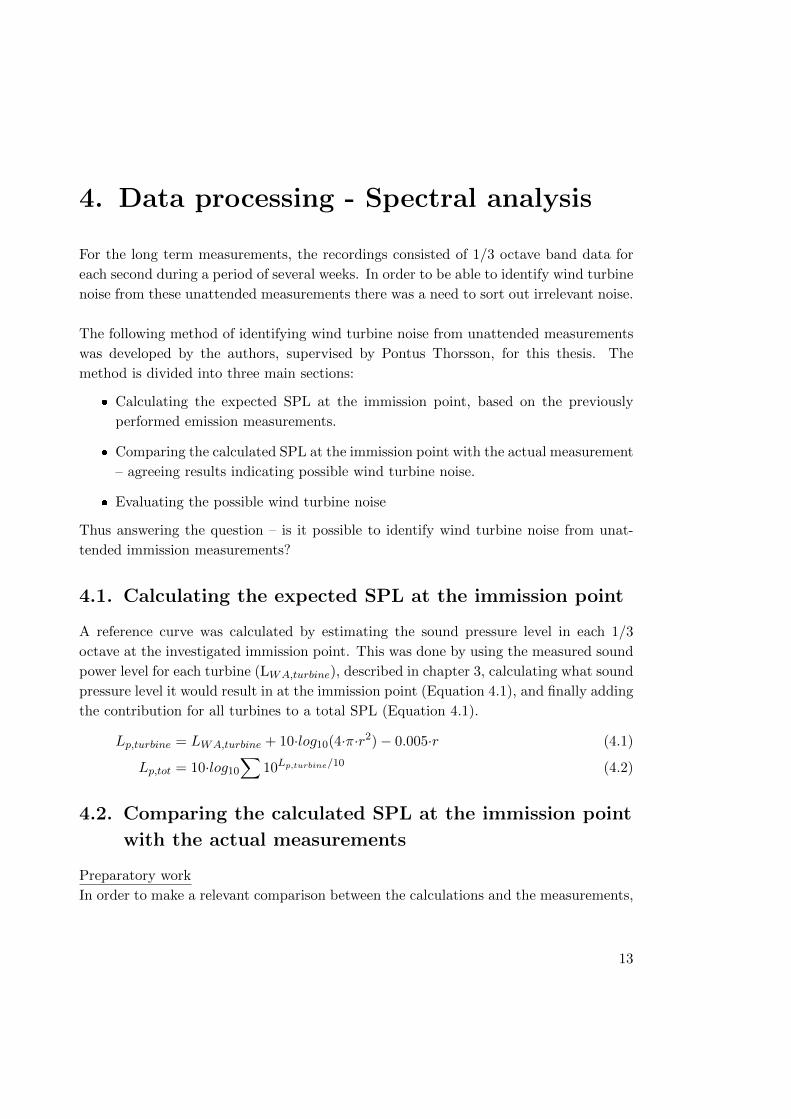
4. Data processing - Spectral analysis
For the long term measurements, the recordings consisted of 1/3 octave band data for
each second during a period of several weeks. In order to be able to identify wind turbine
noise from these unattended measurements there was a need to sort out irrelevant noise.
The following method of identifying wind turbine noise from unattended measurements
was developed by the authors, supervised by Pontus Thorsson, for this thesis. The
method is divided into three main sections:
� Calculating the expected SPL at the immission point, based on the previously
performed emission measurements.
� Comparing the calculated SPL at the immission point with the actual measurement
– agreeing results indicating possible wind turbine noise.
� Evaluating the possible wind turbine noise
Thus answering the question – is it possible to identify wind turbine noise from unat-
tended immission measurements?
4.1. Calculating the expected SPL at the immission point
A reference curve was calculated by estimating the sound pressure level in each 1/3
octave at the investigated immission point. This was done by using the measured sound
power level for each turbine (LWA,turbine), described in chapter 3, calculating what sound
pressure level it would result in at the immission point (Equation 4.1), and finally adding
the contribution for all turbines to a total SPL (Equation 4.1).
Lp,turbine = LWA,turbine + 10·log10(4·π·r2) − 0.005·r (4.1)
Lp,tot = 10·log10∑
10Lp,turbine/10 (4.2)
4.2. Comparing the calculated SPL at the immission point
with the actual measurements
Preparatory work
In order to make a relevant comparison between the calculations and the measurements,
13
Page 20
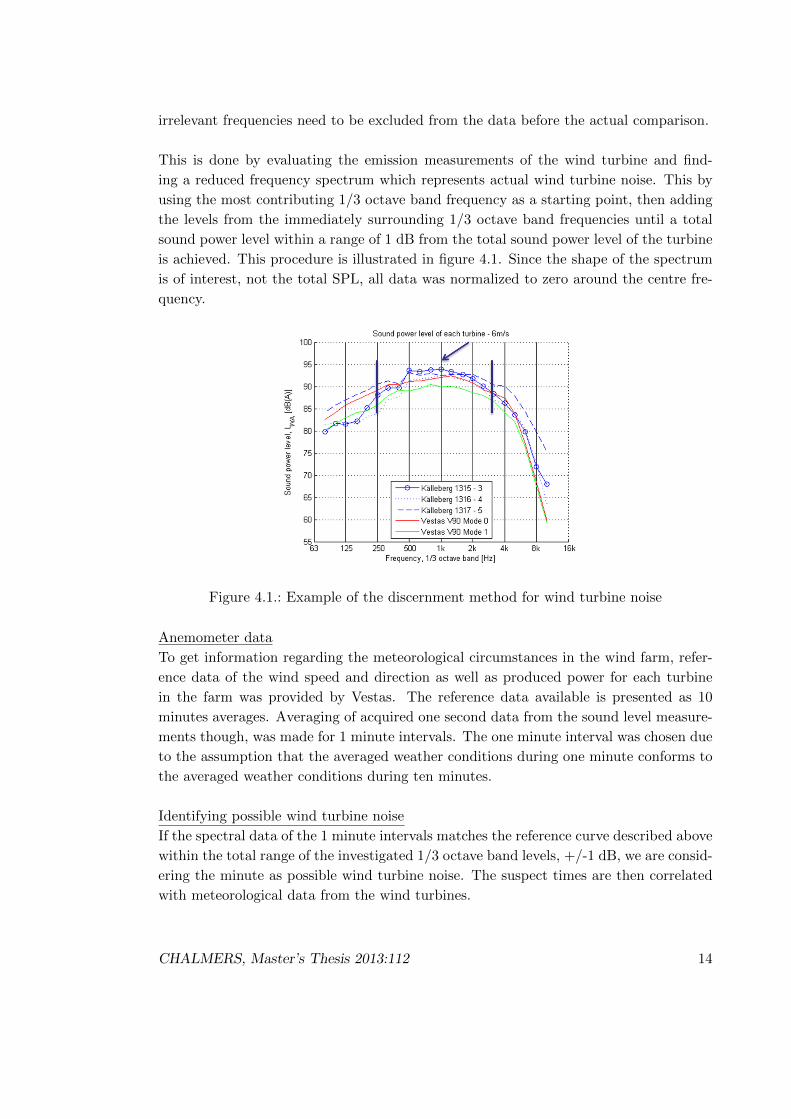
irrelevant frequencies need to be excluded from the data before the actual comparison.
This is done by evaluating the emission measurements of the wind turbine and find-
ing a reduced frequency spectrum which represents actual wind turbine noise. This by
using the most contributing 1/3 octave band frequency as a starting point, then adding
the levels from the immediately surrounding 1/3 octave band frequencies until a total
sound power level within a range of 1 dB from the total sound power level of the turbine
is achieved. This procedure is illustrated in figure 4.1. Since the shape of the spectrum
is of interest, not the total SPL, all data was normalized to zero around the centre fre-
quency.
Figure 4.1.: Example of the discernment method for wind turbine noise
Anemometer data
To get information regarding the meteorological circumstances in the wind farm, refer-
ence data of the wind speed and direction as well as produced power for each turbine
in the farm was provided by Vestas. The reference data available is presented as 10
minutes averages. Averaging of acquired one second data from the sound level measure-
ments though, was made for 1 minute intervals. The one minute interval was chosen due
to the assumption that the averaged weather conditions during one minute conforms to
the averaged weather conditions during ten minutes.
Identifying possible wind turbine noise
If the spectral data of the 1 minute intervals matches the reference curve described above
within the total range of the investigated 1/3 octave band levels, +/-1 dB, we are consid-
ering the minute as possible wind turbine noise. The suspect times are then correlated
with meteorological data from the wind turbines.
CHALMERS, Master’s Thesis 2013:112 14
Page 21
4.3. Evaluating the possible wind turbine noise
Parallel to the constant one second 1/3 octave band level registration of the noise at
the site, sound recordings of possible wind turbine noise was performed by the same
measurement device - as described in 3.2.
The actual sound recordings was processed to work as a ”cheat-sheet” for the spectral
analysis results. This was done by a manual evaluation of the 847 recordings, ranging
in length from 10 seconds to 40 seconds. The evaluation consisted of listening to each
recording and grading the amount of wind turbine noise present in each sound file – from
1 to 5.
1. No wind turbine noise, a lot of disturbance such as rain etc.
2. Maybe wind turbine noise, no amplitude modulation. Bad.
3. Small amplitude modulation. Reasonable/good recording with a lot of background
noise.
4. Somewhat more clear amplitude modulation. Small background disturbances.
5. Very good recording! Distinct amplitude modulation with low impact of back-
ground noise.
Since it was recorded by the same measuring device, the graded sound recordings corre-
late to different spectral analysed minutes from the long term measurements, it is now
possible to evaluate if the minutes that are identified as wind turbine noise by the spec-
tral analysis also have a high grade – i.e. actually are wind turbine noise.
Evaluating the spectral analysis with sound recordings
In order to be able to evaluate how well the spectral analysis works, the irrelevant data
- i.e. spectral “hits” which is not possible to listen to, due to the fact that the 42 dB
trigger described in 3.2 was not activated - needs to be sorted out, this in order to only
investigate those minutes that both are identified as wind turbine noise by the spectral
analysis and that there is an actual recording of.
Each sound file was stored to the measuring devices’ hard drive at a certain time, since
no sound file has a longer duration than 40 seconds the recording either correlates to the
same, the previous, or both minutes in the spectral analysis. Therefore, any minute in
the spectral analysis which is not correlating to the same or previous minute as a sound
recording was sorted out.
In the simplified example shown in table 4.1, the table shows that only minute 1,4,5,8
and 9 will be used when evaluating how well the spectral analysis works. This since these
15 CHALMERS, Master’s Thesis 2013:112
Page 22
Table 4.1.: Sorting of sound recordings
Minute 1 2 3 4 5 6 7 8 9 10
Sound recording x - - x x x - x x -
Spectral analysis x x - x x - x x x x
Analyzed? Yes No No Yes Yes No No Yes Yes No
are the only minutes that are identified as wind turbine noise by the spectral analysis
that there is an actual sound recording of. The comparison from table 4.1 was done for
all 847 recordings and its correlating minutes and spectral analysis hits.
This method of evaluation has given detailed information regarding several different
circumstances at the site during the long term measurement. It also sorts out anything
that in spectral shape resembles what wind turbine noise at the immission point looks
like according to SEPA, which now can be compared to the graded sound recordings.
To summarize, this method gives:
� Which times are suspected wind turbine noise
� A sound recording of the suspected wind turbine noise
� Evaluation of the suspected wind turbine noise, based on a grade of the sound
recording
� Meteorological data regarding wind direction for the suspect wind turbine noise
� The amount of electrical power produced by the wind turbine during the time of
the suspect wind turbine noise - which can be translated to wind speed
CHALMERS, Master’s Thesis 2013:112 16
Page 23
5. Results
In this chapter the results from the evaluations and data processing are presented. The
first section describes the results from the emission measurements of the wind turbines
at Kalleberg. The spectral analysis and gradings can be seen in the following chapter.
Furthermore, long term measurement data and wind gradients are presented together
with comments.
5.1. Emission measurements
The emission measurements according to IEC 61400-11 is presented below in table 5.1.
Results commented with * relies upon two samples, according to the standard at least
three samples is needed. A single dash means that no samples were collected for that
particular wind speed.
Table 5.1.: Results of the emission measurements of the wind farm at Kalleberg
Wind turbine 6 m/s 7 m/s 8 m/s 9 m/s 10 m/s
Kalleberg 1 - 102,9 103,0 102,9 103,0 dB(A)
Kalleberg 2 101,5* 102,5 102,5 102,2 102,1 dB(A)
Kalleberg 3 103,0 103,1 103,3 103,6 - dB(A)
Kalleberg 4 101,7 102,3 102,3 102,1 101,9* dB(A)
Kalleberg 5 104,5 105,2 104,8 105,4 105,0 dB(A)
Kalleberg 4+1 - 103,5 103,5 103,4 103,2 dB(A)
Measurement ”Kalleberg 1+4” was performed as an emission measurement of turbine
4 with an additional turbine operating in the wakes of turbine 4 still active. This to
investigate whether the influence of the wakes could increase the sound pressure level at
the measurement point - compared to the calculations. The measured sound power level
of the combined turbines is equivalent of a free-field value 47,5 dB(A) at the immisson
point by SEPA’s model. By adding the sound power levels of the emissions measurements
of turbine 1 and 4, one should expect 47,0 dB(A) as the most.
17
Page 24
5.2. Spectral analysis
The results of the gradings, evaluation of reference curves and correlation of wind data
is presented in this section.
5.2.1. Reference curve of measurements
Figure 5.1 shows how well the spectral analysis works, the results are based on a ref-
erence curve calculated from the in situ emission measurements of the wind turbines,
described in chapter 3. The sound identified as wind turbine noise is then correlated
with its grading as described in chapter 4 and presented in the figure.
The sound recordings which are most frequently identified as wind turbine noise have
been given the grade 2, this implies that spectral analysis using a calculated reference
curve from SEPA:s prediction model mainly identifies noise where there is no amplitude
modulation present.
Figure 5.1.: Grades for the identified wind turbine noise
5.2.2. Reference curve of grading
Since the results from the spectral analysis were not satisfying, it was decided that a
new reference curve was to be calculated. This time the sound recordings that was given
the highest grade (i.e. clearly showing wind turbine noise) was to be used as a template
for the new reference curve. This with the aim of investigating if the noise of the wind
farm at the sight has a certain characteristic.
CHALMERS, Master’s Thesis 2013:112 18
Page 25
In order to get a new reference curve based on the recordings with the highest grade,
a FFT was made on the parts of the sound files which were manually identified as the
most audible wind turbine noise. The result from this are presented as the thin lines in
figures 5.2 and 5.3.
As can be clearly seen in figure 5.2 and 5.3, the reference curve calculated from the
measurements does not at all resemble the thin lines which represent the most audible
wind turbine noise. By creating a new reference curve based on the gradings it is possible
to see if spectral analysis works using a “correct” spectrum. Worth to notice is that the
low frequency region of the immission measurements shows a clear resemblance over a
majority of the samples. In the upper high frequency region the deviation between the
samples increases.
Figure 5.2.: Reference curve based on calculations compared to recordings with grade 5
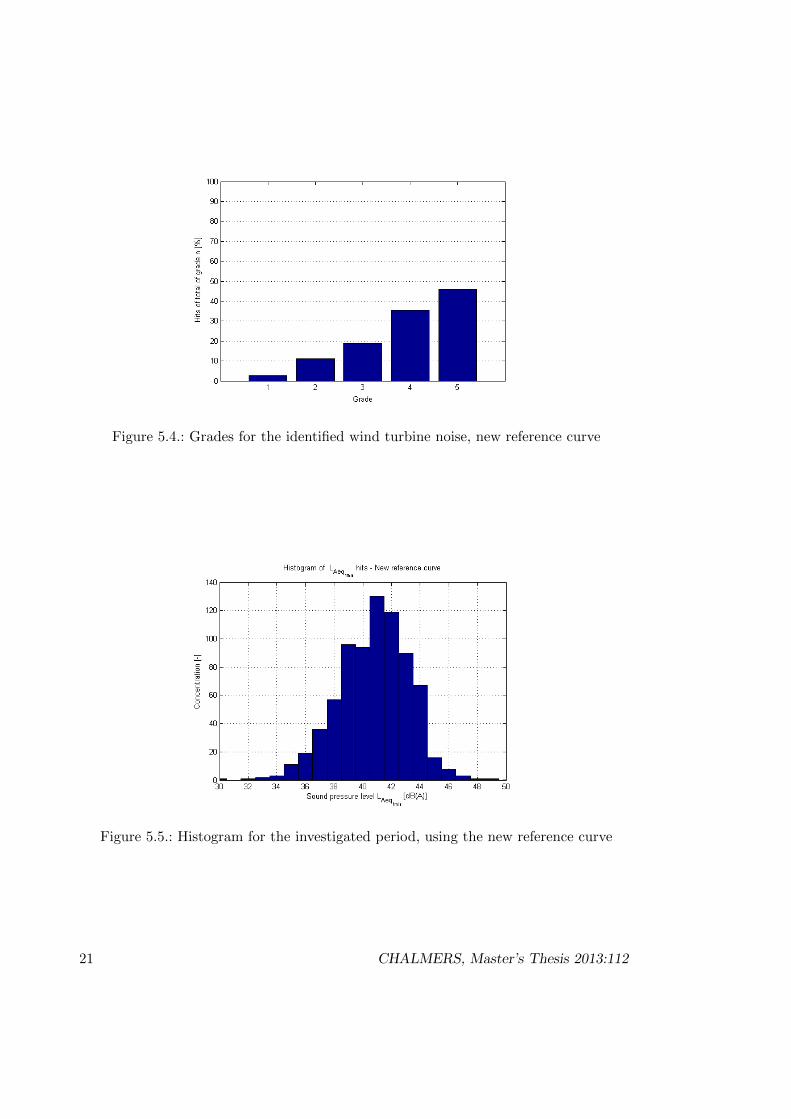
Figure 5.4 shows that when using a reference curve based on the most audible amplitude
modulated wind turbine noise, it identifies the sound recordings given the grade 4 and 5
as most likely to be wind turbine noise. In other words, there is a characteristic of the
noise from the wind farm at this sight which can be identified.
5.2.3. How much of the total amount of noise is wind turbine noise?
With the reference spectrum calculated using the grades, it is now possible to evaluate
how much of the total recordings that the spectrum analysis identifies as wind turbine
noise:
19 CHALMERS, Master’s Thesis 2013:112
Page 26
Figure 5.3.: Reference curve based on recordings with grade 5
The histogram in figure 5.5 shows that the maximum allowed level from wind turbines,
40 dB(A), is exceeded nearly 6% of the total time (4 hours in total during the week) –
this only considering the noise that is identified as wind turbine noise.
The equivalent level for the identified noise is 40.5 dB(A).
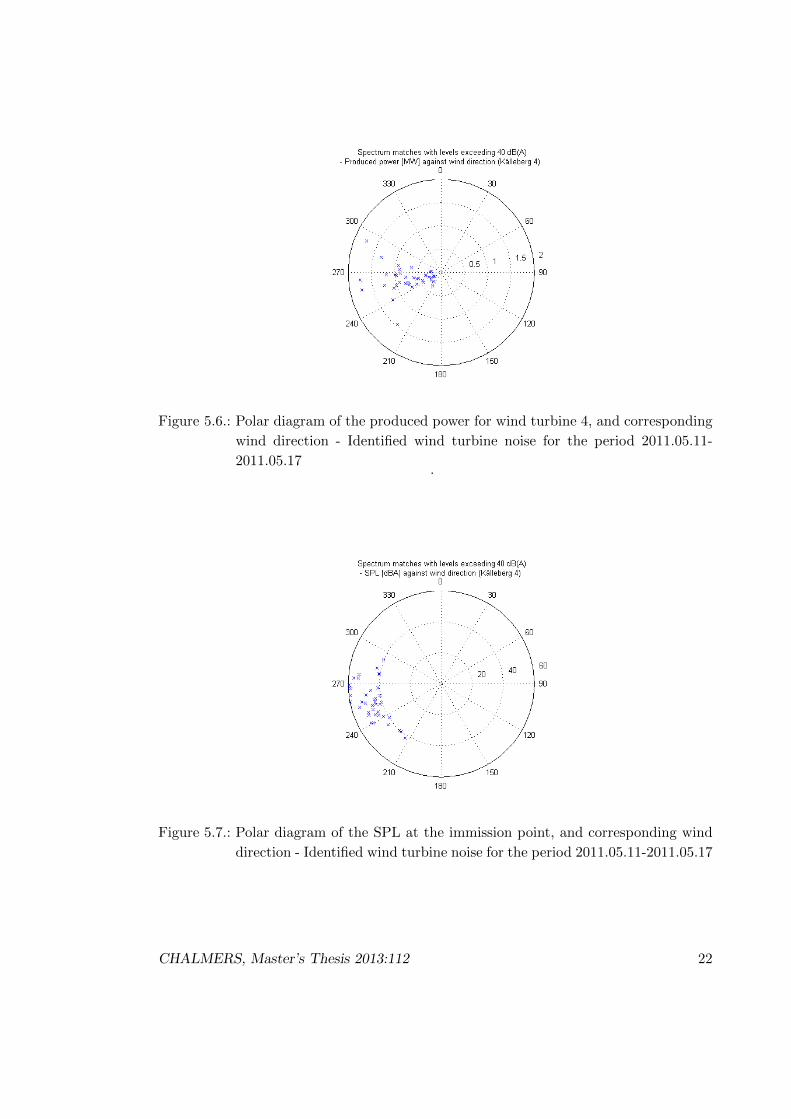
5.2.4. Wind data
The polar diagrams in this section shows the meteorological conditions for the wind
turbine noise, when the sound pressure level exceeds 40 dB(A). Figure 5.6 shows the
produced power for the nearest standing wind turbine and figure 5.7 shows the total
sound pressure level at the immission point. Due to availability from the wind turbine
manufacturer, all plots are based on 10 minute intervals. Note that figure 5.7 indicates
sound pressure levels up to 60 dB(A) from the wind turbines at the immission point,
though we will emphasize that this is mainly caused by the background noise. The
spectral analysis find resemblance with the wind turbine noise and indicates that the
turbines is in fact audible even if they do not contribute to the total sound pressure level.
The figure 5.8 shows the total distribution of the wind direction during the whole period.
The angle for each mark represents the wind direction - the measuring position is located
at 260 degrees.
CHALMERS, Master’s Thesis 2013:112 20
Page 27
Figure 5.4.: Grades for the identified wind turbine noise, new reference curve
Figure 5.5.: Histogram for the investigated period, using the new reference curve
21 CHALMERS, Master’s Thesis 2013:112
Page 28
Figure 5.6.: Polar diagram of the produced power for wind turbine 4, and corresponding
wind direction - Identified wind turbine noise for the period 2011.05.11-
2011.05.17.
Figure 5.7.: Polar diagram of the SPL at the immission point, and corresponding wind
direction - Identified wind turbine noise for the period 2011.05.11-2011.05.17
CHALMERS, Master’s Thesis 2013:112 22
Page 29
Figure 5.8.: Polar diagram of the wind direction for the period 2011.05.11-2011.05.17
23 CHALMERS, Master’s Thesis 2013:112
Page 30
6. Discussion
In this report we have developed a method to identify wind turbine noise from unattended
immission measurements. This has been done both based upon calculations but also
using frequency analysis of actual sound recordings. We will in this chapter discuss and
summarize the results in this report.
6.1. Why does the calculated and measured values not
correlate at the immission point?
It is clear that the spectrum at the immission point is not what could be expected when
considering the measured emission values from the turbines. That there is wind turbine
noise present is proved by the sound recordings. However, at this site, the frequency
spectrum shape substantially changes on a distance of 435 meters from the nearest
turbine - which can be compared to the 150 meters on which the emission levels was
measured. The predicted maximum sound pressure level from wind turbines - 40 dBA
- is also exceeded at such a great number of times, for recordings with clearly audible
wind turbine noise, that it can not be disregarded as just high influence of background
noise.
The fact that the long term measurement from May of 2011, see chapter 5, shows a
lot of ”hits” during a relatively short period of time, and that the long term measure-
ment from January of 2011, presented in Appendix A, shows quite few ”hits” during a
longer period of time implies that the meteorological conditions and propagation effects
such as ground impedance (snow cover) has a clear impact on the spectrum shape of
the wind turbine noise. As can be seen in section 5.2.4, both long term measurement
were performed during quite strong wind at roughly the same wind direction, residents
nearby have noted that wind turbine noise was present during both measurement, the
only known difference is the climate.
In this thesis emission measurements were conducted for each turbine in the wind farm.
In addition to this, the emission from turbine 4 was measured with turbine 1 active; i.e
two turbines measured as one (as can be seen in table 5.1).The combined measurement
shows a slightly higher sound power level from turbine 4 than what could be calculated
using SEPA:s model, with the contribution from turbine 1 set aside. The measurement
24
Page 31
shows 0,5 dB higher values than calculated, which is in the margin of error. However,
the calculation implies downwind conditions from both turbines, which is false.
This situation can, according to [Pro 05], cause a significant increase in sound emitted
from the turbines, compared to if they would be active in a more laminar environment.
The aspect of differences in air impedance and its impact on sound propagation of
wind turbine noise is not investigated in this thesis. It cannot be ruled out that this
may influence the sound propagation in this specific area. The investigated site do have
favourable conditions for large fluctuations in the air layers, with densely placed turbines
and hilly surroundings.
6.2. Is it reliable to measure the emission levels according
to standard and use them in a prediction method
such as SEPA:s?
By using actual emission measurement data for each turbine and incorporate it in a
calculation model as SEPA’s or Nord2000, one will be able to calculate a more reality
adapted situation for the nearby dwellings. Even though this procedure has its deficien-
cies, it is the authors opinion that this is more applicable in real life situations than the
often contaminated immission measurements at an investigated dwelling.
The uncertainty of a calculation model has to be taken into account for every calculation,
but by using real evaluated emission data of the turbines some of these uncertainties will
be eliminated.
The emission measurements performed during this thesis shows that even if the wind
turbines at the site have the same technical specifications, they differ in resulting sound
power levels and frequency spectrum. This depends upon both the evaluation of the
emission measurements but also the individual components of the turbines.
However, there is also a possibility that wind turbines cannot be modelled as omni-
directional point sources. A more complicated source model which can describe both
temporal, i.e. amplitude modulation, and directional effects of wind turbines in a more
realistic way, should also give more realistic results.
25 CHALMERS, Master’s Thesis 2013:112
Page 32
7. Conclusions
In this report we have developed a method to identify wind turbine noise from unat-
tended immission measurements. This has been done both based upon calculations but
also using frequency analysis of actual sound recordings, which have been subjectively
evaluated.
When planning and constructing wind farms, one should not completely rely upon the
model of SEPA - which models the turbines as omnidirectional point sources, unaffected
by i.e. atmospheric turbulence - and interpret the method as sound levels that would
result from an actual immission measurement.
This thesis concludes that the turbines have a different frequency spectrum at a near-field
(emission) point than at a far-field (immission) point. The reason for this is probably
a combination of the change in angle, distance and environment between source and re-
ceiver in near and far points. SEPA’s model for describing noise of wind farms is in those
terms not fully accurate. In sensitive areas where one could predict that the model itself
may be too kind in its predictions, such as over sea and wind sheltered areas - perhaps
the solution would be to be aware of the problem and strive to avoid it.
As of today, complaints regarding excessive noise from wind farms can be read about in
the newspapers. It is not always a problem, but it occurs from time to time, sometimes
somewhat unexplained. Due to this, together with the research in this report, one may
want to further investigate the area of prediction of wind farm noise.
Based on this report and research it is the authors opinion that the wind turbines in
the investigated farm are likely to be more affected by its surroundings than predicted
in the calculation models of today. This report is just a brief view and research of the
area and we encourage further research and development on the topic.
26
Page 33
References
[Bel 04] Bellhouse, G.: Low Frequency Noise and Infrasound from Wind Turbine Gen-
erators - A Literature Review, Energy Efficiency and Conservation Authority,
2004
[Ber 04] van den Berg, G.P.: Do wind turbines produce significant low frequency sound
levels?, 11th International Meeting on Low Frequency Noise and Vibration and
its Control, 2004
[Ber 71] Beranek L.L.: Noise and Vibration Control, McGraw Hill, 1971
[Bul 09] Bullmore, A. et al.: Noise predictions and Comparison with Measurements,
Third international meeting on Wind Turbine Noise, Aalborg, 2009
[Duc 06] Ducosson, I.: Wind turbine noise propagation over flat ground Thesis work, De-
partment of Applied Acoustics, Chalmers University of Technology, Goteborg,
2006
[Hub 82] Hubbard, H.H.: Noise Induced House Vibrations and Human Perception, Noise
Control Engineering Journal, vol 19/n:o 2, 1982
[Lju 98] Ljunggren, S.: Matning av bullerimmission fran vindkraftverk, Elforsk rapport
98:24, Energimyndigheten, KTH - Stockholm, 1998
[Nat 10] Naturvardsverket.: Ljud fran vindkraftverk, reviderad utgava av rapport 6241
, Naturvardsverket, Stockholm, 2010
[Pro 05] Prospathopoulus, J.M. & Voutsinas, S.G.: Noise Propagation Issues in Wind
Energy Applications, Journal of Solar energy Engineering, vol 127, 2005
[Sal 01] Salomons, E.M.: Computational atmospheric acoustics, Kluwer academic pub-
lishers, 2001
[Ver 03] Vermeer L.J. et al.: Wind turbine wake aerodynamics, Progress in Aerospace
Sciences, vol 39, 2003
[Wag 96] Wagner, S. et al.: Wind Turbine Noise,Springer-Verlag Berlin Heidelberg, 1996
27
Page 34
A. Appendix
Long term measurements were also executed for a period of three weeks during January
2011. Since measurements on wind turbines are not considered valid when there is snow
present on the ground, the data gathered from this was mainly aimed to be used as aid
in building the prediction models.
The figures A.1, A.2, A.3 and A.4 each represent the same plots as described in sec-
tion 5.2.4 but for the period of 2011.01.09 - 2011.01.17.
Another measurement was also performed during the late of May 2011, these mea-
Figure A.1.: Histogram for the period of 2011.01.09 - 2011.01.17, using the new reference
curve
surements were supposed to be registered by a sound recorder as described in chapter 3,
but due to excessive sound levels and ”cutting” in the recordings, they were considered
impossible to grade.
The figures A.1, A.2, A.3 and A.4 each represent the same plots as described in 5.2.4
but for the period of 2011.05.23 - 2011.05.25.
28
Page 35
Figure A.2.: Polar diagram of the produced power for wind turbine 4, and corresponding
wind direction - Identified wind turbine noise for the period 2011.01.09-
2011.01.17
29 CHALMERS, Master’s Thesis 2013:112
Page 36
Figure A.3.: Polar diagram of the SPL at the immission point, and corresponding wind
direction - Identified wind turbine noise for the period 2011.05.11-2011.05.17
Figure A.4.: Polar diagram of the wind direction for the period 2011.01.09-2011.01.17
CHALMERS, Master’s Thesis 2013:112 30
Page 37
Figure A.5.: Histogram for the period of 2011.05.23 - 2011.05.25, using the new reference
curve
Figure A.6.: Polar diagram of the produced power for wind turbine 4, and corresponding
wind direction - Identified wind turbine noise for the period 2011.05.23 -
2011.05.25
31 CHALMERS, Master’s Thesis 2013:112
Page 38
Figure A.7.: Polar diagram of the SPL at the immission point, and corresponding
wind direction - Identified wind turbine noise for the period 2011.05.23
- 2011.05.25
Figure A.8.: Polar diagram of the wind direction for the period 2011.05.23 - 2011.05.25
CHALMERS, Master’s Thesis 2013:112 32