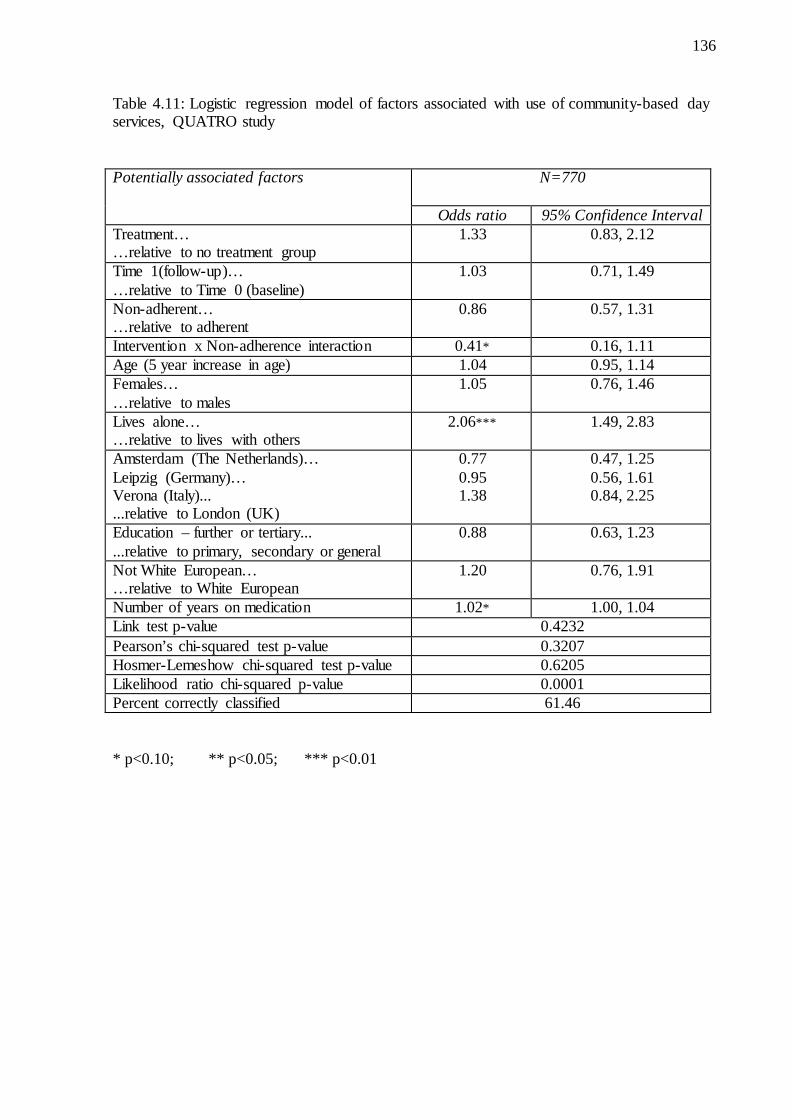
Non-adherence to medication in schizophrenia: The impact on service use and costs Derek King A thesis submitted to the Department of Social Policy of the London School of Economics and Political Science for the degree of Doctor of Philosophy, London, May 2010
Transcript
Non-adherence to medication in schizophrenia: The impact on service use
and costs
Derek King
A thesis submitted to the Department of Social Policy of the London School of
Economics and Political Science for the degree of Doctor of Philosophy, London, May 2010
2
Declaration of Authorship I certify that the thesis I have presented for examination for the PhD degree of the London School of Economics and Political Science is solely my own work other than where I have clearly indicated that it is the work of others (in which case the extent of any work carried out jointly by me and any other person is clearly identified in it). The copyright of this thesis rests with the author. Quotation from it is permitted, provided that full acknowledgement is made. This thesis may not be reproduced without the prior written consent of the author. I warrant that this authorisation does not, to the best of my belief, infringe the rights of any third party.
3
Acknowledgements I would firstly like to thank my supervisor, Professor Martin Knapp for his guidance, patience and support over what was a long journey. Your uncanny ability to know, unfailingly, when encouragement was needed to quell my self doubt or rather when a stern word was required to shake me out of complacency and procrastination was instrumental in completing this thesis. I am also extremely grateful to Dr José-Luis Fernandez and Dr Jouni Kuha for their statistical advice and to Mr Paul Thomson, Ms Anji Mehta and Ms Cate Henderson for reading and providing valuable comments on the thesis. The analysis in chapter 3 was completed as part of a project funded by Bristol-Myers Squibb with collaboration between myself, Professor Martin Knapp and colleagues at BMS, Dr Klaus Pugner and Dr Pablo Lapuerta. My analysis benefitted from discussions we had as a group. I am also thankful for the encouragement from several friends, some of whom have travelled this road themselves. In sharing your experiences you made the enormity of the task seem less burdensome. Most of all I would like to thank my parents, the late Mrs Pauline King and Dr Clarence King. Your guidance, love, encouragement and support mean the world to me and making you proud has always been my greatest motivation.
4
Abstract
Schizophrenia is a chronic illness which has severe consequences for the lives of patients and
their families. The costs associated with treating individuals with schizophrenia are
considerable. This thesis examined the relationship between non-adherence to medication,
patient-, environmental- and medication-related factors and the costs associated with health
and social care services used and the wider societal costs in treating individuals with
schizophrenia. Analysis was undertaken of data from the 1993-4 and 2000 Psychiatric
Morbidity Surveys and the Quality of Life following Adherence Therapy for People Disabled
by Schizophrenia and their Carers study.
An individual’s level of education, having had a recent inpatient stay and alcohol abuse were
found to be associated with a greater likelihood of non-adherence in individuals taking
antipsychotics. These results were not observed in analyses of individuals taking
antidepressants. Common factors associated with non-adherence across individuals taking
antipsychotics and antidepressants included experiencing side-effects and severity of illness.
Community-based services were found to be used more by individuals with interruptions in
their antipsychotic medication. In this group there may also be additional costs in
hospitalisations and overall health and social care services attributable to non-adherence.
Benefits to patients may be accrued by enabling health and social care professionals,
particularly those working in the community, to encourage medication adherence in
individuals with schizophrenia and to provide information on new interventions that are cost-
effective in improving adherence.
National Institute of Clinical Excellence (NICE) guidelines for treating individuals with
schizophrenia, revised in 2009, address some key findings in my analyses, such as
emphasising the role of carers and family members in successful management of the illness,
the potentially adverse impact that illicit drug use can have on therapeutic effects and issues
around service provision to individuals from ethnic minorities.
Further analysis of data from long-term studies is required to determine the clinical, economic
and personal consequences of non-adherence.
5
Table of contents List of tables ............................................................................................................................... 8 List of figures............................................................................................................................ 10 Chapter 1. Introduction ............................................................................................................. 11
1.1 Overview......................................................................................................................... 12 1.2 Schizophrenia – prevalence and quality of life............................................................... 13 1.3 The cost of schizophrenia ............................................................................................... 15 1.4 Adherence ....................................................................................................................... 17
1.4.1 Definition and context ............................................................................................. 17 1.4.2 Theoretical models................................................................................................... 18 1.4.3 Prevalence of non-adherence in schizophrenia........................................................ 23
1.5 Factors associated with non-adherence .......................................................................... 25 1.5.1 Heterogeneity of methods ........................................................................................ 26 1.5.2 Summary of findings ............................................................................................... 27
1.6 The economic impact of non-adherence ......................................................................... 31 1.7 Policy relevance of the analysis...................................................................................... 33 1.8 Hypotheses and research questions ................................................................................ 34 1.9 Thesis structure ............................................................................................................... 35
Chapter 2. Methods and data .................................................................................................... 37
2.6.1 The Psychiatric Morbidity Surveys, 1993-4 ............................................................ 46 2.6.2 The QUATRO Study ............................................................................................... 48 2.6.3 The Psychiatric Morbidity Survey, 2000 ................................................................. 50
2.8 Summary ......................................................................................................................... 66 Chapter 3. Patterns of non-adherence with antipsychotic medication and the impact of non-adherence on costs – analyses of the 1993/4 Psychiatric Morbidity Surveys .......................... 68
3.3.3 Day activity services ................................................................................................ 89 3.3.4 Total health and social care costs ............................................................................ 93 3.3.5 Secondary analysis................................................................................................... 97
3.4 Discussion ....................................................................................................................... 99 3.4.1 Factors associated with non-adherence ................................................................... 99 3.4.2 The association between non-adherence and resource use and costs .................... 102 3.4.3 Other factors associated with resource use and costs ............................................ 103 3.4.4 Limitations ............................................................................................................. 105
3.5 Summary ....................................................................................................................... 108 Chapter 4. The impact of non-adherence to medication in patients with Schizophrenia on health, social care and societal costs – analysis of the QUATRO study ................................ 109
4.1 Background and aims ................................................................................................... 109 4.2. Methods ....................................................................................................................... 111
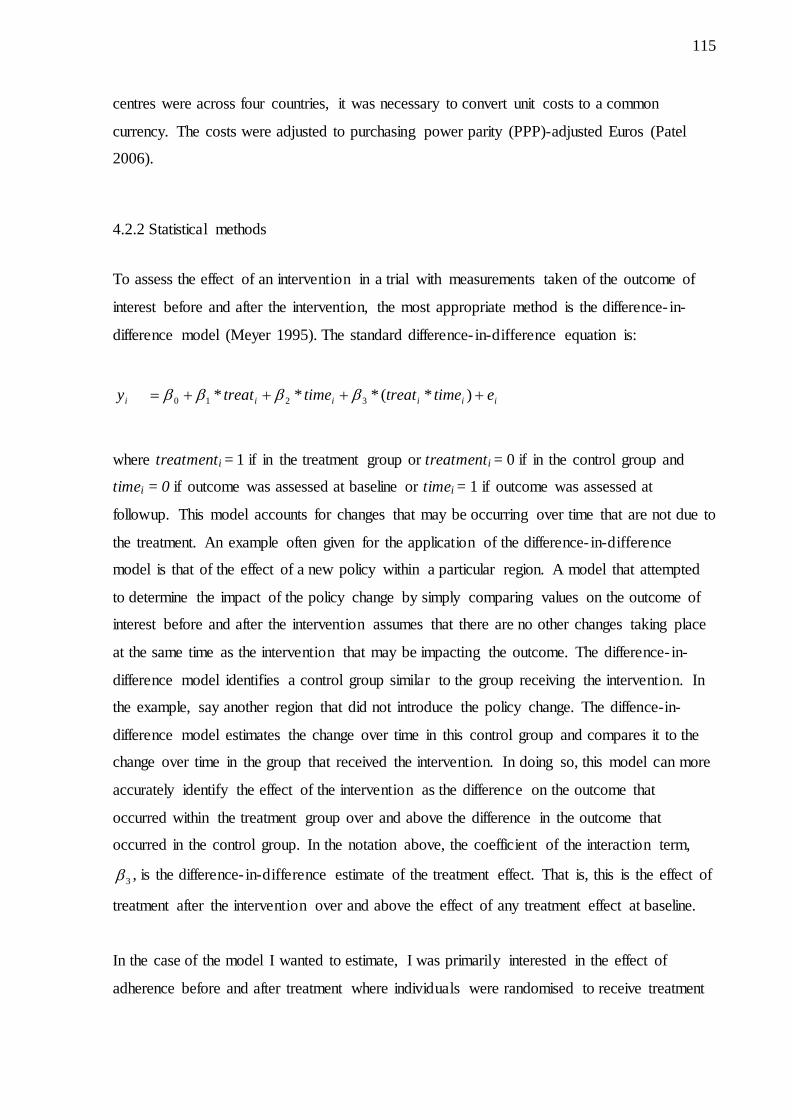
4.2.1 The QUATRO study .............................................................................................. 111 4.2.2 Statistical methods ................................................................................................. 115
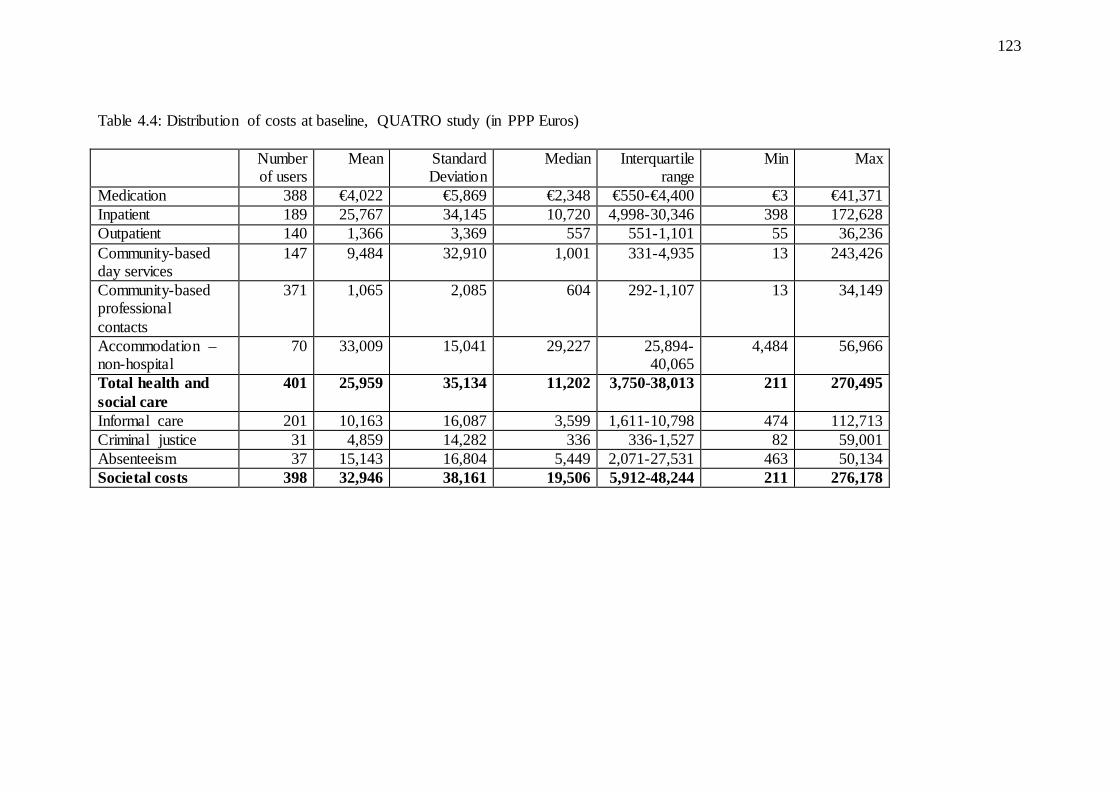
4.3. Results.......................................................................................................................... 119 4.3.1 Demographics ........................................................................................................ 119 4.3.2 Distribution of costs............................................................................................... 122 4.3.3 Health and Social Care costs ................................................................................. 124 4.3.4 Societal costs ......................................................................................................... 128 4.3.5 Component costs.................................................................................................... 131 4.3.6 Sensitivity analyses................................................................................................ 144
4.5 Summary ....................................................................................................................... 153 Chapter 5. Associations between medication non-adherence and resource use and costs for people taking medication for depression – analysis of the Psychiatric Morbidity Survey 2000 ................................................................................................................................................ 155
5.2.1 The Psychiatric Morbidity Survey 2000 sample ................................................... 157 5.2.2 Variable definitions ............................................................................................... 158 5.2.3 Costing service use, benefits and absenteeism ...................................................... 160 5.2.4 Statistical analyses ................................................................................................. 162
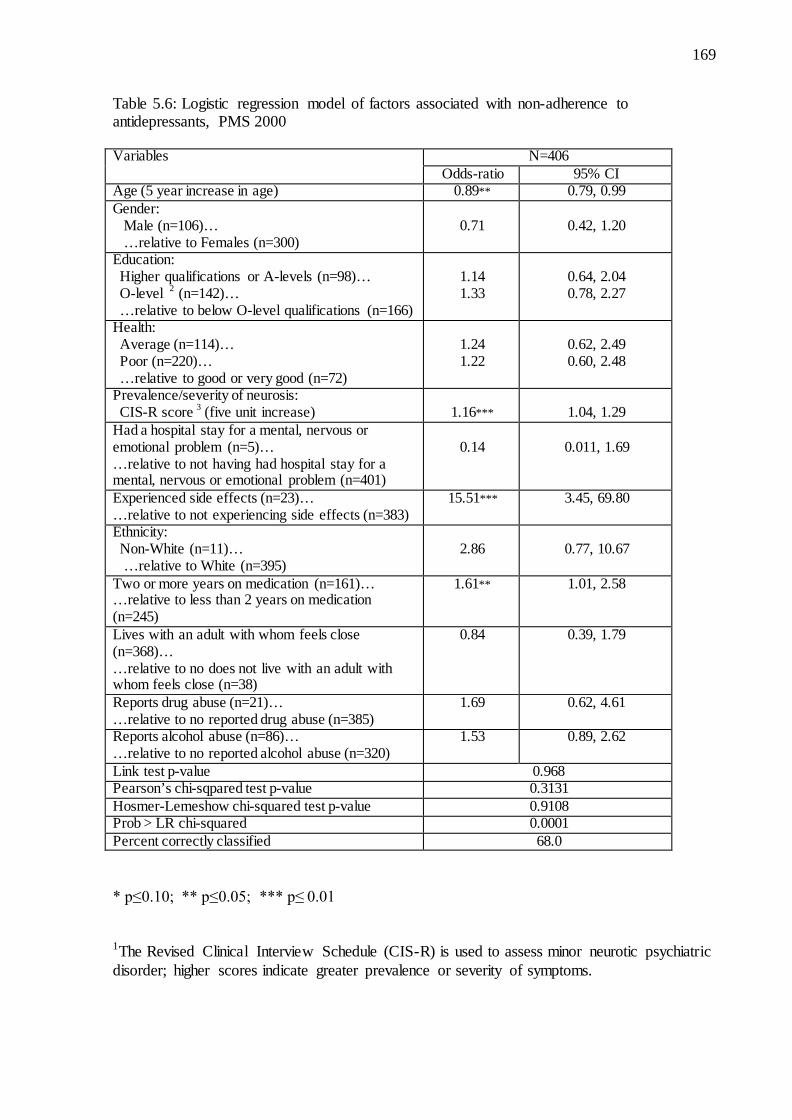
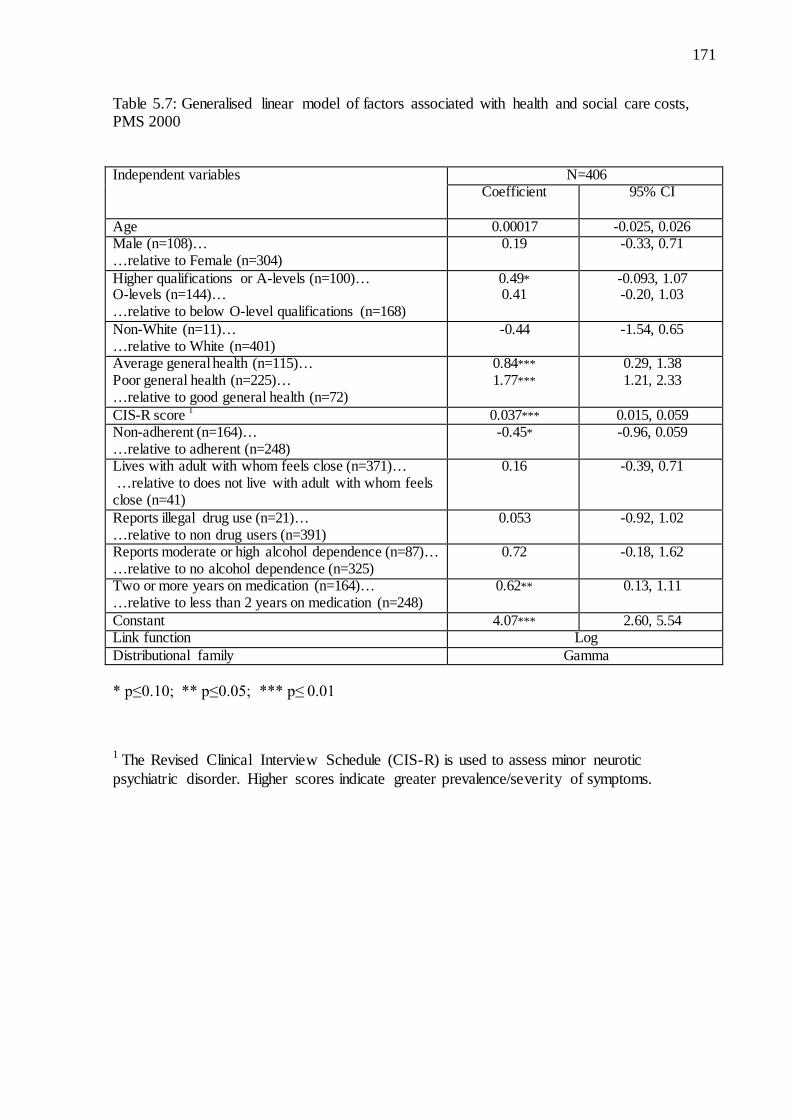
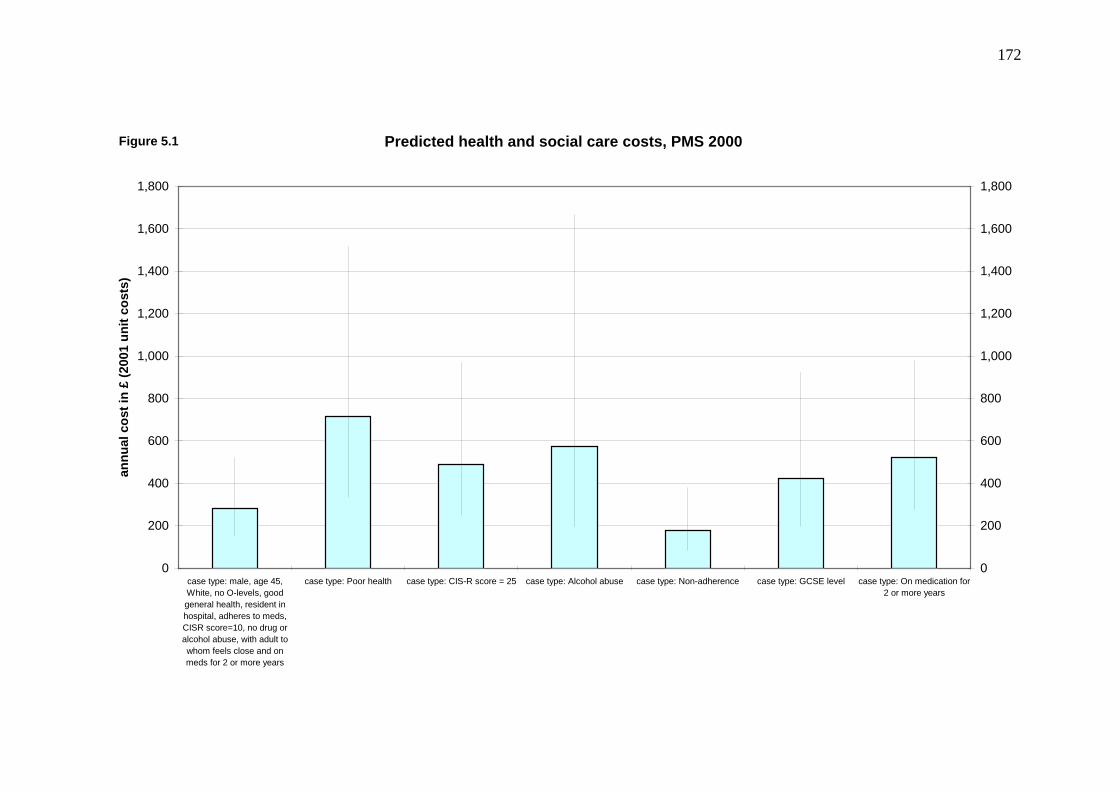
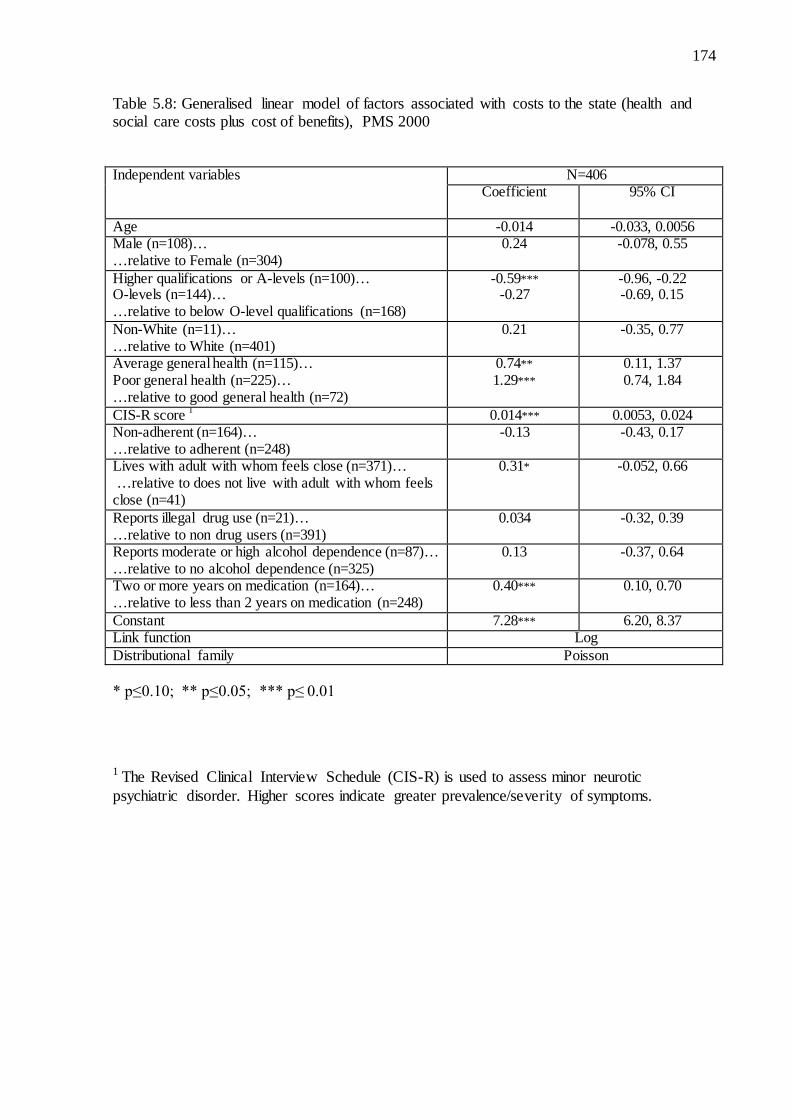
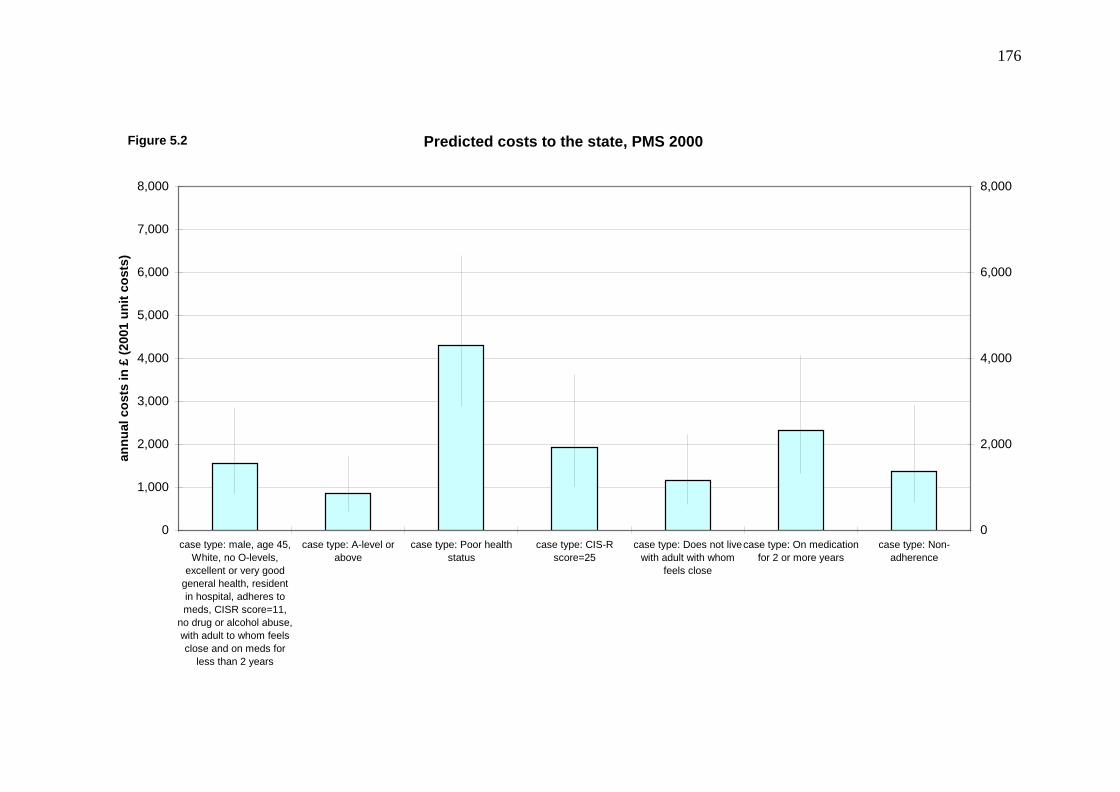
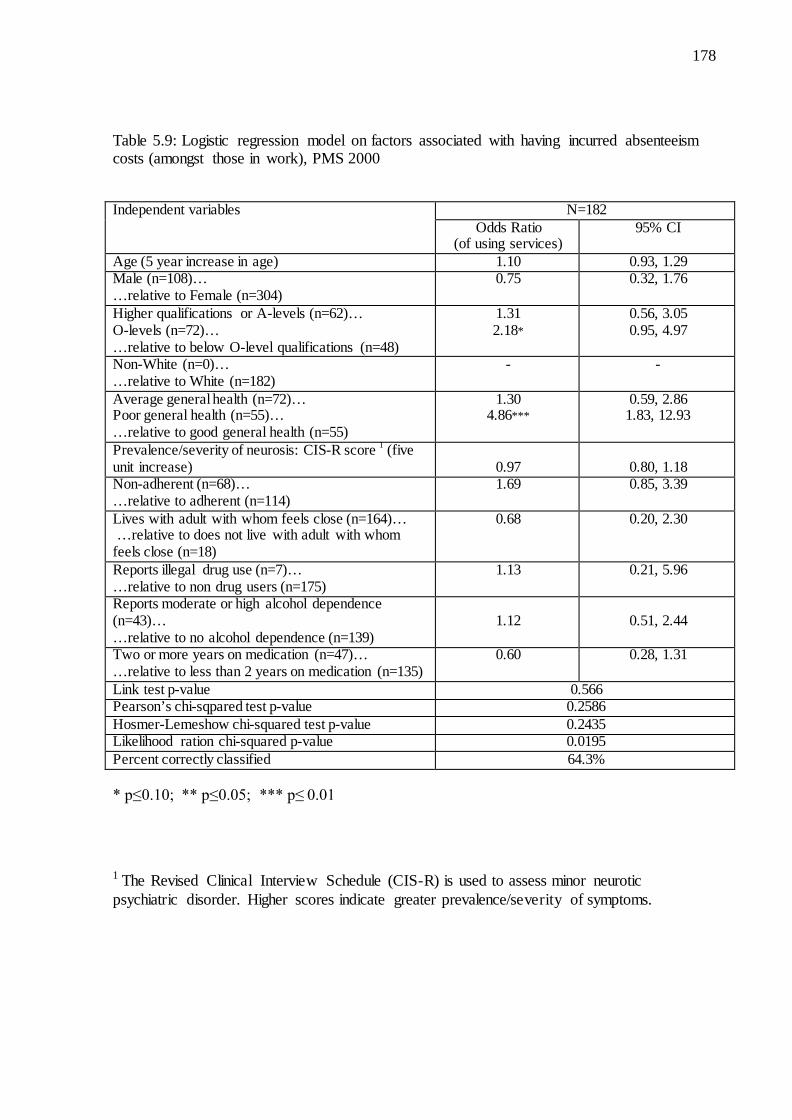
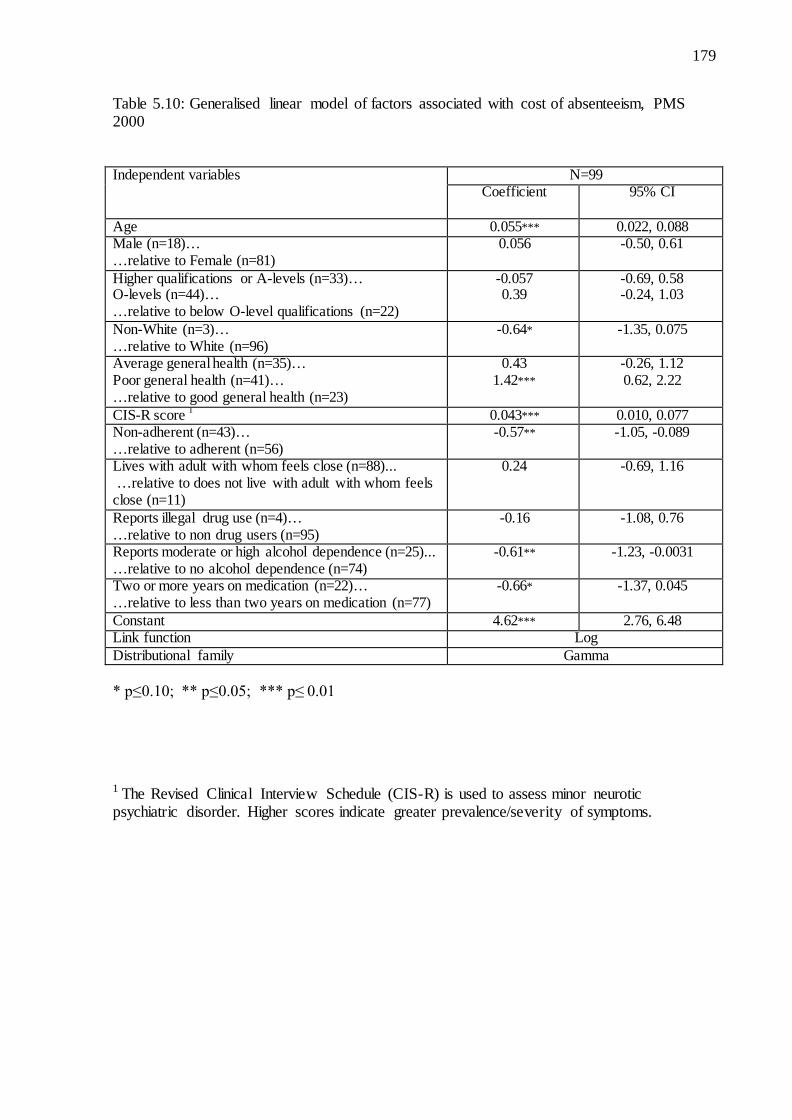
5.3 Results........................................................................................................................... 163 5.3.1 Factors associated with non-adherence to antidepressants .................................... 168 5.3.2 Health and Social Care costs ................................................................................. 170 5.3.3 Costs to the state .................................................................................................... 173 5.3.4 Cost of absenteeism ............................................................................................... 177
5.4 Discussion ..................................................................................................................... 182 5.4.1 Rate of non-adherence in individuals taking antidepressants ................................ 182 5.4.2 Factors associated with non-adherence ................................................................. 184 5.4.3 Association between non-adherence and service use and costs ............................ 186 5.4.4 Other factors associated with service use and costs .............................................. 188 5.4.5 Limitations ............................................................................................................. 188
Chapter 6. Discussion and Conclusions.................................................................................. 192 6.1 Discussion of findings .................................................................................................. 192
6.1.1 Factors associated with non-adherence ................................................................. 192 6.1.2 The association between non-adherence and service use costs ............................. 197 6.1.3 Other factors associated with service use and costs in patients taking antipsychotics ........................................................................................................................................ 199
6.3.1 Implications for patients ........................................................................................ 202 6.3.2 Implications for the health care system ................................................................. 203 6.3.3 Implications for research ....................................................................................... 205
List of tables Table 1.1: Factors associated with non-adherence – Reviews identified in literature
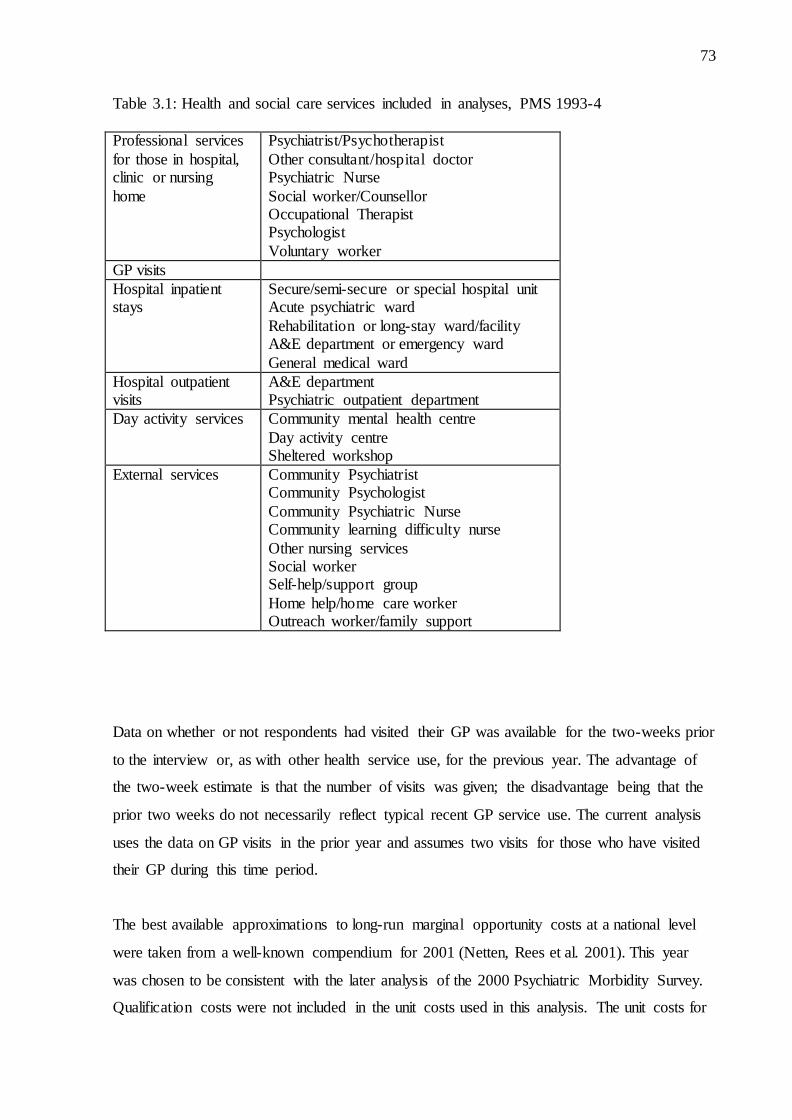
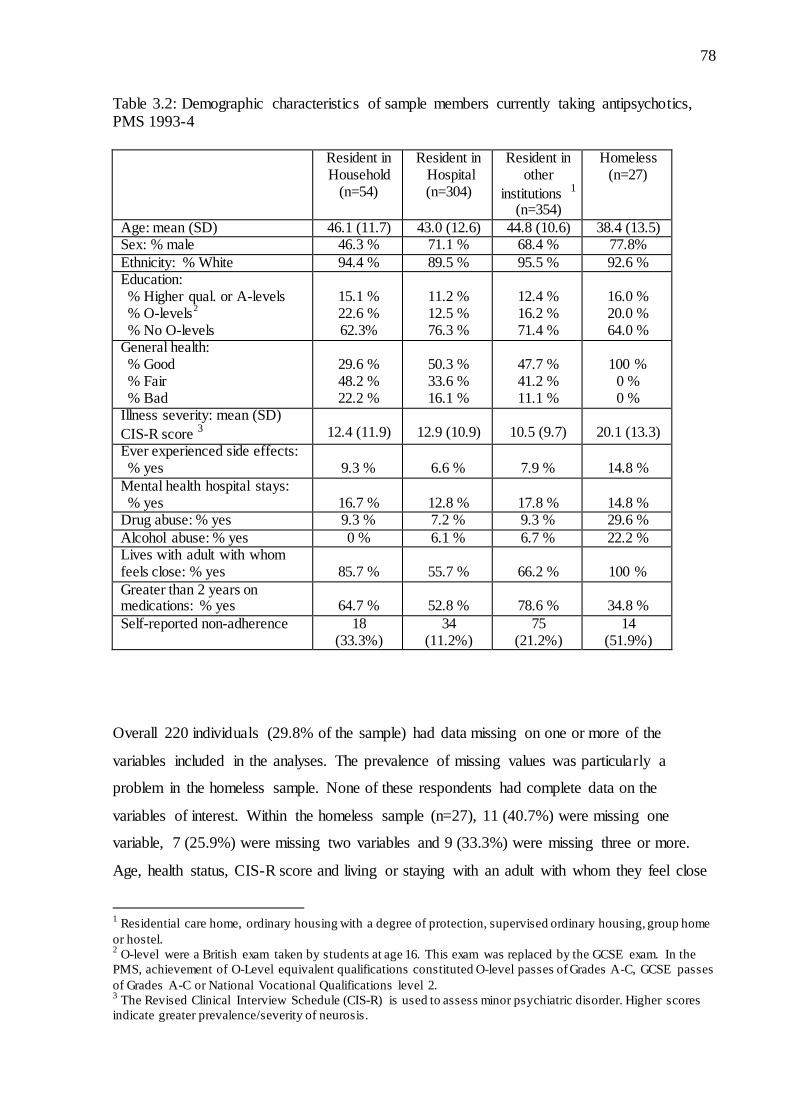
search…………………………………………………………………………….....29 Table 2.1: Relative efficiencies for multiple imputation estimates based on the rate of missingness, γ , and number of imputations, m……….………………………………………...62 Table 3.1: Health and social care services included in analyses, PMS 1993-4……….…........73 Table 3.2: Demographic characteristics of sample members currently taking
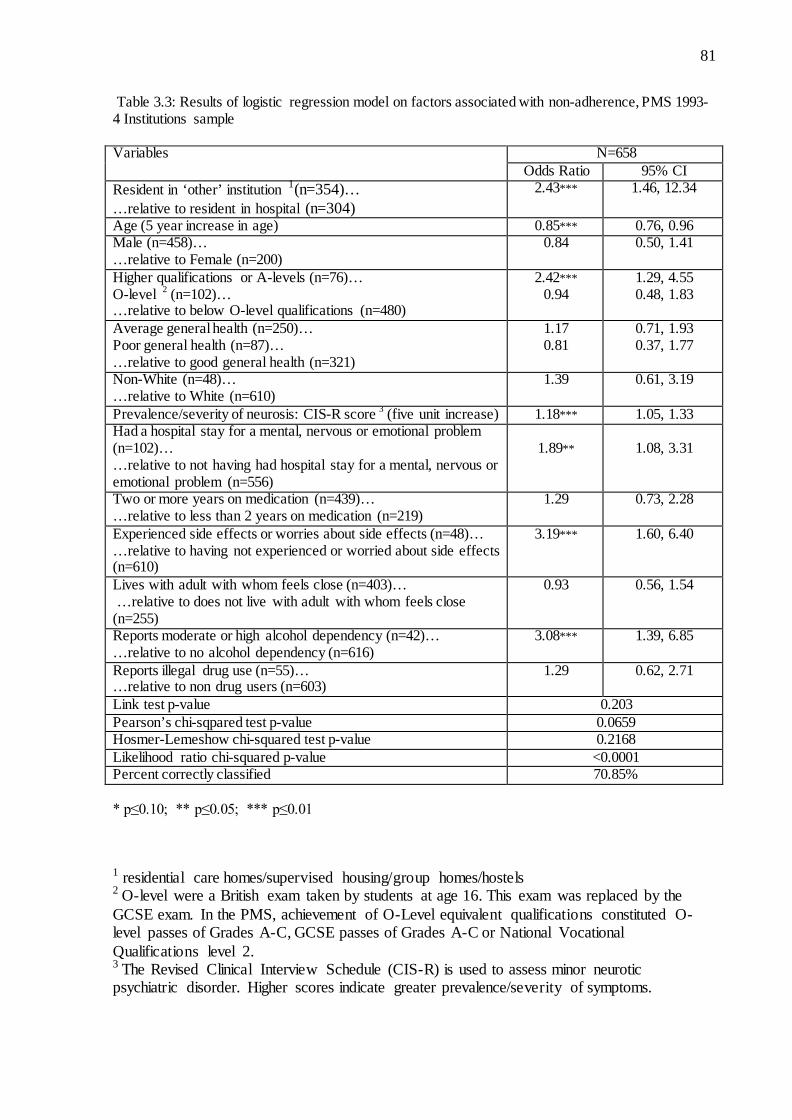
antipsychotics, PMS 1993-4……….…………………………………………….....78 Table 3.3: Logistic regression model on factors associated with non-adherence,
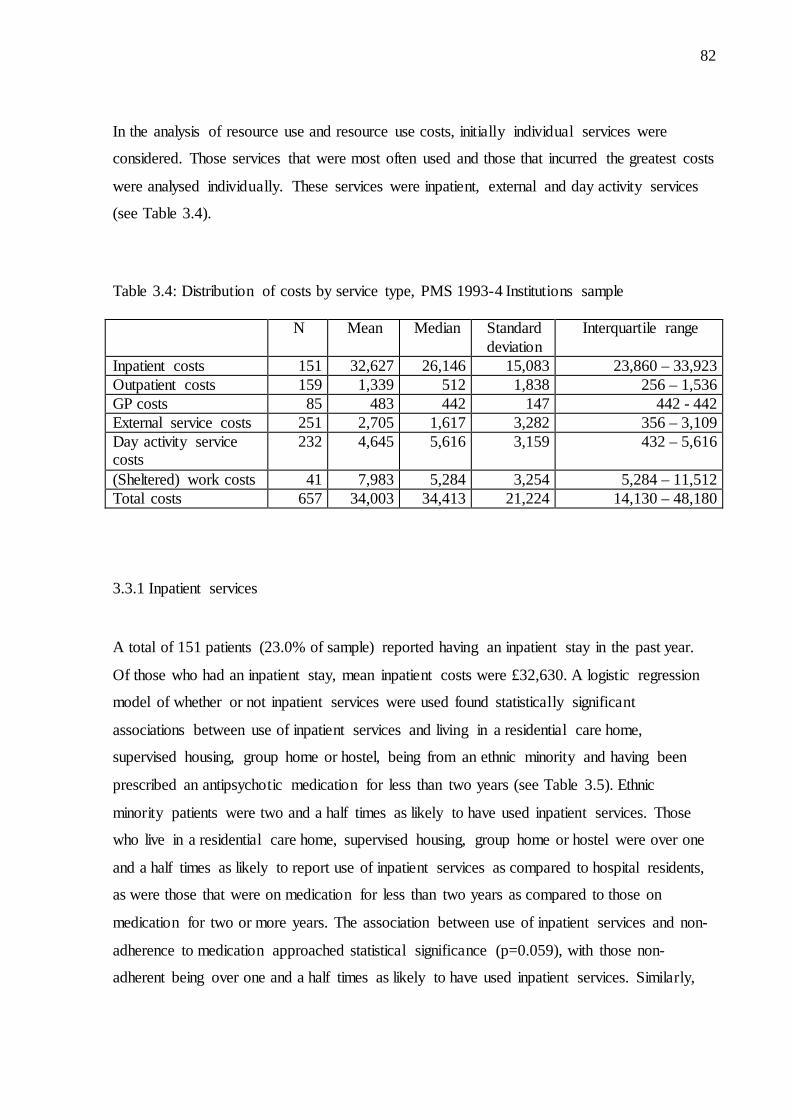
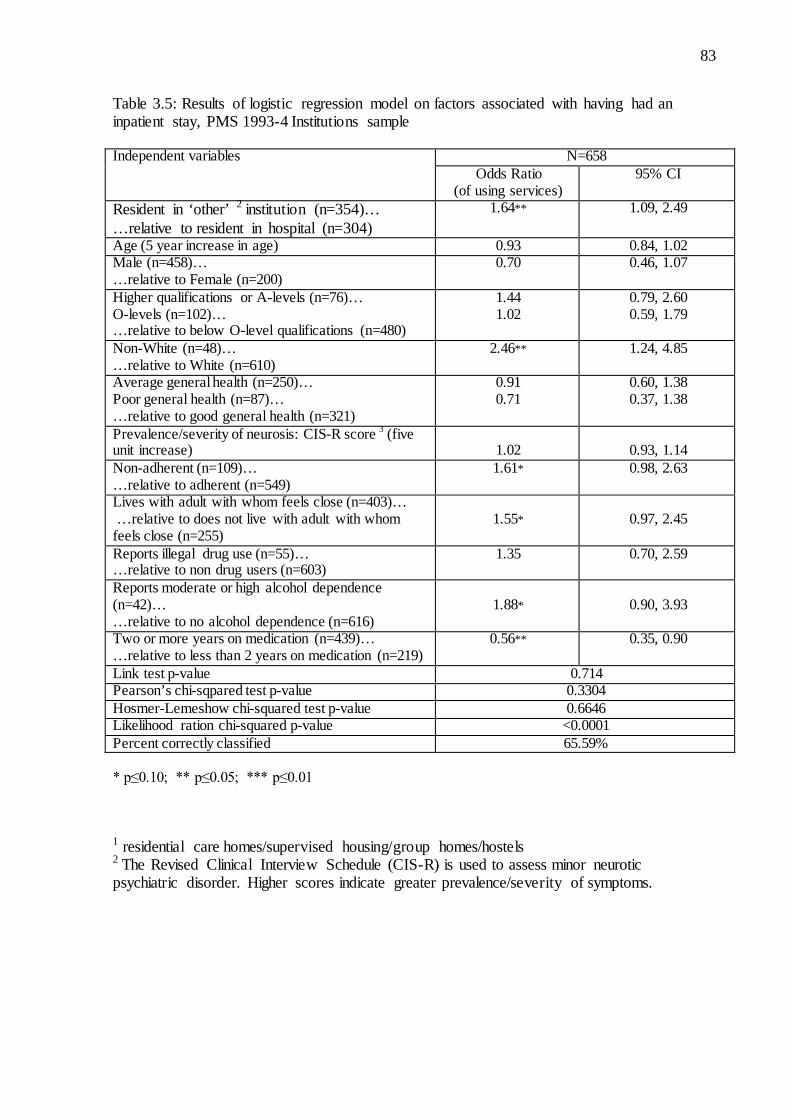
PMS 1993-4 Institutions sample……………………………………………………81 Table 3.4: Distribution of costs by service type, PMS 1993-4 Institutions sample……………82 Table 3.5: Logistic regression model on factors associated with having had an
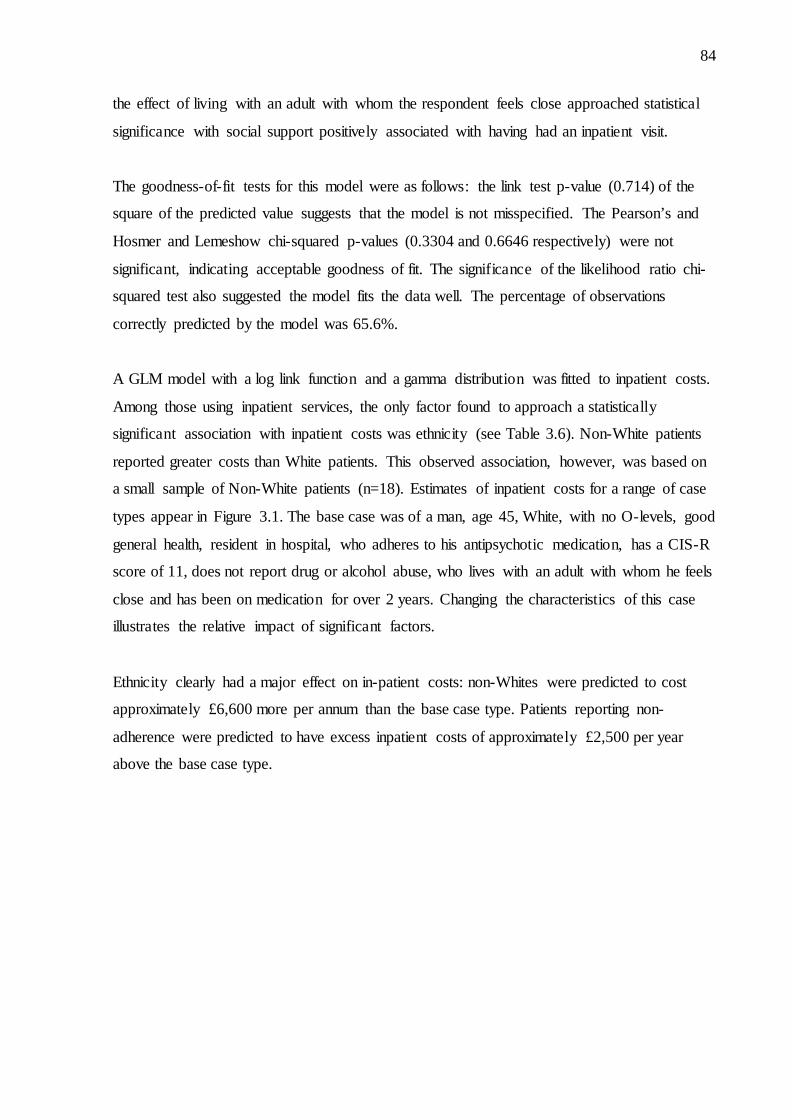
inpatient stay, PMS 1993-4 Institutions sample…………………………………….83 Table 3.6: Generalised linear model on factors associated with inpatient costs,
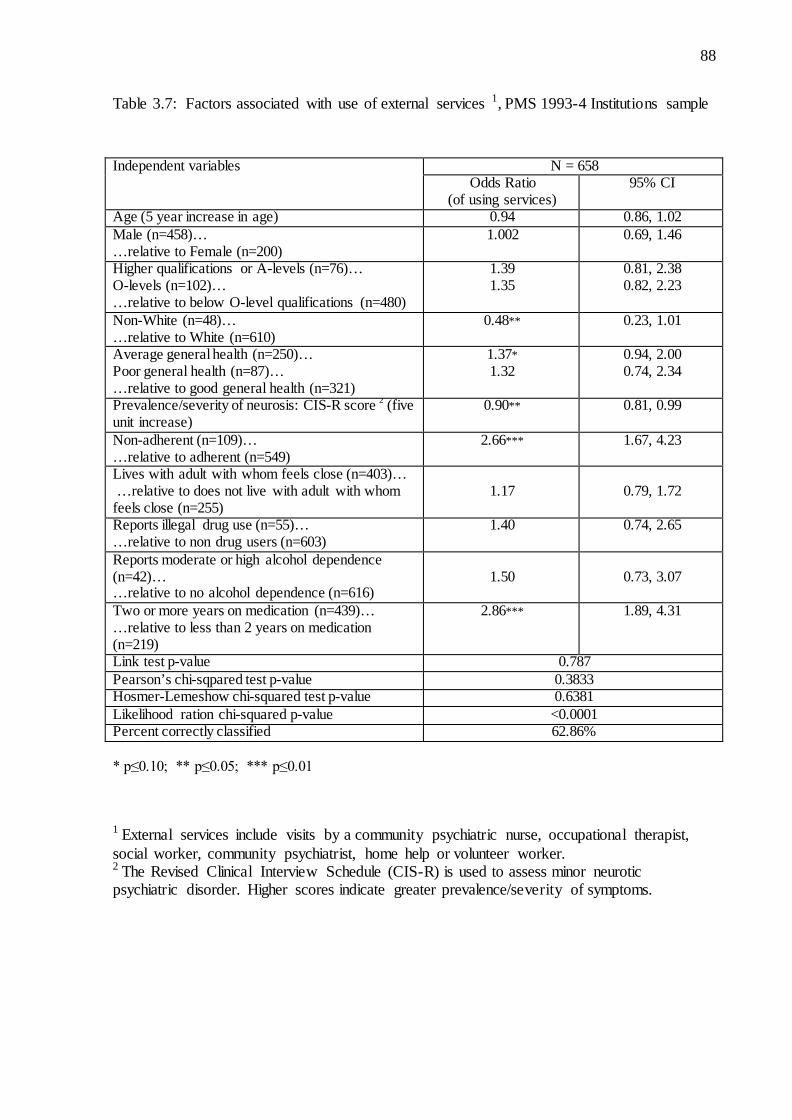
PMS 1993-4 Institutions sample……………………………………………………85 Table 3.7: Factors associated with use of external services, PMS 1993-4
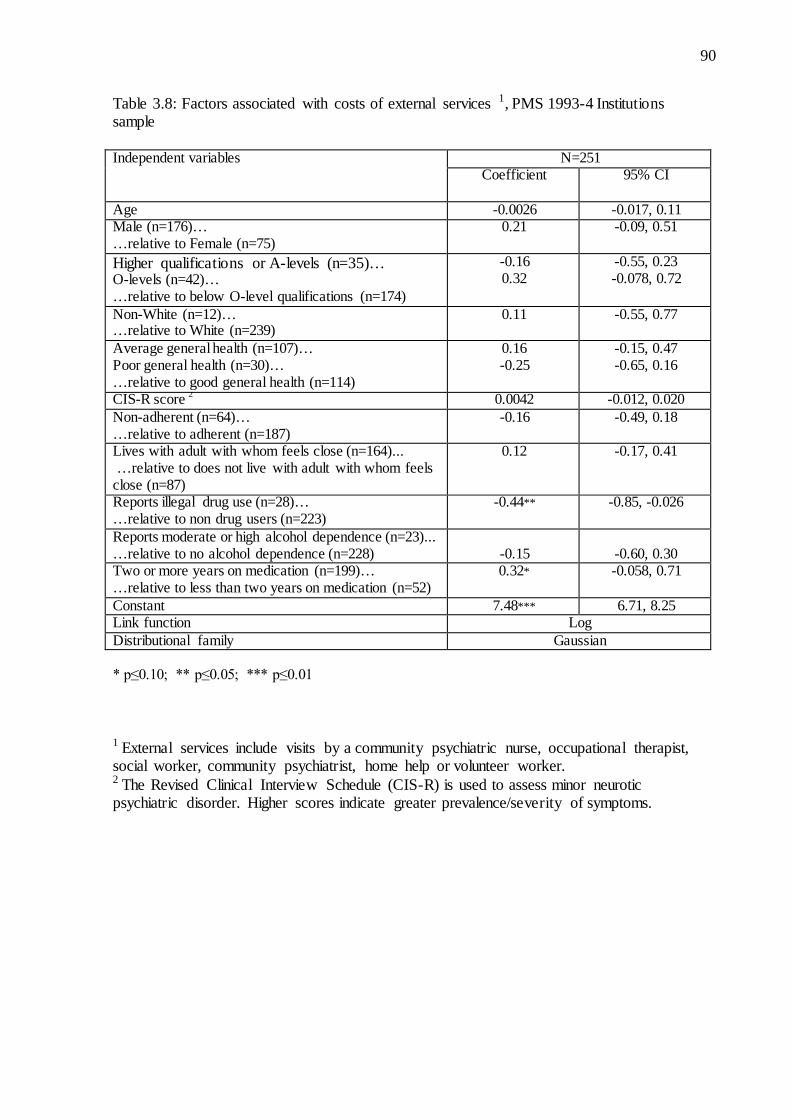
Institutions sample ………………………………………………………………….88 Table 3.8: Factors associated with costs of external services, PMS 1993-4
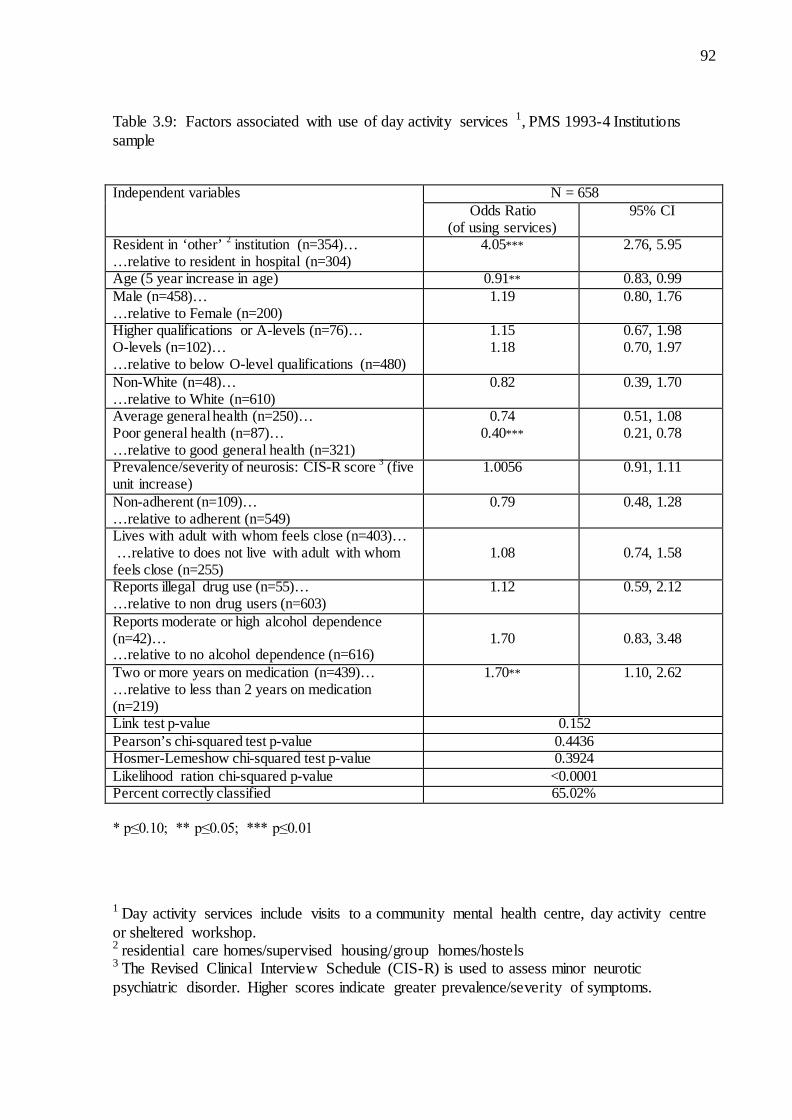
Institutions sample……………………………………………………………...…...90 Table 3.9: Factors associated with use of day activity services, PMS 1993-4
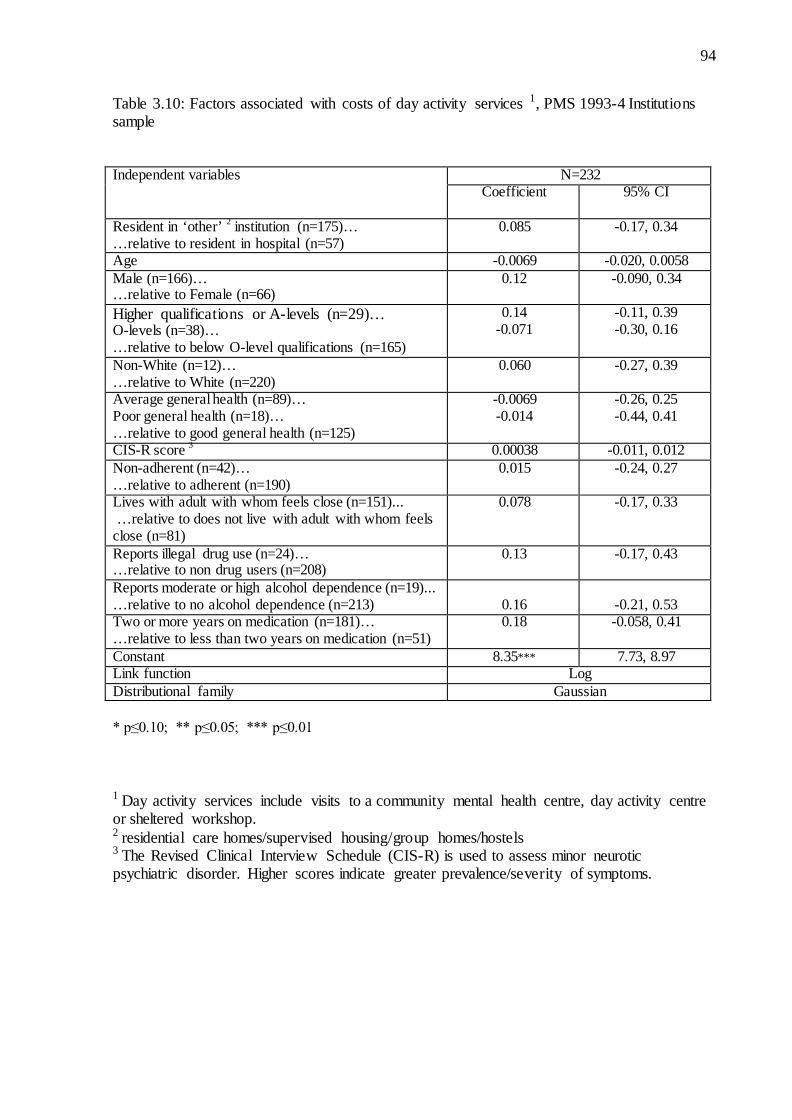
Institutions sample……………………………………………………………….....92 Table 3.10: Factors associated with costs of day activity services, PMS 1993-4
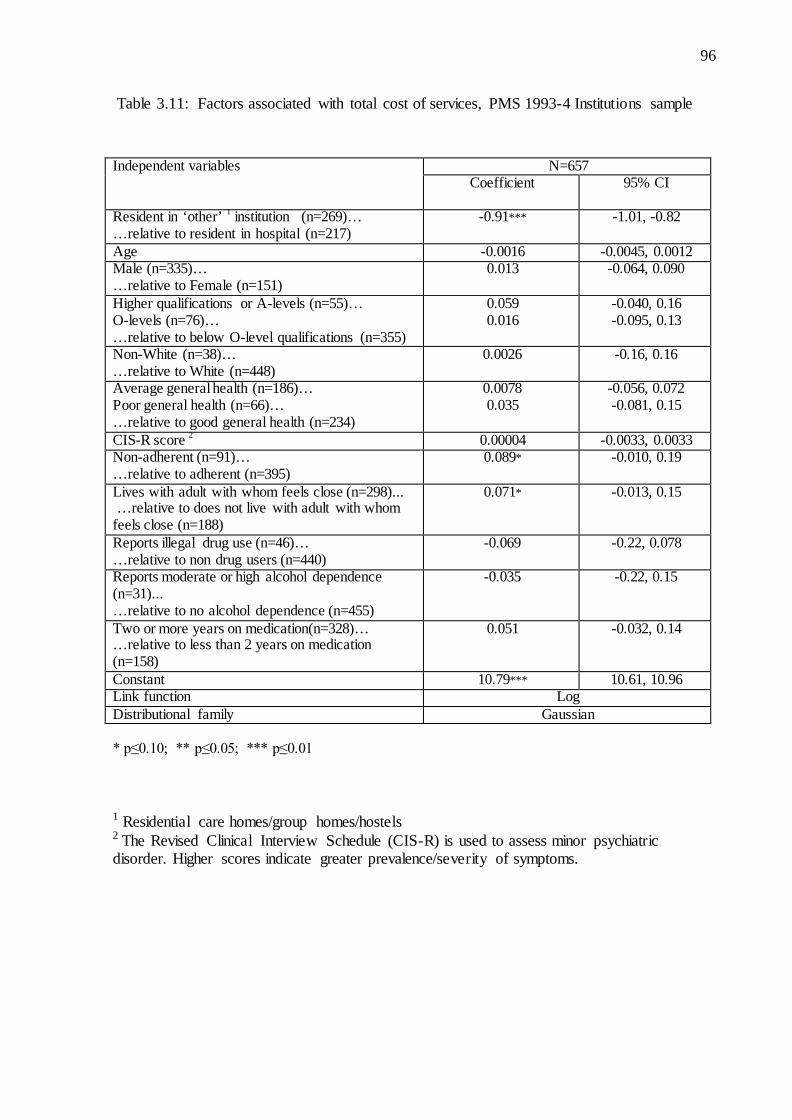
Institutions sample…………………………………………………………………94 Table 3.11: Factors associated with total cost of health and social care services,
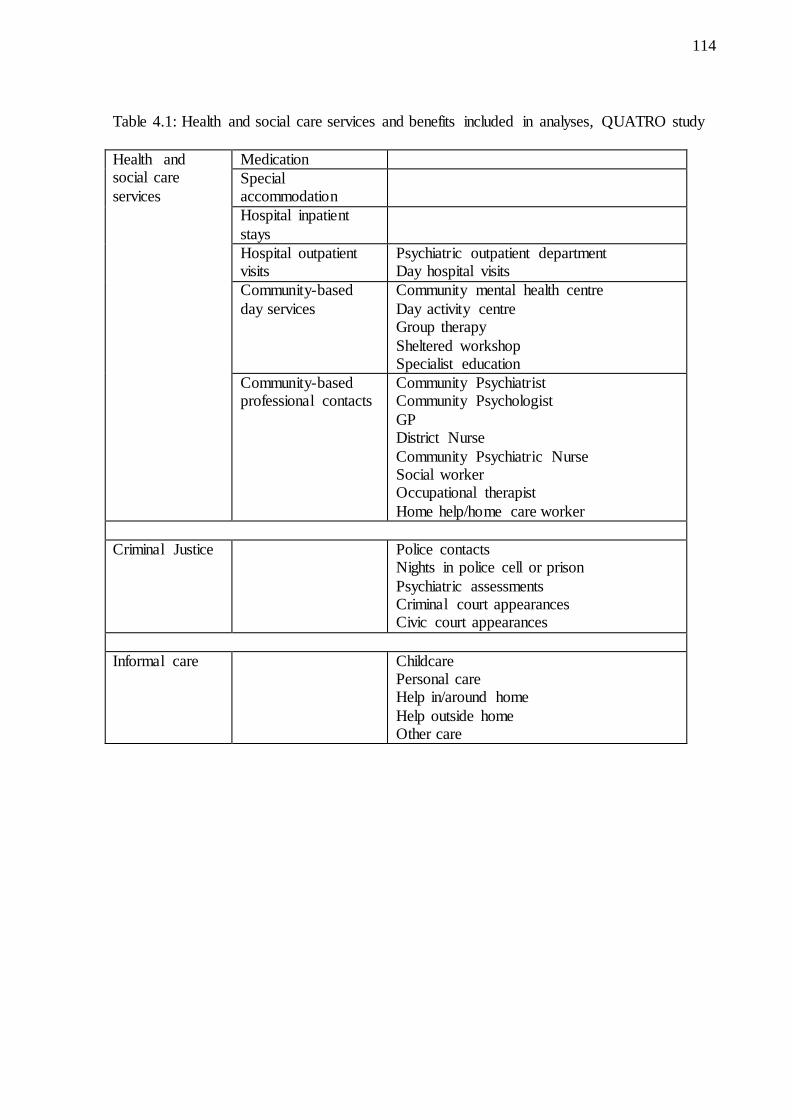
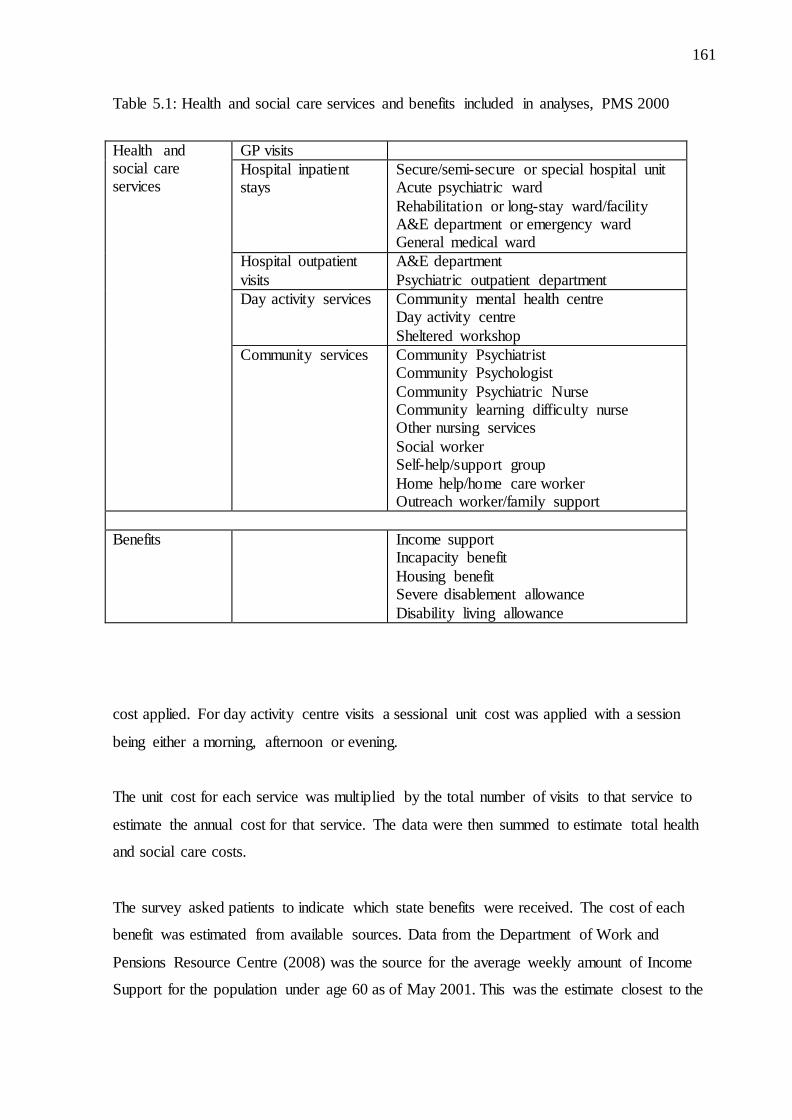
PMS 1993-4 Institutions sample………………………………………………......96 Table 4.1: Health and social care services and benefits included in analyses,
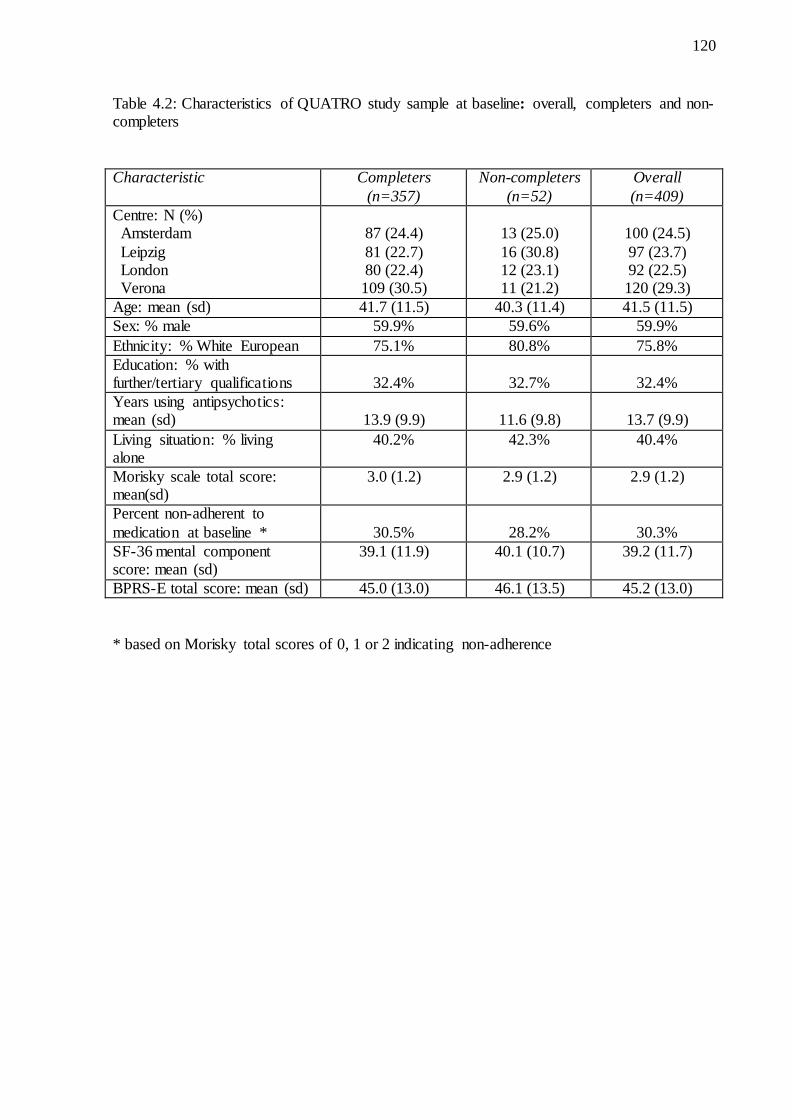
QUATRO study……………………………………………………………………114 Table 4.2: Characteristics of QUATRO study sample at baseline: overall,
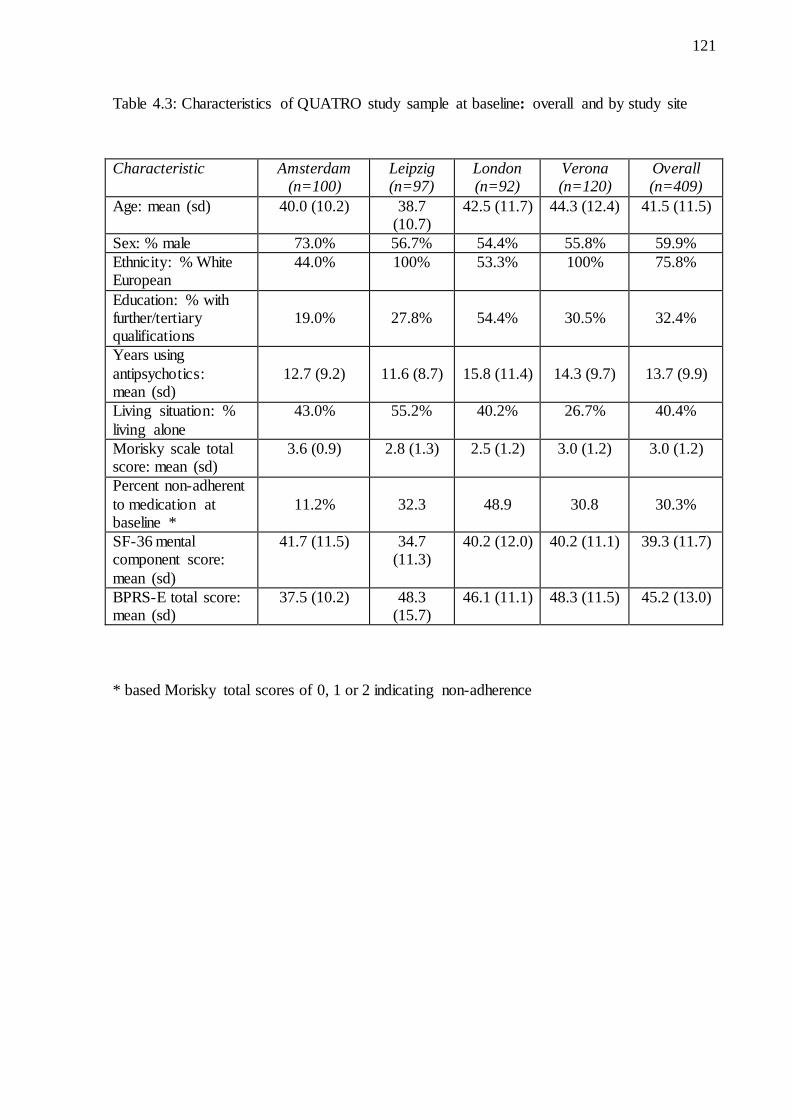
completers and non-completers……………………………………………………120 Table 4.3: Characteristics of QUATRO study sample at baseline: overall
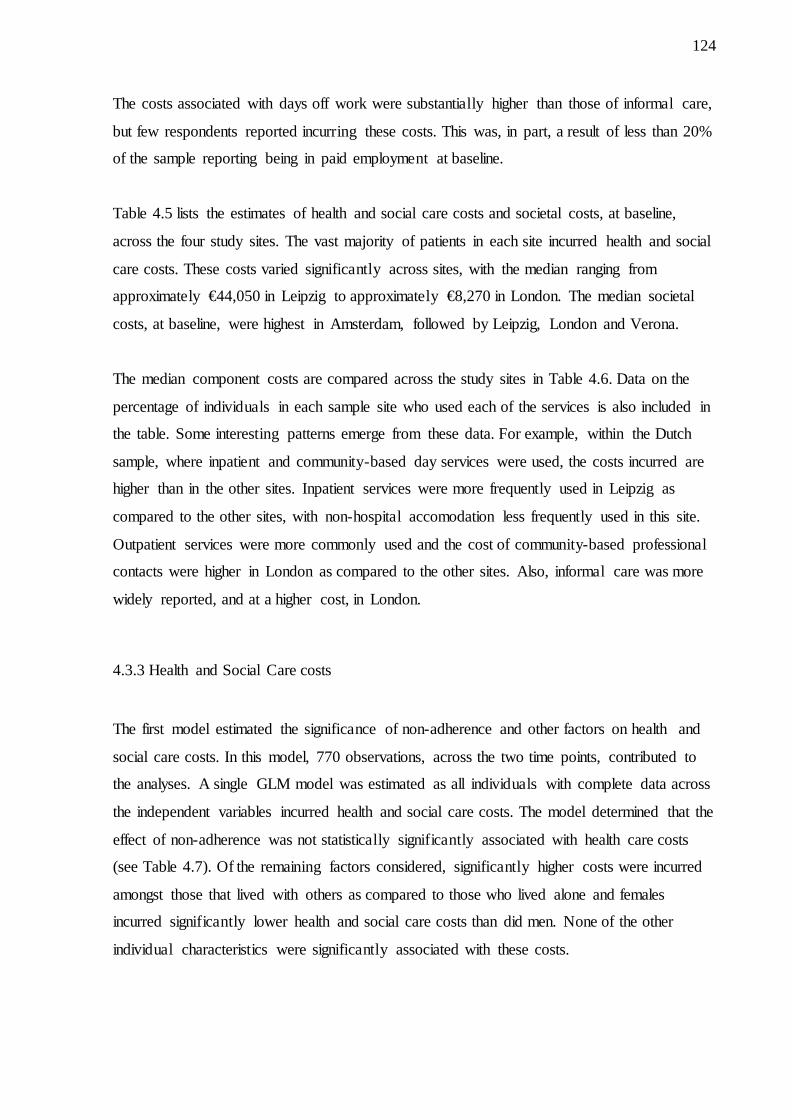
and by study site………………………………………………………………......121 Table 4.4: Distribution of costs at baseline, QUATRO study (in PPP Euros)…………….....123 Table 4.5: Distribution of baseline (i) health and social care and (ii) societal costs in QUATRO
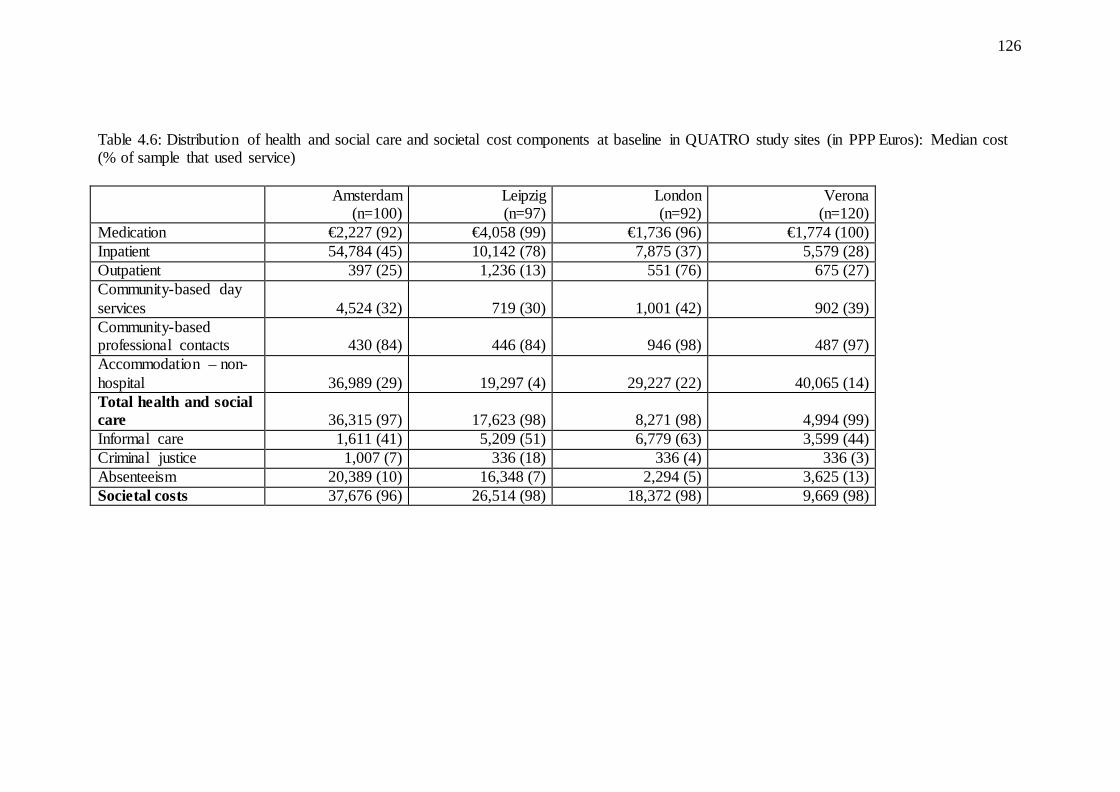
study sites (in PPP Euros)…………………………………………………………125 Table 4.6: Distribution of health and social care and societal cost components
at baseline in QUATRO study sites (in PPP Euros): Median cost (% of sample that used service)……………………………………………….......126
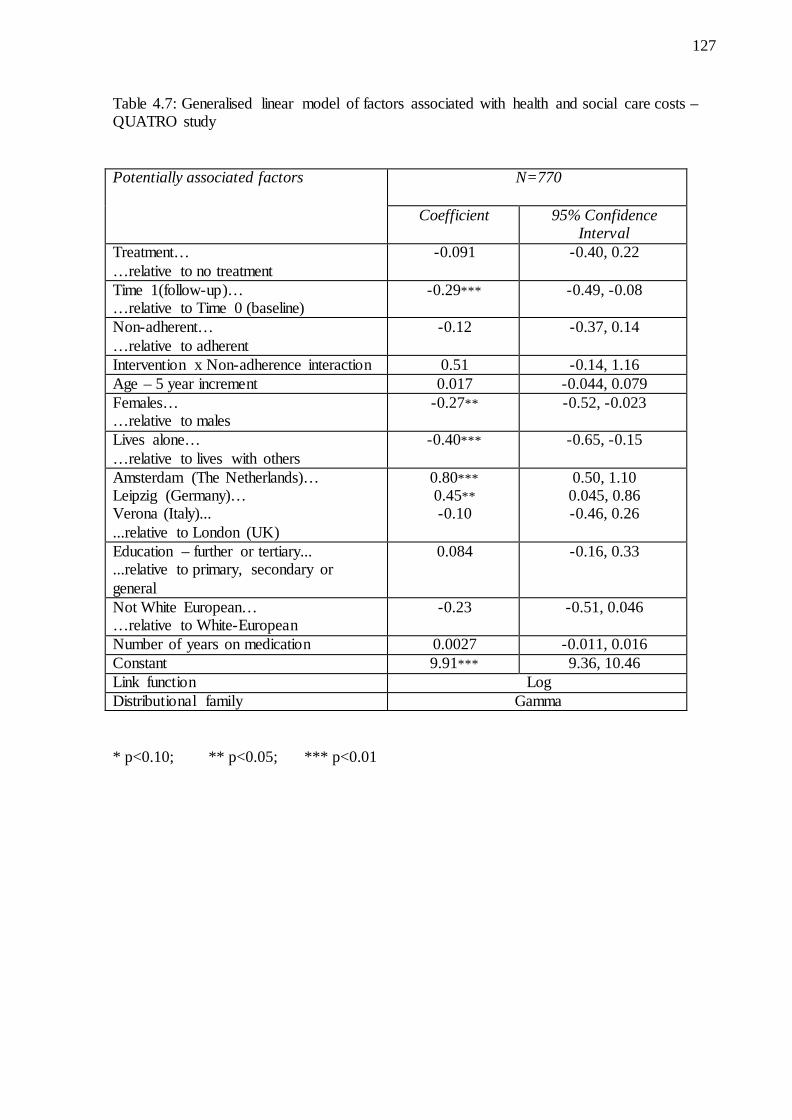
Table 4.7: Generalised linear model of factors associated with health and social care costs, QUATRO study……………………………………………........127
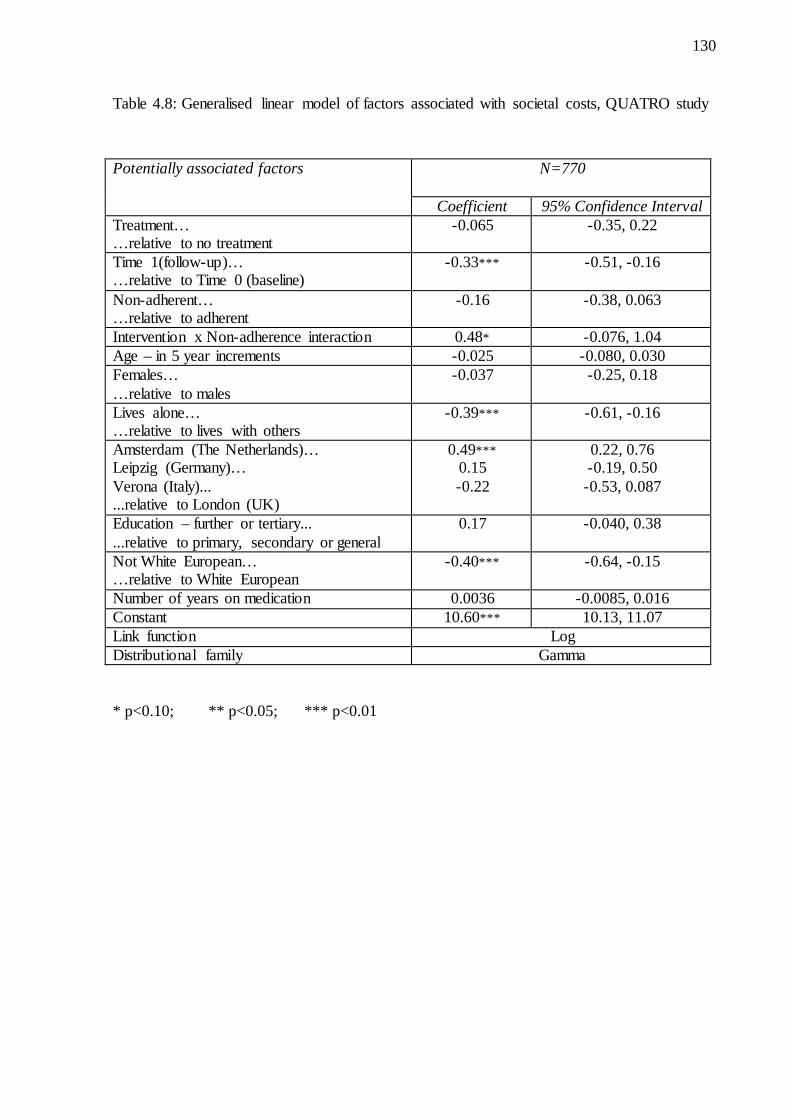
Table 4.8: Generalised linear model of factors associated with societal costs, QUATRO study……………………………………………………………….......130
Table 4.9: Logistic regression model of factors associated with use of inpatient services, QUATRO study……………………………………………………...………….....134
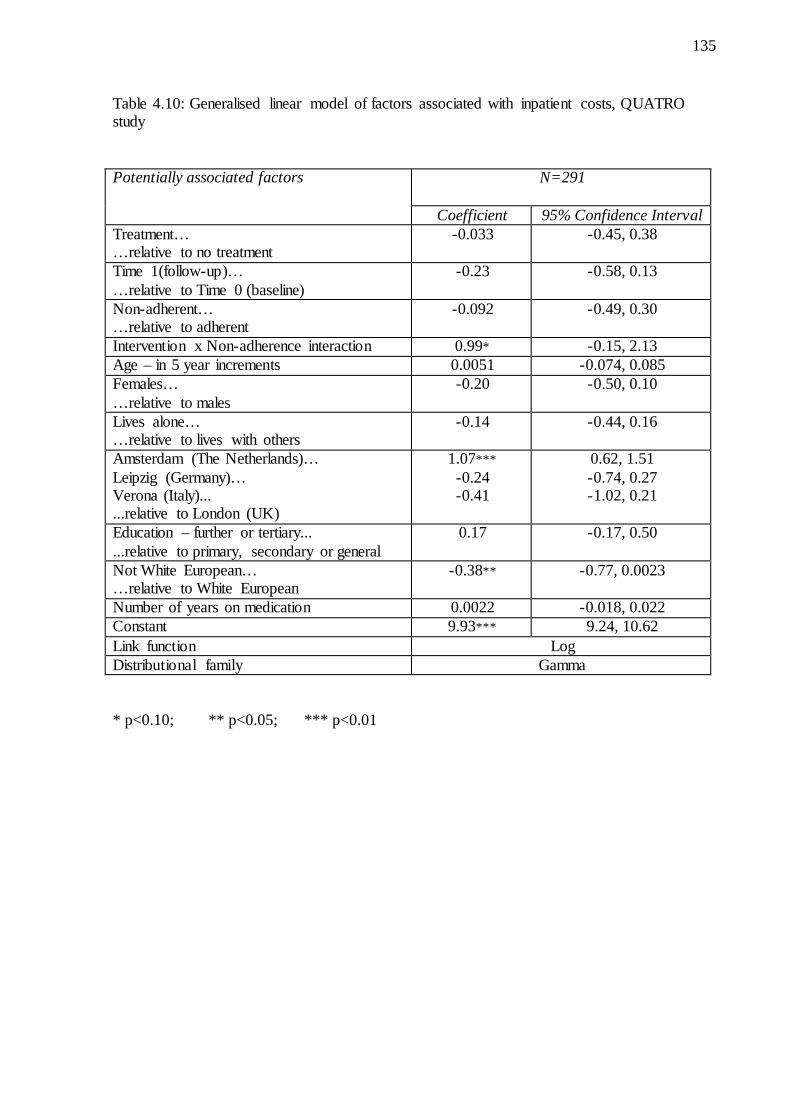
Table 4.10: Generalised linear model of factors associated with inpatient costs, QUATRO study……………………………………………………...…………...135
Table 4.11: Logistic regression model of factors associated with use of community-based day services, QUATRO study…………………………………136
9
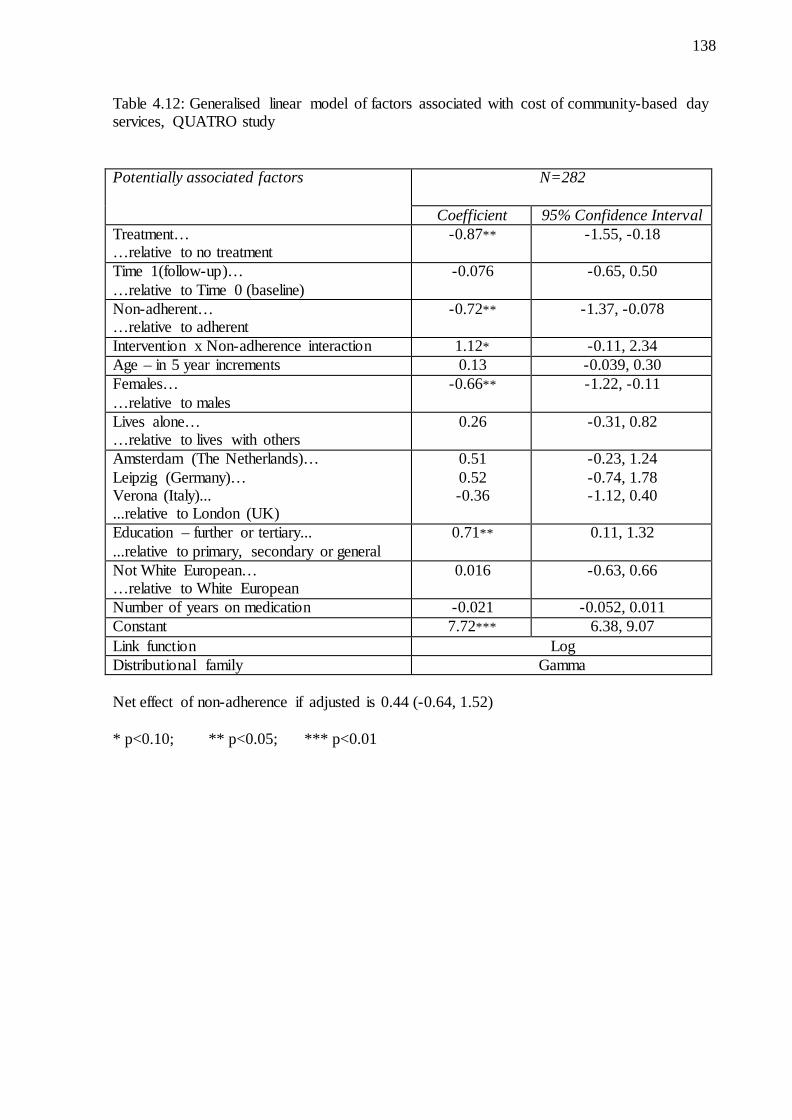
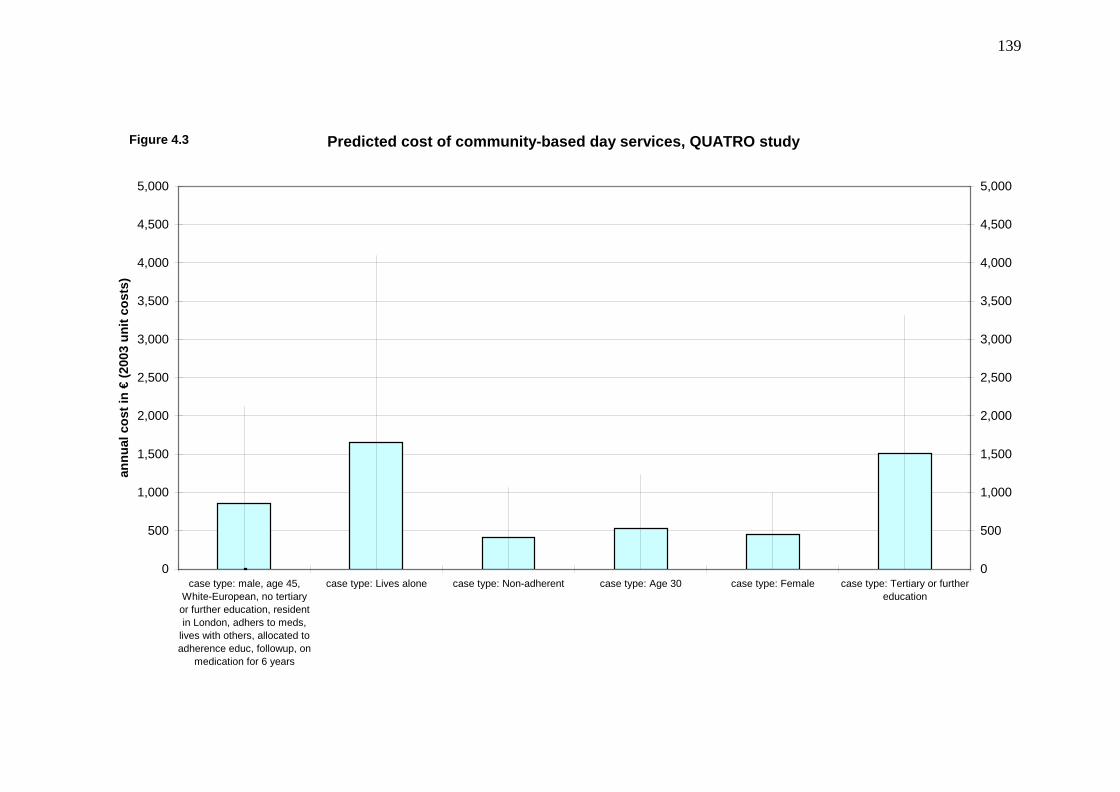
Table 4.12: Generalised linear model of factors associated with cost of community-based day services, QUATRO study…………………………….......138
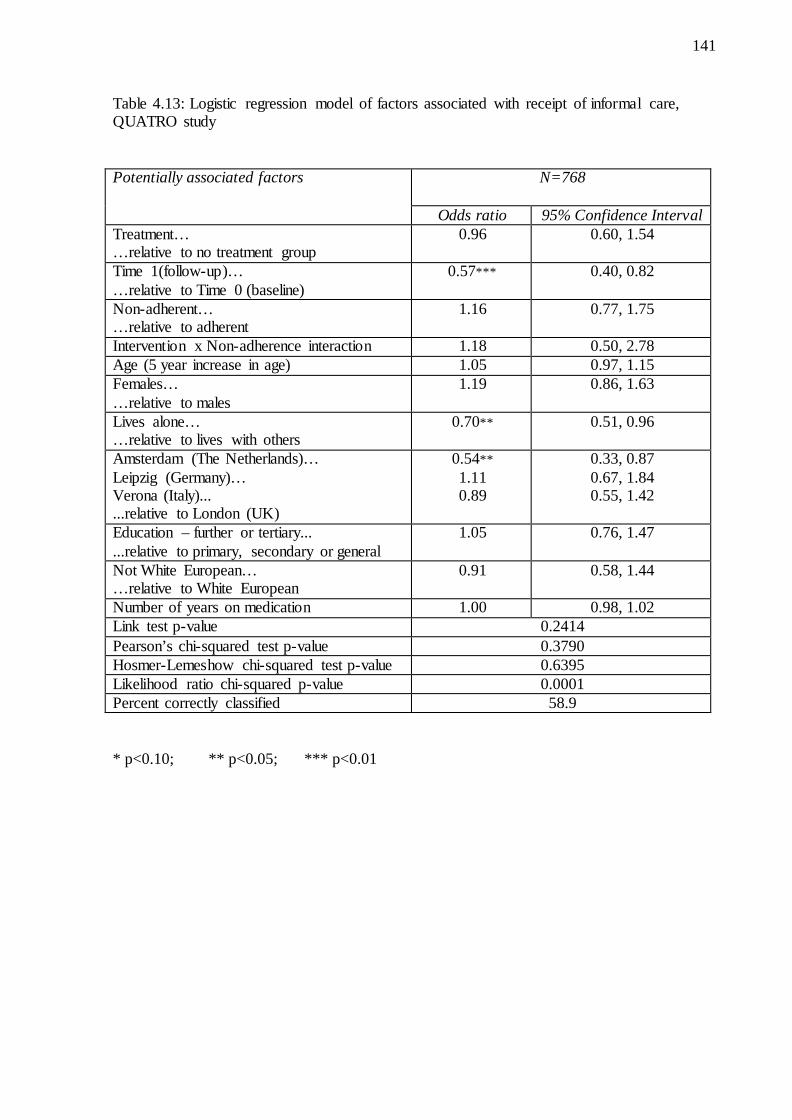
Table 4.13: Logistic regression model of factors associated with receipt of informal care, QUATRO study………………………………………………......141
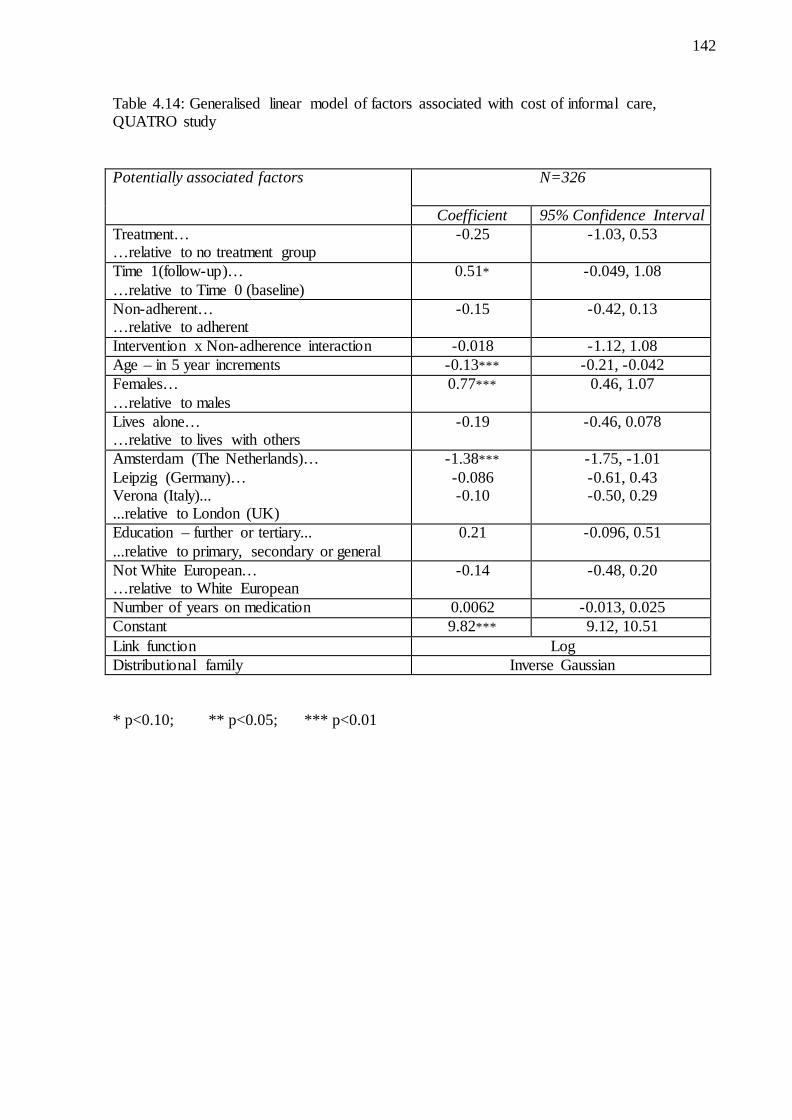
Table 4.14: Generalised linear model of factors associated with cost of informal care, QUATRO study………………………………………………......142
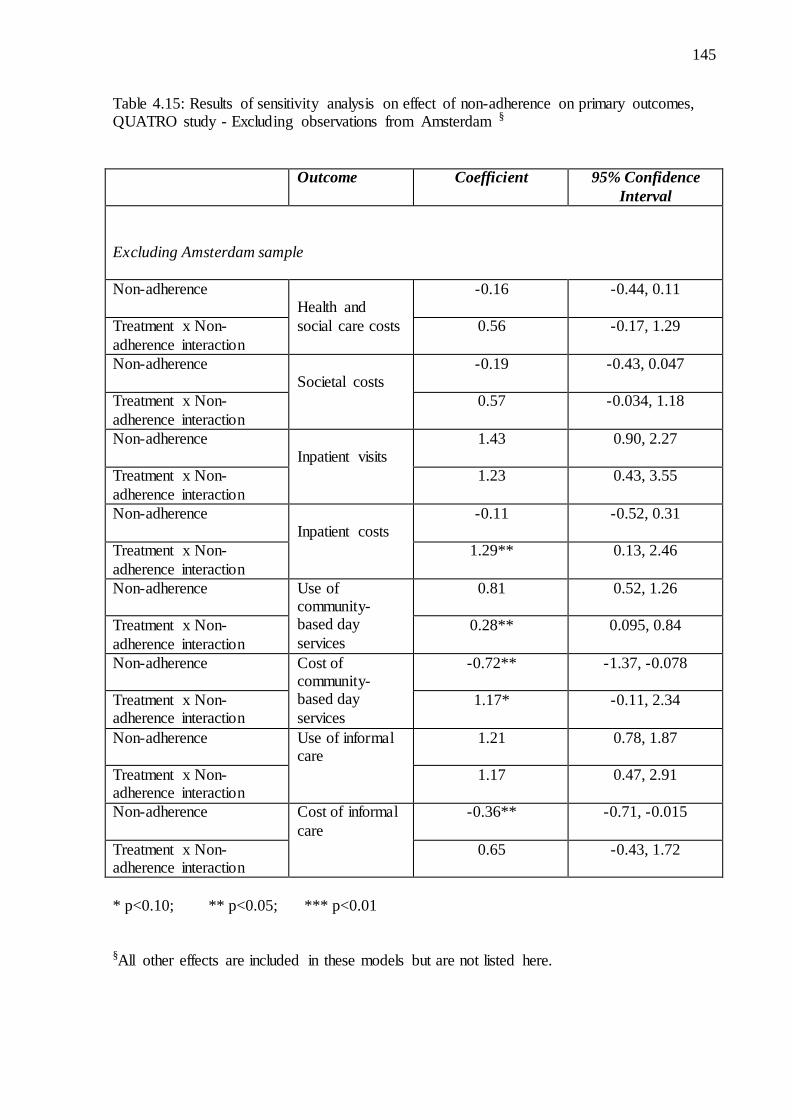
Table 4.15: Results of sensitivity analysis on effect of non-adherence on primary outcomes, QUATRO study - Excluding observations from Amsterdam………………………………………………………………….145
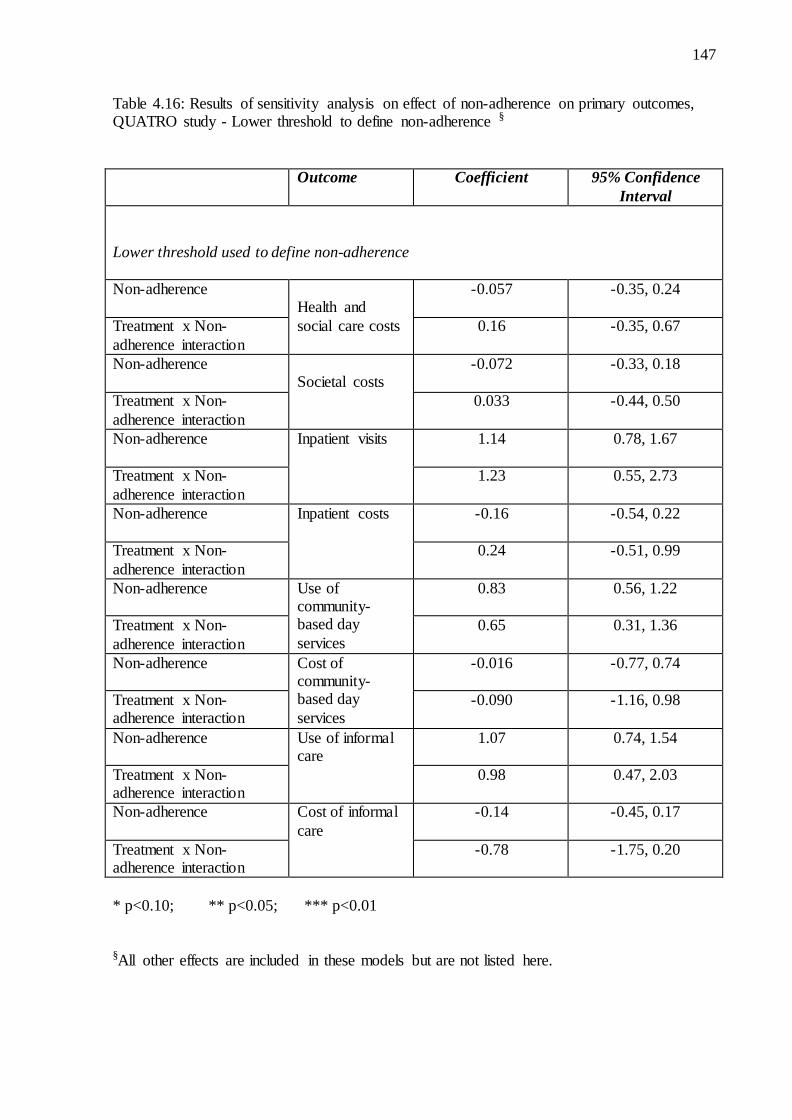
Table 4.16: Results of sensitivity analysis on effect of non-adherence on primary outcomes, QUATRO study - Lower threshold to define non-adherence…………………………………………………………………….147
Table 5.1: Health and social care services and benefits included in analyses, PMS 2000………………………………………………………………………….161
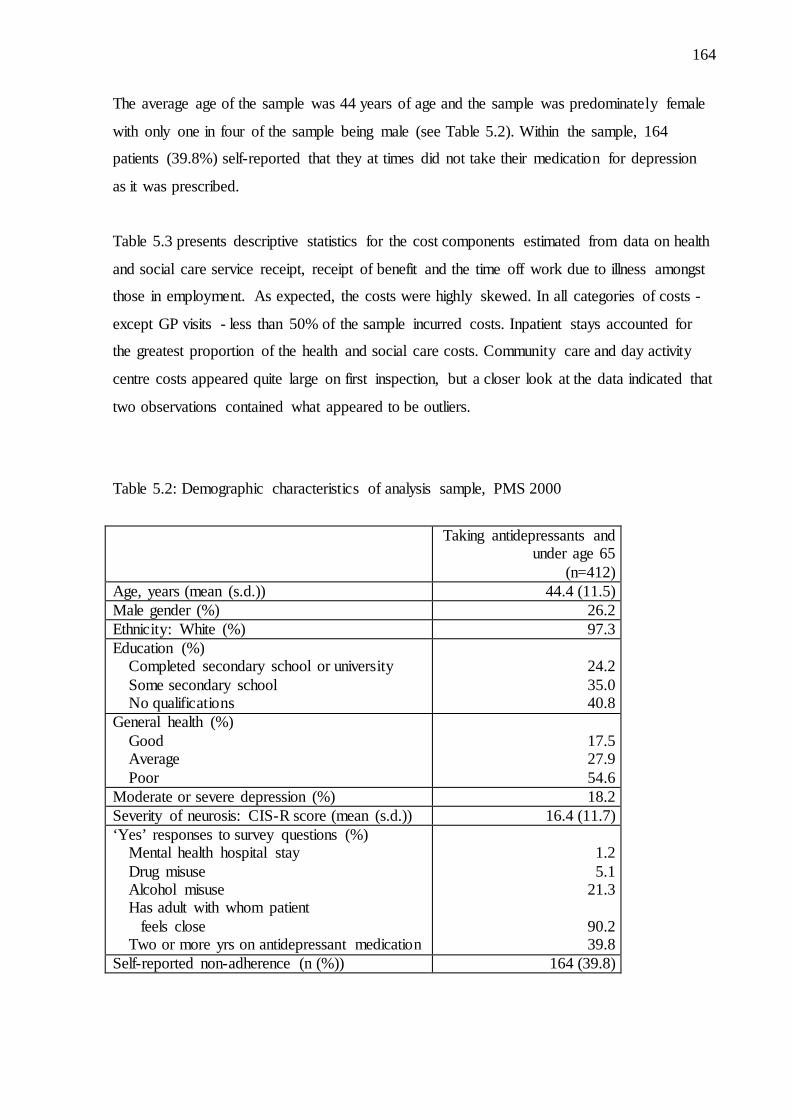
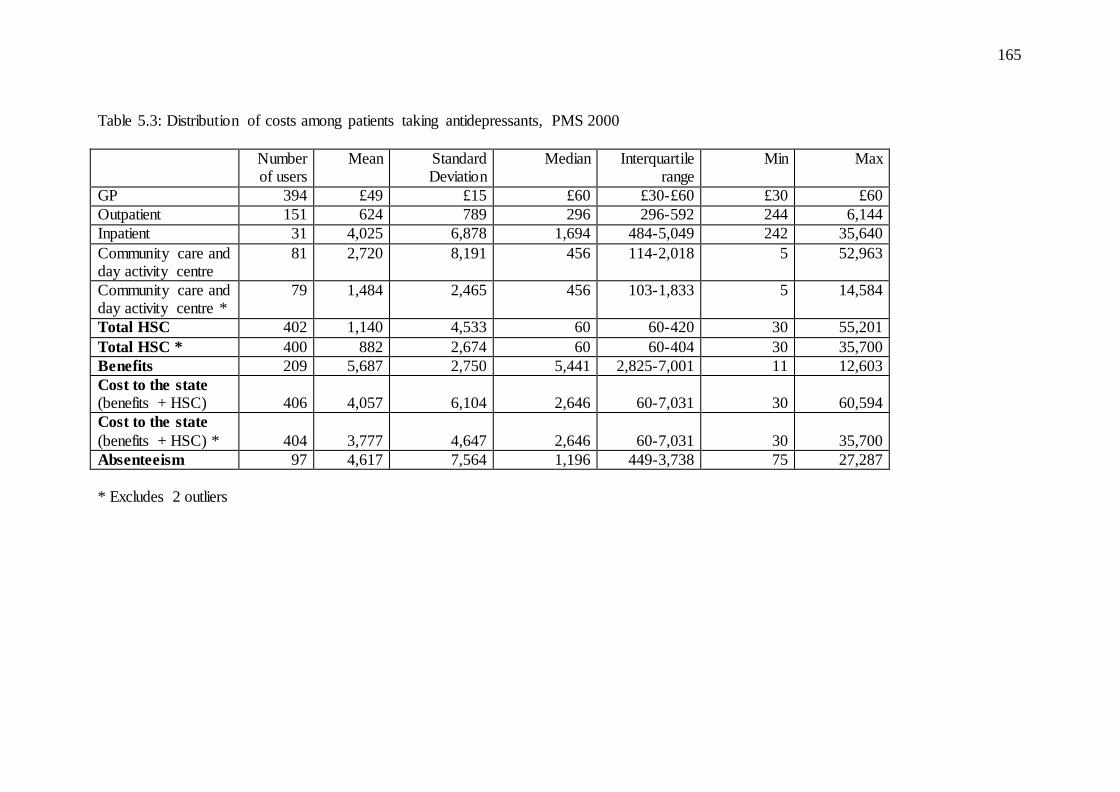
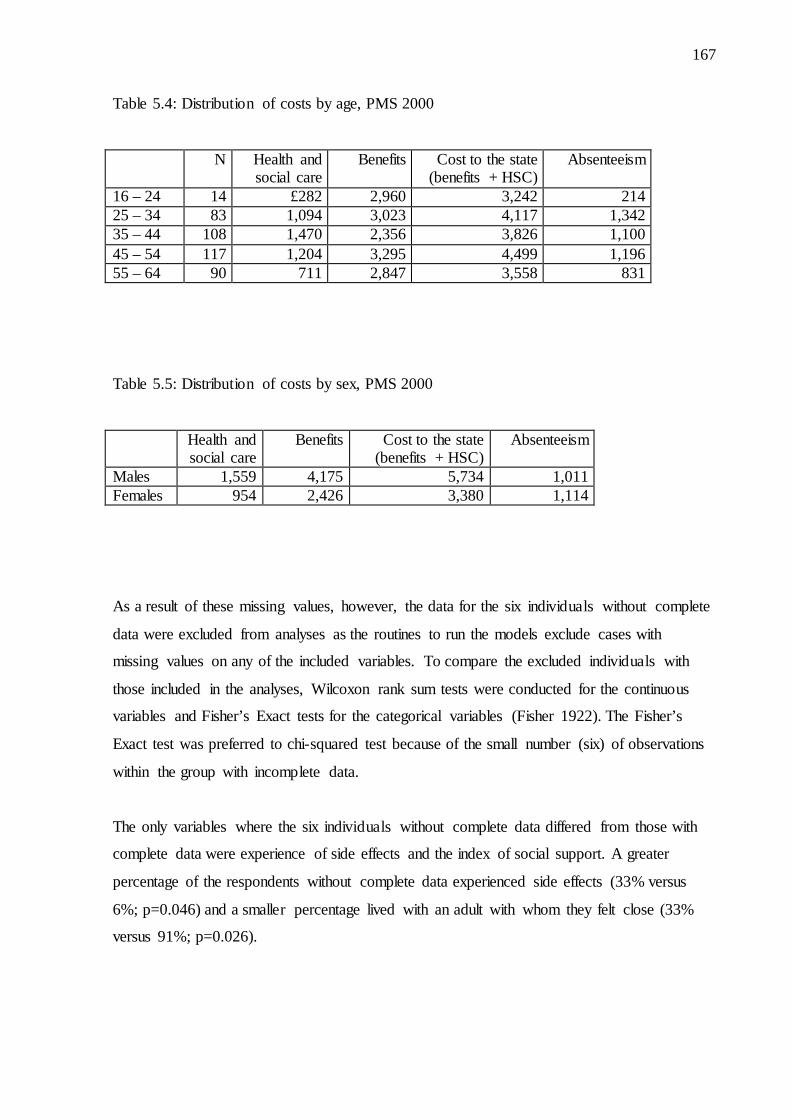
Table 5.2: Demographic characteristics of analysis sample, PMS 2000……………………..164 Table 5.3: Distribution of costs among patients taking antidepressants, PMS 2000………….165 Table 5.4: Distribution of costs by age, PMS 2000…………………………………………..167 Table 5.5: Distribution of costs by sex, PMS 2000…………………………………………....167 Table 5.6: Logistic regression model of factors associated with non-adherence to antidepressants,
PMS 2000……………………………………………………..................................169 Table 5.7: Generalised linear model of factors associated with health and
social care costs, PMS 2000……………………………………………………….171 Table 5.8: Generalised linear model of factors associated with costs to the
state (health and social care costs plus cost of benefits), PMS 2000………….........174 Table 5.9: Logistic regression model on factors associated with having
incurred absenteeism costs (amongst those in work), PMS 2000…………….........178 Table 5.10: Generalised linear model of factors associated with cost of
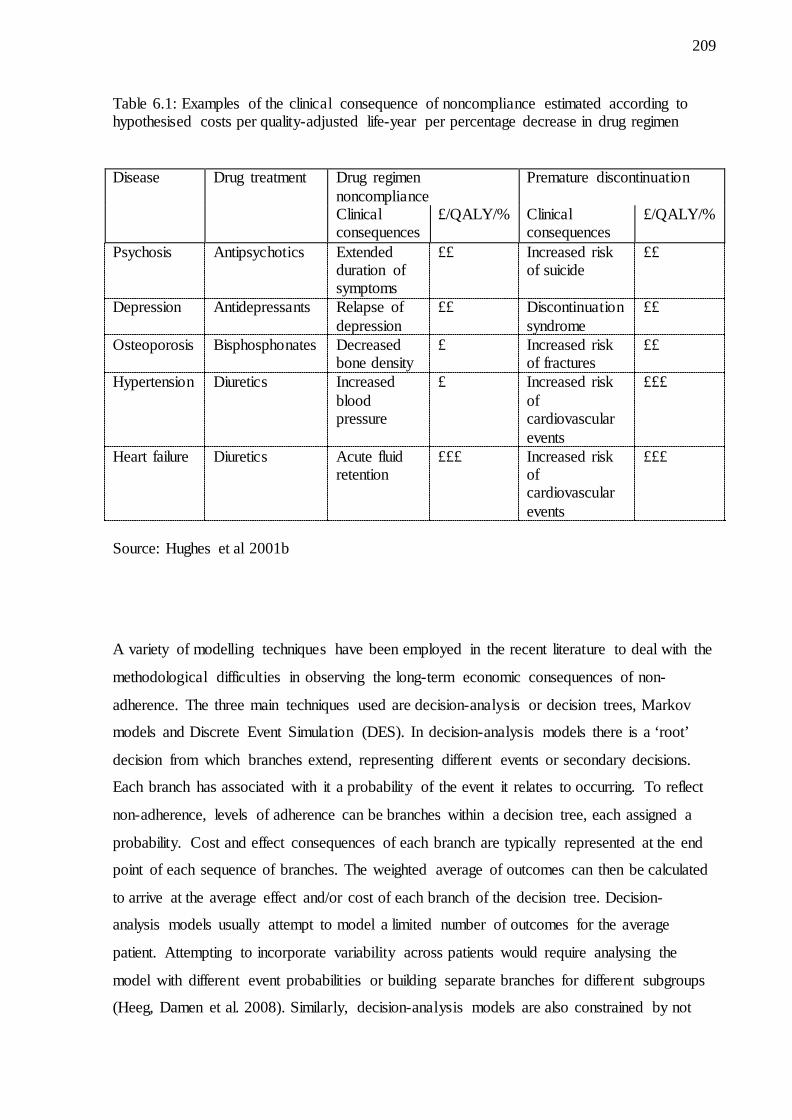
absenteeism, PMS 2000……………………………………………………….....179 Table 6.1: Examples of the clinical consequence of noncompliance estimated
according to hypothesised costs per quality-adjusted life-year per percentage decrease in drug regimen………………………………………………209
10
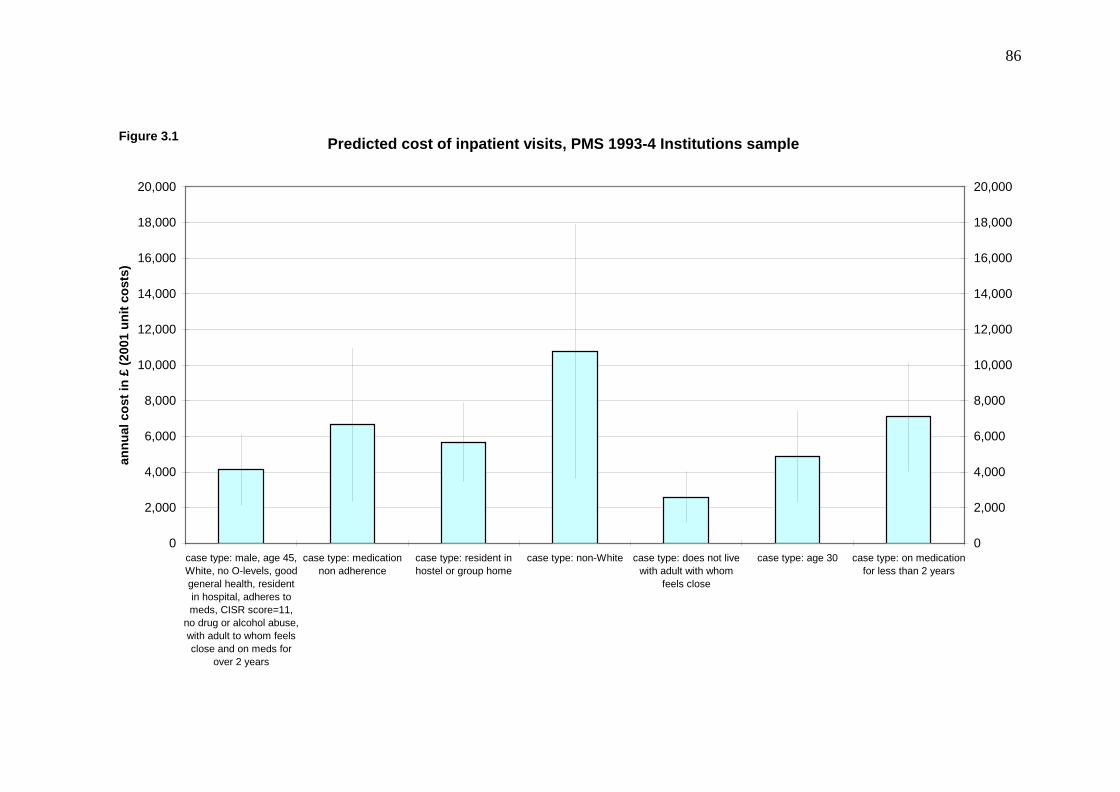
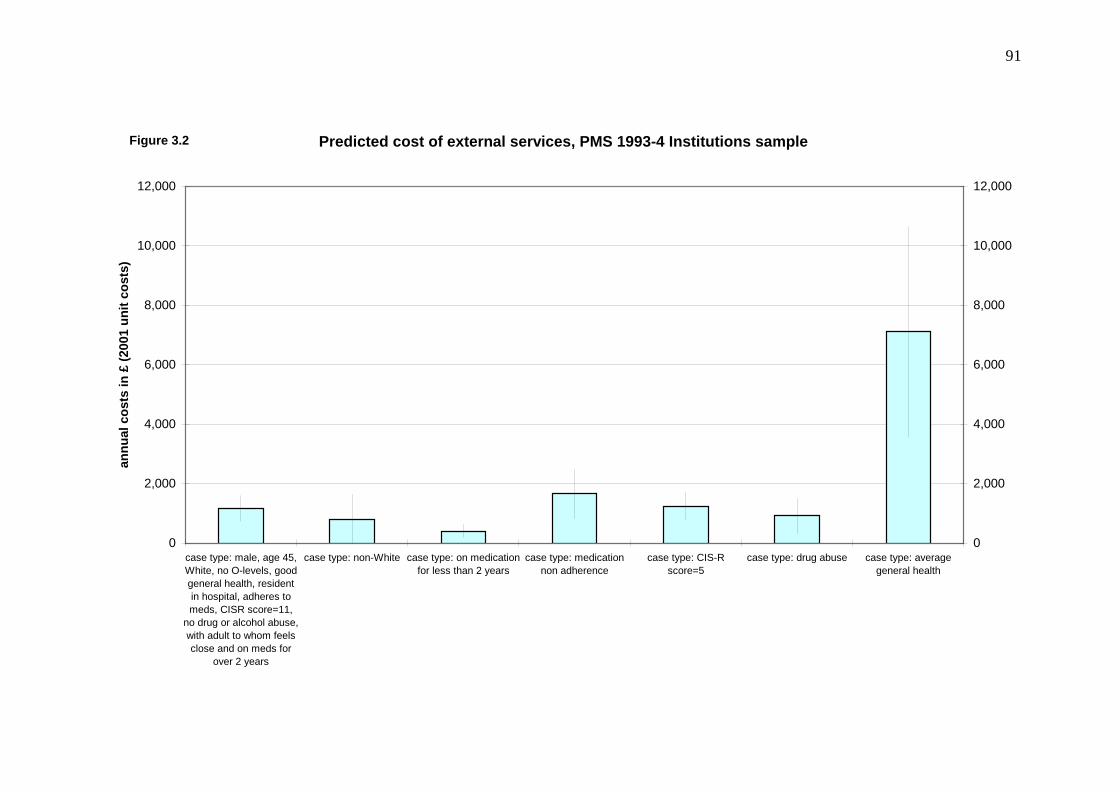
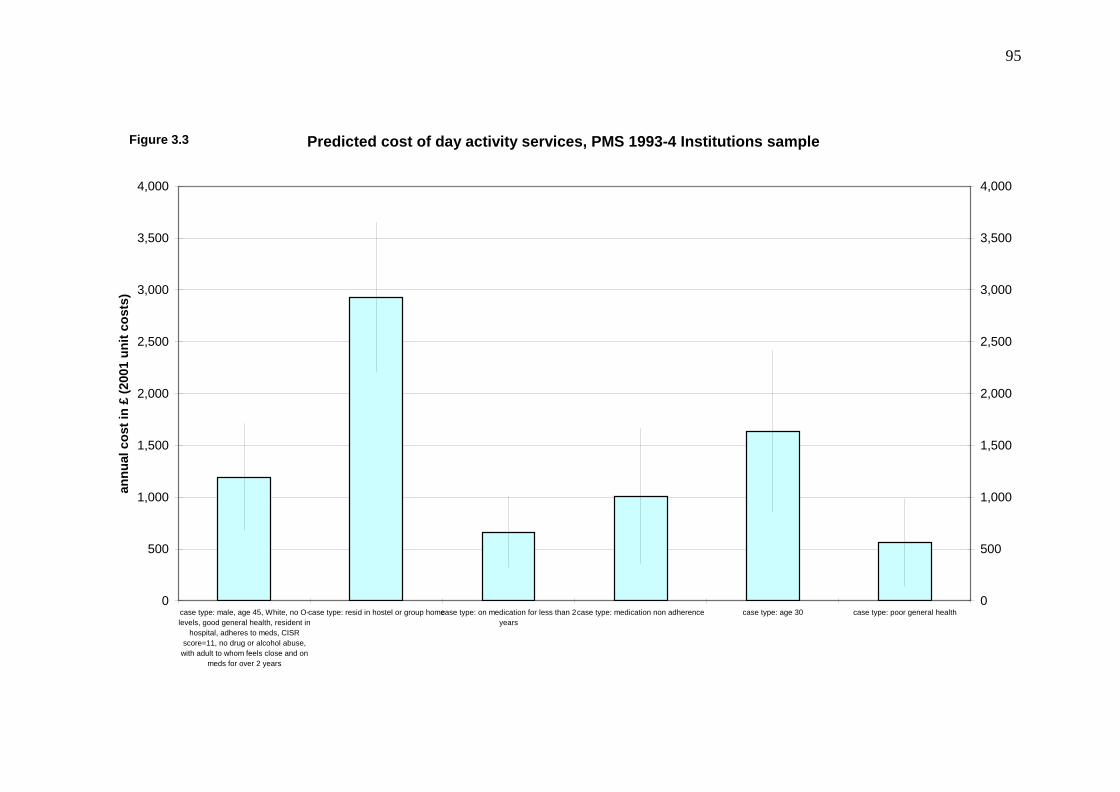
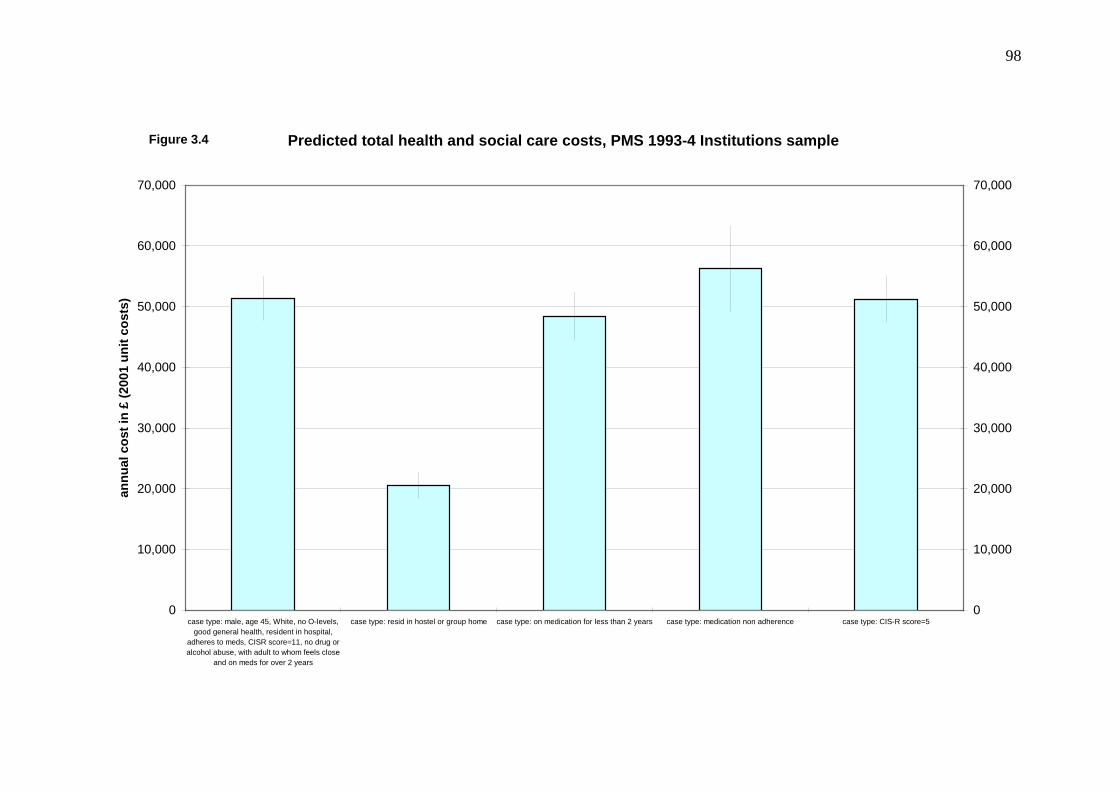
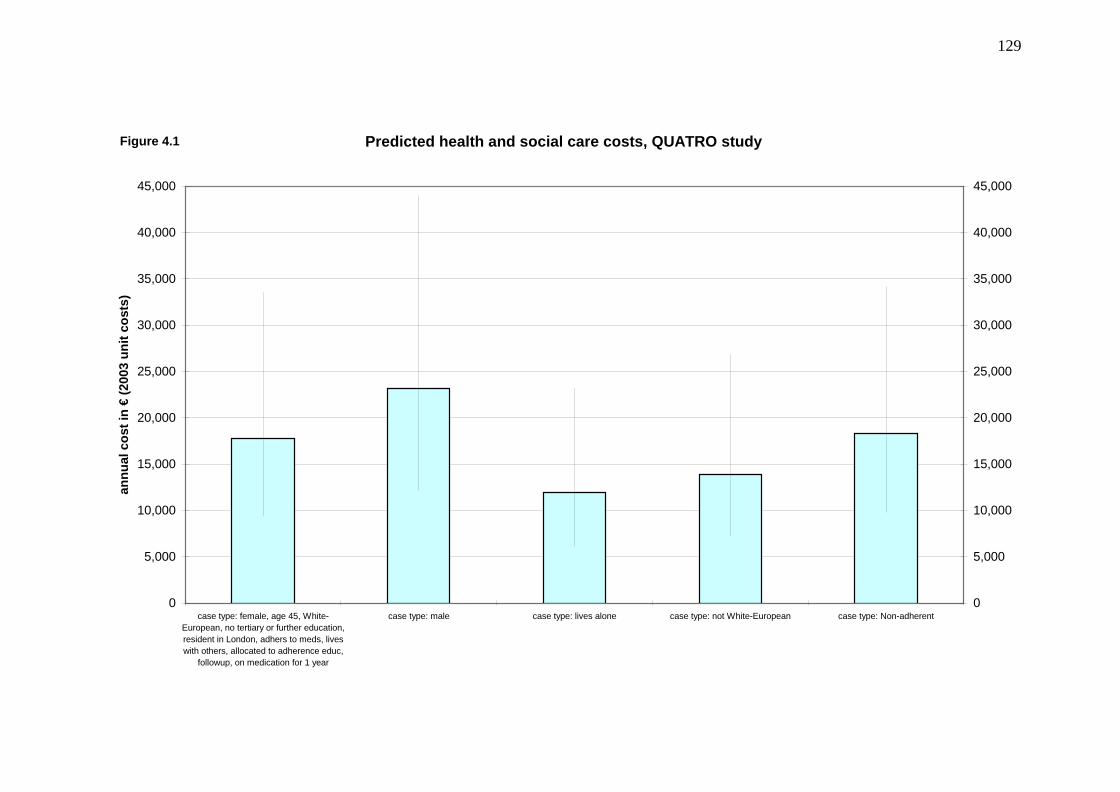
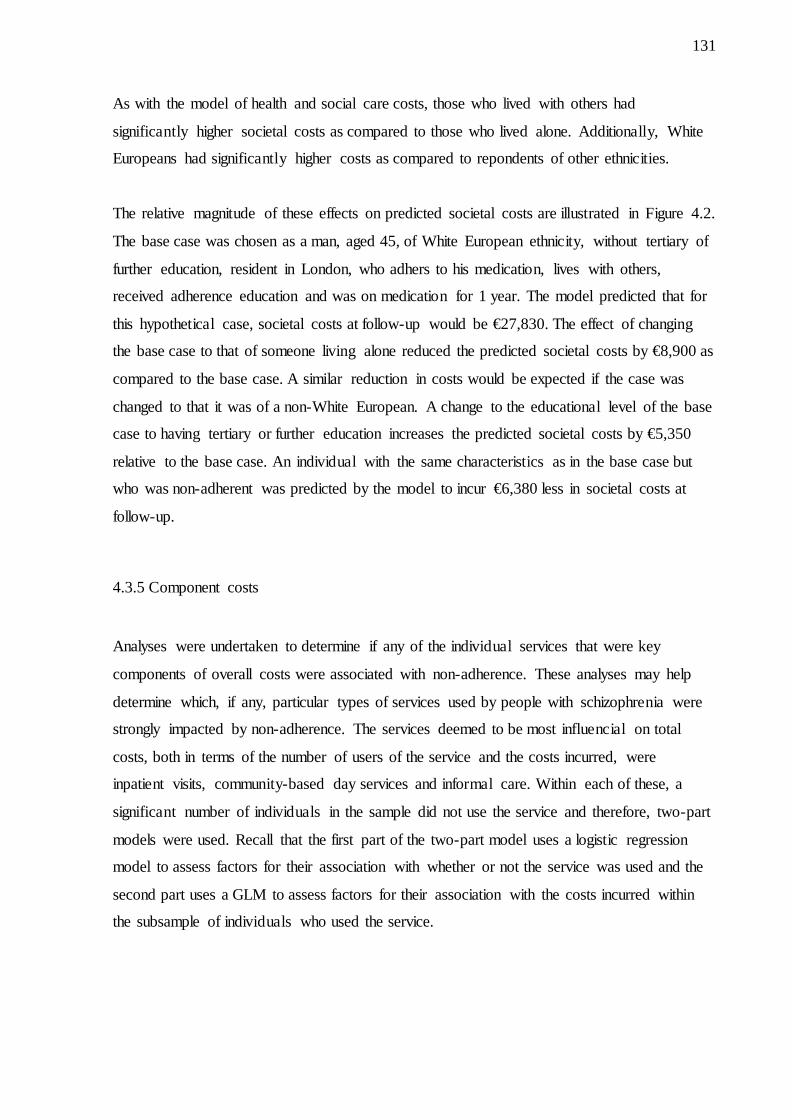
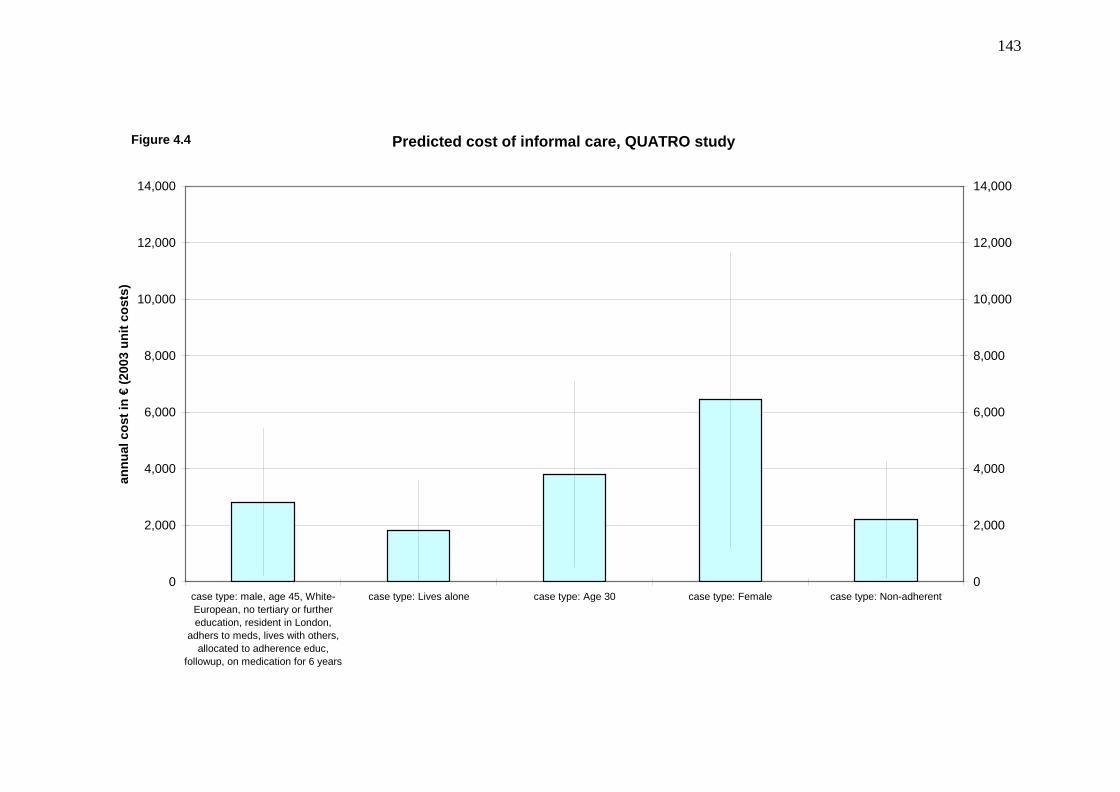
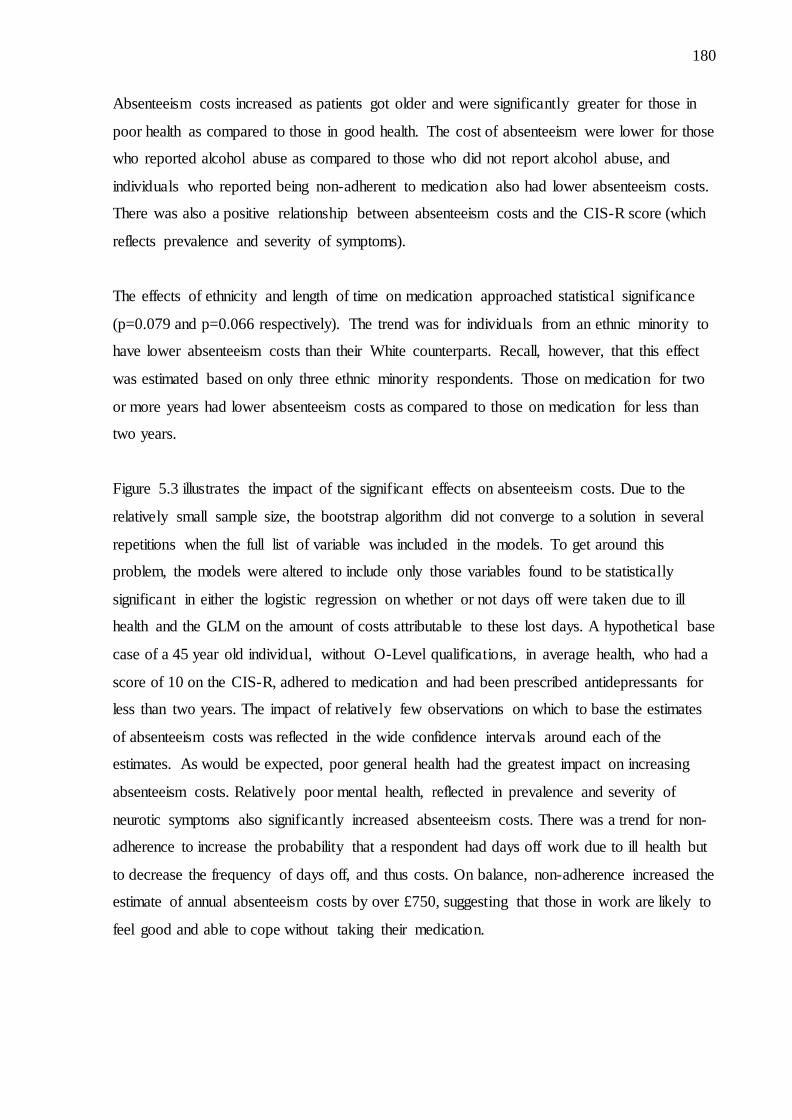
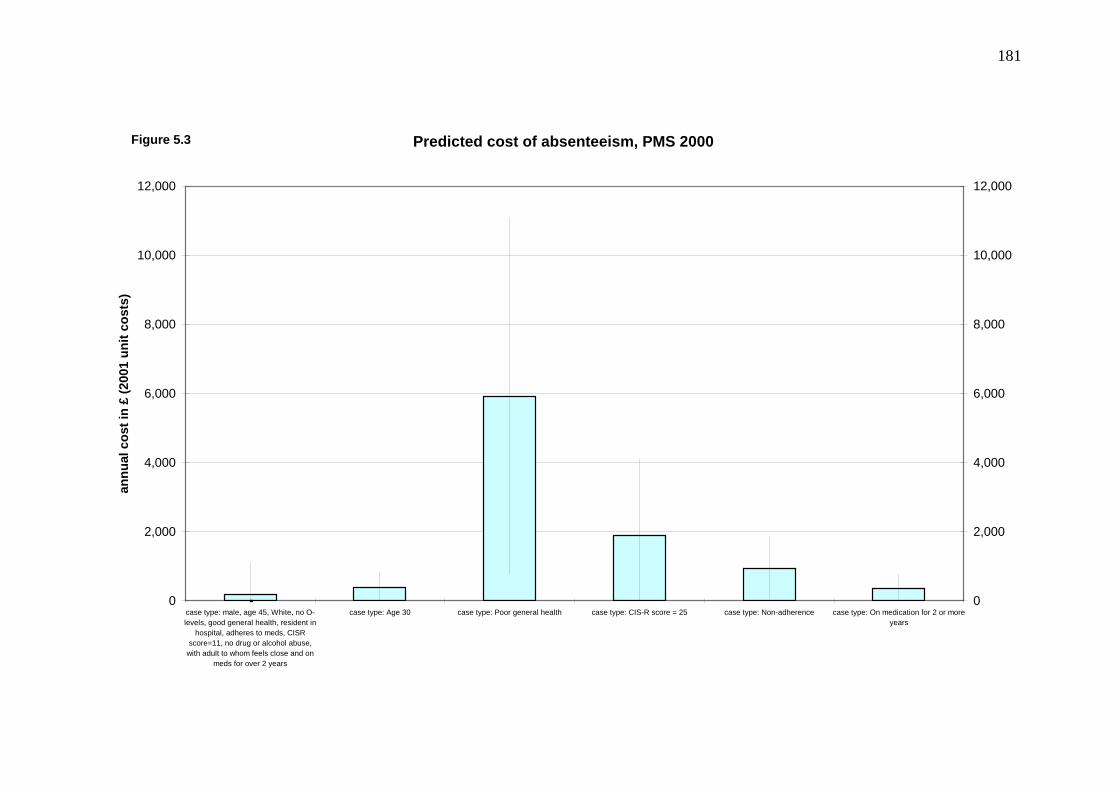
List of figures Figure 3.1: Predicted cost of inpatient visits, PMS 1993-4……….……………………….….86 Figure 3.2: Predicted cost of external services, PMS 1993-4…….……………………….…. 91 Figure 3.3: Predicted cost of day activity services, PMS 1993-4…………………………..…..95 Figure 3.4: Predicted total health and social care costs, PMS 1993-4……………………..….98 Figure 4.1: Predicted health and social care costs, QUATRO study………………………...129 Figure 4.2: Predicted societal costs, QUATRO study…………………………………….…132 Figure 4.3: Predicted cost of community-based day services, QUATRO study………….…139 Figure 4.4: Predicted cost of informal care, QUATRO study…………………………….…143 Figure 5.1: Predicted health and social care costs, PMS 2000……………………………….172 Figure 5.2: Predicted costs to the state, PMS 2000……………………………………….…176 Figure 5.3 Predicted cost of absenteeism, PMS 2000…………………………………….…181
11
Chapter 1
Introduction OK. All right. Listen. Let me join up some of the dots for you. Let me do some of the maths for you: Schizophrenia is the worst pariah. One of the last great taboos... It is not treatable with glamorous and intriguing wonderdrugs like Prozac or Viagra. It isn’t newsworthy. It isn’t curable. It isn’t heroin or ecstasy. It is not the preserve of rock stars and supermodels and hip young authors... They make movies about junkies and alcoholics and gangsters and men who drink too much, fall over and beat their woman until bubbles come out of her nose but Schizophrenia my friend is just not in the phone book. Blue/Orange, Act II Joe Penhall, 2000 The quote above, from the play ‘Blue/Orange’, captures many of the difficulties that surround
schizophrenia – the lack of a cure, the stigma attached to the illness, the degree of isolation
potentially felt by people with the illness and the unparalleled lack of understanding of the
illness amongst the general public.
Schizophrenia is a severe mental disorder, characterized by profound disruptions in thinking,
affecting language, perception, and the sense of self. It often includes psychotic experiences,
such as hearing voices or delusions. A recent study estimated that the number of individuals
in England suffering from schizophrenia was over 120,000 (Mangalore and Knapp 2007). The
World Health Organisation estimated that globally, in the year 2000, schizophrenia was the
seventh leading cause of years-of-life lived in disability (WHO 2001). An idea of the difficult
lives led by those with schizophrenia is further illustrated by a recent sample of individuals
suffering from the illness in Britain. Bebbington et al (2005) found that nearly one-half had
12
attempted suicide or self-harm, a third had at some point been homeless and one in seven had
been in prison.
1.1 Overview
It is evident from research in the UK and elsewhere that the majority of people with
schizophrenia need and use a range of health and other services, resulting in high costs to the
public purse and (often) to others. One area that significantly impacts on costs is the
experience of side effects and non-adherence with treatment. Antipsychotic medications have
a high incidence of unwanted side effects associated with poor quality of life, high rates of
non-adherence or discontinuation of therapy, and several important comorbidities. Substantial
health care resources are used in both managing side effects and managing the consequences
of non-adherence or discontinuation of antipsychotic medications.
Weiden and Olfsen (1995) estimated that non-adherence accounts for approximately 40% of
rehospitalisation costs for patients with schizophrenia in the two years after discharge from in-
patient treatment. Meta-analyses of data from a number of countries concluded that a 50%
improvement in adherence would decrease one-year rehospitalisation rates by 12% (Weiden
and Olfson 1995). Also, given that anywhere from 25% to 80% of patients at some point in
their treatment do not adhere to their medications (Battaglia 2001; Conley and Kelly 2001),
the system-wide costs of non-adherence could be substantial.
Schizophrenia patients often require support in daily activities due to the poor personal and
social functioning associated with the illness. Patients are likely to have difficulty in finding
and holding onto jobs. This also has implications for their families and society at large, as
they will be called upon to support patients. Other societal costs accrue from the lost
productivity of schizophrenia patients and criminal justice costs associated with violent
behaviours that may result from the condition.
So in addition to the clinical and quality of life effects attributable to non-adherence, there are
substantial resource implications in the form of higher service use levels and costs that result
13
from non-adherence. Interventions that are successful in reducing non-adherence rates,
including new medications, will have considerable benefit for patients, their families, and the
health and social care systems. To date, the majority of pharmaceutical, psychological therapy
and psychosocial interventions have been judged based on the degree to which they improve
adherence without consideration of their cost-effectiveness (Zygmunt, Olfson et al. 2002).
Healey et al (1998) conducted a cost-effectiveness evaluation of adherence therapy and
included health, social care and criminal justice costs in their analyses, but this study was
limited by a small sample size at the end-point of the study as a result of sample attrition.
Hughes et al (2001) highlight the need for more information on the cost consequences of non-
adherence to allow economic evaluations to reflect its potential impact. Additionally,
evaluations of interventions that may have an impact on non-adherence require a period of
observation long enough to allow for adequate assessments of their influence on adherence
rates.
This thesis aims to establish factors that contribute to non-adherence in schizophrenia,
examine the pattern of health care service use associated with non-adherence and estimate the
costs associated with non-adherence. Patterns of service use will be established to determine
the impact of non-adherence on resource use and costs. Factors that may impact on the
patient's experience include the type of medication prescribed, the type of residential
accommodation, general health status, type of family unit, or demographic factors such as
age, sex and ethnicity.
1.2 Schizophrenia – prevalence and quality of life
In 1896, Emil Kraepelin established a classification of mental disorders, one of which was
dementia praecox (Pull 2002). This illness was given the name schizophrenia by Eugen Bleuler
who emphasized the presence of a dissociation of mental functions as the essential characteristic
of the illness. The aetiology of schizophrenia is complex with biological, psychological and social
factors all thought to play a role in the onset of illness. Genetics are thought to be the most
significant factor in the development of the illness, accounting for approximately 80% of risk of
onset (Gelder, Harrison et al. 2006). Environmental factors, some of which are experienced
prenatally and interact with genetic factors, are also important. Examples of social and
14
psychosocial factors that may contribute to the onset of schizophrenia are migration, social
isolation and stressful life events (Gelder, Harrison et al. 2006).
The relationship between the genes present in people diagnosed with schizophrenia and their
development of the illness is not fully understood. It is understood that the illness cannot be
attributed to a single gene, although it is not clear if schizophrenia arises from the cumulative
effect of several genes or if there are a range of disorders of different genetic makeup that fit
within the diagnostic category of schizophrenia (Gelder, Harrison et al. 2006).
Schizophrenia is a severe disorder. Behaviour may be seriously disturbed during some phases
of the disorder, leading to adverse social consequences. In the acute phase of the illness,
characteristic symptoms include delusions (strong belief in ideas that are false and without
any basis in reality), hallucinations, fundamental distortions in thinking and perception, and
inappropriate emotions (WHO 2001). These are referred to as positive symptoms. Some
patients recover from acute illness, while others will progress to chronic schizophrenia.
During the chronic phase of the illness, negative symptoms appear. The most common
negative symptoms are social withdrawal, underactivity, lack of conversation, few leisure
interests and slowness (Creer and Wing 1975). Once chronic schizophrenia is established, full
recovery is extremely unlikely. Other characteristics are disorders of thought and speech,
disorders of behaviour, disturbance of emotions and affect, and cognitive deficits (Pull 2002).
In a 14-country study on disability associated with physical and mental conditions, active
psychosis was ranked the third most disabling condition, higher than paraplegia and blindness
(Üstün and Sartorius 1995). Studies that have followed patients over a long period of time
suggest that a minority of patients achieve full recovery, whereas 10-17% required sheltered
care and approximately 40% had poor outcome in terms of social adjustment (Gelder,
Harrison et al. 2006). Notably, an estimated 30% of patients diagnosed with schizophrenia
attempt suicide at least once during their lifetime (Radomsky, Haas et al. 1999).
Because it is a chronic illness, the prevalence of schizophrenia greatly exceeds the incidence.
Based on relatively broad diagnostic criterion, the annual incidence of schizophrenia is
between 0.16 and 0.54 per 1000 population, while the prevalence is estimated to be between
1.4 and 4.6 per 1,000 population (Jablensky 2003). This prevalence range is observed across
countries (Gelder, Harrison et al. 2006). Schizophrenia typically begins in late adolescence or
15
early adulthood. In a study of the age, beginning and course of the illness, the first psychotic
episode began before the age of 30 in 63% of cases (Hafner, Maurer et al. 1993).
There are important gender differences in the incidence, age of onset and severity of
schizophrenia as well as differences in the effects of treatment. The incidence of
schizophrenia is higher in men than it is in women and women have a later mean age of onset
than men (Aleman, Kahn et al. 2003). Fewer women present with the illness between the ages
of 15 and 29 as compared to men and a substantial number of women present with
schizophrenia in their fifties. There is also evidence to suggest that men experience more
severe illness (Aleman, Kahn et al. 2003), and that antipsychotic medications pose more risks
for woman than men (Wieck and Haddad 2003).
1.3 The cost of schizophrenia
The total identified cost of schizophrenia in England was estimated at £6.7 billion in 2004/5
(Mangalore and Knapp 2007). This is significantly greater than a 1997 estimate of annual UK
costs of £2.6 billion (Knapp 1997). Mangalore and Knapp (2007) estimate that in 2004/5, the
cost of schizophrenia in England separated into direct costs of £2 billion and indirect costs of
£4.7 billion. The World Health Organisation (2004) estimated that in 2002 the sum of years of
life lost due to premature death and the years lost due to disability attributable to
schizophrenia in the UK was 85,000 years.
The average annual health and social care (including medications) cost of treating and
supporting a schizophrenia patient in the UK has been estimated for 2004/5 at approximately
£39,000 and the average annual societal cost at £54,600 (Mangalore and Knapp 2007). A
census-based study in four metropolitan areas in Australia, conducted in 1997-1998,
estimated the average, per patient, annual societal cost of schizophrenia to be AUS$51,600
(Carr, Neil et al. 2003). The estimated average annual societal cost of schizo-affective
disorder was AUS$ 47,900. Based on data collected between 1997 and 2003 in the US, Zhu et
al (2008) estimate the average annual medical costs for a patient with schizophrenia to be
US$16,100.
16
Typically, in the UK as elsewhere, in-patient hospital services and community-based
(specialist) residential care account for over 70% of direct costs. Curtis (2008) estimated that
for a patient with mental illness the UK daily cost of an inpatient stay in an acute NHS
psychiatric ward is £219 and in a long-stay NHS hospital ward is £201. The shift towards care
in the community has also led to increases in demand for treatment, care and support services
that previously would have been provided in long-stay psychiatric hospitals (Pederson and
Leese 1997).
The shift towards community-based care has many facets. Crisis Resolution services, for
example, provide individuals with serious mental illness who are at risk of requiring
psychiatric hospitalisation with flexible, home-based care. Crisis Resolution Teams have been
shown to reduce admissions and costs (Johnson, Nolan et al. 2005; Glover, Arts et al. 2006;
McCrone, Johnson et al. 2009). Assertive Outreach teams work to keep people in contact with
services and support people to continue with their treatment. Early Intervention teams support
people intensively in the early phases of their illness. Generic Community Mental Health
Teams, another service model providing community mental health care, are composed of
professionals from a wide range of disciplines, who provide effective local mental health
services primarily for people who use services whose illness is chronic and severe.
Another important cost in treating patients with schizophrenia is the cost of medications.
Gilmer et al (2004) estimated the average annual cost of prescribing among 15,962 Medicaid
beneficiaries to be US$5,200 in 2004, up 27% from US$ 4,100 in 1999.
Schizophrenia patients often require support in daily activities due to the poor personal and
social functioning associated with the illness. Patients are likely to have difficulty in finding
and holding onto jobs. Marwaha et al (2007), in a study of people with schizophrenia across
the UK, France and Germany, observed unemployment rates of 87%, 89% and 70%
respectively. The authors compared these rates to the rates of unemployment in the general
population at the same point in time: 29% in the UK, 38% in France and 35% in Germany.
Factors contributing to low rates of employment include low educational attainment,
employers’ negative attitudes about people with mental health problems and self-stigmatising
behaviour. The high rate of unemployment among patients with schizophrenia also has
implications for their families and society at large, as they will be called upon to provide
17
informal care to patients. Lost productivity and costs incurred within the criminal justice
system are other significant costs associated with the condition.
In relation to their treatment, patients with schizophrenia will experience side effects and are
likely at some point to not adhere with their recommended treatment. Antipsychotic
medications have a very high incidence of unwanted side effects associated with poor quality
of life, high rates of non-adherence or discontinuation of therapy, and several important
comorbidities. Additionally, the lack of insight and cognitive impairment that are symptoms
of the illness may lead to poor medication adherence by patients. Substantial health care
resources are used in both managing side effects and managing the consequences of non-
adherence or discontinuation of antipsychotic medications.
1.4 Adherence
1.4.1 Definition and context
The term ‘compliance’ has been defined as ‘the extent to which a person’s behaviour
coincides with medical or health advice’ (Haynes 1979) or ‘the degree of conformity between
treatment behaviour and treatment standards’ (Gaebel 1997). The first of these definitions
suggests a degree of paternalism on the part of the clinician, whereas the latter, more recent
definition, acknowledges the role of the patient in treatment decisions (Myers and Midence
1998). The greater use of the term ‘adherence’, instead of ‘compliance’ also reflects current
thinking of less paternalism in treatment decisions. The term adherence is used in this thesis.
Non-adherence can refer to medication, to a therapy or to services (Kuipers 1996). As it
relates in medicines, non-adherence covers a range of rates of missing medication across
individuals. Some patients may only miss a few dosages while others may consistently not
take their medication as prescribed. Non-adherence can also be classified as relating to (a)
failure to fill a prescription; (b) filling the prescription but failing to take the medication; (c)
taking only a portion of the prescription; and (d) not following the frequency or dose
instruction of the prescription (Buckalew and Sallis 1986).
18
Across illnesses, non-adherence to medication is estimated to account for 135,000 deaths in
the US per year (Peterson, Takiya et al. 2003).
Little is known about attitudes of schizophrenia patients towards their medications. The
definitions of compliance and adherence given above appear to take a clinical perspective on
patient’s behaviour towards their treatment. But what are the perceptions of patients? Kuipers
(1996) suggests that patients may choose to not adhere to treatment because their perception
or experience is that it is inappropriate or inaccessible. It would be desirable to obtain more
information from patients as to the reasons why they do or do not adhere to their medications.
Some discussion is warranted of how patients’ feel about their medications, their
understanding of their treatment, and the extent to which they feel committed to their
treatment. This perception is particularly important in schizophrenia as, because of the
chronic nature of the illness, patients are often on medication on a long-term basis
(Fleischhacker 2002). In this thesis, the assumption is made that non-adherence takes place
only after patients initially agree to the prescribing of medication to alleviate their symptoms
associated with the illness.
1.4.2 Theoretical models
In a chapter of the book ‘Patient Treatment Adherence’ edited by Bosworth, Oddone and
Weinberger, Bowsorth and Voils (2008) present several theoretical models that have been
identified to try to understand treatment adherence. These include Locus of Control Theories,
Theory of Reasoned Action, Protection Motivation Theory, the Health Belief Model and the
Transtheoretical Model. Discussion of these models has sought to describe their application to
a variety of health behaviours. These may be relating to preventative behaviours such as
breast self-examination, smoking cessation or exercise adherence, to behaviours during
treatment, such as medication adherence and behavioural changes sought through
interventions to improve adherence. Discussion of theoretical models also covers the various
stages of treatment: from seeking and accepting treatment, to starting and maintaining
treatment. For the most part, the application of theoretical models in this area has focussed on
the understanding of preventive behaviours and the initiation of treatment. There exists less
understanding of the maintenance phase of treatment.
19
Rotter’s and Wallston’s The Locus of Control Theories
Rotter sets out that there are internal and external dimensions to locus of control. Internal
locus of control is the degree to which an individual perceives that reinforcement is
contingent on one’s behaviour. External locus of control is based on believing that
reinforcement is contingent on outside forces such as luck or fate. Wallstron expanded on
these concepts by distinguishing external locus of control beliefs which stem from relying on
powerful others, such as a physician, as opposed to unknown external forces. Locus of control
theories suggest that individuals with good internal locus of control are more likely to adhere
to their medical treatment. An individual who believes that by taking their medication as
prescribed they will get better is more likely to adhere.
Social Learning Theory and self-efficacy
Bandura’s concept of Social Learning Theory is also based around expectations. This theory
postulates that human behaviour is determined by expectancies and incentives (Bandura 1977;
Bandura 1986). Three main categories of expectancies are described as expectancies about
environmental cues, expectancies about the consequences of one’s own actions and
expectancies about one’s ability to achieve a desired outcome. The last of these is termed self-
efficacy, and suggests that behaviour is based on both an individual’s belief in their ability to
perform the behaviour and their opinion of the likely outcomes of the behaviour. The value
which the individual places on the desired outcome determines the incentive.
Self-efficacy relates well to medical adherence in that if a patient feels that what is asked of
them in managing their health condition is not outside of their ability, they will follow that
behaviour as directed. The role of expectation on remaining adherent to medication is,
however, less applicable. It is likely that any patient will perceive there to be little difficulty in
taking medications. Non-adherence to medication is likely to occur as a result of experiencing
side-effects or the patient feeling like they no longer require the medication. In these cases, it
is in improving adherence that these concepts can be applied, such as in explaining the
consequences of missed dosages.
20
The Theory of Reasoned Action/Theory of Planned Behaviour
The Theory of Reasoned Action suggests that attitude towards a behaviour and the perception
of how others feel about the behaviour will predict whether or not an individual will follow
the behaviour. The Theory of Planned Behaviour adds the notion that perception of control
over performing a behaviour not only predicts behavioural intention, but will also predict
whether or not they actually perform the behaviour. This relates to self-efficacy. The
difficulties cited in applying this theory to medical behaviour relate to its inability to explain
and account for changes in behaviour over time and the possible divergence between
intentions and actual behaviour. It has been found that the type of behaviour and cognitive
and personality variables affect the level of consistency between intentions and actual
behaviour. By introducing implementation intentions, in effect cues to help determine when,
where and how a behaviour is to be performed, can assist in improving adherence. For
example, a patient could be told to take their medication each day with their evening meal to
help create a pattern for completing the behaviour of medication taking.
Protection Motivation Theory
The Protection Motivation Theory relates to decision making in the face of health threats. The
theory suggests that an individual will follow a prescribed behaviour if they are susceptible to
a threat, the threat is severe and the individual is fearful of the threat. This theory is
particularly relevant in encouraging preventative behaviours, such as condom use, and in
medication adherence where physicians can highlight the deleterious consequences of non-
adherence.
The Health Belief Model
The Health Belief Model suggests that personal beliefs and perceived susceptibility, severity,
benefits and barriers all combine to determine health behaviours (Rosenstock 1966).
Susceptibility refers to the subjective perception of personal vulnerability to a particular
health problem. Severity is the subjective perception of severity or dangerousness of a health
problem and its effects. Benefits are the perceived effectiveness of a range of interventions to
21
treat the health problem and barriers are the perceived negative aspects of a particular action
taken to reduce or eliminate the health problem. These beliefs are thought to be determined by
demographic factors and psychological characteristics. The model is most relevant to the
context of adopting preventing behaviours and stopping harmful behaviours.
Bosworth and Voil’s (2008) review found no evidence that the health belief model has
predictive validity in relation to medication adherence. There are studies, however, which do
suggest a correlation between dimensions of the health belief model and adherence in
schizophrenia. Budd et al (1996) found an association between beliefs around susceptibility
and adherence status. That is, those who did adhere to medication perceived themselves to be
more susceptible to relapse than non-adherers. Adams and Scott (2000) reported that
perceived severity of illness and perceived benefits of treatment explained 43% of the
variation in adherence behaviour.
The Self-Regulatory Model of Illness
This model is similar in concepts to those of the self-efficacy model. In a health behaviour
context, the model defines there to be three stages of self-regulation: representation of the
illness, development and implementation of a plan to cope with the illness and evaluation of
the coping mechanism. Individuals are thought to move from one stage to another, in no
particular direction. For example, an individual may have a coping mechanism, evaluate it to
be ineffective and therefore move back to the stage of development and implementation of a
new plan to cope with their illness. This model relates well to acute illnesses, where a
cognitive response to a threat to adherence is likely, but does not well explain sustained
behaviour in chronic diseases where immediate threats of impact on health are not
immediately experienced (for example, hypertension).
The Transtheoretical Model and the Precaution Adoption Model
The Transtheoretical and Precaution Adoption models define stages of behavioural changes.
The maintenance stage is only one stage of these. The advantage of these stages is in
understanding that the different stages of behavioural change differ significantly. For example
22
the factors that encourage a patient to begin to follow a prescribed behaviour may be very
different from those that encourage maintaining the behaviour in the long term. These models
assert that intervention to promote a behaviour should be specific to the stage the individual is
in.
The Self-Medication Hypothesis
The Self-Medication Hypothesis states that patients decide to start, adjust or stop prescribed
medication according to perceived health needs and that such decisions are conducted
intentionally and rationally, given the information available to the patients and their
understanding of their condition (Mitchell 2007). Mitchell (2007) asserts that there is
evidence that patients with a mental illness do interrupt or stop medication both intentionally
and unintentionally, based largely on how they are feeling, which partly supports the self-
medication hypothesis.
It is difficult to assess these theories in empirical analysis. One noted deficit of research of
adherence in patients with schizophrenia is that the developmental process of decision relating
to medication taking is not taken into account (Marland and Cash 2005). Alternative
approaches to understating medication taking have been suggested. Demyttenaere (1997)
discusses the relevance of considering a medical psychology approach to understand why
each individual patient, with his or her specific symptoms, relational context and therapeutic
alliance is or is not adherent. Within this approach, the theory of constraints asks the question
‘what constrains this patient from more effectively managing his or her condition?’
Weiden (2007) suggests a similar approach in defining a more flexible approach to adherence
theory that is more applicable to clinical practice. He suggests five theories regarding
medication adherence in patients with schizophrenia. These are:
(1) Adherence is not a clinical outcome and only matters as it interferes with outcome
(2) Adherence problems are often entangled with efficacy limitations of antipsychotic
medications
(3) Adherence can be viewed as a behaviour (taking/not taking) or as an attitude (prefers
taking/prefers stopping medication)
(4) When considering adherence attitudes, patient beliefs are always reality
23
(5) Adherence behaviour changes and fluctuates over time and should be considered part
of the illness.
The ambiguity arising from the application of these theories can be illustrated by considering
responses to the third of these theorems. If adherence is viewed as a behaviour, approaches to
improve adherence should address whatever logistic problems prevent patients from taking
their medications as prescribed. On the other hand, if adherence is viewed as an attitude, their
physician must seek ways to educate and convince the patient of the benefits of their
medication. As described by Weiden, non-adherence to medication in schizophrenia typically
is not both behavioural and attitudinal.
The theoretical models discussed set out to understand the factors that explain adherence-
related behaviours. These cover a range of adherent behaviours from preventative behaviours
to adherence during the maintenance phase of treatment in chronic illnesses and responses to
improve adherence. These models have led to successful strategies, primarily in the area of
eliciting healthy behaviours. But these changes in behaviours are often not maintained.
Models which further focus on the understanding the behavioural responses to being in the
maintenance phase of prescribed medications in chronic diseases are needed. Such models
will encourage the development of strategies of intervening to prevent maintenance phase
non-adherence before it occurs.
1.4.3 Prevalence of non-adherence in schizophrenia
Higher rates of non-adherence are likely in chronic diseases, such as schizophrenia, where
medication may be required to be taken indefinitely. Comparing non-adherence rates across
studies is difficult due to the range of methods used. For example, Cramer and Rosenheck
(1998) reviewed 24 studies in which the methods used to assess non-adherence included
patient interview, clinical assessment, urine or blood markers and pill counts, and found non-
adherence to range from 10 to 76%. The mean rate of non-adherence across these studies was
42%. Fenton et al (1997) reviewed 15 studies published between 1983 and 1996 which ranged
in the period over which they assessed non-adherence from one month to two years. They
found non-adherence to range from 24 to 88% with a median of 55%. A review by Lacro
24
(2002) found rates of non-adherence ranging from 4% to 72% with a mean of 41%. This
review is described in greater detail later in this chapter in an overview of factors associated
with non-adherence.
The use of depot injections of antipsychotics to reduce rates of non-adherence does not
eliminate the problem of non-adherence. A study by Kane (1996) found that one in five
patients relapsed when receiving long-acting depot injections. A meta-review of depot
antipsychotic drugs, based on studies observing in-patients and patients in the community,
found no statistically significant difference in relapse, attrition and adverse effects between
depot antipsychotics and oral antipsychotics (Adams, Fenton et al. 2001). This, however, may
be due to the fact that those patients participating in trials were required to be reasonably
compliant with oral medications, and thus the benefits of depot medications may be
underestimated as compared to studies that included patients likely to be non-adherent to oral
antipsychotics.
The rates of non-adherence in other chronic diseases are comparable to those observed in
schizophrenia. A mid 1990s study found that drugs for hypertension are discontinued within
six months by approximately 55% of patients in the UK (Jones, Gorkin et al. 1995). Non-
adherence rates for medication for rheumatoid arthritis have been estimated as being 64%,
with 24% of these being consistently non-adherent (Viller, Guillemin et al. 1999). Briesacher
et al (2008) recently reviewed US health care claims data to compare the rates of adherence
across seven conditions. They found that, based on the sum of each day’s supply of
medications, the rate at which patients missed 20% or more of their medication was 30% for
patients with hypertension, 50% for those with osteoporosis and 40% for those with type 2
diabetes. Non-adherence rates of between 0-60% have been found in a review of studies of
adherence in patients with rheumatoid arthritis (Harrold and Andrade 2008). For patients
taking antibiotics, a 50% non-adherence rate has been reported (Ley and Llewellyn 1994).
Rates of non-adherence vary widely in depression, likely in part because the illness can be
present over a short or long term. Recent evidence estimates the six month non-adherence rate
of patients taking SSRIs to be approximately 40-60% (Nemeroff 2003; Sheehan, Eaddy et al.
2005; Cantrell, Eaddy et al. 2006).
25
1.5 Factors associated with non-adherence
Several factors are thought to contribute to non-adherence in patients with schizophrenia. For
example, the type of medication is thought to be important due to differences in the nature of
side effects associated with each. The older generation of antipsychotic medications, the so-
called ’typicals’, elicit the following side effects: Parkinsonian side effects (including tremor,
hypersalivation), akinesia (slowing of movements), acute dystonic reactions (characterised by
dramatic muscle spasms), akatgusua (characterised by an inner subjective restlessness),
tardive dyskinesia (a movement disorder), anticholinergic side effects (including dry mouth
and constipation), diminished sexual function and weight gain (Bentall, Day et al. 1996). The
newer antipsychotic medications reduce neurological problems commonly experienced with
typicals, but many of the other side effects, such as weight gain and sedation are common to
both classes of antipsychotics (Fleischhacker 2002).
Fenton et al (1997) categorise the range of factors affecting adherence into patient-related,
medication-related, environmental factors, and psychodynamic considerations. They identify
patient-related factors as: demographic characteristics such as gender and ethnicity, illness
characteristics such as age at onset and duration of illness, illness severity and subtype (e.g.
paranoid schizophrenia), cognition or memory, insight, other health beliefs (i.e. attitudes
towards medication), subjective well-being, and alcohol and drug use. The medication-related
factors reviewed were side effects, dosage, agent, route, and complexity of regimen.
Environment factors considered were: family and social support, practical barriers (e.g.
financial burden prevented patient from filling prescription), physician-patient relationship,
attitude of staff, interventions, reinforcement, education, and memory enhancement.
Psychodynamic considerations include: psychological meaning (e.g. feelings about the role of
authority and control in the prescribing of medications), psychological homeostasis (e.g.
relationship between delusions and self-image), and transference/countertransference (i.e.
attitudes towards the prescriber as an authoritarian figure).
There is uncertainty as to the impact that cognitive impairment, a symptom of psychotic
illness, may play in non-adherence in patients with schizophrenia (Buchanan 1996).
Pinikahana (2005) points out that non-adherence rates with medicines for general medical
conditions such as diabetes and arthritis, and antibiotics, which do not impair cognitive
26
function, have similar rates of non-adherence as those observed in patients with
schizophrenia.
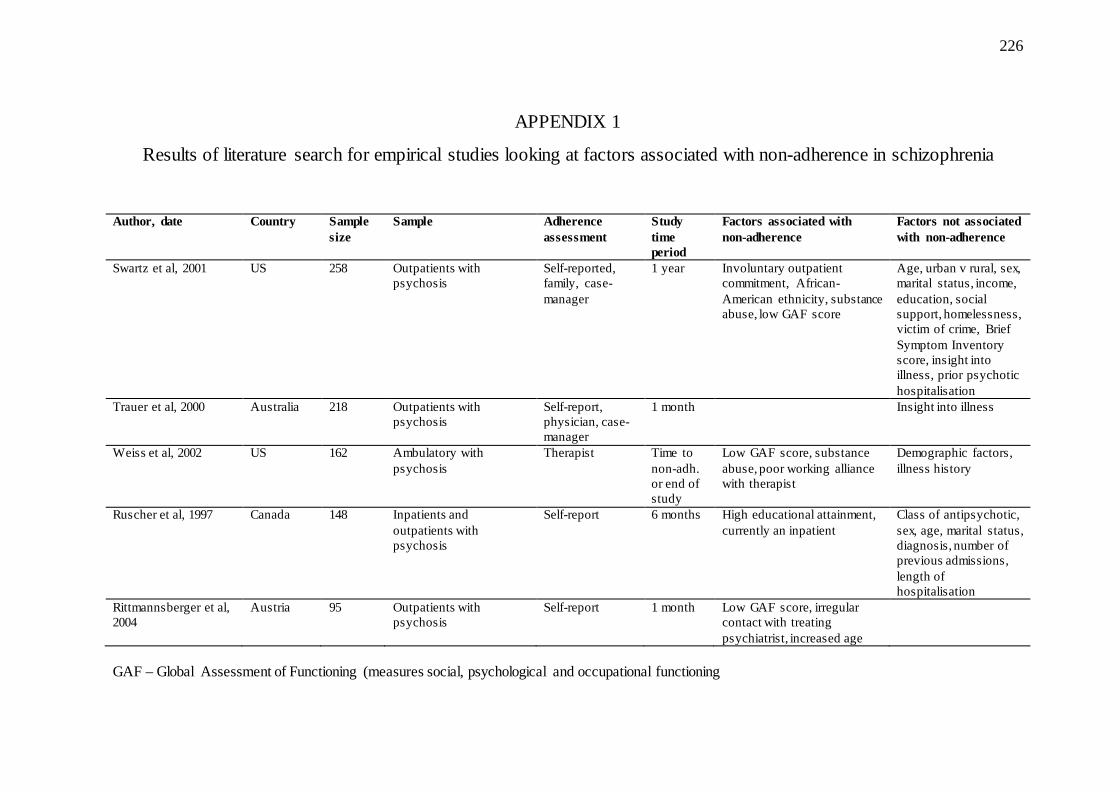
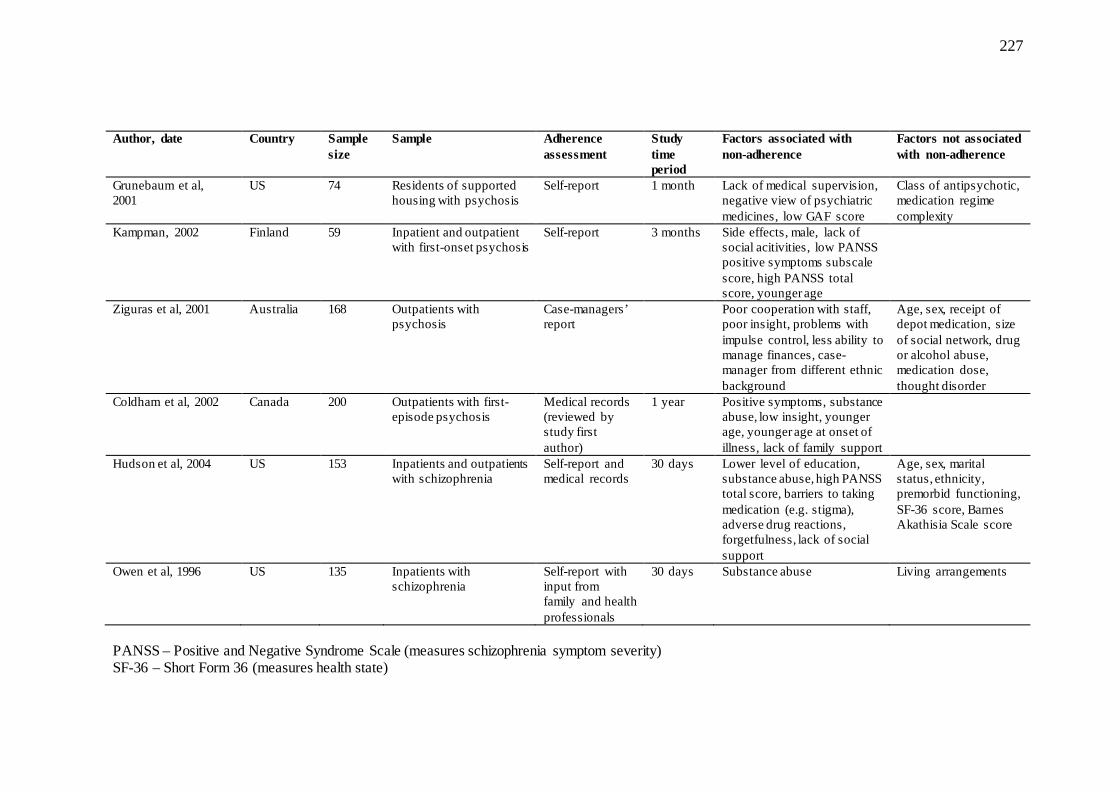
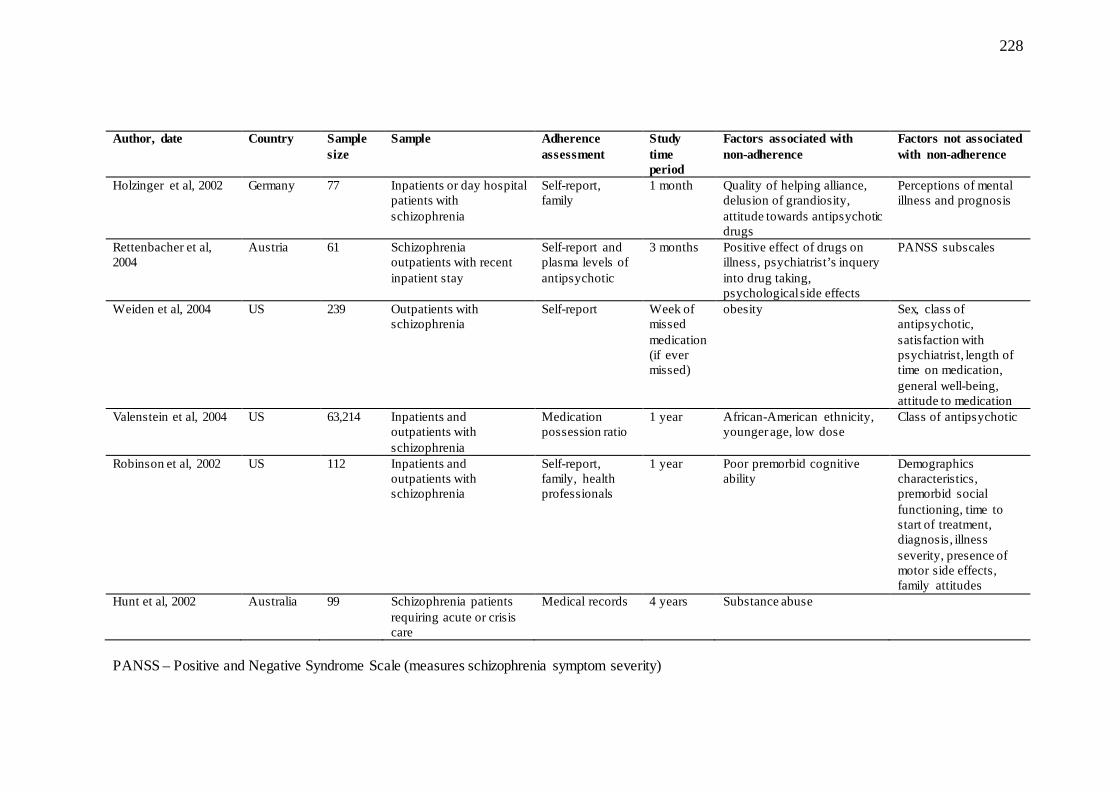
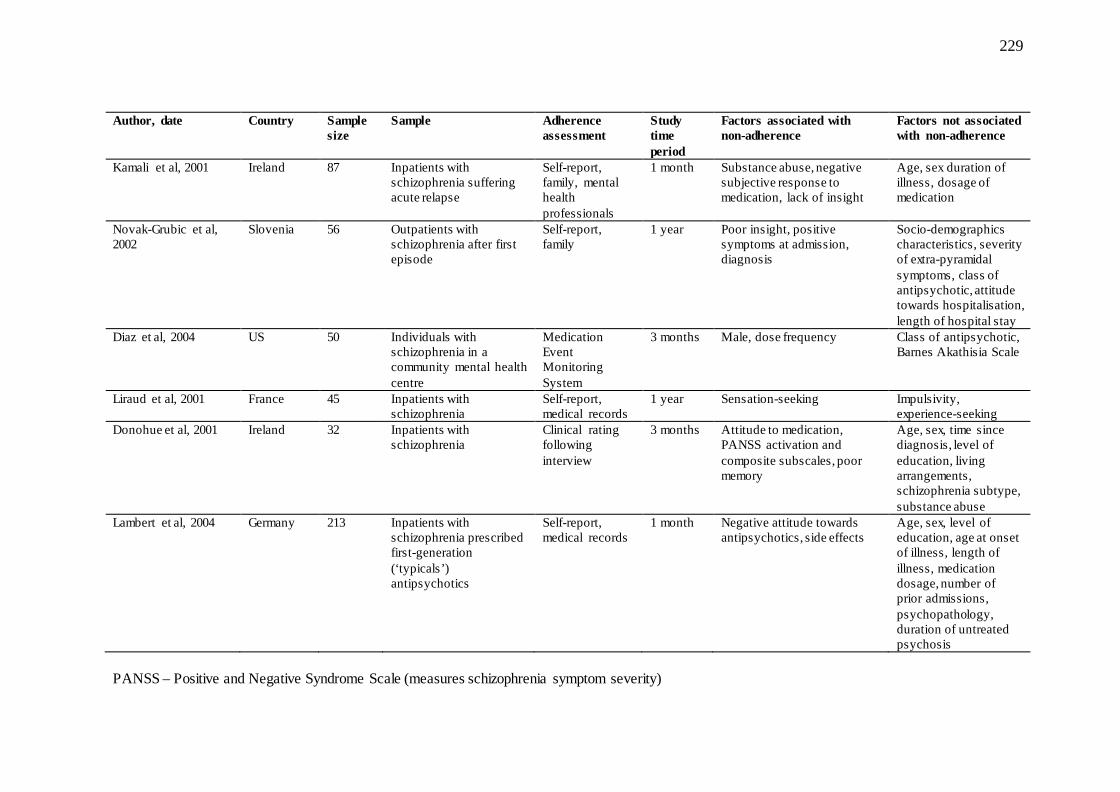
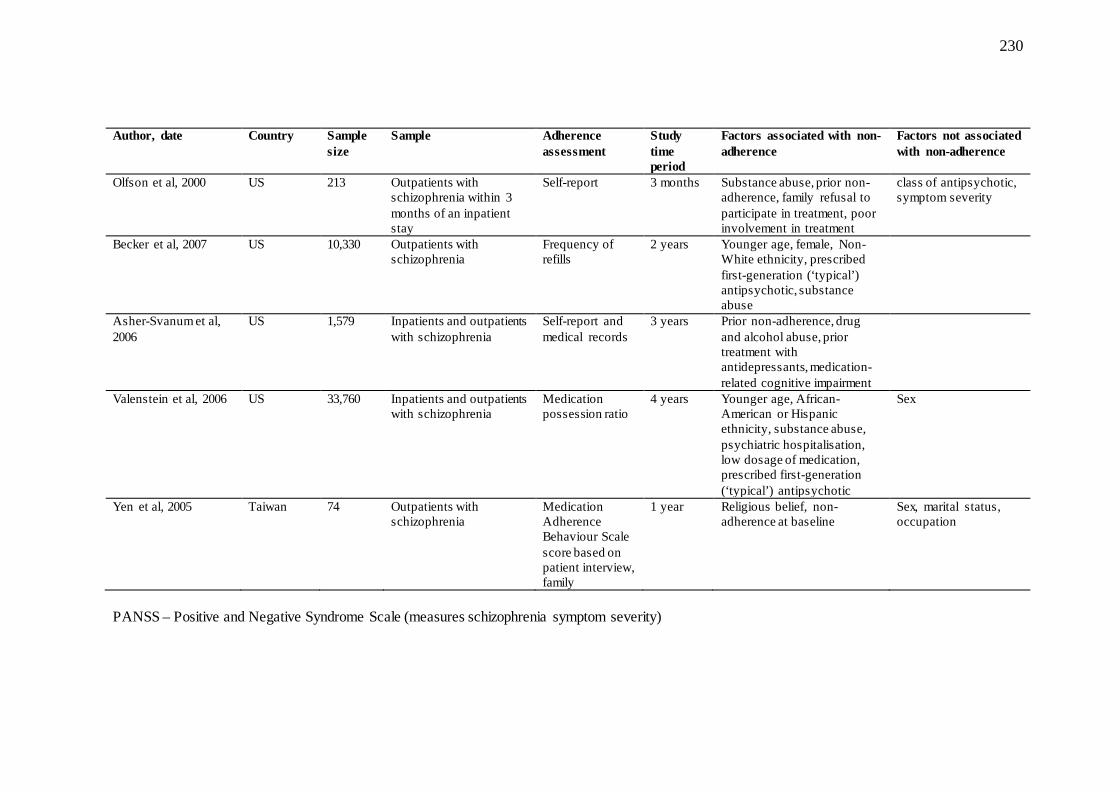
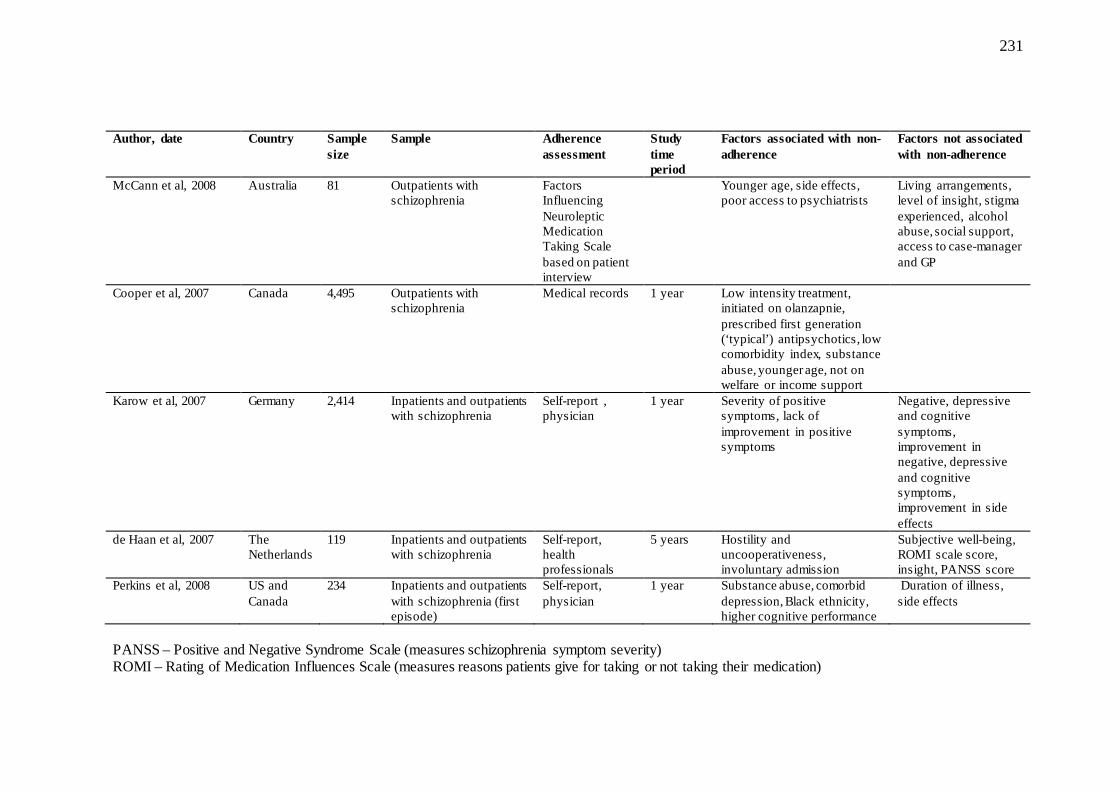
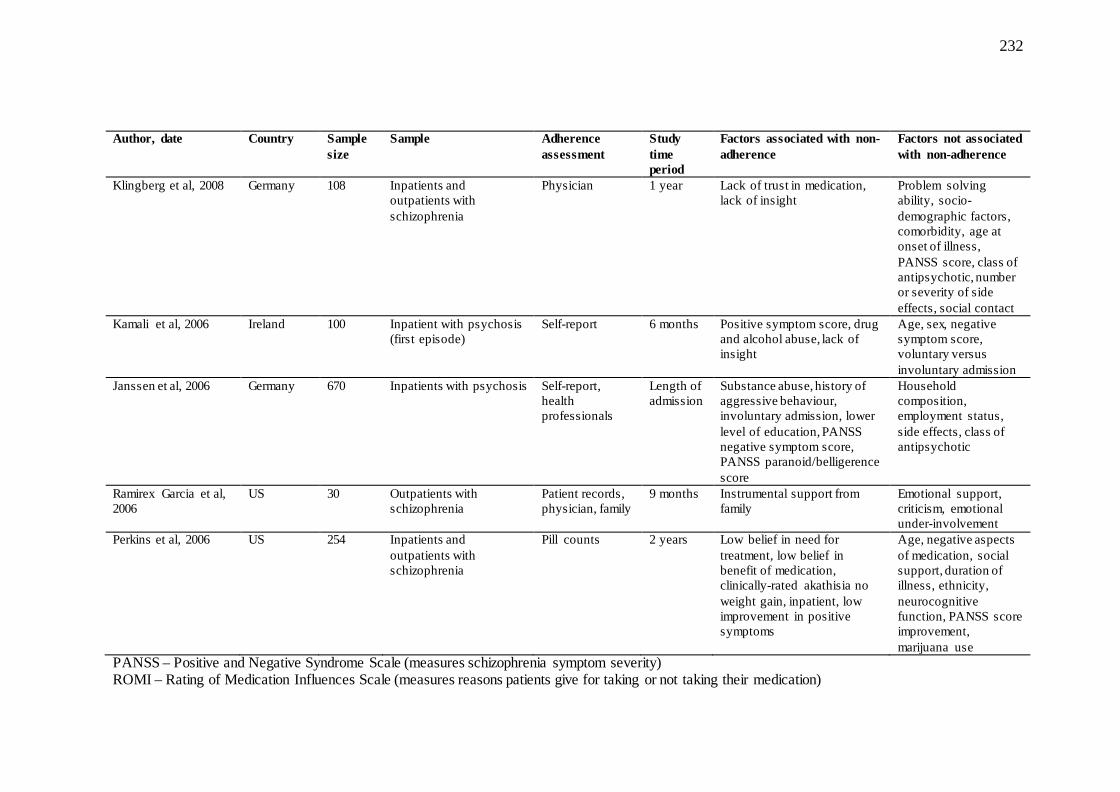
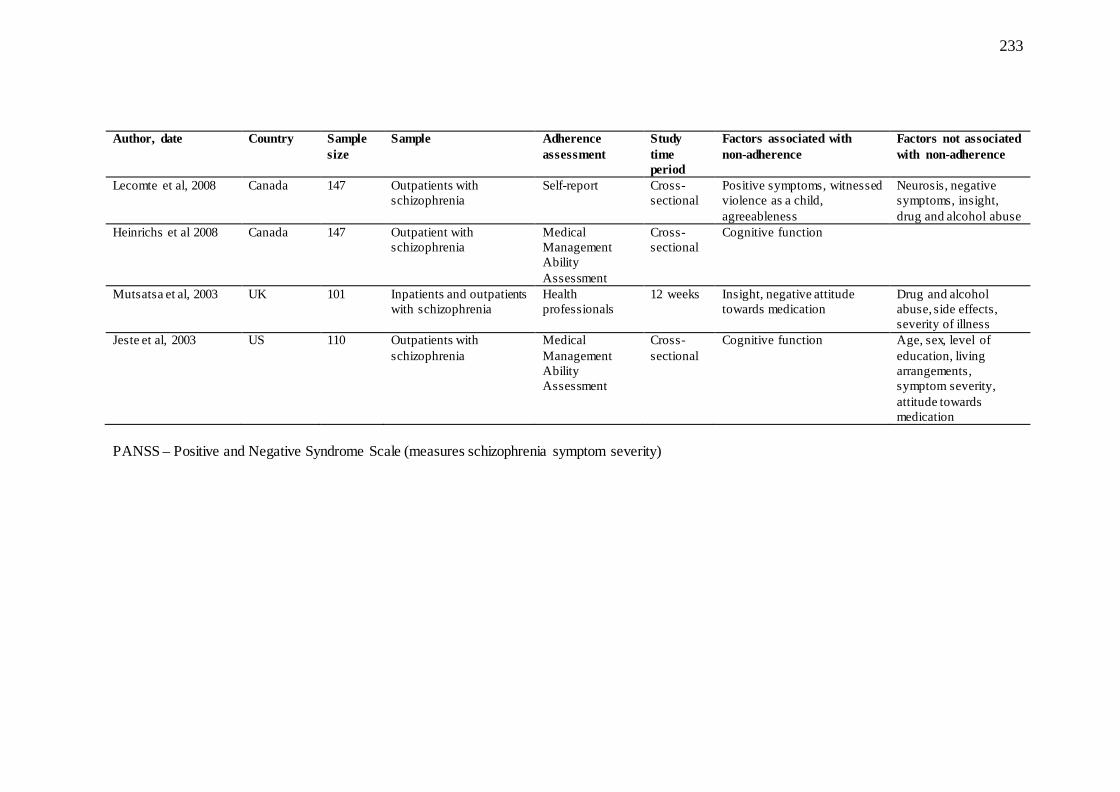
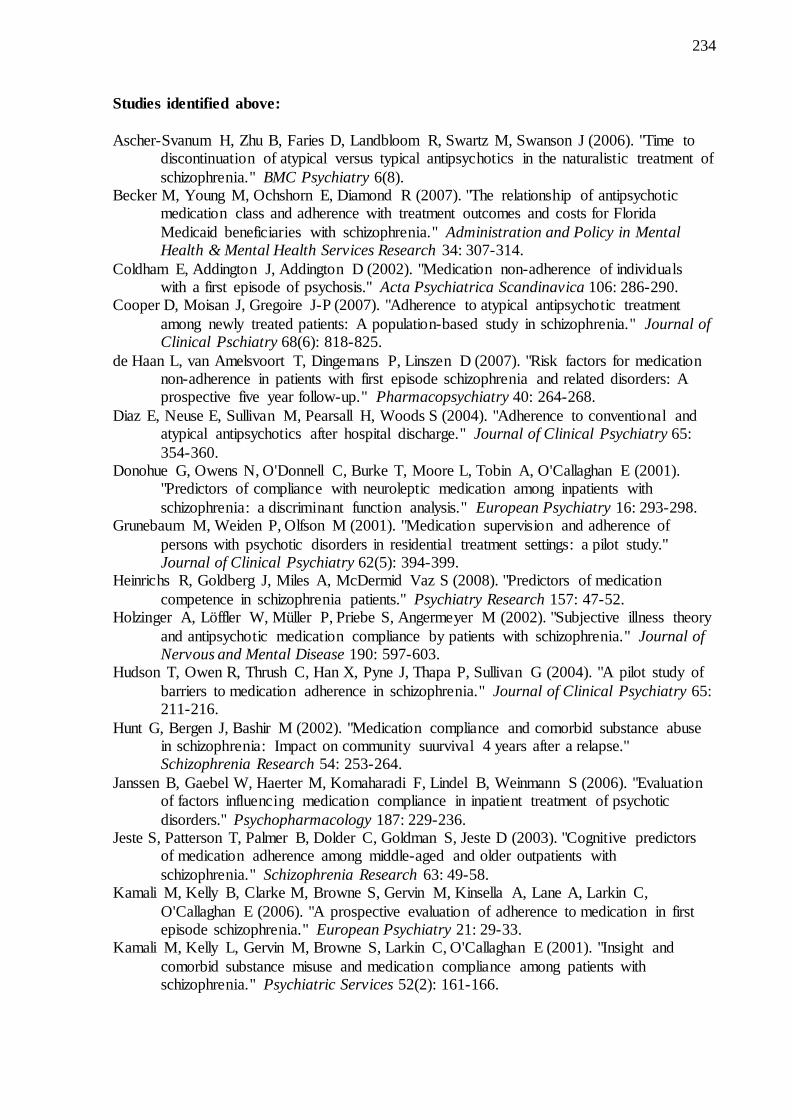
To identify previous empirical studies assessing factors associated with adherence, structured
searches in MEDLINE and PsychInfo were run using the search terms ‘(antipsychotic or
psychosis or psychotic) and (adherence or compliance)’ to identify relevant empirical studies.
The initial search was restricted to studies published in 2000 or later. Other studies were
identified by reviewing the references from an initial selection of studies. The literature search
identified five reviews. Empirical studies identified by the search and included in one of the
reviews were not considered on their own so as to avoid double counting. The search
identified 43 empirical studies in addition to the four reviews. From each of the identified
studies, information was extracted on the date, location, sample size, sample characteristics
(whether patients were inpatients, outpatients or both; and whether they had experienced
psychosis or diagnosed as schizophrenic), method of assessing non-adherence, factors found
to be significantly associated with non-adherence, and factors found not to be associated with
non-adherence. The factors included in the empirical analyses are based on these variables
previously considered in this literature. These studies are listed in appendix 1.
1.5.1 Heterogeneity of methods
The samples under observation across the studies differed along several dimensions. In
particular, treatment settings, diagnoses, method of non-adherence assessment, and the length
of time over which non-adherence was assessed differed across studies. A majority of the
studies sampled patients with schizophrenia and schizophrenia-related illnesses. The
remainder, along with the reviews, defined their samples more broadly, by looking at patients
with psychosis.
The length of time over which adherence status was assessed in the previous studies ranged
from one month to five years. Assessment of non-adherence was by a range of methods: self-
report, medical records, and clinical assessment. As in the Psychiatric Morbidity Surveys
(PMS), which I use later in this thesis to support new empirical analyses, in 11 of the 43
empirical studies, the assessment of adherence relied exclusively on self-reported information.
In a further fourteen, self-reported information was combined with the opinions of a family
27
member, a treating physician or a case-manager. Additional information may be helpful, but
may also be problematic. Kampman et al (2001) found only a 0.50 correlation in adherence
assessments between patients and doctors. Also, the investment in finding a successful
treatment may bias the opinion of physicians (Diaz, Levine et al. 2001).
It would appear that few studies corroborate self-reported adherence with pill counts or
physiological data (Zygmunt, Olfson et al. 2002). These methods were used in only five of the
40 empirical studies reviewed. All measures of adherence have their drawbacks (Thompson,
Kulkarni et al. 2000; Coldham, Addington et al. 2002; Osterberg and Blaschke 2005), but
only self-report will be feasible in a large scale survey. The methods used in empirical
analysis of the factors associated with non-adherence in patients taking antipsychotics are
discussed in more detail in the following chapter.
The heterogeneity of results from previous studies may also be due to changes in treatment
regimes across time and location. The newer atypical antipsychotics have been shown to be
associated with different profiles of side-effects (Geddes, Freemantle et al. 2000), and this
may influence the association between side effects and non-adherence. A trend towards lower
non-adherence in patients receiving atypical medications has been observed elsewhere
(Olfson, Mechanic et al. 2000; Sartorius, Fleischhacker et al. 2002). Chapter 3 of this thesis
examines trends in prescribing in schizophrenia in greater detail.
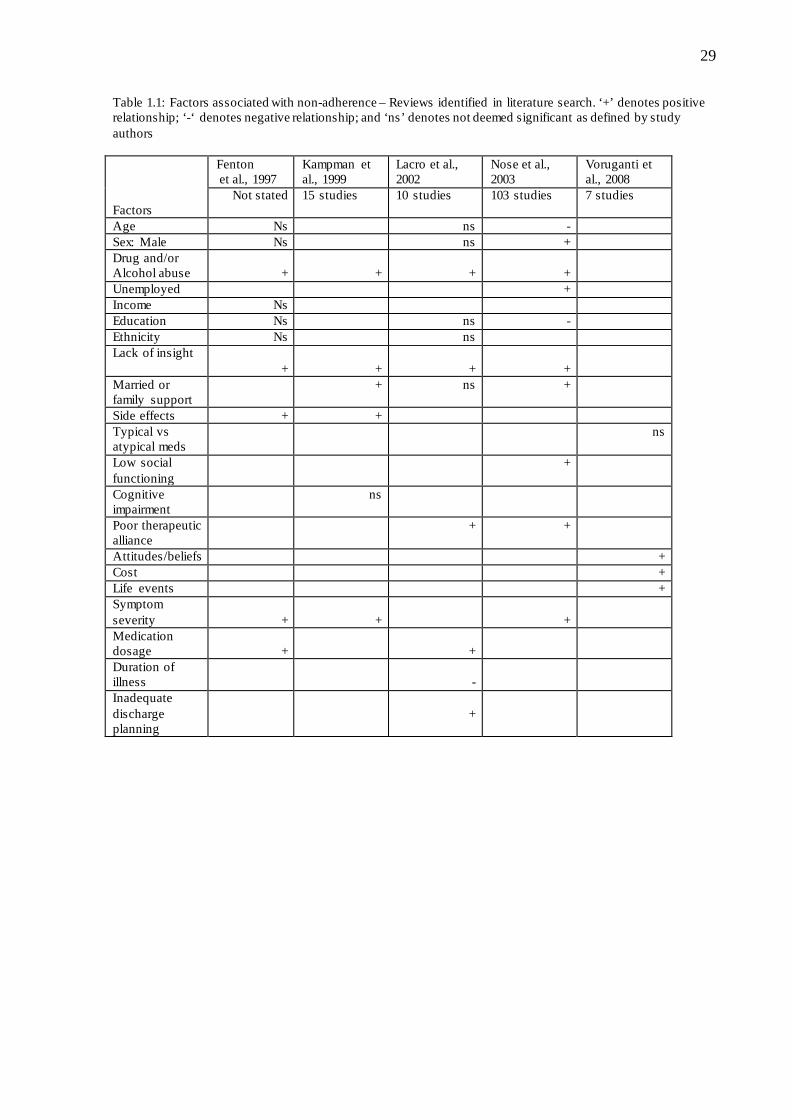
1.5.2 Summary of findings
The literature search yielded five reviews of studies empirically assessing factors potentially
associated with non-adherence (see Table 1.1; (Fenton, Blyler et al. 1997; Kampman and
Lehtinen 1999; Lacro, Dunn et al. 2002; Nose, Barbui C et al. 2003; Voruganti, Baker et al.
2008). The studies were published between 1997 and 2008. The method by which the authors
of the reviews attributed significance to factors based on the results across the studies differed
markedly. For example, Lacro et al (2002) determined the key factors to be those identified as
being statistically significant in 50% or more of the studies included in the review. Voruganti
et al (2008) on the other hand, did not explicitly state their criteria for assessing the balance of
evidence on the influence of factors on non-adherence but appear to base this on significance
observed in the vast majority of the studies included in their review.
28
Despite the limitations in comparing assessments across the reviews, the findings do reveal
some consistencies (Table 1.1). Drug and/or alcohol abuse and lack of insight were identified
as key factors in four of the five reviews. In the one review where lack of insight was not
mentioned, patient attitudes and beliefs, which may be comparable to lack of insight, was
deemed to be significantly associated with non-adherence. In three of the five
reviews symptom severity was identified as a key factor in association with non-adherence to
medication.
Unlike the evidence reviewed by Voruganti et al (2008) there is some evidence of a greater
risk of non-adherence with typicals relative to atypicals. The evidence, however, is not
unanimous. This may be due to the fact that the range of experience of side effects within
medication type may also differ. Olfson et al (2000) report improved adherence within three
months of discharge for those patients prescribed an atypical antipsychotic, though other
evidence that looked at adherence over the previous year did not show this relationship. A US
study by Dolder et al (2002) compared non-adherence rates in haloperidal and perphenazine
(typicals) with risperidone, olanzapine and quetiapine (atypicals) over a 12 month period and
found no significant associations between non-adherence and type of antipsychotic or
between adherence and age, gender, ethnicity or diagnosis. A study conducted in Spain
comparing olanzapine (an atypical) with risperidone (an atypical) and haloperidol (a typical)
found that non-adherence, as measured subjectively by the treating psychiatrist, was
significantly lower in patients taking olanzapine relative to risperidone and haloperidal
(Garcia-Cabeza, Gomez et al. 2001).
A large US study of Medicaid recipients in Florida found that the class of antipsychotic, age,
sex, ethnicity and substance misuse were all associated with adherence rates over a 2-year
period (Becker, Young et al. 2007). Those prescribed atypical antipsychotics were found to
have higher adherence rates as compared to those patients prescribed typical antipsychotics.
Higher rates of adherence were observed amongst patients in the higher age groups, and
among men, those of White ethnicity and those without co-occurring substance misuse.
29
Table 1.1: Factors associated with non-adherence – Reviews identified in literature search. ‘+’ denotes positive relationship; ‘-‘ denotes negative relationship; and ‘ns’ denotes not deemed significant as defined by study authors Factors
Fenton et al., 1997
Kampman et al., 1999
Lacro et al., 2002
Nose et al., 2003
Voruganti et al., 2008
Not stated 15 studies 10 studies 103 studies 7 studies
Age Ns ns - Sex: Male Ns ns + Drug and/or Alcohol abuse
+
+
+
+
Unemployed + Income Ns Education Ns ns - Ethnicity Ns ns Lack of insight
+
+
+
+
Married or family support
+ ns +
Side effects + + Typical vs atypical meds
ns
Low social functioning
+
Cognitive impairment
ns
Poor therapeutic alliance
+ +
Attitudes/beliefs + Cost + Life events + Symptom severity
+
+
+
Medication dosage
+
+
Duration of illness
-
Inadequate discharge planning
+
30
A recent study in Brazil, utilising structured and semi-structured survey questions, asked
patients to identify the motivations for their medication-taking behaviour (Rosa, Marcolin et
al. 2005). The authors used the Rating of Medication Influences scale to assess the
backgrounds of patients and their attitudes towards their medications. The main reason for
maintaining adherence to medication was ‘perceived day-to-day benefit’. This was identified
by 88% of patients. Forty percent of patients felt there was no reason for non-adherence,
while ‘inconvenience of side-effects’ was identified by 36% of patients.
A novel study by Marland and Cash (2005) used qualitative methods to get at the reasons why
patients with schizophrenia did not adhere to medication. They found that medication taking
decision-making in schizophrenia is not unique, though there may be particular difficulties
associated with the illness that make it difficult for patients to progress through
developmental patterns to a perceived optimum position which balances the benefits and
disadvantages of medicine taking. These stages may include the ‘experimental-reflective’
stage which involves patients experimenting to optimize the balance between quality of life
and the consequences of medication taking; and the ‘direct-reactive decision making’ stage
which is reflected by difficulty linking discontinuation of medication with its consequences.
Patients may also be ‘deferential-compliant decision makers’. These patients defer decisions
about medication taking to their physician and will do whatever their physician tells them is
best. Results suggest that adherence is more strongly established for those patients who go
through the ‘experimental-reflective stage’ as compared to those whose decision making is
‘deferential-compliant’. Further, the authors found that schizophrenia patients who experience
a ‘direct-reactive’ stage will do so for a longer period of time as compared to patients with
asthma or epilepsy. This may be due to the delay in the onset of adverse consequences of non-
adherence and/or impaired cognitive insight which is characteristic of schizophrenia.
Rummel-Kluge et al (2008), while not conducting empirical analysis considering how factors
associated with non-adherence interacted with each other, did conduct a large survey of
psychiatrists in Germany to determine the factors they thought most related to non-adherence.
A total of 669 psychiatrists participated. Each was asked to evaluate the compliance in ten
consecutive patients over a ten day period. Due to some of the psychiatrists not completing
the survey for a full ten patients, a total of 5,729 patients were assessed in the survey. The
psychiatrists judged a lack of insight into the need for prophylactic medication, a lack of
31
insight/denial of illness and embarrassment at taking medication every day to be the factors
most strongly contributing to non-adherence.
1.6 The economic impact of non-adherence
In addition to the clinical and quality of life effects attributable to non-adherence, there are
substantial resource implications in the form of higher service use levels and costs that result
from non-adherence. To assess the evidence relating to costs attributable to non-adherence in
patients with schizophrenia, a search of PubMed was conducted using the medical subject
headings ‘patient compliance’, ‘schizophrenia’ and ‘cost or cost analysis’. The search
identified 26 studies. A search of PsychINFO within the Bath Information and Data Services
using the search terms ‘(‘cost’ OR ‘cost analysis’) AND (‘adherence’ OR ‘compliance’) AND
(‘schizophrenia’ or ‘antipsychotic’)’ identified a further 26 studies. The criteria for inclusion
of studies in this review were that a study (i) either attempted to approximate the cost of
services or resource use, or reviewed studies that did; and (ii) undertook an evaluation of the
impact of non-adherence on the cost of services or use of services. These criteria identified
eight relevant studies.
Weiden and Olfsen (1995) estimated that non-adherence accounts for approximately 40% of
rehospitalisation costs for patients with schizophrenia in the two years after discharge from in-
patient treatment. Meta-analyses of data from a number of countries concluded that a 50%
improvement in adherence would decrease one-year rehospitalisation rates by 12%. The
authors based their analysis on data from the US National Institute of Mental Health 1986
Client/Patient Sample Survey and published estimates of the rate of non-adherence reported in
published prospective studies. Their analysis included an estimate of the hospital cost burden
resulting from non-adherence. This cost was estimated at US$705 million in the first two
years following discharge from hospital for an acute schizophrenia admission.
Loosbrock et al (2003) used an US employer claims database to compare the costs of patients
with continuous antipsychotic treatment to those who had gaps in medication over the course
of a year. Patients with gaps in medication of less than two weeks over the course of the year
32
had significantly lower costs than those with less than 250-days exposure to antipsychotic
medication during the year.
A study by Svarstad et al (2001) based non-adherence assessment on whether or not patients
picked up their prescribed medication at a pharmacy. They observed that those patients
deemed to be have irregular medication use had approximately US$1,700 higher mean annual
hospital costs than the regular medication users. This difference was statistically significant.
A significance association between non-adherence and direct medical costs was also observed
by Glazer and Ereshefsky (1996). They used published estimates and clinical experiences
judgements of non-adherence rates to compare various antipsychotic medications in the
outcome of costs associated with relapse.
Theida et al (2003) performed a review that sought to identify studies that looked at
compliance, relapse, and economic costs. Their review identified five studies that ‘either
estimated the direct cost-benefit from improved levels of drug compliance in schizophrenia or
attempted to bring explicit measures of compliance levels into an overall economic
consideration of antipsychotic drug therapy’. Two of the five studies they identified were not
picked up by the search performed for this thesis. However, neither of these studies explicitly
considered the effect of non-adherence on costs. A US based study by Palmer et al (1998)
considered discontinuation of medicine due to adverse effects or a lack of response, while
Davies et al (1998) considered dropout rates as a proxy for non-adherence.
A large US-based study by Weiden et al (2004) observed that measures of partial adherence
suggested that there is a direct link between the proportion of medication missed and the
probability of rehospitalisation in a sample of patients with schizophrenia. They found that
even gaps in medication taking of 1 to 10 days over a one year period were associated with
twice the odds of hospitalisation. Their analysis indicated that the greater the level of non-
adherence along a continuum, the greater the risk of rehospitalisation. These results were
consistent across methods of assessment of partial adherence.
Another large US study of Medicaid recipients that examined the impact of the degree of
adherence on health, social care and criminal justice costs through a series of one-way
analyses of variance found that, in separate analyses looking at patients prescribed typical or
33
atypical antipsychotics, higher total costs were significantly associated with lower rates of
adherence (Becker, Young et al. 2007).
Eaddy et al (2005) studied the resource use implications of non-adherence for a group of
patients with schizophrenia or bipolar disorder. Patients were judged to be partially adherent,
where the degree of adherence was estimated as the ratio of the total days for which
reimbursement of prescribed therapy was claimed to 365 days (the length of the period under
study), if they had claims for less than 80% of days during the year. Partially adherent patients
were significantly more likely to have had an inpatient hospitalisation during the study period.
1.7 Policy relevance of the analysis
The results and conclusions drawn from my analyses have potential relevance for a range of
policies and so, potential implications for patients, their health professionals and the health
care system.
The analysis of factors associated with non-adherence and a discussion of whether or not the
results of this analysis are consistent with theoretical models explaining non-adherence will
be beneficial to identify those initiatives, be they clinical or behavioural, that are likely to
assist patients in being more adherent to their antipsychotic medication. It will also identify
those areas for further research which will further illuminate the factors behind non-adherent
behaviour.
Current policy responses to non-adherence include patient-centred compliance therapy and
behavioural training, family behavioural therapy, and community-based interventions that
provide strong and supportive social networks, close monitoring of clinical status and
provision of stable housing (Kuipers 1996; Zygmunt, Olfson et al. 2002). Therapies which
develop relationships between patients and therapeutic staff are also effective in improving
compliance (Kuipers 1996). Interventions that are successful in reducing non-adherence rates,
including new medications, will have considerable benefits for patients, their families, and the
health and social care systems.
34
For NICE, the body within the UK health care system entrusted with evaluating the cost-
effectiveness of antipsychotic medication and making recommendations about their use, this
thesis provides data on another aspect of costs that could potentially be included in
evaluations. The thesis estimates the potential savings that may arise from reductions in health
and social care service use costs attributable to improvements in adherence. Hughes et al
(2001) highlight the need for more information on the consequences of non-adherence to
allow economic evaluation to reflect their potential impact and my thesis identifies some of
the issues involved in attempting to do this with antipsychotic medication.
These issues will also have relevance for health professionals who treat individuals with
schizophrenia in providing them with information that they can use, in addition to clinical
information and their clinical judgement, in making prescribing choices.
1.8 Hypotheses and research questions
The theoretical models that have been put forward to describe the process of adhering to
recommended health behaviours cover the prevention of illness and initiation of treatment as
well as, to a lesser extent, the management of illness. Here my interest in non-adherence to
medication is on this latter phase. Based on these theoretical models and the reviewed
literature, my research hypotheses are as follows:
1. Where adherence to medication is driven by attitudinal factors, the degree to which an
individual feels threatened by the consequences of non-adherence, reflected by the
severity of their illness and their level of insight into their illness, is a key factor in
encouraging adherence.
2. For some individuals, medication-taking behaviour is primarily the result of external
factors that either encourage or discourage adherence. Here I include social support
and the support of health care professionals as encouraging factors and the presence of
drug or alcohol abuse and the experience of side effects as discouraging factors.
3. In individuals taking antipsychotic medication, non-adherence to medication is likely
to be associated with higher health and social care service use costs due to the
worsening of symptoms associated with discontinuation of medication.
35
The thesis aims to test these hypotheses by establishing which factors contribute to non-
adherence, examining the pattern of health care service use associated with non-adherence
and estimating the costs associated with non-adherence in schizophrenia.
In attempting to explore the relationships between non-adherence, resource use and costs, and
other factors, it is likely to be the case that these relationships are specific to the type of
medication that has been prescribed. In order to better understand these relationships in
individuals taking antipsychotics, it is necessary to determine how these relationships differ in
this patient population as compared to non-adherence to other medications. To facilitate this
comparison, analyses will be conducted to determine the nature of the relationships between
non-adherence to antidepressant medication, resource use and costs, and other factors. The
results of these analyses will allow me to draw conclusions as to the impact of non-adherence
to medication that is specific to those individuals prescribed antipsychotics.
Questions to be addressed
At what rate is treatment with antipsychotic medications discontinued and how is this linked to
the experience of side effects?
Once discontinuation of antipsychotic medication occurs, what are the implications for how
health care resources are used and at what cost?
What factors impact on the relationships between non-adherence to antipsychotic medications
and resource use and costs and are these factors specific to this patient population?
1.9 Thesis structure
A brief outline of the structure of the remainder of the thesis is as follows:
Chapter 2 will present and justify the methods used in the research. The methodological foci
are (i) data sources; (ii) defining patients (iii) measuring non-adherence; (iv) costing methods;
and (v) statistical analyses.
36
Chapters 3 and 4 will address the research question of the nature of the associations between
non-adherence, service use, and costs. Chapter 3 will present results from analysis of the
1993/4 Psychiatric Morbidity Surveys (PMS). Chapters 4 will build upon the previous
findings by assessing the associations over time. This involves analysis of data from the
Quality of Life following Adherence Therapy for People Disabled by Schizophrenia and their
Carers (QUATRO) study, a multi-national randomised controlled trial which evaluated an
adherence therapy intervention for people with schizophrenia.
Chapter 5 will compare the significance of non-adherence in schizophrenia and depression.
Analysis of the 2000 PMS analysis will provide the context for assessing the potential for
containing costs given the nature of the association between non-adherence and costs. It will
determine if the costs attributable to non-adherence, and therefore the potential savings, differ
across the two illnesses.
Chapter 6 will summarise the findings and present the policy implications of the findings in
the context of current UK mental health policy. Conclusions will also be presented.
37
Chapter 2
Methods and data
In this chapter I aim to set out the methods used to address the research questions in the
empirical analyses contained in this thesis. A range of methodological issues are discussed.
These include the method used to define a sample, the potential options for measuring non-
adherence and costing methods. I then briefly describe the datasets that were used in the
analyses, indicating key features of each. In discussing the methodological issues of the
analyses, reference is made to the literature search described in the introductory chapter. The
last part of the chapter is a description of common statistical analytical methods that arise in
each of the empirical analyses.
In looking at the relationship between non-adherence and service use costs, the aim was to
conduct empirical research based on nationally representative UK data which used a fully
robust measure of adherence and collected a broad range of data on health and social care
service use and other potential costs such as informal care, time off work and criminal justice
costs. By using nationally representative data, the results of the analyses would be relevant
within a public health context (Boslaugh 2007). To date, much of the research describing the
impact of non-adherence in schizophrenia is based on local data (Thieda, Beard et al. 2003). It
would also be advantageous to use longitudinal data as these would provide clearer evidence
as to the nature of associations between the variables of interest. The resources required to
undertake primary data collection in this way would be quite substantial and thus the obvious
choice was to use previously collected data that contain as much of the relevant information
as possible.
2.1 Defining a sample
This thesis sought to identify samples of patients who were diagnosed as having
schizophrenia and were taking antipsychotics. In identifying patients, those with
schizoaffective disorder were also included. Henceforth, the single diagnosis label of
38
schizophrenia will be used to refer to patients with either schizophrenia or schizoaffective
disorder.
A majority of the studies identified in the literature review sampled patients with
schizophrenia and schizophrenia-related illnesses. The remainder, along with the reviews,
defined their samples more broadly, by looking at patients with psychosis. In reviewing data,
it is apparent that in some cases diagnostic information is not available, incomplete or
identified the primary diagnosis only. It is therefore difficult, in some cases, to confirm what
proportion of patients had a diagnosis of schizophrenia. Therefore, identifying and including
those patients who were prescribed antipsychotic medication at the time they were recruited
into the study seemed to be the most appropriate method for defining a relevant sample in my
analysis, rather than relying on diagnostic data. The majority of these patients will have
schizophrenia or have experienced a psychotic episode. Others will have a primary diagnosis
for another mental illness, such as bipolar disorder, for which antipsychotic medications are
now prescribed.
The physician practice of prescribing a drug or medical device for a purpose different from
one of the indications for which the product is licensed is referred to as off-label prescribing.
Off-label prescribing has taken place with antipsychotics for many years, although it is
difficult to determine when it commenced. Antipsychotics are also now licensed for use in
treating bipolar disorder (NICE 2006). Using data from 1994 to 2001 from the UK, Hodgon
and Belgamar (2006) looked at the rate of off-label prescribing of atypical antipsychotics
within patients in secondary care. They found that, averaged over the study period, just under
60% of their sample had a diagnosis of schizophrenia or schizophrenia affective disorder.
Based on ICD-10 diagnosis codes, 18.4% of patients prescribed atypical antipsychotics had a
diagnosis of a mood disorder (bipolar disorder is one of the mood disorders), 12.4% an
organic mental disorder diagnosis and 4.0% were diagnosed as having a personality disorder.
Analysis of data from a population-based study in the Canadian province of Manitoba found
that the proportion of patients who were prescribed an antipsychotic and had a diagnosis of
schizophrenia declined from 65% in 1996 to 42% in 2006 in the 19 to 35 year age group and
from 63% to 58% between 1996 and 2006 in the 36 to 65 year age group (Alessi-Severini,
Biscontri et al. 2008). Medical and hospitalisation files were used to identify diagnoses in this
study. A US study of non-institutionalised antipsychotics users observed that in 1996-1997,
8% reported having a mood disorder without comorbid schizophrenia, and this rate rose to
39
22% by 2004-2005 (Domino and Swartz 2008). Throughout the study period, approximately
18% of antipsychotic users reported having anxiety spectrum disorders without schizophrenia
or mood disorders. Generally, estimates of off-label prescribing are difficult to obtain as it is
often not recorded in a patient’s notes and is associated with increased liability for physicians
(Hodgson and Belgamwar 2006). The dataset used in my analysis - which does not
specifically identify individuals based on a diagnosis of schizophrenia - was from interviews
that took place in the early 1990s and the data above suggests that at that time the majority of
individuals prescribed antipsychotics would have a diagnosis of schizophrenia.
In the UK it is now the case that the majority of patients with schizophrenia receive care in
the community (Mangalore and Knapp 2007). Several previous studies which assessed non-
adherence to medication in patients with schizophrenia restricted their samples to inpatients
only. Of the studies identified in the literature review reported on in chapter one, eight of 48,
or 17% of studies, included inpatients only. The datasets analysed in this thesis either
included both inpatients and outpatients or focused on outpatients only. Secondary analyses
included homeless individuals.
2.2 Measuring non-adherence
Different options exist for assessing adherence. These include objective measures such as pill
counts, prescription renewals, blood tests, or medication markers. Alternatively, assessments
of adherence may be asked of patient or their clinicians. No method is without its limitations,
however (Cramer and Rosenheck 1998; Thompson, Kulkarni et al. 2000; Diaz, Levine et al.
2001; Kampman, Lehtinen et al. 2001; Coldham, Addington et al. 2002). Pill counts may not
detect alternating under- and over-use of medication or discarding of pills and will not capture
variations in the timing and duration of missed dosages (Hughes, Bagust et al. 2001).
Relying on prescription renewal information will be effective only if patients use a single
source for filling their prescriptions, and if there is a system in place to record all changes in
medication and dosage. Blood tests may be misleading as plasma levels can vary widely
among patients taking the same dose, and taking doses a few days before a test raises drug
levels reasonably close to target. Medical markers, such as riboflavin, are not quantitative.
40
Assessments by patients may be subject to memory deficits, or distorted due to the level of
psychosis, use of illegal substances or denial of illness. Because some patients are unaware of
mistakes they are making in their medication regime the prevalence of non-adherence in
studies where self-reporting is used will tend to be underestimated (Byerly, Thompson et al.
2007; Velligan, Wang et al. 2007).
Clinical assessments of adherence may be subject to potential bias caused by the clinician’s
investment in finding a successful treatment (Diaz, Levine et al. 2001). The literature is
conflicting with regards to the consistency between patient self-assessment of adherence and
adherence as estimated by their physicians. Such an approach is supported in some studies
(Kampman, Lehtinen et al. 2001; O'Donnell, Donohue et al. 2003), although a study by
Kampman et al (2001) found only a 0.50 correlation in adherence assessments between
patients and doctors. Another difficulty observed in the literature is in judging adherence in a
clinical trial setting. It has been observed that patients who agree to participate in a clinical
study of antipsychotic medications are more likely to adhere to medication and general
treatment plans, suggesting a link between consent to research and compliance with treatment
(Barnes 2002).
Of interest is how non-adherence has been assessed in previous studies in this area. A
structured literature search was described in the previous chapter identifying 43 empirical
studies and five reviews. The samples under observation in the previous literature differed
along several dimensions. With respect to non-adherence, assessment was by a range of
methods: self-report, medical records, and clinical assessment. In ten of the 43 empirical
studies (23%), the assessment of adherence relied exclusively on self-reported information. In
a further 18 (42%), self-reported information was combined with the opinions of a family
member, a physician or a case-manager to arrive at an assessment of adherence. Additional
information of this kind may be helpful, but may also be problematic because of the
inconsistencies described above. A study of primary care patients prescribed antidepressant
medications for 12 weeks or more (defined as maintenance phase) found a 72% agreement
between dichotomous classification based on self-reported adherence and adherence assessed
from pharmacy refill data (Aikens, Nease et al. 2005). It would appear that few studies
corroborate self-reported adherence with pill counts or physiological data (Zygmunt, Olfson
et al. 2002). This method was used in only three of the 43, or 7%, of empirical studies
reviewed.
41
It has been pointed out that self-report methods are generally the most cost-effective and time-
efficient (Thompson, Kulkarni et al. 2000). Also this may be the only feasible method for
collecting adherence information in a large scale or population-based survey. Lecomte et al
(2008) argue that the method used to elicit self-reported information on adherence can
improve reliability. One suggestion given is that using interviewers unknown to the patient
will prevent any incentive they may have in lying to an authority figure that has a stake in
their treatment. Another suggestion is that by asking detailed questions about their medication
taking, as opposed to a simple yes-no question, more accurate information is obtained. The
data used in this thesis assessing adherence were based on self-reported information. The
methods used will be described in more detail below in the description of the datasets.
Across methods of assessing adherence, most studies use binary indices of non-adherence. In
reality, however, it is much more likely that there is a continuum of the degree to which
patients do not adhere to their medications (Aikens, Nease et al. 2005). Non-adherence can
occur at different points in time after a drug is prescribed and varies as to the duration of
missed dosages. For example, Urquhart (1997) identified six categories of non-adherers: (i)
those that miss a dose but then take the missed dosage soon after they were supposed to take
it; (ii) those who miss very few doses; (iii) those who miss a few doses, but never more than
one at a time; (iv) those who a few times a year miss more than one dosage at a time (‘drug
holidays’); (v) those who regularly take drug holidays; and (vi) those who take few or no
doses. Weiden et al (2004) identified various degrees of partial compliance based on the
maximum number of days in any gap in medication taking over a one year period and
observed statistically significant increases in the rate of rehospitalisation as the maximum gap
in medication increased. Donohue et al (2001) similarly used more than two categories to
classify adherence, while Grunebaum et al (2001) used the continuous measure: number of
days in the month prior to interview on which no medication was taken.
In the studies reviewed, the definition of what constituted non-adherence varied substantially.
Some studies defined non-adherence as discontinuation of medication for one week or longer
(Robinson, Woerner et al. 2002), while others classified ever missing medication as
constituting non-adherence (Weiden, Kozma et al. 2004).
42
The reviewed literature highlighted other important inconsistencies in the methods used in
assessing factors associated with non-adherence in patients taking antipsychotics. In
particular, the length of time over which non-adherence was assessed differed across studies.
The length of time over which adherence status was assessed in previous studies ranged from
one month to five years. This is important as the length of time under study is likely to impact
on the prevalence of non-adherence observed. Shorter studies may not follow patients long
enough to observe the long-run medication taking behaviour of patients. Of the 43 empirical
studies reviewed, only 17 (40%) assessed medication taking over a time period of one year or
more.
In summary, there are a wide range of methods that can be used to assess adherence, and the
choice of assessment method should be determined by the goals of the study and the relative
advantages and disadvantages of the methods (Andrade, Kahler et al. 2006).
2.3 Costing methods
There are several sources of costs that result from the incidence of schizophrenia. The key
cost drivers are: inpatient services, specialist community accommodation, medication, lost
employment, premature mortality, family burden and public safety and concern (Knapp,
Simon et al. 2002). The first three of these are examples of direct costs. That is, they are costs
that are incurred for provision of health services to patients (Knapp 1996). Indirect costs are
the necessary, or at least desirable (in some respect), complements to direct expenditure from
local authorities and other agencies. An example of an indirect cost in the support of a patient
with schizophrenia is a carer support service. Costs that are not immediately identifiable, but
are measureable, such as family support, are considered hidden costs. Premature mortality,
family anxiety, and public safety are examples of immeasurable costs (Knapp 1996).
While many of these costs drivers can be identified, there may be difficulties in attaching a
unit cost to them. This is because they may not best equate to the money cost or price of the
resources because of market distortions of prices. The appropriate measure of the cost of a
service is the benefit forgone or opportunity cost of not using the resource in is best
alternative use.
43
Another important consideration in analyses of costs is the perspective taken. Typically this
will either be the perspective of the health and social care system, the
public/sector/government or of the society as a whole. Health and social care costs focus on
the direct costs of services. A public sector/government perspective would include health and
social care costs and those indirect costs, such as the cost of benefits, paid out of the public
purse. Taking a societal perspective necessitates the inclusion of all costs borne by society,
including such indirect costs as informal care and lost productivity. In this thesis the health
and social care system is taken in each empirical analysis. The data necessary to conduct such
analyses were available in each of the datasets. Where additional data were collected allowing
for estimation of public sector/government costs, the cost of lost employment or societal
costs, these were estimated and analysed.
2.4 Measuring and costing psychiatric services
Beecham and Knapp (2001) identified four ‘rules’ for costing mental health services. These
are:
1. Costs should be comprehensively measured ranging over as many service components
of care packages as is relevant
2. Variations between clients and variations between facilities or areas of the country
should not be overlooked
3. Assessments of the comparative performance of services should be made on a like-
with-like basis
4. Cost information is more useful if it is used in conjunction with outcome data
With regards to comprehensively measuring costs, this is most effectively done at the
individual level. Thus collecting service receipt or utilisation data for individual patients or
clients over a specific period of time will achieve comprehensiveness.
The first step to comprehensively costing services is to describe the elements of the service
(Beecham 1995). This involves collecting detailed information of the service and its
44
components. Following this, a unit of measurement for each service is chosen which reflects
the typical unit of contact patients or clients have with the service. For example, a social
worker may typically see clients in hourly appointments so the number of contact hours
would be most easily estimated. The third step is then to identify and collect data on the cost
implications of all service components. For example, staff time potentially includes salary,
national insurance contributions and travel costs and decisions must be made as to the most
appropriate ways to assign these to each unit of service provision. The final step in costing
services is to estimate the unit cost of the service.
Unit cost measures should be based on long-run marginal opportunity costs (Beecham 1995).
This method takes a long-term perspective on resource implications, taking into account
developments in care that could be achieved by using present services more intensively. It
also includes only those effects on resources that can be attributed to the service user (Knapp
1996), and reflects the additional cost attributable to providing the service to an additional
patient or client. Opportunity costs take the perspective that costs incurred are forgone
opportunities to spend financial resources alternatively.
The unit costs used in this thesis are estimates of long-run marginal opportunity costs at a
national level, taken from an annual compendium of health and social care costs. Initially, an
attempt was made to use unit costs consistent with the year in which the data from each
source was collected. A later decision was taken to use the same year in two of the empirical
analyses in which very similar sampling methods and questionnaires were used in order to
facilitate comparisons across the results. The Unit Costs of Health and Social Care, compiled
by Netten el al (2002), reported estimates of unit costs for over 70 health and social care
services based on routine data, literature and ongoing research. The estimates include capital,
revenue and other relevant direct or indirect costs of mental health and social care services.
Revenue costs include salary, supplies, overhead costs as well as catering and domestic costs
in the case of services provided in residential care settings. Because a long-term perspective is
taken, the cost of creating services was also included. That is, the cost of buildings, land and
equipment which constitute capital costs. Building and land costs are annuitized over 60 years
(to reflect the assumed lifetime of a building) and discounted to arrive at an annual, present
value cost. The compendium includes data to allow for unit costs to be specific to the area of
the country in which patients reside but this information was not used here due to the
complexity of applying this data for individual patients. With respect to the fourth rule of
45
costing psychiatric services, the focus here is on resource use, and as discussed in the
introduction, there is an assumption in assessing the impact of non-adherence, that prescribed
medications are clinically effective.
2.5 Potential confounding variables
The literature review of previously published empirical studies and reviews was used to
identify factors to include in the modeling as potentially associated with non-adherence and as
covariates in the analysis of costs. Table 1.1 in chapter 1 lists the factors assessed in
previously published literature reviews for their association with non-adherence. As I am
conducting secondary data analyses, the factors that could be considered were restricted to
those relevant factors included in each of the datasets. Using the classification suggested by
Fenton et al (1997), discussed in Chapter 1, the majority of the available and relevant data are
patient-related. Little data were available on medication- or environment-related factors (e.g.
intensity of treatment or therapeutic alliance) or those that related to psychodynamic
considerations (e.g. degree of insight into illness). The control variables in each dataset are
listed and described in the empirical chapters (3, 4 and 5) which describe the variables in
more detail.
2.6 Data sources
The choice of datasets to use in the analyses was based on the extent to which relevant
information was included in the dataset. The features deemed most important were that the
sample was nationally representative, the data were collected relatively recently, had an
adequate measure of non-adherence, included comprehensive information on health and social
care service use and indices of as many as possible of the potential covariates relevant to non-
adherence and service use. Additionally, longitudinal data were sought as these have the
advantage of allowing for greater confidence in determining the direction of associations
between variables. As secondary data were used, it was inevitable that not all of these features
could be identified in a single dataset. For example, there were data that would have improved
46
the analyses that were not included in the datasets chosen. Also, particular variables were not
categorised in a way that would be most relevant in the analysis. These and other limitations
are discussed in detail in the chapters presenting the empirical analysis. Here, a brief overview
of the datasets is given.
The relevant information in describing secondary data, as set out by Boslaugh (2007), are as
follows:
What was the original purpose for which the data was collected?
What kind of data is it, and when and how were the data collected?
What cleaning and/or recording procedures have been applied to the data?
Given the methodological issues identified, and the desire to conduct an analysis on validated
and representative data, the following sources were identified.
2.6.1 The Psychiatric Morbidity Surveys, 1993-4
The UK Psychiatric Morbidity Surveys (PMS) were cross-sectional, epidemiological surveys
conducted in a range of settings. Interviews were conducted by the Social Survey Division
field force of the British Office of Population Census and Surveys (now called the Office for
National Statistics) between April 1993 and August 1994 (Meltzer, Gill et al. 1995; Gill,
Meltzer et al. 1996; Meltzer, Gill et al. 1996). The PMS data were provided by the UK Data
Archive.
The nature of schizophrenia determines that there will always be significant subgroups of
people with the illness who will be in difficult-to-reach areas of society. For example, rates of
schizophrenia are high in prison and homeless populations (Lamb and Lamb 1990; Singleton,
Meltzer et al. 1998). These patients are rarely considered in analytical studies (Gill, Meltzer et
al. 1996). A significant advantage of the PMS 1993-4 data is that a sample of homeless people
was included in the data.
47
The aims of the 1993-4 PMS surveys are listed as:
(a) to estimate the prevalence of psychiatric morbidity according to diagnostic
category among adults aged 16 to 64 years in Great Britain
(b) to identify the nature and extent of social disabilities associated with mental
illness
(c) to examine the varying use of services and the receipt of care in relation to the
mental illness and the associated social disabilities
(d) to investigate recent precipitating factors which are associated with mental
illness
(e) to investigate the relationship between mental illness and smoking, drinking
and drugs use
The assessment of non-adherence in the 1993/4 PMS was based on self-assessment by survey
respondents. The assessment relates to current medications only and is based on survey
responses to the questions ‘Do you sometimes not take your medications even though you
should?’ and ‘Do you sometimes take more medication/pills than the stated dose?’
Data on the frequency of use of inpatient care, outpatient care, external services (including
community psychiatric nurse, occupational therapist, social worker, community psychiatrist,
home help, volunteer worker), day care and sheltered employment were available from the
survey.
The 1993/4 PMS includes several variables that relate to the analysis of the factors associated
with non-adherence and the analysis of factors associated with costs. These are: age, sex,
education, general level of health, illness severity, inpatient contact for mental health reasons
in the past year, self-reported drug abuse, self-reported alcohol abuse, level of support from
family or friends and familiarity with medication. The dataset also has a variable indicating if
a patient is from an ethnic minority.
48
2.6.2 The QUATRO Study
The QUATRO study was a multi-national randomized controlled trial carried out at four
centres across four European countries (Germany, Italy, the Netherlands and the UK), funded
by the European Commission and coordinated from the UK. It has the advantage of following
patients over time. Its main aim was to compare the effectiveness of adherence therapy with a
health education control intervention (which allows for therapist time and relationship), in
improving health-related quality of life for people with schizophrenia receiving treatment
from general adult mental health services (Gray, Leese et al. 2006). The sample was drawn
from adults receiving care from psychiatric services in each of four European cities:
Amsterdam (The Netherlands), Leipzig (Germany), London (United Kingdom) and Verona
(Italy). Data collection took place between June 2002 and October 2003 (Gray, Leese et al.
2006). Each sample was recruited from the patient records of senior treating clinicians at a
range of local in-patient and community settings that were typical of general treatment centres
in the catchment areas of each site. The inclusion criteria were that the patient must have had
a clinical diagnosis of schizophrenia, must require on-going antipsychotic medication for at
least one year following the baseline assessment, and must have exhibited evidence of clinical
instability in the year prior to baseline (Gray, Leese et al. 2006). Clinical stability is defined as
meeting one or more of the following criteria: a hospital admission on mental health grounds,
a change in the type or dose of antipsychotic medication, planned or actual increased
frequency of contact with mental health services, and indications of clinical instability
reported by relatives, carers or the clinical team. Written, informed consent was obtained from
all participants.
The study was a two-arm randomised controlled trial. Patients were randomly assigned to
either receive the experimental intervention, an individual cognitive-behavioural approach
which is collaborative and patient-centred, or a standard health education control intervention.
The six elements that form the core of the cognitive-behavioural approach are assessment,
medication problem-solving, a medication timeline, exploring ambivalence, discussing beliefs
and concerns about medication, and using medication in the future (Gray, Leese et al. 2006).
Measurements were taken at baseline and after 12 months for both the intervention and
control groups. Adherence to medication was based on patient responses on the Medication
49
Adherence Questionaire (MAQ). Positive responses on the MAQ are summed to obtain a
Morisky score (Morisky, Green et al. 1986), a 5-point scale based on 4 questions relating to
medication-taking behaviour. It asks patients if they ever forget to take medication, if they are
careless about taking medication, if they ever stop taking medication once they feel better and
if they ever stop taking medication because it made them feel worse. The Morisky score is
widely used to assess adherence (Shalansky 2004; Day, Bentall et al. 2005). For the purpose
of this analysis, values of 3 and 4 on the 5-point scale (0-4) were deemed as reflecting a high
liklihood of non-adherence as per classifications found in the literature (Shalansky 2004).
In the QUATRO study, service use information is collected on the Client Service Receipt
Inventory (CSRI) (Beecham and Knapp 1992). The CSRI collects individual patient data on
demographic characteristics, accommodation and living situation, employment history and
earnings, including receipt of benefits, health and social care service receipt, and the role of
informal carers. This questionnaire was originally designed to be used by an interviewer with
the principle carer of a person with mental health problems. The QUATRO study team choose
to have the CSRI administered by non-economist researchers in a face-to-face interview with
participants (Patel 2006). Due to uncertainty over the reliability of service use reports by
people with mental health problems, interviewers were advised that, where full data could not
be obtained from participants, they should obtain supplementary information from key
workers, service providers and/or carers to ensure that the information was as complete and
reliable as possible.
For use in the non-English speaking QUATRO study sites, local language versions of the
CSSRI-EU were available from the EPSILON study (Chisholm, Knapp et al. 2000), which
carried out a process of translation into local languages, focus groups and pilot activities to
ensure face validity and semantic equivalence.
The CSRI can be used for the chosen retrospective period as it breaks down service receipt
into typical units of contact. In the QUATRO study the retrospective period to which the
service use data refers was three months.
50
2.6.3 The Psychiatric Morbidity Survey, 2000
The Psychiatric Morbidity Survey, 2000 collected information both in its own context and
relating to the 1993-4 PMS studies. The positive aspects of this dataset are that it provides
more recent service use data and by having a methodology largely consistent with the
previous PMS data, offers a good comparison across the two studies. The difficulty is that the
study sample includes individuals residing in private households only and is thus not ideal for
comparison of schizophrenia patient samples. The 2000 PMS data was provided by the UK
Data Archive.
The main aim of the survey was to collect data on the prevalence of mental health problems
among adults aged 16 to 74 years living in private households in Great Britain (Singleton,
Bumpstead et al. 2001). The topics of the 2000 PMS Household survey were similar to those
in the 1993-4 surveys. The questions relating to non-adherence to medication were worded
identically to those in the 1993-4 surveys. Service use data were collected for each of the
following category of services: GP consultations, inpatient visits, outpatient visits, day
activity services, and community care services (including community psychiatrist, community
psychologist, community psychiatric nurse, social worker, home help, outreach worker).
The sample in the PMS 2000 was independent of the sample from the 1993-4 surveys. Given
the likely similarity between the household samples in each, however, the PMS 2000 data
would be ideal for comparing rates of non-adherence and the nature of the association
between non-adherence, relevant covariates and service use. Unfortunately, in the 2000 PMS
only 54 patients reported being prescribed antipsychotics at the time of the interview. This
survey was used instead to assess service use and costs in another mental illness sample,
patients taking antidepressants, to contrast the significance of non-adherence in relation to
service use relative to the patients taking antipsychotics in the 1993-4 PMS. The service use
data collected in the PMS surveys were quite similar which greatly enhances this comparison.
The six to seven year gap between the surveys is acknowledged, however. The two PMS
samples were not combined because of changes in the health care system in the intervening
period. For example, the number of standard dosage units of antidepressants prescribed per
1000 population increased by approximately 75% between 1993 and 2000 (Rose 2007). There
51
were also changes to the provision of services, including alterations to the organisation and
configuration of community mental health teams, continued rebalancing of care between
hospital and community settings, and growth of secure provision.
2.7 Statistical analysis
The statistical methods used in the thesis were chosen based on the features of the data. All
statistical analyses were conducted using the STATA data analysis software (StataCorp 2007;
STATA 10.1 2009).
2.7.1 Logistic regression
For the research question assessing factors potentially associated with non-adherence, a
dichotomous index of non-adherence was used in each of the datasets. For the analyses, where
the outcome involved whether a patient was adherent, a logistic regression model was fit to
the data. The logistic regression model can be represented algebraically as:
ii XBBi ep −−+=
011
where pi represents the probability of a positive outcome in patient i, and Xi represents a
column vector of observed values, for patient i, for the set of factors thought to be associated
with non-adherence.
This equation can be rearranged to be expressed as:
X
X
ii
i
eep
Β+Β
Β+Β
+=
0
0
1
52
The logit transformation of pi is:
g(x) =
− i
i
pp
1ln = XiΒ+Β0
The function, g(x), has many of the properties of a linear regression model. That is, it is linear
in its parameters, may be continuous, and may take on values from -∞ to +∞.
The value then of a dichotomous outcome variable given a set of parameters, X, can be
expressed as:
yi = pi + ε
where ε has a binomial distribution with mean zero and variance equal to pi [1-pi].
For a dichotomous variables (say Y), either equation above for p gives the conditional
probability of a positive event (Y=1) given values X. The conditional probability that Y=0 is
thus given by 1-p .
The likelihood function is the product of the contribution to the likelihood function for the a
pair of values (x,y):
∏=
−−=Βn
i
yi
yi
ii xpxpl1
1)](1[)()(
The natural log (ln) of this equation is:
∑=
−−+=Β=Βn
iiiii xpyxpylL
1)]}(1ln[)1()](ln[{)](ln[)(
53
To find the values of the vector of coefficients, β, that maximizes this equation, it is
differentiated with respect to β0 and β1 and the resulting expressions, given below, are set
equal to zero.
∑=
=−n
iii xpy
10)]([
and
0)]([1
=−∑=
n
iiii xpyx
This solution of coefficients is termed the maximum likelihood estimate.
If an independent variable in a logistic regression model is itself dichotomous, the most
commonly used measure of association is the odds-ratio. If the levels of the dichotomous
independent variable are 0 and 1, and the outcome variable, also dichotomous is 1 for a
positive outcome and 0 otherwise, the odds-ratio represents the probability of a positive
outcome among individuals with independent variable value of 1 relative to those with
independent variable at value 0. For example, in the analyses to follow, if a ‘positive’
outcome is defined as having been non-adherent to medication and alcohol abuse is
represented by 1 if the respondent has previously abused alcohol and 0 if they have not, an
odds-ratio of 2 would be interpreted as those with a history of alcohol abuse being twice as
likely to report non-adherence relative to those without a history of alcohol abuse.
The odds-ratio can be written as:
OR = )]0(1/[)0()]1(1/[)1(
pppp
−− ,
that is, the ratio of the odds of a positive outcome for those with a value of 1 on the
independent variable relative to the odds of a positive outcome for those a value of 0 on the
54
independent variable (Hosmer and Lemeshow 2000). Given the algebraic representation of pi
above, the formula for the odds-ratio can be reduced to:
OR = ieβ .
The odds-ratio has possible values ranging from 0 to +∞, with a value of 1 reflecting equal
odds for each level of a dichotomous independent variable. Thus the distribution of the odds-
ratio is skewed right. The sampling distribution of the maximum likelihood coefficient
estimate, β1, has a normal distribution. The endpoints of the 100(1-α)% confidence interval
estimate for the odds ratio is then given by:
exp[β1±z1-α/2 x [standard error( β 1)].
If an independent variable is categorical but has more than two levels, a reference category is
chosen from one of the levels of the variable and odds-ratios are calculated for the remaining
levels which reflect the odds of a positive outcome for that outcome level relative to the
reference level. Again as an example, consider non-adherence as the ‘positive’ outcome and
level of education as an independent variable with 3 levels – without a secondary school
education, completed secondary school or completed post secondary school qualification. If
‘without secondary school education’ were the reference category, an odds-ratio of 2 for
respondents with completed secondary school would represent a doubling of the odds of
being non-adherent for those who had completed secondary school relative to those without a
secondary school education. An odds-ratio of 3 for those who had completed a post-secondary
school qualification would represent these individuals being three times as likely to be non-
adherent as those without a secondary school education.
In the most basic case, the logit is assumed to be linear in relationship to a continuous
covariate. In this case, the slope coefficient, β, is the change in the log odds for an increase of
one unit on the continuous variable. For example, an odds ratio of 1.05 for the variable age
means that a one year increase in age is associated with a 1.05 times the odds of a positive
outcome. A more meaningful description of the association of a dichotomous outcome with a
continuous independent variable may be to report the impact of a relevant or meaningful
55
change of units on the independent variable. It would possible then to say, for example, that ‘a
10 year difference in age is associated with x times the odds of a positive outcome’.
Say the choice of a relevant or meaningful change is ‘c’ units. The odds ratio for a change of
‘c’ units is:
OR(c) = exp(cβ)
This can be estimated by replacing β with its maximum likelihood estimate β . The endpoints
of the 100(1- α)% confidence interval of OR(c) are:
exp[cβ1±z1-α/2 x c x [standard error( β 1)].
The link test is used to test the appropriateness of the specification of the logistic regression
models (Tukey 1949). The link test regresses the outcome variable in the logistic regression
on the values predicted by the model and the predicted values squared. If the squared
predicted values have statistically significant explanatory power, the model is misspecified. In
the case of logistic regression this would necessitate altering the specification of the
independent variables as the specification of the dependent variable is set as the log likelihood
function.
Several options exist for testing the goodness-of-fit of the logistic regression model. Those
used in the analyses are the Pearson’s chi-squared test, the Hosmer-Lemeshow test, the
likelihood ratio test and the percentage of observations correctly predicted by the model
(Hosmer and Lemeshow 2000). In logistic regression the fitted values are calculated for each
covariate pattern and depend on the estimated probability for that covariate pattern. The
Pearson’s chi-squared statistic is based on the residual probability of the observed and
expected values for a particular covariate pattern. This statistic is approximated by the chi-
shared distribution with J – (p+1) degrees of freedom, where J is the number of observations
and p is the number of independent variables included in the model.
56
The Hosmer-Lemeshow test involves regrouping the data by ordering on the predicted
probabilities and then forming a number of equally sized groups (Hosmer and Lemeshow
2000). The Hosmer-Lemeshow goodness-of-fit statistic is the Pearson chi-squared statistic for
the table of observed and estimated expected frequencies for each group summed over all of
the groups (Hosmer and Lemeshow 2000). This test statistic is also approximated by the chi-
squared distribution with degrees of freedom equal to the number of groups minus two.
The likelihood ratio statistic is twice the difference in the log-likelihoods of two models. The
significance of a particular independent variable can be tested by calculating the difference in
log-likelihood of a model with the variable included and a model without the variable and
multiplying this by two. The likelihood ratio test has an approximate chi-squared distribution
with degrees of freedom equal to the number of independent variables in the model.
The logistic regression model fit was further assessed by looking at the percentage of
observations correctly predicted by the model. That is, what percentage of patients who were
non-adherent were predicted by the model to be so. There is no specific percentage that can be
taken to validate the choice of model, but this statistic is useful to judge the relative
performance of logistic regression models.
2.7.2 Two-part models and generalised linear models
In analysing the association between non-adherence and service use costs, specific
characteristics of the distribution of costs suggest that ordinary least square methods are not
appropriate. A distribution of service use typically included a significant number of zero
cases, that is, patients who did not use any services during the period under study. Also, cost
outcomes across a large number of patients are usually skewed to the right. That is, there are a
relatively small number of patients who require very high service use and as a result have
unusually high costs.
A common approach to dealing with the first of these features is to use a two-part model
(Mullahy 1998). In the context of analysis of service use and costs, the first part of the model
estimates whether or not a patient has any service use at all, and the second part of the model
57
estimates the amount of costs incurred among those patients who did use services. The first
part of the model can by estimated with binary probability models - logistic or probit
regression. In the analyses conducted for this thesis, when the data for a cost outcome
contained a significant number of zero values, logistic regression modelling was used for the
first part of a two-part model analysis.
The second part of the two-part model is a model of the costs for those patients who used
services. These costs can be modelled with a linear regression model, provided that the
necessary assumptions or conditions are met. That is, that the relationship between the
dependent and independent variables is linear; that the residuals of the model are not
correlated and have constant variance and the residuals are normally distributed (Cohen,
Cohen et al. 2003). Typically, high skewed data, a common feature of cost data, will violate
the condition of constant variance across the residuals (Dunn, Mirandola et al. 2003).
Heteroscedasticity is the term given to non-constant variance in the residuals.
Heteroscedasticity, along with the residuals not having a normal distribution, will lead to
underestimates of the standard error of the parameter estimates and thus overestimation of
significance levels. One approach to dealing with the skewed distribution of a regression
outcome variable is to perform a transformation on the cost values – usually using the natural
log: ln(y). These values are then analysed with ordinary least squares regression. This method
has its deficiencies, however, as the results may be biased if not appropriately retransformed
(Manning and Mullahy 2001). Here part two of the model was modelled with a generalised
linear model (GLM) where an extension of Park’s test is applied to the raw-scale residuals
from the GLM model to determine which specific GLM to use (Mullahy 1998).
Algebraically, this can be represented by:
Part 1: Pr(yi>0| xi) = ii XBBe −−+ 11
1
Part 2: E[ln(yi)| yi>0,xi] = Xiβi
where yi is the observed cost of patient i, and Xi represents observed values, for patient i, for
the set of factors thought to be associated with non-adherence.
58
The overall model has expected value:
E[y| X] = Pr(y>0|X) x E[y|y>0,X]
The logit model has been described above. The generalised linear model is an extension of a
linear model with three components (Blough, Madden et al. 1999). The first of these is the
linear component:
ηi = Xi β
where X is a column vector of observed values for the model covariates and β is a column
vector of coefficients.
The second component of the GLM model is a link function, g, which describes how the
expected value of a response, yi, is related to the linear predictor:
g(μi) = Xi β
where μi = E(yi). The log link function was used in the analysis of service use costs on account
of the values being skewed to the right.
The third component is the variance function. The variance function value determines the
relationship of the variance of the outcome variable across patients and their mean where each
observed outcome has a probability distribution from an exponential family. This can be
written as:
Var(yi) = σi2 = ΦV(μi)
where Φ is a constant called the dispersion parameter. The exponential family of probability
distributions includes the normal (Gaussian), binomial, Poisson, gamma and the inverse
Gaussian distributions.
59
The choice of distributional function was made based on the modified Park Test described by
Manning and Mullahy (2001). The Park Test statistic is estimated using a ordinary least
square with a log link where the dependent variable is:
ln (yi - iy )2
and the explanatory variable is ln( iy ), the natural log of the fitted value from one of the GLM
specifications. Thus the model is:
ln (yi - iy )2 = λ0+ λ1 ln( iy ) + vi
The coefficient λ1 is used to determine which distributional family to use. If λ1=0 the
Gaussian distribution can be used. The Poisson distribution is suggested by λ1=1 and the
gamma model is suggested if λ1=2. And if λ1=3 the inverse Gaussian model is suggested
(Manning and Mullahy 2001).
As mentioned above, the overall estimate of an individual patient’s expected service use costs
was estimated by multiplying the probability of use of services from the logistic regression
model by the expected costs from the GLM. The method to estimate the standard error of
overall costs involves using a bootstrap algorithm. Because the distribution of the overall
estimate of service use costs cannot be easily defined (as the product of a logistic regression
estimate and a GLM estimate), bootstrapping simulates the distribution to arrive at an
estimate of the standard error. Based on random samples drawn from the original sample, the
overall estimate of service use costs is estimated. This process was repeated 1,000 times with
varying random samples to create a distribution of estimates. The dispersion of these values
estimates the dispersion around the estimate of costs incurred. In each analysis where two-part
models were used, the bootstrap algorithm was used to derive standard errors.
2.7.3 Case types
To graphically illustrate the effect of the factors in the model, predicted costs were calculated
from the models for a series of case types. An initial case was selected for each outcome
60
which combined the factors included in the model at arbitrarily assigned values. The overall
estimate of service use costs was estimated for this case and is represented by a bar in the
graph. The 95% confidence interval for this case, derived from a bootstrap algorithm when
two-part models were used, were calculated and are represented by a line extending from the
lower limit of the confidence interval to the upper limit of the confidence interval. Further
case types, in turn, varied the value of a single factor to see the impact on predicted costs of a
shift in the value for that factor. For example, an initial case type may show the predicted total
service use costs for a man aged 45 on medication for over 2 year. To illustrate the effect of
age, an additional prediction on the graph could show the predicted total costs for a man, aged
64 on medication for over 2 years.
2.7.4 Multiple imputation
A common problem when modelling data from a large sample is that a number of sample
members will have missing data for some of the explanatory variables to be included in the
model. If the individuals with missing data on one or more of the variables of interests are
excluded from the modelling, the model will have less power, and the findings will be less
representative of the population sampled from. There are several techniques for dealing with
missing variables.
An important first step in dealing with missing values is to determine if they are a random
occurrence. In many instances, missing data is not random and is related to the values of the
variable under study. For example, missing data on a survey question about an individual’s
income is potentially related to the respondent not wanting to divulge their income if very
high or very low. Where missing data are unrelated to the values of the variable or any other
variable observed in the dataset it is termed ‘missing completely at random (MCAR)’. Testing
whether or not any of the variables with complete data is associated with an observation
having missing data may be used to test the assumption of MCAR but is inconclusive as it is
not possible to test that the missing values are completely random without knowing what the
missing values are. For example, if it is assumed that in response to being asked their income,
those with particularly high or low incomes are less likely to be willing to reveal their
incomes, then the missing values on this question would relate to the values that would have
61
been observed had the question been answered. It is a strong assumption to assume
missingness completely at random.
A less strong assumption is that missing data may be conditional on another of the
explanatory variables, but not on their values or the dependent variable. This is termed
‘missing at random (MAR)’ (Schafer 1997). Following the previous example, missing values
on an income variable would be considered MAR if those with a particular level of another
explanatory variable in the model, say education, are more or less likely than others to report
their income, but among those with the same level of education, the probability of reporting
income is unrelated to an individual’s actual income (Byrne 2001). Data is not missing at
random (NMAR) if missingness is dependent on the value of the missing variable, as in the
example of those with higher incomes being less willing to reveal their income.
The options for dealing with missing data depend on the assessment of its randomness. Where
data is MCAR, the entire observation may be deleted (listwise deletion) or the estimation can
ignore missing values but include the observation (pairwise deletion) (Scheffer 2002).
Options for estimating missing values when data is MAR are to replace missing values with
the mean of observed cases or use the non-missing data to predict the values of missing data
using a regression model. Both these methods are mainly criticised for underestimating
standard errors of estimates based on the imputed data as they do not incorporate uncertainty
around the imputed values. Other methods such as weighting adjustments, where each
observation is weighted according to the inverse probability of observing that observation’s
pattern of missing data, can produce estimates with excessive variability (Rubin 1996).
The approach taken here is to use multiple imputation. The procedure uses the observed data
to estimate the missing data a multiple of times, creating equally plausible versions of the
complete data set. Each of the data sets is then analysed, and the results combined using
Rubin’s (1987) rules for scalar estimands to produce one set of estimates and standard errors.
The advantage of this method is that it preserves the variance structure of the data and
incorporates uncertainty around the imputed values.
The imputation of multiple datasets was performed using the STATA program Imputation by
Chained Equations (ICE) (Royston 2004; Royston 2005; Royston 2005b). The number of
imputations necessary was discussed by Rubin (1996). He demonstrated that the relative
62
efficiency of an estimate based on the number of imputations is approximated by the
equation:
2/1
1−
+
mγ
where γ is the rate of missing information for the quantity being estimated, m is the number
of imputations and efficiency is measured in units of standard deviations. Based on this
formula, Table 2.1 below indicates efficiencies for various values of γ and m.
Table 2.1: Relative efficiencies for multiple imputation estimates based on the rate of missingness, γ , and number of imputations, m. M
Analysis of each multiply imputed dataset uses the same method that would be used in the
absence of nonresponse. Let lθ , Wl, l=1,…,M be M complete-data estimates and their
associated variances for an estimated θ , calculated from M repeated imputations under one
model (Little and Rubin 1987). The combined estimate is:
Mθ = ∑=
M
l
l
M1
θ
There are two components to the variability associated with this estimate. The first is the
average within–imputation variance, given by:
63
MW = ∑=
M
l
l
MW
1
ˆ
The second variance component is the between-imputation component, given by:
MB = ( )
1
ˆ 2
−
−∑M
Ml θθ
The total variability is estimated as:
MT = MW + MBM
M 1+
where (M+1)/M is an adjustment for finite M.
Based on a Satterwaite approximation, the t distribution is the reference distribution for
confidence interval and significance level estimates (Rubin and Schenker 1986; Rubin 1987).
That is,
( ) 2/1−− MM Tθθ ~ vt
With degrees of freedom, v, estimated as:
v = (M-1)2
111
+
+M
M
BW
M
2.7.5 Endogeneity
64
Endogenous means ‘defined within’ and in economic modelling refers to reverse causality or
simultaneity in cross-sectional models. Simultaneity arises when one or more of the
expanatory variables in a model are jointly determined with the dependent variable. That is,
an explanatory variable is determined at the same time as the dependent variable and it is not
possible to determine the direction of causality. The jointly determined explanatory variable is
endogenous and a model that does not account for the simultaneity will produce a biased
estimate of its effect.
The problem of an endogenous independent variable is typically addressed by the
instrumental variable method (Maddala 2001). Consider the standard ordinary-least-squares
regression model,
uXY iii ++= ββ0
where Yi is the dependent variable, 0β is the intercept, iβ is the slope parameter for the
independent variable Xi and u is the error term.
If Xi is simultaneously determined by Yi , it can be modelled as:
vYX iii ++= γγ 0
But while u is random in its effect on Yi , it will not be random in its effect on Xi meaning
that Xi and u will be correlated and X is endogenous in the model predicting Yi (Wooldridge
2006). Inclusion of an endogenous variable in a model will result in iβ being biased and
inconsistent.
Instruments are variables that are correlated with the endogenous variable but uncorrelated
with the error term. Thus it is necessary to identify a variable, observed in the dataset, say z ,
that is correlated with the endogenous variable Xi and uncorrelated with the error term u . The
condition that z is correlated with Xi can be tested by regressing Xi against z . That is
modelling
65
vzX ++= 10 ππ .
Then z is correlated with Xi (i.e. Cov( z , Xi) ≠ 0) if and only if we can reject the null
hypothesis that 1π = 0. In non-linear models such as logistic regression, a two-stage residual
inclusion method is necessary for addressing endogeneity (Terza, Basu et al. 2008).
Endogeneity may also result from omitted variables and measurement error (referred to as
errors-in-variables). Omitted variable bias occurs if a variable which affects the dependent
variable and is correlated with one or more of the expanatory variable is not included in the
regression model (Wooldridge 2006). The variation associated with the omitted variable
becomes part of the error term in the standard OLS regression model. The result of omitting a
key variable is that the variable(s) in the model with which it is correlated are then
endogenous. Typically, omitted variable bias comes about (particularly in secondary data
analysis) because omitted variables are not observed in the dataset being analysed.
Errors-in-variables arises if the true value of an explanatory variable in a regression model is
unobserved but is estimated in the model by a variable that has associated with it some
measurement error. Consider the model
uxxy +++= 22*110 βββ
where y and 2x are observed but *1x is not. Let 1x be an oberserved measurement of *
1x such
that
1*11 exx +=
where 1e is the measurement error. If 1x is used in place of *1x in the modelling of y and 1x and
1e are correlated, this model will be biased and inconsistent.
Both omitted variable bias and error-in-variables bias can be addressed with the method of
instrumental variables. An alternative method for dealing with potentially omitted variables is
to identify a suitable proxy variable for the unobserved variable.
66
In addressing potential omitted variable bias, one must also be alert to the impact of
multicollinearity. Multicollinearity occurs when some or all of the explanatory variables are
highly correlated. Thus in adding variables to avoid omitted variable bias, one may encounter
multicollinearity if the additional variables are highly correlated with explanatory variables
already included in the model. Multicollinearity may affect the estimated coefficients and
their standard errors, but the model will be unbiased (Wooldridge 2006).
In the model of factors associated with service use, it may be the case that, if in accessing
services an individual is reminded to be consistent in their medication taking, then non-
adherence and use of services are simultaneously determined. One can also accept, for
example, the possibility that the therapeutic alliance between the patient and their physician is
correlated with non-adherence and if not included in the modelling, would contribute to
omitted variable bias. The therapeutic alliance between the patient and their physician is
unobserved in the datasets used in the analyses. Because this effect is unobserved, it will
contribute to the error term in the model and the error term may then be correlated to the
effect of non-adherence, thus making non-adherence endogenous.
One approach to dealing with the potential endogeneity of non-adherence in the modelling of
service use would be to identify an instrumental variable for non-adherence. The difficulty
posed is that due to the limited scope of the datasets analysed, it may be difficult to identify a
variable that can satisfactorily be used as an instrument; that is, a variable that is correlated
with non-adherence but not correlated with service use. If the basis for the endogeneity is the
absence in the modelling of an omitted variable, the alternative approach would be to identify
a suitable proxy measure for the ommited variable which is observed in the dataset.
2.8 Summary
To examine the nature of the association between non-adherence to medication in patients
taking antipsychotics, data from the 1993/4 PMS and the QUATRO study, a randomised
control trial of adherence therapy were used. As a comparison for these associations, similar
analyses were conducted on a sample of patients in the PMS 2000 taking antidepressants.
Within each dataset, non-adherence was assessed based on self-reported information provided
67
in interviews of patients. In each data source, patients were asked for detailed and thorough
information on their use of health and social care services. These data were used in
conjunction with estimates of the long-run marginal cost of specific services to estimate the
total cost of service use from a health and social care perspective. Logistic regression models
were estimated to determine the significance of factors identified in previous literature, and
available in the datasets, in their association with whether a patient was adherent or not.
Modelling the effect of non-adherence on service use costs involved first determining the
prevalence of observations with no service use and therefore, zero costs. Where a significant
number of such cases existed, two-part models were estimated. This involved modelling the
presence or absence of service use in the first part of the model and using generalised linear
models in determining which factors were associated with the cost of services used among
those patients that did use services. In the analysis of the QUATRO data, additional terms
were included to utilise the longitudinal nature of the data. Also, in each dataset, where a
significant number of variables had substantial missing data, multiple imputation was used to
estimate the missing values.
68
Chapter 3
Patterns of non-adherence with antipsychotic medication and the impact of non-adherence on costs – analyses of the 1993/4 Psychiatric Morbidity Surveys
3.1 Background
Much of the analysis of the factors associated with non-adherence and the impact of non-
adherence on service use costs has been based on small surveys and medical trials data. My
review of the literature, described in chapter 1, found few studies based on large, population-
based data. Valenstien et al (2002) used US Veterans data to look at factors associated with
non-adherence. In similar large-scale population-based studies, Cooper et al (2007) conducted
a population-based study in the province of Quebec in Canada using the provincial health
insurance database, and Karow et al (2007) used data from the European Schizophrenia
Outpatient Health Outcomes (SOHO) study to again look at a factors associated with non-
adherence. Also, Janssen et al (2006) studied inpatients with schizophrenia and other
psychoses in Germany, identifying patients through hospital admissions in seven psychiatric
hospitals across Germany. Becker et al (2007) identified patients based on Medicaid lists in
the US state of Florida. Only the study by Becker et al looked at the role of non-adherence on
service use costs.
This analysis, a secondary analysis of the 1993/4 Psychiatric Morbidity Survey data, sought to
provide results based on a large, nationally representative, British sample. The Psychiatric
Morbidity Surveys are cross-sectional, epidemiological surveys conducted in a range of
settings throughout Great Britain. Interviews were conducted by the Social Survey Division
field force of the British Office of Population Census and Surveys (OPCS; now called the
Office for National Statistics) between April 1993 and August 1994 (Meltzer, Gill et al. 1995;
Gill, Meltzer et al. 1996; Meltzer, Gill et al. 1996). The first part of the analysis aims to
examine rates of non-adherence to antipsychotic medication, and to identify the key factors
that appear to be associated with patterns of non-adherence. The second part seeks to estimate
the impact of non-adherence on resource use and their associated costs.
69
3.2 Methods
3.2.1 The sample
The 1993-4 Psychiatric Morbidity Surveys collected data from residents of private
households, persons living in institutions, and homeless persons. Each group were sampled
separately. The OPCS postcode address file was the source of the sampling frame from which
sectors and addresses were selected for the household sample (Meltzer, Gill et al. 1995). The
sampling aimed to identify a relatively small number of people in a large number of areas.
Postal sectors were the primary sampling unit, and were stratified by socio-economic group.
In England and Wales postal sectors were sampled with probability proportional to the
number of postal delivery points, and addresses were selected within each of these. In
Scotland, the multiple occupancy count was used as the basis of probabilistic sampling within
sampling sectors to identify addresses. In total, 200 postal sectors were selected. At each
address, eligible individuals were given an initial questionnaire and those who reported a
long-standing mental illness, use of antipsychotic medication or contact with services relating
to a psychotic illness or screened positive on the CIS-R (a diagnostic instrument for neuroses)
or the Psychosis Screening Questionnaire were followed up in greater detail relative to the
remaining interviewees. Interviews took place between October and December 1993.
The initial step in identifying intstitutions to sample from was to obtain the names and
addresses of all institutions that provide some medical and/or residential care for adults with
mental illness. Institutions included in the sample included the following: establishments
which accommodate mentally ill adults were categorised into residential accommodation,
National Health Service (NHS) accommodation, and private hospitals, homes and clinics and
unregistered accommodation (Meltzer 1993). Within the three types of registered
accommodation for people with mental illness, the survey aimed to sample one in thirty of all
adults in the 16 to 64 years age range. These institutions were ordered by their number of beds
and a sampling fraction applied to each. No centralised list of unregistered accommodation
for mentally ill adults existed from which to sample, so the study team wrote to all general
managers of district health authorities and all directors of social services of health authorities
to construct a list to use as a sampling frame of unregistered accommodation.
70
A pilot survey was conducted in 1992 to test the organisation of the survey and the interview
schedules and procedures. The interviews for the main institutional survey took place between
April and July in 1994.
The homeless sample included residents of hostels, residents of private sector leased and short
life accommodation, adults staying in night shelters and people sleeping rough (Gill, Meltzer
et al. 1996). The survey team categorised hostels specifically catering for people with mental
illness as institutions to be included in the institutional sampling as opposed to the homeless
sampling. Hostels were ordered by size within local authorities and a systematic equal
probability sample of hostels was drawn. Those sleeping rough were sampled through their
use of day centres. The survey did not attempt to sample those sleeping rough who did not use
day centres. For each of the types of temporary accommodations used by the homeless, the
sampling frame was stratified by size and a sample of units/addresses was systematically
sampled from, after taking account of the probability of being sampled. The interviews of
homeless persons took place between July and August 1994.
All patients prescribed antipsychotic medication at the time of the survey were included in the
analyses. This sample may include some patients who are being treated for a mental illness
other than schizophrenia, but based on evidence of the trends in the off-label prescribing of
antipsychotics, at the time of the PMS 1993-1994, only a small minority of patients would be
prescribed antipsychotics without having a diagnosis of schizophrenia (Hodgson and
Belgamwar 2006). For consistency, interviews conducted with proxy respondents were
excluded. Much of the information required in the analyses was based on reporting of
personal information on medication taking and service use which, in order to be reliable and
accurate, would be provided by the interviewee.
3.2.2 Variable definitions
The analyses rely on self-reported determination of non-adherence. In the dataset it was not
possible to distinguish between medication not taken deliberately and occasions when patients
forgot to take their medication. The assessment of non-adherence in the PMS relates to
current medications only and is based on survey responses to the questions ‘Do you
sometimes not take your medications even though you should?’ and ‘Do you sometimes take
71
more medication than the stated dose?’. Thus I sought to include not only patients who took
less medication than they were prescribed, but also those who took more. In the analysis no
differentiation is made between patients prescribed oral medication and those prescribed to
receive depot injections. It was not possible to corroborate self-reported adherence with pill
counts or physiological data in the survey. Indeed, few studies do so (Zygmunt, Olfson et al.
2002). All measures of adherence have their drawbacks, but only self-report will be feasible
in a large-scale survey such as this. Because I rely on self-reported information, it is likely
that patients who are unaware of mistakes they are making in their medication regime are
incorrectly classified as being adherent. Thus my analyses may underestimate the prevalence
of non-adherence. Also, as the analyses include only those taking antipsychotics at the time of
the survey, it excludes those patients who were not on medication when interviewed because
they had refused medication.
The review of previous empirical literature that analysed the relationship between non-
adherence and patient- , medication- and environmental-related factors identified the
following variables within the data to include in the modelling: age, sex, ethnicity, education,
general level of health, illness severity, previous experience of side effects, inpatient contact
for mental health reasons in the past year, self-reported drug abuse, self-reported alcohol
abuse, level of support from family or friends, and familiarity with medication. These factors
were analysed for their association with non-adherence and as covariates in modelling service
use costs.
Data on ethnicity was collected in nine categories: White, Black–Caribbean, Black–African,
Black–Other, Indian, Pakistani, Bangladeshi, Chinese and none of the above. Due to the small
number of non-White respondents in each of the remaining ethnicity categories, these were
combined to create a dichotomous ethnicity variable to use in the analysis. Education was
classified into those with higher qualifications or A-levels, those who completed O-levels, and
those with no O-level qualifications.
Levels of general health were reported by patients on a five-point scale which was collapsed
to three levels: very good/good; average; and poor/very poor. Severity of neurosis was based
on results from the Revised Clinical Interview Schedule (CIS-R), a standardised instrument
used to assess the prevalence and severity of symptoms in minor psychiatric disorders.
Although administered by non-clinicians, the CIS-R has been shown to correlate closely with
72
standard clinical assessments (Lewis, Pelosi et al. 1992). Support from an adult with whom
the patient feels close was based on the question ‘How many adults who live/are staying here
with you do you feel close to?’. Medication familiarity was represented by being on
medication for greater than two years. Additionally, a dummy variable was created which
identified the patient’s place of accommodation, so that the statistical analyses could
differentiate those patients living in hospitals from those in ‘other’ settings (residential care
homes, supervised housing, group homes and hostels).
The primary analysis uses the institutions sample only. This is because very few household
respondents report that they are currently taking antipsychotics and of those that do, the rate
of missing values amongst the other variables included in the analyses is high. The rate of
missingness is also a problem in the homeless sample. The rates of missingness and
identification of the variables most affected by missingness are given in the results section.
3.2.3 Costing service use
Data on the frequency of use of inpatient care, outpatient care, external services (including
community psychiatric nurse, occupational therapist, social worker, community psychiatrist,
home help, volunteer worker), day activity services (including sheltered employment) for the
period of one year were available from the survey (see Table 3.1).
Data on the frequency of use of inpatient care, outpatient care and day activity centres in the
three months prior to interview were obtained in the survey. The number of visits was
multiplied by four to estimate annual usage. The dataset categorises inpatient stays into six
categories: secure or semi-secure unit, acute psychiatric ward, rehabilitation or long-stay
ward, A&E department or emergency ward, general medical ward, or other. Outpatient visits
were categorised into visits to A&E department of hospital casualty department, psychiatric
outpatient department, other hospital outpatient department and other outpatient or daypatient
service. The questionnaire differentiated day activity services as one of community mental
health centre, day activity centre, sheltered workshop or other service.
73
Table 3.1: Health and social care services included in analyses, PMS 1993-4 Professional services for those in hospital, clinic or nursing home
Psychiatrist/Psychotherapist Other consultant/hospital doctor Psychiatric Nurse Social worker/Counsellor Occupational Therapist Psychologist Voluntary worker
GP visits Hospital inpatient stays
Secure/semi-secure or special hospital unit Acute psychiatric ward Rehabilitation or long-stay ward/facility A&E department or emergency ward General medical ward
Hospital outpatient visits
A&E department Psychiatric outpatient department
Day activity services Community mental health centre Day activity centre Sheltered workshop
External services Community Psychiatrist Community Psychologist Community Psychiatric Nurse Community learning difficulty nurse Other nursing services Social worker Self-help/support group Home help/home care worker Outreach worker/family support
Data on whether or not respondents had visited their GP was available for the two-weeks prior
to the interview or, as with other health service use, for the previous year. The advantage of
the two-week estimate is that the number of visits was given; the disadvantage being that the
prior two weeks do not necessarily reflect typical recent GP service use. The current analysis
uses the data on GP visits in the prior year and assumes two visits for those who have visited
their GP during this time period.
The best available approximations to long-run marginal opportunity costs at a national level
were taken from a well-known compendium for 2001 (Netten, Rees et al. 2001). This year
was chosen to be consistent with the later analysis of the 2000 Psychiatric Morbidity Survey.
Qualification costs were not included in the unit costs used in this analysis. The unit costs for
74
each type of inpatient stay were based on daily rates and include accommodation costs. For
A&E outpatient visits and community care services a cost per visit was the basis of the unit
cost. Here an average length of time of one hour was assumed per visit and the unit cost
relating to hourly patient contact time was used. For community mental health centre and
sheltered workshop visits, the average length time of visits was estimated and an hourly unit
cost applied. For day activity centre visits a sessional unit cost was applied with a session
being either a morning, afternoon or evening.
The unit cost of each service used was multiplied by the total number of visits to that service
to estimate the annual cost for that service. The data were then summed to estimate total costs.
The analyses examined total costs, and its three main components: inpatient service costs,
external service costs and the costs associated with day activity service use.
3.2.4 Statistical analyses
As described in chapter 2 on methods, multiple imputation was employed when missing data
was judged to be missing at random. The primary analysis was conducted on the imputed
dataset. For subsamples where missingness at random could not be assumed, two secondary
analyses were performed. The variables found to be significant in their association with non-
adherence in the primary analysis were compared univariately with non-adherence. These
univariate comparisons were made using the Pearson’s chi-squared test for categorical
variables (Plackett 1983) and the Wilcoxon Rank Sum test for continuous variables
(Wilcoxon 1945). Secondly, total service use costs were compared across adherence status
groups using the non-parametric Wilcoxon Rank Sum test.
In the primary analysis, where there is overlap with covariates used to explain non-adherence,
I hoped to determine if these factors significantly affect costs over and above their influence
on non-adherence. Given that this analysis looks at cross-sectional data, it can not be ruled out
that the correlation between a covariate and the indicator of non-adherence will affect the
significance of the main effect of that covariate in the analysis of costs. That is, that
multicollinearity may exist. Whether or not a patient had an inpatient stays in the previous
year was not included as a covariate in the analyses of costs as these visits were included in
the services costed.
75
As described in the methods section, logistic regression models were used to determine the
factors associated with non-adherence. These models were assessed by the link test, the
Pearson’s chi-squared test, the Hosmer-Lemeshow test, the likelihood ratio test and the
percentage of observations correctly predicted by the model. Generalised linear models were
used to test factors for their association with costs. With respect to inpatient, external and day
activity service costs a significant proportion of the study sample did not utilise these services
and so a two-part model was used. Part one modelled the probability that costs are incurred,
while the second part modelled the intensity of costs among those who did use the service
(Mullahy 1998). The probability that costs were incurred was estimated with a logistic
regression model, while estimations of the intensity of costs were modelled using GLM
models. Within a GLM model a link function can be specified to allow for the estimates of the
parameters to be directly derived in the linear scale, and the algorithm outlined by Manning
and Mullahy (2001) was used to select the distributional form of the GLM based on an
extension of the Park test.
In the modelling of the probability of service use (where included) and service use costs, the
effect of institution type was included as a covariate. This effect accounted for the fact that the
use of certain services was likely to be associated with institution type. For example, use of
inpatient services may have been more likely for individuals who at the time of the survey
were not already in long-stay hospitals.
Endogeneity is a potential problem in these models. Simultineity may arise if regular contact
with services has the effect of improving adherence through health service providers
reminding and encouraging patients to adhere to their medication. I considered using the
experience of side-effects as an instrument for non-adherence, but the obvious difficulty is
that this variable itself may by associated with use of services. The limited scope of the PMS
dataset with respect to factors associated with non-adherence made no other observed variable
a good choice as an instrument for non-adherence. The potential for omitted variable bias
exists in that factors associated with non-adherence and service use, supported by the
theoretical literature, were not found in the dataset and could therefore contribute to
correlation between non-adherence and the error term in the modelling. In particular, factors
relating to attitudes to and preferences for support such as the therapeutic alliance between the
76
patient and their physician were not assessed in the PMS surveys. I included medication
familiarity in the modelling of service use costs as a proxy for this effect.
Factors achieving significance at the 0.05 level were deemed statistically significant. The
analysis was performed using the STATA data analysis software (STATA 2008).
Based on the modelling results, predicted costs were derived for a hypothetical case which
arbitrarily set values for the predictive variables included in the modelling. Predicted values
were then estimated for variations of the hypothetical case with one value of one of the
explanatory variables changed. In order to estimate the confidence intervals around these
predictions, a bootstrapping algorithm, incorporating 1000 repetitions, was used. This allowed
me to obtain estimates of the standard error around each of the predictions. This data was then
plotted in histograms illustrating the relative impact of changes to key variables. These plots
were produced using the EXCEL software (Microsoft Corporation 2003).
3.3 Results
The rate of cooperation among institutions selected for the survey was poor with just over
50% participating. Thirty-one percent of the non-participating institutions were deemed
ineligible as they were either acute units and did not have permanent residents, catered for
people aged 65 and over or catered for those who were mentally handicapped as opposed to
mentally ill. The remainder refused to take part. Refusals were most common among private
institutions, smaller hospitals and residential care homes, supported lodging, unstaffed group
homes and hostels.
In the household sample, of the 12,730 individuals selected for interview, 10,108 (79%) co-
operated and had an initial interview which included questions on socio-demographic
characteristics, general health, the Clinical Interview Schedule – Revised and the Psychosis
Screening Questionnaire. Within the homeless sample the response rate varied substantially
according to the source of selecting individuals to be interviewed. Of individuals identified
from hostels, 74% were interviewed; within private sector leased and short-life
accommodation, interviews were completed in 44% of households selected; within
77
nightshelters, 79% of individuals approached did in fact provide an interview; and 68% of
selected visitors to day centres for homeless people were interviewed.
The Psychiatric Morbidity Survey institutions sample consists of data on 1,191 patients. Of
these, the data on 313 residents of institutions were provided by a proxy, and excluded
information relevant to the analyses. Of the remaining 818 subjects, 658 persons were
prescribed antipsychotic medication at the time they were surveyed. The household sample
has data on 10,108 patients of which 271 were interviews of proxies. Of the remaining 9,837
there were 54 respondents who were prescribed antipsychotics at the time of the interview.
The homeless sample includes 1,166 individuals (530 in hostels, 268 in private sector leased
(PSL) or short life accommodation, 187 in nightshelters and 181 from day centres). Within
the hostel and PSL samples, data for 50 patients were provided by proxies. Only 27
individuals in the homeless sample reported that they were currently taking antipsychotics in
their interview.
Table 3.2 summarises demographic data for each sample. The institutions sample is broken
down into those in hospitals and those in ‘other’ institutions to explore the comparability of
these two groups. The samples were comparable in age and ethnicity. The household sample
was balanced between the sexes whereas the other samples had more males than females. The
household and homeless sample members were more educated than the patients in
institutions. All of the homeless respondents report good general health while less than 30%
of the household sample report this level of general health. This divergence may reflect the
subjective nature of responses to questions on a patient’s general health. The homeless
patients were found (after screening) to have higher levels of neurosis and were more likely to
report side effects with their medication and drug and alcohol abuse as compared to the other
samples. The homeless sample also had been taking antipsychotics for a shorter period than
the remaining patients. Patients in residential care homes, supervised housing, group homes or
hostels were most likely to have been on medication for greater than 2 years. Over 50% of the
homeless report non-adherence to medication as compared to approximately 30% in the
household sample, 20% of those in residential care homes, supervised housing, group homes
or hostels and 10% of those in hospital.
78
Table 3.2: Demographic characteristics of sample members currently taking antipsychotics, PMS 1993-4
Resident in Household
(n=54)
Resident in Hospital (n=304)
Resident in other
institutions 1 (n=354)
Homeless (n=27)
Age: mean (SD) 46.1 (11.7) 43.0 (12.6) 44.8 (10.6) 38.4 (13.5) Sex: % male 46.3 % 71.1 % 68.4 % 77.8% Ethnicity: % White 94.4 % 89.5 % 95.5 % 92.6 % Education: % Higher qual. or A-levels % O-levels2 % No O-levels
Overall 220 individuals (29.8% of the sample) had data missing on one or more of the
variables included in the analyses. The prevalence of missing values was particularly a
problem in the homeless sample. None of these respondents had complete data on the
variables of interest. Within the homeless sample (n=27), 11 (40.7%) were missing one
variable, 7 (25.9%) were missing two variables and 9 (33.3%) were missing three or more.
Age, health status, CIS-R score and living or staying with an adult with whom they feel close
1 Residential care home, ordinary housing with a degree of protection, supervised ordinary housing, group home or hostel. 2 O-level were a British exam taken by students at age 16. This exam was replaced by the GCSE exam. In the PMS, achievement of O-Level equivalent qualifications constituted O-level passes of Grades A-C, GCSE passes of Grades A-C or National Vocational Qualifications level 2. 3 The Revised Clinical Interview Schedule (CIS-R) is used to assess minor psychiatric disorder. Higher scores indicate greater prevalence/severity of neurosis.
79
were the variables least frequently answered by homeless respondents. Only 8 (29.6%) of the
homeless sample reported their age and only 13 (48.1%) reported their general health status.
Of note, all homeless respondents who responded to the question on their general health status
reported very good or good health. This suggests a potential bias towards not responding to
this question if the answer did not put the respondent in a favourable light. Similarly, the 19
(70.4%) of the homeless sample who responded to the question regarding whether or not they
live or stay with an adult with whom they feel close all reported having such social support.
Within the household sample 33 of 54 respondents (61.1%) had compete data on the variables
to be included in the analyses, 19 (35.2%) were missing one variable only, while 2 (3.7%)
were missing two variables. The variable that asked whether or not the patient lived or was
staying with an adult with whom they felt close was missing for 35% of the sample. Of those
that did respond to the question on social support, 85.7% report living with an adult with
whom they feel close.
Within the sample of respondents resident in institutions, 486 of 658 (73.9%) had complete
data. One hundred and eighteen (17.9%) were missing one variable only, 35 (5.3%) were
missing two variables, 16 (2.4%) had 3 missing values, 3 (0.5%) had 4 missing values. The
variables with the highest number of missing values were length of time on medication
(12.8% missing), whether or not they lived or stayed with an adult with whom they felt close
(12.6% missing) and alcohol use (5.3% missing). The following variables had no missing
values: non-adherence, experience of side effects, ethnicity, sex, age, inpatient mental health
contact and type of residence. Within the homeless sample, 11 of the 27 (40.7%) patients had
missing values for one variable to be included in the analysis. Seven patients (25.9%) had
missing values for two variables and 9 (33.3%) had missing values for three or more
variables. Data on general health was missing for two-thirds of the homeless sample and age
was not reported by 19 (70.4%) of the sample.
Due to the apparent association between the missingness on questions relating to health status
and social support and the observed values on these items, missingness at random, required
for multiple imputation, cannot be assumed within the homeless sample. It is unclear as to
whether or not a similar problem exists with the question on social support when asked within
the household population. Given the small number of observations contributed by the
household sample and the concern about the missing at random assumption, the decision was
80
taken to restrict the primary analysis to the institutions sample only. Within the institutions
sample missing values are observed on the social support and length of time on medication
questions, but the distribution of observed values does not suggest a bias towards non-
response being associated with a particular response option.
The overall rate of self-reported non-adherence amongst the institutions sample was 16.7%.
This rate differed between patients resident in hospitals (11.2%) and those living in residential
care homes, group homes or hostels (21.2%). This range is somewhat lower than reports in
the literature (Battaglia 2001; Conley and Kelly 2001), probably a consequence of focussing
on an institutions sample where patients may receive support, encouragement and/or
incentives to adhere to medication.
The logistic regression analysis identified significant associations between non-adherence and
the following factors: residence in a residential care home, supervised housing, group home or
hostel, having higher qualifications or A-levels, having had a mental health hospital stay in
the previous year, having previously experienced side effects, and reporting alcohol abuse
(see Table 3.3). Also, the probability of non-adherence increased as CIS-R scores increased
(reflecting greater prevalence and/or severity of symptoms of neurosis) and decreased as the
age of patients increased.
Significantly, those people resident in non-hospital institutions were over twice as likely to be
non-adherent as people resident in hospital. Having higher qualifications or A-levels
approximately doubles the predicted probability of non-adherence, as does having had a
mental hospital stay in the previous year. The odds of not adhering with current medication
were 3.2 times greater for those who have previously experienced side effects with
antipsychotic medication compared to those who had not. Those who report alcohol abuse
were three times as likely to be non-adherent as those who did not report it.
The model diagnostics reported are the average values across the five imputed datasets. The
link test p-value (0.203) of the square of the predicted value suggests that the model is not
misspecified. The Pearson’s and Hosmer and Lemeshow chi-squared p-values (0.0659 and
0.2168 respectively) were not significant, indicating acceptable goodness of fit, as did the
significance of the likelihood ratio chi-squared test. The percentage of observations correctly
predicted by the model was 70.9%.
81
Table 3.3: Results of logistic regression model on factors associated with non-adherence, PMS 1993-4 Institutions sample Variables N=658
Odds Ratio 95% CI Resident in ‘other’ institution 1(n=354)… …relative to resident in hospital (n=304)
2.43***
1.46, 12.34
Age (5 year increase in age) 0.85*** 0.76, 0.96 Male (n=458)… …relative to Female (n=200)
0.84
0.50, 1.41
Higher qualifications or A-levels (n=76)… O-level 2 (n=102)… …relative to below O-level qualifications (n=480)
2.42*** 0.94
1.29, 4.55 0.48, 1.83
Average general health (n=250)… Poor general health (n=87)… …relative to good general health (n=321)
1.17 0.81
0.71, 1.93 0.37, 1.77
Non-White (n=48)… …relative to White (n=610)
1.39 0.61, 3.19
Prevalence/severity of neurosis: CIS-R score 3 (five unit increase) 1.18*** 1.05, 1.33 Had a hospital stay for a mental, nervous or emotional problem (n=102)… …relative to not having had hospital stay for a mental, nervous or emotional problem (n=556)
1.89**
1.08, 3.31
Two or more years on medication (n=439)… …relative to less than 2 years on medication (n=219)
1.29 0.73, 2.28
Experienced side effects or worries about side effects (n=48)… …relative to having not experienced or worried about side effects (n=610)
3.19*** 1.60, 6.40
Lives with adult with whom feels close (n=403)… …relative to does not live with adult with whom feels close (n=255)
0.93 0.56, 1.54
Reports moderate or high alcohol dependency (n=42)… …relative to no alcohol dependency (n=616)
3.08*** 1.39, 6.85
Reports illegal drug use (n=55)… …relative to non drug users (n=603)
1.29 0.62, 2.71
Link test p-value 0.203 Pearson’s chi-sqpared test p-value 0.0659 Hosmer-Lemeshow chi-squared test p-value 0.2168 Likelihood ratio chi-squared p-value <0.0001 Percent correctly classified 70.85% * p≤0.10; ** p≤0.05; *** p≤0.01 1 residential care homes/supervised housing/group homes/hostels 2 O-level were a British exam taken by students at age 16. This exam was replaced by the GCSE exam. In the PMS, achievement of O-Level equivalent qualifications constituted O-level passes of Grades A-C, GCSE passes of Grades A-C or National Vocational Qualifications level 2. 3 The Revised Clinical Interview Schedule (CIS-R) is used to assess minor neurotic psychiatric disorder. Higher scores indicate greater prevalence/severity of symptoms.
82
In the analysis of resource use and resource use costs, initially individual services were
considered. Those services that were most often used and those that incurred the greatest costs
were analysed individually. These services were inpatient, external and day activity services
(see Table 3.4).
Table 3.4: Distribution of costs by service type, PMS 1993-4 Institutions sample N Mean Median Standard
(Sheltered) work costs 41 7,983 5,284 3,254 5,284 – 11,512 Total costs 657 34,003 34,413 21,224 14,130 – 48,180
3.3.1 Inpatient services
A total of 151 patients (23.0% of sample) reported having an inpatient stay in the past year.
Of those who had an inpatient stay, mean inpatient costs were £32,630. A logistic regression
model of whether or not inpatient services were used found statistically significant
associations between use of inpatient services and living in a residential care home,
supervised housing, group home or hostel, being from an ethnic minority and having been
prescribed an antipsychotic medication for less than two years (see Table 3.5). Ethnic
minority patients were two and a half times as likely to have used inpatient services. Those
who live in a residential care home, supervised housing, group home or hostel were over one
and a half times as likely to report use of inpatient services as compared to hospital residents,
as were those that were on medication for less than two years as compared to those on
medication for two or more years. The association between use of inpatient services and non-
adherence to medication approached statistical significance (p=0.059), with those non-
adherent being over one and a half times as likely to have used inpatient services. Similarly,
83
Table 3.5: Results of logistic regression model on factors associated with having had an inpatient stay, PMS 1993-4 Institutions sample Independent variables N=658
Odds Ratio (of using services)
95% CI
Resident in ‘other’ 2 institution (n=354)… …relative to resident in hospital (n=304)
1.64**
1.09, 2.49
Age (5 year increase in age) 0.93 0.84, 1.02 Male (n=458)… …relative to Female (n=200)
0.70
0.46, 1.07
Higher qualifications or A-levels (n=76)… O-levels (n=102)… …relative to below O-level qualifications (n=480)
1.44 1.02
0.79, 2.60 0.59, 1.79
Non-White (n=48)… …relative to White (n=610)
2.46** 1.24, 4.85
Average general health (n=250)… Poor general health (n=87)… …relative to good general health (n=321)
0.91 0.71
0.60, 1.38 0.37, 1.38
Prevalence/severity of neurosis: CIS-R score 3 (five unit increase)
1.02
0.93, 1.14
Non-adherent (n=109)… …relative to adherent (n=549)
1.61* 0.98, 2.63
Lives with adult with whom feels close (n=403)… …relative to does not live with adult with whom feels close (n=255)
1.55*
0.97, 2.45
Reports illegal drug use (n=55)… …relative to non drug users (n=603)
1.35 0.70, 2.59
Reports moderate or high alcohol dependence (n=42)… …relative to no alcohol dependence (n=616)
1.88*
0.90, 3.93
Two or more years on medication (n=439)… …relative to less than 2 years on medication (n=219)
0.56** 0.35, 0.90
Link test p-value 0.714 Pearson’s chi-sqpared test p-value 0.3304 Hosmer-Lemeshow chi-squared test p-value 0.6646 Likelihood ration chi-squared p-value <0.0001 Percent correctly classified 65.59% * p≤0.10; ** p≤0.05; *** p≤0.01 1 residential care homes/supervised housing/group homes/hostels 2 The Revised Clinical Interview Schedule (CIS-R) is used to assess minor neurotic psychiatric disorder. Higher scores indicate greater prevalence/severity of symptoms.
84
the effect of living with an adult with whom the respondent feels close approached statistical
significance with social support positively associated with having had an inpatient visit.
The goodness-of-fit tests for this model were as follows: the link test p-value (0.714) of the
square of the predicted value suggests that the model is not misspecified. The Pearson’s and
Hosmer and Lemeshow chi-squared p-values (0.3304 and 0.6646 respectively) were not
significant, indicating acceptable goodness of fit. The significance of the likelihood ratio chi-
squared test also suggested the model fits the data well. The percentage of observations
correctly predicted by the model was 65.6%.
A GLM model with a log link function and a gamma distribution was fitted to inpatient costs.
Among those using inpatient services, the only factor found to approach a statistically
significant association with inpatient costs was ethnicity (see Table 3.6). Non-White patients
reported greater costs than White patients. This observed association, however, was based on
a small sample of Non-White patients (n=18). Estimates of inpatient costs for a range of case
types appear in Figure 3.1. The base case was of a man, age 45, White, with no O-levels, good
general health, resident in hospital, who adheres to his antipsychotic medication, has a CIS-R
score of 11, does not report drug or alcohol abuse, who lives with an adult with whom he feels
close and has been on medication for over 2 years. Changing the characteristics of this case
illustrates the relative impact of significant factors.
Ethnicity clearly had a major effect on in-patient costs: non-Whites were predicted to cost
approximately £6,600 more per annum than the base case type. Patients reporting non-
adherence were predicted to have excess inpatient costs of approximately £2,500 per year
above the base case type.
85
Table 3.6: Generalised linear model on factors associated with inpatient costs, PMS 1993-4 Institutions sample Independent variables N=151
Coefficient
95% CI
Resident in ‘other’ 1 institution (n=91)… …relative to resident in hospital (n=60)
-0.095 -0.24, 0.051
Age 0.0020 -0.0048, 0.0089 Male (n=99)… …relative to Female (n=52)
0.019
-0.13, 0.17
Higher qualifications or A-levels (n=24)… O-levels (n=28)… …relative to below O-level qualifications (n=99)
-0.019 0.14
-0.22, 0.18 -0.076, 0.35
Non-White (n=18)… …relative to White (n=133)
0.23* -0.028, 0.50
Average general health (n=58)… Poor general health (n=17)… …relative to good general health (n=76)
Lives with adult with whom feels close (n=101)... …relative to does not live with adult with whom feels close (n=50)
0.082 -0.069, 0.23
Reports illegal drug use (n=20)… …relative to non drug users (n=131)
-0.060 -0.27, 0.15
Reports moderate or high alcohol dependence (n=15)... …relative to no alcohol dependence (n=136)
0.074
-0.22, 0.37
Two or more years on medication (n=87)… …relative to less than two years on medication (n=64)
-0.064
-0.22, 0.096
Constant 10.29*** 9.90, 10.67 Link function Log Distributional family Gamma * p≤0.10; ** p≤0.05; *** p≤0.01 1 residential care homes/supervised housing/group homes/hostels 2 The Revised Clinical Interview Schedule (CIS-R) is used to assess minor neurotic psychiatric disorder. Higher scores indicate greater prevalence/severity of symptoms.
86
Predicted cost of inpatient visits, PMS 1993-4 Institutions sample
0
2,000
4,000
6,000
8,000
10,000
12,000
14,000
16,000
18,000
20,000
case type: male, age 45,White, no O-levels, goodgeneral health, residentin hospital, adheres tomeds, CISR score=11,
no drug or alcohol abuse,with adult to whom feelsclose and on meds for
over 2 years
case type: medicationnon adherence
case type: resident inhostel or group home
case type: non-White case type: does not livewith adult with whom
feels close
case type: age 30 case type: on medicationfor less than 2 years
annu
al c
ost i
n £
(200
1 un
it co
sts)
0
2,000
4,000
6,000
8,000
10,000
12,000
14,000
16,000
18,000
20,000
Figure 3.1
87
3.3.2 External services
External services include visits by a community psychiatric nurse, occupational therapist,
social worker, community psychiatrist, home help or volunteer worker. The mean annual cost
of external services among those who used this service was estimated at £2,705 per annum
and 251 patients used these services. There was no reported use of external services by
hospital residents so the dummy variable representing the effect of being in a residential care
home, supervised housing, group home or hostel was excluded from the model.
Use of external services was significantly associated with non-adherence to medication,
ethnicity, the CIS-R score and length of time on medication (see table 3.7). Patients who were
non-adherent or were on medication for two or more years were over two and a half times
more likely to use external services as compared to adherent patients and those on medication
for less than two years, respectively. Non-Whites patients were significantly less likely to use
external services as compared to White patients. Increases in the severity of neurosis were
associated with a lower likelihood of external service use.
The square of the predicted value estimated in the link test had a p-value of 0.787 which
suggests that the model was not misspecified. The Pearson’s and Hosmer and Lemeshow chi-
squared p-values (0.3833 and 0.6381 respectively) were not significant indicating acceptable
goodness of fit, as did the significance of the likelihood ratio chi-squared test (p<0.0001). The
percentage of observations correctly predicted by the model was 62.9%.
88
Table 3.7: Factors associated with use of external services 1, PMS 1993-4 Institutions sample
Independent variables N = 658
Odds Ratio (of using services)
95% CI
Age (5 year increase in age) 0.94 0.86, 1.02 Male (n=458)… …relative to Female (n=200)
1.002
0.69, 1.46
Higher qualifications or A-levels (n=76)… O-levels (n=102)… …relative to below O-level qualifications (n=480)
1.39 1.35
0.81, 2.38 0.82, 2.23
Non-White (n=48)… …relative to White (n=610)
0.48** 0.23, 1.01
Average general health (n=250)… Poor general health (n=87)… …relative to good general health (n=321)
1.37* 1.32
0.94, 2.00 0.74, 2.34
Prevalence/severity of neurosis: CIS-R score 2 (five unit increase)
0.90** 0.81, 0.99
Non-adherent (n=109)… …relative to adherent (n=549)
2.66*** 1.67, 4.23
Lives with adult with whom feels close (n=403)… …relative to does not live with adult with whom feels close (n=255)
1.17
0.79, 1.72
Reports illegal drug use (n=55)… …relative to non drug users (n=603)
1.40 0.74, 2.65
Reports moderate or high alcohol dependence (n=42)… …relative to no alcohol dependence (n=616)
1.50
0.73, 3.07
Two or more years on medication (n=439)… …relative to less than 2 years on medication (n=219)
2.86*** 1.89, 4.31
Link test p-value 0.787 Pearson’s chi-sqpared test p-value 0.3833 Hosmer-Lemeshow chi-squared test p-value 0.6381 Likelihood ration chi-squared p-value <0.0001 Percent correctly classified 62.86% * p≤0.10; ** p≤0.05; *** p≤0.01 1 External services include visits by a community psychiatric nurse, occupational therapist, social worker, community psychiatrist, home help or volunteer worker. 2 The Revised Clinical Interview Schedule (CIS-R) is used to assess minor neurotic psychiatric disorder. Higher scores indicate greater prevalence/severity of symptoms.
89
Analysis of the factors associated with the cost of external services was based on the 251
patients who had used these services in the past 12 months. A GLM model using a log link
function and gamma distribution was fitted to the data (see Table 3.8). Patients who reported
drug use incurred significantly lower costs if they accessed external services as compared to
those who did not report drug use. There is also a trend for having been on medication for two
or more years having an association with increased external service use costs (p=0.096). Even
though non-adherence increased the likelihood of use of external services, the volume of use
was lower, other things being equal. Indeed the product of probability and intensity of use
suggested that non-adherence increased external service use costs, while costs were
substantially lower for patients on medication for less than two years (see Figure 3.2) relative
to the base case. Being of average general health (as compared to good health) had the
greatest impact on increasing the predicted costs of external services.
3.3.3 Day activity services
The estimated mean day care costs among users of this service were £4,645 per annum. A
total of 232 patients (35.3% of sample) reported having used day activity services during the
recall period. A logistic regression model of whether or not day activity services were used
found statistically significant associations between use of these services and living in a
residential care home, supervised housing, group home or hostel, age, self-reported health
status and length of time on medication (see Table 3.9). Those who lived in a residential care
home, supervised housing, group home or hostel were four times as likely to have used day
care services as compared to hospital residents. Each five-year increase in age was associated
with a 10% reduction in the odds of using day care services and those reporting poor health
were 60% less likely to use these services as compared to those who report good health.
Additionally, having been prescribed antipsychotics for two or more years was associated
with 1.7 times the odds of using day care services as compared to those patients who had been
prescribed antipsychotics for less than two years. The association between use of day activity
services and non-adherence to medication was not statistically significant (p=0.333).
90
Table 3.8: Factors associated with costs of external services 1, PMS 1993-4 Institutions sample Independent variables N=251
Coefficient
95% CI
Age -0.0026 -0.017, 0.11 Male (n=176)… …relative to Female (n=75)
0.21
-0.09, 0.51
Higher qualifications or A-levels (n=35)… O-levels (n=42)… …relative to below O-level qualifications (n=174)
-0.16 0.32
-0.55, 0.23 -0.078, 0.72
Non-White (n=12)… …relative to White (n=239)
0.11 -0.55, 0.77
Average general health (n=107)… Poor general health (n=30)… …relative to good general health (n=114)
Lives with adult with whom feels close (n=164)... …relative to does not live with adult with whom feels close (n=87)
0.12 -0.17, 0.41
Reports illegal drug use (n=28)… …relative to non drug users (n=223)
-0.44** -0.85, -0.026
Reports moderate or high alcohol dependence (n=23)... …relative to no alcohol dependence (n=228)
-0.15
-0.60, 0.30
Two or more years on medication (n=199)… …relative to less than two years on medication (n=52)
0.32*
-0.058, 0.71
Constant 7.48*** 6.71, 8.25 Link function Log Distributional family Gaussian * p≤0.10; ** p≤0.05; *** p≤0.01 1 External services include visits by a community psychiatric nurse, occupational therapist, social worker, community psychiatrist, home help or volunteer worker. 2 The Revised Clinical Interview Schedule (CIS-R) is used to assess minor neurotic psychiatric disorder. Higher scores indicate greater prevalence/severity of symptoms.
91
Predicted cost of external services, PMS 1993-4 Institutions sample
0
2,000
4,000
6,000
8,000
10,000
12,000
case type: male, age 45,White, no O-levels, goodgeneral health, residentin hospital, adheres tomeds, CISR score=11,
no drug or alcohol abuse,with adult to whom feelsclose and on meds for
over 2 years
case type: non-White case type: on medicationfor less than 2 years
case type: medicationnon adherence
case type: CIS-Rscore=5
case type: drug abuse case type: averagegeneral health
annu
al c
osts
in £
(200
1 un
it co
sts)
0
2,000
4,000
6,000
8,000
10,000
12,000
Figure 3.2
92
Table 3.9: Factors associated with use of day activity services 1, PMS 1993-4 Institutions sample Independent variables N = 658
Odds Ratio (of using services)
95% CI
Resident in ‘other’ 2 institution (n=354)… …relative to resident in hospital (n=304)
4.05*** 2.76, 5.95
Age (5 year increase in age) 0.91** 0.83, 0.99 Male (n=458)… …relative to Female (n=200)
1.19
0.80, 1.76
Higher qualifications or A-levels (n=76)… O-levels (n=102)… …relative to below O-level qualifications (n=480)
1.15 1.18
0.67, 1.98 0.70, 1.97
Non-White (n=48)… …relative to White (n=610)
0.82 0.39, 1.70
Average general health (n=250)… Poor general health (n=87)… …relative to good general health (n=321)
0.74 0.40***
0.51, 1.08 0.21, 0.78
Prevalence/severity of neurosis: CIS-R score 3 (five unit increase)
1.0056 0.91, 1.11
Non-adherent (n=109)… …relative to adherent (n=549)
0.79 0.48, 1.28
Lives with adult with whom feels close (n=403)… …relative to does not live with adult with whom feels close (n=255)
1.08
0.74, 1.58
Reports illegal drug use (n=55)… …relative to non drug users (n=603)
1.12 0.59, 2.12
Reports moderate or high alcohol dependence (n=42)… …relative to no alcohol dependence (n=616)
1.70
0.83, 3.48
Two or more years on medication (n=439)… …relative to less than 2 years on medication (n=219)
1.70** 1.10, 2.62
Link test p-value 0.152 Pearson’s chi-squared test p-value 0.4436 Hosmer-Lemeshow chi-squared test p-value 0.3924 Likelihood ration chi-squared p-value <0.0001 Percent correctly classified 65.02% * p≤0.10; ** p≤0.05; *** p≤0.01 1 Day activity services include visits to a community mental health centre, day activity centre or sheltered workshop. 2 residential care homes/supervised housing/group homes/hostels 3 The Revised Clinical Interview Schedule (CIS-R) is used to assess minor neurotic psychiatric disorder. Higher scores indicate greater prevalence/severity of symptoms.
93
The link test p-value (0.152) suggested that the model was satisfactorily specified. The
Pearson’s and Hosmer and Lemeshow chi-squared p-values (0.4436 and 0.3924 respectively)
were not significant indicating acceptable goodness of fit. The significance of the likelihood
ratio chi-squared test (p<0.0001) also suggested acceptable goodness of fit. The percentage of
observations correctly predicted by the model was 65.0%.
A GLM model with a log link function and a Gaussian distribution was fitted to day activity
service use costs (see Table 3.10). Among those using day care services, none of the factors
included in the model were found to be associated with day activity service use costs. Figure
3.3 presents the predicted cost of day activity services combining the logistic regression and
GLM results. Compared to the base case type, the effects of living in an institution other than
a hospital and being younger in age had the greatest impact on increasing the cost of day
activity services.
3.3.4 Total health and social care costs
The final model examined factors associated with the total costs of all health and social care
services. The mean observed total cost was £33,795 per annum. A single GLM model was
used, as opposed to a two-part model, because all but one patient had used at least one service
and therefore incurred costs. A log link function and a Gaussian distribution were used in the
GLM (see Table 3.11). Type of residence was found to be statistically significant. People
living in residential care homes, supervised housing, group homes or hostels incurred
significantly lower total costs compared to hospital residents. There was a trend for those
patients who reported non-adherence to have greater total costs than those who adhered to
their antipsychotic medication
94
Table 3.10: Factors associated with costs of day activity services 1, PMS 1993-4 Institutions sample Independent variables N=232
Coefficient
95% CI
Resident in ‘other’ 2 institution (n=175)… …relative to resident in hospital (n=57)
0.085 -0.17, 0.34
Age -0.0069 -0.020, 0.0058 Male (n=166)… …relative to Female (n=66)
0.12
-0.090, 0.34
Higher qualifications or A-levels (n=29)… O-levels (n=38)… …relative to below O-level qualifications (n=165)
0.14 -0.071
-0.11, 0.39 -0.30, 0.16
Non-White (n=12)… …relative to White (n=220)
0.060 -0.27, 0.39
Average general health (n=89)… Poor general health (n=18)… …relative to good general health (n=125)
Lives with adult with whom feels close (n=151)... …relative to does not live with adult with whom feels close (n=81)
0.078 -0.17, 0.33
Reports illegal drug use (n=24)… …relative to non drug users (n=208)
0.13 -0.17, 0.43
Reports moderate or high alcohol dependence (n=19)... …relative to no alcohol dependence (n=213)
0.16
-0.21, 0.53
Two or more years on medication (n=181)… …relative to less than two years on medication (n=51)
0.18
-0.058, 0.41
Constant 8.35*** 7.73, 8.97 Link function Log Distributional family Gaussian * p≤0.10; ** p≤0.05; *** p≤0.01 1 Day activity services include visits to a community mental health centre, day activity centre or sheltered workshop. 2 residential care homes/supervised housing/group homes/hostels 3 The Revised Clinical Interview Schedule (CIS-R) is used to assess minor neurotic psychiatric disorder. Higher scores indicate greater prevalence/severity of symptoms.
95
Predicted cost of day activity services, PMS 1993-4 Institutions sample
0
500
1,000
1,500
2,000
2,500
3,000
3,500
4,000
case type: male, age 45, White, no O-levels, good general health, resident in
hospital, adheres to meds, CISRscore=11, no drug or alcohol abuse,
with adult to whom feels close and onmeds for over 2 years
case type: resid in hostel or group homecase type: on medication for less than 2years
case type: medication non adherence case type: age 30 case type: poor general health
annu
al c
ost i
n £
(200
1 un
it co
sts)
0
500
1,000
1,500
2,000
2,500
3,000
3,500
4,000
Figure 3.3
96
Table 3.11: Factors associated with total cost of services, PMS 1993-4 Institutions sample
Independent variables N=657
Coefficient
95% CI
Resident in ‘other’ 1 institution (n=269)… …relative to resident in hospital (n=217)
-0.91*** -1.01, -0.82
Age -0.0016 -0.0045, 0.0012 Male (n=335)… …relative to Female (n=151)
0.013
-0.064, 0.090
Higher qualifications or A-levels (n=55)… O-levels (n=76)… …relative to below O-level qualifications (n=355)
0.059 0.016
-0.040, 0.16 -0.095, 0.13
Non-White (n=38)… …relative to White (n=448)
0.0026 -0.16, 0.16
Average general health (n=186)… Poor general health (n=66)… …relative to good general health (n=234)
Lives with adult with whom feels close (n=298)... …relative to does not live with adult with whom feels close (n=188)
0.071* -0.013, 0.15
Reports illegal drug use (n=46)… …relative to non drug users (n=440)
-0.069 -0.22, 0.078
Reports moderate or high alcohol dependence (n=31)... …relative to no alcohol dependence (n=455)
-0.035 -0.22, 0.15
Two or more years on medication(n=328)… …relative to less than 2 years on medication (n=158)
0.051 -0.032, 0.14
Constant 10.79*** 10.61, 10.96 Link function Log Distributional family Gaussian * p≤0.10; ** p≤0.05; *** p≤0.01 1 Residential care homes/group homes/hostels 2 The Revised Clinical Interview Schedule (CIS-R) is used to assess minor psychiatric disorder. Higher scores indicate greater prevalence/severity of symptoms.
97
(p=0.079). Predicted total costs for residents of care homes, group homes and hostels were
less than half of the amount for comparable hospital residents (see Figure 3.4). Predicted
excess total service use costs for patients reporting non-adherence was over £5,000 per year.
3.3.5 Secondary analysis
Of the variables found to be associated with non-adherence in the institutions sample, age and
having had a recent mental health inpatient stay were also found to be associated with non-
adherence in the household sample (p=0.007 and p=0.020 respectively). As with patients in
institutions, higher non-adherence was observed amongst younger respondents in the
household sample. Likewise, having had a recent mental health inpatient stay was also
univariately associated with non-adherence in the household sample. The homeless sample
was half the size of the household sample and the univariate comparisons were only
conducted where greater than 80% of the sample had non-missing data for the relevant
variable. Of the variables associated with non-adherence within the institutions sample, this
excluded analyses of the association of non-adherence and each of age and the CIS-R score.
Both having had a recent mental health inpatient stay and experiencing side effects were
associated with non-adherence in the homeless sample (p=0.037 in both cases).
The Wilcoxon rank-sum test comparing total service use costs across adherence status groups
did not find a significant difference in the distribution of costs in the household sample
(p=0.2070). Similarly, there was no difference in total costs between homeless respondents
who reported adherence to their antipsychotic medication and those that reported non-
adherence. However, both samples were extremely small (households: n=54; homeless: n=27)
as it has been estimate that the number of persons with the illness in private households and
homeless in England in the 2003/4 were 72,600; and 22,800 respectively (Mangalore and
Knapp 2007).
98
Predicted total health and social care costs, PMS 1993-4 Institutions sample
0
10,000
20,000
30,000
40,000
50,000
60,000
70,000
case type: male, age 45, White, no O-levels,good general health, resident in hospital,
adheres to meds, CISR score=11, no drug oralcohol abuse, with adult to whom feels close
and on meds for over 2 years
case type: resid in hostel or group home case type: on medication for less than 2 years case type: medication non adherence case type: CIS-R score=5
annu
al c
ost i
n £
(200
1 un
it co
sts)
0
10,000
20,000
30,000
40,000
50,000
60,000
70,000
Figure 3.4
99
3.4 Discussion
Analysis of the institutions sample of the PMS found significant associations between patient-
related factors such as education and alcohol abuse. The experience of side effects was also
significantly associated with non-adherence. With respect to service use and related costs,
non-adherence was significantly associated with the use of external services, while the effect
on non-adherence approached statistical significance in the use of inpatient services and the
total cost of services.
3.4.1 Factors associated with non-adherence
Previous studies that have examined the factors that influence non-adherence in patients with
schizophrenia or taking antipsychotic medication have typically been based on relatively
small, local samples. Thus while there are inconsistencies between the findings of these
studies, the differences may relate to the nature of the populations sampled or to reduced
power due to small sample sizes. The Psychiatric Morbidity Survey has the advantage of
being a large, nationally representative survey. I focused on people living in institutions
(hospital and community-based) because analyses found high rates of missing data for the
other data sets (that is, people living in households and people who were homeless).
The heterogeneity of results from previous studies may also be due to the setting in which the
study took place. Results may differ due to changes in treatment regimes across time and
location. At the time of the PMS survey interviews (1993-94), the majority of schizophrenia
patients in the UK were prescribed older drugs. Atypical antipsychotics have been shown to
be associated with different profiles of side effects (Geddes, Freemantle et al. 2000), and this
may have influenced the association between side effects and non-adherence observed here. A
trend towards lower non-adherence in patients receiving atypical medications has been
observed elsewhere (Olfson, Mechanic et al. 2000; Sartorius, Fleischhacker et al. 2002).
A further difficulty in assessing the magnitude of the impact of non-adherence in the
treatment of patients with schizophrenia is variability in the methods used to detect its
presence. Some studies have employed patient-reported non-adherence, as in the PMS, while
100
others have used assessments by health care professionals. As discussed in chapter 2, the
consistency in the assessment of non-adherence has not been established.
Factors that influence non-adherence are typically placed into one of three categories:
patient-, medication- and environment-related (Oehl, Hummer et al. 2000). Among patient-
related factors, the results are not consistent. Reviews by Fenton et al. (1997) and Lacro et al.
(2002) showed inconsistency in the influence of age, gender and ethnicity, illness severity and
the number of prior hospitalisations. However, they did observe greater consistency in the
non-significance of education and income on non-adherence.
My results are at variance with this latter finding as I observed a significant association
between education and non-adherence. Ruscher et al. (1997) found a similar association in a
sample including a range of psychiatric patients and speculated that more educated patients
may have a greater interest in, or feel more confident about, exercising control over their
medication regimen. Better educated patients may also be more sensitive to and reflective
about medication side effects.
As elsewhere (Trauer and Sacks 1998) I did not observe a relationship between gender and
non-adherence. A review by Oehl et al. (2000) did report such a relationship and attributed it
to poorer health care of men in general and the greater likelihood of women to be care-givers
and thus with an incentive to take their medication. A trend exists in the sample for women to
be in better health, though this result does not achieve statistical significance (chi-squared test
p-value=0.108).
As noted earlier, the association between age and non-adherence is not universally observed,
although my analysis does find such a link, with older people reporting better adherence
(Coldham, Addington et al. 2002). My initial hypothesis was that this effect was related to
patient insight and familiarity with medications over time. It has been shown that the longer
the history of illness, the more likely patients are to adhere to their medications (Mojtabai,
Lavelle et al. 2002). But testing the model without the effect of age did not make the index of
medication familiarity significant in the model.
101
Illness severity was found to be associated with non-adherence. Patients with greater
prevalence and severity of symptoms of neurosis and those who had an inpatient stay for a
mental illness in the year prior to being interviewed were more likely to be non-adherent. The
reviews by Fenton et al (1997), Kampman et al (1999)and Nose et al (2003) observed
associations between non-adherence and the severity of psychotic symptoms.
Substance abuse is likely to increase non-adherence (Fenton, Blyler et al. 1997; Kampman
and Lehtinen 1999; Olfson, Mechanic et al. 2000; Lacro, Dunn et al. 2002; Nose, Barbui C et
al. 2003). A significant association was found in my analysis between alcohol abuse and non-
adherence. Previous studies by Swartz et al. (2001) and Owen et al. (1996) have also observed
this association, though Grunebaum et al. (2001) and Coldham et al. (2002) did not. However,
the Grunebaum study was based on a relatively small sample, reducing the ability to observe
significant effects, and focussed on patients in residential care settings where a low
prevalence of substance abuse reflected the sobriety requirement that often exists in
residential settings.
With respect to medication-related factors, I observed a significant association between past
experience of side effects and non-adherence. It has been estimated that between 25% and
66% of patients on antipsychotics discontinue their medications because of side effects
(Conley and Kelly 2001); akathisia being most highly associated with non-adherence (Fenton,
Blyler et al. 1997) and weight gain also likely to be a key factor (Allison and Casey 2001). In
a study examining the degree of moderate and severe distress of side effects the following
ranking was reported: akinesia (40% of patients), weight gain (37.3%), anticholinergic
(33.2%), sexual problems (30.8%) (Weiden and Miller 2001). The same study also found that
side effects are under-reported by up to factor of four when relying on spontaneous report
versus focused interview. Also, adherence has been found to be adversely affected by
complex treatment regimens (Kampman and Lehtinen 1999).
Results of previous studies are inconsistent in the association found with the route of
administration of medication (Fenton, Blyler et al. 1997), but adherence is more easily
monitored in patients receiving depot injection, thus allowing for earlier intervention if non-
adherence occurs (Oehl, Hummer et al. 2000)
102
3.4.2 The association between non-adherence and resource use and costs
Patterns of resource use and costs are associated with a range of patient characteristics, but
differ by service type. Only non-adherence to medication appears to exhibit a consistent
association with greater resource use, and is a significant factor in the use of inpatient and
external services.
A significance association between non-adherence and service use and costs is observed by
Glazer and Ereshefsky (1996) who concluded that measures taken to improve adherence are
likely to decrease total direct treatment costs. Meta-analyses of data from a number of
countries concluded that a 50% improvement in adherence would decrease one-year
rehospitalisation rates by 12% (Weiden and Olfson 1995). Svarstad et al (2001) estimated the
annual cost of hospital expenditures for schizophrenia patients on Medicaid in the US state of
Wisconsin and found irregular medication users to cost, on average, an additional $1,620 per
annum. This difference was statistically significant based on a linear regression analysis of
log-transformed hospital costs that included age, sex, age of onset of illness, Global
Assessment Scale score, alcohol or drug abuse, use of any oral neuroleptic and previous
hospitalisations as covariates. The analysis of the PMS data found the effect of non-adherence
to approach statistical significance in the use of inpatient services and when this result was
combined with the effect on inpatient costs, the difference in costs for a hypothetical patient
was over £2,500 per annum.
Eaddy et al (2005), using medical and pharmacy claims data from a large Southeastern
Medicaid program in the US, found that inpatient hospitalisation charges were 54.5% greater
for partially compliant patients as compared to compliant patients. This effect was statistically
significant. Statistically significant differences were not found in this study when comparing
total health care costs (including inpatient, outpatient and physician costs) for partially
compliant patients with compliant patients. The effect of compliance was estimated using
multivariate linear models of the log transformed charges with the total number of non-
antipsychotic prescriptions, the total number of distinct non-antipsychotic medication classes,
switching and augmentation and prior hospitalisation included as covariates.
Further evidence of a positive association between non-adherence and inpatient stays was
observed by Weiden et al (2004) who used California Medicaid pharmacy refill and medical
103
claims data for 4,325 outpatients with schizophrenia. They found that the longer the gaps in
use of medication (based on the medication possession ratio), the greater the odds of
hospitalisation.
3.4.3 Other factors associated with resource use and costs
Symptom severity and patient satisfaction
The finding that costs of external service use were associated with severity of neurosis was
consistent with results from a study comparing service utilisation in five European locations
(Knapp, Chisholm et al. 2002). Further results from this study (EPSILON) indicate, however,
that satisfaction with services was only weakly associated with demographic and clinical
characteristics (Ruggeri, Lasalvia et al. 2003). It would be expected that satisfaction with
services would be partly reflective of use of services.
Ethnicity
There exists limited published evidence on the relationship between ethnicity and service use
in the treatment of schizophrenia. A US study found that among adolescents, Caucasian
students received more services in the early stages of treatment than did African American
students, but this difference diminished over time (Cuffe, Waller et al. 2001). A survey of US
Medicare recipients found that among persons under age 65, Caucasians were one and a half
times as likely as African Americans to receive an ambulatory care service and 1.3 times as
likely to have received individual therapy. In a study based on data from the Fourth National
Survey of Ethnic Minorities, among respondents with similar scores on the CIS-R, Caribbean
respondents were less likely to have used therapist or social work services (Nazroo 1999).
My findings suggest that visible ethnic minorities are disproportionately more likely to access
inpatient services and less likely to access external services. This suggests a substitution effect
between these two types of services. It is possible that this pattern is the result of a differential
response to symptoms by clinicians. For example, it may be the case that non-White patients
are more likely than White patients to be admitted to inpatient care. Also, Nazroo (1997)
104
suggests that it is possible that if the instruments used underestimate rates of mental illness
among certain ethnic minority groups, a larger proportion of those who were ill in these
groups will not receive treatment. Another factor in this pattern of service use may be the
effect of not having social support to encourage patients to access services. In the sample
studied by Nazroo, 63% of White respondents reported that they lived with an adult with
whom they feel close, while the corresponding rate for non-Whites was only 42%. A previous
study suggested that the incidence of schizophrenia in non-White ethnic minorities increased
significantly as the proportion of such minorities in the local population fell (Boydell, van Os
et al. 2001), while another study showed that differences in the prevalence rate of psychosis
between White British and African or African-Caribbean British samples were markedly
reduced when social and economics factors were accounted for (Brugha, Jenkins et al. 2004).
These results support the inference that social isolation is likely to influence the types of
resources used for psychiatric services by individuals from ethnic minority backgrounds.
Residential care
A study of residents of psychiatric nursing homes found family contact to be associated with
greater likelihood of service use (Anderson, Lyons et al. 2001). A secondary analysis of the
PMS data that focussed on residents of residential care homes, group homes or hostels did not
replicate this result. Those patients with one or more family members with whom they were
close were no more likely to use inpatient services (odds ratio=0.83; 95% confidence interval
An interesting finding was that rates of external service use decreased as severity of neurosis
increased. This result was consistent with a US-based study of residents of an intermediate
care facility that also observed an inverse relationship between severity of illness and service
use (Anderson and Lewis 1999). This result may occur because patients with more serious
symptoms are more likely to be in a psychiatric hospital.
105
Age
Cuffel et al (1996) observed a non-linear relationship between age and service use. Total costs
for schizophrenia were higher for the youngest (18-29) and the oldest cohorts (65-74 and
74+). My results did not indicate an association of this kind. In the analysis of the PMS
institutions sample, only use of day activity services differed by age. As in the PMS, Svarstad
et al (2001) did not observe age to have a significant effect on inpatients’ hospital costs.
Drug use
Interestingly, patients who reported drug use incurred significantly lower costs when external
services were accessed. This suggests that once accessed, relatively limited use of these
services was made by these patients. This may reflect a lack of consistency on the part of drug
users in accessing services.
Svarstad et al (2001) observed an association between alcohol or drug abuse and inpatient
costs. This association was not found in analysis of the PMS data.
3.4.4 Limitations
A potential source of bias in the analysis of the PMS institutional sample arises from the poor
rate of cooperation of institutions selected to take part in the survey. The rate of cooperation
was poorest among private and smaller institutions. It may be the case, for example, that these
cater to individuals with different levels of severity of illness as compared to larger
institutions. As such, it is not necessarily the case that the results observed can be generalised
to all individuals across the full range of accommodation types. Indeed, in the present context,
it is the smaller institutions that are now more common in providing permanent residence to
individuals with schizophrenia.
While the Psychiatric Morbidity Survey dataset offers advantages over some previously
available data used to study non-adherence, there are measures not included that would have
improved the analyses. As previously mentioned, establishing a strong therapeutic alliance
between doctor and patient has previously been shown to be an important influence on
106
adherence (Olfson, Mechanic et al. 2000; Battaglia 2001; Grunebaum, Weiden et al. 2001),
but is not measured in this dataset.
The analyses would also have been improved with inclusion of a measure of patients’
attitudes towards their medication, their insight and cognitive functioning generally
(Robertson, Woerner et al. 2002), and perceptions of their quality of life. A positive view of
psychiatric medications and patient insight has been shown to improve adherence
(Grunebaum, Weiden et al. 2001). These factors may be associated with the health belief
model, which Oehl et al. (2000) suggests is a major determinant of adherence. The model
establishes that adherence is related to a patient’s perception of severity of illness, efficacy of
treatment and ability to influence illness course. The debilitating nature of the illness,
therefore, is thought to relate to lower health belief by the patient, and thus, poorer adherence.
The potentially important omitted variable bias created by some of the above factors not being
available in the dataset was diminished by including the length of time on medication in the
modelling, which is likely to be correlated with patients’ attitutes towards medication and
insight into their illness.
The models do not test for endogeneity due to the lack of suitable instruments in the dataset. It
may be the case that service use may partly explain adherence, and therefore, in modelling the
effect of non-adherence on service use I am missing the reverse causality that might be
present. This simultaneity would lead to the estimate of the effect of non-adherence to be
biased. Note, however, that if services do include reminders and encouragement regarding
medication taking, the effect would be to improve adherence. Thus this effect would be
counter to the effect that I am trying to observe – the effect of non-adherence. That is, the
observed effect of non-adherence would be greater if simultaneity existed and was accounted
for.
The cross-sectional nature of the Psychiatric Morbidity Survey data does not allow for
analysis of the direction of causation in the associations between service use, costs and
potentially associated factors. The analysis of the QUATRO study in the following chapter
presents results where observations over time are collected. The PMS data also do not include
information on the nature of the physician–patient relationship or attitudes towards service
provision which may impact on individual decisions regarding use of services by patients
107
with schizophrenia. Also, supply-side factors could not be considered, although they are
likely to impact on the availability of and access to services and hence on costs. In particular,
inpatient services are sometimes used in place of less costly outpatient mental health services
if the latter are not available (Sullivan, Jackson et al. 1996; Salvador, Haro et al. 1999).
The interpretation of significant vs. non-significant results is complicated by the potential co-
linearity of variables. Preliminary analysis of the PMS data found significant associations
between non-adherence and age, education, illness severity, alcohol abuse and residential
setting. Other models with different combinations of variables were tested but here those that
best summarised the associations found are reported.
Despite these limitations, the analyses are unusual in attempting to identify the factors
associated with the use and cost of services by employing data from national, representative
surveys. In particular, the link with non-adherence is examined closely. Robust statistical
methods are used, increasing confidence in the associations reported. The 1993/4 PMS
surveys were the only source of nationally representative data on psychiatric morbidity at the
time this analysis was undertaken. I am aware that prescribing patterns have changed in the
time since this data was collected. Most significantly, the newer class of antipsychotics,
termed atypical antipsychotics, have become much more widely prescribed. I undertook
research on the trends in antipsychotic prescribing and the factors associated with which type
of antipsychotic was being prescribed in separate analyses which appear in appendix 2.
This analysis showed that the prescribing of the newer atypical antipsychotics in primary care
practices increased significantly between 1993 and 1999, rising from 1.8% of antipsychotics
prescribed in 1993 to 20.8% in 1999. It also found that older individuals were significantly
less likely to be prescribed atypical antipsychotics. Individuals who had had a inpatient stay in
the previous year were one-and-a-half times as likely to be prescribed the newer
antipsychotics as compared to those who had not had a recent inpatient stay. Those
individuals with more frequent primary care consultations were also significantly more likely
to be prescribed the newer antipsychotics as compared to less frequent users of primary care.
These results suggest that the newer antipsychotics were prescribed to patients found in my
analysis to be significantly more likely to not adhere to their medication.
108
3.5 Summary
Patterns of resource use and costs are associated with a range of patient characteristics, but
differ by service type. Only non-adherence to medication appears to exhibit a consistent
association with greater resource use, and is a key factor in the use of inpatient and external
services.
Important factors appear to relate to the degree of needs of the patient and the ability of the
system to address them. For example, after standardising for severity of neurosis, drug misuse
and other factors, the use of inpatient services and the costs incurred as a result of use are
associated with being from a visible ethnic minority. Patients on medication for a significant
length of time tend to make greater use of external services while being less likely to require
inpatient services. The total cost of all services used was strongly associated with residence in
hospital.
109
Chapter 4
The impact of non-adherence to medication in patients with Schizophrenia on health, social care and societal costs – analysis of the QUATRO study
4.1 Background and aims
Subsequent to completing the analyses of the PMS 1993/4 data reported in the previous
chapter, another dataset was sought which would allow robust conclusions to be drawn
regarding the associations between non-adherence and service use costs. As described in
chapter 2 the features sought were that the data were nationally representative of the UK,
sampled relatively recently, had an adequate measure of non-adherence, included
comprehensive information on health and social care service use and indices of as many as
possible of the potential covariates relevant to non-adherence and service use and collected
these data at more than one time point to allow for analysis of changes over time. The Quality
of Life following Adherence Therapy for People Disabled by Schizophrenia and their Carers
(QUATRO) study was chosen for this analysis. While the study data was not nationally
representative of the UK population, it met the other criteria.
The aim of analysis of the QUATRO study was to supplement the analyses of the previous
chapter in determining the impact of non-adherence to medication on service use costs
attributable to schizophrenia. QUATRO was a multi-national randomised controlled trial that
evaluated an adherence therapy intervention for people with schizophrenia.
This analysis builds on the analyses of the Psychiatric Morbidity Surveys (PMS) described in
the previous chapter in three important ways. Firstly the data are more up-to-date. Patients
were recruited for the QUATRO study in 2002/3, whereas the Psychiatric Morbidity Survey
interviews took place in 1993 and 1994 (Meltzer, Gill et al. 1996). A number of changes have
taken place in the treatment of schizophrenia in the intervening period, most notably the
introduction and sharply increased uptake of atypical antipsychotics (King and Knapp 2006).
The newer medications have been argued to reduce side-effects (Sartorius, Fleischhacker et
al. 2002; Sartorius, Fleischhacker et al. 2003), and therefore - other things being equal - are
110
likely to reduce rates of non-adherence. Also, as more patients now live in the community,
rather than in hospital, they are less frequently in contact with care providers who, in
residential or hospital settings, often provide reminders for medication taking.
Secondly, data are collected at two time points and therefore allow for longitudinal analysis.
Longitudinal analysis is superior to cross-sectional modelling. If samples of the same size
were used in each method, the longitudinal study provides greater statistical power. This is
due to the fact that the intra-subject variability is significantly lower than the variability across
subjects (Hedeker and Gibbons 2006). Also, because longitudinal studies allow one to follow
the same individuals over time, they have the advantage of allowing for the analysis of
dynamic responses. This, in turn, makes these studies better suited to make judgements as to
the direction of causality in significant associations (Arellano 2003). Another advantage of
longitudinal studies is that they allow ageing effects (i.e. changes over time within
individuals) to be differentiated from cohort effects (i.e. differences between subjects at
baseline), which cross-sectional studies do not allow (Hedeker and Gibbons 2006).
The third advantage of the QUATRO study relative to the PMS is that it included a wider
range of service use contacts and considered non-health and social care costs which allowed
me to take a wider perspective in assessing the impact of non-adherence to medication in
schizophrenia on costs in society. With respect to costing services in schizophrenia, much of
the costs to the patient, their family and the society as a whole are outside the health and
social care system. For example, lost employment or employment in low-paid work are costs
to both the individual and society that may result from a patient having schizophrenia.
Criminal justice costs, the cost of informal care and the cost of lost employment are the non-
health and social care related costs included in the costing of services reported in the
QUATRO dataset. Mangalore and Knapp (2007) estimated that, in 2004/5, health and social
care costs represented approximately 30% of total societal costs. They further estimated that
annual cost of informal care, criminal justice costs and cost of lost employment for people
with schizophrenia were £604 million, £1.1 million and £4.8 million respectively.
111
4.2. Methods
4.2.1 The QUATRO study
The QUATRO study was a multi-national randomized controlled trial carried out at four
centres across four European countries (Germany, Italy, the Netherlands and the UK), funded
by the European Union and coordinated from the UK. The sample was drawn from adults
receiving care from psychiatric services in each of four European cities: Amsterdam (The
Netherlands), Leipzig (Germany), London (United Kingdom) and Verona (Italy). Data
collection took place between June 2002 and October 2003 (Gray, Leese et al. 2006). Each
sample was recruited from the patient records of senior treating clinicians at a range of local
in-patient and community settings that were typical of general treatment centres in the
catchment areas of each site. The inclusion criteria were that the patient must have had a
clinical diagnosis of schizophrenia, must require on-going antipsychotic medication for at
least one year following the baseline assessment, and must have exhibited evidence of clinical
instability in the year prior to baseline (Gray, Leese et al. 2006). Clinical instability is defined
as meeting one or more of the following criteria: a hospital admission on mental health
grounds, a change in the type or dose of antipsychotic medication, planned or actual increased
frequency of contact with mental health services and indications of clinical instability
reported by relatives, carers or the clinical team. Written, informed consent was obtained from
all participants.
The study was a two-arm randomised controlled trial. Its main aim was to compare the
effectiveness of adherence therapy with a health education control intervention (which
allowed for therapist time and relationship) in improving health-related quality of life for
people with schizophrenia receiving treatment from general adult mental health services in the
four cities (Gray, Leese et al. 2006). Patients were randomly assigned to either receive the
experimental intervention, an individual cognitive-behavioural approach which is
collaborative and patient-centred, or a standard health education control intervention. The six
elements that form the core of the cognitive-behavioural approach are assessment, medication
problem-solving, a medication timeline, exploring ambivalence, discussing beliefs and
concerns about medication, and using medication in the future.
112
Study participants were interviewed at baseline and after 12 months. Interviews were
conducted by a researcher who was blinded as to the allocation of the participant to the
intervention or control group, but the participants were not blinded as to which intervention
they were receiving. Participants were not told, however, which of the two interventions was
regarded by the study investigators as experimental.
Adherence to medication was based on patient responses on the Medication Adherence
Questionaire (MAQ). Positive responses on the MAQ are summed to obtain a Morisky score
(Morisky, Green et al. 1986). The Morisky score is a 5-point scale based on four questions
relating to medication-taking behaviour. It asks patients if they ever forget to take medication,
if they are careless about taking medication, if they ever stop taking medication once they feel
better and if they ever stop taking medication because it made them feel worse. The Morisky
score is widely used to assess adherence (Shalansky 2004; Day, Bentall et al. 2005). The total
score on the scale ranges from 0 (all items rated ‘yes’) to 4 (all items rated ‘no’). For the
purpose of this analysis, values of 0 to 2 on the 5-point scale (0-4) were deemed as reflecting
non-adherence as per the classification used by the QUATRO study team in their analyses
(Gray, Leese et al. 2006). That is, individuals who responded in agreement with two or more
of the medication-taking behaviour questions was classified as non-adherent.
The other main clinical measures assessed in the study were the mental component summary
score on the Medical Outcome Study (MOS) 36-Item Short Form Health Survey (SF-36) and
the Brief Psychiatric Rating Scale – Expanded (BPRS-E). The SF-36 is a self-report measure
of health-related quality of life and well-being (Ware and Sherbourn 1992). The BPRS-E
measures psychiatric symptoms, negative symptoms, depression and anxiety and manic
excitement or disorganisation (Lukoff, Liberman et al. 1986; Ventura, Green et al. 1993).
The Client Service Receipt Inventory (CSRI) (Beecham and Knapp 1992) was used to collect
service use data. The CSRI collects individual patient data on demographic characteristics,
accommodation and living situation, employment history and earnings, including receipt of
benefits, health and social care service receipt, and the role of informal carers. In the
QUATRO study a three month retrospective period was used. Local language versions of the
CSSRI-EU were available from the EPSILON study (Chisholm, Knapp et al. 2000), which
113
carried out a process of translation into local languages, focus groups and pilot activities to
ensure face validity and semantic equivalence.
The study team had non-economist researchers administer the CSRI in face-to-face interviews
with participants. Where there was a concern about the reliability of the reporting of service
use, on account of a patient’s mental illness, supplementary information from key workers,
service providers and/or carers was sought to ensure that the information was as complete and
reliable as possible.
The main finding of the QUATRO study investigators was that adherence to antipsychotic
medication was not directly linked to quality of life in people with schizophrenia, but may be
indirectly linked to quality of life through improvements in symptoms (Gray, Leese et al.
2006; Puschner, Born et al. 2006). The study investigators tested for differences in medication
adherence attributable to the intervention but did not find significant differences (this analysis
controlled for baseline MAQ score and site). A further analysis which restricted the analysis
to a subgroup of the less treatment-adherent participants also found no significant difference
between the groups at follow-up.
The primary outcomes of interest were the direct health and social care costs and societal
costs. Health and social care costs included the cost of medication(s), special (non-hospital)
accommodation, inpatient stays (including the cost of accommodation), outpatient visits,
community-based day services and community-based professional contacts. The individual
items from the questionnaire included in each of these health and social care cost categories,
as well as those that were included as criminal justice and informal care costs, appear in Table
4.1.
Societal costs included health and social care costs, criminal justice, and informal costs as
well as the cost of lost employment. All unit costs were estimated at 2003 price levels. This
year was chosen as it corresponds to the period of time when the trial took place. Unit costs
were estimated in each study site using either suitable national costs or local service activity
and finance data (Patel 2006). Based on the human capital approach, the national average
wage was used to estimate the cost of time off work. The national average wage was also used
to estimate the cost of informal care based on the opportunity cost method. Because the study
114
Table 4.1: Health and social care services and benefits included in analyses, QUATRO study Health and social care services
Medication Special accommodation
Hospital inpatient stays
Hospital outpatient visits
Psychiatric outpatient department Day hospital visits
Community-based day services
Community mental health centre Day activity centre Group therapy Sheltered workshop Specialist education
Community-based professional contacts
Community Psychiatrist Community Psychologist GP District Nurse Community Psychiatric Nurse Social worker Occupational therapist Home help/home care worker
Criminal Justice Police contacts
Nights in police cell or prison Psychiatric assessments Criminal court appearances Civic court appearances
Informal care Childcare
Personal care Help in/around home Help outside home Other care
115
centres were across four countries, it was necessary to convert unit costs to a common
currency. The costs were adjusted to purchasing power parity (PPP)-adjusted Euros (Patel
2006).
4.2.2 Statistical methods
To assess the effect of an intervention in a trial with measurements taken of the outcome of
interest before and after the intervention, the most appropriate method is the difference- in-
difference model (Meyer 1995). The standard difference- in-difference equation is:
The costs associated with days off work were substantially higher than those of informal care,
but few respondents reported incurring these costs. This was, in part, a result of less than 20%
of the sample reporting being in paid employment at baseline.
Table 4.5 lists the estimates of health and social care costs and societal costs, at baseline,
across the four study sites. The vast majority of patients in each site incurred health and social
care costs. These costs varied significantly across sites, with the median ranging from
approximately €44,050 in Leipzig to approximately €8,270 in London. The median societal
costs, at baseline, were highest in Amsterdam, followed by Leipzig, London and Verona.
The median component costs are compared across the study sites in Table 4.6. Data on the
percentage of individuals in each sample site who used each of the services is also included in
the table. Some interesting patterns emerge from these data. For example, within the Dutch
sample, where inpatient and community-based day services were used, the costs incurred are
higher than in the other sites. Inpatient services were more frequently used in Leipzig as
compared to the other sites, with non-hospital accomodation less frequently used in this site.
Outpatient services were more commonly used and the cost of community-based professional
contacts were higher in London as compared to the other sites. Also, informal care was more
widely reported, and at a higher cost, in London.
4.3.3 Health and Social Care costs
The first model estimated the significance of non-adherence and other factors on health and
social care costs. In this model, 770 observations, across the two time points, contributed to
the analyses. A single GLM model was estimated as all individuals with complete data across
the independent variables incurred health and social care costs. The model determined that the
effect of non-adherence was not statistically significantly associated with health care costs
(see Table 4.7). Of the remaining factors considered, significantly higher costs were incurred
amongst those that lived with others as compared to those who lived alone and females
incurred significantly lower health and social care costs than did men. None of the other
individual characteristics were significantly associated with these costs.
125
Table 4.5: Distribution of baseline (i) health and social care and (ii) societal costs in QUATRO study sites (in PPP Euros) Health and social care costs Societal costs Number
Table 4.6: Distribution of health and social care and societal cost components at baseline in QUATRO study sites (in PPP Euros): Median cost (% of sample that used service) Amsterdam
Table 4.7: Generalised linear model of factors associated with health and social care costs – QUATRO study Potentially associated factors N=770
Coefficient 95% Confidence
Interval Treatment… …relative to no treatment
-0.091 -0.40, 0.22
Time 1(follow-up)… …relative to Time 0 (baseline)
-0.29*** -0.49, -0.08
Non-adherent… …relative to adherent
-0.12
-0.37, 0.14
Intervention x Non-adherence interaction 0.51 -0.14, 1.16 Age – 5 year increment 0.017 -0.044, 0.079 Females… …relative to males
-0.27** -0.52, -0.023
Lives alone… …relative to lives with others
-0.40*** -0.65, -0.15
Amsterdam (The Netherlands)… Leipzig (Germany)… Verona (Italy)... ...relative to London (UK)
0.80*** 0.45** -0.10
0.50, 1.10 0.045, 0.86 -0.46, 0.26
Education – further or tertiary... ...relative to primary, secondary or general
0.084 -0.16, 0.33
Not White European… …relative to White-European
-0.23 -0.51, 0.046
Number of years on medication 0.0027 -0.011, 0.016 Constant 9.91*** 9.36, 10.46 Link function Log Distributional family Gamma * p<0.10; ** p<0.05; *** p<0.01
128
Figure 4.1 illustrates the relative impact on health and social care costs of non-adherence and
the factors found to be significantly associated with these costs. A hypothetical reference case
of a woman, aged 45, of White European ethnicity, without tertiary or further (post-
secondary) education, resident in London, who adhered to medication, lived with others,
received adherence education and had been on medication for one year was estimated by the
model to have incured health and social costs of approximately €17,700 in the three months
prior to the follow-up visit. Altering the combination of factors such that this case was that of
a man (all other characteristics remaining the same), the model estimates additional costs of
over €5,400. Living alone was associated with a €5,800 reduction in costs relative to the base
case. Altering the ethnicity to that of somone not White European was associated in the model
with a €3,800 reduction in costs relative to the base case. A €5,000 reduction in costs was
associated with altering the base case to that of someone who does not adhere to their
medication. Note, however, that across the full range of potential values for the remaining
variables considered in the model, the effect of non-adherence was not found to be
statistically significant.
4.3.4 Societal costs
Societal costs were estimated as the sum of health and social care, informal care, criminal
justice and absenteeism costs. As with health and social care costs, a two-part model was
unnecessary as these costs were incurred for all individuals with complete data on the
independent variables. In the model assessing factors for their association with societal costs,
those who reported non-adherence did not differ from those reporting adherence (see Table
4.8; p=0.186). The interaction between treatment and non-adherence approaches statistical
significance (p=0.090) suggesting that the effect of non-adherence on societal costs is
different for those who received treatment compared to those who did not. A test of the linear
combination determined that the effect of non-adherence for the latter group was also not
significantly different from zero (p=0.212).
129
Predicted health and social care costs, QUATRO study
0
5,000
10,000
15,000
20,000
25,000
30,000
35,000
40,000
45,000
case type: female, age 45, White-European, no tertiary or further education,resident in London, adhers to meds, liveswith others, allocated to adherence educ,
followup, on medication for 1 year
case type: male case type: lives alone case type: not White-European case type: Non-adherent
annu
al c
ost i
n €
(200
3 un
it co
sts)
0
5,000
10,000
15,000
20,000
25,000
30,000
35,000
40,000
45,000
Figure 4.1
130
Table 4.8: Generalised linear model of factors associated with societal costs, QUATRO study
Potentially associated factors N=770
Coefficient 95% Confidence Interval
Treatment… …relative to no treatment
-0.065 -0.35, 0.22
Time 1(follow-up)… …relative to Time 0 (baseline)
-0.33*** -0.51, -0.16
Non-adherent… …relative to adherent
-0.16 -0.38, 0.063
Intervention x Non-adherence interaction 0.48* -0.076, 1.04 Age – in 5 year increments -0.025 -0.080, 0.030 Females… …relative to males
-0.037 -0.25, 0.18
Lives alone… …relative to lives with others
-0.39*** -0.61, -0.16
Amsterdam (The Netherlands)… Leipzig (Germany)… Verona (Italy)... ...relative to London (UK)
0.49*** 0.15 -0.22
0.22, 0.76 -0.19, 0.50 -0.53, 0.087
Education – further or tertiary... ...relative to primary, secondary or general
0.17 -0.040, 0.38
Not White European… …relative to White European
-0.40*** -0.64, -0.15
Number of years on medication 0.0036 -0.0085, 0.016 Constant 10.60*** 10.13, 11.07 Link function Log Distributional family Gamma * p<0.10; ** p<0.05; *** p<0.01
131
As with the model of health and social care costs, those who lived with others had
significantly higher societal costs as compared to those who lived alone. Additionally, White
Europeans had significantly higher costs as compared to repondents of other ethnicities.
The relative magnitude of these effects on predicted societal costs are illustrated in Figure 4.2.
The base case was chosen as a man, aged 45, of White European ethnicity, without tertiary of
further education, resident in London, who adhers to his medication, lives with others,
received adherence education and was on medication for 1 year. The model predicted that for
this hypothetical case, societal costs at follow-up would be €27,830. The effect of changing
the base case to that of someone living alone reduced the predicted societal costs by €8,900 as
compared to the base case. A similar reduction in costs would be expected if the case was
changed to that it was of a non-White European. A change to the educational level of the base
case to having tertiary or further education increases the predicted societal costs by €5,350
relative to the base case. An individual with the same characteristics as in the base case but
who was non-adherent was predicted by the model to incur €6,380 less in societal costs at
follow-up.
4.3.5 Component costs
Analyses were undertaken to determine if any of the individual services that were key
components of overall costs were associated with non-adherence. These analyses may help
determine which, if any, particular types of services used by people with schizophrenia were
strongly impacted by non-adherence. The services deemed to be most influencial on total
costs, both in terms of the number of users of the service and the costs incurred, were
inpatient visits, community-based day services and informal care. Within each of these, a
significant number of individuals in the sample did not use the service and therefore, two-part
models were used. Recall that the first part of the two-part model uses a logistic regression
model to assess factors for their association with whether or not the service was used and the
second part uses a GLM to assess factors for their association with the costs incurred within
the subsample of individuals who used the service.
132
Predicted societal costs, QUATRO study
0
5,000
10,000
15,000
20,000
25,000
30,000
35,000
40,000
45,000
50,000
55,000
60,000
case type: male, age 45, White-European, no tertiary or furthereducation, resident in London,
adhers to meds, lives with others,allocated to adherence educ,
followup, on medication for 1 year
case type: lives alone case type: with teriatry or furthereducation
case type: not White-European case type: Non-adherent
annu
al c
osts
in €
(200
3 un
it co
sts)
0
5,000
10,000
15,000
20,000
25,000
30,000
35,000
40,000
45,000
50,000
55,000
60,000
Figure 4.2
133
Inpatient stays
The logistic regression model found that individuals who lived alone were less likely to have
had an inpatient stay as compared to those who lived with others. None of the other individual
characteristics considered was significantly associated with having had an inpatient stay (see
Table 4.9). The model correctly predicted whether or not inpatient stays had occurred for 65%
of cases. The link test p-value for this model was 0.2976 suggesting that the model was not
misspecified, and the likelihood ratio, Pearson’s and Hosmer-Lemeshow test p-values
suggested acceptable goodness of fit.
With respect to inpatient costs, the GLM model found that inpatient costs were not
significantly associated with any of the factors considered. The interaction of treatment and
non-adherence approached statistical significance (p=0.077), suggesting that the effect of non-
adherence on inpatient costs was different for those who received treatment compared to those
who did not. There was a trend towards inpatient costs being significantly higher for this
group (p=0.083). Thus for those not receiving the study intervention (or prior to receiving the
intervention), the effect of non-adherence was not significant. Receipt of treatment was
associated with a trend towards non-adherence being associated with higher costs.
There was also a trend for ethnic minority respondents to have lower inpatient costs as
compared to White European respondents (see Table 4.10; p=0.060). Because the factors
considered did not appear to be associated with inpatient costs, predictions for case types
comparing costs were not estimated.
Community-based day services
The next key group of services modelled were community-based day services. In a logistic
regression model of whether or not these services were used, living alone and time on
medication were significant (see Table 4.11). Individuals who lived alone were two times as
likely to have used community-based day services as compared to those who lived with
others.
134
Table 4.9: Logistic regression model of factors associated with use of inpatient services, QUATRO study Potentially associated factors N=770
Odds ratio 95% Confidence Interval
Treatment… …relative to no treatment
0.93 0.55, 1.56
Time 1(follow-up)… …relative to Time 0 (baseline)
0.46*** 0.31, 0.68
Non-adherent… …relative to adherent
1.40 0.92, 2.15
Intervention x Non-adherence interaction 1.02 0.39, 2.69 Age (5 year increase in age) 0.99 0.90, 1.09 Females… …relative to males
0.97 0.69, 1.36
Lives alone… …relative to lives with others
0.67** 0.48, 0.94
Amsterdam (The Netherlands)… Leipzig (Germany)… Verona (Italy)... ...relative to London (UK)
1.69** 4.69***
0.87
1.02, 2.80 2.71, 8.13 0.51, 1.46
Education – further or tertiary... ...relative to primary, secondary or general
1.05 0.74, 1.49
Not White European… …relative to White European
0.99 0.62, 1.58
Number of years on medication 0.99 0.97, 1.01 Link test p-value 0.2976 Pearson’s chi-squared test p-value 0.2997 Hosmer-Lemeshow chi-squared test p-value 0.2087 Likelihood ratio chi-squared p-value 0.0001 Percent correctly classified 66.18 * p<0.10; ** p<0.05; *** p<0.01
135
Table 4.10: Generalised linear model of factors associated with inpatient costs, QUATRO study Potentially associated factors N=291
Coefficient 95% Confidence Interval
Treatment… …relative to no treatment
-0.033 -0.45, 0.38
Time 1(follow-up)… …relative to Time 0 (baseline)
-0.23 -0.58, 0.13
Non-adherent… …relative to adherent
-0.092 -0.49, 0.30
Intervention x Non-adherence interaction 0.99* -0.15, 2.13 Age – in 5 year increments 0.0051 -0.074, 0.085 Females… …relative to males
-0.20 -0.50, 0.10
Lives alone… …relative to lives with others
-0.14 -0.44, 0.16
Amsterdam (The Netherlands)… Leipzig (Germany)… Verona (Italy)... ...relative to London (UK)
1.07*** -0.24 -0.41
0.62, 1.51 -0.74, 0.27 -1.02, 0.21
Education – further or tertiary... ...relative to primary, secondary or general
0.17 -0.17, 0.50
Not White European… …relative to White European
-0.38** -0.77, 0.0023
Number of years on medication 0.0022 -0.018, 0.022 Constant 9.93*** 9.24, 10.62 Link function Log Distributional family Gamma * p<0.10; ** p<0.05; *** p<0.01
136
Table 4.11: Logistic regression model of factors associated with use of community-based day services, QUATRO study Potentially associated factors N=770
Odds ratio 95% Confidence Interval
Treatment… …relative to no treatment group
1.33 0.83, 2.12
Time 1(follow-up)… …relative to Time 0 (baseline)
1.03 0.71, 1.49
Non-adherent… …relative to adherent
0.86 0.57, 1.31
Intervention x Non-adherence interaction 0.41* 0.16, 1.11 Age (5 year increase in age) 1.04 0.95, 1.14 Females… …relative to males
1.05 0.76, 1.46
Lives alone… …relative to lives with others
2.06*** 1.49, 2.83
Amsterdam (The Netherlands)… Leipzig (Germany)… Verona (Italy)... ...relative to London (UK)
0.77 0.95 1.38
0.47, 1.25 0.56, 1.61 0.84, 2.25
Education – further or tertiary... ...relative to primary, secondary or general
0.88 0.63, 1.23
Not White European… …relative to White European
1.20 0.76, 1.91
Number of years on medication 1.02* 1.00, 1.04 Link test p-value 0.4232 Pearson’s chi-squared test p-value 0.3207 Hosmer-Lemeshow chi-squared test p-value 0.6205 Likelihood ratio chi-squared p-value 0.0001 Percent correctly classified 61.46 * p<0.10; ** p<0.05; *** p<0.01
137
Also, the greater the number of years on medication, the greater the probability of having used
community-based day services. This model correctly predicted 61% of cases and the link test
suggested that the model was not misspecified. The likelihood ratio, Pearson’s and Hosmer-
Lemeshow test p-values suggested acceptable goodness-of-fit.
The interaction between treatment and non-adherence in this model approached statistical
significance (p=0.080). If the effect of non-adherence is estimated seperately for those who
received the study intervention, the odds of using community-based day services are
significantly lower for those within this group who were non-adherent as compared to those
who did adhere.
Among those who used community-based day services, the GLM model found that non-
adherence was associated with the costs incurred. That is, community-based day service use
costs were significantly lower for those deemed non-adherent as compared to those who did
adhere to their medication (see Table 4.12). Additionally, women incurred less costs than men
and those with a tertiary or further education incurred greater costs as compared to those
without this level of education.
Again the interaction term approached significance (p=0.075) suggesting that the effect of
non-adherence differed according to whether or not the study intervention was received.
Separate estimation of the effect of non-adherence on community-based day service use costs
for those who received the study intervention found this effect to not be significantly different
from zero (p=0.424).
Graphicallly, the effects of non-adherence and the other significant variables are illustrated in
Figure 4.3. Relative to the base case (male, age 45, of White European ethnicity, without
tertiary or further education, resident in London, adheres to medication, lives with others,
randomised to adherence education and on medication for six years), follow-up community-
based day service use costs were halved if the base case was altered to be that of an individual
non-adherent to medication. An increase in costs of approximately €600 was predicted if the
base case was altered to be an individual living alone.
138
Table 4.12: Generalised linear model of factors associated with cost of community-based day services, QUATRO study Potentially associated factors N=282
Coefficient 95% Confidence Interval
Treatment… …relative to no treatment
-0.87** -1.55, -0.18
Time 1(follow-up)… …relative to Time 0 (baseline)
-0.076 -0.65, 0.50
Non-adherent… …relative to adherent
-0.72** -1.37, -0.078
Intervention x Non-adherence interaction 1.12* -0.11, 2.34 Age – in 5 year increments 0.13 -0.039, 0.30 Females… …relative to males
-0.66** -1.22, -0.11
Lives alone… …relative to lives with others
0.26 -0.31, 0.82
Amsterdam (The Netherlands)… Leipzig (Germany)… Verona (Italy)... ...relative to London (UK)
0.51 0.52 -0.36
-0.23, 1.24 -0.74, 1.78 -1.12, 0.40
Education – further or tertiary... ...relative to primary, secondary or general
0.71** 0.11, 1.32
Not White European… …relative to White European
0.016 -0.63, 0.66
Number of years on medication -0.021 -0.052, 0.011 Constant 7.72*** 6.38, 9.07 Link function Log Distributional family Gamma Net effect of non-adherence if adjusted is 0.44 (-0.64, 1.52) * p<0.10; ** p<0.05; *** p<0.01
139
Predicted cost of community-based day services, QUATRO study
0
500
1,000
1,500
2,000
2,500
3,000
3,500
4,000
4,500
5,000
case type: male, age 45,White-European, no tertiaryor further education, residentin London, adhers to meds,
lives with others, allocated toadherence educ, followup, on
medication for 6 years
case type: Lives alone case type: Non-adherent case type: Age 30 case type: Female case type: Tertiary or furthereducation
annu
al c
ost i
n €
(200
3 un
it co
sts)
0
500
1,000
1,500
2,000
2,500
3,000
3,500
4,000
4,500
5,000
Figure 4.3
140
Informal care costs
The final key cost component to be analysed were informal care costs. The logistic regression
model found that among individual characteristics, living with others was associated with
receipt of informal care as would be expected (see Table 4.13). Those who lived alone were
30% less likely to receive informal care. The link test suggested this model was adequately
specified. The model correctly classified 59% of cases. The Pearson’s, Hosmer-Lemeshow
and likelihood ratio test p-values all suggested adequate goodness-of-fit.
The GLM on informal care costs did not find non-adherence to be significanly associated with
informal care costs amongst those who received informal care (see Table 4.14). These costs
were associated with age and gender. The association with age was negative. That is, within
the sample of recipients of informal care, as age increased, the informal care costs declined.
With respect to the other significant effect, women had greater informal care costs than men.
Figure 4.4 graphically illustrates the impact of the significant effects on informal care receipt
and costs relative to a base case. The base case chosen was the same as in Figure 4.3. That is,
of a man, age 45, of White European ethnicity, without tertiary or further education, resident
in London, who adheres to medication, lives with others, allocated to adherence education and
on medication for six years. The model predicted the informal care costs for the base case to
be €3,250. Altering the base case to that of someone who lives alone was associated with a
€1,000 reduction in the predicted cost of informal care. If the characteristics of the base case
are altered such that the case is of a 30 year old, the predicted costs would increase by just
under €1,200. A €4,100 increase in predicted informal care costs was associated with the
effect of changing the base case to that of a woman as opposed to a man.
141
Table 4.13: Logistic regression model of factors associated with receipt of informal care, QUATRO study Potentially associated factors N=768
Odds ratio 95% Confidence Interval
Treatment… …relative to no treatment group
0.96 0.60, 1.54
Time 1(follow-up)… …relative to Time 0 (baseline)
0.57*** 0.40, 0.82
Non-adherent… …relative to adherent
1.16 0.77, 1.75
Intervention x Non-adherence interaction 1.18 0.50, 2.78 Age (5 year increase in age) 1.05 0.97, 1.15 Females… …relative to males
1.19 0.86, 1.63
Lives alone… …relative to lives with others
0.70** 0.51, 0.96
Amsterdam (The Netherlands)… Leipzig (Germany)… Verona (Italy)... ...relative to London (UK)
0.54** 1.11 0.89
0.33, 0.87 0.67, 1.84 0.55, 1.42
Education – further or tertiary... ...relative to primary, secondary or general
1.05 0.76, 1.47
Not White European… …relative to White European
0.91 0.58, 1.44
Number of years on medication 1.00 0.98, 1.02 Link test p-value 0.2414 Pearson’s chi-squared test p-value 0.3790 Hosmer-Lemeshow chi-squared test p-value 0.6395 Likelihood ratio chi-squared p-value 0.0001 Percent correctly classified 58.9 * p<0.10; ** p<0.05; *** p<0.01
142
Table 4.14: Generalised linear model of factors associated with cost of informal care, QUATRO study Potentially associated factors N=326
Coefficient 95% Confidence Interval
Treatment… …relative to no treatment group
-0.25 -1.03, 0.53
Time 1(follow-up)… …relative to Time 0 (baseline)
0.51* -0.049, 1.08
Non-adherent… …relative to adherent
-0.15 -0.42, 0.13
Intervention x Non-adherence interaction -0.018 -1.12, 1.08 Age – in 5 year increments -0.13*** -0.21, -0.042 Females… …relative to males
0.77*** 0.46, 1.07
Lives alone… …relative to lives with others
-0.19 -0.46, 0.078
Amsterdam (The Netherlands)… Leipzig (Germany)… Verona (Italy)... ...relative to London (UK)
-1.38*** -0.086 -0.10
-1.75, -1.01 -0.61, 0.43 -0.50, 0.29
Education – further or tertiary... ...relative to primary, secondary or general
0.21 -0.096, 0.51
Not White European… …relative to White European
-0.14 -0.48, 0.20
Number of years on medication 0.0062 -0.013, 0.025 Constant 9.82*** 9.12, 10.51 Link function Log Distributional family Inverse Gaussian * p<0.10; ** p<0.05; *** p<0.01
143
Predicted cost of informal care, QUATRO study
0
2,000
4,000
6,000
8,000
10,000
12,000
14,000
case type: male, age 45, White-European, no tertiary or furthereducation, resident in London,
adhers to meds, lives with others,allocated to adherence educ,
followup, on medication for 6 years
case type: Lives alone case type: Age 30 case type: Female case type: Non-adherent
annu
al c
ost i
n €
(200
3 un
it co
sts)
0
2,000
4,000
6,000
8,000
10,000
12,000
14,000
Figure 4.4
144
4.3.6 Sensitivity analyses
Estimates from previous studies are that between 25% and 80% of schizophrenia patients do
not adhere to their medication as prescribed (Battaglia 2001; Conley and Kelly 2001). Cramer
and Rosenheck (1999), in a systematic review, found the mean rate of non-adherence among
patients with psychoses to be 42%. The rate of non-adherence in the QUATRO study was at
the low end, ranging from 11% to 49% across sites. Given that the rate of non-adherence was
markedly lower in Amsterdam (11%) relative to the three other sites, sensitivity analyses were
conducted to determine the effect of excluding the patients from Amsterdam to see how this
would impact the study results.
In the model of societal costs, excluding the Amsterdam sample the effect of non-adherence
increases but remains statistically insignificant (see Table 4.15; p=0.115). Also, as in the
primary results, in the model of health and social care costs which excluded observations from
Amsterdam, the effect of non-adherence did not achieve statistical significance (p=0.246).
The interaction between treatment and non-adherence was statistically significant in this
model at the 0.05 level. While the effect of non-adherence was not significant when the study
intervention is not received, amongst recipients there was a significant positive association
between non-adherence and inpatient costs (p=0.021).
The association between non-adherence and the probability of use of community-based day
services differs by receipt of the study intervention when the Amsterdam sample is excluded
from the analyses. When the intervention was received there was a significantly lower
probability of use of these services (p=0.004). At the same time, amongst those not receiving
the study intervention non-adherence was associated with significantly lower community-
based day service use costs (p=0.028). These costs were not associated with non-adherence
amongst recipients of the study intervention. Additionally, excluding the Amsterdam sample
resulted in there being a significant negative association between non-adherence and informal
care costs.
145
Table 4.15: Results of sensitivity analysis on effect of non-adherence on primary outcomes, QUATRO study - Excluding observations from Amsterdam § Outcome Coefficient 95% Confidence
Interval Excluding Amsterdam sample Non-adherence
Health and social care costs
-0.16 -0.44, 0.11
Treatment x Non-adherence interaction
0.56 -0.17, 1.29
Non-adherence
Societal costs
-0.19 -0.43, 0.047
Treatment x Non-adherence interaction
0.57 -0.034, 1.18
Non-adherence
Inpatient visits
1.43 0.90, 2.27
Treatment x Non-adherence interaction
1.23 0.43, 3.55
Non-adherence
Inpatient costs
-0.11 -0.52, 0.31
Treatment x Non-adherence interaction
1.29** 0.13, 2.46
Non-adherence
Use of community-based day services
0.81 0.52, 1.26
Treatment x Non-adherence interaction
0.28** 0.095, 0.84
Non-adherence
Cost of community-based day services
-0.72** -1.37, -0.078
Treatment x Non-adherence interaction
1.17* -0.11, 2.34
Non-adherence
Use of informal care
1.21 0.78, 1.87
Treatment x Non-adherence interaction
1.17 0.47, 2.91
Non-adherence
Cost of informal care
-0.36** -0.71, -0.015
Treatment x Non-adherence interaction
0.65 -0.43, 1.72
* p<0.10; ** p<0.05; *** p<0.01 §All other effects are included in these models but are not listed here.
146
Another sensitivity analysis was undertaken to determine the impact of the choice of threshold
in the Morisky score used to determine non-adherence. Shalansky (2004) suggests using other
choices of a threshold score so as to trade off between the sensitivity and positive predictive
value of the scale in detecting ‘true’ non-adherent patients. Sensitivity analyses were
conducted to determine if using a threshold score of 3 on the Morisky score to define non-
adherence would have an impact on the results. That is, individuals were deemed non-
adherent if they reported that in the past three months they had at some point either forgotten
to take medication, were careless about taking medication, had at some point stopped taking
medication once they felt better, or had at some point stopped taking medication because it
made them feel worse.
Using the lower threshold level suggested that 52.8% of the sample were non-adherent at
baseline. For all of the outcomes analysed the effect of non-adherence remained statistically
non-significant (see Table 4.16). Thus, the higher threshold did not alter the results of the
primary analyses.
4.4 Discussion
The results of the analyses set out in this chapter suggest that non-adherence does not have a
significant impact on the health and social care or societal costs incurred in schizophrenia
patients. This finding is not consistent with analyses in the previous chapter that looked at
factors associated with use of health and social care services which included residential
costs. For subsamples of the data, there was evidence of non-adherence being associated with
higher inpatient costs. For some subsamples there was evidence that non-adherence was
associated with lower community-based day service use costs when these costs were incurred.
While the samples and settings of the PMS 1993/4 and QUATRO studies differ markedly, the
results suggest that the contribution to costs of non-adherence may be relevant for some
services. This is consistent with the results observed by Gilmer et al (2004). They found that
while total costs were actually lower for those individuals who did not adhere to their
medication, hospital costs were significantly higher for the non-adherent group.
147
Table 4.16: Results of sensitivity analysis on effect of non-adherence on primary outcomes, QUATRO study - Lower threshold to define non-adherence § Outcome Coefficient 95% Confidence
Interval Lower threshold used to define non-adherence Non-adherence
Health and social care costs
-0.057 -0.35, 0.24
Treatment x Non-adherence interaction
0.16 -0.35, 0.67
Non-adherence
Societal costs
-0.072 -0.33, 0.18
Treatment x Non-adherence interaction
0.033 -0.44, 0.50
Non-adherence
Inpatient visits 1.14 0.78, 1.67
Treatment x Non-adherence interaction
1.23 0.55, 2.73
Non-adherence
Inpatient costs -0.16 -0.54, 0.22
Treatment x Non-adherence interaction
0.24 -0.51, 0.99
Non-adherence
Use of community-based day services
0.83 0.56, 1.22
Treatment x Non-adherence interaction
0.65 0.31, 1.36
Non-adherence
Cost of community-based day services
-0.016 -0.77, 0.74
Treatment x Non-adherence interaction
-0.090 -1.16, 0.98
Non-adherence
Use of informal care
1.07 0.74, 1.54
Treatment x Non-adherence interaction
0.98 0.47, 2.03
Non-adherence
Cost of informal care
-0.14 -0.45, 0.17
Treatment x Non-adherence interaction
-0.78 -1.75, 0.20
* p<0.10; ** p<0.05; *** p<0.01 §All other effects are included in these models but are not listed here.
148
One consideration as to why non-adherence was not significant in predicting health and social
care or societal costs in the QUATRO study was that the sample for this study was made up
of patients deemed to be clinically unstable in the year prior to the start of the study. Indeed, a
hospital inpatient stay in the year prior to the study was one of the criteria for individuals to
be considered for inclusion in the study. These patients were likely to be less functional than a
general schizophrenia sample. However, this was also an inclusion criterion in the study by
Gilmer et al (2004) which observed no statistically significant difference in total treatment
costs between adherent, partially adherent and non-adherenct individuals, but significantly
higher hospitalisation costs for the non-adherent group. Relative to the 1993/4 PMS sample,
when a comparable index of non-adherence was used for the QUATRO sample (Morisky
score of 3 or below), the latter were, at baseline, more likely to be non-adherent and had been
on medication for longer, potentially reflecting greater severity of illness. The QUATRO
sample was also more ethnically diverse and had higher educational attainment, on average,
as compared to the 1993/4 PMS sample.
Another consideration is whether or not the sample in the QUATRO study was large enough
to detect meaningful differences in costs with sufficient power. The sample size calculation
performed for this study was based on the primary clinical outcome of the main study, the SF-
36 mental component summary score (Gray, Leese et al. 2006). Retrospective estimation of
the power of this study for the service use outcomes (and by extension costs) is difficult as
these outcomes typically have high variability leading to under estimation of power (Gray,
Marshall et al. 1997). Based on the standard error observed in the analysis of health and social
care costs, the sample size of the study was sufficient to observe a 44% difference in costs
with 80% power. How much of a change in costs this represents depends on where on the
distribution of costs it is applied. At the 10th percentile, a change of 44% is less than the
difference between the 10th and 5th percentile. At the 90th percentile, a 44% change would
reflect the difference from the 90% to the 76th percentile. With respect to societal costs, the
sample size of the study was sufficient to observe a 38% difference in costs with 80% power.
Previous studies that have examined the relationship between non-adherence and health care
costs have focussed on hospitalisation costs. Svarstad et al (2001) found non-adherers, that is
those whose claims data indicated a three month gap in claims for medication, were
significantly more likely to have been rehopsitalised and incurred significantly higher
inpatient costs. Weiden et al (2004) observed that gaps in medication therapy, based on
149
prescription claims, were positively correlated with risk of hospitalisation In the PMS
analysis there was a trend towards an association between inpatient visits and non-adherence
being significant, but this was the case in the QUATRO analysis only for those patients who
received the study intervention.
Non-adherence was associated with lower community-based day service costs (when these
services were used) in the QUATRO study. In the analysis of the PMS 1993/4 sample, visits
to patients by community-based health and social care professions were positively associated
with non-adherence. If it is accepted that non-adherence to medication will result in
resumption or exacerbation of symptoms in patients taking antipsychotics, the point of contact
for non-adherent patients will depend on how long they wait before seeking health and social
care help, the way services are organised in their area and the ease with which they are able to
access the services they seek out. If non-adherent patients do not seek health or social care
support as their symptoms increase in severity, the effects of non-adherence may be observed
in the wider societal services such as the criminal justice system. My results suggest that
community care professionals may be the primary source of care for non-adherent individuals
who require services. Use of community-based day services appears to associated with a
greater degree of acceptance of medication (based on adherence and length of time on
medication).
The observed lower health and social care and societal costs experienced by those patients
living alone may reflect the role that co-resident family and friends play in identifying and
encouraging those individuals with schizophrenia to access the available services. However,
those living alone were significantly more likely to use community-based day services.
Community-based day services are the services most likely to be substituted with informal
care. This suggests that informal care acts as a substitute for community-based day services
but as a complement to other health and social care services. Because these effects were
present after accounting for non-adherence in the model, it would indicate that the impact of
co-resident family or friends was not affecting costs solely through reduced rates of non-
adherence. These results were not observed in the earlier analyses of PMS data.
Also contradictory to the earlier analyses is the direction of the association between ethnicity
and costs. The PMS analysis did not find a significant difference in total health and social care
costs between non-Whites and Whites, though non-Whites had significantly higher inpatient
150
costs and were significantly less likely to use external services. Analysis of the QUATRO
data indicated that sample subjects who were not White European had lower health and social
care costs (at a level that approached statistical significance) and significantly lower societal
costs. There was also a trend for those not White European to have incurred lower inpatient
costs when inpatient services were used. More than one interpretation of these contradictory
findings is possible, although further information would be required to conclude definitively.
It may be that the two ethnic minority subsamples differed quite significantly in the two
studies. The PMS data compared all non-Whites to Whites while the QUATRO study
compared White Europeans with other ethnicities. Also, the settings of the two studies differ
appreciably. The effect of ethnicity observed in a study of British patients would be expected
to differ from this effect as estimated in a study including individuals from other countries. It
should be noted, however, that in the QUATRO study, only the London (46.7%) and
Amsterdam (56.0%) samples included ethnic minority patients. Further difference on the
ethnic mix of the non-White samples could exist. Minority ethnic groups were not sampled in
sufficient numbers to determine wether the mix of ethnicities were similar in the two studies.
The difficulty with making conclusions regarding the impact of ethnicity is that like the PMS
and QUATRO studies, few studies are sufficiently large to sample from ethnic minorities with
schizophrenia in sufficient numbers.
The analysis of the PMS data identified associations between length of time on medication
and the use of external services and day activity services. In the QUATRO analysis a
significant positive association was found between length of time on medication and use of
community-based day services. These results suggest that familiarity with medical treatment
allows patients to feel more comfortable with use of community-based services. These results
may also, in part, reflect greater stability in the treatment of patients over the course of their
illness. That is, patients may become more able to rely on community services as opposed to
inpatient or outpatient services. Another conclusion may be warranted, however, as the
QUATRO study sampled unstable patients so one would expect that familiarity with
medication in this group to be poor and unrepresentative of stability of their medication
regime.
151
4.4.1 Limitations
There are several aspects of the QUATRO study that may limit the strength of the conclusions
drawn from these data. Firstly, the sample in the QUATRO study was relatively small, both
overall and within each site. The results may not be generalisable to the populations within
each site and across sites.
The use of a multi-centre, cross-country sample has some advantages, but may also lead to
problems and uncertainty. There are many challenges to such a study design as survey
instruments have to be translated and in costing services uncertainty is likely given that
services are delivered in different ways across sites and unit costs for services are not always
available (Patel 2006). With regards to differences in unit costs across countries, a sudy by
Heider et al (2009), which followed samples of schizophrenia patients in France, Germany
and the UK for two years, found that while differences existed in the costs for individual
services, the total adjusted costs of health services were less variable than the unit costs.
Because the Morisky scale is basing non-adherence assessment on self-reporting, it runs the
risk of underestimating non-adherence. As discussed in chapter 2, however, self-assessment
of non-adherence is the method most widely used in studies of schizophrenia patients
(Velligan, Lam et al. 2006) and few studies corroborate self-reported adherence with pill
counts or physiological data (Zygmunt, Olfson et al. 2002). More fundamentally, comparisons
across studies are difficult because the definitions of what constitutes adherence, the period
over which it is assessed and the sample of patients on whom it is assessed, vary widely
across studies.
The QUATRO study data is also lacking information that would be beneficial in the
interpretation of the nature of the relationship between non-adherence to medication in
schizophrenia and service use costs. The prior analysis of PMS data adjusted for some factors
that were not considered in the analysis of the QUATRO data because they were not available
in the dataset. These were general health status, whether or not co-morbidity was present
(based on the CIS-R score), self-reported use of illegal drugs and self-reported alcohol abuse.
However, none of these factors were statistically significant in the model of total health and
social care costs in the previous analyses. The PMS analysis observed an association between
152
drug abuse and lower costs of external service use. Unfortunately, because the QUATRO
study did not collect data on illegal drug use this association could not be tested for in the
current analysis.
Another important omission is data on the type of antipsychotics prescribed to the patients in
the study. Without this information it is not possible to determine if certain prescribed
antipsychotics are more cost inducing than others, or in fact if the general class of the
antipsyhchotic, ‘typical’ or ‘atypical’ impacts on costs. Evidence to date suggests that
adherence rates are similar across the different generation of antipsychotics and across
different specific medications. Gilmer et al (2004) found no difference in adherence rates
between those treated with the atypical antipsychotics risperidone, olanzapine and quetiapine
and those treated with typical antipsychotics and refers to two other studies where similar
results were found. They do not, however, compare service use costs across medications.
There may be other effects of the type or class of antipsychotic prescribed that may impact on
costs. For example, it could be the case that a particular medication was better than others in
preventing weight gain which did not impact on adherence rates but did reduce costs incurred
from illness due to the gain in weight. For this reason, it is not possible to say that had data on
the type or class of drug been included in the QUATRO study, this would have had a direct
impact on the interpretation of the effect of non-adherence in this study. Also, as mentioned
earlier, the reason for not including the cost of treatment in the measure of costs was that is
would be in effect replicating a difference in the treatment and control groups that is
determined by the inclusion of a treatment effect in the model.
Finally, while longitudinal, the duration of the QUATRO study is still quite short relative to a
lifetime of schizophrenia and the (probable) long-term impacts of non-adherence. That is,
some of the negative impacts of non-adherence might not be observed within the one year
over which patients were followed in this study or if changes in service use have occurred,
these changes may persist for longer than this length of time.
Despite these limitations the analysis of the QUATRO study data was helpful in assessing the
relationship between non-adherence and costs. Unlike previous literature that has tended to
estimate this association using cross-sectional data, the longitudinal element of this study
allows for estimates to take account of changes over time. The longitudinal nature of the
153
study, the robust method of assessing adherence and the detailed information on service use
data made it the best available source for examining these associations.
4.5 Summary
The QUATRO study, a randomised control trial assessing the efficacy of an adherence
therapy intervention in individuals with schizophrenia, provided longitudinal data from which
to analyse the relationship between non-adherence and service use costs. The dataset included
thorough information from which health and social care service use costs were estimated, as
well as criminal justice and informal care costs. The sum of these costs was taken as an
approximation of societal costs.
Non-adherence was not found to be associated with either health and social care service use
costs or societal costs, but for subsamples of individuals was significantly associated with
higher inpatient costs and lower community-based day service costs. The significance of non-
adherence may have been underestimated as the sample was made up of clinically unstable
patients. The service use patterns of these individuals may not be representative of a broader
range of patients with schizophrenia. Also, the sample of the QUATRO study may not have
been large enough to observe meaningful differences in costs with adequate power. Further,
the duration of the QUATRO study – one year – may not have been sufficiently long to
observe the long-term effects of non-adherence.
Living alone was associated with significantly lower health and social care and societal
costs.This may reflect the importance of support from family and friends in the lives of people
with schizophrenia in encouraging them to seek out services and providing informal care. The
associations between ethnicity and a lower probability of use of community services and a
greater probability of inpatient visits found in analysis of the 1993/4 PMS institutions sample
were not observed in this dataset.
154
ACKNOWLEDGEMENT FOR USE OF QUATRO STUDY DATA The QUATRO study is a multi-centre collaboration between the Health Services Research Department, Institute of Psychiatry, King’s College London, London, UK; the Department of Medicine and Public Health, Section of Psychiatry and Clinical Psychology, University of Verona, Italy; the Department of Psychiatry, Leipzig University, and the Department of Psychiatry II, Ulm University, Germany; and the Department of Psychiatry, Academic Medical Center, University of Amsterdam, Netherlands. The study was funded by a grant from the Quality of Life and Management of Living Resources Programme of the European Union (QLG4-CT-2001-01734). The views expressed in this paper are my own and not necessarily those of the funder or collaborators. I wish to acknowledge the contributions of the patients, carers and staff who have taken part in this study and the contributions of the following colleagues to the overall QUATRO study: Amsterdam (Aart Schene, Annemarie Fouwels, Martijn Kikkert, Maarten Koeter, Karin Meijer); Leipzig/Ulm (Thomas Becker, Matthias Angermeyer, Anja Born, Anne Gießler, Hedda Helm, Bernd Puschner); London (Jonathan Bindman, Jayne Camara, Anthony David, Richard Gray, Martin Knapp, Morven Leese, Paul McCrone, Mauricio Moreno, Anita Patel, Debbie Robson, Graham Thornicroft, Ian White); Verona (Michele Tansella, Francesco Amaddeo, Corrado Barbui, Lorenzo Burti, Daniela Celani, Doriana Cristofalo, Claudia Goss, Antonio Lasalvia, Giovanna Marrella, Mariangela Mazzi, Michela Nosè, Mirella Ruggeri, Marta Solfa).
155
Chapter 5
Associations between medication non-adherence and resource use and costs for people taking medication for depression – analysis of the Psychiatric Morbidity
Survey 2000
5.1 Background
Given that some illnesses are more debilitating than others, it follows that attitudes towards
medication are likely to vary widely across illnesses. Furthermore, the side effects of
medications differ widely across medication types and these differences are reflected in
varying rates of non-adherence to medication across different illnesses. In trying to
understand the impact of non-adherence to medication on service use and service use costs in
patients with schizophrenia it is important, therefore, to consider how the associations differ
from those that would be observed in a different illness population. To do this, I have chosen
to look at patients with another mental illness, depression.
The UK Office of National Statistics (2008) estimates that the prevalence of treated
depression in the UK was 5% in 1998 and the World Health Organization estimated that
major depression will carry the second highest disease burden by 2020 (Murray and Lopez
1996).
The incidence of depression is higher than that for schizophrenia although the actual
medication cost per patient is lower due to the lower unit cost the of medications taken. The
Health and Social Care Information Centre (2009) reported the average net ingredient cost per
prescription in England in 2008 to be £34.55 for drugs used in psychosis and related disorders
and £6.88 for antidepressants.
Estimates of non-adherence rates in depression are comparable to those in schizophrenia. In a
study conducted in California in the US, Venturini et al (1999) retrospectively studied the
pharmacy claims data of 942 patients and determined that over a six month period only 13%
of patients completed an adequate course of treatment with selective serotonin reuptake
inhibitors (SSRIs). Adequate treatment was defined as the average daily dose exceeding 90%
156
of the minimum therapeutic dose. Another US-based study, relying on automated pharmacy
data and reviewing medical records, observed that among 155 patients newly prescribed
antidepressants, 28% stopped their medication in the first month and by the third month 44%
had stopped taking their medication (Lin, Korff et al. 1995). Cantrell et al (2006) conducted a
retrospective study of patients starting treatment on SSRIs for depression or anxiety using a
large US managed care database which included data for approximately 23,000 patients and
observed a 57% rate of non-adherence.
The prevalence and burden of illness of depression and the non-adherence rates of patients
prescribed medication for this illness are good reasons to use patients with this illness as a
comparator to those with schizophrenia in assessing the impact of non-adherence to
medication. Both illnesses are likely to affect a patient’s insight into their illness, a factor
thought to impact on non-adherence. Also, the medications for both schizophrenia and
depression have significant (but different) side effects.
Side effects vary according to the type of antidepressant prescribed. Those associated with
selective serotonin reuptake inhibitors are nausea, diarrhoea, agitation, headaches, loss of
libido, erectile dysfunction and failure to reach orgasm. The side effects associated with
tricyclic antidepressants include dry mouth, blurred vision, drowsiness, dizziness, tremors,
skin rash, weight gain or loss and sexual dysfunction. Monoamine oxidase inhibitors are less
likely to have associated side effects in of themselves but are associated with very adverse
effects, such as heart attack and stroke, when interacted with certain foods or other
medications (NICE 2007).
Here the focus is on depression, but many patients with a diagnosis of anxiety will also be
prescribed anti-depressants. The primary analyses will include both groups as there is high
comorbidity for anxiety and depression. Within the Psychiatric Morbidity Survey (PMS)
2000, mixed anxiety and depressive disorder was the most prevalent neurotic disorder
observed (Singleton, Bumpstead et al. 2001).
Data from the PMS 2000 of adults living in private households was used to examine the
factors associated with non-adherence and the relationship between non-adherence and the
use of formal services and the resulting cost of these services, amongst patients taking
antidepressants. The previous PMS of adults in institutions (1994) was used to examine these
157
associations amongst patients taking antipsychotic medication (chapter 4). While the two
PMS surveys were conducted 6-7 years apart, the questionnaires used were very similar and
the benefit of comparing across similar data on individual characteristics and health and social
care service use outweighs limitations due to the few differences in how the data were
collected.
Thus the aims of the analyses of the PMS 2000 were to estimate the rate at which treatment
with medication was discontinued in patients with depression; to assess the impact of this
non-adherence to depression medication on how resources were used and at what cost. These
results are compared to the results observed for patients taking antipsychotic medication in the
concluding chapter.
5.2 Methods
5.2.1 The Psychiatric Morbidity Survey 2000 sample
The PMS 2000 was a cross-sectional survey covering people aged 16 to 74 living in private
households in England, Wales and Scotland. It was a repeat of the 1993 survey of adults
living in private households with some modifications. The age range of the first survey was
18 to 65 and the PMS 2000 included measures of personality disorder and intellectual
functioning (Singleton, Bumpstead et al. 2001). The PMS 2000 surveys included structural
assessment and screening instruments to determine if mental disorders were present and if so,
the severity of illness. Additionally, data on service use, risk factors for mental disorders and
socio-demographic status were collected. A subsample of individuals was selected to
undertake a second-stage interview to assess for psychosis and personality disorders.
Interviews took place between March and September 2000.
The sampling frame of the survey was the postcode address file (Royal Mail 2009) and the
primary sampling units were postal sectors. From the over 9000 postal sectors in Britain, 438
were selected with a probability proportional to the number of addresses within the sector.
Within each postal sector, 36 addresses were selected, and if the household included 1 or
158
more persons aged 16 to 74 the Kish grid method (Kish 1965) was used to systematically
select one person in each household to be interviewed for the survey.
The selection of individuals to include in the analyses was as follows. To minimize
differences between the 1993/94 PMS and the PMS 2000, analyses were restricted to those
between 16 and 65 years of age. Various data in the PMS 2000 can be used to identify
patients with depression and determine the severity of the illness. A relevant sample was
identified as those patients that were prescribed antidepressants at the time of the survey.
5.2.2 Variable definitions
With respect to non-adherence, as in the 1993/4 PMS surveys, the PMS 2000 survey relied on
self-reported information. Patients were asked if they ever do not take the medication they
have been prescribed for mental illness (and if they ever take more than the stated dose). Data
was also gathered on the reason for the non-adherence and the time since the last interruption
of their medication taking. The wording of these questions was identical to that used in the
1993/4 PMS surveys.
The variables included in the modelling were the same as used in the analysis of non-
adherence to antipsychotics: age, sex, ethnicity, education, general level of health, illness
severity, previous experience of side effects, inpatient contact for mental health reasons in the
past year, self-reported drug abuse, self-reported alcohol abuse, social support, and familiarity
with medication. Derived variables produced by the primary data collection team, and used in
the main report, were the source of some indices used in my analyses (Singleton, Bumpstead
et al. 2001). As in the 1993/4 PMS, data on ethnicity was collected in nine categories, but for
the purpose of the analyses was collapsed into White and non-White due to the small number
of respondents in each of the individual non-White classifications. The education variable was
collapsed from five categories to three. The first category combined those with a degree,
teaching, Higher National Diploma, nursing or A Level qualification. The second category
includes those with GCSE or equivalent education and the third included those with no
qualifications.
159
The index of drug dependency was the derived variable provided in the dataset (Singleton,
Bumpstead et al. 2001). This variable took the value of one if the respondent reported
dependency on any drug and zero if they did not. A variable indication alcohol abuse was also
taken from the derived variables. This variable took a value of one, indicating a drinking
problem, if the respondent had a combined score of eight or more on the ten drinking audit
questions included in the survey.
Levels of general health were reported by patients on a five-point scale which was collapsed
to three levels: very good/good; average; and poor/very poor as some of the original
categories had relatively few observations. The wording of the question in the survey relating
to general health was the same as in the earlier PMS studies though in the PMS 2000 this
question was part of the SF-12 instrument. As previously, prevalence of symptoms relating to
and severity of neurosis was based on results from the Revised Clinical Interview Schedule
(CIS-R), a standardised instrument used to assess the prevalence and severity of symptoms in
minor psychiatric disorders (Lewis, Pelosi et al. 1992). Support from an adult with whom the
patient feels close was based on the question: ‘How many adults who live/are staying here
with you do you feel close to?’
The course of treatment for patients taking antidepressants is typically shorter than that for
patients taking antipsychotics. The NICE (2007) guidelines for the treatment of depression
states that:
“Antidepressants should be continued for at least six months after remission of an episode of depression, because this greatly reduces the risk of relapse. Patients who have had two or more depressive episodes in the recent past, and who have experienced significant functional impairment during the episodes, should be advised to continue antidepressants for two years.”
For this reason, consideration was given for changing the definition used to assess medication
familiarity from two years, as used in the analysis of non-adherence to antipsychotics, to a
period of one year for antidepressants. Examination of the PMS 2000 data suggested that a
substantial proportion of patients reported taking antidepressants for 2 years of more (39.8%),
so the decision was taken to use this period in defining medical familiarity.
160
5.2.3 Costing service use, benefits and absenteeism
The potential economic consequences of non-adherence that were analysed were the cost of
health and social care services, costs to the state and the cost of time off work due to illness.
This is a wider group of costs considered than in the analyses of non-adherence in
antipsychotics. The additional cost outcomes were analysed because previous literature
looking at the impact of non-adherence on costs in patients taking antidepressants suggested
that these wider costs were substantial in this patient population.
A list of benefits included in the analysis, along with the individual health and social care
services included, appears in Table 5.1. With respect to GP visits, survey respondents were
asked if they had visited their GP in the past year and if these visits related to a physical or
psychological problem. The number of visits in the past year was not requested. Respondents
were also asked the number of times they had visited their GP in the past 2 weeks. Because
the 2 weeks prior to the survey were not necessarily representative of GP service use in the
past year, a decision was made to use the information on whether or not they had visited their
GP in the past year. To account for the fact that the number of visits were not recorded, those
that visited their GP for a physical problem were assumed to have made 2 such visits in the
past year and likewise, those that reported that they had visited their GP for a psychological
problem were assumed to have made 2 visits. That is, individuals who report having visited
their GP for both physical and psychological problems would be assumed to have made 4
visits in the past year.
Health and social care costs were calculated by multiplying the frequency of use of each
service by the estimated national average cost for the service. The unit costs were taken
from the PSSRU Unit Costs of Health and Social Care for 2001 (Netten, Rees et al. 2001).
These were the costs applied in costing the 1993/4 PMS surveys. The unit costs do not
include qualification costs. Daily rates were applied for inpatient stays and included
accommodation costs. A cost per visit was applied to A&E outpatient visits and community
care services. An average length of time of one hour was assumed per visit and the unit cost
relating to hourly patient contact time was used. For community mental health centre and
sheltered workshop visits, the average length time of visits was estimated and an hourly unit
161
Table 5.1: Health and social care services and benefits included in analyses, PMS 2000
Health and social care services
GP visits Hospital inpatient stays
Secure/semi-secure or special hospital unit Acute psychiatric ward Rehabilitation or long-stay ward/facility A&E department or emergency ward General medical ward
Hospital outpatient visits
A&E department Psychiatric outpatient department
Day activity services Community mental health centre Day activity centre Sheltered workshop
Community services Community Psychiatrist Community Psychologist Community Psychiatric Nurse Community learning difficulty nurse Other nursing services Social worker Self-help/support group Home help/home care worker Outreach worker/family support
Benefits Income support
Incapacity benefit Housing benefit Severe disablement allowance Disability living allowance
cost applied. For day activity centre visits a sessional unit cost was applied with a session
being either a morning, afternoon or evening.
The unit cost for each service was multiplied by the total number of visits to that service to
estimate the annual cost for that service. The data were then summed to estimate total health
and social care costs.
The survey asked patients to indicate which state benefits were received. The cost of each
benefit was estimated from available sources. Data from the Department of Work and
Pensions Resource Centre (2008) was the source for the average weekly amount of Income
Support for the population under age 60 as of May 2001. This was the estimate closest to the
162
age range of the sample used in the analyses. This site was also the source for the average
weekly amount of the Incapacity Benefit and Severe Disablement Allowance for the working
age population as of May 2001. Because the earliest data available on the Disability Living
Allowance benefit was May 2002, this amount was applied to the PMS 2000 rate of receipt of
this benefit. These benefit amounts were multiplied by 52 to arrive at annual amounts and
then summed to arrive at the total annual cost of benefits. The costs of benefits were added to
health and social care costs to estimate total costs to the state. Absenteeism costs were
estimated as the length of time off work for those in employment in the past year. The
national annual salary was estimated from data summarised by the UK Office of National
Statistics (2001). This source estimated the average weekly gross earnings for all employees.
This amount was divided by five to arrive at average daily earnings. This amount was
multiplied by the number of days taken off work as reported in the dataset.
5.2.4 Statistical analyses
The first primary analysis was a logistic regression model to identify the characteristics
potentially related to non-adherence to medication. In this model, the outcome was the binary
variable ‘Was the patient adherent or non-adherent to their prescribed medication at the time
of the survey’. The other main analyses determined the factors associated with the cost of
health and social care services, costs to the state and the costs of absenteeism.
The methods appropriate for modelling costs were discussed in detail in chapter 2. Only a
brief summary of the methods is provided here. For each outcome, if a significant proportion
of the sample did not incur the cost, a two-part modelling process was undertaken (Mullahy
1998). The first part was a model to determine which, if any, of the factors were associated
with incurring the cost vs. not-incurring the cost. Here logistic regression was used. The
second part was a model of the costs incurred for the subsample of those patients who did
incur costs. The choice of regression model was made based on the distribution of costs. If
there was not significant skewness in the data, an ordinary least-squares (OLS) regression
model would be appropriate. If the costs were skewed, a GLM was fitted to the data.
In each of the models with cost outcomes, different combinations of the explanatory variables
were used in an attempt to take into account potential multicollinearity between non-
163
adherence and those factors found to be associated with non-adherence in the sample. For the
logistic regression models assessment of model fit was by the link test, the Pearson’s chi-
squared test, the Hosmer-Lemeshow test, the likelihood ratio test and the percentage of
observations correctly predicted by the model. For the GLM model, a log link function was
used and the Park test was employed to determine the appropriate distribution to apply to the
data.
Robust standard-errors were applied in all analyses. Factors achieving significance at the 0.05
level were deemed statistically significant. The analysis was performed using the STATA data
analysis software (STATA 2008).
As in the analyses of non-adherence to antipsychotics, predicted costs were derived for
hypothetical cases based on the modelling results. Again a bootstrapping algorithm,
incorporating 1,000 repetitions, was used to estimate the confidence interval for predictions
based on two-part models. The case types were plotted in histograms using EXCEL
(Microsoft Corporation 2003) to illustrate the relative impact of changes to key variables.
5.3 Results
Initial interviews were completed of 8,800 individuals and over 600 people participated in the
second stage interviews on psychosis and personality disorder (Singleton, Bumpstead et al.
2001). A total of 412 individuals in the PMS 2000 met the criteria set out for inclusion in the
analyses. That is, they were prescribed an antidepressant at the time of the survey and were
below the age of 65. This sample can then be further classified according to the diagnostic
criteria applied in the survey. Responses to the CIS-R and an algorithm based on the ICD-10
diagnostic criteria were used (WHO 1992; Singleton, Bumpstead et al. 2001). Based on a
hierarchical classification of diagnosis, 75 (18%) of the sample of individuals prescribed
antidepressant medication were classified as having severe or moderate depression as their
primary illness and a further 80 (19%) as having mixed anxiety and depression as their
primary illness.
164
The average age of the sample was 44 years of age and the sample was predominately female
with only one in four of the sample being male (see Table 5.2). Within the sample, 164
patients (39.8%) self-reported that they at times did not take their medication for depression
as it was prescribed.
Table 5.3 presents descriptive statistics for the cost components estimated from data on health
and social care service receipt, receipt of benefit and the time off work due to illness amongst
those in employment. As expected, the costs were highly skewed. In all categories of costs -
except GP visits - less than 50% of the sample incurred costs. Inpatient stays accounted for
the greatest proportion of the health and social care costs. Community care and day activity
centre costs appeared quite large on first inspection, but a closer look at the data indicated that
two observations contained what appeared to be outliers.
Table 5.2: Demographic characteristics of analysis sample, PMS 2000
Taking antidepressants and
under age 65 (n=412)
Age, years (mean (s.d.)) 44.4 (11.5) Male gender (%) 26.2 Ethnicity: White (%) 97.3 Education (%) Completed secondary school or university Some secondary school No qualifications
24.2 35.0 40.8
General health (%) Good Average Poor
17.5 27.9 54.6
Moderate or severe depression (%) 18.2 Severity of neurosis: CIS-R score (mean (s.d.)) 16.4 (11.7) ‘Yes’ responses to survey questions (%) Mental health hospital stay Drug misuse Alcohol misuse Has adult with whom patient feels close Two or more yrs on antidepressant medication
1.2 5.1
21.3
90.2 39.8
Self-reported non-adherence (n (%)) 164 (39.8)
165
Table 5.3: Distribution of costs among patients taking antidepressants, PMS 2000 Number
of users Mean Standard
Deviation Median Interquartile
range Min Max
GP 394 £49 £15 £60 £30-£60 £30 £60 Outpatient 151 624 789 296 296-592 244 6,144 Inpatient 31 4,025 6,878 1,694 484-5,049 242 35,640 Community care and day activity centre
81 2,720 8,191 456 114-2,018 5 52,963
Community care and day activity centre *
79 1,484 2,465 456 103-1,833 5 14,584
Total HSC 402 1,140 4,533 60 60-420 30 55,201 Total HSC * 400 882 2,674 60 60-404 30 35,700 Benefits 209 5,687 2,750 5,441 2,825-7,001 11 12,603 Cost to the state (benefits + HSC)
Males 1,559 4,175 5,734 1,011 Females 954 2,426 3,380 1,114 As a result of these missing values, however, the data for the six individuals without complete
data were excluded from analyses as the routines to run the models exclude cases with
missing values on any of the included variables. To compare the excluded individuals with
those included in the analyses, Wilcoxon rank sum tests were conducted for the continuous
variables and Fisher’s Exact tests for the categorical variables (Fisher 1922). The Fisher’s
Exact test was preferred to chi-squared test because of the small number (six) of observations
within the group with incomplete data.
The only variables where the six individuals without complete data differed from those with
complete data were experience of side effects and the index of social support. A greater
percentage of the respondents without complete data experienced side effects (33% versus
6%; p=0.046) and a smaller percentage lived with an adult with whom they felt close (33%
versus 91%; p=0.026).
168
5.3.1 Factors associated with non-adherence to antidepressants
In a model assessing the association of patient-, medication- and environment-related factors
on non-adherence to antidepressants, the effects of age, CIS-R score, length of time on
medication and having experienced side effects were statistically significant (see Table 5.6).
Each five-year increase in age reduced the probability of being non-adherent by 11%. Non-
adherence was significantly more likely for those patients who experienced a greater
prevalence or severity of symptoms (CISR score >12). A five-unit increase in the CIS-R score
increased the odds of being non-adherent by 16%.
Greater familiarity with medication, based on having been prescribed anti-depressants for two
years or more, was associated with 1.6 times the odds of reporting non-adherence as
compared to those on medication for less than two years. Those who had experienced side
effects with their antidepressant medication were over 15 times as likely to be non-adherent to
this medication. The estimate of this effect was based on 23 patients who reported
experiencing side effects.
The link test p-value (0.968) of the square of the predicted value suggested that the model was
not misspecified. The Pearson’s and Hosmer and Lemeshow chi-squared p-values (0.3131 and
0.9108 respectively) were not significant, indicating acceptable goodness-of-fit, as did the
statistical significance of the likelihood ratio chi-squared test. The percentage of observations
correctly predicted by the model was 68.0%.
169
Table 5.6: Logistic regression model of factors associated with non-adherence to antidepressants, PMS 2000 Variables N=406
Odds-ratio 95% CI Age (5 year increase in age) 0.89** 0.79, 0.99 Gender: Male (n=106)… …relative to Females (n=300)
0.71
0.42, 1.20
Education: Higher qualifications or A-levels (n=98)… O-level 2 (n=142)… …relative to below O-level qualifications (n=166)
1.14 1.33
0.64, 2.04 0.78, 2.27
Health: Average (n=114)… Poor (n=220)… …relative to good or very good (n=72)
1.24 1.22
0.62, 2.49 0.60, 2.48
Prevalence/severity of neurosis: CIS-R score 3 (five unit increase)
1.16***
1.04, 1.29
Had a hospital stay for a mental, nervous or emotional problem (n=5)… …relative to not having had hospital stay for a mental, nervous or emotional problem (n=401)
0.14
0.011, 1.69
Experienced side effects (n=23)… …relative to not experiencing side effects (n=383)
15.51*** 3.45, 69.80
Ethnicity: Non-White (n=11)… …relative to White (n=395)
2.86
0.77, 10.67
Two or more years on medication (n=161)… …relative to less than 2 years on medication (n=245)
1.61** 1.01, 2.58
Lives with an adult with whom feels close (n=368)… …relative to no does not live with an adult with whom feels close (n=38)
0.84 0.39, 1.79
Reports drug abuse (n=21)… …relative to no reported drug abuse (n=385)
1.69 0.62, 4.61
Reports alcohol abuse (n=86)… …relative to no reported alcohol abuse (n=320)
1.53 0.89, 2.62
Link test p-value 0.968 Pearson’s chi-sqpared test p-value 0.3131 Hosmer-Lemeshow chi-squared test p-value 0.9108 Prob > LR chi-squared 0.0001 Percent correctly classified 68.0 * p≤0.10; ** p≤0.05; *** p≤ 0.01 1The Revised Clinical Interview Schedule (CIS-R) is used to assess minor neurotic psychiatric disorder; higher scores indicate greater prevalence or severity of symptoms.
170
5.3.2 Health and Social Care costs
As only ten patients did not incur any health or social care service use costs, rather than
complete a two-step model for this dependent variable, these patients were included as they
represented a relatively small portion of the sample (2.4%). The generalised linear model for
this outcome employed a log link function and the Park test suggested a gamma distribution
for this data. Health status, CIS-R score and length of time on medication were significantly
associated with total health and social care costs (see Table 5.7). Those in average or poor
health had higher health and social care costs than those in good health. Likewise, as the
prevalence or severity of symptoms increased, higher health and social care costs were
incurred. Having been on medication for two or more years was also associated with higher
total health and social care costs as compared to having been on medication for less than two
years. There was a trend towards non-adherence being associated with lower health and
social care costs as compared to those who did adhere to their medication (p=0.083).
Figure 5.1 illustrates the marginal increase in cost attributable to the significant effects in the
model of health and social care costs. As a starting point, the predicted costs were calculated
for an arbitrary case. This initial case was for a man, age 45, White, without O-Level
academic qualifications, who had a low prevalence and severity of symptoms, had average
general health, who adhered to his medication, did not misuse drugs or alcohol, had social
contact with an adult with whom he felt close and had been on medication for 2 or more
years. The effect of altering this case to that of an individual with poor health status as
opposed to the average was a £4,300 increase in predicted health and social care costs. The
costs attributed to altering the case to someone who did not adhere to his medication was a
£100 decrease in the predicted costs relative to the base case. The high degree of uncertainty
in these estimates is reflected in the wide confidence intervals.
171
Table 5.7: Generalised linear model of factors associated with health and social care costs, PMS 2000 Independent variables N=406
Coefficient
95% CI
Age 0.00017 -0.025, 0.026 Male (n=108)… …relative to Female (n=304)
0.19
-0.33, 0.71
Higher qualifications or A-levels (n=100)… O-levels (n=144)… …relative to below O-level qualifications (n=168)
0.49* 0.41
-0.093, 1.07 -0.20, 1.03
Non-White (n=11)… …relative to White (n=401)
-0.44 -1.54, 0.65
Average general health (n=115)… Poor general health (n=225)… …relative to good general health (n=72)
Lives with adult with whom feels close (n=371)… …relative to does not live with adult with whom feels close (n=41)
0.16 -0.39, 0.71
Reports illegal drug use (n=21)… …relative to non drug users (n=391)
0.053 -0.92, 1.02
Reports moderate or high alcohol dependence (n=87)… …relative to no alcohol dependence (n=325)
0.72 -0.18, 1.62
Two or more years on medication (n=164)… …relative to less than 2 years on medication (n=248)
0.62**
0.13, 1.11
Constant 4.07*** 2.60, 5.54 Link function Log Distributional family Gamma * p≤0.10; ** p≤0.05; *** p≤ 0.01 1 The Revised Clinical Interview Schedule (CIS-R) is used to assess minor neurotic psychiatric disorder. Higher scores indicate greater prevalence/severity of symptoms.
172
Predicted health and social care costs, PMS 2000
0
200
400
600
800
1,000
1,200
1,400
1,600
1,800
case type: male, age 45,White, no O-levels, goodgeneral health, resident inhospital, adheres to meds,CISR score=10, no drug oralcohol abuse, with adult towhom feels close and onmeds for 2 or more years
case type: Poor health case type: CIS-R score = 25 case type: Alcohol abuse case type: Non-adherence case type: GCSE level case type: On medication for2 or more years
annu
al c
ost i
n £
(200
1 un
it co
sts)
0
200
400
600
800
1,000
1,200
1,400
1,600
1,800
Figure 5.1
173
When the two observations thought to be potential outliers were excluded from the analysis of
health and social care costs, the results were somewhat altered in that while the health status
and severity of illness effects remained statistically significant, the effect of length of time on
medication was no longer significant (p=0.134). In this model, non-adherence no longer
approached statistical significance (p=0.275) and gender was significant (p=0.018) with males
generating higher health and social care costs. When those variables found to be associated
with non-adherence (age, CIS-R score, length of time on medication) were excluded from the
model to take account of potential multicollinearity, there was no change in the significance
of non-adherence.
5.3.3 Costs to the state
The costs of benefits paid to the patient were combined with the health and social care service
use costs to arrive at costs to the state. Here, as with the previous model, a generalised linear
model was estimated. In this model, a log link function was used and the Park test suggested a
Poisson distribution underlying the data (see Table 5.8). As in the previous model, all cases
with complete data contributed to the model estimation. Relative to those without
qualifications, the respondents who achieved A-Level or university qualifications incurred
lower costs to the state. There was also a significant association between general health status
and these costs. As general health worsened, costs to the state increased. Similarly, as the
prevalence and severity of neurosis symptoms increased, costs to the state also increased.
Also, these costs were significantly higher for those who had been taking antidepressants for
two or more years as compared to those who had been on medication for less than two years.
The effect of non-adherence was not significant.
174
Table 5.8: Generalised linear model of factors associated with costs to the state (health and social care costs plus cost of benefits), PMS 2000 Independent variables N=406
Coefficient
95% CI
Age -0.014 -0.033, 0.0056 Male (n=108)… …relative to Female (n=304)
0.24
-0.078, 0.55
Higher qualifications or A-levels (n=100)… O-levels (n=144)… …relative to below O-level qualifications (n=168)
-0.59*** -0.27
-0.96, -0.22 -0.69, 0.15
Non-White (n=11)… …relative to White (n=401)
0.21 -0.35, 0.77
Average general health (n=115)… Poor general health (n=225)… …relative to good general health (n=72)
Lives with adult with whom feels close (n=371)… …relative to does not live with adult with whom feels close (n=41)
0.31* -0.052, 0.66
Reports illegal drug use (n=21)… …relative to non drug users (n=391)
0.034 -0.32, 0.39
Reports moderate or high alcohol dependence (n=87)… …relative to no alcohol dependence (n=325)
0.13 -0.37, 0.64
Two or more years on medication (n=164)… …relative to less than 2 years on medication (n=248)
0.40***
0.10, 0.70
Constant 7.28*** 6.20, 8.37 Link function Log Distributional family Poisson * p≤0.10; ** p≤0.05; *** p≤ 0.01 1 The Revised Clinical Interview Schedule (CIS-R) is used to assess minor neurotic psychiatric disorder. Higher scores indicate greater prevalence/severity of symptoms.
175
Illustrations of the marginal effects of key variables appear in Figure 5.2. The initial case
chosen for this model was that of a man, age 45, White, who had completed O-Levels, had
low prevalence and severity of symptoms, was in very good general health, adhered to his
antidepressant medication, did not misuse drugs or alcohol, had social contact with an adult
with whom he felt close and was on antidepressants for less than two years. For this case the
predicted costs to the state were £1,550. The effect of changing the case to a non-adherent
patient reduced predicted costs by just under £200. The largest increase in the predicted costs
occurred if the case was changed to someone in poor health or on medication for two or more
years. In these cases the predicted costs increase by £2,750 and £770 respectively. If the
highest level of educational qualifications was assumed, predicted costs to the state were £690
less than those predicted for the initial reference case.
When the model was run without the two potential outliers, the effects of education, health
status, illness severity and length of time on medication remained statistically significant. In
this model, age and gender were also significantly associated with costs to the state. As the
age of patients increased the costs incurred by the state decreased. Also, the costs to the state
were higher for male patients than for female patients. As in the analysis of health and social
care costs, the potential multicollinearity between non-adherence and age, CIS-R score and
length of time on medication did not appreciably alter the significance of non-adherence.
176
Predicted costs to the state, PMS 2000
0
1,000
2,000
3,000
4,000
5,000
6,000
7,000
8,000
case type: male, age 45,White, no O-levels,
excellent or very goodgeneral health, residentin hospital, adheres tomeds, CISR score=11,
no drug or alcohol abuse,with adult to whom feelsclose and on meds for
less than 2 years
case type: A-level orabove
case type: Poor healthstatus
case type: CIS-Rscore=25
case type: Does not livewith adult with whom
feels close
case type: On medicationfor 2 or more years
case type: Non-adherence
annu
al c
osts
in £
(200
1 un
it co
sts)
0
2,000
4,000
6,000
8,000
Figure 5.2
177
5.3.4 Cost of absenteeism
The final outcome of interest was absenteeism costs. A sample of 185 respondents reported
being in employment in the last year and were asked the number of days that they had been
away from work due to ill health. The effect of ethnicity could not be included in the logistic
regression analysis as the three ethnic minority respondents who reported being in
employment in the last year had all experienced days off work due to ill health. That is, the
index of the effect of being from an ethnic minority perfectly predicted having time off work.
Thus it was not possible for the model to estimate the effect of ethnicity on whether or not
someone had taken experienced time off work and the effect of ethnicity was excluded in this
model.
As would be expected, the model found that poor health was associated with having incurred
absenteeism costs (see Table 5.9). Those with poor health were nearly five times as likely to
have taken time off work for ill health as compared to those in excellent or good health. There
was also a trend towards those with O-Level academic qualifications to have greater odds of
having had a period of absence from work as compared to those without O-Level
qualifications (p=0.065).
The link test p-value (0.0.566) suggested the model was satisfactorily specified. The
Pearson’s and Hosmer and Lemeshow chi-squared p-values (0.2586 and 0.2435 respectively)
were not significant, indicating acceptable goodness of fit. The statistical significance of the
likelihood ratio chi-squared test suggested that the model fit the data adequately (p=0.0195).
The percentage of observations correctly predicted by the model was 64.3%.
In the GLM run on those people with depression who did report days missed from work
(n=99), the cost of absenteeism was modelled with a log link function and the Park test
suggested a gamma distribution. Age, health status, severity of illness, alcohol abuse and non-
adherence were all statistically significantly associated with the cost of absenteeism (see
Table 5.10).
178
Table 5.9: Logistic regression model on factors associated with having incurred absenteeism costs (amongst those in work), PMS 2000 Independent variables N=182
Odds Ratio (of using services)
95% CI
Age (5 year increase in age) 1.10 0.93, 1.29 Male (n=108)… …relative to Female (n=304)
0.75
0.32, 1.76
Higher qualifications or A-levels (n=62)… O-levels (n=72)… …relative to below O-level qualifications (n=48)
1.31 2.18*
0.56, 3.05 0.95, 4.97
Non-White (n=0)… …relative to White (n=182)
- -
Average general health (n=72)… Poor general health (n=55)… …relative to good general health (n=55)
1.30 4.86***
0.59, 2.86 1.83, 12.93
Prevalence/severity of neurosis: CIS-R score 1 (five unit increase)
0.97
0.80, 1.18
Non-adherent (n=68)… …relative to adherent (n=114)
1.69 0.85, 3.39
Lives with adult with whom feels close (n=164)… …relative to does not live with adult with whom feels close (n=18)
0.68 0.20, 2.30
Reports illegal drug use (n=7)… …relative to non drug users (n=175)
1.13 0.21, 5.96
Reports moderate or high alcohol dependence (n=43)… …relative to no alcohol dependence (n=139)
1.12
0.51, 2.44
Two or more years on medication (n=47)… …relative to less than 2 years on medication (n=135)
0.60 0.28, 1.31
Link test p-value 0.566 Pearson’s chi-sqpared test p-value 0.2586 Hosmer-Lemeshow chi-squared test p-value 0.2435 Likelihood ration chi-squared p-value 0.0195 Percent correctly classified 64.3% * p≤0.10; ** p≤0.05; *** p≤ 0.01 1 The Revised Clinical Interview Schedule (CIS-R) is used to assess minor neurotic psychiatric disorder. Higher scores indicate greater prevalence/severity of symptoms.
179
Table 5.10: Generalised linear model of factors associated with cost of absenteeism, PMS 2000 Independent variables N=99
Coefficient
95% CI
Age 0.055*** 0.022, 0.088 Male (n=18)… …relative to Female (n=81)
0.056
-0.50, 0.61
Higher qualifications or A-levels (n=33)… O-levels (n=44)… …relative to below O-level qualifications (n=22)
-0.057 0.39
-0.69, 0.58 -0.24, 1.03
Non-White (n=3)… …relative to White (n=96)
-0.64* -1.35, 0.075
Average general health (n=35)… Poor general health (n=41)… …relative to good general health (n=23)
Lives with adult with whom feels close (n=88)... …relative to does not live with adult with whom feels close (n=11)
0.24 -0.69, 1.16
Reports illegal drug use (n=4)… …relative to non drug users (n=95)
-0.16 -1.08, 0.76
Reports moderate or high alcohol dependence (n=25)... …relative to no alcohol dependence (n=74)
-0.61** -1.23, -0.0031
Two or more years on medication (n=22)… …relative to less than two years on medication (n=77)
-0.66*
-1.37, 0.045
Constant 4.62*** 2.76, 6.48 Link function Log Distributional family Gamma * p≤0.10; ** p≤0.05; *** p≤ 0.01 1 The Revised Clinical Interview Schedule (CIS-R) is used to assess minor neurotic psychiatric disorder. Higher scores indicate greater prevalence/severity of symptoms.
180
Absenteeism costs increased as patients got older and were significantly greater for those in
poor health as compared to those in good health. The cost of absenteeism were lower for those
who reported alcohol abuse as compared to those who did not report alcohol abuse, and
individuals who reported being non-adherent to medication also had lower absenteeism costs.
There was also a positive relationship between absenteeism costs and the CIS-R score (which
reflects prevalence and severity of symptoms).
The effects of ethnicity and length of time on medication approached statistical significance
(p=0.079 and p=0.066 respectively). The trend was for individuals from an ethnic minority to
have lower absenteeism costs than their White counterparts. Recall, however, that this effect
was estimated based on only three ethnic minority respondents. Those on medication for two
or more years had lower absenteeism costs as compared to those on medication for less than
two years.
Figure 5.3 illustrates the impact of the significant effects on absenteeism costs. Due to the
relatively small sample size, the bootstrap algorithm did not converge to a solution in several
repetitions when the full list of variable was included in the models. To get around this
problem, the models were altered to include only those variables found to be statistically
significant in either the logistic regression on whether or not days off were taken due to ill
health and the GLM on the amount of costs attributable to these lost days. A hypothetical base
case of a 45 year old individual, without O-Level qualifications, in average health, who had a
score of 10 on the CIS-R, adhered to medication and had been prescribed antidepressants for
less than two years. The impact of relatively few observations on which to base the estimates
of absenteeism costs was reflected in the wide confidence intervals around each of the
estimates. As would be expected, poor general health had the greatest impact on increasing
absenteeism costs. Relatively poor mental health, reflected in prevalence and severity of
neurotic symptoms also significantly increased absenteeism costs. There was a trend for non-
adherence to increase the probability that a respondent had days off work due to ill health but
to decrease the frequency of days off, and thus costs. On balance, non-adherence increased the
estimate of annual absenteeism costs by over £750, suggesting that those in work are likely to
feel good and able to cope without taking their medication.
181
Predicted cost of absenteeism, PMS 2000
0
2,000
4,000
6,000
8,000
10,000
12,000
case type: male, age 45, White, no O-levels, good general health, resident in
hospital, adheres to meds, CISRscore=11, no drug or alcohol abuse,
with adult to whom feels close and onmeds for over 2 years
case type: Age 30 case type: Poor general health case type: CIS-R score = 25 case type: Non-adherence case type: On medication for 2 or moreyears
annu
al c
ost i
n £
(200
1 un
it co
sts)
0
2,000
4,000
6,000
8,000
10,000
12,000
Figure 5.3
182
5.4 Discussion
The analysis of the PMS 2000 data, by incorporating costs associated with receipt of benefits
and absenteeism costs, provides a very broad overview of the observable direct and indirect
costs incurred by individuals prescribed antidepressant medication. It is noteworthy that the
costs of both benefits and absenteeism were substantial and amongst those who incurred these
costs, far outweigh health and social care service use costs. Few factors were found to be
associated with non-adherence in the data. Analyses of costs found that non-adherence was
significantly associated with absenteeism costs only, and this association was negative. The
analyses also determined that two outliers have a substantial impact on some of the findings.
There was a trend towards non-adherence being negatively associated with health and social
care service use costs, but this trend disappeared when the potential outlier values were
excluded from the analyses.
5.4.1 Rate of non-adherence in individuals taking antidepressants
The rate of non-adherence in this study was 40%. It was very difficult to determine from the
literature if consistent estimates of the rate of non-adherence could be observed due to
difference in settings, patient populations and methods use to assess adherence. A review of
the literature on non-adherence in patients taking anti-depressants identified several large
studies with widely differing rates of non-adherence for the time periods under study. Rates of
non-adherence ranged from 35% to 70%. Within the PMS 2000 sample a large proportion of
those taking antidepressants were judged to have mild or moderate depression. This contrasts
with some of the previous studies in this area that have focussed on patients with severe
depression or had a greater proportion of patients with severe depression. This may partly
explain the relatively low prevalence of non-adherence to antidepressants in the PMS 2000
data as compared to other studies.
A large (n=4,312) US-based study estimated non-adherence rates for newly diagnosed,
privately insured patients with major depression (Akincigil, Bowblis et al. 2007). The sample
consisted of members of the general population who were enrolees in a large health care
organisation operating in north-eastern US states. Assessment of adherence was based on
183
pharmacy refill records for the period from January 2003 to January 2005. The non-adherence
rates were 49% in the first 16 weeks of treatment, increasing to 58% by week 33.
Cantrell et al (2006) studied adherence to SSRI medication using medical and pharmacy
claims data from a managed care database in the US covering 30 health plans and holding
records of over 25 million persons across the US. This study included data for nearly 23,000
individuals newly prescribed SSRIs during the period of July 2001 to June 2002. The 6-month
adherence rate was approximately 57% and this estimate was consistent across varying
methods of assessing adherence: length of therapy, medication possession ratio and a
combination of the two. Olfson et al (2006) in a nationally representative US sample observed
a 42% rate of non-adherence in the initial 30 days of treatment with an antidepressant and a
72% rate of non-adherence after 90 days.
Pampallona et al (2002), in a review of non-adherence in depression identified 32 studies
published between 1973 and 1999. Fifty percent of these were US-based studies, ten were
conducted in the UK, three in Canada and three in continental Europe. In total, these studies
included over 10,000 patients, all of whom were diagnosed with depression. The range of
rates of non-adherence was between 30% and 97% with a median of 63%. The methods used
to assess adherence varied across studies.
A literature review on medication compliance in psychiatric treatment identified ten articles
which assess the rate of compliance for patients taking medication for depression (Cramer and
Rosenheck 1998). The review was based on a MEDLINE search of literature published
between 1975 and 1996. The methods of assessing adherence in these studies were primarily
pill counts and lithium blood levels supplemented by patient interviews. Two of the articles
included in the review were meta-analyses. The review found that the mean rate of non-
adherence across the studies was 37% and ranged from 10% to 60%.
Using quite strict criteria to assess a patient as adherent (a combination of identifying
detectable serum levels of study medication at all follow-up assessments, self-reported
assurance and attendance at scheduled visits), a Swedish study found that 60% of patients
with major depressive disorder were non-adherent to their medication in the first 24 weeks of
treatment (von Knorring, Akerblad et al. 2006).
184
A small (n=107) UK-based cross-sectional study found the rate of self-reported non-
adherence to medication to be 35% for a sample of patients diagnosed with depression (Byng,
Bury et al. 2007), while in a US sample of older patients with depression (based on secondary
analysis of a prospective cohort study of participants from the (US) National Institute of
Mental Health Clinical Research Center for the Study of Depression in Later Life), where
self-reporting was used to asses non-adherence, approximately 28% of patients taking
antidepressants reported being non-adherent in their medication taking (Bosworth, Voils et al.
2008). The results of this study, along with the analyses of the PMS 2000, support the view
that self-reported non-adherence rates will be lower than if more invasive methods are used in
assessment. As discussed in chapter 4, however, in a large-population survey, all methods
other than self-reporting would be extremely difficult to implement. The two studies above
which based non-adherence rates on large populations were both US studies that
retrospectively analysed claims data for large managed care organisations.
5.4.2 Factors associated with non-adherence
My analysis observed a very strong association between the experience of side effects and
non-adherence to antidepressants. This association was not surprising given the range of side
effects known to affect those prescribed antidepressants as detailed in the introduction to this
chapter.
In the literature reported in the previous section, rates of non-adherence to antidepressants
were observed to increase over time. Just as the duration of a study is likely to impact on the
rate of non-adherence, it may also influence results of analysis of the factors associated with
non-adherence. Aikens et al (2005) postulate that in the period after commencing taking an
antidepressant, non-adherence is related to the side effects and the perception that the
medication prescribed is ineffective. In the longer-term non-adherence is likely to result from
patients judging that they no longer need the medication or becoming less willing to continue
tolerating previously acceptable side effects (e.g. sexual dysfunction) (Aikens, Nease et al.
2005). Note, however, that for this theory to hold, patients must distinguish between what are
intolerable side effects in the short and longer term. If this theory is true, it would explain the
higher rates of non-adherence observed in the literature above which sampled newly
diagnosed patients prescribed antidepressants for the first time.
185
Several empirical studies in the literature examine the associations between non-adherence
and patient-, medication- and environment-related factors. A search of the literature found
two review studies, although neither was a structured or systematic review. In the first,
Nemeroff (2003) identified severe side effects/adverse events such as severe daytime
sleepiness, anxiety and nausea to be consistently significant contributors to non-adherence in
patients taking antidepressants. The method by which the studies cited in this review were
identified was not stated by the author.
The other review was a narrative review by Mitchell (2006)4. The author discusses the
literature in support of, and opposing, the hypothesis that adherence behaviour is a form of
self-medication. The method to identify the included studies is not stated. Key determinants
of non-adherence for patients taking antidepressants, based on observed trends in the
literature, were perceptions of stigma, concern about drugs, feeling better and side effects.
Olfson et al (2006), using data from the US Medical Expenditure Panel Survey for 1996-
2001, observed associations between non-adherence to antidepressants and Hispanic ethnicity,
lower educational attainment and low family income. They also observed that among patients
who continued on antidepressant medication beyond the first 30 days, those treated with
SSRIs were more likely to adhere to their medication than those treated with tricyclic
antidepressants or other older antidepressants.
The study by Akincigil et al (2007), described above, found that non-adherence was
associated with younger age, alcohol or substance abuse, comorbid cardiovascular/metabolic
conditions, use of older generation antidepressants and residence in lower-income
neighbourhoods.
In another US study conducted between December 1999 and May 2000, Bull et al (2002)
surveyed people with major depression or depressive disorder who had recently started to take
an SSRI antidepressant. In this study, patients were asked in a questionnaire if they had
4 A narrative review summarises primary studies from which conclusions may be interpreted. Results have a qualitative rather than a quantitative meaning. Kirkevold, M. (1997). "Integrative nursing research - an important strategy to further the development of nursing science and practice." Journal of Advanced Nursing 25: 977-984, Campbell Collaboration. (2001). "Campbell Collaboration guidelines." Retrieved February 14, 2006, from www.campbellcollaboration.org..
186
discontinued treatment. Thus, the outcome was a more severe interruption of medication
taking beyond non-adherence. The authors found that communication about adverse events,
regular visits to a physician, lack of experience of adverse events and being married
significantly reduced the probability of discontinuing SSRI medication in the first 3 months.
In a small US-based study of patients prescribed antidepressants for greater than 11-weeks
(defined as being in a maintenance phase of medication treatment) adherence was assessed
with two forms of self-reported information (Aikens, Nease et al. 2005). Firstly, the first three
items from the Brief Medication Questionnaire were used to measure the percentage of their
medication adhered to in the preceding two weeks. Secondly, general adherence was assessed
using the Morisky scale. This study found that a composite score that takes into account the
relative weight of perceptions about the necessity of medication and the concerns about
medication, derived from the Beliefs About Medication scale, was found to be statistically
significantly associated with non-adherence in multivariate regression analyses that accounted
for depression severity, treatment duration and social desirability bias (the tendency to answer
questionnaires in the socially acceptable direction).
Loh et al (2007) conducted a survey in Germany of general practitioners and patients with
depression in which they collected data at baseline and after six to eight weeks to, among
other things, determine if patient participation in decision-making was associated with
treatment adherence. Adherence was assessed based on response to a question put to both the
GP’s and the patients at the six to eight week visits, asking them to rate adherence on a 5-
point scale. Using structured equation modelling, the authors concluded that an association
between self-reported adherence and patient participation in shared treatment decision-making
did exist. This result was observed after accounting for the severity of the patients’
depression.
5.4.3 Association between non-adherence and service use and costs
Few studies were identified which analysed the associations between non-adherence to
antidepressants and service use and the costs associated with service use. Cantrell et al (2006)
used claims data from a large US health plan database to conduct such a study. Patients were
recipients of at least one prescription for an SSRI between July 2001 and June 2002. The
187
authors produced three indices of non-adherence: one based on the medication possession
ratio (MPR), another based on the length of therapy (LOT), and a third that combined MPR
and LOT data. The results were that patients judged to be adherent to their medication
incurred lower medical costs (this did not include prescribing costs). The difference in
medical costs between adherent and non-adherent patients was approximately $450. When the
cost of medication was included, the difference between adherent and non-adherent patients
was not statistically significant.
von Knorring et al (2006), in an analysis conducted in Sweden between June 1999 and
February 2003, costed health services and time off work due to illness in patients with major
depression. In this study, patients were deemed to be adherent if they had detectable serum
levels of medication, self-reported that they had taken medication as prescribed, and attended
scheduled visits. The authors did not observe any differences in total costs incurred after two
years between adherent and non-adherent patients. Inpatient costs were significantly higher
for non-adherent patients. The average total cost per patient over the 2 years of the study was
just under €39,000. Indirect costs were estimated at just below €34,000.
In a large study using pharmacy and medical claims data from a pharmacy benefit and
medical management company in the US, adherence was defined as having 70% or greater
supply of pills supplied over a 180 day follow-up period and the economic outcomes analysed
were pharmacy cost charges, medical charges (depression and non-depression related
physician, emergency room, hospital, laboratory and any other medical charges) and total
healthcare (combined pharmacy and medical) charges (White, Vanderplas et al. 2003). Non-
adherence was found to be associated with significantly lower medical charges as compared
to adherent patients, though total healthcare charges were not significantly different between
adherent and non-adherent patients. The difference in total medical costs for the follow-up
period was approximately US$1,300.
Apart from the von Knorring work, few previous studies have assessed associations between
non-adherence to antidepressants and non-health care costs. No studies were identified which
used costs to the state as an outcome in assessing the potential impact of non-adherence. It
could be argued that there is no theoretical basis for hypothesising that non-adherence would
impact on costs to the state, but given that non-medical costs incurred by individuals with
depression often greatly exceed their medical costs, it is helpful to contextualise the impact of
188
non-adherence from the wider perspective of costs to the state. Layard et al (2007) estimated
that the average, per person, economic savings to the UK Exchequer of treating patients with
depression and/or anxiety in reduced incapacity benefit, income support, housing benefit,
council tax benefit and recovered employment taxes would be three times the medical costs
saved. Similarly, Bosmans et al (2007), in a cost-effectiveness analysis of a pharmacy based
coaching programme to improve adherence to antidepressants, estimated that the average
indirect costs of absenteeism for the non-intervention group were €2,249 while the direct
medical costs for this sample were €711. The data for this study were collected in 2000 and
2001, with costs adjusted to 2002 values.
5.4.4 Other factors associated with service use and costs
Amongst the other factors assessed in the models, those found to be significantly associated
with health and social care costs were related to the severity of illness. Self-reported poor
health, higher CIS-R scores and greater length of time on medication were all significantly
associated with these costs. Similarly, poorer health was, as would be expected, associated
with higher absenteeism costs. Older individuals also incurred higher absenteeism costs,
perhaps reflecting the fact that having been in the workforce for longer, they would have
higher incomes than younger individuals and would thus have higher costs associated with
time off work. This is consistent with the fact that the probability of having time off work is
not significantly associated with age. Alcohol abuse was associated with lower absenteeism
costs among those who took time off work but not the probability of taking time off work.
This suggests that those individuals with moderate to high alcohol intake returned to work
more quickly after time off.
5.4.5 Limitations
There were some limitations associated with using the PMS 2000 dataset for the analyses
undertaken as this survey was not designed specifically to address the questions being asked
in my analyses. These were much the same as discussed in chapter 4 in relation to the 1993/4
PMS surveys: the inability to incorporate some potentially important factors that relate to
189
non-adherence, the fact that the data was cross-sectional and the resulting possibility that non-
adherence may be endogenous.
As discussed in chapter 3, the source of endogeneity may be simultaneity or omitted variable
bias. The inclusion of an index of medication familiarity reduced the likelihood of omitted
variable bias as it is served as a proxy for the unobserved effects of the attitudes to medication
and the patient’s insight into their illness. The potential for simultaneity between service use
and non-adherence is arguably greater in the 2000 PMS sample of individuals taking
antidepressants than in the 1993/4 PMS sample of individuals prescribed antipsychotics; this
is because the overall pattern of service use suggested that the main health and social care
services used by the antidepressants sample were outpatient and community services. It is in
these services, which are usually regular contacts between patients and health providers,
where reminders and encouragement of adherence are more likely (as compared to inpatient
visits). Services that offer reminders and encouragement regarding medication taking, will
however, have the effect of improving adherence, and would bias down the observed effect of
non-adherence in the models.
The theoretical models of non-adherence suggest key factors such as a patient’s attitude to
their illness and their medication are key to understanding non-adherence. With respect to the
data being cross-sectional, as with patients diagnosed with schizophrenia, the nature of the
associations between illness, non-adherence and service use cannot be fully understood
without being able to assess causality. For patients taking antidepressants the potential exists
for their illness to impact on the ways in which they perceive medication and thus whether on
not they adhere, while at the same time non-adherence is likely to make symptoms worse and
thus may impact on the severity of illness which may in turn impact on the use of services.
Previous studies have attempted to assess the impact of depression on adherence to
medication (DiMatteo, Lepper et al. 2000; Wing, Phelan et al. 2002).
The analysis of the impact of non-adherence on the cost of absenteeism was compromised by
not being able to identify whether all time off work was directly related to an individual’s
illness for which antidepressants were prescribed. In the survey, respondents were asked to
report the number of days off work for all health- related reasons. It should be noted,
however, that it has been shown that depression can trigger the onset of physical health issues
190
(Carroll, Cassidy et al. 2004). Thus it cannot be ruled out that while some health service use
may not appear to be related to depression, this may in fact be the case.
A further limitation pertains to the analysis of the cost of absenteeism. Absenteeism was taken
as proxy of lost productivity, but the current literature suggests that estimates of lost
productivity should also incorporate presenteeism. Sanderson and Andrews (2006) define
presenteeism as ‘lost productivity arising from attending work while unwell’. These costs
could not be captured from the PMS 2000 data.
Donohue and Pincus (2007) conducted a literature review based on searches of MEDLINE
and EMBASE between 1990 and July 2005 to assess whether the costs of depression
treatment are offset by gains in worker productivity and/or reductions in other healthcare
spending. Among their key findings are that suicide-related costs made up 6% of total societal
costs of depression in 2000, that depression affected educational attainment, which lowers
earning potential and that in addition to absenteeism, significant costs can be attributed to
presenteeism – reduced productivity at work. The authors cite data from a study by Greenberg
et al (2003) which estimated suicide-related costs of patients with depression in the US in
2000 to be US$5,450million and presenteeism costs to be US$15,295million. As a percentage
of total costs (direct health care, suicide-related and all workplace-related costs), presenteeism
accounted for 18.4% of costs. Greenberg et al (2003) estimated suicide-related costs using a
human capital framework based on the total number of suicides by age and gender in 2000,
with the present value of lost lifetime earnings estimated assuming 60% of suicides were
attributable to depression. They estimated presenteeism by assuming that 20% of time at work
while suffering from a depression episode resulted in lost productivity.
Finally, my analyses does not account for differences between antidepressant medications or
between the classes of antidepressants. There is evidence that antidepressants differ in their
effects on adherence to medication (MacGillivray, Arroll et al. 2003), presenteeism (Greener
and Guest 2005) and total medical costs of treatment (Sheehan, Eaddy et al. 2005).
The PMS 2000 was not designed to answer specific questions regarding patient behaviours
and service use, but rather as a nationally representative survey of psychiatric morbidity in the
British population. It uniquely offered a snapshot of the British household population and the
relative prevalence and severity of mental illnesses. The PMS 2000 and the 1993/1994 PMS
191
surveys, taken together, offer comparable data from similar samples. The analyses undertaken
sought to make use of these data, as best possible, to assess the associations between non-
adherence, patient-, treatment- and environment-related factors and a range of cost outcomes.
As in the previous empirical chapters, robust statistical methods were used, increasing
confidence in the associations reported.
5.5 Summary
The rate of non-adherence to antidepressants observed in my analysis of the PMS 2000 data
was towards the low end of the range reported in the literature. This may be due to the
assessment of non-adherence in the PMS relying on self-reported information, the smaller
proportion of severely depressed and newly diagnosed patients in the sample relative to
samples in previous literature. The relatively low rate of non-adherence observed may also
reflect a bias for people who do not take their medication also not wanting to participate in
surveys.
An association was observed between greater prevalence or severity of symptoms and non-
adherence in the data. My results were consistent with the literature in finding a strong
association between the experience of side effects and non-adherence to antidepressants. The
literature also supports the finding that a positive association existed between length of time
on medication and the probability of non-adherence. The literature suggests some potential
reasons for this finding: that patients perceive that they no longer need medication or that they
want to avoid side effects.
Non-adherence to medication did not appear to be strongly associated with health and social
care costs or, more widely, costs to the state amongst patients taking antidepressants. For
those in work there was a trend towards non-adherence increasing the probability of having
had to take time off from work due to ill health but the actual number of days missed were
lower amongst non-adherent individuals. Few other studies have assessed the impact of non-
adherence on either health, social care or state costs of absenteeism costs. Some of these
studies observe medical costs to be higher for non-adherent patients, although other results
suggest a weak or opposite association.
192
Chapter 6
Discussion and Conclusions
6.1 Discussion of findings
The aim of this thesis was to identify those factors associated with non-adherence to
antipsychotic medication and to determine the extent to which non-adherence was associated
with service use costs incurred by individuals taking antipsychotics. The findings for this
patient population were compared to those from a sample of individuals taking
antidepressants to determine if the previously observed relationships were present in another
patient group.
6.1.1 Factors associated with non-adherence
In relation to factors associated with non-adherence, my hypotheses were that where non-
adherence to antipsychotic medication was driven by attitudinal factors, severity of illness and
insight would be key factors, and where non-adherence was driven by external factors, social
support, drug and/or alcohol abuse and the experience of side effects would be significant.
Analysis of the 1993/4 PMS institutions sample indicated that non-adherence was associated
with the type of institution the individual was in, their age, level of education, severity of
illness, whether or not they had an alcohol abuse problem, whether or not they had had a
recent inpatient stay and whether or not they experienced medication side effects. Individuals
who were in residential care homes, supervised housing, group homes or hostels were more
than twice as likely to not adhere to their antipsychotics as those in hospital. The association
between age and the probability of non-adherence was negative. That is, within the sample, as
age increased, the probability of non-adherence decreased. Those individuals who had higher
education or A-level educational qualifications were more likely to not adhere as compared to
those with the lowest level of educational attainment. Individuals whose illness was deemed
more severe based on the presence and severity of neurosis, those that had recent inpatient
stays, those who reported moderate or high alcohol dependency and those who reported
193
experiencing side effects were all more likely to not adhere to their medication. The
significance of a recent inpatient stay was also observed in secondary analysis of the 1993/4
PMS household and homeless samples.
These findings were difficult to compare with previous research in this area because of
inconsistency in methodologies across studies. In particular, the reviewed studies differed
widely in the methods used to assess non-adherence, the factors considered and the length of
time over which individuals were followed. Despite these differences, some consistent
findings emerged which were also observed in my analyses. Among patient-related factors,
age, level of education and illness severity were significantly associated with non-adherence
in other studies. Additionally, several studies observed an association between substance
abuse and non-adherence, though in some studies this was an association with illegal drug
misuse as opposed to alcohol, the latter being the association observed in my analysis. The
most consistent finding across this literature was the association between the experience of
side effects and non-adherence.
The effects of age, severity of illness and experience of side effects were also observed as
significantly associated to non-adherence in analysis of individuals taking antidepressants in
the PMS 2000. These findings were broadly consistent with results from other studies.
Significant associations between non-adherence and socioeconomic factors, ethnicity and
substance abuse have also been reported in the literature (Olfson, Marcus et al. 2006;
Akincigil, Bowblis et al. 2007). In my analyses of the 1993-4 and 2000 PMS (chapters 3 and
5), the effects associated with non-adherence in both samples were consistent in the direction
of their association. This suggests that these individual- level factors are important to
medication taking behaviour across mental illnesses.
Some differences between the results do emerge, however. Neither an individual’s level of
education, nor alcohol abuse (or substance abuse more widely) had a significant impact on
non-adherence to antidepressants in the analysis of the PMS 2000, although these effects were
found to be significant in other studies of individuals prescribed antidepressants. In the case
of the effect of having had a recent inpatient stay, in the sample of individuals taking
antidepressants this was associated with a greater likelihood to adhere to their medication as
compared to the sample of individuals taking antipsychotics where it was associated with
greater likelihood of non-adherence. Note, however, that the finding in the sample of those
194
taking antidepressants is based on a very small number of recent inpatients. Also, length of
time on medication was significantly associated with non-adherence to antidepressants but not
with non-adherence to antipsychotics.
Where differences in the two sets of results occur, they suggest that there are particular
aspects of the illness of psychosis or of antipsychotic medication that determine that certain
factors influence medication taking behaviour in a way that differs from what occurs in
patients taking antidepressants. For example, if it is assumed that individuals with higher
educational attainment taking antipsychotics are more inclined to not take their medication
because of the degree to which it inhibits their ability to function intellectually, at a level they
feel they are capable of, this negative aspect does not appear to be associated with taking
antidepressants.
The significance of an inpatient stay on non-adherence to antipsychotics but not to
antidepressants is likely due to the relative severity of illness in the samples studied. In the
1993/4 PMS, approximately 15% of those included in the analysis sample had had an
inpatient stay as compared to less than 2% of the sample of individuals taking antidepressant
in the PMS 2000. If the rates of hospitalisation were similar in the two samples and having
had an inpatient stay were still found to be significantly associated with non-adherence in the
sample taking antipsychotics but not in the sample taking antidepressants, it would then be
warranted to conclude that some aspect of the effects of acute illness warranting
hospitalisation affects the subsequent medication taking behaviour of individuals with
schizophrenia more that individuals with depression (e.g. disruption of therapeutic alliance).
The rate of alcohol abuse was higher in those prescribed antidepressants in the PMS 2000
compared to those prescribed antipsychotics in the 1993/4 PMS, but the effect of alcohol
misuse was found to be associated with non-adherence in the latter group only. It is not
obvious why alcohol abuse or substance abuse would be associated with non-adherence in one
group of patients and not the other. The effect of alcohol or substance abuse was found to be
associated with non-adherence to antidepressants by Akincigil et al (2007).
These results support some of my hypothesis and not others. Severity of illness, alcohol abuse
and the experience of side effects were found to be associated with non-adherence to
antipsychotic medication. Other factors hypothesised to be significant – the patient’s level of
195
insight (proxied by their length of time on medication) and social support - were not found to
be significant.
To gain further understanding of the findings from the empirical results it is also relevant to
see how well they relate to theoretical models that attempt to describe medication taking
behaviour. These models were reviewed in Chapter 1. Typically, theoretical models
developed to understand medication taking behaviours focus on preventative behaviours and
the behaviours relating to the initiation of treatment rather than the maintenance phase of
treatment, which is the focus of my analysis. Despite this, my findings, and those of the
literature looking at factors associated with non-adherence in individuals taking
antipsychotics support some of the models reviewed.
Perhaps the most often cited theoretical model for explaining medication taking behaviour is
the Health Belief Model (HBM). This model suggests health behaviours are determined by
the interaction of personal beliefs and perceived susceptibility, severity, benefits and barriers
of the behaviour. Budd et al (1996) conducted a study of the impact of the HBM in
schizophrenia patients in Wales comparing 20 patients who had presented for, and accepted,
depot antipsychotic medication at all scheduled appointments over the year prior to the study
(compliers) with 20 patients who had failed to attend and/or accept medication for one-third
or more of all scheduled appointments over the same period (non-compliers). The constructs
of the HBM were evaluated using a Health Beliefs Questionnaire (Champion 1984; Pan and
Tantam 1989). The authors found scores on the susceptibility subscale had the greatest
discriminatory power in distinguishing compliers from non-compliers. Scores on the severity
and benefits subscales were significant in distinguishing between the two groups when tested
in separate analyses, but were not significant when added to a model that already contained
the susceptibility subscale.
The concept of susceptibility is consistent with the assumption that those with higher
educational attainment are more likely not to adhere because they perceive the effects of the
medication act as a barrier to functioning at a level they feel they are capable of. More highly
educated individuals may also feel less susceptible to the consequences of non-adherence. The
Self-Medication Hypothesis is, like the concept of susceptibility in the Health Belief Model,
supported by the significance of educational attainment if one assumes that the more educated
an individual is, the more likely they are to perceive that they have a good understanding of
196
their illness and do not need to take medication. The Self-Medication Hypothesis suggests
that individuals intentionally and rationally decide to start, adjust or stop prescribed
medication according to perceived health needs based the information they are given and their
understanding of their condition (Mitchell 2007). It may be the case that more educated
individuals are inclined to rationalise not taking their medication and for this to be an
intentional choice.
With respect to severity of illness, it is likely to be the case that, across illnesses, individuals
whose symptoms are less severe will exhibit greater internal locus of control at the initial
stage of treatment. That is, less severe symptoms may allow them to make the connection
between taking medication and relieving symptoms. However, individuals experiencing more
severe symptoms, particularly in psychotic illness where diminished cognitive function is one
of the potential symptoms, may find it more difficult to perceive that they have the power,
through adherence, to relieve symptoms. Where internal locus of control does not exist,
patients may benefit from identifying their physicians as an external locus of control. This
may account for the finding in the literature that a positive therapeutic alliance between
patients and their physicians improves adherence in patients taking antipsychotics (Weiss,
Smith et al. 2002; Rittmannsberger, Pachinger et al. 2004; McCann, Boardman et al. 2008).
The Self-Regulatory Model of illness does not point to specific patient-, medication- or
environment-related factors being related to non-adherence in patients taking antipsychotics,
but does reflect the likely dynamic nature of medication taking behaviour present in
individuals taking this medication. It proposes a dynamic flow between the three stages of
self-regulation – representation of the illness, development and implementation of a plan to
cope with the illness and evaluation of the coping mechanism. Perhaps the most likely
representation of this model in empirical findings is the significance of side effects. An
individual in the stage of evaluating their coping mechanism (taking the medication), on
experiencing side effects, may reflect that their coping mechanism is ineffective and become
non-adherent to seek to develop a new plan for coping with their symptoms.
Interpretations of the applicability of empirical findings to the available theoretical models is
difficult but may be enhanced by qualitative research methods. Using concept mapping,
Kikkert et al (2006) identified five themes that encompass the factors that affect adherence:
medication efficacy, external factors (such as patient support and therapeutic alliance),
197
insight, side effects and attitudes towards medication. The authors point out that the
importance placed on each of these factors may differ substantionally between patients, carers
and health professions. I will return to this point in my discussion of the implications of my
findings for research.
6.1.2 The association between non-adherence and service use costs
The main hypothesis of my thesis was that non-adherence to medication in individuals taking
antipsychotics, in addition to its impacts on clinical outcomes, is likely to lead to higher
service use and costs. This hypothesis was put forward by researchers previously. Gilmer et al
(2004) suggested that awareness and acknowledgement of the high service use costs that can
be attributed to non-adherence in patients with schizophrenia might act as an incentive to
locate resources to improve adherence in patients with this illness.
My empirical findings support this hypothesis for some key health and social care services. In
a nationally representative sample of patients taking antipsychotics, non-adherence was
associated with greater likelihood of use of community-based health and social care
professionals. Also, a trend towards significance was observed between non-adherence and
the use of inpatient services and the total cost of health and social care services. Additional
analysis of a randomised control trial sample observed no significant association between
non-adherence and either health and social care or societal costs, but a significant association
between non-adherence and lower community-based day service costs. The sample size for
this study was chosen based on having adequate power to observe meaningful differences on
the clinical outcomes and as such, may have been under-powered in relation to measuring
differences in costs.
My analyses also suggest that the relationships between non-adherence and service use and
costs are specific to individuals taking antipsychotics and are likely to vary substantially for
individuals taking other medications. My analysis of the PMS 2000 found a trend towards
non-adherence being associated with lower health and social care service use costs in
individuals taking antidepressants. There was a trend for non-adherence to be associated with
absence from work in this group, although the costs attributed to time off work were
significantly lower amongst those who did not adhere to their medication.
198
To date, few other studies have empirically modelled the effect of non-adherence on costs
across a wide range of services. Previous studies have found an association between non-
adherence to antipsychotics and hospitalisations and their related costs (Weiden and Olfson
1995; Svarstad, Shireman et al. 2001; Weiden, Kozma et al. 2004). These studies have
observed a significant association between non-adherence and inpatient visits and their costs,
confirming the trend observed in my analysis of the 1993/4 PMS. Loosbrock et al (2003)
observed an association between non-adherence and total health care costs; however Eaddy et
al (2005) did not observe this association although they did observe inpatient costs to be
higher amongst individuals deemed partially compliant with their medication as compared to
those who were overly compliant. Note that Eaddy et al (2005) included only inpatient,
outpatient and physician costs in their definition of total costs.
Only two studies were identified that assessed the relationship between non-adherence and
service use and costs in patients taking antidepressants. von Knorring et al (2006) found an
association between non-adherence and inpatient costs, and White et al (2003) observed an
association with medical charges (physician, emergency room, hospital, laboratory and any
other medical charges) but not with total health care costs. As I did, von Knorring et al (2006)
looked at absenteeism costs in their analysis and also did not observe a difference in these
costs by adherence status.
My findings and previous literature suggest that non-adherence is associated with service use
in individuals taking antipsychotics in a way that is different from patients with another
mental illness. In particular, there was some evidence that inpatient and community-based
services were more burdened by non-adherence than other services. Increased total health and
social care costs associated with non-adherence were observed in the literature and while not
conclusively supported by my analysis, there is a trend towards this observation as well in my
analysis of the 1993/4 PMS. Further analysis in this area is warranted to corroborate these
findings. Analysis of societal cost data suggests no differences in these costs by adherence
status. It is the case, however, that my analysis and that of von Knorring et al (2006) only
looked at a limited portion of the indirect costs associated with schizophrenia.
Putting these results in context, there are certain aspects of the illness of schizophrenia that
may impact on the strength of my findings and findings from the literature. There is an issue
199
that some individuals go untreated. Data from the 2000 PMS booster sample of individuals
living in private households suggests that a substantial number of individuals who potentially
have psychosis go untreated. Brugha et al (2005) found that of adults interviewed in 1993 and
found to probably have functional psychosis, only 34% were prescribed medication for their
psychosis. Data from the PMS 2000 found that this rate had increased to 57% in 2000
(Brugha, Bebbington et al. 2004). This suggests that a large proportion of individuals with
psychosis, many of whom will likely have schizophrenia, are untreated and in all probability
will make demands on health, social care or other services. If some of these individuals go
untreated because of difficulties adhering to medication, the estimated costs associated with
non-adherence obtained by survey individuals who are taking medication will underestimate
these costs.
Another issue is the difficulty associated with obtaining data on homeless individuals. The
1993/4 PMS included a survey of the homeless population and while non-adherence was not
associated with total health and social care costs within this group (based on a very simple
analysis), the sample was very small, and more importantly, the lack of service use in a
homeless population may reflect unmet need.
A third issue that may impact upon the results is that the nature of sampling for surveys may
mean that those individuals that are less likely to adhere to medication are also less likely to
participate in a survey if approached to do so. All of these factors suggest that findings from
empirical analysis are likely to underestimate the service use and costs associated with non-
adherence to antipsychotics.
6.1.3 Other factors associated with service use and costs in patients taking antipsychotics
Of the other factors included in the modelling of service use and costs, none were found to be
significant in both the 1993/4 PMS and QUATRO study analyses. Higher severity of
symptoms was associated with higher external services (i.e. community-based visits by health
and social care professionals), while longer length of time on medication was associated with
greater probability of use of community-based day services. Length of time on medication in
the QUATRO study is difficult to interpret because the sample was chosen from patients with
200
an unstable illness, but may relate to severity of illness which was not included in the
QUATRO analyses.
The finding that non-White respondents in the 1993/4 PMS were less likely to use external
services but, on average, had a greater number of inpatient visits was not confirmed by the
QUATRO analyses. In the latter study, non-White European respondents were no more likely
to use inpatient services than White Europeans and incurred lower inpatient costs when
inpatient visits occurred. The fact that the QUATRO study sampled across countries makes it
unlikely that commonalities in the patterns of service use by ethnic minority individuals
would be observed.
The theoretical models presented in chapter 1 describe the current understanding of
medication-taking decision-making, but to the extent that these theories can be thought of
more broadly to describe decisions on all aspects of an individual’s health, they offer insight
into the potential pattern for non-White individuals to forgo health and social care services in
the community with the apparent impact of requiring inpatient services when their mental
well-being deteriorates. This pattern of decision-making about when to access services is
consistent with the Health Belief Model. It suggests that non-White individuals may have
different views as to the benefits of community-based health and social care services and
perceive there to be barriers to accessing these services. Other research in this area also
supports this application of the Health Belief Model, identifying perception of illness severity,
reliance on informal support networks, a lack of trust and the perception that the providers of
community psychiatric care lack cultural awareness and understanding as key reasons why
non-White individuals are less likely to access community-based services (National Centre for
Social Research 2002; The Sainsbury Centre for Mental Health 2002; National Institute for
Mental Health in England 2003).
Severity of illness appeared to be strongly associated with total health and social care costs in
individuals taking antidepressants. This was not the case in the analysis of patients taking
antipsychotics identified in the 1993/4 PMS which included an index to represent this effect.
201
6.2 Limitations
The analyses conducted in this thesis rely on the best available data on a cross-section of
individuals taking medication for whom information was collected on adherence to
medication and use of health, social care and other services. As this was secondary analysis, it
is important to note that none of these data were collected for this purpose directly and as
such, have some limitations with respect to addressing my particular research questions. The
discussion above identifies some aspects of the samples that may have made it more difficult
to observe consistent results.
None of the datasets contained information on all of the factors found to be potentially
associated with non-adherence in a review of the literature. With respect to the analysis of
non-adherence to antipsychotics, the 1993/4 PMS and QUATRO samples differed in their
settings. Had consistent results been observed across the two samples the results could be
deemed more generalisable. However, the differences in the samples make it less likely to
observe consistent results.
The fact that prescribing patterns are constantly changing imposes a further limitation on
these analyses. These changes may have an impact on the nature of the relationship between
previously observed factors affecting adherence and the relationship between non-adherence
and costs. Despite these limitations, however, it is my feeling that this thesis provides
important information on these relationships.
6.3 Policy Implications
My research has implications for policies that relate to patients, the health care system and
future research in this area. I will first discuss the policies affecting individual patients, and
then implications for the wider health care system.
202
6.3.1 Implications for patients
The empirical analyses within this thesis have important implications for patients. They
illustrate that for a nationally representative sample, the rate of non-adherence was in line
with those estimated in the literature from local studies and reviews. Given the rates at which
patients report not adhering to their medication, there is a significant shortfall in the clinical
benefits that could be available to patients.
Factors associated with non-adherence in my analyses are consistent with some of the
previous findings within the literature. These results aid in corroborating previous findings,
with the benefit that the analyses include data drawn from a nationally representative study.
Also, by comparing the results for non-adherence to antipsychotics with those of non-
adherence to antidepressants, for a similar population, the analyses shed light on which of the
factors associated with non-adherence are particular to patients prescribed antipsychotics.
That is, in addition to those factors that are likely to be associated with non-adherence across
illnesses, such as the experience of side effects, there are those factors, such as substance
abuse, that are more likely to be associated with non-adherence in patients experiencing
psychosis. This information could potentially be used to help clinical staff to identify those
patients most likely to benefit from interventions to improve adherence in patients taking
antipsychotics, and to ensure that potential interventions are designed and delivered in such a
way as to be targeted at those individuals most at risk of not adhering to their medication.
A range of interventions have been developed to improve medication adherence in patients
with schizophrenia. These are primarily psychosocial interventions such as educational
approaches, skills training, group therapy, family interventions, cognitive treatments,
behavioural modification techniques or some combination of these (Byerly, Nakonezny et al.
2007). The evidence to date, while not entirely consistent, suggests that those interventions
that are intensive, supportive, have a problem-solving element and include the family
members of patients are most effective in improving adherence. Hudson et al (2008) found
that in a trial of a practical, patient-tailored intervention to identify and develop strategies to
overcome barriers to medication adherence, patients who received the intervention were less
likely to be non-adherent at the 6-month study assessment. Note, however, that evidence in
my results, and other literature, throw up the likely challenge of intervening with difficult-to-
203
reach populations such as the homeless and those with a dependency on illegal drugs. For
example, a focus on family- involvement strategies to improve adherence would not address
the needs of homeless individuals. The availability of long-acting injectable antipsychotic
medications does, however, allow physicians to identify those patients not attending
appointments and therefore not receiving their medication. Depot antipsychotic medication
has become an option for treating difficult-to-reach patients.
My analyses did not estimate adherence rates for the range of antipsychotic drugs, as the
datasets used did not identify the particular medication prescribed for each individual. Were
this information available, it would be possible to determine to what extent non-adherence
rates, and the factors related to adherence, differed by medication. A study by Gianfrancesco
et al (2006) observed that in a comparison of antipsychotics on rates of adherence, where
adherence was measured by medication possession ratio, use of the atypical antipsychotic
quetiapine was associated with better adherence than use of two other atypical antipsychotics
– risperidone and olanzapine.
6.3.2 Implications for the health care system
The current National Institute of Clinical Excellence guidance (NICE 2009) on treatment for
patients with schizophrenia calls for medication choices to be made collaboratively by the
person using services and healthcare professionals after the person using services has been
informed of the benefits and side-effects of each drug and has had a chance to discuss this
information. The guidance also calls for the views of carers to be considered if the service
user agrees, and for the use of alcohol, tobacco, prescription and non-prescription medication
and illicit drugs to be discussed so that the service user is aware that these will possibly
interfere with the therapeutic effects of prescribed medication and psychological treatments.
Specific guidance on treating patients from ethnic minorities was also provided. The current
guidance is a revision of guidance published in 2002 which recommended atypical
antipsychotics as the first-choice for pharmacological treatment (NICE 2002).
The new guidance, therefore, addresses some key factors found to be associated with non-
adherence as corroborated by my findings, in particular, emphasising the role of carers and
family members in successful management of the illness, the potentially adverse impact that
204
illicit drug use can have on therapeutic effects and issues around service provision to
individuals from ethnic minorities.
My findings confirmed the importance of carers and family members and suggest that the
guidance could go further to address the needs of those individuals who live alone and/or are
not in contact with family members. With respect to individuals with schizophrenia from
ethnic minorities, it is highly likely that the observed pattern of service use which substitutes
inpatient visits for community-based services reflects the fact that these individuals are only
accessing services when their illness has progressed to become more severe. Further analysis
is warranted to determine if the changes in the guidelines in England have the desired effect
of eliminating patterns of service use that appear to be based on an individual’s ethnicity.
The NICE guidance refers explicitly to non-adherence in recommending that service users are
made aware of the high risk of relapse if they discontinue their medication and that depot
injectable antipsychotic medication should be offered to people with schizophrenia when
avoiding non-adherence is a clinical priority.
The guidance recommend that the psychological therapy and psychosocial interventions that
should be offered to people with schizophrenia are cognitive behavioural therapy, family
intervention (where families live with or are in close contact with the service user) and art
therapy. These interventions are recommended on the basis that they are beneficial in
reducing symptoms, risk of relapse or rehospitalisation or improve the quality of life of
people with schizophrenia, as opposed to the specific consideration of improving adherence.
However, while their impact on adherence was not the primary consideration, it is possible
that they may improve adherence. The one intervention assessed by NICE that was
specifically designed to improve adherence was not recommended on the grounds that trials
of its clinical effectiveness did not consistently show improvement in adherence as a result of
the intervention. Counselling and supportive psychotherapy and social skills training were
also not recommended.
The results presented in my thesis suggest that the impact of non-adherence varied across the
types of services used by individuals with schizophrenia. These results were not consistent,
however, across the two studies assessing service use costs in individuals prescribed
antipsychotics. Analysis of a sample of individuals taking antidepressants suggested that the
205
cost implications of non-adherence were not significant in this group of service users. Thus
while adherence interventions may not be generally beneficial across illnesses, they have the
potential to be beneficial for people taking antipsychotics.
If further evidence supported the finding that use of community-based services was associated
with non-adherence, then encouraging health professionals working in this sector to provide
information and practical tools to help individuals adhere to their medication may have the
best outcomes for reducing non-adherence rates. As an example, Gray et al (2004) observed
that medication management training given to community mental health nurses was effective
in improving adherence in patients with schizophrenia.
Some common results do exist when hospital and outpatient services are contrasted with
community services. In both studies, having social support was associated with an increased
probability of having had an inpatient stay. This may be interpreted as evidence for the
importance of monitoring individuals in secondary care without social support so as to ensure
that the signs of symptom severity requiring an inpatient stay are adequately monitored.
Alternatively, this result may reflect the need for community services to better support those
living with individuals with schizophrenia. Another consistent finding was the significance of
medication familiarity, as indexed by length of time on medication, in association with the use
of community services. This suggests the need for newly diagnosed patients to be encouraged
to access these services.
6.3.3 Implications for research
Having analysed data as to the factors associated with non-adherence, I believe that it would
be beneficial to have a better understanding of the reasons behind the medication taking
behaviour of individuals. This information would be helpful for assessing theoretical models
to explain non-adherence to medication. There have been some qualitative research on the
reasons individuals with schizophrenia give for not taking their medication. Löffler et al
(2003) conducted a survey in Leipzig in Germany of schizophrenia patients receiving
inpatient, day care or outpatient treatment. The patients were asked for their reasons for
compliance and non-compliance with medication using the Rating of Medication Influences
(ROMI) scale (Weiden, Rapkin et al. 1994). The reasons most often given were to avoid side-
206
effects of medication, no perceived benefit of the medication and lack of insight into the
necessity of medication. Similar findings were observed in a study by Rosa et al (2005) in
Brazil who interviewed outpatients diagnosed with schizophrenia.
Löffler et al (2003) went further and assessed the correlation between patient-related factors
and responses given regarding reasons for non-adherence. Men were significantly less likely
to report fear of stigmatisation as a reason for non-adherence, older patients were less likely to
consider distress from side effects as a cause for non-adherence and patients with more severe
symptoms were more likely to give denial of the illness and a fear of stigma as reasons for
non-adherence. Also, patients who had had an inpatient stay in the previous six months were
more likely to report that lack of recovery or improvement was a reason for non-adherence.
These results suggest that the Health Belief Model is relevant to explaining the underlying
reasons for non-adherence in individuals taking antipsychotics. The authors of this study also
found that the subjective reasons for non-adherence were stable over time (Löffler, Killian et
al. 2003).
Pound et al (2005) used meta-ethnography to synthesis qualitative research into the
experiences of individuals with regards to their medicine taking. Reviewing studies from
1992 to 2001, they found two qualitative studies of individuals taking antipsychotics, both of
which suggested that individuals weigh up the positives and negatives of their medication
when making decisions on how they take medicines (Rogers, Day et al. 1998; Usher 2001).
The benefits reported were reduced symptoms, improved ability to deal with symptoms and
reduced risk of relapse. These were weighed up against physical and psychological adverse
effects and the stigma and discrimination associated with taking antipsychotics. The studies
also found that people taking antipsychotics felt pressure from relatives and health professions
to take their medication and that adherence was necessary for them to be tolerated in their
communities. Pound et al (2005) concluded that individuals are generally reluctant to take
medicine and prefer to minimise medicine intake; the authors suggest that the focus of
improving medication taking behaviour should be on developing safer medicines. Weiden
(2007) makes a similar suggestion by pointing out that non-adherence may be brought about
for some patients by a lack of efficacy of their medication, which exacerbates symptoms
which in turn interfere with an individual’s medication taking behaviour.
207
The theoretical models of medication taking behaviour are of benefit to the extent that they
can be used in allowing individuals with schizophrenia and their health professionals to work
towards making their illness more manageable. While theoretical approaches are of value for
understanding an individual patient’s medication-taking behaviour, the constraints of clinical
practice mean that it may be difficult to assess the theoretical underpinnings of non-adherence
at an individual level and make it difficult to determine individually-specific methods for
improving adherence (Zygmunt, Olfson et al. 2002). Weiden (2007) proposes a flexible
approach to applying adherence theory in individuals taking antipsychotics that may lead to
an enhanced range of potential therapeutic interventions to limit the effects of non-adherence.
This approach distinguishes adherence attitudes from adherence behaviour and points out that
each needs to be assessed and managed to improve medication taking behaviour.
In addition to the valuable information that can be gained in future from qualitative research,
how best to incorporate the impact of non-adherence in quantitative analysis needs to be
addressed. One issue is how best to standardise the measurement and reporting of adherence.
Cramer et al (2008) propose that adherence should be reported in studies as the percentage of
dosages missed in a particular period of time. This continuous measure would reflect the
severity of non-adherence and would avoid situations where different cut-points indicating
non-adherence are used across studies. They suggest that in prospective studies, the
percentage of dosages missed would be available from electronic monitoring and in
retrospective studies the medication possession ratio would provide the necessary information
to allow for this index to be calculated. Electronic monitoring and the medicine possession
ratio methods, however, are not without limitations and are unlikely to be feasible in large
surveys. Hughes et al (2001) have recommended using a measure of non-adherence, such as
the therapeutic coverage achieved and relating it to changes in outcome at different levels of
exposure over time. This would take into account the timing of missed dosages, which may be
important to the effectiveness of the medication.
Another important question is how best can cost-effectiveness analysis (CEA) take account of
longer term outcomes which will reflect the true impact of non-adherence to medication? In a
review of literature evaluating both costs and clinical outcomes in schizophrenia, none of the
trials used for CEA evaluated costs and effects beyond the first year of treatment (Basu 2004).
The fact that these trials were funded by pharmaceutical companies and employed methods
that would meet marketing regulatory requirements only meant that it would be impractical
208
for them to take a long-term perspective, in part due to the costs involved. Long-term studies
incur substantial costs in following patients and in data collection. Moreover, studies
involving schizophrenia patients have very high sample attrition (Verhoeven, Van der Heijden
et al. 2005; Vickar, North et al. 2009). These costs may be warranted, however, given that
short-term studies do not address effects and costs that appear in the longer term, when the
impacts of non-adherence may realised, especially in a chronic illness such as schizophrenia.
Historically, analyses of randomised control trials to assess clinical effectiveness have
adopted intention-to-treat analysis when participants do not receive the intervention or course
of treatment to which they were randomised. Thus those individuals who do not adhere to
their treatment would contribute outcome data towards the group to which they were
assigned. This approach requires two important assumptions to be made (White 2005).
Firstly, that the benefit of treatment is the same for all individuals, regardless of whether they
are more or less likely to adhere to their medication. Secondly, that the difference in costs
between the treatment and control group depends only on the difference in intervention costs.
The latter assumption can not be made in drug trials where there are cost implications of non-
adherence. Cost-effectiveness evaluations of drug therapies should include sensitivity analysis
to determine if realistic rates of non-adherence have a bearing on the outcome of the
evaluation (Hughes, Bagust et al. 2001). Note that while the focus here is not on the clinical
consequences on non-adherence, these too are important.
Table 6.1 is a subset of part of Table II in Hughes et al (2001). The original table attempts to
categorise drug-disease pairs according to the sensitivity of their cost-effectiveness ratios to
changes in adherence taking into account the nature of the disease and the severity of the
consequences of non-adherence. The table estimates these impacts for a range of illnesses
including psychosis and depression. The economic consequences are represented as £ (least
costly), ££ or £££ (most costly) which are hypothesised costs per quality-adjusted life-year
(QALY) per percentage decrease in drug regimen non-adherence or premature treatment
discontinuation. These, however, are only estimates. Information on the frequency of missed
dosages would be necessary to determine the effects on the pharmacodynamic interaction of a
drug with the disease process it was prescribed for. This is partly reflected in the perceived
impact of non-adherence relative to premature discontinuation of medication for a potentially
fatal disease such as hypertension.
209
Table 6.1: Examples of the clinical consequence of noncompliance estimated according to hypothesised costs per quality-adjusted life-year per percentage decrease in drug regimen Disease Drug treatment Drug regimen
noncompliance Premature discontinuation
Clinical consequences
£/QALY/% Clinical consequences
£/QALY/%
Psychosis Antipsychotics Extended duration of symptoms
££ Increased risk of suicide
££
Depression Antidepressants Relapse of depression
££ Discontinuation syndrome
££
Osteoporosis Bisphosphonates Decreased bone density
£ Increased risk of fractures
££
Hypertension Diuretics Increased blood pressure
£ Increased risk of cardiovascular events
£££
Heart failure Diuretics Acute fluid retention
£££ Increased risk of cardiovascular events
£££
Source: Hughes et al 2001b
A variety of modelling techniques have been employed in the recent literature to deal with the
methodological difficulties in observing the long-term economic consequences of non-
adherence. The three main techniques used are decision-analysis or decision trees, Markov
models and Discrete Event Simulation (DES). In decision-analysis models there is a ‘root’
decision from which branches extend, representing different events or secondary decisions.
Each branch has associated with it a probability of the event it relates to occurring. To reflect
non-adherence, levels of adherence can be branches within a decision tree, each assigned a
probability. Cost and effect consequences of each branch are typically represented at the end
point of each sequence of branches. The weighted average of outcomes can then be calculated
to arrive at the average effect and/or cost of each branch of the decision tree. Decision-
analysis models usually attempt to model a limited number of outcomes for the average
patient. Attempting to incorporate variability across patients would require analysing the
model with different event probabilities or building separate branches for different subgroups
(Heeg, Damen et al. 2008). Similarly, decision-analysis models are also constrained by not
210
modelling variability in patient characteristics over time. To incorporate variability over time,
the model would require branches for each time period, exponentially increasing the number
of branches.
A Markov model is a repeated decision tree in which events are modelled as transitions from
one health state to another over time (Heeg, Damen et al. 2008). As in decision-analysis,
Markov models become very complex when made to account for subgroups of patients. This
method of modelling is also constrained by the assumption that the probability of an event is
not affected by previous occurrences of the event. This assumption does not hold in
schizophrenia where the risk of relapse or non-adherence is not independent of previously
experienced relapses, so micro-simulation Markov models have been developed to simulate
individual patient histories over time (Heeg, Damen et al. 2008).
Discrete Event Simulation Models represent the dynamic behaviour of a system. They are
able to represent multiple factors in a model simultaneously (Heeg, Buskens et al. 2005).
Time-independent parameters, such as sex, can be assigned a probability distribution and
time-dependent variables, such as adherence or non-adherence, are simulated as part of
patient histories. This feature of DES models allows them to assess outcomes over longer-
term time horizons. Data for a large number of individuals can be run through the model to
arrive at aggregate clinical outcomes and costs.
Each of the modelling approaches require data from the literature or expert opinion as to the
probability of events such as non-adherence and the clinical and cost consequences of these
events. Typically, sensitivity analyses are run to determine the impact of varying the
probability of non-adherence. The results produced in this thesis could be used to contribute
estimates of the cost consequences on non-adherence to such model.
Hughes et al (2007) conducted a review of pharmacoeconomic evaluations published between
1997 and 2005 that included non-adherence in the evaluation process and found no
consistency in the modelling techniques used. The authors note that Health Technology
Assessment bodies have not published consensus guidelines on the use of these techniques.
211
6.4 Conclusions
The impact of non-adherence on health, social care and the wider societal costs is difficult to
assess for practical and methodological reasons. Analyses of nationally representative samples
of individuals prescribed antipsychotics and antidepressants suggest that younger age, illness
severity and the experience of side-effects are common causes of non-adherence in mental
illness. Substance abuse is an additional factor associated with non-adherence in patients
taking antipsychotics.
Community-based services were found to be used more by individuals with interruptions in
their antipsychotic medication. In this group there may also be additional costs in
hospitalisations and overall health and social care services attributable to non-adherence.
Benefits to patients may be accrued by enabling health and social care professionals,
particularly those working in the community, to encourage medication adherence in
individuals with schizophrenia and to provide information on new interventions that are cost-
effective in improving adherence.
The datasets used in my analyses were the best available sources of data at the time of my
analyses. Further analysis in this area is warranted. At the level of the individual, qualitative
research methods may contribute to our understanding of the reasons why some people with
schizophrenia choose not to take their medication. More long-term studies are needed to
determine the clinical, economic and personal consequences of non-adherence. Greater
standardisaton of the way in which non-adherence is assessed in these studies would be
beneficial. The data provided from these studies will be particularly useful in assessments of
the long-term cost-effectiveness of new medicines and therapies to treat schizophrenia.
212
REFERENCES Adams, C., M. Fenton, et al. (2001). "Systematic meta-review of depot antipsychotic drugs
for people with schizophrenia." British Journal of Psychiatry 179: 290-299. Adams, J. and J. Scott (2000). "Predicting medication adherence in severe mental disorders."
Acta Psychiatrica Scandinavica 101: 119-124. Aikens, J., D. Nease, et al. (2005). "Adherence to maintenance-phase antidepressant
medication as a function of patient beliefs about medication." Annals of Family Medicine 3: 23-30.
Akincigil, A., J. Bowblis, et al. (2007). "Adherence to antidepressant treatment among privately insured patients diagnosed with depression." Medical Care 45: 363-369.
Aleman, A., R. Kahn, et al. (2003). "Sex differences in the risk of schizophrenia." Archives of General Psychiatry 60: 565-571.
Alessi-Severini, S., R. Biscontri, et al. (2008). "Utilization and costs of antipsychotic agents: A Canadian population-based study, 1996-2006." Psychiatric Services 59(5): 547-553.
Allison, D. and D. Casey (2001). "Antipsychotic-induced weight gain: a review of the literature." Journal of Clinical Psychiatry 62((suppl 7)): 22-31.
Anderson, R. and D. Lewis (1999). "Clinical characteristics and service use of persons with mental illness living in an intermediate care facility." Psychiatric Services 50(10): 1341-1345.
Anderson, R., J. Lyons, et al. (2001). "The prediction of mental health service use in residential care." Community Mental Health Journal 37(4): 313-322.
Andrade, S., K. Kahler, et al. (2006). "Methods for evaluation of medication adherence and persistence using automated databases." Pharmacoepidemiology and Drug Safety 15(8): 565-574.
Arellano, M. (2003). Panel Data Econometriics. Oxford, Oxford University Press. Bandura, A. (1977). Social Learning Theory. Englewood Cliffs, NJ, Prentice Hall. Bandura, A. (1986). Social Foundations of Thought and Action. Englewood Cliffs, NJ,
Prentice Hall. Barnes, T. (2002). Compliance issues and the new antipsychotics. Schizophrenia. M. Maj and
N. Sartorius. Chichester, John Wiley & Sons. Basu, A. (2004). "Cost-effectiveness analysis of pharmacological treatments in schizophrenia:
critical review of results and methological issues." Schizophrenia Research 71: 445-462.
Battaglia, J. (2001). Compliance with treatment in schizophrenia. American Psychiatric Association - 53rd Institute on Psychiatr Serv, Orlando, Florida, USA.
Bebbington, P., M. Angermeyer, et al. (2005). "The European Schizophrenia Cohort (EuroSC) - A naturalistic prognostic and economic study." Social Psychiatry and Psychiatric Epidemiology 40: 707-717.
Becker, M., M. Young, et al. (2007). "The relationship of antipsychotic medication class and adherence with treatment outcomes and costs for Florida Medicaid beneficiaries with schizophrenia." Administration and Policy in Mental Healh & Mental Health Services Research 34: 307-314.
Beecham, J. (1995). Collecting and estimating costs. The Economic Evaluation of Mental Health Care. M. Knapp. Aldershot, Ashgate Publishing Ltd: 61-82.
Beecham, J. and M. Knapp (1992). Costing psychiatric interventions. Measuring Mental Health Needs. G. Thormicroft, C. Brewin and J. Wing. London, Gaskell: 163-183.
Beecham, J. and M. Knapp (2001). Costing psychiatric interventions. Measuring Mental Health Needs. G. Thormicroft. London, Gaskell: 200-224.
213
Bentall, R., J. Day, et al. (1996). Side-effects of neuroleptic medication: Assesment and impact on outcome of psychotic disorders. Handbook of Mental Health Economics and Health Policy, Volume 1, Schizophrenia. M. Moscarelli, A. Rupp and N. Sartorius. Chichester, John Wiley & Sons.
Blough, D., C. Madden, et al. (1999). "Modeling risk using generalized linear models." Journal of Health Economics 18: 153-171.
Boslaugh, S. (2007). Secondary Data Sources for Public Health: A practical guide. Cambridge, Cambridge University Press.
Bosmans, J., O. Brook, et al. (2007). "Cost effectiveness of a pharmacy-based coaching programme to improve adherence to antidepressants." Pharmacoeconomics 25(1): 25-37.
Bosworth, H., C. Voils, et al. (2008). "The effects of antidepressant medication adherence as well as psychosocial and clinical factors on depression outcome among older adults." International Journal of Geriatric Psychiatry 23: 129-134.
Boydell, J., J. van Os, et al. (2001). "Incidence of schizophrenia in ethnic minorities in London - ecological study into interactions with environment." BMJ 323: 1336-1338.
Briesacher, B., S. Andrade, et al. (2008). "Comparison of drug adherence rates among patients with seven different medical conditions." Pharmacotherapy 28(4): 437-443.
Brugha, T., P. Bebbington, et al. (2004). "Trends in service use and treatment for disorders in adults throughout Great Britain." British Journal of Clinical Psychology 185: 378-384.
Brugha, T., R. Jenkins, et al. (2004). "Risk factors and the prevalence of neurosis and psychosis in ethnic groups in Great Britain." Social Psychiatry and Psychiatric Epidemiology 39: 939-946.
Brugha, T., N. Singleton, et al. (2005). "Psychosis in the community and in prisons: A report from the British National Survey of Psychiatric Morbidity." American Journal of Psychiatry 162: 774-780.
Buchanan, A. (1996). Compliance with treatment in schizophrenia. Hove, Psychology Press Ltd.
Buckalew, L. and R. Sallis (1986). "Patient compliance and medication preception." Journal of Clinical Psychology 42(1): 49-53.
Budd, R., I. Hughes, et al. (1996). "Health beliefs and compliance with anitpsychotic medication." British Journal of Clinical Psychology 35: 393-397.
Bull, S., X. Hu, et al. (2002). "Discontinuation of use and switching of antidepressants." JAMA 288(11): 1403-1409.
Byerly, M., P. Nakonezny, et al. (2007). "Antipsychotic medication adherence in schizophrenia." Psychiatric Clinics of North America 30: 437-452.
Byerly, M., A. Thompson, et al. (2007). "Validity of electronically monitored medication adherence and conventional adherence measures in schizophrenia." Psychiatric Services 58(6): 844-847.
Byng, R., C. Bury, et al. (2007). "Patients' experience of consultations for depression and predictors of adherence to antidepressants." Primary Care & Community Psychiatry 12(3-4): 109-115.
Byrne, B. (2001). Structural Equation Modelling with Amos: Basic concepts, applications, and programming. Mahwah, New Jersey, Lawrence Erlbaum Associates.
Campbell Collaboration. (2001). "Campbell Collaboration guidelines." Retrieved February 14, 2006, from www.campbellcollaboration.org.
Cantrell, C., M. Eaddy, et al. (2006). "Methods for evaluating patient adherence to antidepressant therapy: A real-world comparison of adherence and economic outcomes." Medical Care 44(4): 300-303.
Carr, V., A. Neil, et al. (2003). "Costs of schizophrenia and other psychoses in urban Australia: findings from the Low Prevalence (Psychotic) Disorders Study." Australian and New Zealand Journal of Psychiatry 37: 31-40.
Carroll, L., J. Cassidy, et al. (2004). "Depression as a risk factor for onset of an episode of troublesome neck and low back pain." Pain 107: 134-139.
Champion, V. (1984). "Instrument development for health belief model constructs." Advances in Nursing Science 10: 73-85.
Chisholm, D., M. Knapp, et al. (2000). "Client socio-demographic and service receipt inventory - European Version: development of an instrument for international research. EPSILON Study 5. European Psychiatric Services: Inputs linked to Outcome Domains and Needs." British Journal of Psychiatry 177: S28-S33.
Cohen, J., P. Cohen, et al. (2003). Applied Multiple Regression/Correlation Analysis for the Behavioral Sciences. Mahwah, New Jersey, Lawrence Erlbaum Associates.
Coldham, E., J. Addington, et al. (2002). "Medication non-adherence of individuals with a first episode of psychosis." Acta Psychiatrica Scandinavica 106: 286-290.
Conley, R. and D. Kelly (2001). "Management of treatment resistance in schizophrenia." Biological Psychiatry 50(11): 898-911.
Cooper, D., J. Moisan, et al. (2007). "Adherence to atypical antipsychotic treatment among newly treated patients: A population-based study in schizophrenia." Journal of Clinical Pschiatry 68(6): 818-825.
Cramer, J. and R. Rosenheck (1998). "Compliance with medication regimes for mental and physical disorders." Psychiatric Services 49: 196-201.
Cramer, J. and R. Rosenheck (1999). "Enhancing medication compliance for people with serious mental illness." Journal of Nervous and Mental Disease 187(1): 53-55.
Cramer, J., A. Roy, et al. (2008). "Medication compliance and persistence: terminology and definitions." Value in Health 11(1): 44-47.
Creer, C. and J. Wing (1975). "Living with a schizophrenic patient." British Journal of Hospital Medicine 14: 73-82.
Cuffe, S., J. Waller, et al. (2001). "A longitudinal study of adolescent mental health service use." Journal of Behavior Health Services and Research 28(1): 1-11.
Cuffel, B., D. Jeste, et al. (1996). "Treatment costs and use of community mental health services for schizophrenia by age cohorts." American Journal of Psychiatry 153(7): 870-876.
Curtis, L. (2008). Unit Costs of Health and Social Care 2008. Canterbury, Personal Social Services Research Unit.
Davies, A., P. Langley, et al. (1998). "Risperidone versus haloperidol: II. cost-effectiveness." Clinical Therapeutics 20: 196-213.
Day, J., R. Bentall, et al. (2005). "Attitudes towards antipsychotic medication: The impact of clinical variables and relationships with health professionals." Archives of General Psychiatry 62: 717-724.
Demyttenaere, K. (1997). "Compliance during treatment with antidepressants." Journal of Affective Disorders 43: 27-39.
Department for Work and Pensions. (2008). "Department for Work and Pensions Resource Centre, Statistics - Tabulation Tool." Retrieved 9th July 2008, from www.dwp.gov.uk/asd/tabtool.asp.
Diaz, E., H. Levine, et al. (2001). "Use of the medication event monitoring system to estimate medication compliance in patients with schizophrenia." Journal of Psychiatry and Neuroscience 26(4): 325-329.
DiMatteo, M., H. Lepper, et al. (2000). "Depression is a risk factor for noncompliance with medical treatment - Meta-analysis of the effects of anxiety and depression on patient adherence." Archives of Internal Medicine 160: 2101-2107.
Dolder, C., J. Lacro, et al. (2002). "Antipsychotic medication adherence: is there a difference between typical and atypical agents?" American Journal of Psychiatry 159: 103-108.
Domino, M. and M. Swartz (2008). "Who are the new users of antipsychotic medications?" Psychiatric Services 59: 507-514.
Donohue, G., N. Owens, et al. (2001). "Predictors of compliance with neuroleptic medication among inpatients with schizophrenia: a discriminant function analysis." European Psychiatry 16: 293-298.
Donohue, J. and H. Pincus (2007). "Reducing the societal burden of depression - A review of economic costs, quality of care and effects of treatment." Pharmacoeconomics 25(1): 7-24.
Dunn, G., M. Mirandola, et al. (2003). "Describing, explaining or predicting mental health care costs: a guide to regression models." British Journal of Psychiatry 183: 398-404.
Eaddy, M., A. Grogg, et al. (2005). "Assessment of compliance with antipsychotic treatment and resource utilization in a medicaid population." Clinical Therapeutics 27(2): 263-272.
Fenton, W., C. Blyler, et al. (1997). "Determinants of medication compliance in schizophrenia: empirical and clinical findings." Schizophrenia Bulletin 23(4): 637-651.
Fisher, R. (1922). "On the interpretation of X2 from contingency tables, and the calculation of P." Journal of the Royal Statistical Society 85(1): 87-94.
Fleischhacker, W. (2002). Pharmacological treatment of schizophrenia: A review. Schizophrenia. M. Maj and N. Sartorius. Chichester, John Wiley & Sons.
Gaebel, W. (1997). "Towards the improvement of compliance: the significant psycho-education and new antipsychotic drugs." International Clinical Psychopharmacology 12(suppl 1): S37-S42.
Garcia-Cabeza, I., J.-C. Gomez, et al. (2001). "Subjective response to antipsychotic treatment and compliance in schizophrenia - a naturalistic study comparing olanzapine, risperidone and haloperidol (EFESO Study)." BMC Psychiatry 1: 7-15.
Geddes, J., N. Freemantle, et al. (2000). "Atypical antipsychotics in the treatment of schizophrenia: systmeatic overview and met-regression analysis." BMJ 321: 1371-1376.
Gelder, M., P. Harrison, et al. (2006). Shorter Oxford Textbook of Psychiatry, Oxford University Press.
Gianfrancesco, F., K. Rajagopalan, et al. (2006). "Treatment adherence among patientw with schizophrenia treated with atypical and typical antipsychotics." Psychiatry Research 144: 177-189.
Gill, B., H. Meltzer, et al. (1996). Psychiatric morbidity among homeless people. OPCS Surveys of Psychiatric Morbidity in Great Britain. Report 7. London, HMSO.
Gilmer, T., C. Dolder, et al. (2004). "Adherence to treatment with antipsychotic medication and health care costs among medicaid beneficiaries with schizoprenia." American Journal of Psychiatry 161(4): 692-699.
Glazer, W. and L. Ereshefsky (1996). "A pharmacoeconomic model of outpatient antipsychotic therapy in "revolving door" schizophrenia patients." Journal of Clinical Psychiatry 57(8): 337-345.
Glover, G., G. Arts, et al. (2006). "Crisis resolution/home treatment teams and psychiatric admission rates in England." British Journal of Psychiatry 189: 441-445.
216
Gray, A., M. Marshall, et al. (1997). "Problems in conducting economic evaluations alongside clinical trials - Lessons from a study of case management for people with mental disorders." British Journal of Psychiatry 170: 47-52.
Gray, R., M. Leese, et al. (2006). "Adherence therapy for people with schizophrenia - European multicentre randomised controlled trial." British Journal of Psychiatry 189: 508-514.
Gray, R., T. Wykes, et al. (2004). "Effect of a medication management training package for nurses on clinical outcomes for patients with schizophrenia - cluster randomised controlled trial." British Journal of Psychiatry 185: 157-162.
Greenberg, P., R. Kessler, et al. (2003). "The economic burden of depression in the United States: how did it change between 1990 and 2000?" Journal of Clinical Psychology 64(12): 1465-1473.
Greener, M. and J. Guest (2005). "Do antidepressants reduce the burden imposed by depression on employers?" CNS Drugs 19(3): 253-264.
Grunebaum, M., P. Weiden, et al. (2001). "Medication supervision and adherence of persons with psychotic disorders in residential treatment settings: a pilot study." Journal of Clinical Psychiatry 62(5): 394-399.
Hafner, H., K. Maurer, et al. (1993). "The influence of age and sex on the onset and early course of schizophrenia." British Journal of Psychiatry 162: 80-86.
Harrold, L. and S. Andrade (2008). "Medication adherence of patients with selected rheumatic conditions: A systematic review of the literature." Semin Arthritis Rheum [epub ahead of print].
Haynes, R. (1979). Introduction. Compliance in Health Care. R. Haynes, D. Sackett and D. Taylor. Baltimore, MD, John Hopkins University Press: 1-10.
Healey, A., M. Knapp, et al. (1998). "Cost-effectiveness evaluation of compliance therapy for people with psychosis." British Journal of Psychiatry 172: 420-424.
Hedeker, D. and R. Gibbons (2006). Longitudinal Data Analysis. Hoboken, New Jersey, John Wiley & Sons.
Heeg, B., E. Buskens, et al. (2005). "Modelling the treated course of schizophrenia: Development of a discrete event simulation model." Pharmacoeconomics 23 Suppl. 1: 17-33.
Heeg, B., J. Damen, et al. (2008). "Modelling approaches - The case of schizophrenia." Pharmacoeconomics 26(8): 633-648.
Heider, D., S. Bernert, et al. (2009). "Direct medical mental health care costs of schizophrenia in France, Germany and the United Kingdom - Findings from the European Schizophrenia Cohort (EuroSC)." European Psychiatry 24: 216-224.
Hodgson, R. and R. Belgamwar (2006). "Off-label prescribing by psychiatrists." Psychiatric Bulletin 30: 55-57.
Hosmer, D. and S. Lemeshow (2000). Applied Logistic Regression. New York, John Wiley & Sons, Inc.
Hudson, T., R. Owen, et al. (2008). "Guideline implementation and patient-tailoring strategies to improve medication adherence for schizophrenia." Journal of Clinical Psychiatry 69: 74-80.
Hughes, D., A. Bagust, et al. (2001). "Accounting for noncompliance in pharmacoeconomic evaluatoins." Pharmacoeconomics 19(12): 1185-1197.
Hughes, D., W. Cowell, et al. (2007). "Methods of integrating medication compliance and persistence in pharmacoeconomic evaluations." Value in Health 10(6): 498-509.
Jablensky, A. (2003). The epidemiological horizon. Schizophrenia. W. D. Hirsch SR. Oxford, Blackwell Publishing: 203-231.
217
Janssen, B., W. Gaebel, et al. (2006). "Evaluation of factors influencing medication compliance in inpatient treatment of psychotic disorders." Psychopharmacology 187: 229-236.
Johnson, S., F. Nolan, et al. (2005). "Outcomes of crises before and after introduction of a crisis resolution team." British Journal of Psychiatry 187: 68-75.
Jones, J., L. Gorkin, et al. (1995). "Discontinuation of and changes in treatment after start of new course of antihypertensive drugs: a study of the United Kingdom population." BMJ 311: 293-295.
Kampman, O. and K. Lehtinen (1999). "Compliance in psychoses." Acta Psychiatrica Scandinavica 100: 167-175.
Kampman, O., K. Lehtinen, et al. (2001). "The reliability of compliance assessments performed by doctors and patients during neuroleptic treatment: a comparison of compliance ratings." Acta Psychiatrica Scandinavica 104: 299-304.
Kane, J. (1996). "Schizophrenia." as cited in 'Pharmcotherapy of schizophrenia: Gaps in our knowledge, J. Kane. In: Schizophrenia Maj M, Sartorious N (eds.) 2nd edition (2002) Wiley:Chichester.
Karow, A., J. Czekalla, et al. (2007). "Association of subjective well-being, symptoms, and side effects with compliance after 12 months of treatment in schizophrenia." Journal of Clinical Pschiatry 68(1): 75-80.
Kikkert, M., A. Schene, et al. (2006). "Medication adherence in schizophrenia: Exploring patients', carers' and professionals' view." Schizophrenia Bulletin 32(4): 786-794.
King, D. and M. Knapp (2006). "Patterns of, and factors associated with, atypical and typical antipsychotic prescribing by general practitioners in the UK during the 1990s." Journal of Mental Health 15: 269-278.
Kirkevold, M. (1997). "Integrative nursing research - an important strategy to further the development of nursing science and practice." Journal of Advanced Nursing 25: 977-984.
Kish, L. (1965). Survey Sampling. London, Wiley & Sons. Knapp, M. (1996). The health economics of schizophrenia treatment. Handbook of Mental
Health Economics and Health Policy, Volume 1, Schizophrenia. M. Moscarelli, A. Rupp and N. Sartorius. Chichester, Jon Wiley & Sons.
Knapp, M. (1997). "Cost of schizophrenia." British Journal of Psychiatry 171: 509-518. Knapp, M., D. Chisholm, et al. (2002). "Comparing patterns and costs of schizophrenia care
in five European countries: The EPSILON study." Acta Psychiatrica Scandinavica 105(1): 42-54.
Knapp, M., J. Simon, et al. (2002). Economics of schizophrenia: A review. Schizophrenia. M. Maj and N. Sartorius. Chichester, John Wiley & Sons.
Kuipers, E. (1996). "The management of difficult to treat patients with schizophrenia, using non-drug therapies." British Journal of Psychiatry 169 (suppl. 31): 41-51.
Lacro, J., L. Dunn, et al. (2002). "Prevalence of and risk factors for medication nonadherence in patients with schizophrenia: a comprehensive review of recent literature." Journal of Clinical Psychiatry 63: 892-909.
Lamb, R. and D. Lamb (1990). "Factors contributing to homelessness among the chronically and severely mentally ill." Hospital and Community Psychiatry 41: 301-305.
Layard, R., D. Clark, et al. (2007). "Cost-benefit analysis of psychological therapy." National Institute Economic Review No. 202: 90-98.
Lecomte, T., A. Spidel, et al. (2008). "Predictors and profiles of treatment non-adherence and engagement in services problems in early psychosis." Schizophrenia Research 102: 295-302.
218
Lewis, G., A. Pelosi, et al. (1992). "Measuring psychiatric disorder in the community: The development of a standardised assessment for use by lay interviewers." Psychological Medicine 22: 465-486.
Ley, P. and S. Llewellyn (1994). Improving patients' understanding, recall, satisfaction and compliance. Health Psychology: Process and Applications. A. Broom and S. Llewellyn. London, Nelson Thornes Ltd
Lin, E., M. Korff, et al. (1995). "The role of the primary care pysician in patients' adherence to antidepressant therapy." Med Care 33: 67-74.
Little, R. and D. Rubin (1987). Statistical Analysis with Missing Data. New York, John Wiley & Sons.
Löffler, W., R. Killian, et al. (2003). "Schizophrenic patients' subjective reasons for compliance and noncompliance with neuroleptic treatment." Pharmacopsychiatry 36: 105-112.
Loh, A., R. Leonhart, et al. (2007). "The impact of patient participation on adherence and clinical outcomes in primary care of depression." Patient Education and Counseling 65(1): 69-78.
Loosbrock, D., Z. Zhao, et al. (2003). "Antipsychotic medication use patterns and associated costs of care for individuals with schizophrenia." Journal of Mental Health Policy and Economics 6: 67-75.
Lukoff, D., R. Liberman, et al. (1986). "Symptoms monitoring in the rehavilitation of schizophrenic patients." Schizophrenia Bulletin 12: 578-602.
MacGillivray, S., B. Arroll, et al. (2003). "Efficacy and tolerability of selective serotnin reuptake inhibitors compared with tricyclic antidepressants in depression treated in primary care: systematic review and meta-analysis." BMJ 326: 1014-1019.
Maddala, G. (2001). Introduction to Econometrics. Chishester, John Wiley & Sons Ltd. Mangalore, R. and M. Knapp (2007). "Cost of schizophrenia in England." Journal of Mental
Health Policy and Economics 10(1): 23-41. Manning, W. G. and J. Mullahy (2001). "Estimating log models: to transform or not to
transform?" Journal of Health Economics 20(4): 461-494. Marland, G. and K. Cash (2005). "Medicine taking decisions: schizophrenia in comparison to
asthma and epilepsy." Journal of Psychiatric and Mental Health Nursing 12: 163-172. Marwaha, S., S. Johnson, et al. (2007). "Rates and correlates of employment in people with
schizophrenia in the UK, France and Germany." Br J Psychiatry 191: 30-37. McCann, T., G. Boardman, et al. (2008). "Risk profiles for non-adherence to antipsychotic
medications." Journal of Psychiatric and Mental Health Nursing 15: 622-629. McCrone, P., S. Johnson, et al. (2009). "Impact of a crisis resolution team on service costs in
the UK." Psychiatric Bulletin 33(1): 17-19. Meltzer, H. (1993). Surveys of Psychiatric Morbidity, Institutions Sample, 1994. OPCS.
London, Office of Population Census and Surveys. Meltzer, H., B. Gill, et al. (1995). The prevalence of psychiatric morbidity among adults
living in private households. OPCS Survey of Psychiatric Morbidity in Great Britain. Report 1. London, HMSO.
Meltzer, H., B. Gill, et al. (1996). The prevalence of psychiatric morbidity among adults living in institutions. OPCS Surveys of Psychiatric Morbidity in Great Britain. Report 4. London, HMSO.
Meyer, B. (1995). "Natural and quasi-experiments in economics." Journal of Business and Economic Statistics 13(2): 151-161.
Microsoft Corporation (2003). Microsoft Office Excel, Microsoft Corporation. Mitchell, A. (2006). "Depressed patients and treatment adherence." Lancet 367(9528): 2041-
2043.
219
Mitchell, A. (2007). "Adherence behaviour with psychotropic medication is a form of self-medication." Medical Hypotheses 68: 12-21.
Mojtabai, R., J. Lavelle, et al. (2002). "Gaps in use of antipsychotics after discharge by first-admission patients with schizophrenia, 1989 to 1996." Psychiatric Services 53: 337-339.
Morisky, D., L. Green, et al. (1986). "Concurrent and predictive validity of a self-reported measure of medication adherence." Medical Care 24(1): 67-74.
Mullahy, J. (1998). "Much ado about two: reconsidering retransformation and the two-part model in health economics." Journal of Health Economics 17: 247-281.
Murray, C. and A. Lopez (1996). Alternative visions of the future: Projecting mortality and disability, 1990-2020. Harvard, Harvard University Press.
Myers, L. and K. Midence (1998). Concepts and issues in adherence. Adherence to Treatment in Medical Conditions. L. Myers and K. Midence. London, Gordon and Breach.
National Centre for Social Research (2002). Ethnic Differences in the Contest and Experience of Psychiatric Illness: A qualitative study. W. O'Connor and J. Nazroo. London, The Stationary Office.
National Institute for Mental Health in England (2003). Inside Outside - Improving mental health services for Black and minority ethnic communities in England. Leeds, National Institute for Mental Health in England.
Nazroo, J. (1997). Ethnicity and Mental Health: Fourth national survey of ethnic minorities. London, Policy Studies Institute.
Nazroo, J. (1999). Ethnicity and Mental Health. London, Policy Studies Institute. Nemeroff, C. (2003). "Improving antidepressant adherence." Journal of Clinical Psychiatry 64
(Suppl 18): 25-30. Netten, A. and L. Curtis (2002). Unit Costs of Health and Social Care 2002. Canterbury,
Personal Social Services Research Unit, University of Kent. Netten, A., T. Rees, et al. (2001). Unit Costs of Health & Social Care - 2001. Canterbury,
Person Social Services Research Unit. NICE (2002). Guidance on the use of newer (atypical) antipsychotic drugs for the treatment of
schizophrenia. London, National Institute for Clinical Excellence. Technology appraisals TA43.
NICE (2006). Bipolar disorder - The management of bipolar disorder in adults, children and adolescents, in primary and secondary care. National Clinical Practice Guideline Number 38. London, National Insititute for Health and Clinical Excellence.
NICE (2007). Depression: Management of depression in primary and secondary care. London, National Institute of Clinical Excellence. National Clinical Practice Guideline Number 23.
NICE (2009). Schizophrenia - Core interventions in the treatment and management of schizophrenia in adults in primary and secondary care. NICE clinical guideline 82. London, National Institute for Health and Clinical Excellence.
Nose, M., Barbui C, et al. (2003). "How often do patients with psychosis fail to adhere to threatment programmes? A systematic review." Psychological Medicine 33(7): 1149-1160.
O'Donnell, C., G. Donohue, et al. (2003). "Compliance therapy: a randomised controlled trial in schizophrenia." BMJ 327: 834-837.
Oehl, M., M. Hummer, et al. (2000). "Compliance with antipsychotic treatment." Acta Psychiatrica Scandinavica 102(Suppl. 407): 83-86.
Office of National Statistics. (2001). "Annual survey of hours and earnings." Retrieved 10th July 2008, from
Office of National Statistics. (2008). "Retail Prices Index: annual index numbers of retail prices 1948-2007." Retrieved 27 March 2008, from http://www.statistics.gov.uk/StatBase/tsdataset.asp?vlnk=7172&More=N&All=Y.
Olfson, M., S. Marcus, et al. (2006). "Continuity of antidepressant treatment for adults with depression in the United States." American Journal of Psychiatry 163: 101-108.
Olfson, M., D. Mechanic, et al. (2000). "Predicting medication noncompliance after hospital discharge among patients with schizophrenia." Psychiatric Services 51(2): 216-222.
Osterberg, L. and T. Blaschke (2005). "Adherence to medication." New England Journal of Medicine 353: 487-497.
Owen, R., E. Fischer, et al. (1996). "Medication non-compliance and substance abuse among patients with schizophrenia." Psychiatric Services 47: 853-858.
Palmer, C., D. Revicki, et al. (1998). "A cost-effectiveness clinical decision analysis model for schizophrenia." American Journal of Managed Care 4: 345-355.
Pampallona, S., P. Bollini, et al. (2002). "Patient adherence in the treatment of depression." British Journal of Psychiatry 180: 104-109.
Pan, P. and D. Tantam (1989). "Clinical characteristics, health beliefs and compliance with maintenance treatment: A comparison between regular and irregular attenders at a depot clinic." Acta Psychiatrica Scandinavica 79: 564-570.
Patel, A. (2006). Issues in multi-national health economic evaluation. PhD thesis. Institute of Psychiatry. London, King's College London, University of London.
Pederson, L. and B. Leese (1997). "What will a primary care led NHS mean for GP workload? The problem of the lack of an evidence base." BMJ 317: 1337-1341.
Peterson, A., L. Takiya, et al. (2003). "Meta-analysis of trials of interventions to improve medication adherence." American Journal of Health-Syst Pharmacy 60(7): 657-665.
Pinikahana (2005). Determinants fo medication compliance in schizophrenia. Progress in Schizophrenia Research. J. Pletson. Hauppauge, New York, Nova Science Publishers, Inc.: 131-148.
Plackett, R. (1983). "Karl Pearson and the Chi-Squared Test." International Statistical Review 51(1): 59-72.
Pound, P., N. Britten, et al. (2005). "Resisting medicines: A synthesis of qualitative studies of medicine taking." Social Science and Medicine 61: 133-155.
Pull, C. (2002). Diagnosis of Schizophrenia: A review. Schizophrenia. M. Maj and N. Sartorius. Chichester, John Wiley & Sons.
Puschner, B., A. Born, et al. (2006). "Adherence to medication and quality of life in people with schizophrenia." Journal of Nervous and Mental Disease 194(10): 746-752.
Radomsky, E., G. Haas, et al. (1999). "Suicidal behavior in patients with schizophrenia and other psychotic disorders." American Journal of Psychiatry 156: 1590-1595.
Rittmannsberger, H., T. Pachinger, et al. (2004). "Medication adherence among psychotic patients before admission to inpatient treatment." Psychiatric Services 55: 174-179.
Robertson, D., M. Woerner, et al. (2002). "Predictors of medication discontinuation by patients with first-episode schizophrenia and schizoaffective disorder." Schizophrenia Research 57: 209-219.
Robinson, D., M. Woerner, et al. (2002). "Predictors of medication discontinuation by patients with first-episode schizophrenia and schizoaffective disorder." Schizophrenia Research 57: 209-219.
Rogers, A., J. Day, et al. (1998). "The meaning and management of neuroleptic medicine: a study of patients with a diagnosis of schizophrenia." Social Science and Medicine 47(9): 1313-1323.
Rosa, M., M. Marcolin, et al. (2005). "Evaluation of the factors interfering with drug treatment compliance among Brazilian patients with schizophrenia." Rev Bras Psiquiatr 27(3): 178-184.
Rosa, M., M. Marcolin, et al. (2005). "Evaluation of the factors interfering with drug treatment compliance among Brazilian patients with schizophrenia." Revista Brasileira Psiquiatria 27(3): 178-184.
Rose, N. (2007). Psychopharmaceuticals in Europe. Mental Health Policy and Practice Across Europe. M. Knapp, D. McDaid, E. Mossialos and G. Thornicroft. Maidenhead, Open University Press: 155.
Rosenstock, I. (1966). "Why people use health services." Millbank Memorial Fund Quarterly 44: 94-127.
Royal Mail. (2009). "Postcode Address File." Retrieved 21 August 2009, from http://www.royalmail.com/portal/rm/jump2?mediaId=400085&catId=400084.
Royston, P. (2004). "Multiple imputation of missing values." Stata Journal 4(3): 227-241. Royston, P. (2005). "Multiple imputation of missing values: update." Stata Journal 5(2): 188-
201. Royston, P. (2005b). "Multiple imputation of missing values: Update of ice." Stata Journal
5(4): 527-536. Rubin, D. (1987). Multiple Imputation for Nonresponse in Surveys. New York, Wiley. Rubin, D. (1996). "Multiple imputation after 18+ years." Journal of the American Statistical
Association 91(434): 473-489. Rubin, D. and N. Schenker (1986). "Multiple imputation for interval estimation from simple
random samples with ignorable nonresponse." Journal of the American Statistical Association 81: 366-374.
Ruggeri, M., A. Lasalvia, et al. (2003). "Satisfaction with mental health services among people with schizophrenia in five European sites: results from the EPSILON Study." Schizophrenia Bulletin 29(2): 229-245.
Rummel-Kluge, C., T. Schuster, et al. (2008). "Partial compliance with antipsychotic medication is common in patients with schizophrenia." Australian and New Zealand Journal of Psychiatry 42(5): 382-388.
Ruscher, S., R. de Wit, et al. (1997). "Psychiatric patients' attitudes about medication and factors affecting noncompliance." Psychiatric Services 48(1): 82-85.
Salvador, C., J. Haro, et al. (1999). "Service utilization and costs of first-onset schizophrenia in two widely differing health service areas in north-east Spain." Acta Psychiatrica Scandinavica 100(5): 335-343.
Sanderson, K. and G. Andrews (2006). "Common mental disorders in the workforce: recent findings from descriptive and social epidemiology." Canadian Journal of Psychiatry 51(2): 63-75.
Sartorius, N., W. Fleischhacker, et al. (2002). "The usefullness of and use of second generation antipsychotic medications: review of evidence and recommendations by a Task Force of the World Psychiatric Association." Current Opinion in Psychiatry 15(Suppl 1): S1-S51.
Sartorius, N., W. Fleischhacker, et al. (2003). "The usefulness of and use of second-generation antipsychotic medications: An update." Current Opinion in Psychiatry 16(Suppl. 1): S1-S44.
Schafer, J. (1997). Analysis of Incomplete Multivariate Data. London, Chapman & Hall. Scheffer, J. (2002). "Dealing with missing data." Res. Lett. Inf. Math. Sci. 3: 153-160. Shalansky, S. (2004). "Self-reported Morisky score for identifying nonadherence with
cardiovascular medications." The Annals of Pharmacotherapy 38: 1363-1368.
Sheehan, D., M. Eaddy, et al. (2005). "Differences in total medical costs across the SSRIs for the treatment of depression and anxiety." The American Journal of Managed Care 11(12, Sup): S354-S361.
Singleton, N., R. Bumpstead, et al. (2001). Psychiatric Morbidity Among Adults Living in Private Households, 2000. London, Social Survey Division of the Office of National Statistics.
Singleton, N., H. Meltzer, et al. (1998). Psychiatric Morbidity Among Prisoners. London, HMSO.
STATA 10.1 (2009). STATA. College Station, Texas, StataCorp. STATA (2008). STATA. College Station, Texas, StataCorp. StataCorp (2007). Stata Statistical Software: Release 10. College Station, TX, StataCorp LP. Sullivan, G., C. Jackson, et al. (1996). "Characteristics and service use of seriously mentally
ill persons living in rural areas." Psychiatric Services 47(1): 57-61. Svarstad, B., T. Shireman, et al. (2001). "Using drug claims data to assess the relationship of
medication adherence with hospitalization and costs." Psychiatric Services 52: 805-811.
Swartz, M., J. Swanson, et al. (2001). "Effects of involuntary outpatient commitment and depot antipsychotics on treatment adherence in persons with severe mental illness." Journal of Nervous and Mental Disease
189(9): 583-592. Terza, J., A. Basu, et al. (2008). "Two-stage residual inclusion estimation: Addressing
endogeneity in health econometric modeling." Journal of Health Economics 27: 531-543.
The Information Centre for Health and Social Care. (2009). "Prescriptions dispensed in the community, statistics for 1998 to 2008: England." Retrieved 1 September, 2009, from http://www.ic.nhs.uk/webfiles/publications/presdisp98-08/Prescriptions_Dispensed_in_the_Community_1998_2008_Tables_a.xls.
The Sainsbury Centre for Mental Health (2002). Breaking the Cirles of Fear - A review of the relationship between mental health services and African and Caribbean communities. London, The Sainsbury Centre for Mental Health.
Thieda, P., S. Beard, et al. (2003). "An economic review of compliance with medication therapy in the treatment of schizophrenia." Psychiatric Services 54: 508-516.
Thompson, K., J. Kulkarni, et al. (2000). "Reliability and validity of a new Medication Adherence Rating Scale (MARS) for the psychoses." Schizophrenia Research 42: 241-247.
Trauer, T. and T. Sacks (1998). "Medication compliance: A comparison of the views of severely mentally ill clients in the community, their doctors and their case managers." Journal of Mental Health 7(6): 621-629.
Tukey, J. (1949). "One degree of freedom for non-additivity." Biometrics 5: 232-242. Urquhart, J. (1997). "The electronic medication event monitor: lessons for pharmacotherapy."
Clinical Pharmacokinetics 32: 345-356. Usher, K. (2001). "Taking neuroleptic medicines as the treatment for schizophrenia: a
phenomenological study." Australian and New Zealand Journal of Mental Health Nursing 19(3): 145-155.
Üstün, T. and N. Sartorius (1995). Mental Illness in General Health Care: an international study. Chichester, John Wiley & Sons on behalf of the World Health Organization.
Valenstein, M., L. Copeland, et al. (2002). "Pharmacy data identify poorly adherent patients with schizophrenia at increased risk for admission." Medical Care 40: 630-639.
Velligan, D., Y.-W. Lam, et al. (2006). "Defining and assessing adherence to oral antipsychotics: A review of the literature." Schizophrenia Bulletin 32: 724-742.
Velligan, D., M. Wang, et al. (2007). "Relationships among subjective and objective measures of adherence to oral antipsychotic medications." Psychiatric Services 58(9): 1187-1192.
Ventura, J., M. Green, et al. (1993). "Training and quality assurance with the Brief Psychiatric Rating Scale. The 'drift busters'." International Journal of Methods in Psychiatric Research 3(4): 221-244.
Venturini, F., J. Sung, et al. (1999). "Utilization patterns of antidepressant medications in a patient population served by a primary care medical group." J Managed Care Pharm 5: 243-249.
Verhoeven, W., F. Van der Heijden, et al. (2005). "Novel antipsychotics: Facts and fictions." Journal of Treatment Evaluation 2(4): 212-222.
Vickar, G., C. North, et al. (2009). "A randomized controlled trial of a private-sector inpatient- initiated psychoeducation program for schizophrenia." Psychiatric Services 60(1): 117-120.
Viller, F., F. Guillemin, et al. (1999). "Compliande to drug treatment of patients with rheumatoid arthritis: a 3 year longitudinal study." Journal of Rheumatology 26(10): 2114-2122.
von Knorring, L., A.-C. Akerblad, et al. (2006). "Cost of depression: effect of adherence and treatment response." European Psychiatry 21(6): 349-354.
Voruganti, L., L. Baker, et al. (2008). "New generation antipsychotic drugs and compliance behaviour." Current Opinion in Psychiatry 21: 133-139.
Ware, J. and C. Sherbourn (1992). "The MOS, 36 item Short-Form Health Survey (SF-36). I, Conceptual framework and item selection." Medical Care 30: 473-483.
Weiden, P. (2007). "Understanding and addressing adherence issues in schizophrenia: From theory to practice." Journal of Clinical Psychiatry 68 [Suppl 14]: 14-19.
Weiden, P., C. Kozma, et al. (2004). "Partial compliance and risk of rehopsitalization among California medicaid patients with schizophrenia." Psychiatric Services 55: 886-891.
Weiden, P. and A. Miller (2001). "Which side effects really matter? Screening for common and distressing side effects of antipsychotic medications." Journal of Psychiatric Practice 7: 41-47.
Weiden, P. and M. Olfson (1995). "Cost of relapse in schizophrenia." Schizophrenia Bulletin 21(3): 419-429.
Weiden, P., B. Rapkin, et al. (1994). "Rating of medication influences (ROMI) scale in schizophrenia." Schizophrenia Bulletin 20(2): 297-310.
Weiss, K., T. Smith, et al. (2002). "Predictors of risk of nonadherence in outpatients with schizophrenia and other psychotic disorders." Schizophrenia Bulletin 28(2): 341-349.
White, I. (2005). "Uses and limitations of randomization-based efficacy estimators." Statistical Methods in Medical Research 14: 327-347.
White, T., A. Vanderplas, et al. (2003). "Economic impact of patient adherence with antidepressant therapy within a managed care organization." Disease Management & Health Outcomes 11(12): 817-822.
WHO (1992). The ICD-10 Classification of Mental and Behavioural Disorders: Clinical descriptions and diagnostic guidelines. Geneva, World Health Organisation.
WHO. (2001). "The World Health Report 2001 - Mental Illness: new understanding, new hope - Schizophrenia." Retrieved 20 May 2004, from http://www.who.int/whr2001/2001/main/en/chapter2/002e3.htm.
WHO. (2004). "World Health Organisation - Mental Health." Retrieved 20 May 2004, from http://www.who.int/mental_health/management/schizophrenia/en/.
Wieck, A. and P. Haddad (2003). "Antipsychotic- induced hyperprolactinaemia in women: pathophysiology, severity and consequences. Selective literature review." Br J Psychiatry 182: 199-204.
Wilcoxon, F. (1945). "Individual comparisons by ranking methods." Biometrics 1: 80-83. Wing, R., S. Phelan, et al. (2002). "The role of adherence in mediating the relationship
between depression and health outcomes." Journal of Psychosomatic Research 53: 877-881.
Wooldridge, J. (2006). Introductory Econometrics: A Modern Approach. Mason, OH, Thomson-South Western.
Zhu, B., H. Ascher-Svanum, et al. (2008). "Costs of treating patients with schizophrenia who have illness-related crises events." BMC Psychiatry 8: 72.
Zygmunt, A., M. Olfson, et al. (2002). "Interventions to improve medication adherence in schizophrenia." American Journal of Psychiatry 159(10): 1653-1664.
225
APPENDIX APPENDIX 1: Results of literature search for empirical studies looking at factors associated
with non-adherence in schizophrenia APPENDIX 2: Patterns of, and factors associated with, atypical and typical antipsychotic
prescribing by general practitioners in the UK during the 1990s
226
APPENDIX 1
Results of literature search for empirical studies looking at factors associated with non-adherence in schizophrenia Author, date Country Sample
size Sample Adherence
assessment Study time period
Factors associated with non-adherence
Factors not associated with non-adherence
Swartz et al, 2001 US 258 Outpatients with psychosis
Self-reported, family, case-manager
1 year Involuntary outpatient commitment, African-American ethnicity, substance abuse, low GAF score
Age, urban v rural, sex, marital status, income, education, social support, homelessness, victim of crime, Brief Symptom Inventory score, insight into illness, prior psychotic hospitalisation
Trauer et al, 2000 Australia 218 Outpatients with psychosis
Self-report, physician, case-manager
1 month Insight into illness
Weiss et al, 2002 US 162 Ambulatory with psychosis
Therapist Time to non-adh. or end of study
Low GAF score, substance abuse, poor working alliance with therapist
Demographic factors, illness history
Ruscher et al, 1997 Canada 148 Inpatients and outpatients with psychosis
Self-report 6 months High educational attainment, currently an inpatient
Class of antipsychotic, sex, age, marital status, diagnosis, number of previous admissions, length of hospitalisation
Rittmannsberger et al, 2004
Austria 95 Outpatients with psychosis
Self-report 1 month Low GAF score, irregular contact with treating psychiatrist, increased age
GAF – Global Assessment of Functioning (measures social, psychological and occupational functioning
227
Author, date Country Sample
size Sample Adherence
assessment Study time period
Factors associated with non-adherence
Factors not associated with non-adherence
Grunebaum et al, 2001
US 74 Residents of supported housing with psychosis
Self-report 1 month Lack of medical supervision, negative view of psychiatric medicines, low GAF score
Class of antipsychotic, medication regime complexity
Kampman, 2002 Finland 59 Inpatient and outpatient with first-onset psychosis
Self-report 3 months Side effects, male, lack of social acitivities, low PANSS positive symptoms subscale score, high PANSS total score, younger age
Ziguras et al, 2001 Australia 168 Outpatients with psychosis
Case-managers’ report
Poor cooperation with staff, poor insight, problems with impulse control, less ability to manage finances, case-manager from different ethnic background
Age, sex, receipt of depot medication, size of social network, drug or alcohol abuse, medication dose, thought disorder
Coldham et al, 2002 Canada 200 Outpatients with first-episode psychosis
Medical records (reviewed by study first author)
1 year Positive symptoms, substance abuse, low insight, younger age, younger age at onset of illness, lack of family support
Hudson et al, 2004 US 153 Inpatients and outpatients with schizophrenia
Self-report and medical records
30 days Lower level of education, substance abuse, high PANSS total score, barriers to taking medication (e.g. stigma), adverse drug reactions, forgetfulness, lack of social support
Owen et al, 1996 US 135 Inpatients with schizophrenia
Self-report with input from family and health professionals
30 days Substance abuse Living arrangements
PANSS – Positive and Negative Syndrome Scale (measures schizophrenia symptom severity) SF-36 – Short Form 36 (measures health state)
228
Author, date Country Sample
size Sample Adherence
assessment Study time period
Factors associated with non-adherence
Factors not associated with non-adherence
Holzinger et al, 2002 Germany 77 Inpatients or day hospital patients with schizophrenia
Self-report, family
1 month Quality of helping alliance, delusion of grandiosity, attitude towards antipsychotic drugs
Perceptions of mental illness and prognosis
Rettenbacher et al, 2004
Austria 61 Schizophrenia outpatients with recent inpatient stay
Self-report and plasma levels of antipsychotic
3 months Positive effect of drugs on illness, psychiatrist’s inquery into drug taking, psychological side effects
PANSS subscales
Weiden et al, 2004 US 239 Outpatients with schizophrenia
Self-report Week of missed medication (if ever missed)
obesity Sex, class of antipsychotic, satisfaction with psychiatrist, length of time on medication, general well-being, attitude to medication
Valenstein et al, 2004 US 63,214 Inpatients and outpatients with schizophrenia
Medication possession ratio
1 year African-American ethnicity, younger age, low dose
Class of antipsychotic
Robinson et al, 2002 US 112 Inpatients and outpatients with schizophrenia
Self-report, family, health professionals
1 year Poor premorbid cognitive ability
Demographics characteristics, premorbid social functioning, time to start of treatment, diagnosis, illness severity, presence of motor side effects, family attitudes
Hunt et al, 2002 Australia 99 Schizophrenia patients requiring acute or crisis care
Kamali et al, 2001 Ireland 87 Inpatients with schizophrenia suffering acute relapse
Self-report, family, mental health professionals
1 month Substance abuse, negative subjective response to medication, lack of insight
Age, sex duration of illness, dosage of medication
Novak-Grubic et al, 2002
Slovenia 56 Outpatients with schizophrenia after first episode
Self-report, family
1 year Poor insight, positive symptoms at admission, diagnosis
Socio-demographics characteristics, severity of extra-pyramidal symptoms, class of antipsychotic, attitude towards hospitalisation, length of hospital stay
Diaz et al, 2004 US 50 Individuals with schizophrenia in a community mental health centre
Medication Event Monitoring System
3 months Male, dose frequency Class of antipsychotic, Barnes Akathisia Scale
Liraud et al, 2001 France 45 Inpatients with schizophrenia
Self-report, medical records
1 year Sensation-seeking Impulsivity, experience-seeking
Donohue et al, 2001 Ireland 32 Inpatients with schizophrenia
Clinical rating following interview
3 months Attitude to medication, PANSS activation and composite subscales, poor memory
Age, sex, time since diagnosis, level of education, living arrangements, schizophrenia subtype, substance abuse
Lambert et al, 2004 Germany 213 Inpatients with schizophrenia prescribed first-generation (‘typicals’) antipsychotics
Self-report, medical records
1 month Negative attitude towards antipsychotics, side effects
Age, sex, level of education, age at onset of illness, length of illness, medication dosage, number of prior admissions, psychopathology, duration of untreated psychosis
McCann et al, 2008 Australia 81 Outpatients with schizophrenia
Factors Influencing Neuroleptic Medication Taking Scale based on patient interview
Younger age, side effects, poor access to psychiatrists
Living arrangements, level of insight, stigma experienced, alcohol abuse, social support, access to case-manager and GP
Cooper et al, 2007 Canada 4,495 Outpatients with schizophrenia
Medical records 1 year Low intensity treatment, initiated on olanzapnie, prescribed first generation (‘typical’) antipsychotics, low comorbidity index, substance abuse, younger age, not on welfare or income support
Karow et al, 2007 Germany 2,414 Inpatients and outpatients with schizophrenia
Self-report , physician
1 year Severity of positive symptoms, lack of improvement in positive symptoms
Negative, depressive and cognitive symptoms, improvement in negative, depressive and cognitive symptoms, improvement in side effects
de Haan et al, 2007 The Netherlands
119 Inpatients and outpatients with schizophrenia
Self-report, health professionals
5 years Hostility and uncooperativeness, involuntary admission
234 Inpatients and outpatients with schizophrenia (first episode)
Self-report, physician
1 year Substance abuse, comorbid depression, Black ethnicity, higher cognitive performance
Duration of illness, side effects
PANSS – Positive and Negative Syndrome Scale (measures schizophrenia symptom severity) ROMI – Rating of Medication Influences Scale (measures reasons patients give for taking or not taking their medication)
232
Author, date Country Sample
size Sample Adherence
assessment Study time period
Factors associated with non-adherence
Factors not associated with non-adherence
Klingberg et al, 2008 Germany 108 Inpatients and outpatients with schizophrenia
Physician 1 year Lack of trust in medication, lack of insight
Problem solving ability, socio-demographic factors, comorbidity, age at onset of illness, PANSS score, class of antipsychotic, number or severity of side effects, social contact
Kamali et al, 2006 Ireland 100 Inpatient with psychosis (first episode)
Self-report 6 months Positive symptom score, drug and alcohol abuse, lack of insight
Age, sex, negative symptom score, voluntary versus involuntary admission
Janssen et al, 2006 Germany 670 Inpatients with psychosis Self-report, health professionals
Length of admission
Substance abuse, history of aggressive behaviour, involuntary admission, lower level of education, PANSS negative symptom score, PANSS paranoid/belligerence score
Household composition, employment status, side effects, class of antipsychotic
Perkins et al, 2006 US 254 Inpatients and outpatients with schizophrenia
Pill counts 2 years Low belief in need for treatment, low belief in benefit of medication, clinically-rated akathisia no weight gain, inpatient, low improvement in positive symptoms
Age, negative aspects of medication, social support, duration of illness, ethnicity, neurocognitive function, PANSS score improvement, marijuana use
PANSS – Positive and Negative Syndrome Scale (measures schizophrenia symptom severity) ROMI – Rating of Medication Influences Scale (measures reasons patients give for taking or not taking their medication)
233
Author, date Country Sample
size Sample Adherence
assessment Study time period
Factors associated with non-adherence
Factors not associated with non-adherence
Lecomte et al, 2008 Canada 147 Outpatients with schizophrenia
Self-report Cross-sectional
Positive symptoms, witnessed violence as a child, agreeableness
Neurosis, negative symptoms, insight, drug and alcohol abuse
Heinrichs et al 2008 Canada 147 Outpatient with schizophrenia
Medical Management Ability Assessment
Cross-sectional
Cognitive function
Mutsatsa et al, 2003 UK 101 Inpatients and outpatients with schizophrenia
Health professionals
12 weeks Insight, negative attitude towards medication
Drug and alcohol abuse, side effects, severity of illness
Jeste et al, 2003 US 110 Outpatients with schizophrenia
Medical Management Ability Assessment
Cross-sectional
Cognitive function Age, sex, level of education, living arrangements, symptom severity, attitude towards medication
Studies identified above: Ascher-Svanum H, Zhu B, Faries D, Landbloom R, Swartz M, Swanson J (2006). "Time to
discontinuation of atypical versus typical antipsychotics in the naturalistic treatment of schizophrenia." BMC Psychiatry 6(8).
Becker M, Young M, Ochshorn E, Diamond R (2007). "The relationship of antipsychotic medication class and adherence with treatment outcomes and costs for Florida Medicaid beneficiaries with schizophrenia." Administration and Policy in Mental Health & Mental Health Services Research 34: 307-314.
Coldham E, Addington J, Addington D (2002). "Medication non-adherence of individuals with a first episode of psychosis." Acta Psychiatrica Scandinavica 106: 286-290.
Cooper D, Moisan J, Gregoire J-P (2007). "Adherence to atypical antipsychotic treatment among newly treated patients: A population-based study in schizophrenia." Journal of Clinical Pschiatry 68(6): 818-825.
de Haan L, van Amelsvoort T, Dingemans P, Linszen D (2007). "Risk factors for medication non-adherence in patients with first episode schizophrenia and related disorders: A prospective five year follow-up." Pharmacopsychiatry 40: 264-268.
Diaz E, Neuse E, Sullivan M, Pearsall H, Woods S (2004). "Adherence to conventional and atypical antipsychotics after hospital discharge." Journal of Clinical Psychiatry 65: 354-360.
Donohue G, Owens N, O'Donnell C, Burke T, Moore L, Tobin A, O'Callaghan E (2001). "Predictors of compliance with neuroleptic medication among inpatients with schizophrenia: a discriminant function analysis." European Psychiatry 16: 293-298.
Grunebaum M, Weiden P, Olfson M (2001). "Medication supervision and adherence of persons with psychotic disorders in residential treatment settings: a pilot study." Journal of Clinical Psychiatry 62(5): 394-399.
Heinrichs R, Goldberg J, Miles A, McDermid Vaz S (2008). "Predictors of medication competence in schizophrenia patients." Psychiatry Research 157: 47-52.
Holzinger A, Löffler W, Müller P, Priebe S, Angermeyer M (2002). "Subjective illness theory and antipsychotic medication compliance by patients with schizophrenia." Journal of Nervous and Mental Disease 190: 597-603.
Hudson T, Owen R, Thrush C, Han X, Pyne J, Thapa P, Sullivan G (2004). "A pilot study of barriers to medication adherence in schizophrenia." Journal of Clinical Psychiatry 65: 211-216.
Hunt G, Bergen J, Bashir M (2002). "Medication compliance and comorbid substance abuse in schizophrenia: Impact on community suurvival 4 years after a relapse." Schizophrenia Research 54: 253-264.
Janssen B, Gaebel W, Haerter M, Komaharadi F, Lindel B, Weinmann S (2006). "Evaluation of factors influencing medication compliance in inpatient treatment of psychotic disorders." Psychopharmacology 187: 229-236.
Jeste S, Patterson T, Palmer B, Dolder C, Goldman S, Jeste D (2003). "Cognitive predictors of medication adherence among middle-aged and older outpatients with schizophrenia." Schizophrenia Research 63: 49-58.
Kamali M, Kelly B, Clarke M, Browne S, Gervin M, Kinsella A, Lane A, Larkin C, O'Callaghan E (2006). "A prospective evaluation of adherence to medication in first episode schizophrenia." European Psychiatry 21: 29-33.
Kamali M, Kelly L, Gervin M, Browne S, Larkin C, O'Callaghan E (2001). "Insight and comorbid substance misuse and medication compliance among patients with schizophrenia." Psychiatric Services 52(2): 161-166.
235
Kampman O, Laippala P, Vaananen J, Koivisto E, Kiviniemi P, Kilkku N, Lehtinen K (2002). "Indicators of medication compliance in first-episode psychosis." Psychiatry Research 110: 39-48.
Karow A, Czekalla J, Dittmann R, Schacht A, Wagner T, Lambert M, Schimmelmann B, Naber D (2007). "Association of subjective well-being, symptoms, and side effects with compliance after 12 months of treatment in schizophrenia." Journal of Clinical Psychiatry 68(1): 75-80.
Klingberg S, Schneider S, Wittorf A, Buchkremer G, Wiedemann G (2008). "Collaboration in outpatient antipsychotic drug treatment: Analysis of potentially influencing factors." Psychiatry Research 161: 225-234.
Lambert M, Conus P, Eide P, Mass R, Karow A, Moritz S, Golks D, Naber D (2004). "Impact of present and past antipsychotic side effects on attitude toward typical antipsychotic treatment and adherence." European Psychiatry 19(7): 415-422.
Lecomte T, Spidel A, Leclerc C, MacEwan G, Greaves C, Bentall R (2008). "Predictors and profiles of treatment non-adherence and engagement in services problems in early psychosis." Schizophrenia Research 102: 295-302.
Liraud F, Verdoux H (2001). "Association between temperamental characteristics and medication adherence in subjects presenting with psychotic or mood disorders." Psychiatry Research 102: 91-95.
McCann T, Boardman G, Clark E, Lu S (2008). "Risk profiles for non-adherence to antipsychotic medications." Journal of Psychiatric and Mental Health Nursing 15: 622-629.
Mutsatsa S, Joyce E, Hutton S, Webb E, Gibbins H, Paul S, Barnes T (2003). "Clinical correlates of early medication adherence: West London first episode schizophrenia study." Acta Psychiatrica Scandinavica 108: 439-446.
Novak-Grubic V, Tavcar R (1999). "Treatment compliance in first-episode schizophrenia." Psychiatric Services 50: 970-971.
Olfson M, Mechanic D, Hansell S, Boyer C, Walkup J, Weiden P (2000). "Predicting medication noncompliance after hospital discharge among patients with schizophrenia." Psychiatric Services 51(2): 216-222.
Owen R, Fischer E, Booth B, Cuffel B (1996). "Medication non-compliance and substance abuse among patients with schizophrenia." Psychiatric Services 47: 853-858.
Perkins D, Gu H, Weiden P, McEvoy J, Hamer R, Lieberman J (2008). "Predictors of treatment discontinuation and medication nonadherence in patients recovering from a first episode of schizophrenia, schizophreniform disorder, or schizoaffective disorder: A randomized, double-blind, flexible-dose, multicenter study." Journal of Clinical Psychiatry 69(1): 106-113.
Perkins D, Johnson J, Hamer R, Zipursky R, Keefe R, Centorrhino F, Green A, Glick I, Kahn R, Sharma T, Tohen M, McEvoy J, Weiden P, Liegerman J, HGDH_Research_Group (2006). "Predictors of antipsychotic medication adherence in patients recovering from a first psychotic episode." Schizophrenia Research 83: 53-63.
Ramirez Garcia J, Chang C, Young J, Lopez S, Jenkins J (2006). "Family support predicts psychiatric medication usage among Mexican American individuals with schizophrenia." Social Psychiatry and Psychiatric Epidemiology 41: 624-631.
Rettenbacher M, Hofer A, Eder U, Hummer M, Kemmler G, Weiss E, Fleischhacker W (2004). "Compliance in schizophrenia: Psychopathology, side effects, and patients' attitudes towards the illness and medication." Journal of Clinical Psychiatry 65: 1211-1218.
236
Rittmannsberger H, Pachinger T, Keppelmüller P, Wancata J (2004). "Medication adherence among psychotic patients before admission to inpatient treatment." Psychiatric Services 55: 174-179.
Robinson D, Woerner M, Alvir J, Bilder R, Hinrichsen G, Lieberman J (2002). "Predictors of medication discontinuation by patients with first-episode schizophrenia and schizoaffective disorder." Schizophrenia Research 57: 209-219.
Ruscher S, de Wit R, Mazmanian D (1997). "Psychiatric patients' attitudes about medication and factors affecting noncompliance." Psychiatric Services 48(1): 82-85.
Swartz M, Swanson J, Wagner R, Burns B, Hiday V (2001). "Effects of involuntary outpatient commitment and depot antipsychotics on treatment adherence in persons with severe mental illness." Journal of Nervous and Mental Disease 189(9): 583-592.
Trauer T, Sacks T (2000). "The relationship between insight and medication adherence in severely mentaly ill clients treated in the community." Acta Psychiatrica Scandinavica 102: 211-216.
Valenstein M, Blow F, Copeland L, McCarthy J, Zeber J, Gillon L, Bingham C, Stavenger T (2004). "Poor antipsychotic adherence among patients with schizophrenia: medication and patient factors." Schizophrenia Bulletin 30(2): 255-264.
Valenstein M, Ganoczy D, McCarthy J, Kim H, Lee T, Blow F (2006). "Antipsychotic adherence over time among patients receiving treatment for schizophrenia: A retrospective review." Journal of Clinical Psychiatry 67: 1542-1550.
Weiden P, Mackell J, McDonnell D (2004). "Obesity as a risk factor for antipsychotic noncompliance." Schizophrenia Research 66: 51-57.
Weiss K, Smith T, Hull J, Piper A, Huppert J (2002). "Predictors of risk of nonadherence in outpatients with schizophrenia and other psychotic disorders." Schizophrenia Bulletin 28(2): 341-349.
Yen C-F, Chen C-S, Ko C-H, Yeh M-L, Yang S-J, Yen J-Y, Huang C-F, Wu C-C (2005). "Relationships between insight and medication adherence in outpatients with schizophrenia and bipolar disorder: Prospective study." Psychiatry and Clinical Neurosciences 59: 403-409.
Ziguras S, Klimidis S, Lambert T, Jackson A (2001). "Determinants of anti-psychotic medication compliance in a multicultural population." Community Mental Health Journal 37(3): 273-283.
237
APPENDIX 2
Patterns of, and factors associated with, atypical and typical antipsychotic prescribing by general practitioners in the UK during the 1990s
Introduction
The development of atypical (or second generation) antipsychotics has offered people with
schizophrenia a potentially more effective and less damaging set of treatment options.
Atypical antipsychotics are more expensive than the earlier class of antipsychotics (which are
no longer patented), but are argued to be more effective in alleviating symptoms of the illness
and to be associated with fewer side-effects (Leucht et al. 1999; Sartorius et al. 2002;
Sartorius et al. 2003). By reducing side-effects, for example, atypical antipsychotics may
reduce non-adherence to medication, which significantly increases the probability of relapse
into an acute schizophrenic episode (Weiden and Olfson 1995), and in turn pushes up
treatment and support costs (Almond et al. 2004). Thus, support for prescribing of atypical
antipsychotics, relative to typical antipsychotics, in treating patients with schizophrenia, has
also been made on cost-effectiveness grounds (Davis et al. 2003; Hudson et al. 2003),
although the evidence is not unequivocal (Basu 2004; Duggan 2005).
Data from IMS indicate that sales of antipsychotics in the United Kingdom increased ten-fold
between 1996 and 2002, a trend matched in a number of other European countries (IMS
Health 2003). The introduction and uptake of atypical antispychotics has been the primary
reason. A number of local studies of prescribing patterns in primary care in the UK show
rapid increases in the use of atypical antipsychotics. For example, between 1994 and 1997, a
28% growth in prescriptions in Scotland was observed (Stark et al. 2000); between 1996/7
and 2000/1, there was a six-fold increase in the volume of atypical antipsychotics prescribed
in the West Midlands (Ashcroft et al. 2002); and for a similar period there was a twenty-fold
rise in expenditure on atypicals in Greater Manchester (Hayhurst et al. 2003). In July 2002,
the National Institute for Clinical Excellence (NICE) published guidance favouring the use of
atypical antipsychotics as a first line treatment for patients with schizophrenia (NICE 2002),
which may be expected to further boost growth (Walley 2004).
238
Overall, the percentage of mental health drugs prescribed by general practitioners in England
accounted for by antipsychotics has increased only slightly since 1998 to about 10%.
However, they represent more than 21% of spending on mental health drugs in primary care, a
proportion that has grown from approximately 12% in 1998 (source: Prescribing analysis and
cross tabulation data). The rise in spending is entirely due to switching from low price typical
antipsychotics to the more expensive atypical antipsychotics (despite inflation-adjusted prices
for the latter having dropped over time).
Using national data on primary care prescribing, Kaye et al (2003) calculated that
antipsychotic use increased from 10.5 people per 1000 population in 1991 to 12.2 per 1000 in
2000, with most of the increase – and indeed most of the use – to treat non-prescribing of
atypical antipsychotics in the treatment of schizophrenia. My analysis, like that by Kaye et al,
is based on the General Practice Research Database (GPRD). Importantly, the GPRD allows
us to follow people with schizophrenia and schizoaffective disorder over a number of years in
order to assess changes in the prescription of atypical antipsychotics over time and – a
particular focus of my work – to explore some of the individual characteristics associated with
these changes.
Methods
General Practice Research Database
The GPRD is a computerised database of anonymised general practice patient records that
commenced in 1987 and now contains over 30 million patient years of information. Currently,
the database collects information on approximately 3 million patients: approximately 4.7% of the
UK population. Data are provided by a cross-section of practices, across the UK. Information is
recorded by GPs on demographics, medical diagnosis, all prescriptions, referrals to hospitals,
hospital discharge reports where patients are referred to hospital for treatment, and treatment
outcomes (crudely measured) (Wood and Coulson 2001). The GPRD is used for academic and
policy-related research, and also by the United Kingdom Medicines and Healthcare products
Regulatory Agency, primarily for better understanding of drug safety issues brought to its
attention by GPs submitting adverse drug reaction reports. The quality and completeness of
239
these data for research have been confirmed by several validation studies (Walley and
Mantgani 1997).
As atypical antipsychotic medications were not prescribed in the UK before 1993, my study
used data from 1st January 1993 through to 31st December 1999. A legal dispute between the
data owners and the data vendors resulted in the rapid decline in the number of patients
available in the database. For this reason, data for 2000 and 2001 are excluded. I did not look
at later (post-2001) data because I chose to employ a panel design based on linking annual
GPRD datasets from one year to the next.
Schizophrenia and schizoaffective patients
My inclusion criteria required a patient to have received at least one prescription for an
antipsychotic medication, be enrolled in the General Practice Research Database for the entire
year and have been diagnosed with schizophrenia or schizoaffective disorder prior to the
beginning of that year. There were no other inclusion or exclusion criteria.
Read codes (now simply called the Clinical Terms in the UK) provide the diagnostic
classification used to identify patients with schizophrenia or schizoaffective disorder. The
Read codes were introduced in the UK in 1986 to generate computer summaries of patient
care in primary care. In the subsequent revision (Version 2), their structure was changed and
based upon the International Classification of Diseases (ICD)-9 and OPCS-4, the
Classification of Surgical Operations and Procedures. Schizophrenia disorders are identified
by Read codes E100-106, E10y, E10z or Eu20; schizoaffective disorder by Read codes E107
or Eu25.
My identification of users of antipsychotic drugs was similar to the method employed by
Kaye et al (2003). They too identified patients who had at least one prescription for an
antipsychotic during the year. There are, however, important differences. They did not limit
their analysis to schizophrenia and schizoaffective patients, and only used data from 270
general practices that had an uninterrupted record of data contribution to the GPRD.
240
Antipsychotic drugs
Medications are the most reliably recorded resource category in the GPRD given the separate
and detailed prescription records in the database. The drug name (generic and method of
administration), daily dose (mg, ml, etc.) and duration of therapy (days) of all prescriptions
made by the GP are recorded in the database. The atypical antipsychotic medications
observed in the dataset are: amisulpride, clozapine, olanzapine, quetiapine, remoxipride,
risperidone, sertindole, and zotepine. These drugs were not all marketed for the full period
under study here. The date of licensing for each of the drugs appears in Table 1. For
comparison, Kaye et al (2003) identified patients who received a medication listed as an
antipsychotic on the British National Formulary, but excluded from their analysis the use of
clozapine, benperidol, sertindole, amisulipride and quetiapine on the basis that each of these
drugs were prescribed to fewer than 1,000 patients during the study period.
Linking of annual datasets
I linked patients over time to allow panel analyses to be conducted (see below). Data for each
year from 1993 to 1999 were sorted, and then merged on the unique patient number. This
means that the number of observations per patient will vary, depending upon the number of
years in which they met the inclusion criteria.
Statistical analysis
By linking annual datasets I created a longitudinal (also called panel) dataset which then
allowed me to analyse changes over time. Longitudinal data designs of this kind are very
helpful because they allow for separate estimation of the effects of differences between
subjects, and of time-series or within-subject effects reflected in the changes within subjects
over time. Panel data regression techniques allow one to take advantage of these different
types of information. A panel logistic regression model was run in STATA (2001). A model
was fitted to the data to determine factors influencing the choice between typical and atypical
antipsychotics, with the dependent variable as positive if the patient received an atypical
antipsychotic and negative if they did not.
241
Table 1: Licensing period of atypical antipsychotic medications observed in the GPRD dataset Drug name Year licensed If withdrawn,
Year Comments
Amisulpride 1997 Clozapine 1995 Olanzapine 1996 Quetiapine 1997 Remoxipride 1986 1993 Withdrawn due to reports
of aplastic anaemia1 Risperidone 1993 Sertindole 1996 1998 Withdrawn due to
concerns about effects on the heart; Reinstated with restricted license in 2002 requiring strict monitoring and guidelines of use2
Zotepine 1998
1 Northern and Yorkshire Regional Drug and Therapeutics Centre. ‘The Use of Atypical Antipsychotics in the Management of Schizophrenia’ February 1998. Accessed on-line on 23 January 2006 at: http://www.nyrdtc.nhs.uk/docs/eva/atypical_antipsychotics.pdf 2 Norfolk and Waveney Mental Health Partnership NHS Trust Pharmacy Medicine Information. Accessed on-line on 23 January 2006 at: http://www.nmhct.nhs.uk/pharmacy/dsertind.htm
242
A random-effects model was employed because I assumed that while some omitted effects
may be constant over time but vary between cases (e.g. the confidence of the patient in
expressing a preference for atypical antipsychotics), others may be fixed between cases but
vary over time (e.g. the relative price of atypicals to typical antipsychotics). Also, the STATA
output includes a significance test of the proportion of the total variance in the data
contributed by the panel-level variance component. If this test returns a finding of
significance, this justifies the panel specification of the model which accounts for both the
variability within patients over time, and the variability between patients. Significance levels
at the 0.05 level or below were deemed statistically significant.
Results
Of patients with schizophrenia or schizoaffective disorder who contributed data in 1999,
20.8% were prescribed an atypical antipsychotic during that year. At the start of the study
period, atypical antipsychotic prescribing was much lower: 1.8% in 1993. Full data on the rate
of atypical prescribing in each year of the study period appear in Table 2. At the beginning of
this period, the most widely prescribed atypical antipsychotic was remoxipride (IMS Health
2003b), but this drug was withdrawn in 1994 due to reports of aplastic anaemia (Northern and
Yorkshire Regional Drug and Therapeutics Centre 1998). From 1994 to 1997, the atypical
antipsychotic with the largest market share was risperidone, but in 1998 and 1999 it was
overtaken by olanzapine as the most widely used atypical antipsychotic (IMS Health 2003b).
A panel logistic regression model (random effects) was run on 4,391 patients in the database
for 1993 to 1999 who had a diagnosis of schizophrenia or schizoaffective disorder and
received at least one antipsychotic medication prescription in each year that they contributed
data to my sample. Statistically significant associations were observed between choice of
antipsychotic medication and three variables: age, having an inpatient stay in the previous
year and having six or more primary care visits in the previous year (see Table 3). Older
patients were less likely to be prescribed an atypical as compared to a typical antipsychotic.
For every five-year difference in age the probability of being prescribed an atypical
antipsychotic decreased by 15%. Patients who had an inpatient stay in the previous year were
over 1.5 times as likely to receive atypical antipsychotics, as were patients who had visited
their GP six or more times in the previous year. Gender and time since first diagnosis of
243
Table 2: Rate of atypical prescribing in general practice for patients with schizophrenia or schizoaffective disorder: 1993-1999 Year Atypical antipsychotic prescribing among
GPRD schizophrenia and schizoaffective patients prescribed antipsychotics N %
1993 69 1.8 1994 102 2.7 1995 129 3.7 1996 166 5.7 1997 232 9.2 1998 277 13.8 1999 228 20.8 Source: General Practice Research Database.
Table 3: Panel logistic regression on GRPD data (1993-1999) looking at factors associated with receipt of atypical antipsychotics N = 4,391 Average number of observations per subject = 3.3 Wald chi-squared statistic = 78.71 Prob > chi2 = 0.0000 Coefficient Odds ratio p-value Age – 5 year increase -0.1640 0.85 <0.001 Sex – Male relative to female 0.2609 1.30 0.121 Time since diagnosis of schizophrenia – 5 year increase
0.0285 1.03 0.557
Inpatient in the previous year 0.5206 1.68 <0.001 6 or more GP visits 0.5165 1.68 <0.001 Constant -4.3596 Panel-level variance component (log of the standard deviation)
2.2674
0.1066
Standard deviation 3.1072 0.1656 Proportion of total variance contributed by the panel-level component
0.7458
0.0202
Liklihood ration test of rho=0: chibar2(01) = 1258.70 Prob >= chibar2 = 0.000 Note: random effects model with subject effect included.
244
schizophrenia or schizoaffective disorder were not associated with higher or lower odds of
being prescribed an atypical antipsychotic.
A test of the contribution to the model of having repeated observations from each patient
suggests that the design of the model, which accounts for the fact that there is variability
within patients over time and between patients, is justified.
Discussion
Trends in the rate of prescribing of atypical antipsychotics
Within my primary care study sample, a tenfold increase in the rate of atypical antipsychotic
prescribing was observed between 1993 and 1999. This rate of growth is comparable to UK
data from other sources, although none appear to have looked at as wide a sample as I was
able to examine in this paper. For example, a six-fold increase in retail sales of atypical
antipsychotics was observed in IMS Health data for the period 1996 to 1999 (IMS Health
2003).
Local studies of prescribing have also found comparable growth rates, and have the advantage
of looking at a more recent period. In the West Midlands between 1996/7 and 2000/1 there
was a six-fold increase in the volume of atypical antipsychotics prescribed. The authors
calculated defined daily dose at the health authority level by adjusting for differences in
population size and age stratification (Ashcroft et al. 2002).
Hayhurst et al (2003) observed greater increases in Greater Manchester over the same period
(1996/7 to 2000/1), but these increases varied markedly across health authorities. For a three-
month period in 1999, the adjusted per capita expenditure on atypical antipsychotics ranged
from less than £75 to over £500 and the variation between health authorities in per capita
expenditure on atypical drugs was almost three times greater than the variation in per capita
expenditure on typical antipsychotics.
With regards to prescribing patterns subsequent to the data used in this study, data from the
NHS Prescription Pricing Authority indicate that the rate of atypical antipsychotic prescribing
245
in General Practice in England has increased from 21.3% in June 2000 to 61.1% in June 2005
(NHS Prescription Pricing Authority 2006). These data are not comparable to the GPRD data,
however, as they include prescribing for indications other than schizophrenia and
schizoaffective disorder and relate to rates in England only, as compared to the GPRD which
incorporates data for all of the UK.
Factors associated with atypical antipsychotics prescribing
My analysis has been able to identify some significant correlates of prescription choice,
notably age, previous inpatient stay and previous frequency of primary care consultation.
Age
The NICE guidelines issued in 2002 did not suggest that age should be taken into account in
the prescription choice. The NICE guidelines do recommend that patients whose illness is
stable on typical antipsychotics should not be switched to atypical antipsychotics. It is
possible that older patients, having had their illness for a longer period of time (the age of
onset of schizophrenia being almost always in early adulthood), are more likely to have been
stabilised on a typical antipsychotic. My model tests for the effect of age separately from time
since diagnosis, but this effect was not found to be statistically significant. One conclusion
would thus be that other interpretations of the age effect are warranted. It is the case, however,
that age and time since diagnosis are significantly correlated (r=0.49 in 1999; p<0.0001), so
some degree of collinearity cannot be ruled out.
It may be the case that more of the younger patients in the sample are newly diagnosed and
are more likely to be receiving an initial prescription for atypical antipsychotics. For these
patients, the NICE guidelines – which obviously postdate the period studied in this paper –
suggest that atypical antipsychotics should be considered. Alternatively, this result may be
due to GPs being more defensive in their prescribing to older patients. There have been
concerns that atypical antipsychotics increase the risk of ischaemic stroke in patients with
dementia (Wooltorton 2002), and while these concerns were not extended to patients with
schizophrenia, it may be the case that clinical experience ahead of the formal issue of such
246
warnings affected the prescription choice for GPs prescribing for older patients (Percudani et
al. 2005). Recent studies have subsequently found no statistically significant increased risk of
ischaemic stroke for dementia patients taking atypical antipsychotics as compared to typical
antipsychotics (Gill et al. 2005).
There is also evidence that discrimination may affect the prescribing choice. Studies in the US
have concluded that ethnic minority patients are less likely to be prescribed atypical
antipsychotics relative to the general population (Valenti et al. 2003; Opolka et al. 2004). It
may be the case that similar discrimination occurs against older schizophrenia and
schizoaffective disorder patients.
Inpatient stays in the previous 12 months
The GPRD data indicate that over time, patients with recent inpatient stays were more likely
to be prescribed atypical antipsychotics. If it is reasonable to assume that inpatient admission
follows an exacerbation of symptoms, then it can be inferred from this result that, in line with
the NICE guidance, patients with more severe illness, or whose illness has not been stabilised,
are more likely to be prescribed atypical antipsychotics. Alternatively, this result may reflect a
preference of prescribing atypical antipsychotics, for acute patients, by hospital-based
psychiatrists. The prescription choice would then be continued by the patient’s GP once they
were discharged from hospital.
A US study by Duggan (2005), on individual patient Medicaid data, found a significant
increase in the use of inpatient care in the days leading up to an initial prescription for an
atypical antipsychotic. This suggests that patients were started on atypical antipsychotics as a
consequence of their previous medication not preventing an acute episode. Therefore, this
result is not likely to be due to comorbidity, but instead the result of the severity of symptoms
present in an acute hospital setting.
GP visits in the previous 12 months
Evidence supporting the significance of comorbidity in the prescription choice can be found
in my result that there is an increased likelihood of atypical prescribing among patients with
247
several recent visits to their GP. For some patients this may be for side-effects experienced as
a result of their antipsychotic medication.
The setting of care may also be a key factor in the prescription choice. Just as hospital
psychiatrists may prescribe more atypical antipsychotics as they are often treating acutely ill
patients, the prescribing of antipsychotics in primary care may be affected by a GP’s
experiences. Mortimer (2003) suggests that where antipsychotics are prescribed in primary
care, there may be a preference for using the older typical antipsychotics as GPs are more
likely to be familiar with these drugs. As the GPRD data are primary care-based, there may be
a bias in lower rates of atypical antipsychotic prescribing in these data.
Significant findings from other studies
Taylor et al (2000), in their study of inpatient prescribing, found an association between
gender and the use of atypical antipsychotics. They found that men were more likely to
receive atypical antipsychotics. This result was not substantiated by my analysis: I found no
significant gender difference.
In reaching treatment decisions, physicians are to some extent influenced by the extent of
their postgraduate education, the views of local colleagues, staff shortages (encouraging, it
has been argued, wider use of depot medications), pharmaceutical company advertising, the
requests of patients and budgetary constraints (Hogman 1996; Bebbington 2001; Hayhurst et
al. 2003; Walley 2004). For example, despite recommendations against either practice, there
is evidence that for patients with severe symptoms, psychiatrists often prescribe excessive
dosages or prescribe more than one antipsychotic (Taylor et al. 2000; Mortimer 2003; Paton et
al. 2003). Further, there is evidence that in primary care, familiarity with the content of the
National Service Frameworks in mental health is poor (Rogers et al. 2002).
Limitations
This study is potentially limited by the scope and content of the source of data. The GPRD
includes prescribing data at the outpatient level only. This includes prescribing initiated by the
248
GP or by a specialist in an outpatient setting. The dataset does not include records of hospital
inpatient prescribing, which may represent a sizeable proportion of antipsychotic prescribing.
Data from IMS Health on sales of atypical antipsychotics in the United Kingdom indicate that
in 2002 approximately 33% of prescriptions for atypical antipsychotics were made within
hospitals (IMS Health 2003).
The analysis of factors impacting on medication choice is limited by the lack of more detailed
data on the characteristics of patients, and medical practitioners, included in the sample. It has
been suggested by other UK studies that receipt of an atypical rather than a typical
antipsychotic is linked to factors such as treatment history and risk of non-adherence
(Hogman 1996; Mortimer 2003).
Conclusions
The trend of an increase in the rate of atypical antipsychotic prescribing in schizophrenia, as a
percentage of all antipsychotic prescribing, is likely to continue, unless clear evidence is
forthcoming that the side-effects attributable to atypical antipsychotics are more debilitating
than those associated with typical antipsychotics (Bushe and Leonard 2004). Reductions in
their real prices, relative to typical antipsychotics, seems likely to encourage GPs to prescribe
atypical antipsychotics more frequently in preference to the older medications. What is not
clear is if the rate of increase will be above what was observed prior to the introduction of the
NICE guidelines. Those guidelines have been welcomed by psychiatrists and patients, the
majority of whom appear to favour the use of atypical over typical antipsychotics in
schizophrenia treatment (Patel et al. 2003; Rethink (formerly known as the National
Schizophrenia Fellowship) 2005). Of course, atypical antipsychotics are not homogeneous in
their efficacy or side-effect profiles, and so comparisons within the atypical class of
antipsychotics would be a useful topic for further research.
It is government policy in England to improve access to atypical antipsychotics, based on the
evidence synthesis and consultations undertaken to inform the NICE review and guidance.
Further evidence is needed to make more transparent the treatment choices being made by
physicians. Variability in atypical prescribing rates, evidence of polypharmacy, and empirical
249
results such as those set out in this paper, indicating the use of non-need-based factors in
antipsychotic drug choice, suggest that prescribing for schizophrenic patients retains elements
of inconsistency and ambiguity.
250
REFERENCES Almond S, Knapp M, Francois C, Toumi M, Brugha T (2004). "Relapse in schizophrenia:
costs, clinical outcomes and quality of life". British Journal of Clinical Psychology 184: 346-351.
Ashcroft D, Frischer M, Lockett J, Chapman S (2002). "Variations in prescribing atypical antipsychotic drugs in primary care: Cross-sectional study". Pharmacoepidemiology and Drug Safety 11: 285-289.
Basu A (2004). "Cost-effectiveness analysis of pharmacological treatments in schizophrenia: critical review of results and methological issues". Schizophrenia Research 71: 445-462.
Bebbington P (2001). "Choosing antipsychotic drugs in schizophrenia". Psychiatric Bulletin 25: 284-286.
Bushe C, Leonard B (2004). "Association between atypical antipsychotic agents and type 2 diabetes: A review of prospective clinical data". British Journal of Psychiatry 184(Suppl. 47): S87-S93.
Davis J, Chen N, Glick I (2003). "A meta-analysis of the efficacy of second-generation antipsychotics". Archives of General Psychiatry 60: 553-564.
Duggan M (2005). "Do new prescription drugs pay for themselves? The case of second-generation antipsychotics". Journal of Health Economics 24: 1-31.
Gill S, Rochon P, Hermann N, Lee P, Sykora K, Gunraj N, Normane S, Gurwitz J, Marras C, Wodchis W, Mamdani M (2005). "Atypical antipsychotic drugs and risk of ischaemic stroke: Population based retrospective cohort study". BMJ 330: 445-448.
Hayhurst K, Brown P, Lewis S (2003). "Postcode prescribing for schizophrenia". British Journal of Psychiatry 182: 281-283.
Hogman G (1996). Is cost a factor? A survey of psychiatrists and health authorities to determine the factors influencing the prescribing and funding of atypical antipsychotics. London, National Schizophrenia Fellowship.
Hudson T, Sullivan G, Feng W, Owen R, Thrush C (2003). "Economic evaluations of novel antipsychotic medications: a literature review". Schizophrenia Research 60: 199-218.
IMS Health (2003). Sales evolution of atypical antipsychotics 1991-2002 in Local Currency Dollars. Fairfield, USA, IMS Health Incorporated.
IMS Health (2003b). Market share evolution of atypical antipsychotics 1991 – 2002. Fairfield, USA.
Kaye J, Bradbury B, Jick H (2003). "Changes in antipsychotic drug prescribing by general practiioners in the UK from 1991 to 2000: A population-based observational study". British Journal of Clinical Pharmacology 56: 569-575.
Leucht S, Pitschel-Walz G, Abraham D, Kissling W (1999). "Efficacy and extrapyramidal side-effects of the new antipsychotics olanzapine, quetiapine, risperidone, and sertindole compared to conventional antipsychotics and placebo. A meta-analysis of randomized controlled trials". Schizophrenia Research 35: 51-68.
Mortimer A (2003). "Antipsychotic treatment in schizophrenia: Atypical options and NICE guidance". European Psychiatry 18: 209-219.
NHS Prescription Pricing Authority (2006). Personal communitation, 30 January 2006. London.
NICE (2002). Guidance on the use of newer (atypical) antipsychotic drugs for the treatment of schizophrenia. London, National Institute for Clinical Excellence. Technology appraisals TA43.
251
Northern and Yorkshire Regional Drug and Therapeutics Centre. (1998). "The use of atypical antipsychotics in the management of schizophrenia". Retrieved 23 January, 2006, from http://www.nyrdtc.nhs.uk/docs/eva/atypical_antipsychotics.pdf.
Opolka J, Rascati K, Brown C, Gibson P (2004). "Ethnicity and prescription patterns for haloperidol, risperidone, and olanzapine". Psychiatric Services 55: 151-156.
Patel M, Nikolaou V, David A (2003). "Psychaitrists' attitudes to maintenance medication for patients with schizophrenia". Psychological Medicine 33: 83-89.
Paton C, Lelliott P, Harrington M, Okocha C, Sensky T, Duffett R (2003). "Patterns of antipsychotic and anticholinergic prescribing for hospital inpatients". Journal of Psychopharmacology 17: 223-229.
Percudani M, Barbui C, Fortino I, Tansella M, Petrovich L (2005). "Second-generation antipsychotics and risk of cerebrovascular accidents in the elderly". Journal of Clinical Psychopharmacology 25: 468-470.
Rethink (formerly known as the National Schizophrenia Fellowship). (2005). "That's Just Typical". Retrieved 3 March, 2005, from http://www.rethink.org/publications/pdfs/Typical-report.pdf.
Rogers A, Campbell S, Gask L, Sheaff R, Marshall M, Halliwell S, Pickard S (2002). "Some National Service Frameworks are more equal than others: Implementing clinical governance for mental health in primare care groups and trusts". Journal of Mental Health 11: 199-212.
Sartorius N, Fleischhacker W, Gjerris A, al e (2002). "The usefullness of and use of second generation antipsychotic medications: review of evidence and recommendations by a Task Force of the World Psychiatric Association". Current Opinion in Psychiatry 15(Suppl 1): S1-S51.
Sartorius N, Fleischhacker W, Gjerris A, Kern U, Knapp M, Leonard B, Lieberman J, Lopez-Ibor J, van Raay B, Twomey E (2003). "The usefulness of and use of second-generation antipsychotic medications: An update". Current Opinion in Psychiatry 16(Suppl. 1): S1-S44.
Stark C, Jones J, Agnew J, Hepburn T (2000). "Antipsychotic drug prescribing trends in primary care in Scotland 1994-97". Health Bulletin (Edinburgh) 58: 96-101.
STATA 7.0 (2001). STATA. College Station, Texas, Stata Corporation. Taylor D, Mace S, Mir S, Kerwin R (2000). "A prescription survey of the use of atypical
antipsychotics for hospital inpatients in the UK". International Journal of Psychiatry in Clinical Practice 4: 41-46.
Valenti A, Narendram R, Pristach C (2003). "Who are patients on conventional antipsychotics?". Schizophrenia Bulletin 29: 195-199.
Walley T (2004). "Neuropsychotherapeutics in the UK: What has been the impact of NICE on prescribing?". CNS Drugs 18: 1-12.
Walley T, Mantgani A (1997). "The UK General Practice Research Database". Lancet 350: 1097-1099.
Weiden P, Olfson M (1995). "Cost of relapse in schizophrenia". Schizophrenia Bulletin 21(3): 419-429.
Wood L, Coulson R (2001). "Revitalizing the General Practice Research Database: Plans, challenges, and opportunities". Pharmacoepidemiology and Drug Safety 10: 379-383.
Wooltorton E (2002). "Risperidone (Risperdal): Increased rate of cerebrovascular events in dementia trials". Canadian Medical Association Journal 167: 1269-1270.