1
Non‐catchment type instruments for snowfall measurement: General considerations and
issues encountered during the WMO CIMO SPICE experiment, and derived
recommendations
Authors : Yves‐Alain Roulet(1), Audrey Reverdin(1), Samuel Buisan(2), Rodica Nitu(3)
(1) MeteoSwiss, Payerne, Switzerland, yves‐[email protected]
(2) Spanish State Meteorology Agency (AEMET) Aragon Regional Office, Zaragoza, Spain
(3) Environment and Climate Change Canada, Toronto, Canada
1 Introduction
One objective of the WMO CIMO SPICE (Solid Precipitation Intercomparison Experiment) was to
investigate the ability of emerging technologies to measure solid precipitation (accumulation and
intensity) as an alternative to the traditional tipping‐bucket and weighing gauges, and to assess their
operational capabilities under winter conditions. This category of instruments, also called non‐
catchment type instruments (among them disdrometers and present weather sensors) provides
information on precipitation amount and intensity, and are also used for the discrimination of
precipitation and/or weather type (SYNOP, METAR codes for real time applications such as airports).
For disdrometers, these reported information are based on the measurement of hydrometeor size
and fall speed velocity distributions, which can be retrieved as raw data from the sensor and be used
for detailed event‐based analysis.
The important number of non‐catchment type instruments tested along during the SPICE campaign
under various winter climate conditions provides basics for the assessment of the ability for such
instruments to measure and report snow, and increases the know‐how on this type of instrument.
This paper will summarize the issues encountered with the operation of non‐catchment type
instruments tested during the SPICE campaign, and will give preliminary statement on the ability of
these instruments to report precipitation accumulation under winter conditions.
2 Methodology
SPICE was a multisite experiment, ran over two winter seasons (2013/14 and 2014/15), involving 20
sites in 15 different countries (Figure 1). More than 30 different instrument types were provided by
manufacturers and evaluated against reference measurements.
Figure 1
In order
Working
from th
automat
Alter shi
mounted
real pre
descript
automat
publicat
The dat
conduct
non‐catc
‐
c
‐
g
: Location of
to guarante
g Reference
e previous
tic weighing
ield and a DF
d on the inn
ecipitation e
ion of the S
tic measurem
ion, coming
a resolution
ed using 30
chment type
Reference re
catching 0.2
precipitation
Reference r
gauge catchi
f sites partici
ee the tracea
System (FW
solid precip
gauge (OTT
FIR (Double
ner fence of
events from
SPICE metho
ment within
soon). See a
n was typica
min events.
instruments
eporting pre
25 mm or
n.
eporting no
ing 0.1 mm o
ipating to the
ability and c
WRS) has bee
pitation inter
Pluvio2 or G
Fence Interc
the DFIR wa
noise repo
odology and
a DFIR) can
lso the SPICE
ally 1 min (
. Criteria for
s were as fol
ecipitation (‘Y
more AND
o precipitatio
or less AND p
e SPICE field
comparability
en defined,
rcomparison
GEONOR T‐20
comparison R
as also added
orted by the
the differen
n be found i
E keynote pa
(down to 6
the 30 min
low:
Yes’ case, de
precipitatio
on (‘No’ cas
precipitation
experiment
y of results a
based on th
n (Goodison
00B3 gauge
Reference, F
d to the FW
e reference
nt level of r
in the final r
aper from TE
sec in som
event selec
enoted Y be
on detector
se, denoted
n detector re
t.
across the s
he results an
et al., 199
with 3 trans
igure 2). A p
WRS, in order
weighing g
eferences (f
report of th
ECO 2016 (Ni
me cases), b
ction (i.e. pre
elow) : refere
recording 1
N below) :
cording 0 m
ites, a comm
nd recomme
8). It consis
sducers) with
precipitation
r to help disc
gauge. An e
from bush g
e experimen
itu et al., 201
but the ana
ecipitation e
ence weighin
18 min or
reference
in of precipit
2
mon Field
endations
sts in an
h a Single
detector
criminate
extensive
gauges to
nt (WMO
16).
lysis was
event) for
ng gauge
more of
weighing
tation.
‐
d
‐
Figure 2
The eval
question
‐
t
‐
w
‐
‐ A
‐ T
For this
accumul
were als
Instrument
reporting m
defined for
level than a
Instrument u
reporting 0 m
: Field Work
luation of th
ns:
Reliability in
the same tim
Performance
without prec
Performance
ratio, for rai
measuremen
Assessment
Threshold se
instrument u
s purpose,
ation), or ca
so used, base
under test
more than 0
non‐catchm
weighing gau
under test re
mm of precip
ing Referenc
he sensors u
n detecting p
me (YY cases)
e of SUT du
cipitation (N
e during pre
in, mixed an
nt quality (w
of YN, NY ev
election: Ac
under test to
plots were
atch ratio (C
ed on followi
reporting pr
mm of pre
ment instrum
uge.
eporting no
pitation.
ce System (FW
nder test (SU
precipitation
)?
ring no prec
N cases)?
ecipitation e
nd snow, res
wind speed, w
vents: When
cording to t
o allow reliab
created, su
CR) as a func
ing continge
recipitation
ecipitation (a
ment, since t
precipitatio
WRS), as con
UT) provided
: Do both in
cipitation ev
events (YY c
spectively. A
wind directio
do both inst
the analysis,
ble reporting
uch as scat
ction of win
ncy table (Ta
(‘Yes’ case,
accumulation
they have m
n (‘No’ case
nfigured on t
d by the ma
nstruments r
vents: Do bo
ases): Quan
Assessment o
on).
truments dis
, what shou
g of precipita
ter plots (r
d speed and
able 1).
denoted Y
n). A lower
much lower
, denoted N
the Sodanky
nufacturers,
report precip
oth instrume
titative asse
of external f
sagree?
uld be the t
ation event (3
reference ac
d precipitatio
below) : ins
threshold h
sensitivity a
below) : ins
lä SPICE site,
addressed f
pitation (any
ents agree o
essment, usi
actor influen
hreshold set
30 min interv
ccumulation
on type. Skil
3
strument
has been
nd noise
strument
, Finland.
following
y type) at
on period
ing catch
ncing the
t for the
val)?
vs SUT
lls scores
4
Reference
SUT Precipitation No‐Precipitation Total
Precipitation x (hits) z (false alarms) x + z
No‐Precipitation y (misses) w (correct negatives) y + w
Total x + y z + w N = x + y + z + w
Table 1: Contingency table for precipitation detection.
In this paper, the Probability of Detection (POD) and the False Alarm Rate (FAR) are used. They are
defined as:
% 100
The POD gives the fraction of events, out of all the precipitation events as indicated by the reference,
which will also be reported as precipitation events by the SUT. In other words it gives the probability
of the SUT agreeing on the occurrence of precipitation given that the reference detected
precipitation. Ideally, POD would have a value of 100%.
% 100
The FAR is the fraction of precipitation events as reported by the SUT which were judged by the
reference as not meeting the precipitation event criteria. FAR gives an indication of how likely is that
the sensor is not reliable when it reports the occurrence of precipitation. A larger percentage for FAR
would imply that there is a high probability that the SUT fails to recognize precipitation events in a
similar manner as judged by the reference. Ideally, the FAR would be zero.
The Root Mean Square Error (RMSE) has also been calculated for each SUT and precipitation type.
This value gives an indication of the variability of the SUT against the reference. It is defined as:
1/
Where Xai is the reference accumulation over the ith 30 min interval, Xbi the accumulation of the SUT
over that same interval and n is the number of 30 min intervals over which the analysis was
performed.
The results, using metrics and plots described here above, are shown in Chapter 4.
5
3 Instruments under test
The instruments submitted by manufacturers, and accepted as SUT within SPICE, are listed in Table 2,
together with the corresponding SPICE host site.
Instrument Model Measuring principle Host SPICE sites
Thies Laser Precipitation Monitor LPM Disdrometer Marshall, Weissfluhjoch
OTT Parsivel2 disdrometer Disdrometer Sodankylä
Campbell Scientific PWS100 Present Weather Sensor Haukeliseter, Marshall
Vaisala FS11P (FS11/PWD32 combination) Present Weather Sensor Sodankylä
Vaisala PWD 33 EPI Present Weather Sensor Sodankylä
Vaisala PWD 52 Present Weather Sensor Sodankylä
Yankee TPS3100 Hotplate Evaporative Plate Marshall, Haukeliseter, Sodankylä
Table 2: Emerging technology instruments submitted by manufacturers (11 instruments in total).
In total, 11 instruments, covering three different measuring principles (disdrometer, present weather
sensor and evaporative plate), and allocated to four SPICE sites, representing various climate
conditions, have been evaluated. They were installed according to manufacturer’s requirements. It is
to be noted that the Thies LPM was provided with a shield, both in Marshall and Weissfluhjoch.
All instruments have been operated during two winter seasons (2013/14 and 2014/15), except the
Hotplate in Haukeliseter, which was installed for the second season only. Operational considerations
(e.g. installation, configuration, maintenance issues, etc.) have also been collected from the
respective site managers, and were used for the assessment of the performance of each SUT.
4 Results
A standardized Instrument Performance Report (IPR) has been produced for each of the seven
different instrument type (according to Table 2), and will be available as an annex to the SPICE Final
Report (soon to be published). It contains the evaluation of one SUT against the site reference. This
chapter will give a summary of the main outcomes, instrument specific, and as an overall assessment
for non‐catchment type instruments.
4.1 Reliability in detecting precipitation
The reliability of SUT in detecting precipitation is assessed using skill scores, as defined in Chapter 2
above. A summary for all SUT is presented in Table 3.
6
POD [%] FAR [%]
Thies LPM (Weissfluhjoch) 99.1 0.2
Thies LPM (Marshall) 100.0 43.2
Parsivel2 (Sodankylä) 100.0 52.3
PWS100 (Haukeliseter) 87.2 0.0
PWS100 (Marshall) 97.3 4.1
FS11P (Sodankylä) 100.0 53.3
PWD52 (Sodankylä) 100.0 57.4
PWD33 (Sodankylä) 100.0 62.4
TPS Hotplate (Haukeliseter) 75.3 0.8
TPS Hotplate (Sodankylä) 100.0 82.9
TPS Hotplate (Marshall) 99.6 5.1
Table 3: Summary of skills scores for each SUT. POD: Probability Of Detection, FAR: False Alarm Rate. In bracket: SPICE host site.
The POD ranges from 75 to 100%, which indicates fairly high reliability of the non‐catchment
instruments in general to detect precipitation (independent from type and quantity). These
instruments are usually more sensitive than traditional gauges (weighing and tipping bucket gauges),
with lower detection threshold. The FAR varies from 0 (no false event reported) up to 82% (high
probability that the SUT fails to recognize precipitation events according to the reference). The large
differences in FAR among the SUT is to be underlined. It may be related to specific climate conditions
from each site (e.g. all sensors tested in Sodankylä, except the TPS Hotplate, show the same order of
FAR, around 50%), but the performance of the instrument has the most impact (e.g. the PWS100
show small FAR in both sites, Marshall and Haukeliseter).
4.2 Performance of SUT during no precipitation events
The output signal of non‐catchment instruments during no precipitation events is usually a stable,
noise‐free signal indicating 0 mm. This is an intrinsic feature of these instruments, where the output
has already been processed internally. The consequence is that the threshold needed to be set to
report precipitation adequately over an aggregated time step (typically 30 min) remains very low (0
to 0.1 mm/30 min if we want to reach the 3 STD).
4.3 Performance during precipitation events
The assessment of the SUT in terms of reporting the correct accumulation during precipitation events
can be summarized using RMSE calculation. The RMSE numbers for all SUT are presented in Table 4.
7
All [mm] Rain [mm] Mixed [mm] Snow [mm]
Thies LPM (Weissfluhjoch) 0.483 0.248 0.505 0.486
Thies LPM (Marshall) 0.488 0.767 0.526 0.305
Parsivel2 (Sodankylä) 0.208 0.075 0.192 0.241
PWS100 (Haukeliseter) 0.740 0.314 0.691 0.817
PWS100 (Marshall) 0.558 0.688 0.697 0.343
FS11P (Sodankylä) 0.146 0.137 0.157 0.133
PWD52 (Sodankylä) 0.138 0.133 0.149 0.124
PWD33 (Sodankylä) 0.363 0.176 0.485 0.143
TPS Hotplate (Haukeliseter) 0.333 0.409 0.360 0.306
TPS Hotplate (Sodankylä) 0.129 0.094 0.142 0.114
TPS Hotplate (Marshall) 0.232 0.344 0.283 0.121
Pluvio2 (all four sites) 0.1‐0.45 0.0‐0.2 0.05‐0.4 0.1‐0.5
Table 4: RMSE (Root Mean Square Error) in mm of precipitation related to the reference, for all non‐catchment SUT, for all, rain, mixed, and snow events respectively. As a comparison, RMSE range for the Pluvio2 weighing gauge from the four sites hosting non‐catchment type instruments (Haukeliseter, Marshall, Sodankylä and Weissfluhjoch) is indicated.
The results show a large scatter across all instruments, and for each precipitation type, with no clear
tendency. It was expected that the RMSE would generally be lower for rain than for snow, but some
SUT show different behavior across different sites. As an example, the Thies LPM has a lower RMSE
for snow than for rain at Marshall (0.305 mm and 0.767 mm, respectively), and the opposite is true in
Weissfluhjoch (0.486 mm and 0.248 mm, respectively). The PWS100, the other SUT tested at two
different sites, show the same pattern, with a higher RMSE for snow than for rain in Haukeliseter
(0.817 mm and 0.314 mm, respectively) and the opposite in Marshall (0.343 mm and 0.688 mm,
respectively). It is to be noticed that the number of rain events is generally low, and prevent for some
sites to draw robust conclusions.
Scatter in the 30 min events data may be a function of either site characteristics, or the SUT itself, or
a combination of the two. Table 4 shows that all SUT located in Sodankylä (low wind conditions) have
low RMSE, independently from the technology (three PWD Vaisala sensors, one Hotplate, and one
Parsivel2). An assessment of these sensors under high wind conditions, especially in terms of scatter,
is necessary. The PWS100 and the Hotplate were both tested in Marshall and Haukeliseter. The RMSE
ratio between these two sensors is of the same order for both sites, the Hotplate showing lower
RMSE. This difference relates directly to the performance of the instrument. In order to fairly
compare all RMSE, it should be calculated for wind speed up to 4 m/s (representing the wind
maximum at Sodankylä). Higher RMSE for sites with higher winds is expected. This has to be taken
into account when comparing RMSE from SUT located at different sites.
8
As a comparison, RMSE for unshielded and shielded (Single Alter) Pluvio2 evaluated against the site
reference (Pluvio2 or Geonor) for the four sites hosting non‐catchment type instruments ranges from
0.0 to 0.2 mm for rain, 0.05 to 0.4 mm for mixed, and 0.1 to 0.5 mm for snow. As an example, the
RMSE for Sodankylä, which hosted most of the non‐catchment type instruments, remains between 0
and 0.1 for all precipitation type.
The catch ratio of SUT with respect to the reference has also been assessed as a function of wind
speed. Unlike for weighing and tipping bucket gauges, where the catch ratio for snow and mixed
precipitation decreases drastically with increasing wind speed, wind is expected not to have such a
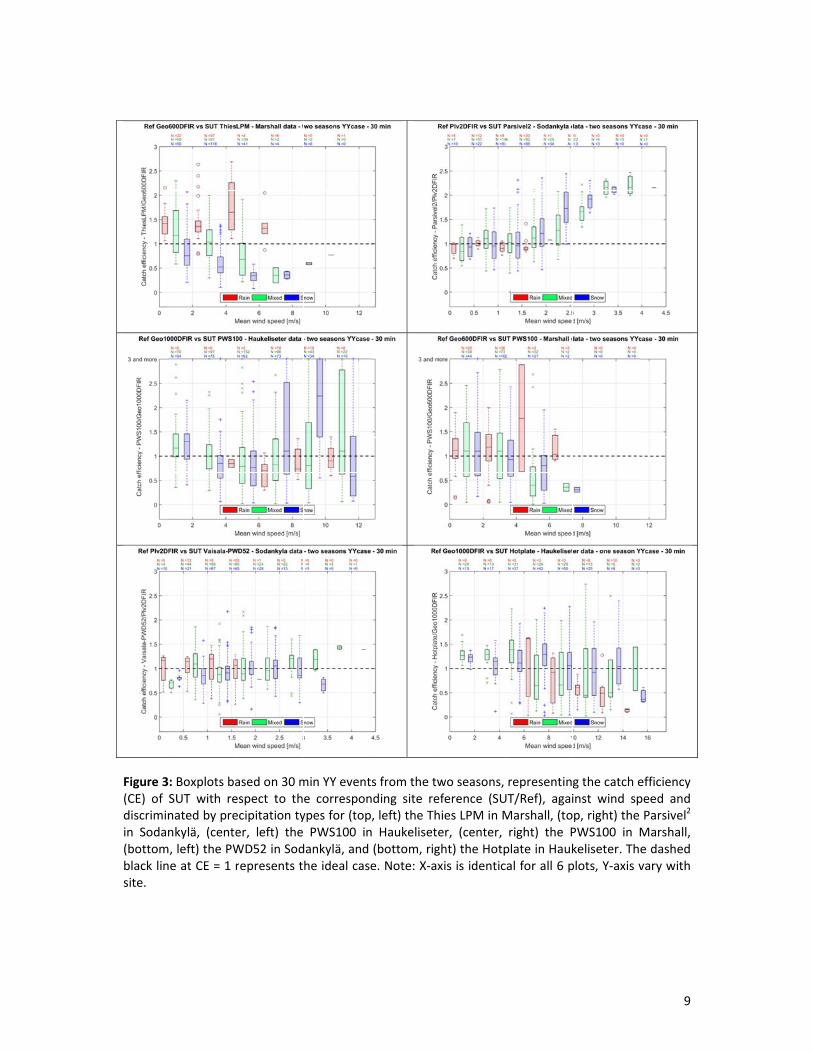
strong impact on non‐catchment type instruments. Some cases are presented below in Figure 3, as
example, and a comprehensive results overview will be given during the oral presentation at TECO.
Figure 3(CE) of Sdiscriminin Sodan(bottomblack linsite.
: Boxplots baSUT with renated by prenkylä, (cente, left) the PWe at CE = 1 r
ased on 30 mespect to thecipitation tyer, left) the WD52 in Sodrepresents t
min YY evente corresponypes for (topPWS100 in
dankylä, and he ideal case
s from the twnding site re, left) the Thn Haukelisete(bottom, rige. Note: X‐ax
wo seasons, eference (SUhies LPM in Mer, (center, ght) the Hotpxis is identic
representinUT/Ref), agaiMarshall, (toright) the Pplate in Haukcal for all 6 p
g the catch einst wind spp, right) the PWS100 in Mkeliseter. Thplots, Y‐axis v
9
efficiency peed and Parsivel2 Marshall, e dashed vary with
10
Figure 3 shows that not all non‐catchment type instruments have similar behavior with respect to the
influence of wind speed.
The two box plots on the top represent the catch ratio as a function of wind speed for two
disdrometers (Thies LPM in Marshall on the left, Parsivel2 in Sodankylä on the right), showing
opposite trends. The Thies LPM indicates a decrease of the catch ratio for snow and mixed
precipitation with increasing wind speed. The mean catch ratio drops to 0.5 by winds at 4 m/s. The
Parsivel2 shows an increase of the catch ratio for snow and mixed precipitation with increasing wind
speed (above 2 m/s), resulting in a clear overcatch from the SUT (mean CR around 2 by winds at 4
m/s). Note that the horizontal axis is not the same for both SUT, since Sodankylä has lower wind
speed, with maximum around 4 m/s (10 m/s for Marshall).
The two box plots in the center represent the catch ratio as a function of wind speed for the same
instrument, PWS100, installed in Haukeliseter (left) and Marshall (right). A lot of snow and mixed
events at Haukeliseter occurring under high winds (more than 6 m/s) resulted in a large overcatch,
with CR for single events of 3 and more. For wind speed up to 6 m/s, the behavior of the SUT is
similar for the two sites, showing a very large scatter below and above the ideal case of a CR equal to
1, with CR varying randomly between 0 and 2. There seems to be no relation with specific
environmental conditions. Nevertheless, the mean CR is close to 1, indicating that this sensor seems
to be a reliable instrument to account for the total accumulation over a longer period (e.g. one
season).
The two box plots on the bottom represent the catch ratio as a function of wind speed for two other
non‐catchment type instruments, the Vaisala PWD52 in Sodankylä (left) and the TPS Hotplate in
Haukeliseter (right). The mean catch ratio for snow events for the PWD52 is characterized by almost
no trend with increasing wind speed (up to 4 m/s), staying around 1, and with a generally smaller
scatter than for the other instruments above. The same trend is true for the Hotplate, up to wind
speed at 14 m/s, but the scatter increasing at wind speed of 8 m/s and above. The scatter for wind
speed up to 4 m/s is very similar for both instruments.
4.4 Assessment of YN, NY events
The native resolution and sensitivity of present weather sensors and disdrometers are generally
higher than for catchment instruments (traditional precipitation gauges). The non‐catchment type
instruments are therefore suitable to detect light (or trace) precipitation events. As a result in the
evaluation of the sensor, the number of YN cases are very low, i.e. cases where the non‐catchment
type instrument would miss a precipitation event recorded as such by the reference. This is
confirmed, with a number of YN cases for almost all the SUT ranging from 0 % (of the total Y cases
from the reference) to 3 %. Only the PWS100 and the Hotplate, both in Haukelister, show higher
percentage (12.8 % and 24.7 %, respectively). Haukeliseter being a windy site, these “miss” cases
might be related to high wind speed conditions.
The NY cases, i.e. when the reference is not reporting any precipitation and the SUT does (according
to the thresholds defined in Chapter 2 above), vary from 0 % (of the total N cases from the reference)
to 18 %, with most of the SUT being around 5 %. Due to the higher sensitivity of the non‐catchment
type instruments already mentioned above, it might be possible that a certain number of NY cases
are actually more a “miss” from the reference than a “false alarm” from the SUT. These cases need
further in depth analysis.
11
5 Conclusion
One objective of SPICE was to evaluate the ability for alternative technologies (i.e. other than
traditional tipping bucket and weighing gauges) to be used operationally for snow measurement
(accumulation). Several non‐catchment type instruments have been tested during two winter
seasons within the SPICE field campaign. In total, 11 instruments from 7 different types were tested
in 4 different SPICE sites.
A standardized Instrument Performance Report (IPR) has been produced for each instrument,
assessing its performance against the site reference. The ability of the SUT to detect precipitation
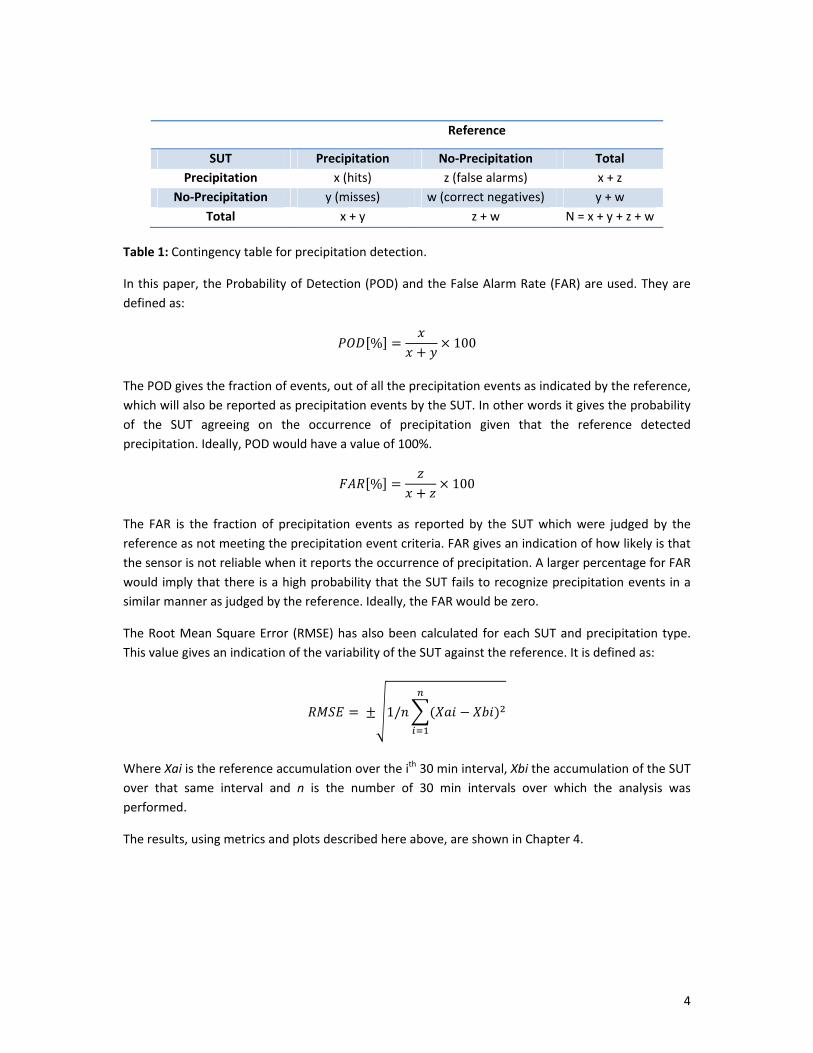
according to the reference was assessed using metrics (contingency table, POD and FAR). The results
showed a high POD for all SUT (100% for most of them), which confirms the generally higher
sensitivity of disdrometers and present weather sensors than traditional precipitation gauges
(weighing and tipping bucket gauges).
The ability of the SUT to measure the correct amount of precipitation was also assessed, calculating
the catch ratio of the SUT related to the site reference. The results, assessed with the RMSE, vary
from one SUT to another, and from one site to another, making it difficult to give a general
statement. Generally, RMSE tends to be higher for snow and mixed precipitation than for rain, but
this is not always the case. The catch ratio was also calculated as function of wind speed, in order to
understand the impact of winds on the quality of the SUT measurement. For weighing and tipping
bucket gauges, a decrease of the catch ratio with increasing wind speed is expected. This relationship
has not been fully analyzed for disdrometers or present weather sensors yet. The results showed all
three tendencies, depending on the SUT, with decrease, increase or no changes in the catch ratio
with increasing wind speed. This tends to show that the shape of the sensor (not identical for all
SUT), but also their internal proprietary algorithm to convert the raw information into water
quantity, is affecting this relationship in various manners.
The generally large scatter showed when using the 30 min events tends to demonstrate that these
sensors are usually not appropriate to measure snow accumulation over short interval (typically 30
min). But for some of them, the mean catch ratio was found to be acceptable (around 1), which
indicates that these sensors might be used to measure precipitation accumulation over a longer
period (e.g. one season).
Further analysis is needed to better understand the behavior of these sensors, especially working
with the raw data (drop size and fall speed distribution), and exploiting the full capacity of such
sensors, which provide much more information than the precipitation accumulation (precipitation
type, SYNOP and METAR code, etc.). Field tests on SPICE reference sites have been continued in that
sense after the official end of the project, and will enhance the knowledge on the operational use of
non‐catchment type instruments in winter conditions. Among others, data from disdrometers
installed within a DFIR (the precipitation detectors that served as part of the FWRS, see Chapter 2)
are being analyzed. Preliminary results have shown good agreement with the site reference (shielded
weighing gauge in the DFIR) in terms of accumulated solid precipitation. This tends to confirm that
the impact of wind speed on non‐catchment type instruments is relevant.
12
6 References
Goodison B., Louie P.Y.T. and Yang D., 1998: WMO Solid Precipitation Measurement
Intercomparison, Final Report, WMO IOM Report No. 67, WMO/TD – No. 872.
Nitu et al., 2016: WMO SPICE: Intercomparison of Instruments and methods for the measurement of
Solid Precipitation and Snow on the Ground, Overall results and recommendations, Keynote 3A,
TECO 2016, Madrid, Spain.