Non-equilibrium effects in high pressure, high temperature plasmas Ananth N. Bhoj and Mustafa Megahed ESI US R&D Inc., 6767 Old Madison Pike, Huntsville, AL 35806 USA. Abstract: High temperature plasmas generated at high pressures are generally modeled assuming local thermal equilibrium. When non-equilibrium effects are important it is useful to consider fluid based two temperature models, solving separately for gas and electron temperatures. In this paper, plasma kinetics are addressed by calculating electron transport and rate coefficients and solving for the detailed volumetric mechanism of electron and heavy particle reactions. The quasi-neutrality condition is assumed for the discharge, while the electric conduction equation is solved to obtain electric fields. Results from the 3-d simulations using this approach as applied to an example representative of technological applications involving arc discharges are presented. Keywords: arc discharge, non-equilibrium, plasma modeling, plasma kinetics 1. Introduction Arc discharges are of central importance to materials processing and high temperature chemistry applications, including combustion. Advances in modeling arc discharges in recent years have led to a better understanding of the underlying physics [1]. The complex interaction of flow, electric, magnetic and thermal effects along with gas chemistry and electrode surface phenomena renders very difficult generic, comprehensive analytical or computational tools suitable for the industrial setting. Simplifying assumptions are normally used to focus on particular physics or engineering issues of interest [2, 3]. 2. Model Description In this paper, we discuss the computational modeling of an arc discharge, typical of industrial applications, using a generic fluid based approach to allow for significant non-equilibrium conditions [4]. The model has been presented earlier [5] and is part of the CFD-ACE+ modeling platform [6]. Electron density is obtained from a quasi-neutrality condition. Electron energy is computed by addressing the solution of the electron energy balance equation. The electric conduction equation is solved to obtain the electric potential and electric field within solids and the plasma. The conductivity of the plasma can be modeled as either a function of gas temperature and pressure or computed from the electron density. The electron conduction current is computed from the known quantities of conductivity and electric fields. The current boundary condition applied at the electrode is known. The model is able to self- consistently compute quantities such as the velocity and pressure fields in the gas. The electron, gas and solid temperatures are calculated. In addition, the solution of reaction chemistry yields the number density (or concentrations) of various species. This includes the computation of electron transport and rate coefficients and solving for the detailed volumetric mechanism of electron and heavy particle reactions. The output electric parameters include the conductivity, electron density and electric potential. In the next section, the application of this model to an example is discussed. 3. Arc Discharge in Oxygen In this example, a typical 3-d section is considered as shown in Figure 1. The top powered electrode tip is exposed to the gas, here Oxygen. The sides are covered by dielectric. O 2 enters through the inlet at a slightly higher pressure and exits through the outlet. The pressure is near atmospheric at 10 5 Pa. The lower solids, 14.5 mm from the powered electrode, contain a metal and a dielectric and their lower surfaces are grounded. The electrical
Transcript
Non-equilibrium effects in high pressure, high temperature plasmas
Ananth N. Bhoj and Mustafa Megahed
ESI US R&D Inc., 6767 Old Madison Pike, Huntsville, AL 35806 USA.
Abstract: High temperature plasmas generated at high pressures are generally modeled assuming local thermal equilibrium. When non-equilibrium effects are important it is useful to consider fluid based two temperature models, solving separately for gas and electron temperatures. In this paper, plasma kinetics are addressed by calculating electron transport and rate coefficients and solving for the detailed volumetric mechanism of electron and heavy particle reactions. The quasi-neutrality condition is assumed for the discharge, while the electric conduction equation is solved to obtain electric fields. Results from the 3-d simulations using this approach as applied to an example representative of technological applications involving arc discharges are presented. Keywords: arc discharge, non-equilibrium, plasma modeling, plasma kinetics
1. Introduction
Arc discharges are of central importance to materials processing and high temperature chemistry applications, including combustion. Advances in modeling arc discharges in recent years have led to a better understanding of the underlying physics [1]. The complex interaction of flow, electric, magnetic and thermal effects along with gas chemistry and electrode surface phenomena renders very difficult generic, comprehensive analytical or computational tools suitable for the industrial setting. Simplifying assumptions are normally used to focus on particular physics or engineering issues of interest [2, 3].
2. Model Description
In this paper, we discuss the computational modeling of an arc discharge, typical of industrial applications, using a generic fluid based approach to allow for significant non-equilibrium conditions [4]. The model has been presented earlier [5] and is part of the CFD-ACE+ modeling platform [6]. Electron density is obtained from a quasi-neutrality condition. Electron energy is computed by addressing the solution of the electron energy balance equation.
The electric conduction equation is solved to obtain the electric potential and electric field within solids and the plasma. The conductivity of the plasma can be modeled as either a function of gas temperature and pressure or computed from the
electron density. The electron conduction current is computed from the known quantities of conductivity and electric fields.
The current boundary condition applied at the electrode is known. The model is able to self-consistently compute quantities such as the velocity and pressure fields in the gas. The electron, gas and solid temperatures are calculated. In addition, the solution of reaction chemistry yields the number density (or concentrations) of various species. This includes the computation of electron transport and rate coefficients and solving for the detailed volumetric mechanism of electron and heavy particle reactions. The output electric parameters include the conductivity, electron density and electric potential. In the next section, the application of this model to an example is discussed.
3. Arc Discharge in Oxygen
In this example, a typical 3-d section is considered as shown in Figure 1. The top powered electrode tip is exposed to the gas, here Oxygen. The sides are covered by dielectric. O2 enters through the inlet at a slightly higher pressure and exits through the outlet. The pressure is near atmospheric at 105 Pa. The lower solids, 14.5 mm from the powered electrode, contain a metal and a dielectric and their lower surfaces are grounded. The electrical
conductivity of the metal and dielectric are assumed to be 106 and 10-6 1/ohm-m respectively. The mesh with 13000 cells is locally refined near the electrode.
For the initial conditions, the initial gas temperature field is about 1000 K. The top surface of the electrode is assigned a fixed current boundary condition of 2.5×10⁶ A/m2. The initial electron temperature is assumed to be 2 eV. The reaction chemistry includes electron impact collisions including momentum transfer, dissociation, excitation, ionization and recombination. Heavy species reactions include neutral – neutral reactions, electron - ion and ion – ion recombination, and charge transfer. Surface chemistry at electrode and grounded surfaces includes neutralization of charged species and recombination of atoms.
Figure 1. The 3-d sector geometry used in these simulations. The distance from the electrode tip to the metal is 14.5 mm. In the remaining figures results are shown on a section plane.
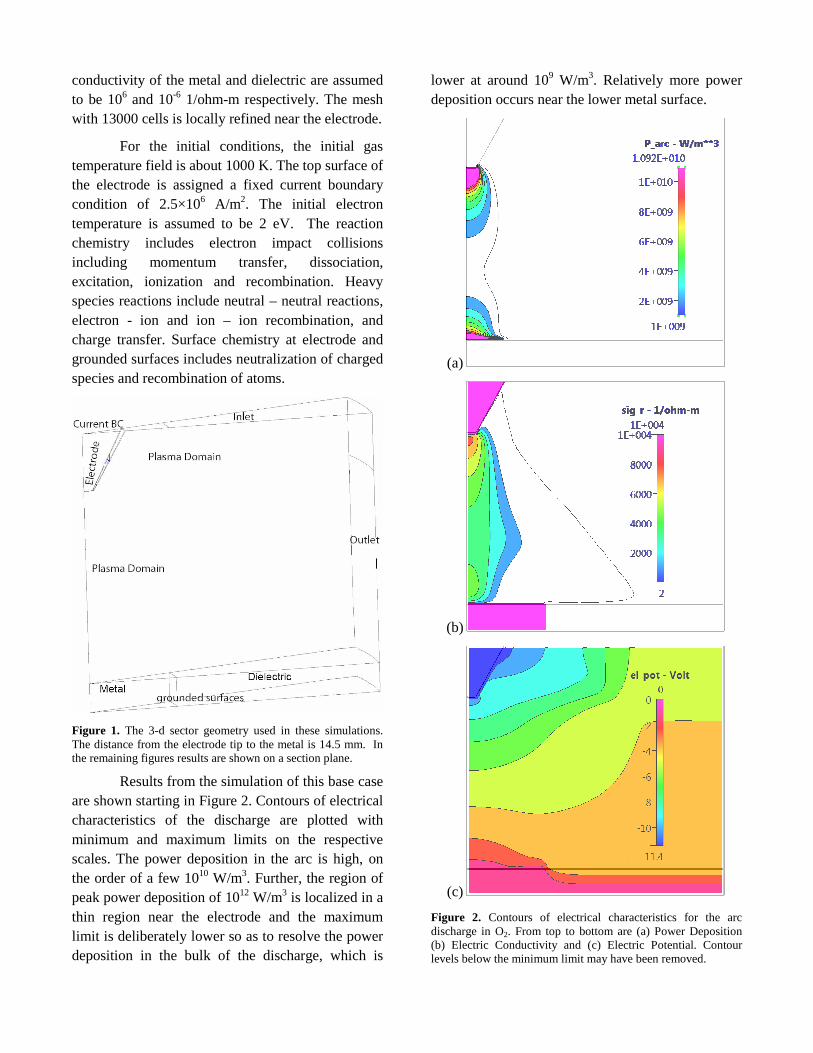
Results from the simulation of this base case are shown starting in Figure 2. Contours of electrical characteristics of the discharge are plotted with minimum and maximum limits on the respective scales. The power deposition in the arc is high, on the order of a few 1010 W/m3. Further, the region of peak power deposition of 1012 W/m3 is localized in a thin region near the electrode and the maximum limit is deliberately lower so as to resolve the power deposition in the bulk of the discharge, which is
lower at around 109 W/m3. Relatively more power deposition occurs near the lower metal surface.
(a)
(b)
(c)
Figure 2. Contours of electrical characteristics for the arc discharge in O2. From top to bottom are (a) Power Deposition (b) Electric Conductivity and (c) Electric Potential. Contour levels below the minimum limit may have been removed.
The spatial variation of the electrical conductivity is a direct consequence of the shape of the discharge. Here it is computed using the spatial distribution of electron density and mobility. One of the difficulties involved in such models stems from the large variation in electrical conductivity at interfaces between material domains, which can be several orders of magnitude apart. The greater the width of this range, the harder it is to obtain convergence in numerical solutions.
The discharge is sustained at low voltages typical of high current arc discharges as in Figure 2(c). The discontinuities in the lower solids arise due to their differing conductivities. The voltage at the negatively powered electrode is about -11.4 V.
(a)
(b)
Figure 3. Contours of temperatures for the arc discharge in O2. Shown from top to bottom are (a) temperature of the gas and in solid materials in Kelvin and (b) electron temperature in eV. Contour levels below the minimum limit may have been removed.
(a)
(b)
(c)
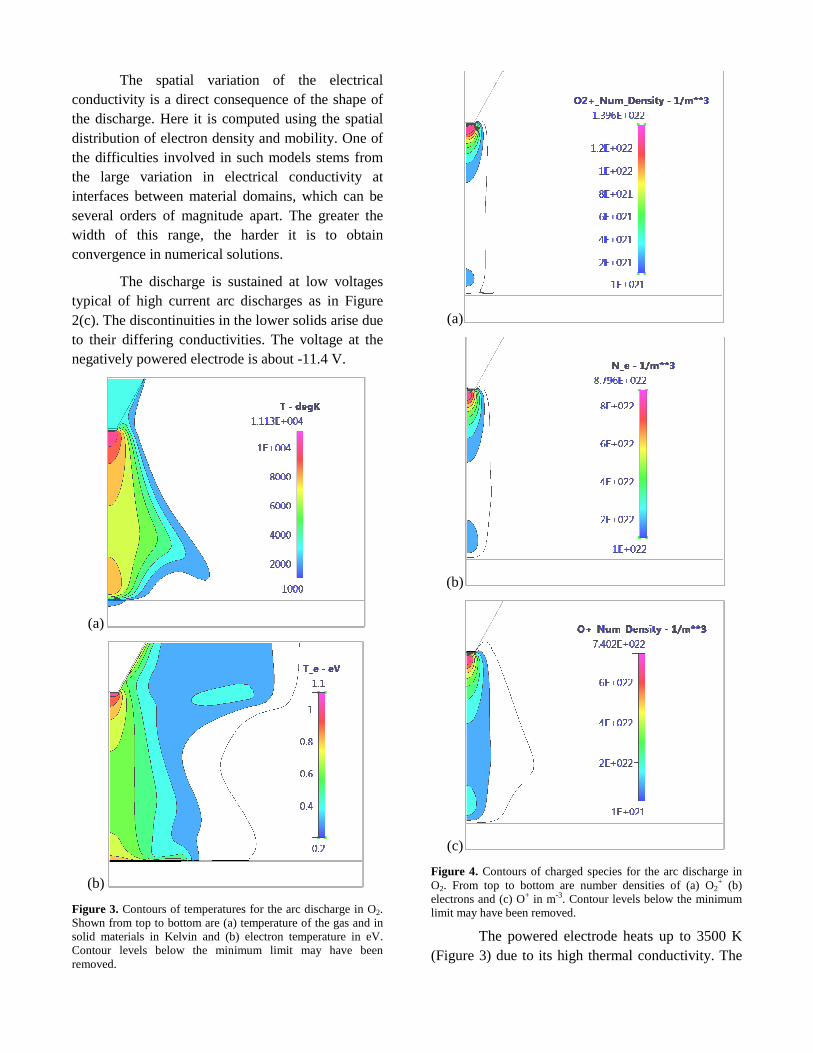
Figure 4. Contours of charged species for the arc discharge in O2. From top to bottom are number densities of (a) O2
+ (b) electrons and (c) O+ in m-3. Contour levels below the minimum limit may have been removed.
The powered electrode heats up to 3500 K (Figure 3) due to its high thermal conductivity. The
peak gas temperature is around 11000 K near the region of peak power deposition. There is a sharp gradient as gas temperature falls off several thousand Kelvin at short radii from the central axis of the arc. While peak electron temperature is about 1.1 eV near the region of peak power deposition, it decreases more gradually throughout the plasma domain. The conditions in the plasma region near the central axis are close to local thermal equilibrium (LTE) with reduced difference between electron and gas temperatures. Departures from LTE are noted farther out where the gas is cooler than electrons.
The dominant ion in the discharge is O+ for these conditions (Figure 4) and as expected the peak ion and electron densities occur close to the region of peak power deposition. Sharp gradients exist in the contours of charged species density. The space charge region is very thin for these conditions and the arc is largely quasi-neutral.
The spatial distribution of neutral species densities are shown in Figure 5. The contours of the background gas, O2, depict the degree of dissociation resulting from the arc, with virtually no dissociation away from the arc. The region of the arc discharge nearer the central axis is abundant in reactive O radicals resulting from the decomposition of O2 and the high gas temperature. Given the role of O atoms in the chemical reaction mechanism, it is expected that this distribution critically determines the shape and strength of the arc discharge.
4. Summary
In this work, the example of a typical arc discharge configuration using O2 at near atmospheric pressure was used to illustrate the discharge characteristics that can be computed using a two temperature fluid based modeling approach with CFD-ACE+. The limits of application for this model are being extended to address more complicated chemistries over a wider range of pressures.
References
[1] M. S. Benilov, J. Phys D, 41, 133001 (2008).
Figure 5. Contours of number densities of (above) background O2 and (below) O radicals in m-3. Contour levels below the minimum limit may have been removed.
[2] J. J. Beulens, D. Milojevic, D. C. Schram and P. M. Vallinga, Phys. Fluids B, 3, 2548 (1991).
[3] C. Delalondre, A. Bouvier, A. Caruso, N. Mechitoua, O. Simonin and J.-C. Verite, Pure & Appl. Chem., 70, 1163 (1998).
[4] S. C. Synder, A. B. Murphy, D. L. Hofeldt and L. D. Reynolds, Phys. Rev. E, 52, 2999 (1995).
[5] N. Zhou, “A Two Temperature Model for High Pressure High Temperature Plasmas”, Presented at the 58th GEC, San Jose, CA, October 2005.
http://meetings.aps.org/link/BAPS.2005.GEC.LT2.5
[6] CFD-ACE+ User Manual (2010). CFD-ACE+ can be licensed from the ESI Group. http://www.esi-cfd.com