Non-Invasive Artificial Pulse Oximetry: Development and Testing by Garth Cloete Thesis presented in partial fulfilment of the requirements for the degree of Master of Science in Engineering (Mechatronics) at Stellenbosch University Department of Mechanical and Mechatronic Engineering Stellenbosch University Private Bag X1, Matieland, 7602, South Africa Supervisor: Prof C. Scheffer March 2012
Transcript
Non-Invasive Artificial Pulse Oximetry:
Development and Testing
by
Garth Cloete
Thesis presented in partial fulfilment of the requirements for the degree of
Master of Science in Engineering (Mechatronics)
at Stellenbosch University
Department of Mechanical and Mechatronic Engineering Stellenbosch University
Private Bag X1, Matieland, 7602, South Africa
Supervisor: Prof C. Scheffer
March 2012
Stellenbosch University http://scholar.sun.ac.za
Pag
e ii
ABSTRACT
The monitoring of patients in healthcare is of prime importance to ensure their efficient treatment. The monitoring of blood oxygen saturation in tissues affected by diseases or conditions that may negatively affect the function is a field that has grown in importance in recent times.
This study involved the development and testing of a highly sensitive non-invasive blood oxygen saturation device. The device can be used to continuously monitor the condition of tissue affected by diseases which affect the blood flow through the tissue, and the oxygen usage in tissue. The device’s system was designed to specifically monitor occluded tissue which has low oxygen saturations and low perfusion. With the use of the device, it is possible to monitor the status of tissue affected by diseases such as meningococcemia and diabetes mellitus or conditions such as the recovery after plastic surgery.
The study delved into all aspects involved in the development of a non-invasive artificial pulse oximeter, including but not limited to that of a detailed device design, signals analysis, animal in-vivo and laboratory in-vitro system design for the calibration of the system as well as human clinical validation and testing procedures. All these aspects were compared to determine the relative accuracies of the different models.
Through testing it was shown that it is possible to non-invasively measure the mixed oxygen saturation in occluded tissue. However, without accurate validation techniques and methods of obtaining both arterial and venous blood samples in occluded tissue the system could not be fully validated for determining both the arterial and venous oxygen saturations in the human in-vivo study.
Although the system was unable to accurately measure specifically the venous oxygenation it was able to measure the mixed oxygen saturation. With further research it would be possible to validate the system for measuring both the arterial and venous oxygen saturations.
Stellenbosch University http://scholar.sun.ac.za
Pag
e ii
i
OPSOMMING
Die monitering van pasiënte in gesondheidsorg is van uiterste belang om doeltreffende behandeling te verseker. Die monitering van bloedsuurstof-versadiging in weefsels wat geaffekteer word deur siektes of toestande wat ’n negatiewe impak kan hê op die funksie daarvan is ’n gebied wat aansienlike groei getoon het in die onlangse verlede.
Die studie het die ontwikkeling en toetsing van ’n hoogs sensitiewe nie-indringende bloedsuurstofversadigingsensor ingesluit. Hierdie sensor kan gebruik word om deurentyd die toestand van weefsel te monitor wat geaffekteer word deur siektes wat bloedvloei deur weefsel affekteer sowel as die suurstofgebruik in die weefsel. Die stelsel is ontwerp om spesifiek die ingeslote weefsel wat lae suurstofversadiging en lae perfusie het, te monitor. Deur gebruik te maak van die toestel is dit moontlik om die toestand van die weefsel wat geaffekteer word deur siektes soos meningococcemia en diabetes mellitus of toestande soos die herstel na plastiese sjirurgie te monitor.
Die studie het gekyk na alle aspekte wat betrokke is in die ontwikkeling van ’n nie-indringende kunsmatige pols-oksimeter, insluitend maar nie beperk tot gedetailleerde ontwerp nie, sein analise, dier in-vivo en laboratorium in-vitro stelselontwerp vir die kalibrasie van die stelsel sowel as menslike kliniese bekragtiging en toetsprosedures. Al hierdie aspekte is vergelyk om die relatiewe akkuraatheid van die verskillende modelle te bepaal.
Die toetse het gewys dat dit moontlik is om nie-indringend die gemengde suurstofversadiging in weefsel te bepaal. Sonder akkurate bekragtigingstegnieke en metodes om beide arteriële en vene bloedmonsters te versamel in ingeslote weefsel kan die stesel nie ten volle bekragtig word om beide arteriële- en veneversadigings in menslike in-vivo studie te bepaal nie.
Hoewel die stelsel nie ’n akkurate meting van die aarsuurstof kon kry nie, is daar wel ’n akkurate meting geneem van die gemengde suurstofversadiging. Toekomstige navorsing kan lei tot die bekragtiging van die stelsel om beide arteriële en slagaar suurstofversadigings te meet.
Stellenbosch University http://scholar.sun.ac.za
Pag
e iv
ACKNOWLEDGEMENTS
I would like to express my deepest gratitude to the following people who contributed to this thesis and who helped to make it possible:
I am particularly indebted to my Supervisor, Prof Cornie Scheffer, for providing direction, encouragement and understanding throughout the project. Without whom I would not be in the position I am today.
To Prof Pieter Fourie, who provided the critical feedback and medical advice I required for the development of the clinical procedures.
To Prof Andre R. Coetzee and Dr Daniel Muller who provided the necessary expertise in animal and clinical testing procedures, and their time and support in performing the necessary medical procedures required for this project.
To Mr Ferdie Zietsman and the mechanical workshop personnel who manufactured the mechanical components for this project and always answered my high demands with a smile.
To The Scientific Group and Edwards Lifesciences who kindly donated the infant bypass oxygenators and the PreSep venous catheters which were used in the in-vitro calibration phase of the project.
Finally, to my parents Colin and Sharon, my sister Claire, and my friends Stefan, Anja and Charl, all of which supported me through the thick and thin and who knew when to give me a kick for motivation when the times called for it, Thank you!
Stellenbosch University http://scholar.sun.ac.za
Pag
e v
CONTENTS
DECLARATION ................................................................................................... I
ABSTRACT ........................................................................................................ II
OPSOMMING .................................................................................................. III
ACKNOWLEDGEMENTS ................................................................................... IV
CONTENTS ....................................................................................................... V
LIST OF FIGURES.............................................................................................. IX
LIST OF TABLES .............................................................................................. XII
LIST OF EQUATIONS ....................................................................................... XII
NOMENCLATURE .......................................................................................... XIV
FIGURE 4: STRUCTURE OF HAEMOGLOBIN (FRESENIUS MEDICAL CARE, 2009) ........................ 8
FIGURE 5: COMMON PULSE OXIMETER LAYOUT, WHERE Λ1 AND Λ2 ARE THE RED AND INFRARED
LIGHT WAVELENGTHS BEING SHONE THROUGH THE FINGER ......................................... 14
FIGURE 6: ABSORPTION COEFFICIENTS OF HB AND HBO2 (TISDALL, 2009) ............................ 15
FIGURE 7: LIGHT ABSORPTION BY TISSUE COMPONENTS (NOT TO SCALE) ............................. 15
FIGURE 8: EXTINCTION COEFFICIENTS OF WATER AND LIPIDS (PORK FAT); TAKEN FROM (COPE, 1991) ............................................................................................................. 17
FIGURE 9: NEAR INFRARED SPECIFIC EXTINCTION COEFFICIENT SPECTRA OF HAEMOGLOBIN
DERIVATIVES OCCURRING IN-VIVO, TAKEN FROM (COPE, 1991) .................................. 17
FIGURE 10: LIGHT PATH THROUGH FINGER TISSUE AND THE RESPIRATION-INDUCED VENOUS
PULSES EFFECT ON THE PPG. IMAGE ADAPTED FROM (LI, 2010) ................................. 18
FIGURE 11: RED/INFRARED MODULATION RATIO (R) VERSUS SAO2, ORIGINAL IMAGE FROM
FIGURE 47: THE DATA CORRELATION BETWEEN MULTIPLE TESTS TO DETERMINE THE R CURVE FOR
A 735NM/940NM COMBINATION ........................................................................ 70
FIGURE 48: CORRELATION OF R CURVES FOR THE REFLECTANCE PHOTODIODE (HCT: 16%) ...... 71
Stellenbosch University http://scholar.sun.ac.za
Pag
e xi
FIGURE 49: CORRELATION OF R CURVES AT LOW MIXED OXYGEN SATURATION (HCT: 23%) ...... 71
FIGURE 50: CORRELATION OF R CURVES AT FIXED SAO2 WITH VARIED SVO2 (HCTA: 15%; HCTV: 18%) .............................................................................................................. 72
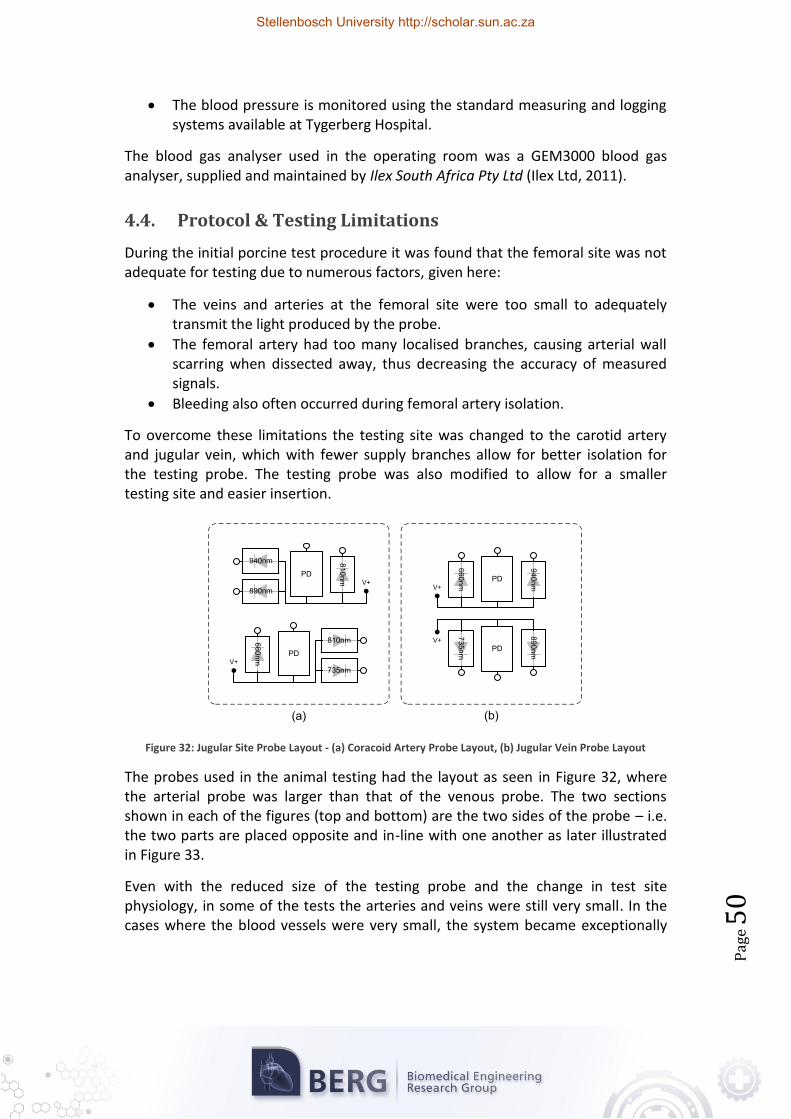
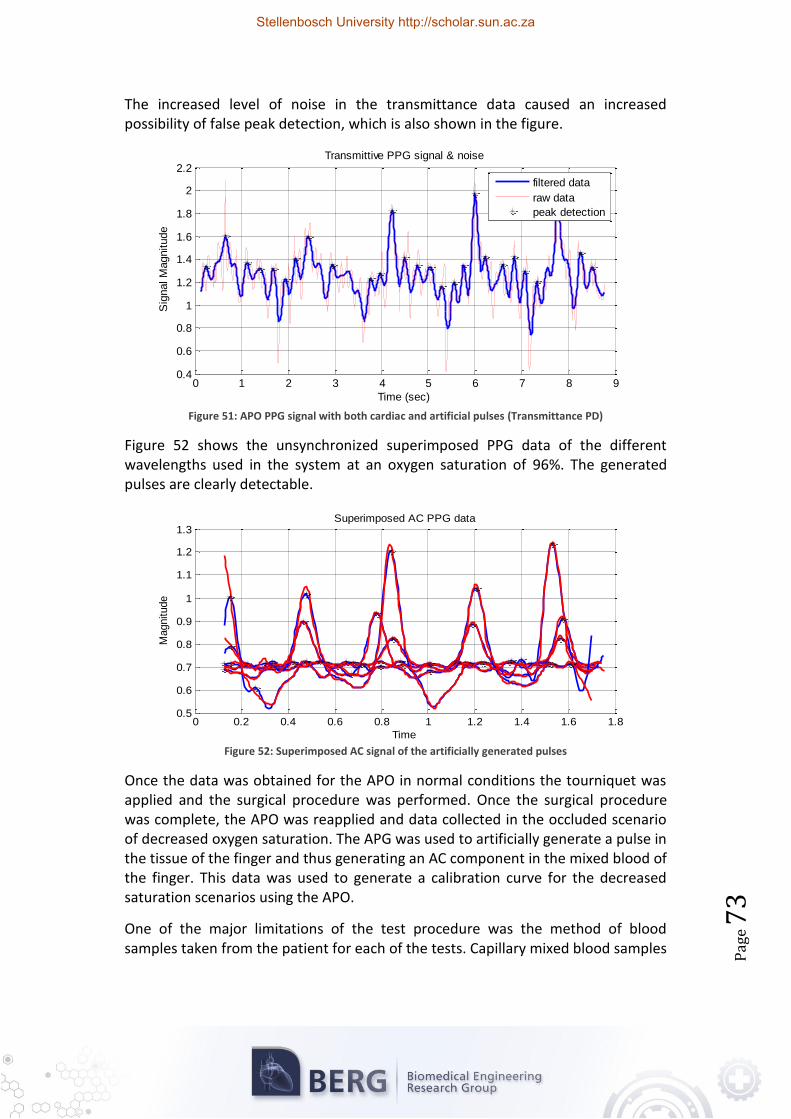
FIGURE 51: APO PPG SIGNAL WITH BOTH CARDIAC AND ARTIFICIAL PULSES (TRANSMITTANCE PD) ...................................................................................................................... 73
FIGURE 52: SUPERIMPOSED AC SIGNAL OF THE ARTIFICIALLY GENERATED PULSES.................... 73
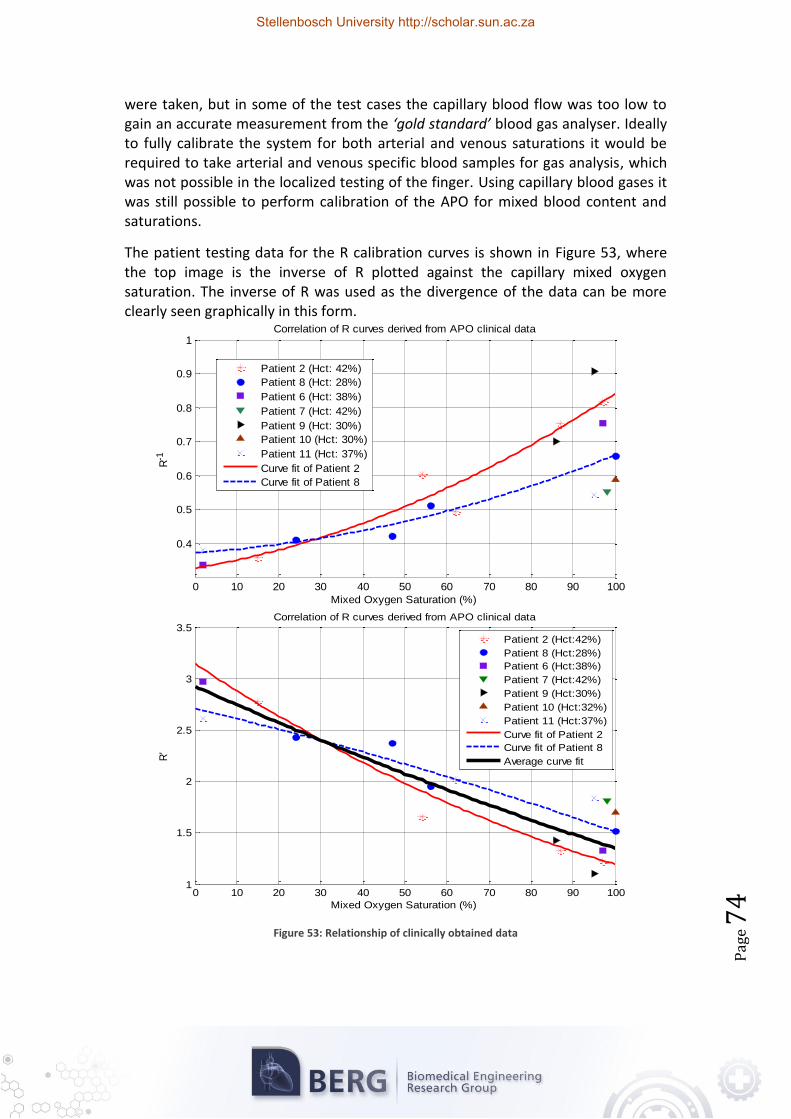
FIGURE 53: RELATIONSHIP OF CLINICALLY OBTAINED DATA ................................................. 74
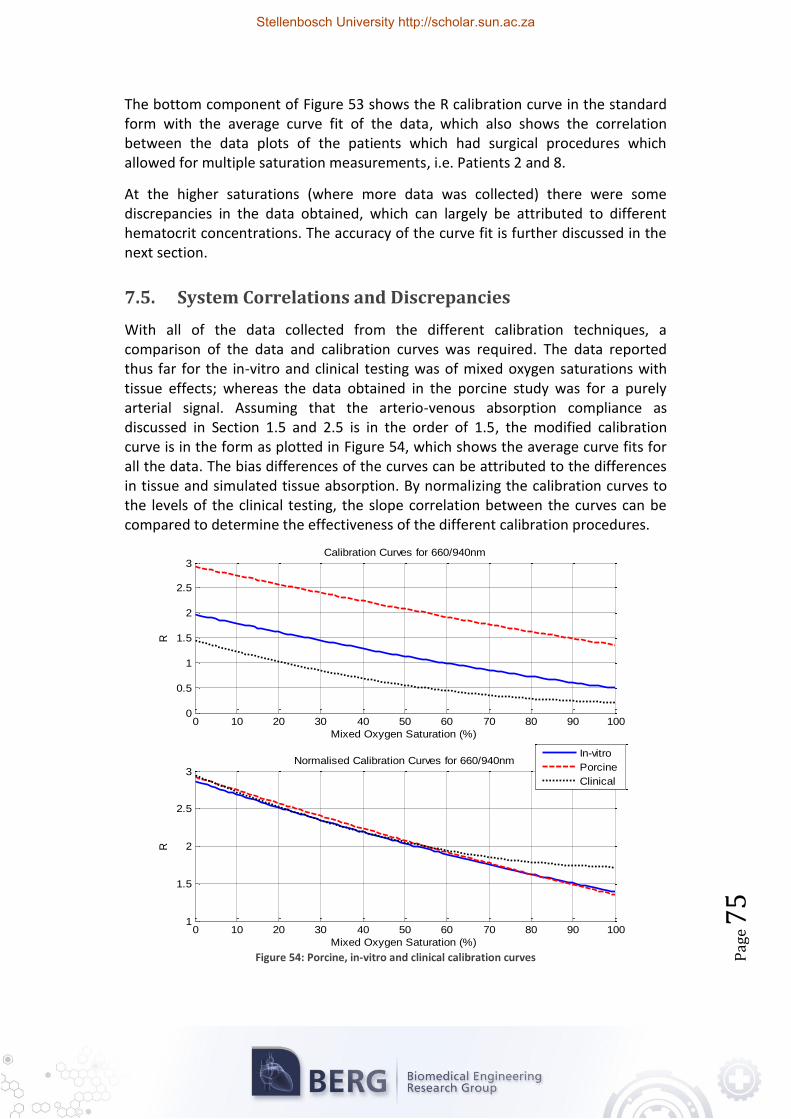
FIGURE 54: PORCINE, IN-VITRO AND CLINICAL CALIBRATION CURVES .................................... 75
FIGURE 55: ARDUINO MEGA 2560 SCHEMATIC (ARDUINO, 2010) - PART 1 ....................... A-1
FIGURE 56: ARDUINO MEGA 2560 SCHEMATIC (ARDUINO, 2010) - PART 2 ....................... A-2
FIGURE 57: A REVERSE-BIASED PHOTO DIODE AND TRANSIMPEDANCE AMPLIFIER ................... A-1
TABLE 5: TRACHEOTOMY PROCEDURE (THE TITI TUDORANCEA LEARNING CENTER, 2010; LUMRIX.NET, N.D.) ........................................................................................... 48
TABLE 6: LED OPTICAL CHARACTERISTICS ...................................................................... B-1
TABLE 7: MODEL 1132 RESPIRATION TRANSDUCER SPECIFICATIONS.................................... B-1
TABLE 8: LILLIPUT D902 TECHNICAL FEATURES .............................................................. B-2
This chapter discusses the clinical need for blood oxygenation monitoring with respect to vital sign monitoring, and introduces the monitoring techniques which can be used to solve the current shortcomings of blood oxygen saturation monitoring. In addition to discussing the motivation, overviews of both the clinical and medical science backgrounds are given, as these are directly related to the hypothesis of the thesis.
1.1. Objectives
The objective of this thesis is to perform a study into the possible methods to accurately determine blood oxygen saturation in human beings. The main method under consideration is Near-Infrared Spectroscopy (NIRS).
Occluded tissue which is sampled by conventional NIRS methods lacks an Alernating Current (AC) component created by pulsating arterial blood. This causes some difficulties due to making use of Aoyaki’s ratio of ratios (Severinghaus, 2007; Aoyagi, 2003) which requires both AC and Direct Current (DC) components to be prevalent in photoplethysmograph (PPG) signals. A method to overcome these shortcomings is required.
The sensor is required to be highly sensitive over a wide range of saturation levels, as a possible application of the device would be for the use in monitoring tissue infected with diseases such as Meningococcemia .
Meningococcemia (Milonovich, 2007; Kirsch et al., 1996; Dippenaar et al., 2006) is the presence of meningococcus in the blood stream and can be one of the most rapidly fatal infectious diseases, and commonly causes inflammation of the blood vessels (vasculitis). This damage of the blood vessels can cause leaking under the skin, as well as clotting within the vessels which can cause occlusion within the tissue (Lutwick, 2006), and consequently a decrease in tissue perfusion and oxygen saturation.
The device must adhere to all applicable safety requirements. Furthermore, the device should not in any way hinder the healing process or cause damage to the site where it is applied.
It is required that the prototype developed in this thesis be fully tested both experimentally and clinically, to verify the results potential clinical usefulness of the device.
Stellenbosch University http://scholar.sun.ac.za
Pag
e 2
The following is a list of objectives which will be critical to the success of the thesis: 1. The design and manufacture of a highly sensitive blood oxygen saturation
sensor that is capable of non-invasively measuring saturation values in occluded peripheral tissues.
2. In vitro data collection using the designed system in a laboratory setup in conjunction with a tissue simulator.
3. Porcine calibration of the device and data collection during the initial testing stage.
4. In vivo data collection with the prototype in a clinical setup. Volunteers will be selected from patients receiving elective surgery.
5. The interpretation of the in vitro and in vivo data collected, using a haema-tology system.
6. The calibration of the prototype using the interpreted data and reference saturation values provided by the haematology system.
7. Statistical analysis of the calibrated prototype to determine viability of the concept in a clinical setting.
The ulitmate outcome of the study is a complete system that can be used to monitor the oxygen saturations in a localised area, such as a person's fingertip.
1.2. Clinical Motivation
The monitoring of patients in the healthcare system has become a top priority to ensure efficient and competent treatment. There are numerous devices which are used in a clinical setting for monitoring and evaluating the health of patients, such as electrocardiograms (ECG), endoscopes, ultrasound scans and blood pressure monitors to name but a few of the most common devices. These devices are used to monitor patient health as well as to aid in the diagnosis of patient ailments.
An important clinical technique is the monitoring of oxygen saturation in living tissue, which can be performed through non-invasive, in-vivo examination of the tissue, and is of interest in many areas of medicine and physiology (Cope, 1991). The Pulse Oximeter (PO) is an example of the aforementioned monitoring technique and is commonly used to measure the oxygen saturation in blood and the changes of blood volume flowing through the tissue. One of its chief uses is in determining the effectiveness of and the need for supplemental oxygen.
There are also many drawbacks in the pulse oximetry devices that are currently implemented. Consequently, a need has been expressed for the development of a more accurate device which can be used to continuously monitor oxygen saturation in limbs which have been affected by diseases and conditions which may cause a decline in tissue functionality (Fourie, 2008; Muller, 2011; Dippenaar et al., 2006).
The potential advantages of the prototype system proposed in this study will include an improved understanding of NIRS at low perfusion and saturation
Stellenbosch University http://scholar.sun.ac.za
Pag
e 3
scenarios, which can lead to better calibrated pulse oximeters with fewer limitations.
1.3. Medical Science Background
This section is included to provide the necessary general medical background into the physiology of the human body and the characteristics that are observed and measured to determine the health of a patient – these parameters include the vital signs and how they affect and are affected by the physiological features measured in pulse oximetry.
1.3.1. Vital Signs
The vital signs are measurements of various physiological characteristics to determine and assess the most basic body functions. The four primary vital signs which are standard in most medical settings are body temperature, heart rate (pulse rate), blood pressure, and respiratory rate – each of which can play a role in signals measured by an oximeter.
Electrocardiogram (ECG)
The ECG measures the electrical activity of the heart by measuring the transmitted electrical signals on the skin surface of the patient. The ECG is a commonly used diagnostic tool which can convey the current status and cardiac function of the heart. The first published evidence of a human electrocardiogram was in 1887 by Augustus D. Waller of St Mary’s Medical School, London who made use of a capillary electrometer developed by Thomas Goswell in their laboratory (Waller, 1887; Jenkins, 2009).
Modern day ECGs vary in complexity and can consist of between two and twelve differential electrode pairs known as ‘leads’. Different lead combinations are used to measure different heart activities. A common form of a 12-lead ECG electrode system is shown in Figure 1 (left).
One of the base features of an ECG signal is the derivation of the heart rate, indicated as the R-R Interval illustrated in Figure 1 (right) – which in its simplest form can be described as the heart periodically pumping blood through the body and in turn causing the physical expansion and contraction of the arteries.
Blood Pressure
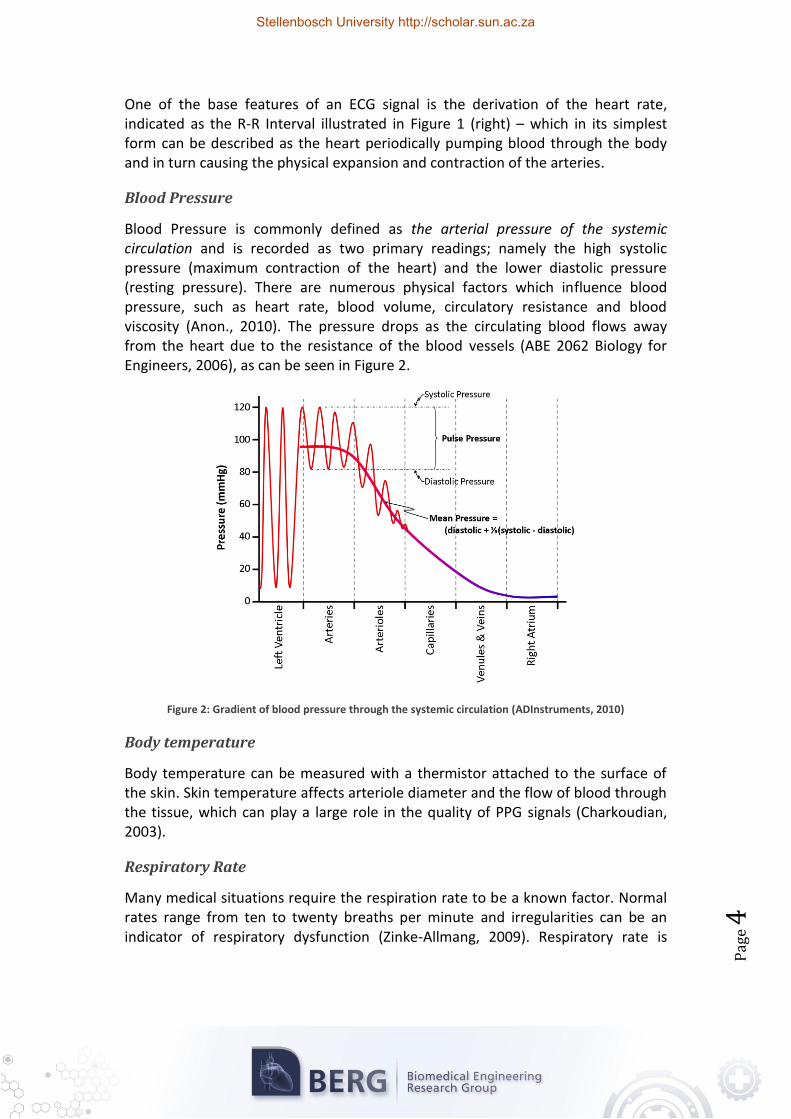
Blood Pressure is commonly defined as the arterial pressure of the systemic circulation and is recorded as two primary readings; namely the high systolic pressure (maximum contraction of the heart) and the lower diastolic pressure (resting pressure). There are numerous physical factors which influence blood pressure, such as heart rate, blood volume, circulatory resistance and blood viscosity (Anon., 2010). The pressure drops as the circulating blood flows away from the heart due to the resistance of the blood vessels (ABE 2062 Biology for Engineers, 2006), as can be seen in Figure 2.
Figure 2: Gradient of blood pressure through the systemic circulation (ADInstruments, 2010)
Body temperature
Body temperature can be measured with a thermistor attached to the surface of the skin. Skin temperature affects arteriole diameter and the flow of blood through the tissue, which can play a large role in the quality of PPG signals (Charkoudian, 2003).
Respiratory Rate
Many medical situations require the respiration rate to be a known factor. Normal rates range from ten to twenty breaths per minute and irregularities can be an indicator of respiratory dysfunction (Zinke-Allmang, 2009). Respiratory rate is
Stellenbosch University http://scholar.sun.ac.za
Pag
e 5
measured using a variety of techniques, such as making use of ECG signal timing, electronic stethoscopes and piezoelectric respiration transducers.
Oxygen Saturation
Beyond the primary four vital signs; pain, pupil size and oxygen saturation (Mower et al., 1997; Mower et al., 1998; Neff, 1988) have been proposed as possible fifth vital signs. None have been officially accepted as their importances vary depending on the medical discipline involved. Numerous Emergancy Medical Services EMS agencies in the United States use Oxygen Saturation (SO2) as a vital sign (Curran, 2009).
SO2 is the relative amount of oxygen carried by the haemoglobin in the erythrocytes of the blood. Oxygen Saturation can be measured with a pulse oximeter which is based on the spectrophotometric measurement of the change in the colour of blood - deoxygenated blood has a blue colour, whereas fully oxygenated blood is a bright red colour. Due to these differences a commonly used pulse oximeter makes use of two wavelengths of light to measure the differences in light absorption and determine the oxygen saturation of the blood (Enderle et al., 2005). This technique is discussed in further detail in Chapter 2.
Oxygen saturation can also be used as an indication of the efficiency of the respiratory system (Bye et al., 1983).
1.3.2. Effect of Clinical Anatomy
Pulse oximeters have become a commonly used medical device; however the PPG signal is rarely displayed and in most cases is only used to determine the heart rate. PPG signals can be obtained in two ways – 1) transitive absorption i.e. light being shone through the finger; and 2) reflective absorption which is the case when a probe is placed on the forehead or other appendage.
In cases where a patient may be suffering from hypothermia or shock, the blood flow to the periphery can be drastically reduced – causing weak signal quality in PO data, so commonly used secondary sites for pulse oximeter probe placement include the forehead, ear lobe, nasal septum and lower lip. Other mounting sites include the vagina and oesophagus.
Figure 3 illustrates the circulatory system of the hand, and more specifically the fingers. When a pulse oximeter probe is placed over the forefinger the resulting PPG signal is obtained from the blood being pumped through the arteries supplying the finger and passing through the capillaries and out through the veins.
Stellenbosch University http://scholar.sun.ac.za
Pag
e 6
Figure 3: (Left) The veins on the dorsum of the hand (Right) The radial and ulnar arteries (Gray, 2000)
One of the principle reasons for using the finger as a pulse oximeter site is the ease of mounting a probe on site with a relatively small chance of alignment error on the PPG signal.
One of the chief functions of the cardiopulmonary and cardiovascular systems is the efficient regulation of oxygen absorption into tissue. Cellular damage can occur if the tissue is deprived of sufficient amounts of oxygen for an extended period of time. The oxygen content of blood is thus a good indication of the efficiency of the cardiopulmonary and cardiovascular functions.
1.3.3. Haemoglobin and “RED” Blood Cells
Non-invasive optical monitoring systems such as pulse oximeters monitor the changes in the optical attenuation caused by chromophores in the blood. One such chromophore is haemoglobin, which has the greatest impact on pulse oximeter readings (Cope, 1991). According to Martini and Bartholomew (2007) oxygen is transported through the body in two forms, namely bound to haemoglobin found in red blood cells (98.5% of blood’s oxygen content) and the rest is transported as a solute in blood plasma. As such, it can be assumed that the oxygen content of the RBCs is a good representation of the overall blood oxygen content. Once the haemoglobin has transported oxygen from the lungs to the required tissues, it then transports carbon dioxide away from the cells back to the lungs to be exhaled.
Stellenbosch University http://scholar.sun.ac.za
Pag
e 7
Oxygen physically binds to haemoglobin in a ratio of 4:1, i.e. four molecules of oxygen can bind to one molecule of deoxygenated haemoglobin (Hb) to form a single molecule of oxygenated haemoglobin (HbO2). The concentrations of HbO2 vary depending on where it is measured in the system. Arterial blood generally has a high concentration of HbO2 whereas venous blood has a relatively low concentration.
Haemoglobin oxygen saturation (SO2) is expressed as a percentage of the total haemoglobin which has been bonded to oxygen and can be expressed as shown in Equation 1.
(
)
Equation 1: Haemoglobin
Saturation
To determine the relationship between the oxygen saturation and the oxygen partial pressure in the blood, Kokholm (1990) presented Equation 2.
Equation 2:
Relationship between Haemoglobin
Saturation and Oxygen Partial
Pressure (Cope, 1991; Kokholm, 1990)
( )
(
) ( )
( ) ( ) ( )
where is the ‘half saturation point’ for oxygen molecules binding to haemoglobin under the current blood conditions, and is the ‘half saturation point’ at a body temperature of 37°C and a pH of 7.4, which for an adult is usually .
This can be used to calculate oxygen saturation in the blood from blood gas analysis values. It has been found that on average the arterial oxygen saturation (SaO2) is in the order of 94%, and the venous oxygen saturation (SvO2) in the internal jugular vein is approximately 62% (Cope, 1991).
Stellenbosch University http://scholar.sun.ac.za
Pag
e 8
Figure 4: Structure of Haemoglobin (Fresenius Medical Care, 2009)
Besides oxygenated haemoglobin and deoxygenated haemoglobin there are two other types of haemoglobin found in blood, namely methaemoglobin (MetHb) and carboxyhaemoglobin (COHb) (Kamat, 2002) which do not bind oxygen, but can play a role in measured SO2 values. Figure 4 shows an illustrated representation of a haemoglobin cell and the binding points for oxygen (Fresenius Medical Care, 2009).
1.4. The History of Determining Blood and Tissue Oxygenation
The important events which lead to modern day methods of determining blood oxygenation started in 1864 when Sir George G. Stokes discovered that haemo-globin played a role in respiratory function (Breathnach, 1966; Severinghaus & Honda, 1987).
With that discovery the initial attempts to measure the oxygen saturation of blood was made by a physiologist Karl von Vierordt in the mid-1870’s in Tübingen, Germany. His initial methods included trying to measure the changes in the amount of red light transmitted through a human limb while the blood flow was regulated with a Tourniquet (Cohn, 2006). Kurt Kramer used the same principles in the 1930’s by proving that the oxygen saturation of exposed canine arteries can be measured to an accuracy of 1% (Severinghaus, 2002).
Comparatively, in the late 1890’s Walter H. Nernst, from Gottingen, Germany reported that the current induced between platinum and silver electrodes immersed in blood is directly related to the dissolved oxygen pressure in the fluid. However, platinum absorption of proteins caused distortions in the results.
In 1898 Halden, an English physiologist proposed that oxygen could be chemically expelled from its bonds with the haemoglobin, which was developed by J. Barcrodt
Stellenbosch University http://scholar.sun.ac.za
Pag
e 9
who then used this principle to determine the gas composition of blood (Zislin & Christyakov, 2006).
The same principles used by Halden and Barcroft were then also adopted by D. Van Slyke in 1922, who combined the vacuum and chemical principles to develop his manometric apparatus (Zislin & Christyakov, 2006).
The need for pulse oximetry development intensified during World War II (1940s) as pilots began to fly at ever higher altitudes without pressurised cabins (Mendelson, 1992).
The first ‘oximeter’ as it is currently known was produced by Glen Milliken in 1942 to measure the saturation in tissues non-invasively. Karl Matthes (1935), a physician, developed the principles used by Milliken, whereby two different coloured lights are used to compensate for the amount of light absorbed by tissues. Milliken’s device was very sensitive to the effects of skin pigmentation, the thickness of the limbs and the blood volume passing through the limb, and thus calibrations were required for every measurement (Severinghaus, 2002).
Other landmark events which occurred in 1942 include E. Goldie compressing the earlobe to obtain a ‘bloodless’ reference for pulse oximeter readings, and the first development of light reflectance oximetry (Zislin & Christyakov, 2006).
Leland C. Clark then developed the ‘Clark Electrode’ in 1954 which was used to measure the dissolved oxygen pressure by logging the consumption of oxygen which diffuses through a semi-permeable membrane to a noble metal electrode. The rate of oxygen consumption was discovered to be proportional to the rate of diffusion and hence it can be related to the dissolved partial oxygen pressure. One of the most important non-invasive methods in measuring the dissolved oxygen pressure in neonates is a derivative of the Clark Electrode called the ‘Transcutaneous Clark Electrode’ which measures the blood oxygen saturation in the tissue of the forehead (Templer, 1984). This device was developed by D. Lubbers in 1972.
The clinical feasibility of oximetry improved when Hewlett Packard developed a commercially available ear oximeter that heated the tissue to 41°C to increase the local cutaneous blood flow.
Conventional Pulse Oximetry was discovered by Takuo Aoyaki, a bio-engineer from the Nihon Kohden Company; a medical device production company in 1974. Aoyaki discovered that the output signal from a normal oximeter consisted of two components, namely, the DC and AC components (Goldman et al., 2000). The DC component was due to the constant light absorption of skin, bone, venous blood, etc. In turn, the AC component is due to the volumetric changes in the arterial blood caused by the contractions of the heart. Aoyaki used the ratio between the AC and DC components at two separate wavelengths of light, one being red light
Stellenbosch University http://scholar.sun.ac.za
Pag
e 1
0
and the other infrared light. These ratios are in turn used to develop an ‘R’ value which is related to the oxygen saturation.
The calculation of R is shown in the following equation:
⁄
⁄
Equation 3: Red to Infrared
Ratio (Goldman et al., 2000)
The first prototype using Aoyaki’s principles was developed and tested by Dr William New, a Stanford anaesthesiologist in 1978 (Severinghaus, 2002). It is the prototype on which most current forms of pulse oximeters are based. The device wasn’t adopted widely in the United States until the mid-1980s when oximeters became cheaper, smaller and easier to apply.
By 1995 oximeters became small enough to be placed on a finger, which is now the common standard.
Masimo introduced Signal Extraction Technology (SET) in 1995, which improved measurement accuracy by filtering out motion artefacts from the signal and considering low perfusion scenarios, which increased the possible applications of oximetry for portable and in-home screening (Goldman et al., 2000).
In 2009, with the development of Bluetooth and Wireless technologies, the first Bluetooth-enabled fingertip pulse oximeter was commercialised by Nonin Medical, allowing clinicians to remotely monitor patients (NONIN, 2009).
1.5. Prominent SO2 Monitoring Techniques
To be able to accurately identify the best method or technique to meet the needs of the problem statement set forth for this thesis, all currently employed methods of saturation and blood gas monitoring methods need to be considered and evaluated on their merits. Monitoring techniques can be divided into two broad classifications, namely non-invasive and invasive techniques. This thesis is primarily concerned with non-invasive techniques, since the clinical need in the South African setting is for monitoring neonates and children, where invasive monitoring is often not feasible (Dippenaar & Schoevers, 2008).
This section outlines a brief overview of SO2 and perfusion monitoring techniques.
1.5.1. Near-Infrared Spectroscopy
In medicine Near-Infrared Spectroscopy (NIRS) is a spectroscopic (optical) method of using the near-infrared electromagnetic spectrum (650 nm to 2500 nm) to perform medical diagnostics. Medical applications of NIRS include oximetry, blood sugar analysis, assessment of brain function and measuring cerebral blood flow.
Stellenbosch University http://scholar.sun.ac.za
Pag
e 1
1
Beer-Lambert’s law (discussed in Section 2.2) is a basis for NIRS and states that light absorption in an absorbing medium is related to the concentration of the absorbing compound in the medium, the absorption coefficients of the medium and the optical path-length through the medium (Elwell & Hebden, 2000).
NIRS devices make use of a light source and a detector to measure the intensity of different wavelengths passed through the medium such as tissue and blood. In the case of Oximetry, NIRS is used to determine the oxygen concentration of haemo-globin by considering the absorption of water, lipids, melanin, oxygenated haemoglobin, deoxygenated haemoglobin and cytochrome oxidase in the blood and tissue (Hollis, 2002).
This technique has become commonly used in emergency medicine as it is non-invasive, painless and makes use of non-ionising radiation.
1.5.2. Pulse Oximetry
Pulse Oximetry can be used to non-invasively measure SO2 levels. It has become extensively used in general monitoring and modern ICUs where pulse oximeters are commonly mounted on thin parts of the body such as a fingertip or ear lobe.
Conventional Pulse Oximetry makes use of two wavelengths of light which are specifically chosen for system performance and the absorption characteristics of Hb and HbO2 (Rusch et al., 1996). The two wavelengths are shone periodically on the tissue of interest and a photodiode detects the light that is either transmitted or reflected by the tissue. Due to the pulsatile nature of arterial blood, the light detected also has an alternating intensity level which can be used to determine the arterial oxygen saturation. Pulse Oximetry is explored in more detail in Chapter 2.
1.5.3. Transcutaneous Clark Electrode
Transcutaneous oxygenation (PtcO2) is measured by placing an oxygen-sensitive electrode on the skin’s surface whereby the sensor can non-invasively measure the skin’s partial oxygen pressure (pO2). The electrode is similar to that used in blood gas analysis machines, specifically the Clark polarographic PO2 electrode, which is used to measure the partial pressure of oxygen in a blood sample (Templer, 1984).
The Clark electrode consists of a platinum cathode and silver anode immersed in an electrolytic potassium chloride solution. The electrodes are connected to an external bias source and the electrolyte is separated from the blood sample by means of an O2-permeable membrane.
The pO2 is measured by the oxidation/reduction (redox.) reaction which occurs at the cathode, namely:
Equation 4: pO2
redox. reaction
Stellenbosch University http://scholar.sun.ac.za
Pag
e 1
2
The flow of electrons from the anode to the cathode is directly proportional to the rate of O2 reduced at the cathode and in turn the concentration of O2 in the electrolytic solution. Small heating coils heat the skin to improve the response rate of the sensor. As such the Transcutaneous Clark Electrode can be used to non-invasively measure the pO2 through the skin.
1.5.4. Blood-Oxygen-Level Dependent Magnetic Resonance Imaging (BOLD MRI)
Functional magnetic resonance imaging (fMRI) is a specialised form of MRI used to measure brain activity by measuring the haemodynamic response of the brain. The MRI contrast of Hb is known as the blood oxygen level dependant (BOLD) effect whereby a change in the regional O2 content is used to measure the changes in neural activity.
To determine the regional O2 content, the magnetic resonance (MR) of HbO2
(diamagnetic) and Hb (paramagnetic) is measured (Enderle et al., 2005). BOLD MRI readings are measured as the percentage change in activity measured before and after task initiation and are thus the change in oxygen requirements for the neural activity.
In a previous thesis, Schoevers (2008) developed an ‘Artificial-Pulse Oximeter (APO)’ which made use of a pneumatic cuff to artificially induce a pulse in the tissue and compared the use of a 660/910 nm LED pair to that of a 740/880 nm LED pair sensor to accurately measure both high and low saturation in low perfusion scenarios. It was found that the 660/910 nm sensor performed more accurately at high saturations in comparison to the 740/880 nm sensor, which proved to be better for low saturation scenarios. The study’s results were not conclusive but they indicated that the concept is viable and hypothesised an arterio-venous compliance which stated that the overall absorption of two volumes of blood with differing saturations would be a linear combination of the individual saturation values (not to be confused with physiological arterial and venous compliance whereby blood vessels tend to stretch in response to pressure). This concept is further discussed in Section 2.5.
1.6. Chapter Summary
Clinically, there are often patients suffering with peripheral vascular inflictions where low peripheral saturation and low perfusion conditions affect the tissue (such as tissue ischemia). Clinicians need to be able to properly assess the function of affected tissue by evaluating the O2 supply and demand through non-invasive and continuous monitoring (Schoevers, 2008). The success of a treatment method employed is often evaluated by visual inspection of the treated tissue, as many of the current monitoring techniques have proven to be ineffective.
Stellenbosch University http://scholar.sun.ac.za
Pag
e 1
3
Invasive blood gas analysis is unreliable due to advanced coagulation in the tissue, the transcutaneous Clark electrode is dependent on tissue perfusion, BOLD MRIs are limited due to their cost and intermittence, conventional pulse oximeters require pulsatile blood behaviour, and traditional NIRS systems are generally costly and not readily available in low-income hospital and tertiary care facilities. Additionally it has been postulated that venous oxygenation may be an important indicator of the quality of infected tissue. Consequently there is a need for a device which can overcome these limitations which, in theory, can be achieved by the device proposed by Schoevers with some modifications.
Stellenbosch University http://scholar.sun.ac.za
Pag
e 1
4
CHAPTER 2: PULSE OXIMETRY: AN OVERVIEW
This chapter presents a general overview of pulse oximetry and the scientific principles behind it, including a look at some of the limitations faced by conven-tional pulse oximeters and other possible uses of pulse oximetry.
2.1. Operating Basics
Pulse Oximetry is a non-invasive method of saturation monitoring and is based on two physical properties (Kamat, 2002):
1. the light absorbance of Oxygenated Haemoglobin is different to that of Reduced Haemoglobin at different wavelengths of light, namely red and infrared light used in conventional oximeters.
2. the absorbance of both wavelengths has a pulsatile component which is due to the fluctuations in the volume in arterial blood.
Oxygen saturation (SO2) is therefore determined by monitoring the distinctive light absorption behaviour of the tissue with respect to the pulsatile component of the arterial blood flowing through the vascular bed.
2.2. Oximetry Principles of Light Absorption in Tissue
Oximetry as discussed earlier relies on the difference in absorption coefficients at different wavelengths of light of the different chromophores present in tissue, chief among them being haemoglobin (Hb) and oxygenated haemoglobin (HbO2).
Figure 5: Common Pulse Oximeter layout, where λ1 and λ2 are the red and infrared light wavelengths being shone through the finger
A conventional pulse oximeter (Figure 5) uses two wavelengths of light (emitted from photo-emitters) which are sequentially shone through the tissue area under consideration and the incident light is measured by means of a photo detector
Stellenbosch University http://scholar.sun.ac.za
Pag
e 1
5
(such as a photodiode) which produces an output signal to be analysed. The measurement is conventionally performed at two specific wavelengths chosen for their absorption characteristics (Figure 6): a red wavelength, λ1 (± 660 nm), where there is a large difference in light absorption between Hb and HbO2; and a near infra-red wavelength, λ2 (± 940 nm), where the absorption of Hb is slightly less than that of HbO2.
Figure 6: Absorption coefficients of Hb and HbO2 (Tisdall, 2009)
The output signal measured by the photo-detector is in the form of a photoplethysmograph (PPG), as shown in Figure 7. The time dependence of the light absorption in a vascular bed, as well as the proportion of light absorption due to different components of tissue, can be seen.
Figure 7: Light Absorption by Tissue Components (Not to scale)
Stellenbosch University http://scholar.sun.ac.za
Pag
e 1
6
Shelly (2007) suggested that it is more useful to consider the oximeter waveform as measuring the change in blood volume and more specifically the path length in the area being monitored.
Processing of the photoplethysmographic signal is based on Beer-Lambert's law, which relates the intensity of transmitted light (It) to the intensity of incident light (Io) through the relationship where α is the wavelength dependent extinction coefficient of the sample, d is the path length that light follows through the sample (usually not a straight line) and c is the concentration of the sample. Derivatives of Beer-Lambert's law are used to relate light transmittance to the blood oxygen saturation.
Equation 5: Beer-Lambert
Law (simplified)
Equation 5 is true for a single absorbing species and a non-scattering medium. Beer-Lamberts Law can also be expressed as Equation 6 which is modified for multiple absorbing compounds (Elwell & Hebden, 2000):
[ ] [ ]
Equation 6: Beer-Lambert
Law
where: at a given Wavelength
The αxcx product is also called the absorption coefficient of an absorbing compound. However, when a high scattering medium is considered, the Beer-Lambert law can be further modified to include firstly a constant, G, which is attributed to scattering losses and secondly a multiplier which accounts for the increased optical path length due to scattering, where the Differential Path-length (DP) is the true optical distance; and the Differential Path-length Factor (DPF) is the scaling factor. As such, the Modified Beer-Lambert Law, which incorporates these two additions, is expressed as:
[ ]
Equation 7: Modified Beer-Lamberts Law
Unfortunately G is an unknown factor and is approximately equal for all attenuations, but as such the equation can be reconfigured as a ‘difference’ equation:
( ) ( ) Equation 8:
Modified Beer-Lambert Law 2
The determination of DPF will require use of a time of flight method, and will vary with different tissue types as well as extremity thicknesses.
Stellenbosch University http://scholar.sun.ac.za
Pag
e 1
7
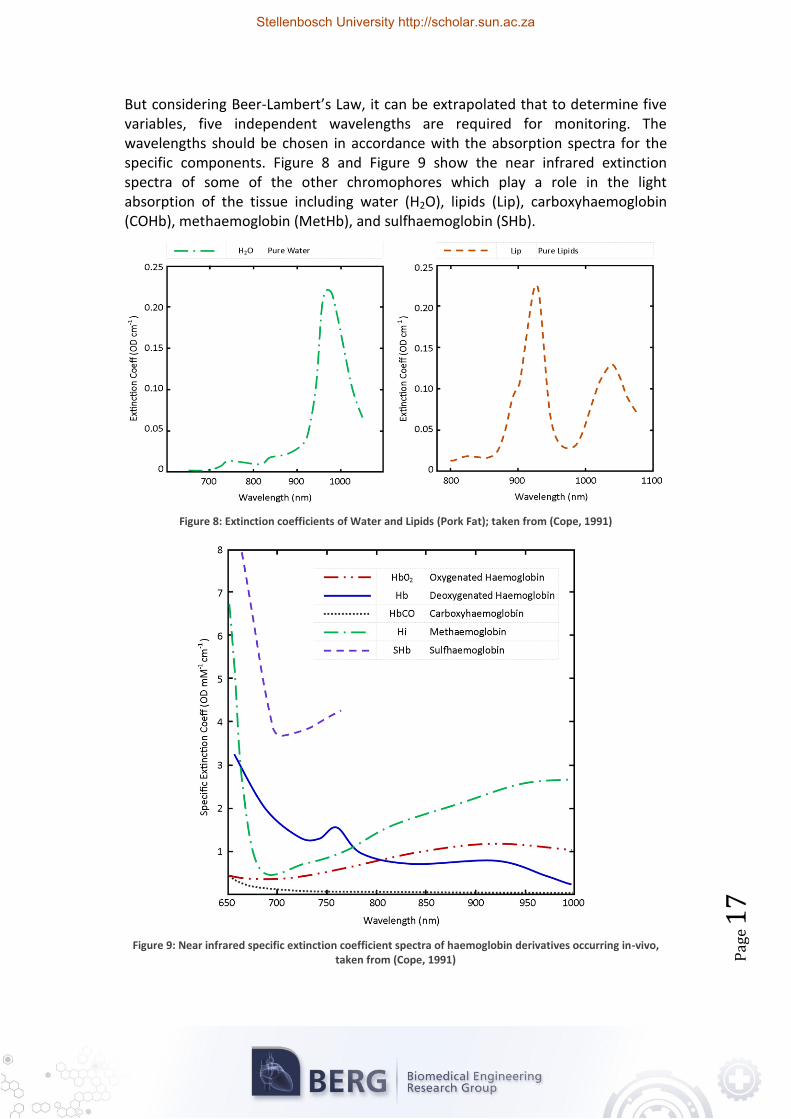
But considering Beer-Lambert’s Law, it can be extrapolated that to determine five variables, five independent wavelengths are required for monitoring. The wavelengths should be chosen in accordance with the absorption spectra for the specific components. Figure 8 and Figure 9 show the near infrared extinction spectra of some of the other chromophores which play a role in the light absorption of the tissue including water (H2O), lipids (Lip), carboxyhaemoglobin (COHb), methaemoglobin (MetHb), and sulfhaemoglobin (SHb).
Figure 8: Extinction coefficients of Water and Lipids (Pork Fat); taken from (Cope, 1991)
Figure 9: Near infrared specific extinction coefficient spectra of haemoglobin derivatives occurring in-vivo,
taken from (Cope, 1991)
Stellenbosch University http://scholar.sun.ac.za
Pag
e 1
8
The use of Equation 5 and its derivatives in oximetry are very dependent on the correct calibration of the sensor to compensate for differences in skin pigmenta-tion, skin thickness, underlying tissues and blood volume in the vascular bed. As can be seen from Figure 7 and Figure 10, the magnitude of the photoplethysmographic signal is highly dependent on the amount of blood injected into the vascular bed during the contraction of the heart during systole and the other aforementioned factors. This calibration requirement can make the use of pulse oximetry in certain clinical settings ineffective.
Figure 10: Light Path through finger tissue and the Respiration-Induced venous pulses effect on the PPG. Image adapted from (Li, 2010)
Takuo Aoyaki, a bio-engineer from Nihon Kohden (a neurology, monitoring and cardiology company) solved this problem with his ratio of ratios principle, which is used in his pulse oximeter. Dividing the red and infrared photoplethysmographs into their corresponding AC and DC components and mathematically normalising the AC component by dividing it with the DC component, he obtained a ratio for each wavelength that was independent of skin pigmentation, thickness and composition. A normalised red to infrared ratio was found by dividing the red ratio by the infrared ratio. This normalised red to infrared ratio was largely independent of all the factors needing calibration in the normal oximeter, but highly dependent on the concentration of Hb and HbO2 in the arterial blood.
⁄
⁄
Equation 9: Red to Infrared
Ratio
The blood oxygen saturation could thus be directly linked to this ratio. Equation 10 illustrates the relationship between blood oxygen saturation and the normalised red to infrared ratio (Cope, 1991; Zonios et al., 2004) with S(t) being the blood oxygen saturation value and α660,ox the specific absorption coefficient for oxygenated (ox) or deoxygenated (deox) haemoglobin at, respectively, a red (r) or
Stellenbosch University http://scholar.sun.ac.za
Pag
e 1
9
infrared (ir) wavelength of light. R(t) is the normalised red to infrared ratio as explained above.
( ) ( )
( ) ( ) ( )
Equation 10: Determining Saturation
using r-ir Ratio
The advantages of using this system is the relatively simple hardware required for the measurements and the broad base of available knowledge concerning the underlying science. This system, however, has the disadvantage of relying on the presence of a clearly detectable photoplethysmographic signal containing both AC and DC components. In the scope of this thesis, this system would therefore be unable to provide any measurements on its own when taking the occluded nature of the tissue under investigation into account. The absence of an AC component due to the absence of a pulsatile arterial component in the occluded tissue renders this system unusable.
Figure 11: Red/Infrared Modulation Ratio (R) versus SaO2, original image from (Mannheimer, 2007)
Figure 11 (Mannheimer, 2007) illustrates the relationship between SaO2 values and the Red/Infrared Modulation ratio (R) as described in Equation 9 and Equation 10. For high saturations the pulse amplitude of the red signal is less than that of the infrared signal, and at low saturations the inverse is true. To determine the SaO2, a pulse oximeter measures R and then estimates the saturation by applying the calibration curve.
Stellenbosch University http://scholar.sun.ac.za
Pag
e 2
0
2.3. Uses of Pulse Oximetry
With the development of new technologies it has been theorised there are numerous other uses for pulse oximetry. A few of these other possible uses include (Hill & Stoneham, 2000; Frey et al., 2008; Jubran, 2004):
pulse oximeters can be used as a simple, portable all-in-one monitor which can measure oxygenation, pulse rate and rhythm regularity.
critical patients often require a safe, non-invasive monitor of the cardio-respiratory status during general and local anaesthesia, and during post-operative- and intensive-care.
emergency vehicles such as aircraft, helicopters and ambulances generate a lot of noise during the transport of patients, so visible waveforms of saturation may provide a global indication of a patient's cardio-respiratory status.
after plastic and orthopaedic surgery or in cases of soft tissue swelling, the viability and the health of limbs are often called into question; pulse oximetry may be able to provide an indication as to whether there is sufficient blood flow and the tissue health over time.
blood gas analysis is often required in intensive care units as well as in the paediatric divisions; pulse oximetry can reduce the required frequency of measurements especially in cases where vascular access is limited.
in thoracic anaesthesia when a lung has collapsed, pulse oximetry can be used to determine what the functionality of the lung is, and to determine whether increased concentrations of oxygen are required.
theoretically pulse oximetry can be used for the screening of respiratory failure in severe asthmatic cases.
with the addition of artificial pulses at fixed frequency on venous blood components, it is possible to theoretically determine the oxygen content in the venous component which in turn can be used to indicate whether the tissue of a limb is recovering after damage.
deriving blood pressure through photoplethysmograph (PPG) signals and ECG signals.
Beside the above listed possible applications of pulse oximetry which require clinical testing, with the further development of signal analysis and monitoring techniques there is potential of being able to extract other clinical parameters from the PPG signal. Using venous volume pulsations it may be possible to determine the patient respiration rate, venous blood oxygen saturation, and metabolic rate. By making use of the pulse wave characteristics, parameters such as arterial elasticity and pulse wave velocities can be determined. This considered, other parameters such the arterial-venous compliance and patient motion are also attainable.
Stellenbosch University http://scholar.sun.ac.za
Pag
e 2
1
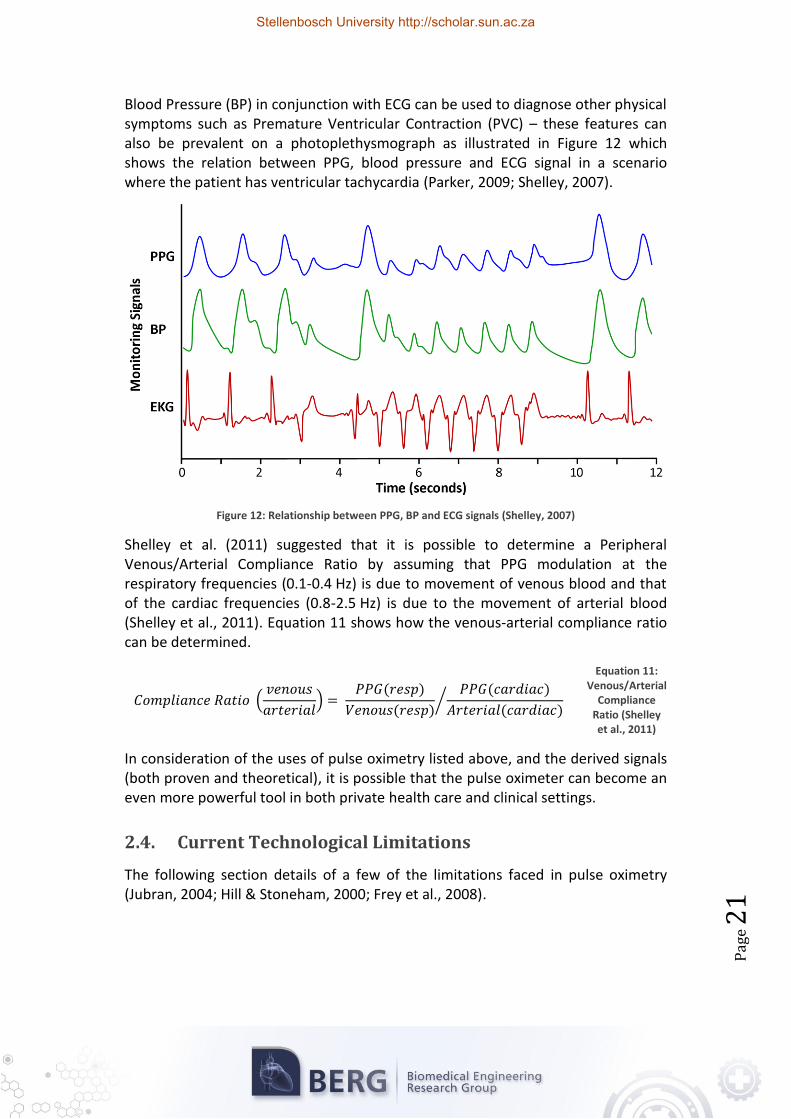
Blood Pressure (BP) in conjunction with ECG can be used to diagnose other physical symptoms such as Premature Ventricular Contraction (PVC) – these features can also be prevalent on a photoplethysmograph as illustrated in Figure 12 which shows the relation between PPG, blood pressure and ECG signal in a scenario where the patient has ventricular tachycardia (Parker, 2009; Shelley, 2007).
Figure 12: Relationship between PPG, BP and ECG signals (Shelley, 2007)
Shelley et al. (2011) suggested that it is possible to determine a Peripheral Venous/Arterial Compliance Ratio by assuming that PPG modulation at the respiratory frequencies (0.1-0.4 Hz) is due to movement of venous blood and that of the cardiac frequencies (0.8-2.5 Hz) is due to the movement of arterial blood (Shelley et al., 2011). Equation 11 shows how the venous-arterial compliance ratio can be determined.
(
)
( )
( )
( )
( )⁄
Equation 11: Venous/Arterial
Compliance Ratio (Shelley et al., 2011)
In consideration of the uses of pulse oximetry listed above, and the derived signals (both proven and theoretical), it is possible that the pulse oximeter can become an even more powerful tool in both private health care and clinical settings.
2.4. Current Technological Limitations
The following section details of a few of the limitations faced in pulse oximetry (Jubran, 2004; Hill & Stoneham, 2000; Frey et al., 2008).
Stellenbosch University http://scholar.sun.ac.za
Pag
e 2
2
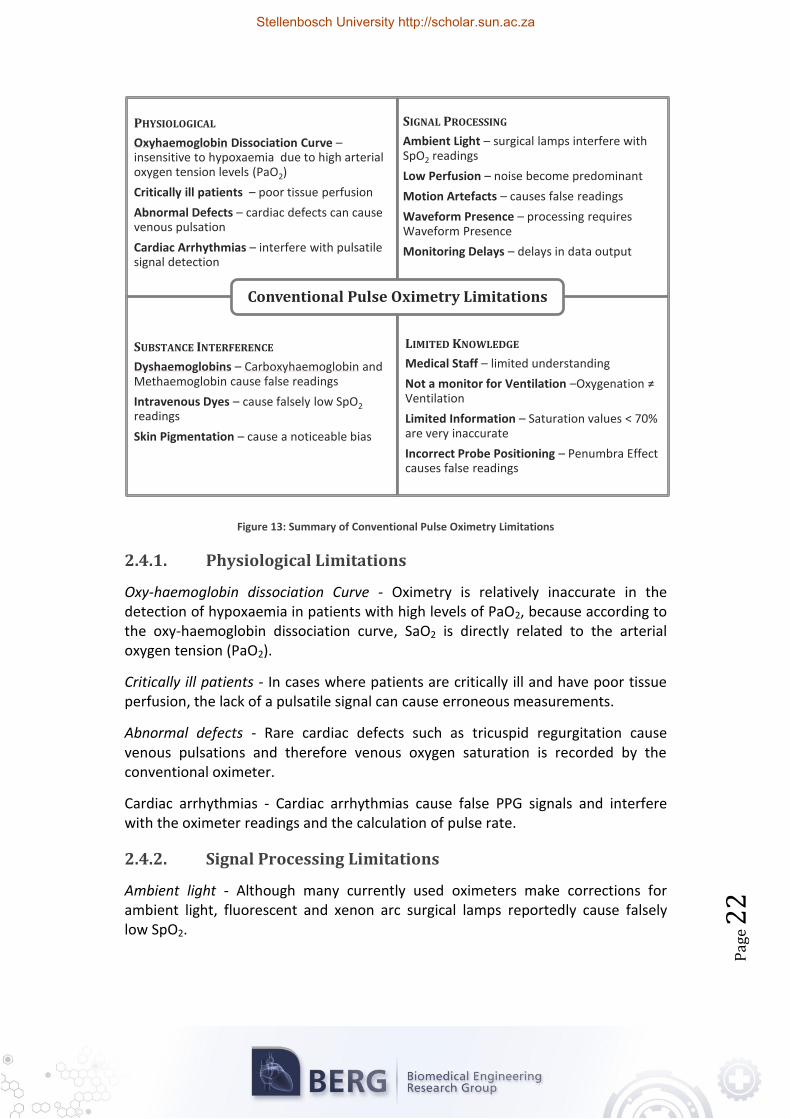
Figure 13: Summary of Conventional Pulse Oximetry Limitations
2.4.1. Physiological Limitations
Oxy-haemoglobin dissociation Curve - Oximetry is relatively inaccurate in the detection of hypoxaemia in patients with high levels of PaO2, because according to the oxy-haemoglobin dissociation curve, SaO2 is directly related to the arterial oxygen tension (PaO2).
Critically ill patients - In cases where patients are critically ill and have poor tissue perfusion, the lack of a pulsatile signal can cause erroneous measurements.
Abnormal defects - Rare cardiac defects such as tricuspid regurgitation cause venous pulsations and therefore venous oxygen saturation is recorded by the conventional oximeter.
Cardiac arrhythmias - Cardiac arrhythmias cause false PPG signals and interfere with the oximeter readings and the calculation of pulse rate.
2.4.2. Signal Processing Limitations
Ambient light - Although many currently used oximeters make corrections for ambient light, fluorescent and xenon arc surgical lamps reportedly cause falsely low SpO2.
PHYSIOLOGICAL
Oxyhaemoglobin Dissociation Curve – insensitive to hypoxaemia due to high arterial oxygen tension levels (PaO2)
Critically ill patients – poor tissue perfusion
Abnormal Defects – cardiac defects can cause venous pulsation
Cardiac Arrhythmias – interfere with pulsatile signal detection
SIGNAL PROCESSING
Ambient Light – surgical lamps interfere with SpO2 readings
Low perfusion - Conventional methods of Pulse Oximetry require satisfactory arterial perfusion of the skin, and thus low cardiac output. Vasoconstrictions and hyperthermia make it difficult to differentiate between true signals and noise.
Motion artefacts - Motion artefacts are a major source of false readings and erroneous alarms. A new approach dubbed 'Signal Extraction Technology' was introduced by the Masimo corporation to extract the true signal from the background noise, thus reducing the errors caused by motion induced noise (further discussed in Section 2.5).
Waveform presence - If there is no waveform visible on a pulse oximeter, any saturation values obtained are meaningless as conventional oximeters require a pulsatile signal.
Monitoring delays - The partial pressure of oxygen could have fallen a great deal before the oxygen saturation starts to fall. Pulse oximeters will only warn of a potentially fatal complication several minutes after it has occurred.
2.4.3. Substance Interference
Dyshaemoglobins - Conventional Pulse Oximeters make use of only two wavelengths of light and thus can only distinguish and measure two substances, namely HbO2 and Hb. Consequently, elevated Carboxyhaemoglobin and Methaemoglobin levels can cause inaccurate readings. Methaemoglobinaemia, caused by an overdose of prilocaine, can cause readings to tend towards 85%, and increased levels of Carboxyhaemoglobin, caused by carbon monoxide poisoning, can cause saturation values to tend towards 100%.
Intravenous dyes - Intravenous dyes can cause falsely low SpO2 readings; an effect that can persist for more than 20 minutes after a dye has been applied.
Skin pigmentation and other pigments - Skin pigmentation and nail polish can cause inaccurate oximetry readings. A noticeable bias has been recorded in patients with different skin pigments.
2.4.4. Limited Knowledge
Medical staff knowledge - Studies have demonstrated that many nurses and physicians are unable to identify that motion artefacts, arrhythmias and nail polish can affect the accuracy of pulse oximeters (Kendrick, n.d.; Jubran, 2004).
Not a monitor of ventilation - Case study results (Davidson & Hosie, 1993; Hutton & Clitton-Brock, 1993) have indicated that a false sense of security centres around pulse oximetry due to oximetry giving a good indication of adequate oxygenation, but not supplying any direct information concerning the ventilation of the patient.
Stellenbosch University http://scholar.sun.ac.za
Pag
e 2
4
Limited information - Oxygen saturation values less than 70% are inaccurate as there are no control values to compare them with, since it is illegal to reduce saturations below 70% for calibration of the devices.
Probe positioning - The Penumbra effect emphasises the importance of correct probe positioning. This effect causes falsely low readings and occurs when the probe is not symmetrically placed, such that the path length between the two LEDs and the photo-detector is unequal, causing one wavelength to be compounded.
2.5. Important Technical Advancements
Some of the important developments relevant to this study are discussed in this section. These developments include a discussion of the results and recommendations made by Schoevers in his earlier attempt to address the problem (Schoevers, 2008).
2.5.1. Masimo ‘Signal Extraction Technology’
The Masimo 'Signal Extraction Technology' (SET) pulse oximetry system is a relatively new method of acquiring arterial oxygen saturation. The system utilises proprietary techniques to determine noise reference signals in the photoplethys-mograph which can then be used with adaptive filters to determine oxygen saturation values (Masimo, 2004).
When using adaptive filters, it is often problematic to determine a valid noise reference to be fed into the adaptive filter. The filter uses this noise reference to discern between signal and noise proportions of the input signal. The Masimo Corporation solved this problem with their 'SET' algorithms. The following relationship
( ( )) Equation 12: Masimo ‘SET’ Relationship
where NR represents the noise reference signal, Ir and Iir the red and infrared photoplethysmograph respectively and R(t) the red over infrared ratio, enables Masimo's system to acquire a suitable noise reference. Masimo obtained Equation 12 by using the following relationships:
If: Then:
Equation 13: Derivation of the Masimo
‘SET’ Relationship
⁄
[ ] [ ] [ ]
Substituting in:
[ ] [ ]
Stellenbosch University http://scholar.sun.ac.za
Pag
e 2
5
Masimo's approach is diagrammatically depicted in Figure 14. The red and infrared photoplethysmographs are fed into the reference signal generator where a range of reference signals are generated utilising Equation 3 and values for R(t) corresponding to saturation values from 0% to 100%. This range of noise reference signals is then fed into the adaptive filter which then filters one of the photoplethysmographs using this signal. The output at the adaptive filter is then analysed for power content to indicate the correct value of R(t) and thus the saturation value. Only the correct value for R(t) will cause a peak in the power graph as indicated in Figure 14.
The advantages of using this system include the ability to measure in low signal to noise environments, as is the case in low peripheral perfusion and motion artefact scenarios (Goldman et al., 2000; Masimo, 2004). This is made possible by the independence of the Masimo system on the conventional 'red over infrared' ratio, as described in Section 2.2. The disadvantage of this system lies in the fact that the power analysis at the end stage of the system also requires the presence of an AC component, however small, in the photoplethysmograph. This renders the Masimo approach unusable within the scope of this thesis.
In 2007, Aoyaki et al. proposed that to be able to realise the full potential of pulse oximetry it would become necessary to increase the number of optical wavelengths used and that to do so, an accurate physical theory would need to be developed. By proving that Schuster’s theory of radiation through a foggy atmosphere could be adapted to pulse oximetry (Aoyaki et al., 2007), where ∆Ab is the change in optical density of blood due to ∆Db, blood thickness change [cm]:
Stellenbosch University http://scholar.sun.ac.za
Pag
e 2
6
√ ( ) Equation 14:
Schuster’s theory
where:
( )
Through experimentation they achieved:
(√ ( ) ) Equation 15:
Modified Schuster’s theory
By considering three of the major sources of error in pulse oximetry - optics, tissues and venous blood, Equation 15 can be further modified to:
⁄
√ ( ) √ ( )
√ ( ) √ ( )
⁄
Equation 16: Fully Modified
Schuster theory
where:
It was shown that many of the error factors and problems of pulse oximetry could be solved by using this approach of multiple wavelength pulse oximetry. Aoyaki et al. experimentally proved the theory by performing an in-vivo clinical trial using three and five wavelength pulse oximeters on volunteers (Aoyaki et al., 2007). The results showed that a three wavelength system could be used to eliminate the effect of tissue and a five wavelength system could be used to eliminate the effects of venous blood and motion artefacts.
By applying their theory it is possible that many of the problems faced by pulse oximeters such as motion artefacts, low pulse amplitudes, inaccuracies, and response delays could be solved by using multiple wavelengths of light.
2.5.3. Previous Study Results
J.E. Schoevers performed a study which can be viewed as the predecessor towards the current work in his MSc thesis titled: Low Blood Oxygen Saturation Quantification in Human Arterial and Venous Circulation (Schoevers, 2008).
Stellenbosch University http://scholar.sun.ac.za
Pag
e 2
7
His thesis focused around the development of a system which could be used to monitor patients suffering from ischemic conditions causing low perfusion such as meningococcemia, which often spreads rapidly. Due to low SaO2 readings pulse oximetry has had limited success as a monitoring tool. The study attempted to address these limitations by developing an Artificial Pulse Oximeter (APO) capable of accurately measuring both SaO2 and SvO2 in low saturation and perfusion scenarios.
Two LED sensor pairs were designed, namely a 660/910 nm pair and a 740/880 nm pair to provide accuracy at both high and low saturations, respectively. The LED pairs were driven individually and the photodiode used was identical in each probe type, all of which was controlled and processed by a development board produced by GeoAxon Pty Ltd.
An ‘Artificial Pulse Generator’ (APG) was integrated into the design to overcome the absence of an AC component in the PPG signal by generating an artificial pulse in the tissue. SaO2 and SvO2 were calculated according to an arterio-venous hypothesis dependent on the arterial-to-venous compliance. Schoevers calibrated the APO by performing an empirical in-vitro calibration approach, and validated the results by performing an in-vivo clinical study (Schoevers, 2008).
Figure 15: APO system developed by Schoevers (2008)
It was found that the in-vitro calibration method was relatively accurate in high saturation scenarios, but that the overall accuracy was inferior to an in-vivo calibration approach. A theoretical model proved a close correlation between photon diffusion theory of light propagation and the 660/910 nm sensor's calibration curve at high saturations. The 740/880 nm results were, however, inconclusive while at lower saturations it did show an improved precision compared to that of the 660/910 nm sensor. It was thus concluded that the 740/880 nm sensor is better suited for low saturation scenarios.
Schoevers’ results were neither comprehensive nor entirely conclusive, but it was hypothesized that with further development of the APO system, an accurate determination of SaO2 and SvO2 would be possible.
Stellenbosch University http://scholar.sun.ac.za
Pag
e 2
8
2.6. Chapter Summary
By considering the possible uses for pulse oximetry, the current technical advances in the field and the international research being performed, pulse oximetry has a very good chance of becoming an ever more predominant diagnostic tool in medical care. However, there is still extensive research and development required before it can reach its full potential.
Stellenbosch University http://scholar.sun.ac.za
Pag
e 2
9
CHAPTER 3: SYSTEM DEVELOPMENT
As mentioned earlier in this document, all existing systems that are currently being used to non-invasively measure blood oxygen saturation are either dependant on a clearly detectable AC component in the photoplethysmograph, or provide inaccurate measurements due to factors such as oedema or thicker skin in older patients. The system proposed in this thesis aims to overcome these problems by integrating selected characteristics of the existing systems with a novel system that is able to overcome the fundamental problem of an absence of an AC component.
Considering the research detailed in Chapter 1, Chapter 2, and the project objectives, it was determined that in conjunction with developing a pulse oximeter based probe design, further diagnostic tools would need to be added to the system to verify some of the theories and ‘myths’ surrounding pulse oximetry. The functionality of these tools could also be used as experimental validation for some of the data extracted from PPG signals, such as the derived heart rate or respiratory rate.
3.1. Design Principles
This section discusses the underlying mechanical and electronic design process of the separate subsystems of the mechanical control systems and the electronic boards designed and produced for the thesis. Furthermore a look into the setup procedure of the software to implement such designs is also included.
3.1.1. Electronic Design Principles
The design process of the circuits required a bottom up approach, i.e. the requirements of each of the PCBs was developed into a comprehensive functional model from which the subsystems could be designed to address all the requirements in a modular format. Once all the electronic subsystems were designed, they were evaluated to determine subsystem interaction compatibility, and in cases where there were system clashes in the integration process, alterations were made to improve the necessary compatibility.
Due to the importance of signal quality for signal analysis and control, the Electromagnetic Compatibility (EMC) of designed components is of critical importance to reduce unnecessary noise in the system.
According to Williams (2001), designing for good EMC starts by controlling the flow of interference into and out of equipment. Furthermore, to improve the EMC of a system one should place insulation and reroute currents such that they are diverted away from incoming interference sources or the interference is absorbed
Stellenbosch University http://scholar.sun.ac.za
Pag
e 3
0
before it can affect the circuits. Williams further states that one of the best ways to improve overall EMC performance would be to design the PCB layout in such way as to partition separated sections and to keep the grounds of such systems apart (Williams, 2001).
As a result, all the electronic systems of the design were subdivided into three ‘electronic type’ groups, namely power, analogue and digital electronics, which were used to perform system specific electronic design.
Another important aspect of electronic design for medical equipment is the safety of the medical device. Accordingly, the electrical safety standards are of critical importance as many of the dangers involved in interfacing with the human body are often counterintuitive (Prutchi & Norris, 2005). Patient and operator electrical protection starts at the device enclosure which ensures contact with hazards are avoidable; secondly the electronic circuitry should have other safety barriers to ensure that leakage currents are kept to a minimum and are within the safety standards. The required safety components can be divided into the following regions: accessible parts (parts that can be touched without use of tool), live parts (electrical power supply), signal input and output parts (signal analysis and interfacing circuits) and finally applied parts (patient connections with the device) - all of which need to be carefully analysed for their specific safety risks.
3.1.2. Mechanical Design Principles
Besides the electronic design there are many uncertainties in the mechanical design process. The major uncertainties concerning strength and stress of a designed or manufactured product with respect to the system include (Shigley et al., 2004; Ullman, 2003; Figliola & Beasley, 2006):
material compositions, as they have inherent property tolerances
the effect of other nearby assemblies
the effect of thermo-mechanical and chemical treatments on the material properties
the validity of mathematical models used to model reality
influence of time and use on the strength and geometry
effect of corrosion and wear
One of the most fundamental requirements of the design proposed in this thesis, and the design of medical devices in general, is aimed at the development of systems which can be used for ‘bed-side’ continuous monitoring.
The system is also required to be easy to use as physicians, nurses and trainees need to be able to apply the device without any difficulty. The device also needs to be robust and as small as possible to be used under a wide range of circumstances.
Stellenbosch University http://scholar.sun.ac.za
Pag
e 3
1
3.2. Conceptual Development
Shigley et al. (2004) wrote that any design should adhere to and be governed by the terms: functional, safe, reliable, competitive, usable and manufacturable. Keeping the project requirements in mind, the system was broken into its functional components to be developed modularly to improve the simplicity and quality of the prototype.
The proposed system can be broken up into its functional components as shown in Table 1 which also lists a few of the concepts generated in the initial design phase.
Table 1: Functional Analysis and Concept Development Summary
3.2.1. Selected Conceptual System
Initial design of the pulse oximeter consists of conceptual ideas. By definition a concept is an idea that is sufficiently developed to evaluate the physical principles that govern its behaviour (Ullman, 2003; Shigley et al., 2004). The conceptual design process is an iterative process that requires evaluation and refining whereby concepts are generated with use of the specification definitions and are then evaluated so that decisions can be made about the concept.
The selected non-invasive system to be developed consisted of an electronically controlled inflatable cuff, which is to be placed proximal to a custom built five wavelength NIRS LED and photo detector probe. The NIRS LED and photo detector hardware would operate in a similar manner to that used in conventional pulse oximeters.
A pulsatile component would be induced in the vascular bed of the finger by inflating the pneumatic cuff which gently forces the blood present in the finger segment through the finger. Both the normal pulse oximeter data as well as that induced by the cuff would be logged by a data acquisition system both on the control board as well as on the PC for data analysis.
Generate Light
LEDS
Sweeping Spectrum
Light Generator
Laser Diodes
Transmit Light
Place directly against
skin
Fibre Optics
Colour Filters
Receive light
Photo Sensitive Receiver
Fibre Optics
Reciever
Pulse Generation
Adjustable 'Blood
Pressure Cuff'
Fixed Ring Cuff
Mechanical Strap
Minimisation of Motion artefacts
Use an Accelero-
meter
Spring / Dampener
Sponge
Adaptive Filtering
Attachment to Body
Mounting on Cuff
Digit Clip
Elastic Cuff
Disposable Cuff
Stellenbosch University http://scholar.sun.ac.za
Pag
e 3
2
The entire system would be controlled and monitored by a standalone micro-processor control unit on which all the data can be processed and stored to be retrieved later.
3.2.2. Additional Diagnostic tools
To be able to monitor and validate the other physiological parameters, an ECG was developed to monitor heart function and a respiratory sensor was added to monitor respiration. An accelerometer was added to the finger probe to monitor motion in the area of the probe.
A prototype system using the selected concept was then developed and manufac-tured to overcome abovementioned problems in currently available pulse oximeters and to achieve the goals as set forth by the project objectives.
3.2.3. Controlling Electronics
To control the system a Microchip dsPIC30F4013 was used initially for the development of the system, but in the interests of simplicity of the design the controller board was switched with the Arduino Mega 2560 (Figure 16) which is based on the ATmega2560 microcontroller. A summary of the Arduino Mega 2560 specifications is shown in Table 2. The Arduino Mega 2560 can be programmed through Arduino’s open-source programming environment which is based on the Java programming language and can run on Windows, Mac OS X, and Linux.
Table 2: Arduino Mega 2560 specifications summary
Microcontroller ATmega2560
Operating Voltage 5 V
Digital I/O Pins 54
Analogue Input Pins 16
Hardware Serial Ports 4
DC Current per I/O Pin 40 mA
Flash Memory 256 KB
SRAM 8 KB
Clock Speed 16 MHz
Figure 16: Arduino Mega 2560
Stellenbosch University http://scholar.sun.ac.za
Pag
e 3
3
Besides having all the necessary connections required for the prototype and possible expansion therof, it has the advantage of containing everything needed to support the microcontroller, including a USB-to-serial interface (Atmega8U2 programmed as a USB-to-Serial converter) for direct communication with a PC.
Each analogue input has 10 bits of resolution (1024 divisions) in the range from GND to 5 V which can be adjusted through the AREF pin which supplies a reference voltage.
The Arduino system simplifies the hardware and software development required in the design process of the project which also includes a number of open-source libraries for integrating and programming secondary and tertiary peripherals.
3.3. Finger Probe System Development
The four major components to be considered in the finger and probe system are the light sources, the photo detectors, the accelerometer and the inflatable cuff - each of which are described in the following section.
3.3.1. Light Source & Wavelength Selection
One of the most important decisions which had to be taken at an early stage of the research was the selection of light source(s) to be used in the system as the spectral effects and absorption characteristics of the blood and tissue components play such a large role in the response and accuracy of the system. Due to their size, availability and relative low cost, LEDs were selected as the primary light source for the pulse oximeter probe.
The range for optical spectroscopic measurements across tissue is approximately 600 nm to 1350 nm; but as a result of increased attenuation due to multiple tissues causing scattering, the short wavelength limit is in practise reduced to approxi-mately 650 nm. Experiments have also been conducted on the NIR spectra of adult (HbA) and foetal (HbF) haemoglobin. These indicate that in the range of 650 nm to 1000 nm there are no perceptible differences in HbA and HbF NIR absorption spectra, thus allowing the calibration spectra from adult blood to be used on new-born infant data (Fouzas et al., 2011; Zijistra et al., 1991).
Conventional pulse oximeters generally consist of 660/940 nm LED combinations as this has been proven to be the most accurate two wavelength combination for determining SaO2. In comparison, Aoyaki et al. (2007) proved the viability of their five wavelength system by using the wavelengths: 660 nm, 700 nm, 730 nm, 805 nm and 875 nm.
The isosbestic wavelength (approximately 810 nm) has the unique feature that the Hb and HbO2 absorption coefficient curves intersect at this wavelength.
Stellenbosch University http://scholar.sun.ac.za
Pag
e 3
4
Keeping these factors under consideration as well as the availability of LEDs in small quantities, the LED wavelengths that were chosen for the prototype were 660 nm, 735 nm, 810 nm, 890 nm and 940 nm (depicted in Figure 17).
Figure 17: LED wavelength selection
The specific surface mount (SMT) LED packages were chosen for their size (2.7 mm x 3.5 mm), the total radiated power (typically 10 mW), peak wavelength, half width (typically 10 nm) and the viewing half angle (typically 55°). The goal of the selection process was to use LEDs which would have similar electro-optical characteristics at their specific wavelengths (Electo-Optical Characteristics available in Appendix B).
The LEDs were initially driven by a TLC5916 (8 Channel Constant Current LED Sink Driver) but it was later decided to simplify the system by making use of High-Speed Saturated Switch Transistors (2N2369A NPN Transistors) which could be directly switched with digital outputs from the microcontroller.
By making use of five wavelengths it becomes possible to derive five independent equations describing the tissue characteristics, thus making it possible to solve for five variables using either Modified Beer-Lambert’s Law (Equation 8) or the Modified Shuster Theory (Equation 14).
3.3.2. Photo-Detector Selection
To perform a comparison between transmitted and reflectance pulse oximetry it was necessary to incorporate two photodiodes into the design, one in the centre of the LEDs (reflectance) and one on the opposite side of the probe (transmittance).
Stellenbosch University http://scholar.sun.ac.za
Pag
e 3
5
Ideally a large surface area is required to more accurately measure the amount of light which is absorbed, scattered, reflected or transmitted. For the purposes of this thesis where a finger mounted probe was being developed, size was an important constraint. Consequently, the spectral sensitivity and range played a more important role in the selection of a photodiode. A SMT BPW 34 S Silicon PIN Photodiode was chosen for the application as it has an optimal spectral range of 400 nm to 1100 nm, half angle of 60° and a switching time of less than 20 ns. The photodiode characteristics are included in Appendix B.
CiRi
Rs
Photodiode
N
PIp
Figure 18: Photodiode equivalent model
The effective electronic photodiode model is shown in Figure 18 where Ri, Ci and Rs are the photodiode shunt resistance, shunt capacitance and series resistance respectively. In most cases, Rs is small enough to be ignored and the inductive element L is also negligible at frequencies below 100 MHz.
CiRi
Rs
+
-
L
Coa Roa
Cf
Rf
RL
Vout(f)
Ip
Figure 19: Effective photodiode transimpedance circuit and amplifier
Ri and Ci are used to calculate the other circuit components in the transimpedance amplifier (Figure 19) for an adequate amplifier bandwidth and stability.
A LMC 660 CMOS Quad Operational amplifier was selected as the operational amplifier for the transimpedance circuit, converting the current generated by the photodiode into a voltage signal to be measured and monitored. The LMC 660 was selected due to its Rail-to-Rail output swing, ultra-low input bias current and precision current-to-voltage converter capabilities (OSRAM, 2007).
Stellenbosch University http://scholar.sun.ac.za
Pag
e 3
6
3.3.3. LED Layout
As seen in Equation 5 the light absorption through tissue is a function of the optical path length, and thus the positioning of the LEDs relative to the photodiodes can play a critical role in light distribution through the tissue.
Figure 20 shows the layout of the PDs and LEDs in the different test setups, where (a) is the original layout proposed where each LED is equally spaced around the reflectance PD, but this layout was found to be too large; (b) is the final layout employed in the reflectance side of the finger probe and within in-vitro test setup and (c) is the layout which was used in the animal arterial validation trials (described in Chapter 4)
3.3.4. Accelerometer circuit
An ADXL203 Precision ±1.7g Dual-Axis iMEMS Accelerometer (Analog Devices, 2010) was selected to be mounted inside the finger cuff to monitor the motion of the digit. Both axes are summed and monitored to determine the primary frequencies of motion applied to the sensor which can then be dynamically filtered out of the logged PPG signals obtained from the photodiodes.
3.3.5. Probe Design
All the necessary components of the pulse oximeter were integrated into a recycled and modified Nonin finger-clip pulse oximeter (Figure 21), including the five different wavelength LEDs, reflectance and transmittance photodiodes, finger cushioning, accelerometer and spring loaded finger clip for easy mounting.
Stellenbosch University http://scholar.sun.ac.za
Pag
e 3
7
Figure 21: Model of the Finger Probe
3.4. ‘Artificial Pulse Inducer’ Development
Artificially generating a pulse in the blood and tissue of the finger is the basis upon which Artificial Pulse Oximetry (APO) is based. In a scenario where there is low perfusion or the tissue is occluded, an artificial pulse generates an AC component in the PPG signal, which can thus be used to determine the mixed blood oxygen saturation. Furthermore, in a scenario were there isn’t low perfusion and there is thus a pulsatile component generated by the cardiac output in the tissue, it would be possible to get a comparison between the PPG generated by the arterial component of the blood to a PPG signal generated by the mixed movement of both the arterial and venous components of the blood and tissue.
The APG can be divided into three primary subsystems, namely the pressure cuff, inflation system, and an electronic controller. The pneumatic cuff was designed to periodically inflate at a frequency that is offset from that of the heart rate of the patient, in order to avoid inteference of the waveforms.
3.4.1. Pneumatic Cuff
Figure 22 illustrates the inflatable cuff unit, where the internal blue portion is the malleable inflatable cuff, and the ring surrounding the cuff is a solid perspex ring
Stellenbosch University http://scholar.sun.ac.za
Pag
e 3
8
which ensures the pneumatic force of the cuff, when inflated, is forced inward towards the finger and thus inducing a controlled single dimensional pulse in the finger. The threaded portion protruding is the external connector to the pneumatic drive system which is discussed in the next section.
Figure 22: Inflatable Cuff Design
Figure 23: (a-c) Inflation Cuffs with one, two and three tubes respectively; (d) ‘Single-Inflation-Tube’ Cuff in the open position
Three different cuffs were developed, each with either one, two or three inflatable tubes (Figure 23). In the case of three and two tubes, the tubes were inflated sequentially to cause a peristaltic action in the finger. By experimentation it was found that with multiple tubes the system became large and unwieldy, and the gain of pulse due to the peristaltic action was unnecessary, as the induced pulses caused by the single unit are of a high enough quality to gain the necessary information from the PPG signal.
Stellenbosch University http://scholar.sun.ac.za
Pag
e 3
9
3.4.2. Pneumatic Cuff Inflation System
The pneumatic inflation cuff is driven by a pneumatic pressure generator which can switch and supply the separate tubes via an electronic control system controlled by a microcontroller.
The inflation system and pressure generator in relation to the entire system are schematically represented in Figure 25. The pressure is generated by two 12 VDC rolling pumps (type 02 P05K) connected in parallel to a 0.1 ℓ pressure vessel (CRVZS-0.1) used to build enough volume to periodically supply the inflatable cuffs. A one-way valve (H-QSM) was placed between the pumps and the pressure vessel to prevent reverse leakage through the compressors. All of the intermediate connections of the pneumatic system were sourced as standard Festo quick push-in fittings for easy setup and a modular design.
A PNP pressure sensor (SDE-1) was used to monitor the pneumatic pressure within the pressure vessel and to regulate the pressure to 550 mmHg. When the pressure is achieved the sensor outputs a signal which is then used to switch the compressors off at which stage the sensor is set to a tolerance band of 50 mmHg, i.e. when the pressure drops below 500 mmHg the sensor, by use of controlling electronics, switches the compressors back on until the pressure is back up to the required 550 mmHg.
The average systolic blood pressure is in the order of 120 mmHg, and as a result a cuff pressure of 550 mmHg adequately overcomes the pressure within the tissue, and hence induces a pulse in the tissue.
Figure 24: Pneumatic System
Stellenbosch University http://scholar.sun.ac.za
Pag
e 4
0 Air
Pum
p D
river
s
1
4
2
3
P1
P2
12
11
2
11
12
+24V
0V
RL
RL
0.1ℓ
Pre
ssur
e V
esse
lC
RV
ZS-0
,1
One
-Way
Fl
ow V
alve
H-Q
SM
12V
DC R
ollin
g P
umps
121
2
112
3
4
Sol
enoi
d D
river
1
Sol
enoi
d D
river
2Fl
ow-C
ontro
l Val
ve: G
R-
QS
Flow
-Con
trol V
alve
: GR
-Q
S
Infl
ata
ble
Cu
ff
Pre
ssur
e S
enso
rS
DE
-1
Sol
enoi
d V
alve
Ban
kM
HA
1, M
inia
ture
2x2/
2-w
ay
Qui
ck E
xhau
st V
alve
SE
U-1
/8
Qui
ck E
xhau
st V
alve
SE
U-1
/8
940n
m
PD
890n
m
810n
m
735n
m
660n
m
PD
Acc
eler
omet
er &
R
efra
ctiv
e P
hoto
diod
e
LED
s &
Ref
lect
ance
P
hoto
diod
eE
lect
roca
rdio
gram
Out
put
Res
pira
tory
Sen
sor O
utpu
t
xy
z
Figure 25: Pneumatic System in respect to the overall system
Stellenbosch University http://scholar.sun.ac.za
Pag
e 4
1
To supply the specific cuffs with the generated pressure, a recently developed fast-switching miniaturised solenoid valve bank (Festo MHA1 2x2/2-way and 2/2-way valves) was implemented. The solenoid valves are controlled by a dual system which integrates the signals from the microcontroller and a pressure regulating circuit which consists of TSC-105L3H power relays to switch the valves (the power and control schematics are included in Appendix B). The microcontroller controls the switching frequency, duty cycle and the pulse rate of inflated cuffs.
3.5. Photoplethysmograph Signal Processing
The most fundamental component of a pulse oximeter is the PPG signals from which all the information is extracted, including oxygen saturation, heart rate and the effects of the blood pulsing through the tissue.
To process the signal produced by the photodiodes in the pulse oximeter, an electronic signal processing system was designed (Figure 26) for two purposes, 1) converting the current signal to a voltage signal which the microprocessor can measure and monitor, 2) separating the signals into the separate signal components, i.e. AC and DC components.
The PPG signal is generally comprised of a large DC signal and a small AC signal, once the AC signal is decoupled from the DC signal it requires multistage amplification to monitor a clear resolution of the signal. The signal was divided into three components to be monitored and logged; the amplified AC and DC signals as well as the original unfiltered signal are logged for further processing, analysis and verification of signal extraction.
Multistage Amplification
Final StageFiltering
Initial StageFiltering
DC De-Coupling
Transimpedance Photodiode
Amplifier
DC Amplification
Voltage Buffer
DC
Sig
nal
Out
put
Ana
log
Sig
nal
Out
put
Photodiode Signal Input
Voltage Buffer
Orig
inal
S
igna
l Out
put
V+
Figure 26: Photodiode amplification system overview
All signals from the system can be logged on both an eight channel Spider 8 Data Acquisition System as well as on the EEPROM connected to the microcontroller. The full schematics tested and implemented are given in Appendix A.
Stellenbosch University http://scholar.sun.ac.za
Pag
e 4
2
3.6. Peripheral Systems
Two peripheral systems were added to the design to verify and monitor the other patient vital signs, which can be used for determining other parameters in the PPG signals. The two peripheral systems are an ECG and a respiratory sensor. This section describes the overall design and selection of these peripheral systems.
3.6.1. Electrocardiogram
To monitor and verify the heart rate of a patient a three-lead ECG was developed. The designs of the ECG were based on the low cost ECG development designs made by Nyugen (2003).
The primary frequency response of ECG monitors is in the range of 0.5 Hz to 100 Hz, which affects the accuracy of the signal. The American Heart Association (AHA) recommends an ECG frequency response of 0.05 Hz to 100 Hz for signal processing and analysis (AHA, 2011). Careful consideration needs to be given to power line noise at 50/60 Hz. The system sensitivities for ECG signals need to be in the range of 0.1 mV to 6 mV (an example of which is the R-wave signal which is usually less than 2 mV).
The ECG electronic schematic is illustrated in Figure 27; and probe placement is shown in Figure 25.
10k
100k
+
-
100k
100k
+
-
100k 100k
10k
+
-
10k10k
5V
+
-
+
-
100k
100k
1uF
100k
100k 100k
0.1uF
10k
10k
+
-
200k
Electrode +
Electrode -
Electrode BASE
+-
10k
10k200nF
100nF
+
-EKG Output
+5V
-5V
+5V
-5V
+5V
-5V
+5V
-5V
+5V
-5V
+5V-5V+5V
-5V
Bias Reference
Instrumentation Amplifier with intermediate Low-Pass Filtering
Final Stage ~100Hz LPF
Figure 27: ECG electronic schematic, based on (Nguyen, 2003)
For patient safety, surge protection diodes were added between the ECG electrodes and current is limited by electrode input resistances on each of the
Stellenbosch University http://scholar.sun.ac.za
Pag
e 4
3
electrode lines. A 100 Hz Low Pass Butterworth filter was implemented for signal quality improvement and its innate signal time response and stability.
3.6.2. Respiratory Sensor
To monitor and measure the respiratory rate, a Model 1132 Pneumotrace II piezoelectric respiration transducer was implemented. The respiratory sensor works on the principle that changes in the thoracic circumference generate a high-level, linear output signal which does not require an excitation voltage (UFI, 2010). The Pneumotrace II can be used not only to measure the respiration rate, but has also been proven to be an indicator of respiration volume.
LM324 operational amplifiers were used to amplify the signal output by the respiratory sensor and to log by the data acquisition systems (Figure 28).
The primary frequencies of the measured thoracic circumference measurement and respiratory rate are between and 0.1 Hz and 0.5 Hz.
3.6.3. Power Electronics
Due to the diversity of components and electronics required for the system, multiple voltages are required to drive the different circuits and pneumatic components. The voltage levels required include 24 VDC, 12 VDC, 5 VDC, and -5 VDC.
The different voltages are required for the components listed in Table 3.
All of the individual power circuits are illustrated in Appendix A.
3.7. System Summary
Figure 29 through Figure 31 show the complete prototype system. Figure 29 (a) and (b) show how the artificial pulse cuff is mounted on the patient’s finger with the modified pulse oximeter. Figure 30 and Figure 31 show the complete designed system with and without the cover plate respectively.
Figure 29: Artificial Pulse Inducer with Modified Probe; (a) Two tube system, (b) Single tube system
Figure 30: Overall APO System with all peripheral components
Stellenbosch University http://scholar.sun.ac.za
Pag
e 4
5
Figure 31: Internal Electronics of the complete APO system
Each of the individual components are shown in the above images. The ECG is used in conjunction with the respiration strap to validate any extracted heart and respiration rates respectively. The system is fully controlled by the Amtel micro-processor and all the data is logged through the eight channels of the Spider 8 data acquisition unit.
3.8. Chapter Summary
The developed system met the requirements set forth by the functional analysis by being able to generate an artificial pulse, drive two photodiodes and five LEDs as well as monitor heart and respiratory rates.
The complete system was used in the porcine and clinical testing procedures discussed in Chapters 4 and 6 respectively, and the developed oximeter probes with amplification modules were also used in the in-vitro test-setup discussed in Chapter 5.
Stellenbosch University http://scholar.sun.ac.za
Pag
e 4
6
CHAPTER 4: ANIMAL TESTING MODEL
One of the primary focuses of this thesis is to be able to accurately measure the blood oxygen saturation when it falls below 70% (i.e. the termed low saturation scenarios). To accomplish this there are two primary methods for calibrating the hardware, namely in-vitro and in-vivo techniques. An in-vitro technique is defined as a study performed outside of a living organism (i.e. test tube study), an in-vivo technique is where the study is performed in/on a living organism.
To perform a validation and calibration of the designed system, it was decided to perform an in-vivo animal test setup to compare the testing technique to that of other studies, including that of Aoyaki’s in-vitro test setup (discussed in more detail in Chapter 5)
An initial study was performed by Schoevers in 2007 (Health Research Ethics Committee, Faculty of Health Sciences, Tygerberg project: N07/01/010), whereby the calibration and testing was done in an in-vitro laboratory test setup. However, Shoevers observed that in low perfusion scenarios the laboratory calibration setup was inaccurate. In addition, there is little information concerning NIRS calibration values at haemoglobin oxygen saturation lower than 70%.
This thesis aimed to overcome the technical limitations identified in the initial study by Schoevers. The animal model experiments were decided upon in order to derive a direct calibration through NIRS measurements of the individual arterial and venous oxygen saturation sites.
4.1. Ethical Philosophy of Animal Testing
The primary ethical view of proposed animal experiments is based upon the fundamental view that animals are worthy of moral considerations and concern, and hence their interests must be protected as far as possible in their use for advancement of biological knowledge and research to promote the health of humans and animals alike.
Russell and Burch (1959) proposed the following guiding principles of humane experimental techniques for the planning and conduct of animal experiments (Russel & Burch, 2002).
These systematic guidelines are known as the “three R’s” (Replacement, Reduction and Refinement):
Stellenbosch University http://scholar.sun.ac.za
Pag
e 4
7
Replacement of animals with non-sentient research systems, i.e. researchers should strive to avoid the use of laboratory animals if alternative methods can yield the data required from the research.
Reduction of the number of animals which are to be used in testing. The number should be kept at a minimum by designing the testing procedures in a manner that will achieve sufficient statistical power for experimental results while ensuring the minimum use of animal specimens.
Refinement of the experimental methodology to be adopted to have the least distressing or harmful effects on the animals, and when this is not avoidable to counter those effects by the use of ataractics (tranquillisers), neuroleptics (dissociative agents), anaesthetics, analgesics and other effective strategies.
Furthermore, animals are protected from research designs which involve pain, illness, isolation, mutilation (whether by surgery or otherwise) and/or premature death until such research can be demonstrated to be absolutely necessary and for which alternative designs using non-sentient systems are not feasible.
4.2. Animal Care & Testing Requirements
The use of sentient animals was justified for the study due to a number of factors, first of which was that the proposed form of experimentation could not be performed on humans; second, the previous study by Schoevers indicated that a purely in-vitro testing setup was insufficient; and finally the vascular system of a pig is similar to that of a human in terms of anatomy and function (White & Bloor, 1981; White et al., 1986).
To meet the requirements of the study as well as to ensure that the guidelines described in the previous section were met, certain test specimen criteria were put forth to maintain the quality of the testing protocols (Table 4).
Table 4: Porcine Specimen Criteria
Animal Species Pig (Porcine) Body Mass >35 kg Gender Any Gender Age Any Age Min. Specimens Required
Eight (8) Tested Independently Previous studies in animal testing have shown that sample sizes of between 4 and 8 specimens are statistically necessary (Coetzee, 2008).
Source of Animals All of the animals used in the study were supplied by Central Animal facility at the Faculty of Health Sciences, Tygerberg Hospital. The animals were fetched and provided for by the trained staff at Tygerberg hospital.
Animal Care All of the animals were held and cared for within the neat, clean and safe environment of the Central Research Unit (CRU) where sufficient water and foodstuffs were supplied
Stellenbosch University http://scholar.sun.ac.za
Pag
e 4
8
and the temperature of the environment was controlled. The animals required no physical restraint as all medications were administered from a distance using a needle attached to an extension by the trained staff at the CRU.
All testing and procedures were performed under the guidance of the trained medical staff at Tygerberg Hospital. Prof A.R. Coetzee in conjunction with his medical staff performed the necessary surgical procedures and supervised the testing procedures.
The animal testing protocol was submitted to and approved by the Committee for Experimental Animal Research (CEAR), Tygerberg.
4.3. Testing Protocol
The testing procedure and protocol was set forth as follows, where all medical applications were performed by the trained medical staff, and monitoring and testing was done by the author.
1. The animal receives a premedication of 10 mg/kg intramuscular ketamine. 2. An intravenous catheter is inserted and anaesthesia is achieved with fentanyl
(10 μg/kg) and thiopentone (5 – 10 mg/kg). 3. A tracheostomy is performed and then the animal is tracheally intubated. The
animals are mechanically ventilated with the required oxygen and air.
Table 5: Tracheotomy Procedure (The Titi Tudorancea Learning Center, 2010; LuMriX.net, n.d.)
Tracheotomy Procedure:
A Curvilinear skin incision is made along the relaxed skin tension lines (RSTL) between the sternal notch and the cricoid cartilage.
A Midline vertical incision is made to divide the strap muscles. Division of the thyroid isthmus between the ligatures. The cricoid is elevated using a cricoid hook. A tracheal incision is then made – where the inferior based flap (i.e. through second
and third tracheal rings) is commonly used. The flap is then sutured directly to the inferior skin margin.
The tracheostomy tube is then inserted, during which the endotracheal tube is withdrawn. Once the tube has been fully inserted the cuff is inflated and secured around the neck with tape.
Upon completion of the tracheotomy the ventilator tubing is connected.
4. The environmental temperature of the operating room and operating table are controlled to the physiologically ideal temperature of between 36.5 °C and 37.5 °C.
5. A femoral artery and vein of one leg is dissected free, allowing room for the placement of the testing probes.
6. The testing probes are then placed individually over the artery and the vein. 7. Once the device is correctly mounted and the signal qualities are suitable for
monitoring, the test site is flushed with saline solution to ensure the physio-logical conditions of the tissue are correct.
8. The device is started up and the NIRS measurements commence in a conti-nuous manner (for more information on these measurements see no. 14).
9. Blood samples are taken from the vein and the artery for blood gas analysis to be used as the ‘gold standard’ of the physiological state of the blood gases.
A blood gas test is primarily performed using a small volume of blood by puncturing either an artery or a vein with a thin needle and syringe.
The test is used to determine the pH of the blood, the partial pressure of carbon dioxide and oxygen, and the bicarbonate level. Other concentrations reported by the analysers include that of lactate, haemoglobin, several electrolytes, oxyhaemoglobin, carboxyhaemoglobin and methaemoglobin. The testing is mainly used in pulmonology to determine gas exchange levels in the blood related to lung function.
10. The inspired oxygen fraction is varied at random to achieve haemoglobin saturations varying from 50% to 100%. This section of the experiment is used to simulate hypoxic conditions.
11. The haemoglobin saturations are measured by making use of a blood gas analysis machine. These will then be compared to the data obtained from the device. These measurements will be obtained in the same manner as that explained in no. 8 of this section.
12. By tilting the table, the perfusion pressures and blood flow can be altered acutely. After 60 seconds of stabilisation, measurements are taken. This section of the experiment simulates low flow and low tissue perfusion clinical scenarios.
13. All reference measurements are made that include the arterial and venous blood gases (taken from the femoral vessels).
14. All measurements are performed by the prototype system, and consist of:
The pulsatile component of blood passing through both the vein and artery is recorded by the data acquisition module (DAQ) in the form of photo-plethysmograph and interpreted by the PC to deliver a blood oxygenation saturation value.
The sensor which is placed on the exposed vein and artery continuously measures the photoplethysmographic signal and the DAQ transmits this data to the storage device.
The data transmitted to the storage device will be sent to the PC and is stored and processed with commercially available software, such as Catman Easy and Matlab. Matlab is used to perform data analysis.
Values calculated are compared to the reference values obtained from the blood gas haematology system.
ECG and respiratory rate signals are used in post analysis.
Stellenbosch University http://scholar.sun.ac.za
Pag
e 5
0
The blood pressure is monitored using the standard measuring and logging systems available at Tygerberg Hospital.
The blood gas analyser used in the operating room was a GEM3000 blood gas analyser, supplied and maintained by Ilex South Africa Pty Ltd (Ilex Ltd, 2011).
4.4. Protocol & Testing Limitations
During the initial porcine test procedure it was found that the femoral site was not adequate for testing due to numerous factors, given here:
The veins and arteries at the femoral site were too small to adequately transmit the light produced by the probe.
The femoral artery had too many localised branches, causing arterial wall scarring when dissected away, thus decreasing the accuracy of measured signals.
Bleeding also often occurred during femoral artery isolation.
To overcome these limitations the testing site was changed to the carotid artery and jugular vein, which with fewer supply branches allow for better isolation for the testing probe. The testing probe was also modified to allow for a smaller testing site and easier insertion.
The probes used in the animal testing had the layout as seen in Figure 32, where the arterial probe was larger than that of the venous probe. The two sections shown in each of the figures (top and bottom) are the two sides of the probe – i.e. the two parts are placed opposite and in-line with one another as later illustrated in Figure 33.
Even with the reduced size of the testing probe and the change in test site physiology, in some of the tests the arteries and veins were still very small. In the cases where the blood vessels were very small, the system became exceptionally
660nm PD
810nm
735nm
810nmPD
940nm
890nmV+
V+
(a)
735nm PD
890nm
V+
660nm PD
940nmV+
(b)
Stellenbosch University http://scholar.sun.ac.za
Pag
e 5
1
sensitive to probe placement as misalignment could cause almost complete occlusion in the specific blood vessel, thus reducing the quality of measurements.
4.5. Testing Model
Figure 33 provides an overview of the porcine anatomy and the two test sites used in the testing procedures. It also shows the ECG and respiratory sensor probe placement during testing. Both the arterial and venous probes encompass the blood vessels as shown in the bottom right of the image – i.e. there is a photodiode on either side of the vessel, with LEDs on either side.
Figure 33: Animal Testing Model
4.6. Test Specimen Post-Study
At the end of the experiment the animals, while still under full anaesthesia, were euthanised by means of administering a concentrated dosage of potassium chloride (KCl) solution intravenously. The dosage administrated for the euthanasia
Stellenbosch University http://scholar.sun.ac.za
Pag
e 5
2
of the pigs was in the order of 10 - 30 mmol, i.e. the amount required to bring the heart of the pig to asystole.
4.7. Chapter Summary
In accordance with the experimental protocol, all the physiological features were measured and logged by a Datex Ohmeda S/5™ Anesthesia Monitor to be used and referenced in the data analysis.
Due to the physiological limitations experienced during the animal experiments, it was decided to extend the scope of the thesis by including an in-vitro test setup to validate and compare the results obtained in the setup. The in-vitro test setup is discussed in the next chapter.
Stellenbosch University http://scholar.sun.ac.za
Pag
e 5
3
CHAPTER 5: IN-VITRO TEST SETUP
As mentioned in the previous section, there were various limitations encountered in the porcine study, and thus to compare and validate the calibration setups, it was decided to perform a secondary study comprised of an in-vitro test setup similar to that performed by Schoevers (2008) with the new device and a series of modifications to the testing model.
This chapter takes a look into the test setup and the protocols followed throughout the in-vitro testing phase of the study.
5.1. In-vitro Technique Development
The in-vitro technique employed in this project is based on studies performed and discussed by Edrich et al. (1998) and Edrich et al. (2000). Edrich’s model (Figure 34) was further modified by Schoevers to include two blood chambers for monitoring the effects of different saturations in the arterial and venous blood flowing through the tissue (Figure 35).
Figure 34: Edrich et al. (2000) improved in-vitro model for reducing blood flow artefacts
Further research was performed by the collaborative team of Aoyaki (Nihon Kohen) and Yamanishi (Minolta) which endeavoured to develop a pulse oximeter simulator which could more accurately simulate the conditions of blood flowing through tissue in a controlled environment. They constructed a simulator with double layers of blood and milk to simulate the tissue conditions, however after testing the tissue portion (milk) was a source of error in saturation readings (Aoyaki et al., 2007). With further adjustment it was found that venous blood also contributes to the errors in pulse oximetry at which point they gave up on designing a pulse oximetry
Stellenbosch University http://scholar.sun.ac.za
Pag
e 5
4
simulator. But these effects and limitations of the system were compensated for in the design performed by Schoevers.
In this thesis Schoevers’ method was further adapted and modified to incorporate (1) separate systems for the oxygenation and deoxygenation of the arterial and venous circuits, (2) pressure monitoring of the diffuser liquid, (3) incorporation of a second Peristaltic pump to maintain low flow in the venous line, and (4) adding insertion points for oximetry catheters to continuously measure the oxygen saturation in-line for comparison with the blood gas analysis and the measured results of the pulse oximeter device.
Figure 35: Schoevers (2008) in-vitro test setup
5.2. Overview of the Technique
The in-vitro setup consists of two identical sub-circuits, namely the arterial and venous simulating loops, indicated in Red and Blue respectively in Figure 38. The arterial circuit is used to calibrate the sensors for conventional pulse oximetry i.e. localised analysis of only the arterial saturation. The combined circuits of both the arterial and venous loops can be used to verify and calibrate the overall absorption and reflection of two blood volumes which differ in oxygen saturation levels.
The circuit is such that human blood is circulated through the system and the operator can control the oxygen saturation in both of the sub-circuits.
To generate pulsatile flow in the arterial line, a ‘constant-flow’ peristaltic pump was modified by removing one of the impeller arms. The pulse rate is varied by adjusting the speed of the peristaltic pump. On the venous line a peristaltic pump is employed at a low speed to ensure constant low flow through the venous line.
To oxygenate and deoxygenate the blood, infant blood oxygenators were used in conjunction with nitrogen (N2), oxygen (O2) and carbon dioxide (CO2). Schoevers
Stellenbosch University http://scholar.sun.ac.za
Pag
e 5
5
made use of a D901 Lilliput 1 Oxygenator from Dideco whereas this study made use of two similar oxygenators, namely the Lilliput D902 Oxygenators which were donated by The Scientific Group (Scientific Group, 2009).
100% O2 is used to oxygenate the blood and a 95% N2, 5% CO2 mixture is used to decrease the degree of saturation during a desaturation period.
Homogenised 2% low fat milk is used as a diffusor to simulate the scattering properties of bloodless tissue, skin and bone (Edrich et al., 2000). The chambers are separated by flexible membranes that outwardly deform if pressure is applied to the chambers to simulate the change in tissue density and incident light path length during blood pulses.
The cuvette used in the system is illustrated in Figure 36, and the complete setup is shown in Figure 37.
Figure 36: In-Vitro Cuvette Model, original image by (Schoevers, 2008)
Figure 37: In-Vitro Test Setup
Stellenbosch University http://scholar.sun.ac.za
Pag
e 5
6
dasj
dfio
Oxy
gena
ted
Cha
mbe
rD
iffus
ion
Cha
mbe
rD
eoxy
gena
ted
Cha
mbe
r
Tran
smitt
ing
Phot
o D
iode
Rec
eive
r
95%
CO
2 5%
N2
Supp
ly T
ank
100%
O2
Supp
ly T
ank
Dat
a Lo
gger
SPID
ER 8
Dat
a Lo
gger
Co
mp
ute
r
Inse
rtion
Poi
nt fo
r:C
entra
l Ven
ous
Oxi
met
ry
Cat
hete
r
Inse
rtion
Poi
nt fo
r:C
entra
l Arte
rial O
xim
etry
C
athe
ter
Oxy
gena
tors
–
Lillip
ut D
902
with
Res
ervo
ir
Test
ing
‘Cu
vette
’
Mod
ified
Pe
rista
ltic
Pum
p –
Puls
atile
Arte
rial
Flow
Peris
talti
c Pu
mp
–
LOW
Ven
ous
Flow
Edw
ards
PC
C
athe
ter M
odul
e fo
r Dat
a lo
ggin
g
Edw
ards
PC
C
athe
ter M
odul
e fo
r Dat
a lo
ggin
g
2% M
ilk a
s D
iffus
er
Inlet for Saline Primer
Han
d Pu
mp
Ref
lect
ive
Phot
o D
iode
Rec
eive
r &
LED
Driv
er
Arte
rial S
imul
atin
g Lo
op
Veno
us S
imul
atin
g Lo
op
Figure 38: In-Vitro Test Setup
Stellenbosch University http://scholar.sun.ac.za
Pag
e 5
7
5.3. Calibration Procedure
The overall goal of the calibration procedure was to obtain a calibration curve where the APO's output ratio R could be correlated with blood oxygen saturation values. This process entails measuring R while fully desaturating the human blood in the system to where the SO2 << 20%.
The calibration procedure was divided into two phases, namely conventional arterial calibration and arterio-venous validation. During the conventional arterial calibration only the arterial circuit in the calibration setup is used. Both the arterial and venous circuits are used during the arterio-venous validation stage.
The steps for the arterial calibration are:
1. the entire circuit is first primed using a 0.9% saline solution 2. homogenised 2% low fat milk is injected into the diffusor chamber 3. all excess saline in the oxygenator's reservoirs is drained via a three-way
valve at the lower part of the circuit 4. approximately 500 ml of blood is directly injected into the oxygenator's
venous reservoir 5. the peristaltic pump is started 6. a drainage valve is used again to drain the saline in the system 7. a 100% supply of O2 is connected to the gas port of the oxygenator to fully
oxygenate the blood 8. a blood sample taken via a sample port and analysed using a GEM 3000
blood gas analyser. The analyser is used as the golden standard reference system for all measurements
9. the pH of the blood is noted and adjusted to physiological conditions by adding the necessary amount of Sodium Bicarbonate
10. the sensor is engaged to measure the absorption and reflection of the blood in the system for a period of 60 seconds
11. O2 supply is disconnected and replaced with the 95% N2/CO2 gas supply to deoxygenate the blood
12. time is allowed for the volume of blood to partially deoxygenate as the blood is circulated by the pump after which the N2/CO2 mix is switched off
13. time is allowed for the system to stabilise at the given saturation. 14. a reference blood gas sample is taken to be analysed 15. PPG data is again recorded and stored in conjunction with the reference
saturation values provided by the blood gas analyser and the PreSep Central Venous Oximeter Catheter readings.
This deoxygenation process is conducted repeatedly to obtain data of the stepwise decreasing saturation values, down to a saturation value of less than 10% to 20%.
Stellenbosch University http://scholar.sun.ac.za
Pag
e 5
8
To perform the arterio-venous validation phase, both the arterial and venous circuits are used. The steps are thus:
1. both circuits are primed in a similar manner to the arterial calibration phase 2. milk is injected into the diffusor chamber 3. approximately 500 ml of whole blood is injected into each of the
oxygenator's venous reservoirs and excess saline is drained 4. the venous and arterial blood are fully oxygenated using the O2 supply 5. reference blood samples are taken from both the arterial and venous
circuits and analysed 6. the pH of the blood is noted and adjusted to physiological conditions by
adding the necessary amount of Sodium Bicarbonate 7. once the blood conforms to human physiological conditions, the sensor
data is also collected 8. the arterial loop’s blood oxygen saturation is held constant 9. the N2/CO2 supply is connected to the venous circuit’s gas port, replacing
the O2 supply 10. a short period of time is allowed for a volume of the venous blood to be
partially deoxygenated 11. the N2/CO2 supply is stopped and time is allowed for system stabilisation 12. this dual process is conducted to provide two separate blood volumes at
separate saturations flowing through the cuvette 13. a dual reference sample is withdrawn from each circuit and analysed 14. the sensor data is collected during the analysis (i.e. logging time of
60 seconds) 15. the venous desaturation and data collection is repeated until venous
saturation is below 40% 16. the arterio-venous validation is performed at 4 different arterial saturation
levels, namely 100%, 80%, 60% and 40%
5.4. Secondary System Proposal
A secondary layout using only one oxygenator was also developed to oxygenate each circuit separately on one oxygenator by bypassing the oxygenator during the oxygenation or deoxygenation phases of a specific line.
This method was found to have numerous limitations as the system becomes more complex to control and the oxygenation in each line is not constantly being monitored. However, it could overcome a lack of equipment limitation if a second oxygenator could not be sourced. The oxygenators cost in the order of R8000 each and can only be used once.
The alternative setup is given in Appendix C.
Stellenbosch University http://scholar.sun.ac.za
Pag
e 5
9
5.5. Measurements
During the testing of the in-vitro test setup the following properties and system characteristics were monitored and logged:
the systolic, diastolic and mean blood pressure in both the venous and arterial lines
the systolic/diastolic blood pressures of the arterial and venous lines were maintained in the order of 150/100 mmHg and 30/20 mmHg respectively
the invasive oxygen saturation using PreSep venous catheters (donated to the project by Edwards Lifesciences specifically for research purposes)
oxygen saturation by means of blood samples analysed by a blood gas analyser
the readings measured by the device
pCO2, pO2, pH, Hct (%) – primary outputs from the blood gas analyser
the time and logging notes
the flow rates in the arterial and venous lines
throughout testing the blood temperature was maintained at 38 °C
5.6. Chapter Summary
This data as well as that obtained in Chapter 4 was used to perform initial calibration curves for the system. The data processing is discussed further in Chapter 7.
The final stage of the research was to perform a descriptive and comparative case control study which could be used to verify and validate the prototype system. This chapter discusses the requirements and procedures for performing the clinical study.
All of the testing was performed within the operating theatres at Tygerberg Hospital and were performed under the supervision of trained medical staff.
The Health Research Ethics Committee (HERC) evaluated and certified the proposed test protocol.
6.1. Inclusion/Exclusion Criteria
The study consisted of 15 patients, all of whom were undergoing some form of orthopedic surgery on the day of testing. The inclusion criteria of the study were as follows:
mass of participant must be greater than 50 kg
participant must be older than 18 years
participant can be male or female
participants must have given written informed consent
patients that are physically able to partake in this study (determined by the supervising physician)
patients that have a normal Hb concentration
In comparison the exclusion criteria was relatively simple:
mass of participant is less than 50 kg
participants that have not given written informed consent
patients that are physically unable to partake in this study
Each test subject who met the inclusion criteria was firstly informed on all the possible risks associated with the test procedure. This primarily consisted of explaining the basic operating principles of the APO and the steps in the procedure for testing. Once the test subjects understood the basic procedure they were required to sign a written consent form to participate in the project.
All the tests were performed at Tygerberg Hospital, and due to the non-invasive nature of the study, there were sufficient willing participants to perform the study.
Stellenbosch University http://scholar.sun.ac.za
Pag
e 6
1
6.2. Testing Procedures
Once the patients had consented to participate, the APO was set up in the operating room in which the patient would be undergoing their specific surgery. The room was then prepared for the surgery by the clinical assistants. Once the testing location was prepared, the system setup was completed by performing pre-testing procedures to ensure correct operation of the system. These primarily check that all components of the system are operating as required.
Once the test subject was prepared for the operating room (OR), a surgical pneumatic tourniquet was placed around the arm to be inflated at a later stage to occlude the tissues in the arm and hand.
The pulse oximeter was placed on the patient’s finger and the inflatable cuff was wrapped around the same finger (in most cases the index finger). The subject was asked to keep their body movement to a minimum during the test procedure. The APO was then used to take baseline measurements of the patient’s oxygen saturation and a blood sample was taken to be used in a blood gas analyser to obtain a valid reference value for the oxygen saturation. The test setup is shown in Figure 39.
Figure 39: Clinical Testing – The proposed test setup
Stellenbosch University http://scholar.sun.ac.za
Pag
e 6
2
The blood sample, typically 0.5 ml, was drawn from the subject's finger by means of a normal finger pricking procedure conducted by the clinical assistant.
The tourniquet was then inflated to a pressure sufficient to cut off all normal blood circulation to the subject's hand. This is to simulate the occluded nature of affected tissue. A short period of time, not exceeding 5 minutes, was allowed for the saturation value in the tip of the finger of interest to decrease to a suitable value.
Once enough time had been allowed to decrease the oxygen saturation of the occluded blood, the APO system was rerun. Once the data was digitally collected, the pulse oximeter probe was removed and another blood sample was drawn as a reference to the current oxygen saturation levels.
After the measurements were completed, the clinical assistants deactivated the tourniquet system, thus restoring normal circulation in the subject's hand. The sensor and APG were then removed from the subject's finger.
In some of the testing cases the procedure was varied if the patient was to undergo a surgical procedure which required a tourniquet to be used for an extended period of time. In these cases, instead of removing the tourniquet after the initial ‘low-saturation test’ the testing procedure was repeated by leaving the tourniquet on and taking blood samples and APO measurements at fixed 5 minute intervals, thus getting saturation data for lower saturations in a controlled manner. These tests were justified as the subject required the tourniquet anyway and use of the APO would not affect the patient’s health or the surgical procedure in any way.
6.3. Ethical Aspects of the Study
1. Research participants
15 volunteers were recruited from the Tygerberg Hospital.
2. Remuneration
No remuneration was offered to the participants.
3. Procedure
Each test subject was informed of all the risks associated with the test procedure and was required to sign a written consent form to participate in testing.
4. Confidential Handling of Patient Information
All patient information was and will be handled and reported on in a confidential manner.
Stellenbosch University http://scholar.sun.ac.za
Pag
e 6
3
6.4. Limitations and Procedure Critiques
A few limitations were encountered during the testing of the system, one of which was the difficulty to draw blood from a pinprick once the arm was occluded, due to the decreased blood pressure in the occluded tissue. This problem is also faced by clinical staff when drawing blood from tissue which is badly occluded.
Another limitation faced during human clinical testing at Tygerberg Hospital was the difficulty of making use of the ECG and respiratory sensor in the surgical setting as sterilisation was seen as a problem and the cables would be in the way of surgical staff during their procedures. Fortunately these components of the study were verified on the porcine in-vivo testing model as well as volunteer testing without the occlusion of tissue.
6.5. Chapter Summary
The APO device produced clearly detectable PPG signals in all of the subjects tested in Tygerberg Hospital.
In conjunction with the data collected in the in-vitro and in-vivo testing techniques, the clinical testing data was used to determine probe specific calibration curves, all of which is discussed in further detail in Chapter 7.
Stellenbosch University http://scholar.sun.ac.za
Pag
e 6
4
CHAPTER 7: DATA ANALYSIS & TESTING RESULTS
Thus far throughout the thesis the focus has been the development of the pulse oximetry system and calibration techniques and procedures. The final component of the research is analyzing the data from the different testing procedures and correlating the data to test the co-variance and quality of the calibration techniques.
This chapter delves into the fundamentals of the signals analysis, the results from each of the testing techniques as well as the conclusions drawn from the correlations between the different data sets.
7.1. Data Analysis and Signal Extraction
The analysis of any biomedical signal is of utmost importance as the quality and significance of the signal features are dependent on the original signal quality of the sensor, and the signal analysis and extraction techniques.
There are numerous sources of error in any system, a few of which include signal noise, electromagnetic interference, as well as patient physiological conditions, to name but a few. Digital signal extraction technologies aim to reduce the signal noise without compromising the signals or the signal features.
Furthermore, by applying statistical modeling and analysis, the data extracted from the signals can be characterized and compared to other of the like to determine the significance and correlations between the signals. Statistical analysis is also used to determine whether the data is statistically relevant or whether it is an outlier or a ‘statistical anomaly’, and should thus be ignored from the rest of the data analysis.
7.1.1. Typical Signals
The typical signals obtained from the prototype, beyond having the fundamental signal being measured, generally also have a noise component, and an underlying trend which is affected by non-direct physiological feature (such as respiration). To perform an adequate signal analysis the necessary signal features need to be extracted from the base signal and to do so it is necessary to understand the signals being obtained from the device.
Stellenbosch University http://scholar.sun.ac.za
Pag
e 6
5
Figure 40: Typical PPG signals from the reflective photodiode
Figure 41: Frequency analysis of PPG signals from a transmittance and reflective photodiode
0 0.5 1 1.5 2 2.5 3 3.5 4 4.50.85
0.9
0.95
1
1.05
1.1
Time (sec)
Norm
alis
ed M
agnitude
Standard Pulse Oximetry PPG Wave Forms
filtered data
raw data
peak detection (min)
peak detection (max)
660nm
810nm
940nm
Motion Induced Artifact
0 5 10 15 20 25 30 35 40 45 500
0.05
0.1
0.15
0.2
0.25
0.3
0.35
Frequency [Hz]
Magnitude
FFT of PPG signals
Reflection
Transmitted
Stellenbosch University http://scholar.sun.ac.za
Pag
e 6
6
Figure 40 illustrates the fundamental PPG signals measured by the device (without the artificial pulse generation), the image shows the relative PPG signals of the 660 nm, 810 nm and 940 nm LEDs where the red signal is the raw signal and the blue is the filtered curve fit signal, on which the peak detection is performed. The primary PPG cardiac frequencies are in the order of 0.8 to 2.5 Hz (Shelley et al., 2011) and the primary frequencies of the artificially generated pulse are between 0.4 and 5 Hz, so the -3 dB low pass cutoff frequency was chosen to be 10 Hz to insure there was minimal signal quality lost during filtering.
Through testing it was found that the transmittance photodiode had a larger level of ambient noise, caused by increased scattering through the tissue as well as an increased susceptibility to ambient light. A Fast Fourier Transform (FFT) was performed on both the reflectance and transmittance PPG signals to analyze the frequency spectrum of the different signals, which is graphically represented in Figure 41. Both signals where measured at a sampling frequency of 200 Hz and the FFT was performed over 1000 samples. The difference between signal noise levels can clearly be seen.
Signal quality from the ECG and respiratory sensors was good with minimal noise, as shown in Figure 42 and Figure 43 respectively. However placement of the respiratory probe proved to be a critical factor, as the strap is susceptible to over stretching that induces error signals.
Figure 42: ECG Signal from the device
Figure 43: Respiratory Signal from the device
0 1 2 3 4 5 6 7 8 9
2.6
2.8
3
3.2
Time (sec)
Sig
nal M
agnitude
ECG Signal
0 2 4 6 8 10 12 14 16 18 20 220.9
0.95
1
1.05
1.1
1.15
Time (sec)
Sig
nal M
agnitude
Signal from Respiratory Sensor
Stellenbosch University http://scholar.sun.ac.za
Pag
e 6
7
7.1.2. Signal Breakdown
With the APG engaged, in non-occluded tissue, both the cardiac output pulses (heart beat) and artificial pulses are evident (Figure 44), the cardiac pulses are verified by the ECG signal and likewise the artificial pulses are generated by the microcontroller, thus their positions can be controlled and extrapolated. Figure 44 illustrates the difference in magnitude of the cardiac and artificial pulses.
Figure 44: APO PPG signal with both cardiac and artificial pulses
Furthermore, through signal analysis, peak detection can be employed to compute the differences between the artificial and cardiac pulses. Figure 45 shows the signal after the peak detection algorithm has been applied, firstly to detect all pulse peaks and second only the artificial pulse peaks. The same algorithm can be applied to determine the value and locations of the local minima.
But as can be seen in the images by comparing the ‘raw’ data to the filtered data - filtering can cause degradation in the true peak amplitudes, and if not applied correctly can cause a total loss of signal integrity.
0 1 2 3 4 5 6 7 8 9
0.65
0.7
0.75
0.8
0.85
0.9
0.95
1
1.05
Time (sec)
Magnitude
PPG Signal at 660nm with cardiac and artificial pulse generation
filtered data
raw data
ArtificialPulse
GeneratorPPG
Pulses
Cardiac PPG Pulses
Stellenbosch University http://scholar.sun.ac.za
Pag
e 6
8
Figure 45: Peak detection in all pulses (top) & only artificial pulses (bottom)
The threshold to determine the peaks in the tissue is a function of the perfusion of the PPG signal i.e. relative to the ratio of the amplitude of the AC component divided by the DC component of the signal. So in cases where the ratio is low i.e. a weak pulsatile component the threshold adapts to the weaker signal to perform peak detection.
7.2. Porcine In-Vivo Model
As was mentioned in Chapter 4, there were a few limitations encountered during animal testing, one of the most critical being the small size of the blood vessels in a few of the test specimens, which could not be overcome through probe redesign. In these cases probe placement became increasingly important and sensitive to movement as a slight movement of the probe could cause complete occlusion in the small blood vessels.
This led to many false data points where noise effects from ambient light and low blood volumes overpowered the signal produced by the probe.
The correlation between the observed oxygen saturation and derived R values can be seen in Figure 46 specifically for the 660 nm / 940 nm LED combination for both
0 1 2 3 4 5 6 7 8 9
0.7
0.8
0.9
1
1.1
Time (sec)
Sig
nal M
agnitude
PPG Signal with full peak detection
filtered data
raw data
peak detection
0 1 2 3 4 5 6 7 8 9
0.7
0.8
0.9
1
1.1
Time (sec)
Sig
nal M
agnitude
PPG Signal with only artificial pulse detection
Stellenbosch University http://scholar.sun.ac.za
Pag
e 6
9
the reflectance and transmittance scenarios. A second-order polynomial curve fit was allied to the data relationship between the SpO2 is not linear as seen in Equation 10.
Figure 46: The data correlation between multiple tests to determine the R curve for a 660/940nm combination
There is a relatively large error interval between the data fit and the measured data, which can lead to unreliable results in the system. Data scattering was a larger problem in the other wavelength data which could be due to improper probe placement where the blood vessel is too small to adequately cover the probes.
And due to these large errors and divergent nature of the results, it was not possible to apply multi-wavelength theory to calibrate the system.
However, when comparing the different R factors obtained from the different correlations, it was found that the 735 nm / 940 nm LED combination provided a relatively small error compared to some of the other combinations, which can be seen in Figure 47.
10 20 30 40 50 60 70 80 90 1001
2
3
4
5
6
Oxygen Saturation (%)
R-1
660nm/940nm reflectance LED combination - R correlation
Test 2
Test 4
Test 6
Test 7
Poly fit
10 20 30 40 50 60 70 80 90 1001
2
3
4
5
6
7
8
9
Oxygen Saturation (%)
R-1
660nm/940nm Transmittance LED combination - R correlation
Test 2
Test 4
Test 7
Poly fit
Stellenbosch University http://scholar.sun.ac.za
Pag
e 7
0
Figure 47: The Data correlation between multiple tests to determine the R curve for a 735nm/940nm combination
Oximeter calibration is highly dependent on the specific hardware used in the specific design and depending on the sourced LEDs and photodiodes; different combinations can prove to be more accurate, thus, also requiring accurate calibration techniques.
Due to the limitations encountered in this specific modeling technique, a secondary calibration technique was developed, namely the in-vitro test setup (the results of which are discussed in the next section).
7.3. In-Vitro Model
Using the system described in Chapter 5, a series of calibration tests were performed using ‘newly expired’ human blood from the blood bank, which was first diluted and then adjusted for the base excess to achieve ‘normal human’ physiological blood conditions.
The tests included adjusting only the oxygen saturation of the arterial line, as well as adjusting both the arterial and venous oxygen saturations in a controlled manner; while still generating an artificial pulse in the arterial component of the system, which is used to calculate the mixed oxygen saturation in the system. Different LED combinations were tested for their relative accuracy in determining the oxygen saturation passing through the system.
Figure 48 illustrates the measured oxygen saturation calibration points for each of the different LED combinations specific to the operation of the system. A second order polynomial fit was applied to each of the data sets. In total, 22 data points at different oxygen saturations were measured which were then used to calculate the R correlations. Each of the combinations where chosen for their specific extinction coefficients for the hemoglobin derivatives as illustrated in Figure 9. The
20 30 40 50 60 70 80 90 1000
5
10
15
Oxygen Saturation (%)
R-1
735nm/940nm reflectance LED combination - R correlation
Test 2
Test 4
Test 6
Test 7
Poly fit
Stellenbosch University http://scholar.sun.ac.za
Pag
e 7
1
combinations chosen include 660/940 nm, 660/810 nm, 735/890 nm, 660/890 nm and 735/940 nm wavelength combinations. In all of the test cases, all of the wavelength data was measured in the form of PPG graphs from which the R calibration curves were calculated.
As seen in the figure, there was some scattering in the data obtained, the maximum error between the curve fit and measured data was approximately 30% which translates to a possible ± 10% oxygen saturation error.
Figure 48: Correlation of R curves for the reflectance photodiode (Hct: 16%)
Figure 49 shows the data obtained specifically for very low saturation cases, it is interesting to note the difference in the level of the 735/940 nm in these mutually exclusive test cases, which implies the data obtained in the previous case of 735/940 nm is erroneous at the low saturations, and thus explains the difference in the underlying trend of the data.
Figure 49: Correlation of R curves at low mixed oxygen saturation (Hct: 23%)
10 20 30 40 50 60 70 80 90 100
0
0.5
1
1.5
2
2.5
Mixed Oxygen Saturation (%)
R-1
Correlation of R curves (Reflection Sensor)
660/810nm
660/940nm
735/890nm
660/890nm
735/940nm
0 5 10 15 20 25 30 350
0.1
0.2
0.3
0.4
0.5
0.6
0.7
Mixed Oxygen Saturation (%)
R-1
Correlation of R curves (Low Saturation)
660/810nm
660/940nm
735/890nm
660/890nm
735/940nm
Stellenbosch University http://scholar.sun.ac.za
Pag
e 7
2
In comparison, the data obtained when maintaining the arterial oxygen saturation at 80% is illustrated in Figure 50, where only the underlying venous oxygen saturation was adjusted. The data has a good correlation with the fitted data curves.
Figure 50: Correlation of R curves at fixed SaO2 with varied SvO2 (Hcta: 15%; Hctv: 18%)
The results of the in-vitro calibration test setup shows that it is possible to perform a calibration of a pulse oximeter through an in-vitro test setup, however more testing is required to obtain a more conclusive correlation. Furthermore, some more modifications may be required to the test curvette to reduce the internal resistance and pressure/volume compliance of blood flowing between the sensor ports of the curvette. Also further testing is required to better determine the effect of venous saturation on the measured data.
One method of better producing accurate pulsations within both the arterial and venous lines would to adjust the system to make use of a modern bypass peristaltic pump which can be programmed with the precise waveform to be generated in line. Unfortunately, for this thesis it was not possible to obtain any of these modern peristaltic pumps; as such, old decommissioned bypass roller pumps were used, which produced a basic pulse in the system, but the pulse generated in the system was of a low quality.
7.4. Human Clinical Testing
Lastly, the final method of calibrating the developed pulse oximeter, and testing the APO was human clinical testing in Tygerberg Hospital’s surgical theatres. Sixteen patients were tested, all of which were undergoing surgical procedures that required a tourniquet on a limb. The first APO test performed on each patient was performed under ‘normal’ conditions i.e. before the tourniquet is applied, so that the PPG signals consisted of both the cardiac pulses and the artificially generated pulses. An example of the reflectance PPG data was shown in Figure 44; in comparison Figure 51 illustrates an example of the data from the transmittance PD.
70 72 74 76 78 80 82 84 86 880
1
2
3
4
5
Mixed Oxyen Saturation (%)
R-1
Correlation of R curves (Arterial Saturation: const)
660/810nm
660/940nm
735/890nm
660/890nm
735/940nm
Stellenbosch University http://scholar.sun.ac.za
Pag
e 7
3
The increased level of noise in the transmittance data caused an increased possibility of false peak detection, which is also shown in the figure.
Figure 51: APO PPG signal with both cardiac and artificial pulses (Transmittance PD)
Figure 52 shows the unsynchronized superimposed PPG data of the different wavelengths used in the system at an oxygen saturation of 96%. The generated pulses are clearly detectable.
Figure 52: Superimposed AC signal of the artificially generated pulses
Once the data was obtained for the APO in normal conditions the tourniquet was applied and the surgical procedure was performed. Once the surgical procedure was complete, the APO was reapplied and data collected in the occluded scenario of decreased oxygen saturation. The APG was used to artificially generate a pulse in the tissue of the finger and thus generating an AC component in the mixed blood of the finger. This data was used to generate a calibration curve for the decreased saturation scenarios using the APO.
One of the major limitations of the test procedure was the method of blood samples taken from the patient for each of the tests. Capillary mixed blood samples
0 1 2 3 4 5 6 7 8 90.4
0.6
0.8
1
1.2
1.4
1.6
1.8
2
2.2
Time (sec)
Sig
nal M
agnitude
Transmittive PPG signal & noise
filtered data
raw data
peak detection
0 0.2 0.4 0.6 0.8 1 1.2 1.4 1.6 1.80.5
0.6
0.7
0.8
0.9
1
1.1
1.2
1.3
Time
Magnitude
Superimposed AC PPG data
Stellenbosch University http://scholar.sun.ac.za
Pag
e 7
4
were taken, but in some of the test cases the capillary blood flow was too low to gain an accurate measurement from the ‘gold standard’ blood gas analyser. Ideally to fully calibrate the system for both arterial and venous saturations it would be required to take arterial and venous specific blood samples for gas analysis, which was not possible in the localized testing of the finger. Using capillary blood gases it was still possible to perform calibration of the APO for mixed blood content and saturations.
The patient testing data for the R calibration curves is shown in Figure 53, where the top image is the inverse of R plotted against the capillary mixed oxygen saturation. The inverse of R was used as the divergence of the data can be more clearly seen graphically in this form.
Figure 53: Relationship of clinically obtained data
0 10 20 30 40 50 60 70 80 90 100
0.4
0.5
0.6
0.7
0.8
0.9
1
Mixed Oxygen Saturation (%)
R-1
Correlation of R curves derived from APO clinical data
Patient 2 (Hct: 42%)
Patient 8 (Hct: 28%)
Patient 6 (Hct: 38%)
Patient 7 (Hct: 42%)
Patient 9 (Hct: 30%)
Patient 10 (Hct: 30%)
Patient 11 (Hct: 37%)
Curve fit of Patient 2
Curve fit of Patient 8
0 10 20 30 40 50 60 70 80 90 1001
1.5
2
2.5
3
3.5
Mixed Oxygen Saturation (%)
R'
Correlation of R curves derived from APO clinical data
Patient 2 (Hct:42%)
Patient 8 (Hct:28%)
Patient 6 (Hct:38%)
Patient 7 (Hct:42%)
Patient 9 (Hct:30%)
Patient 10 (Hct:32%)
Patient 11 (Hct:37%)
Curve fit of Patient 2
Curve fit of Patient 8
Average curve fit
Stellenbosch University http://scholar.sun.ac.za
Pag
e 7
5
The bottom component of Figure 53 shows the R calibration curve in the standard form with the average curve fit of the data, which also shows the correlation between the data plots of the patients which had surgical procedures which allowed for multiple saturation measurements, i.e. Patients 2 and 8.
At the higher saturations (where more data was collected) there were some discrepancies in the data obtained, which can largely be attributed to different hematocrit concentrations. The accuracy of the curve fit is further discussed in the next section.
7.5. System Correlations and Discrepancies
With all of the data collected from the different calibration techniques, a comparison of the data and calibration curves was required. The data reported thus far for the in-vitro and clinical testing was of mixed oxygen saturations with tissue effects; whereas the data obtained in the porcine study was for a purely arterial signal. Assuming that the arterio-venous absorption compliance as discussed in Section 1.5 and 2.5 is in the order of 1.5, the modified calibration curve is in the form as plotted in Figure 54, which shows the average curve fits for all the data. The bias differences of the curves can be attributed to the differences in tissue and simulated tissue absorption. By normalizing the calibration curves to the levels of the clinical testing, the slope correlation between the curves can be compared to determine the effectiveness of the different calibration procedures.
Figure 54: Porcine, in-vitro and clinical calibration curves
0 10 20 30 40 50 60 70 80 90 1000
0.5
1
1.5
2
2.5
3
Mixed Oxygen Saturation (%)
R
Calibration Curves for 660/940nm
0 10 20 30 40 50 60 70 80 90 1001
1.5
2
2.5
3
Mixed Oxygen Saturation (%)
R
Normalised Calibration Curves for 660/940nm
In-vitro
Porcine
Clinical
Stellenbosch University http://scholar.sun.ac.za
Pag
e 7
6
By comparing the curves in Figure 54, the correlation between the calibration techniques can be evaluated. Overall the three testing methods show a fair correlation at lower saturations; however the clinical data diverges from the other two techniques. For each of the test procedures the error between the original test data and the final calibration curve was calculated and found to be a maximum of 35% in the porcine tests, 21% in the in-vitro tests and 20% in the clinical tests which can lead to an error in the calculated oxygen saturation of 18%, 13% and 21% in each of the tests respectively. These errors are substantial. One way to overcome these errors would firstly be to acquire more test data from the different techniques to improve the confidence interval of the results, and second, by improving the APOs algorithm the measured results could also be improved.
7.6. Chapter Summary
Through experimentation and testing of the different testing models a correlation between the calibration curves was developed, however within the data collected there was a large degree of scatter in each of the different testing models. This low confidence interval could be improved by performing further studies and improving the signal extraction algorithms. But this type of inaccuracy has been observed in numerous types of commonly used pulse oximeters even in the optimal range of SO2>85% (Van de Louw et al., 2001).
However, even with the large possible error in the results the study has shown it is possible to artificially generate a regular pulse in occluded tissue, and thus make it possible to measure the oxygen saturation non-invasively through pulse oximetry, which was previously not possible.
Stellenbosch University http://scholar.sun.ac.za
Pag
e 7
7
CHAPTER 8: CONCLUSIONS & RECOMMENDATIONS
8.1. Conclusions
Pulse oximetry has become a common tool found in medical institutions as it can provide valuable information about the patients’ health, it has however been proven to be ineffective in numerous scenarios, including cases where there is low tissue perfusion and cases where there is tissue occlusion. In such cases, the availability of a device which can perform continuous non-invasive oxygen saturation monitoring would prove to be an invaluable tool. Such a device could possibly provide information about ischemic tissue and what the relative state of the tissue is over time, which can in turn lead to improved treatment and decision-making of intervention methods.
Conventional pulse oximeters that measure the SaO2 rely on the pulsatile component of PPG signals measured in the tissue being monitored, in cases where there is no pulsatile signal oximeters prove to be most ineffective. This thesis, together with the results obtained by Schoevers in 2008 aimed to overcome these limitations by developing the APO which can artificially generate a pulse in occluded tissue from which the oxygen saturation can be calculated. Secondly, by generating a clearly detectable pulse in tissue which isn’t occluded it is possible to calculate the difference of saturations between the SaO2 and SvO2, making it possible to calculate these two components of the blood in tissue being monitored.
The development of a pulse oximeter does not only consist of the designing of a device but also system calibration techniques, validation models and the development of a signals analysis algorithm, all of which contribute equally to the effective development of the system. Beyond the development of the APO, this study also consisted of developing and testing an effective method to calibrate such devices.
Three calibration techniques were used in this study, namely, animal testing (porcine), in-vitro testing and human clinical trials. The study found that all three methods allowed for the development of calibration curves for the device, however all three techniques had inherent limitations.
For the porcine study, physiological limitations caused that of the seven tests, only four provided credible results which could be used for developing system specific calibration curves. Furthermore, besides the limitations faced in animal testing, this form of study proved to be very expensive, reducing the viability of using such a method for system calibration and validation.
Stellenbosch University http://scholar.sun.ac.za
Pag
e 7
8
The in-vitro study, though not part of the original scope of the study proved to be a credible method of developing system calibration curves in conjunction with human clinical validation techniques. Though the system did not comprise of all the ideal components, it did result in a calibration curve of a similar trend to that obtained in the clinical testing with a bias difference between the curves. The bias was an expected difference between the calibration curves, as the thickness and volumes of scattering mediums is different to that in human tissue. With modifications and further testing it is the author’s opinion that an in-vitro technique can prove to be credible method of pulse oximeter calibration.
Finally the last form of calibration and testing comprised of a human clinical study which was performed in the operating theatres at Tygerberg Hospital. Testing of the APO proved that it was possible to artificially generate a repeatable pulse in fully occluded tissue and be used to calculate the oxygen saturation in low saturation scenarios. The initial results showed the system to have a relatively high error, but with further testing and the improvement of calibration techniques the accuracy of the device can be improved, thus also be used to calculate both SaO2 and SvO2.
Through testing of the developed device it was found that making use of the multiple wavelengths may provide valuable data about the tissue being monitored for system research and system development would be required to fully utilise the extra data. It was however found that the 660/940 nm LED combination proved to be the most accurate for calculating the oxygen saturation.
In conclusion, though the results of the thesis do not prove to be the most accurate in the limited testing performed, it was shown that it is possible to non-invasively measure the oxygen saturation in occluded tissue and improve the performance of oximeters during low saturation scenarios. With alternative clinical validation techniques it would be possible to calculate both SaO2 and SvO2, though in this study the accuracy of such results are still inconclusive.
8.2. Recommendations
In developing a medical device such as the APO there are numerous facets of the design which need to be fully considered; and a result the scope of fully developing such a system is more complex than purely developing a device to obtain the PPG waveforms. Without adequate calibration techniques it is not possible to accurately develop such a system. The recommendations for future work are broken up into two components namely, hardware recommendations and calibration system recommendations.
8.2.1. Hardware Recommendations
Though the developed pulse oximeter proved to be able to measure the oxygen saturations, further development is required to obtain a commercially viable
Stellenbosch University http://scholar.sun.ac.za
Pag
e 7
9
product. The APO system made use of a µOLED graphical display to display the parameters measured by the different components of the system, but further development is required to develop a fully functional GUI, which allows for the user to input secondary parameters and so that the system can perform a real-time analysis on the data being measured. One possible platform for the device would be a smart phone or tablet, which has the computational power of a PC, and a fully functioning user interface which does not require secondary peripherals, such as keyboards to enter information.
Although it has been theorised that multi-wavelength pulse oximetry is the way of the future (Aoyaki et al., 2007), it may be more feasible from a system development point of view to implement a commercially validated module and probe onto the APG to measure the PPG signals as sourcing of multi-wavelength LEDs for prototyping proved to be a limiting factor in the design process.
The APG itself proved to be able to generate a uniform repeatable pulse, which during clinical testing did not cause any discomfort to patients, it could however through different manufacturing techniques be made smaller to fit on a wider range of finger sizes, including that of children and infants.
8.2.2. Calibration System Recommendations
The development of calibration techniques is of critical importance for the accurate development of pulse oximeters. Porcine calibration techniques, though accurate in simulating physiological conditions have numerous other limitations and are not a feasible method to perform repeatable testing, which also has ethical repercussions. Consequently it is the authors’ opinion that more focus should be placed on the development of an in-vitro test setup which can be used to accurately simulate tissue conditions. If such a system was to be developed, different colour filters could be used to simulate the differences in skin colour as well as other possible pigment effects. Another possibility would be to make use of modern bypass peristaltic pumps to more accurately simulate the blood pulsations through the tissue.
In terms of the human validation phase and the development of the system to calculate the SvO2 and SaO2 levels would require a different clinical study which would include a method of collecting both arterial and venous blood samples to be used for the validation of measurements, without these comprehensive measurements there is no way to validate that the system is accurately measuring the desired parameters.
Stellenbosch University http://scholar.sun.ac.za
Pag
e 8
0
REFERENCES
A.D.A.M., 2006. ECG electrode placement. [Online] A.D.A.M., Inc Available at: http://adam.about.net/encyclopedia/ECG-electrode-placement.htm [Accessed 21 May 2011].
ABE 2062 Biology for Engineers, 2006. Lecture 20. [Online] Available at: http://www.agen.ufl.edu/ [Accessed August 2008].
ADInstruments, 2010. Heat & Circulation (English). [Online] (1.1) Available at: http://www.adinstruments.com/solutions/experiments/ [Accessed May 2011].
AHA, 2011. American Heart Association. [Online] Available at: http://www.heart.org/HEARTORG/ [Accessed February 2011].
Analog Devices, 2010. ADXL103/ADXL203: Precision ±1.7 g Single-/Dual-Axis iMEMS Accelerometer. Datasheet. Norwood: Analog Devices, Inc.
Anon., 2010. Blood Pressure. [Online] Available at: http://www.heart.org/HEARTORG/Conditions/HighBloodPressure/ [Accessed June 2011].
ANZCP, 2011. Basic principles of design of an ECG amplifier. [Online] Available at: http://www.anzcp.org/CCP/Biomedical%20electronics/biomed/ECG%20amplifier.htm [Accessed March 2011].
Aoyagi, T.E.E., 2003. Pulse Oximetry: its invention, theory and future. Journal of Anesthesia, 17(4), pp.259-66.
Aoyaki, T. et al., 2007. Multiwavelength Pulse Oximetry: Theory for the Future. International Anesthesia Research Society, 105(6), pp.S53-8.
Arduino, 2010. Arduino Mega 2560. [Online] Arduino Available at: http://arduino.cc/en/Main/ArduinoBoardMega2560 [Accessed May 2011].
Biolog, 2007. Electrode Placement. [Online] Available at: http://www.biolog3000.com/electrode.htm [Accessed May 2011].
Breathnach, C.S., 1966. George GabrielStokes on the function of haemoglobin. Irish Journal of Medical Science (1926-1967), Sixth(484), pp.121-5.
Bye, P.T., Farkas, G.A. & Roussos, C., 1983. Respiratory Factors Limiting Exercise. Annual Review of Physiology, 45, pp.439-51.
Charkoudian, N., 2003. Skin Blood Flow in Adult Human Thermoregulation: How It Works, When It Does Not, and Why. Mayo Clin. Proc., 78, pp.603-12.
Coetzee, F.M..E.Z.., 2000. Noise-Resistant Pulse Oximetry Using a Synthetic Reference Signal. IEEE Trans Biomed Eng, 47(8), pp.p1018 - 1026.
Coetzee, A.R., 2008. Discussions on the best methods of performing animal testing. [Personal Communication].
Cohn, S.M., 2006. Near-Infrared Spectroscopy: Potential Clinical Benefits in Surgery. J. Am. Coll. Surg., 205(2), pp.322-32.
Cope, M., 1991. The Application of Near Infrared Spectroscopy to Non Invasive Monitoring of Cerebral Oxygenation in the Newborn Infant. PhD Thesis. London: Department of Medical Physics and Bioengineering University College.
Curran, R., 2009. The Vital Signs. [Online] Available at: http://www.emsworld.com/article/10320429/ [Accessed September 2011].
Davidson, J.A.H. & Hosie, H.E., 1993. Limitations of Pulse Oximetry: Respiratory Insufficiency - a failure of detection. BMJ: 307, 307(6900), pp.372-73.
Dippenaar, R. & Schoevers, J., 2008. Discussions on the feasible monitoring and treatment techniques of Meningococcemia in infants. [Personal Communication].
Dippenaar, R., Smith, J., Goussard, P. & Walters, E., 2006. Meningococcal purpura fulminations treated with medicinal leeches. Pediatric Critical Care Medicine, 7, pp.476-78.
Edrich, T., Flaig, M., Knitza, R. & Rall, G., 2000. Pulse Oximetry: an improved in vitro model that reduces blood flow-related artifacts. IEEE Transactions on Biomedical Engineering, 47(3), pp.338-43.
Elwell, C. & Hebden, J., 2000. Near-Infrared Spectroscopy. [Online] Available at: http://medphys.ucl.ac.uk/research/ [Accessed 1 August 2007].
Enderle, J., Blanchard, S. & Bronzino, J., 2005. Introduction to Biomedical Engineering. 2nd ed. Burlington MA: Elsevier Academic Press.
Figliola, R.S. & Beasley, D.E., 2006. Theorey and Design for Mechanical Measurements. 4th ed. Hoboken, NJ, United States of America: John Wiley & Sons, Inc.
Fourie, P., 2008. Discussions on the need for devices to monitor the condition of occluded tissue. [Personal Correspondence].
Fresenius Medical Care, 2009. Anaemia. [Online] Available at: http://www.fmc-renalpharma.com/anaemia.htm [Accessed September 2011].
Frey, B., Waldvogel, K. & Balmer, C., 2008. Clinical applications of photoplethysmography in paediatric intensive care. Intensive Care Med, 34, pp.578-82.
Gallant, M.I., 2010. Transimpedance Photodiode Amplifier. [Online] Available at: http://www.jensign.com/transimpedanceamp/ [Accessed Feb 2011].
Goldman, J.M., Petterson, M.T., Kopotic, R.J. & Barker, S.J., 2000. Masimo signal extraction pulse oximetry. Journal of Clinical Monitoring and Computing, 16, pp.475-83.
Gray, H., 2000. Anatomy of the Human Body. [Online] (20) Available at: http://www.bartleby.com/ [Accessed September 2011].
Hill, E. & Stoneham, M.D., 2000. Practical Applications of Pulse Oximetry. [Online] World Federation of Societies of Anaesthesiologists Available at: http://www.nda.ox.ac.uk/wfsa/html/u11/u1104_01.htm [Accessed June 2009].
Hollis, V.S., 2002. Non-Invasive Monitoring of Brain Tissue Temperature by Near-Infrared Spectroscopy. PhD Thesis. London: University of London.
Hutton, P. & Clitton-Brock, T., 1993. The Benefits and Pitfalls of Pulse Oximetry. BMJ: 307, 307(6902), pp.457-58.
Ilex Ltd, 2011. Ilex South Africa Pty (Ltd). [Online] Available at: www.ilex.co.za [Accessed April 2011].
Jenkins, D., 2009. ECG Library. [Online] Available at: http://www.ecglibrary.com [Accessed 9 Aug 2011].
Jubran, A., 2004. Pulse Oximetry. Intensive Care Med, 31(11), pp.2017-20.
Kamat, V., 2002. Pulse Oximetry. Indian J. Anaesth., 46(4), pp.261-68.
Kendrick, A.H., n.d. Pulse Oximetry. The buyers' guide to repiratory care products, pp.190-214.
Kirsch, E.A., Barton, R.P., Kitchen, L. & Giroir, B.P., 1996. Pathophysiology, Treatment and Outcome of Meningococcemia: A Review and Recent Experience. The Pediatric Infectious Disease Journal, 15(11), pp.967-79.
Kokholm, G., 1990. Simultaneous measurements of blood pH, pCO2, pO2 and concentrations of of hemoglobin and its derivatives - A multicentre study. Scand. J. Clin. Lab. Invest., 203, pp.75-86.
Komiyama, T..Q.V..S.H..F.M., 2001. Comparison of two spatially resolved near-infrared photometers in the detection of tissue oxygen saturation: poor reliability at very low oxygen saturation. Clin Sci (Lond)., 101(6), pp.715-8.
Leclerc, F. et al., 2006. Do new strategies in meningococcemia produce better outcomes? Critical Care Medicine, 28(9), pp.S60-63.
Li, K., 2010. Wireless Reflectance Pulse Oximeter Design and Photoplethysmographic Signal Processing. MSc thesis. Manhattan: Department of Electrical & Computer Engineering Kansas State University.
LuMriX.net, n.d. Tracheotomy. [Online] Available at: www.lumrix.net/medical/otolaryngology/tracheotomy [Accessed June 2009].
Lutwick, L.I., 2006. Meningococcemia. [Online] Gale Encyclopedia of Medicine Available at: http://www.healthatoz.com/ [Accessed September 2008].
Mannheimer, P.D., 2007. The Light–Tissue Interaction of Pulse Oximetry. Anesth Analg, 105(6), pp.S10-17.
Martini, F.H. & Bartholomew, E.F., 2007. Essencials of Anatomy & Physiology. San Francisco, CA, United States of America: Pearson Education Inc.
Parker, P.M., 2009. Common Expressions: Photoplethysmograph. [Online] Available at: http://www.websters-online-dictionary.org/definitions/Photoplethysmograph [Accessed August 2011].
Prutchi, D. & Norris, M., 2005. Design and Development of Medical Electronic Instrumentation. New Jersey: John Wiley & Sons, Inc.
Ramos-e-Silva, M. & Pereira, A.L.C., 2005. Life Threatening Eruptions due to Infectious Agents. Clin Dermatol., 23(2), pp.p151 - 153.
Rusch, T.L., Sankar, R. & Scharf, J.E., 1996. Signal Processing Methods for Pulse Oximetry. Comput. Biol. Med., 26(2), pp.143-59.
Russel, W.M.S. & Burch, R.L., 2002. The Principles of Humane Experimental Technique. London: Methuen.
Schoevers, J.E., 2008. Low Blood Oxygen Saturation Quantification in Human Arterial and Venous Circulation. MSc Thesis. Stellenbosch: University of Stellenbosch.
Scientific Group, 2009. The Scientific Group. [Online] Available at: http://scientificgroup.com [Accessed March 2011].
Severinghaus, J.W., 2002. The History of Clinical Oxygen Monitoring. International Congress Series, 1242(6), pp.115-20.
Shelley, K. et al., 2011. A Method for Determining the Peripheral Venous/Arterial Compliance Ratio. [Online] AUA Available at: https://www.auahq.org/members/ [Accessed June 2011].
Shigley, J.E., Mischke, C.R. & Budynas, R.G., 2004. Mechanical Engineering Design. 7th ed. New York, NY: McGraw-Hill.
The Titi Tudorancea Learning Center, 2010. Tracheotomy. [Online] Available at: http://www.tititudorancea.org/z/tracheotomy.htm [Accessed Sept 2010].
Tisdall, M., 2009. Non-invasive near infrared spectroscopy: a tool for measuring cerebral oxygenation and metabolism in patients with traumatic brain injury. MD Thesis. London: The Institute of Neurology University College London.
UFI, 2010. UFI Model 1132 Pneumotrace II™. [Online] Available at: http://www.ufiservingscience.com/model_1132.html [Accessed October 2010].
Ullman, D.G., 2003. The Mechanical Design Process. 3rd ed. New York, NY: McGraw-Hill.
Van de Louw, A. et al., 2001. Accuracy of Pulse Oximetry in the Intensive Care Unit. Intensive Care Med., 27, pp.1606-13.
Waller, A.D., 1887. A demonstration on man of electromotive changes accompanying the heart's beat. J Physiol, 8(5), pp.229-34.
Westerson, D., 2007. Understand and apply the transimpedance amplifier (Part 1). [Online] National Semiconductor Corp. Available at: http://www.eetindia.co.in/STATIC/PDF/200708/EEIOL_2007AUG08_RFD_NETD_SIG_TA_01.pdf?SOURCES=DOWNLOAD [Accessed Sep 2010].
White, F.C. & Bloor, C.M., 1981. Coronary collateral circulation in the pig: correlation of collateral flow with coronary bed size. Basic Res. Cardiol., 76(2), pp.189-96.
White, F.C., Roth, D.M. & Bloor, C.M., 1986. The pig as a model for myocardial ischemia and exercise. Lab Anim Sci., 36(4), pp.351-56.
Williams, T., 2001. EMC for Product Designers. 3rd ed. Jordan Hill, Oxford: Butterworth-Heinemann.
WONCA & ICC, 2010. Clinical Use of Pulse Oximetry. Pocket Reference 2010. WONCA/ICC.
Zijistra, W.G., Buursma, A. & Meeuwsen-van der Roest, W.P., 1991. Absorption Spectra of Human Fetal and Adult Oxyhemoglobin, De-Oxyhemoglobin, Carboxyhemoglobin, and Methemoglobin. Clinical Chemistry, 37(9), pp.1633-38.
Zinke-Allmang, M., 2009. Respiration: The Properties of Gases and Cyclic Processes. In Physics for the Life Sciences. Toronto: Nelson Education Ltd. pp.202-50.
Zislin, B.D. & Christyakov, A.V., 2006. The history of Oximetry. Biomedical Engineering, 40(1), pp.44-47.
Zonios, G., Shankar, U. & Iyer, V.K., 2004. Pulse Oximetry Theory and Calibration for low Saturations. IEEE Transactions on Biomedical Engineering, 51(5), pp.818-22.
Stellenbosch University http://scholar.sun.ac.za
Pag
e A
-1
APPENDIX A: CIRCUIT DIAGRAMS
A.1. Arduino Mega 2560 circuit designs
Figure 55: Arduino Mega 2560 Schematic (Arduino, 2010) - Part 1
Stellenbosch University http://scholar.sun.ac.za
Pag
e A
-2
Figure 56: Arduino Mega 2560 Schematic (Arduino, 2010) - Part 2
Stellenbosch University http://scholar.sun.ac.za
Pag
e A
-1
A.2. Transimpedance Amplifier
According to Gallant (2010) and Westerson (2007) a reverse biased photodiode within a transimpedance amplifier circuit (Figure 57) can be modelled as an ideal fixed-current source (Ip) as shown in Figure 58, Figure 59 and 60.
CF
RF
+
-+5V
-5V
VOUTCoa
PD
V+
Figure 57: A reverse-biased photo diode and transimpedance amplifier
CiRi
Rs
Photodiode
N
PIp
Figure 58: Photodiode Equivalent Circuit
CiRi
Rs
+
-
L
Coa Roa
Cf
Rf
RL
Vout(f)
Ip
Figure 59: Photodiode and Transimpedance Amplifier Circuit.
where:
Ipd Photodiode Current Source Rs Photodiode Series Resistance
Rf Feedback Resistance L Series Inductance
Cf Total Feedback Shunt Capacitance Coa Op-Amp Input Capacitance
Stellenbosch University http://scholar.sun.ac.za
Pag
e A
-2
Ri Photodiode Shunt Resistance Roa Op-Amp Input Resistance
Ci Photodiode Shunt Capacitance
CRi +
-
Roa
Cf
Rf
RL
Vout(f)
Ip
Figure 60: Simplified photodiode and Transimpedance Amplifier Circuit
The equivalent circuits where used to calculate the feedback capacitance Cf, to ensure that the design has sufficient bandwidth while still being stable (Westerson, 2007).
It was assumed that Rs is small enough to be ignored and the inductive element L is negligible for frequencies below 100 MHz. And the photodiode shunt resistance is typically >> 100 MΩ. Further it is assumed that the current source generates by the photodiode action is ideal for all derivations.
Further, by considering Figure 60, and assuming that the op-amp is also ideal, the transfer function of the circuit can be derived as:
Equation 17: Transimpedance
amplifier transfer function
And the equivalent capacitance is:
Equation 18: Equivalent
capacitance
Now considering the amplifier input to output ratio (F):
⁄
⁄ ⁄
( )
Equation 19: Transimpedance feedback factor
Stellenbosch University http://scholar.sun.ac.za
Pag
e A
-3
Therefore the poles for the circuit are:
( )
Equation 20: Transimpedance
circuit poles
And the open circuit gain A is
Equation 21: Gain
Bandwidth Product
Thus to stabilise the circuit Cf needs to be chosen such that
( )
Equation 22: Transimpedance feedback factor
(2)
Which using the relationships ⁄ ⁄ the
resulting simplified equation is:
(
)
Equation 23: Simplified Cf
equation
Which if assuming can be further simplified to:
√
√
Equation 24: Simplified Cf
equation
Compared to the online calculator produced by Gallant (2010) which calculates the Cf for optimum flat transimpedance response to be approximately 22 pF.
However through testing and experimentation of the system, it was found that a shunt capacitance of < 30 pF had too much ringing, and was thus iteratively changed to a Cf = 56 pF. This response to giving the circuit some overcompensation to reduce ringing is also suggested by Westerson (2007). The limitation of overcompensating the circuit is that the bandwidth of the transimpedance amplifier will also be reduced.
Figure 65: Constant Current Sink LED Driver Circuit
A.6. Accelerometer Circuit
+
-
+5V
-5V+ Input A
ccelerometer
+ Output -
COM3
DNC5
DNC4
DNC2
Yout6
ST1
Xout7Vs
8
+X
+Y
10n 10n
100n
+5V
AccelerometerADXL 203
Figure 66: Accelerometer Circuit
Stellenbosch University http://scholar.sun.ac.za
Pag
e A
-7
A.7. EEPROM Circuit
CS1
SO2
WP3
V-4
V+8
HOLD7
SCK6
SI5
EEPROM 25LC1024
+5V
5k6
5k6
100n
SCK1
SDI12
EEPROM CS1
SDO12
Figure 67: EEPROM Circuit
A.8. μOLED Circuit
Vin1
TX2
RX3
Gnd4
Res5
+5V1
TX12
RX13
Gnd5
Reset4
100n
1k
+5V
Atmel 2560 8-bit Microcontroller
uOLe
d-32
0240
Figure 68: OLED Circuit Connections
A.9. Solenoid Control Circuit
N.C.560
Gnd2
OutSol1
Output toSolenoid 1
+24V +5V
N.C.
Solenoid Switch 1
TSC-105L3H5VDC Relay
2N2222
Figure 69: Solenoid Valve Control Circuit
Stellenbosch University http://scholar.sun.ac.za
Pag
e A
-8
A.10. Pressure Sensor Controlling Circuit
390
N.C.
+12V+24V
Gnd3
Out2
V+1
Input from SDE1 Pressure Sensor
Gnd2
OutPump1
Output toCompressors TSC-105L3H
5VDC Relay
Figure 70: Pressure Sensor feedback circuits
A.11. Power Supply Circuits
LM317K
ADJ
2
IN1
OUT3
100n 1uF
5602k2
12V+
-
Vout = 5V+
+
Figure 71: Voltage Regulator Circuit - 5V DC
GND
2
IN1
OUT3
L7812CV
0.33uF 100nF24V
+
-
Vout = 12V+
+
Figure 72: Voltage Regulator Circuit - 12V DC
Stellenbosch University http://scholar.sun.ac.za
Pag
e A
-9
NC1
CAP+2
GND3
CAP-4
V+8
OSC7
LV6
Vout5
7660CPAZ Voltage Converter
10uF
COSC RL
10uF
V+(+5V)
-VOUT
IS
(-5V)
+
+
Figure 73: Voltage Regulator Circuit - negative 5V DC
Stellenbosch University http://scholar.sun.ac.za
Pag
e B
-1
APPENDIX B: DATA SHEETS
B.1. LED Datasheet information
Table 6: LED Optical Characteristics
SMT 660 SMT 735 SMT 810 SMT 890 SMT 940
Maximum Ratings
Item Unit Power Dissipation mW 120 100 190 150 140
Forward Current mA 50 50 100 100 100
Reverse Voltage V 5 5 5 5 5
Operating Temperature °C -20 to +80 -20 to +80 -20 to +80 -20 to +80 -20 to +80
Electro-Optical Characteristics
Item Unit
Typical Value (IF=
20mA)
Typical Value (IF=
50mA)
Typical Value (IF=
50mA)
Typical Value (IF=
50mA)
Typical Value (IF=
50mA)
Forward Voltage V 1.9 1.9 1.6 1.45 1.3
Total Radiated Power mW 3.5 10 18 8 15
Brightness mcd 110 Radiated Intensity mW/sr
5 8 4 6
Peak Wavelength nm 660 735 810 880 940
Half Width nm 20 20 40 75 50
Viewing Half Angle deg. 50 55 55 55 55
B.2. Model 1132 respiration transducer specifications
Table 7: Model 1132 respiration transducer specifications
Signal source Piezoelectric Excitation required None Signal output 20 to 200 mV into a one mega Ohm load Transducer package size
280 mm x 25 mm x 3.2 mm
Instrumented diameter 20 cm to over 250 cm – 122 cm hook- and- loop strap provided to link ends of transducer package
Lead length 305 cm Other characteristics Waterproof & Washable
Stellenbosch University http://scholar.sun.ac.za
Pag
e B
-2
B.3. Lilliput D902 Oxygenator specifications
Table 8: Lilliput D902 Technical Features
Max. Blood Flow 2300 ml/min
Ref. Blood Flow 3300 ml/min
Membrane Type Microporous Polypropylene
Membrane Surface Area 0.64 m2
Rigid Venous Reservoir Volume 1800 ml
Static Priming Volume 105 ml
The D902 Lilliput 2 Infant Hollow Fibre Oxygenator is intended for use in cardiopulmonary bypass circuits as a device to replace the function of the lungs. (dideco, 2006)
The PreSep Central Venous Oximetry Catheter is a haemodynamic monitoring probe, indicated for use through blood sampling, central venous pressure monitoring, and central venous oxygen saturation measurement (Edwards Lifesciences, 2003).
B.5. Photodiode BPW34S (R18R) datasheet information
Table 10: BPW34S characteristics
Maximum Ratings
Power Dissipation mW 150
Reverse Voltage V 32
Operating Temperature °C -40 to +100
Electro-Optical Characteristics
Spectral Sensitivity nA/Ix 80 (≥ 50)
Wavelength of max Sensitivity nm 850
Spectral Range (10% of max) nm 400 to 1100
Radiant Sensitive Area mm2 7
Half Angle deg. ± 60
Dark Current nA 2
Short-circuit current µA 80 Rise and Fall times of photocurrent ns 20