Non-malnourished under five children in Dhaka slums: Associated factors and behaviors A Research Protocol Study Submitted by: Md. Shanjad Bin Inam Supervisors: Lena Haglin, Leonie Dapi Nzefa Masters of Public Health (MPH) Course Masters Program 2006-07 Umea International School of Public Health Submitted to: Department of Public Health and Clinical Medicine Epidemiology and Public Health Sciences Umea University Umea, Sweden
Transcript
Non-malnourished under five children in Dhaka slums: Associated factors and behaviors
A Research Protocol Study
Submitted by: Md. Shanjad Bin Inam Supervisors: Lena Haglin, Leonie Dapi Nzefa
Masters of Public Health (MPH) Course Masters Program 2006-07
Umea International School of Public Health
Submitted to: Department of Public Health and Clinical Medicine
Epidemiology and Public Health Sciences Umea University Umea, Sweden
2
TABLE OF CONTENTS
A. Acknowledgements 3 A. Abstract 4 B. Background 5 C. Rationale 7 D. Aim of the study 7 E. Methodology 8
Study population 8
Inclusion and exclusion criterion 8
Area selection 8
Study period 9
Study design 9
Sampling design 9
Sample size for quantitative data 10
Framework for information from qualitative study 11
Qualitative Themes 12
Data collection tools and research instruments 12
Data collection method 12
Data quality control 13
Data entry and analysis plan 13
F. Study limitation 17 G. Ethical issue 17 H. Action plan 18 I. Budget 19 J. References 20 K. Annexure 22
3
A. Acknowledgement I would like to express my sincere gratitude and thanks to:
Lena Haglin and Leonie Dapi Nzefa for their excellent supervision and guidance all the
way.
Heiko Becher for his excellent comment as moderator.
All staffs of Epidemiology and Public Health Sciences, Department of Public Health and
Clinical Medicine of Umea University for the academic, administrative and personal
support during my studies.
My course mates for excellent support and encouragement during my studies.
My friends who provided mental support during my studies.
My mother, wife and sisters who love me and encouraged me taking any challenge.
I remember my father to whom I lost in very early age would be so happy seeing me here.
4
B. Abstract Malnutrition is an important factor of child morbidity in Bangladesh. This protocol is mainly
focused on information from qualitative study to get knowledge about factors and associated
behaviors of the non-malnourished (well-nourished) “under five” children. A quantitative (cross
sectional) study will also be conducted to know the prevalence of the same. There are no studies
published on behavioral aspects of the non-malnourished slum children. The proposed study
under consideration will try to explore the issue. After getting the preliminary results for
prevalence the qualitative study will be conducted. Information from qualitative study will be
collected from mothers of both malnourished and non-malnourished children to observe the
circumstances emerging related to nutrition. Maximum diversity purposive sampling design will
be applied for qualitative method. Qualitative information will be collected from two slums, one
from highest and another from lowest prevalence of non-malnourished children. Key informant
interview, in-depth interview, non-participant daylong observation and Focus Group Discussion
will be conducted. The study result will come up with the explainable factors and behaviors
behind being non-malnourished children in slums, which may help developing socially
expectable and replicable intervention programs in future. Also this study would give some clues
for further quantitative study.
5
C. Background
Malnutrition is the major cause of disease burden in developing countries and is a principal factor
inhibiting further rapid declines in child mortality1. Approximately 70% of world’s malnourished
children live in Asia, resulting in the region having the highest concentration of childhood
malnutrition. Prevalence of stunting and underweight are high in South Asia where one in every
two preschool children is stunted2. In fact, Bangladesh has the highest prevalence of child
underweight of all countries in the world except North Korea, and only seven countries have a
higher prevalence of child stunting3 than that of Bangladesh. More than 54% of preschool-age
children equivalent to more than 9.5 million are stunted, 56% is underweight and more than 17%
of preschool children are wasted in Bangladesh4. Though prevalence of “under five” malnutrition
has declined steadily from 56% to 47% and “under five” mortality declined from 116/1000 to
88/1000 between the years 1996 to 20045, Bangladesh is still in the bottom line in the world
context.
The rapid migration of rural poor to urban slums of Bangladesh in search of livelihoods has
serious impacts on physical and socioeconomic conditions of the cities. Between 1986 and 1997,
slums grew by 67% in three major divisional cities (Dhaka, Chittagong and Khulna) 6. Urban
poor are now estimated at around 11 million or 37% of the urban population7. 14% of the urban
population lives below the poverty line and the largest gap between the rich and the poor is in the
urban areas. However, 50% of the slum population lives below the poverty line8. This rapid
growth of slum based urban poor, means that the number of malnourished children also is raising.
Studies conducted in urban areas of developing countries have shown that malnutrition is
associated with low income, employment status, household expenditure9, low education9-10,
housing status10-11 and birth order12. On the contrary, very few looked at the determinants for the
good nutritional status, especially in slums. A study in Bangladesh showed that taller mothers,
less parity, female headed households, higher income, electricity in the home and more floor
area, acted positively for the good nutrition in children13. However, positive behaviors of the
slum families for non-malnourished children have not been enough studied and the study under
6
consideration will look at the behaviors including the practices and beliefs of the caregivers of
children in Dhaka slums.
Malnutrition
Malnutrition is the condition that occurs when a person’s body is not getting enough energy and
nutrients. The condition may result from low food availability, unbalanced diet, absorption or
other medical problems. Some general symptoms include fatigue, dizziness, weight loss and
decreased immune response.14.The term can also encompass over nutrition. Malnutrition is
mostly characterized by Protein Energy Malnutrition (Marasmas, Kwashiorkor, Marasmic
Kwashiorkor) and Skin Infections in children.
Weight for age is a combined indicator of wasting and stunting. Bangladesh Demographic and
Health Survey defined underweight whose weight for age is below –2 SD from the median of the
reference population are classified as ‘under weight’ and those who fall below –3 SD are
classified as ‘severely under weight’. Any child whose weight for age is between –1 SD to +1 SD
median of the reference population is considered as non-malnourished children5.
Information on Bangladesh and Dhaka City
Bangladesh is located in South Asia surrounded by India, Myanmar and Bay of Bengal. It is
world’s 7th largest country in terms of population (150,448.339) 15. Total area is 144, 000 square
kilometer. Population density is 1075 people per square kilometer.
Dhaka is the capital city of Bangladesh with population of 11 million (2007) 16. Slum population
is 3.4 million with that 2.5 million are within Dhaka City Corporation area17.
7
D. Rational Developing countries are facing the universal problem of child malnutrition. Even in many
developed countries malnutrition of “under five” children is a threat for health policy makers
because of the diversity in child rearing practice and health seeking behaviors. For the last few
decades, Bangladesh has spent millions of dollars through different interventions including child
immunization, primary health services, parental education and media communication. Almost all
of them are direct intervention to the community. Since the prevalence of absolute poverty
(energy intake below 2254 kcal/day) is more than 45% of the population and prevalence of hard-
core poor are quite high (25%), 18 it is impossible to solve the child malnutrition problem only
through the direct interventions. The present study intends to explore the real community
participation to solve the problem of child malnutrition through searching solutions that exists
within the community. Slum children are the most vulnerable children in any context and
therefore selected population for this study. It is assumed that some children are well nourished
irrespective of areas, community and environment. Accordingly, in slum areas we expect to get
some families with well-nourished children where behaviors and practices favor child
development positively though they live in the slum community. These families can be identified
as positive deviants whose experiences and practices can be disseminated to the other families. In
respect to cost and sustainability of child nutrition program through self-administrative process
(families solve their children’s malnutrition problem), search for positive deviants and their
behaviors are essential. The results of the study may facilitate further development of the existing
child health program in Bangladesh in a sustainable way through ownership of family and
community.
E. Aim
1. To assess social conditions and circumstances behind different level of nutritional status of “under five” children living in slums along with the associated factors and behaviors of their families.
8
2. To assess the prevalence of non-malnourished ‘under five’ children in the slums of Dhaka. F. Methodology:
1. Study population
All “under five” children and their parents/caregivers in the slum areas of Dhaka city during the
study period.
Inclusion criterion:
All mothers/caregivers with children aged less than five years
Giving voluntary consent to participate.
Exclusion criterion:
Mothers unable to respond questioning.
Severely ill mothers and children.
2. Area selection
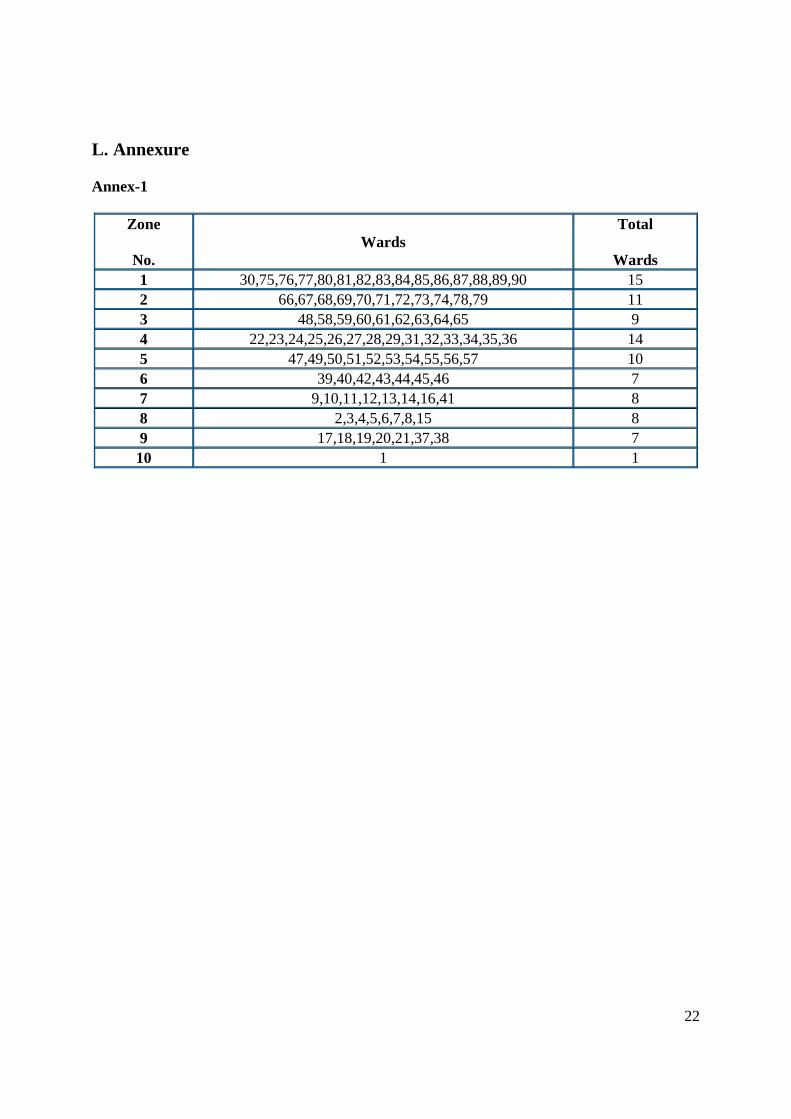
Dhaka city is divided into 10 zones (Dhaka City Corporation). One slum will be selected
randomly from each of the zones. Slum lists are available in Dhaka City Corporation.
3. Definition of slum
A slum is a cluster of compact settlements of 5 or more households, which generally grow very
unsystematically and haphazardly in an unhealthy condition and atmosphere on government and
private vacant land. Slums also exist in the owner based household premises6.
However, for this study we will consider the slum lists provided by DCC..
A slum has the following characteristics:
Predominantly very poor housing structure. Materials are very cheap and of low quality such
as old gunny bags, polythene, straw etc. and have low height houses in comparison with other
normal structure. Grow on govt./semi govt. vacant land and public owned places, abandoned
buildings/places or by the side of the road with very high housing density.
9
Poor sewerage and drainage or even lack of such facilities. Inadequate and unhealthy
drinking water supply. Insufficient or absence of streetlight. Few or no paved streets.
Slum settlements are inhabited by poor, uneducated and below poverty level.
4. Study Period:
January 2008 to December 2008
5. Study design
Qualitative study will be conducted based on the prevalence of non-malnourished children from
cross-sectional study.
6. Sampling design
For quantitative study, data will be collected through two-stage cluster sampling method. At first
one slum will be randomly selected from each of the 10 zones of Dhaka City Corporation. The
required sample households will be equally distributed into the selected 10 slums. If any of the
selected slums fails to fulfill the required households then the next nearest slum will be selected
for rest of the households. Sample household will be identified through systematic random
method from each of the slums. Household head will be interviewed to identify the eligible
“under five” children. If more than one under five children lives in the same household only one
children will be selected randomly for this study.
Information from qualitative study will be collected after getting the prevalence of quantitative
survey. Out of ten slums, one slum with highest prevalence and another with lowest prevalence
of non-malnourished children will be selected purposively. Ten mothers (5 of non-malnourished
children group and 5 of malnourished children group) will be selected from each of the two slums
for in-depth interview. Mothers will be identified through maximum diversity purposive
sampling method. Depending upon the identified theme of the diversity, number of mothers for
in-depth interview may vary. If concern fathers are available during interview, he will also be
interviewed (not more than 2 from each of the two slums). Two mothers will be selected
purposively (one of non-malnourished children and one of malnourished children) from each of
the two slums for daylong observations on child rearing practice. Each observation may continue
up to 7 days. Observation will also include the environment of each slum. Other than the parents,
10
if there is any person who has considerable impact on non-malnourished children would be
identified as the key informant. Depending on situation, number of key informants may vary.
Two Focus Group Discussions will be done (one group to non-malnourished children and one
group to malnourished children) from each of the two slums. Each group will consist of 5-8
participants and will not include those selected for in-depth interviews and daylong observations.
7. Sample size for quantitative data
Formulae for sample size is
n = 2
2
dpqz
Prevalence of non-malnourished children in rural Bangladesh is 52%. 19. To take the maximum
sample size we assume 50% of the children of the slum areas are non malnourished. At 95% level
of significance and 5% deviation from the true value the required simple size is calculated as
follows:
z =1.96, p=.5 and d=.05
n = 384 children.
Considering the Design Effect20 =2.2
Sample size n = 384 x 2.2 = 845 children.
We assume 10% children will be absent during the survey. Our required sample size is 940
(adjusted).
Average sample size of the slum families of Dhaka city is 4.04. 12.63%6 of the slum population
is of age 0 to 4 years6. Total Fertility Rate is 3.0915. To get 940 children (not more than one
children from one household) we need to visit at least 5693 households. Thus we will consider
5700 households for this study.
8. Definition of household
A household is defined as: person or persons having a relation or not, living together and taking
food from the same kitchen. 6.
For this study we will consider using the same cooking pot instead of kitchen for household
definition.
11
9. Framework for information from the qualitative study:
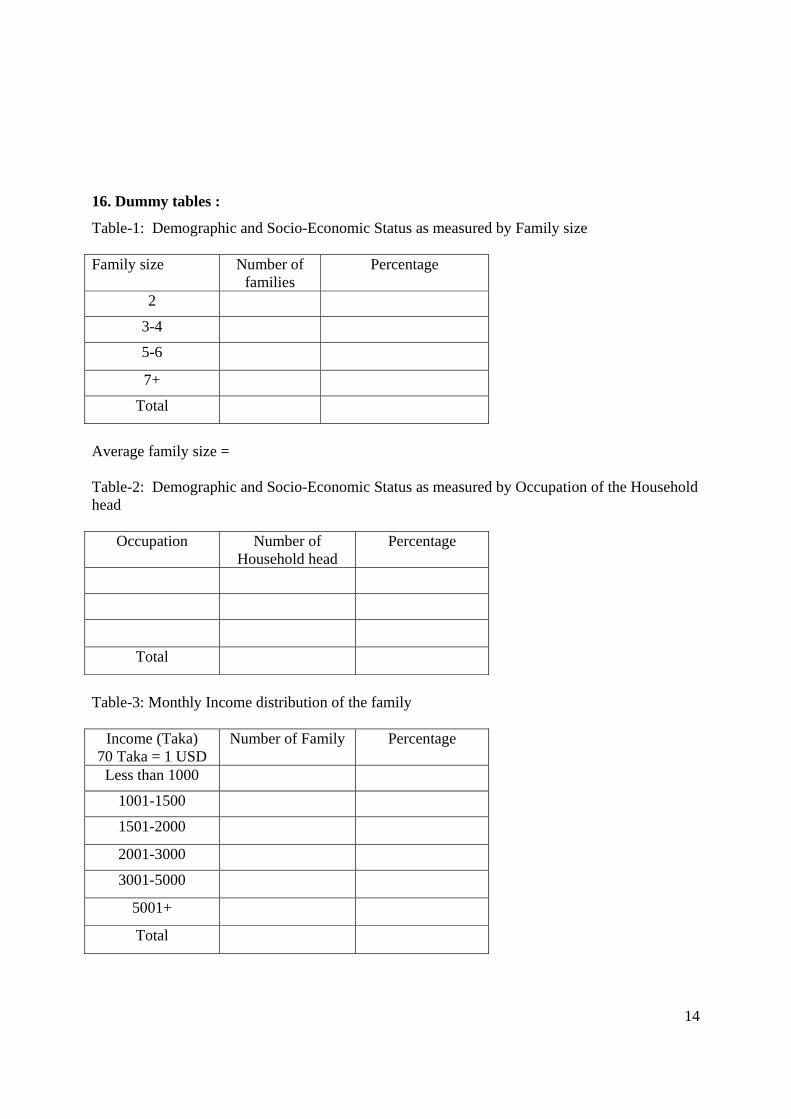
10. Variables
Following variables (background) are to be included in the questionnaire
G. Study Limitation Cluster variation may be more than expected. Since the observations are limited, we may not
identify all positive behaviors and practices of the families. Though the sample size is good
enough to estimate the prevalence for qualitative study we may lose some information due to
cluster effect.
H. Ethical Issue Participation in the study will be voluntary. Participants of the study will be informed regarding
the objectives of the study. They will have their liberty either to leave or to refuse to take part at
any stage of the interview. No physical risk is connected in this study. Confidentiality of the
information will be ensured and each interview will be conducted in privacy. Written consent will
be obtained from the participants from those who can sign and left thumb impression will be
collected who cannot sign.
This protocol will be submitted to the Ethical Review Committee of the concerned institute for
ethical clearance.
18
I. Action plan M
1M 2
M 3
M 4
M 5
M 6
M 7
M 8
M 9
M 10
M 11
M 12
Recruitment HR, PI, Co-PI, Investigators X Slum selection PI, Co-PI, Investigators X Questionnaire, checklist and guideline development
PI, Co-PI, Investigators, Research Officer
X
Staff training PI, Co-PI, Investigators, Research Officer
X X
Field testing and questionnaire review PI, Co-PI, Investigators, Research Officer, Field Supervisor
X
Mapping and household listing PI, Co-PI, Investigators, Research Officer, Field Supervisor
X
Data collection (quantitative) Field Research Assistant X X X X Data collection (qualitative) Research Officer, Field Research
Assistant X X X X
Data entry, edit, compilation and analysis (quantitative and qualitative)
Data Analyst, Data Management Assistant
X X X X X X X X
Draft report PI, Co-PI, Investigators, Data Analyst X Prepare final report PI, Co-PI, Investigators, Data Analyst X Debriefing meeting with DCC, DGHS PI, Co-PI, Investigators X M1, M2 means Month 1, Month 2, HR means Human Resources, PI means Principal Investigator Co PI means Co Prinicipal Investigator.
19
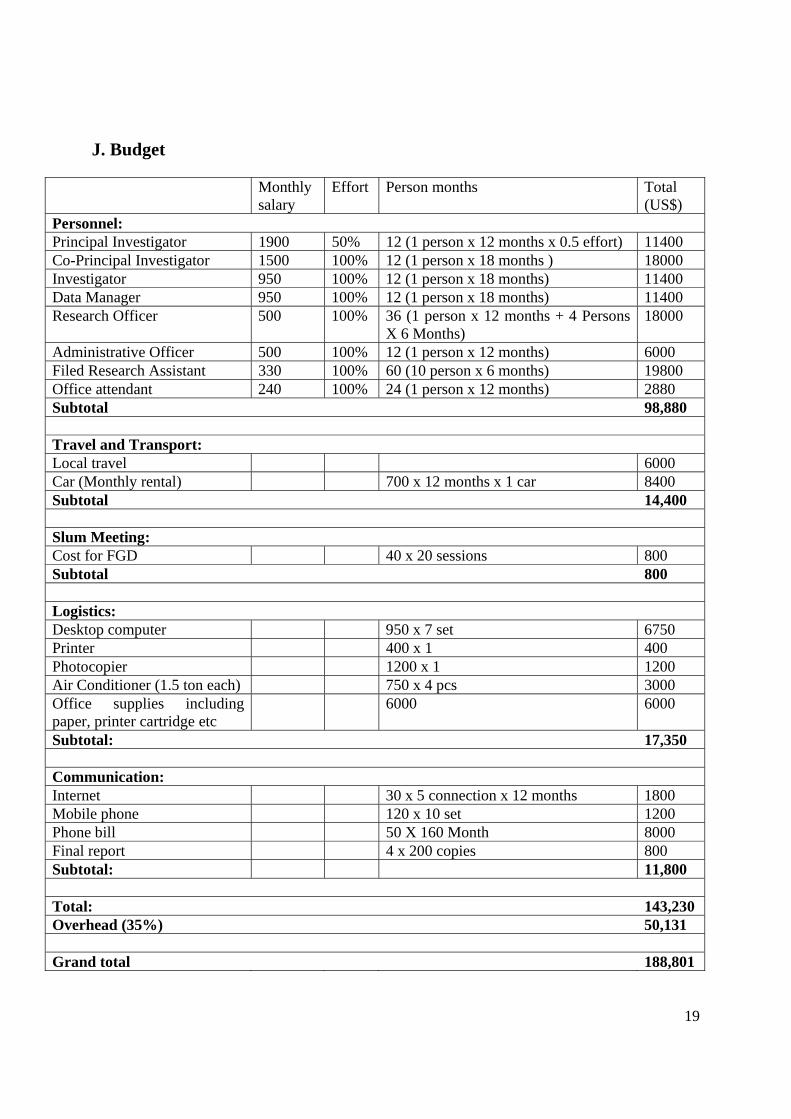
J. Budget
Monthly salary
Effort Person months Total (US$)
Personnel: Principal Investigator 1900 50% 12 (1 person x 12 months x 0.5 effort) 11400 Co-Principal Investigator 1500 100% 12 (1 person x 18 months ) 18000 Investigator 950 100% 12 (1 person x 18 months) 11400 Data Manager 950 100% 12 (1 person x 18 months) 11400 Research Officer 500 100% 36 (1 person x 12 months + 4 Persons
X 6 Months) 18000
Administrative Officer 500 100% 12 (1 person x 12 months) 6000 Filed Research Assistant 330 100% 60 (10 person x 6 months) 19800 Office attendant 240 100% 24 (1 person x 12 months) 2880 Subtotal 98,880 Travel and Transport: Local travel 6000 Car (Monthly rental) 700 x 12 months x 1 car 8400 Subtotal 14,400 Slum Meeting: Cost for FGD 40 x 20 sessions 800 Subtotal 800 Logistics: Desktop computer 950 x 7 set 6750 Printer 400 x 1 400 Photocopier 1200 x 1 1200 Air Conditioner (1.5 ton each) 750 x 4 pcs 3000 Office supplies including paper, printer cartridge etc
6000 6000
Subtotal: 17,350 Communication: Internet 30 x 5 connection x 12 months 1800 Mobile phone 120 x 10 set 1200 Phone bill 50 X 160 Month 8000 Final report 4 x 200 copies 800 Subtotal: 11,800 Total: 143,230 Overhead (35%) 50,131 Grand total 188,801
20
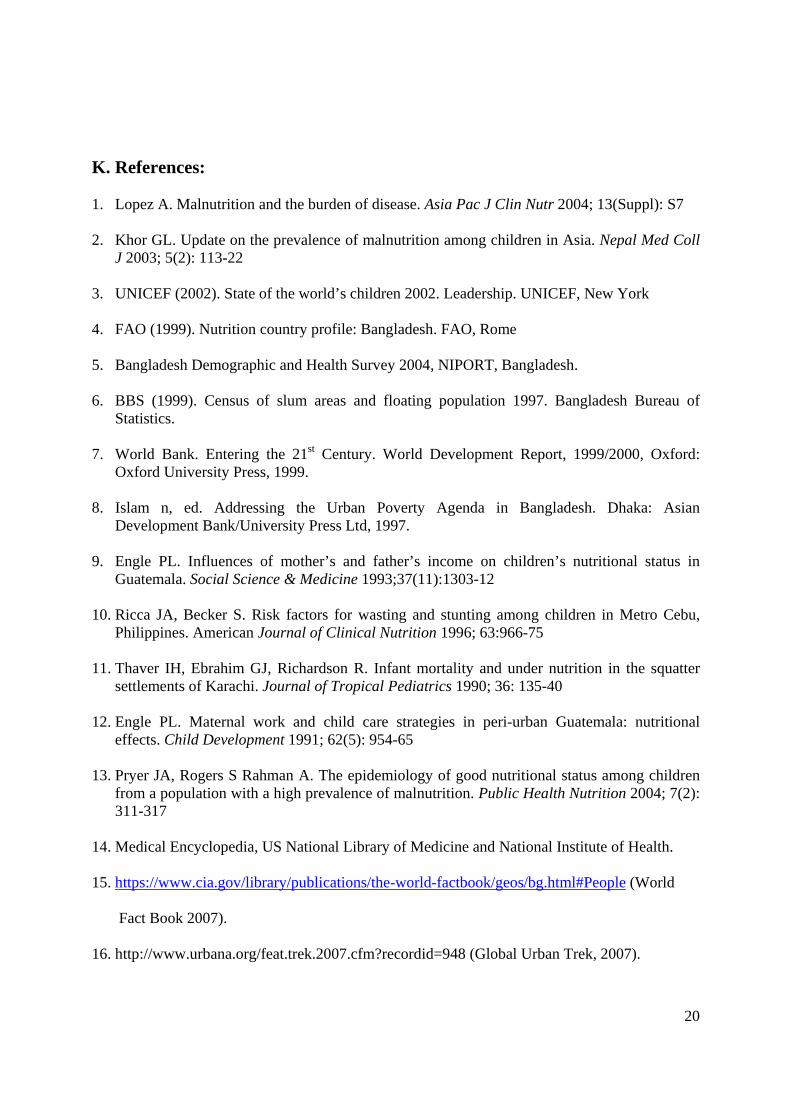
K. References: 1. Lopez A. Malnutrition and the burden of disease. Asia Pac J Clin Nutr 2004; 13(Suppl): S7
2. Khor GL. Update on the prevalence of malnutrition among children in Asia. Nepal Med Coll
J 2003; 5(2): 113-22 3. UNICEF (2002). State of the world’s children 2002. Leadership. UNICEF, New York 4. FAO (1999). Nutrition country profile: Bangladesh. FAO, Rome 5. Bangladesh Demographic and Health Survey 2004, NIPORT, Bangladesh. 6. BBS (1999). Census of slum areas and floating population 1997. Bangladesh Bureau of
Statistics. 7. World Bank. Entering the 21st Century. World Development Report, 1999/2000, Oxford:
Oxford University Press, 1999. 8. Islam n, ed. Addressing the Urban Poverty Agenda in Bangladesh. Dhaka: Asian
Development Bank/University Press Ltd, 1997. 9. Engle PL. Influences of mother’s and father’s income on children’s nutritional status in
Guatemala. Social Science & Medicine 1993;37(11):1303-12 10. Ricca JA, Becker S. Risk factors for wasting and stunting among children in Metro Cebu,
Philippines. American Journal of Clinical Nutrition 1996; 63:966-75 11. Thaver IH, Ebrahim GJ, Richardson R. Infant mortality and under nutrition in the squatter
settlements of Karachi. Journal of Tropical Pediatrics 1990; 36: 135-40 12. Engle PL. Maternal work and child care strategies in peri-urban Guatemala: nutritional
effects. Child Development 1991; 62(5): 954-65 13. Pryer JA, Rogers S Rahman A. The epidemiology of good nutritional status among children
from a population with a high prevalence of malnutrition. Public Health Nutrition 2004; 7(2): 311-317
14. Medical Encyclopedia, US National Library of Medicine and National Institute of Health. 15. https://www.cia.gov/library/publications/the-world-factbook/geos/bg.html#People (World
17. http://southasia.oneworld.net/article/view/133390/1/ (One World South Asia, 2007). 18. Statistical Pocket book 2003, Bangladesh Bureau of Statistics. 19. Bangladesh Demographic and Health Survey 2000, NIPORT, Bangladesh. 20. Research method for developing countries (HSERV/EPI 539), EPI Methodology, WHO 2005