71
Good Afternoon

7/28/2019 Non Parametric Tests ICSSR RMC DIB&C Dr.S.selvaRani
http://slidepdf.com/reader/full/non-parametric-tests-icssr-rmc-dibc-drsselvarani 1/71
Good Afternoon

7/28/2019 Non Parametric Tests ICSSR RMC DIB&C Dr.S.selvaRani
http://slidepdf.com/reader/full/non-parametric-tests-icssr-rmc-dibc-drsselvarani 2/71
Non-Parametric Test-( 11-6-2013)Presentation By
Dr.S.SelvaRani, Principal,
Sri Sarada Niketan College for Women,
Amaravathipudur, Karaikudi

7/28/2019 Non Parametric Tests ICSSR RMC DIB&C Dr.S.selvaRani
http://slidepdf.com/reader/full/non-parametric-tests-icssr-rmc-dibc-drsselvarani 3/71
தட நணறகண நத ற ம அ.
எண ஏ னழத இவபங ண வழம உன
ற சட றவ ற ற அதற த.
அபங வட னறக பமன க ல
.
சலவ சலவஞ சவசலவம அசலவஞ சலவ ல த.
எரள னனவய கம அரள நயரள த
.
எர வ சசல தவய ரள த.

7/28/2019 Non Parametric Tests ICSSR RMC DIB&C Dr.S.selvaRani
http://slidepdf.com/reader/full/non-parametric-tests-icssr-rmc-dibc-drsselvarani 4/71
Tests o Hypot eses Statistical tests arm the researcher to objectively interpret
the data, without intuitive, biased or unconcerned
generalization or particularization. Medical test information from the diagnostic labs tells like:
Your BloodTotal Sugar
Borderlinehigh
High Interpretation
172mg/dL 200-239mg/dL
>239mg/dL
Fine; you are not a Sweetperson!
220mg/dL 200-239mg/dL
>239mg/dL
Pre-caution; you are
becoming a sweet person!
thethe

7/28/2019 Non Parametric Tests ICSSR RMC DIB&C Dr.S.selvaRani
http://slidepdf.com/reader/full/non-parametric-tests-icssr-rmc-dibc-drsselvarani 5/71
Parametric and Non-parametric tests Statistical tests are of two broad types- Parametric and
Non-parametric.
Parametric and nonparametric statistical proceduresthat test hypotheses involving different assumptions.
There are assumptions about:
- Shape of Data distribution- normal or any other or Nodefinite shape per se.
- Nature of Data – Measurement or Counting based
- Variance- Randomization of sampling, etc.
All these decide to use or not a particular class of test-
Parametric and Non-parametric.
7/28/2019 Non Parametric Tests ICSSR RMC DIB&C Dr.S.selvaRani
http://slidepdf.com/reader/full/non-parametric-tests-icssr-rmc-dibc-drsselvarani 6/71
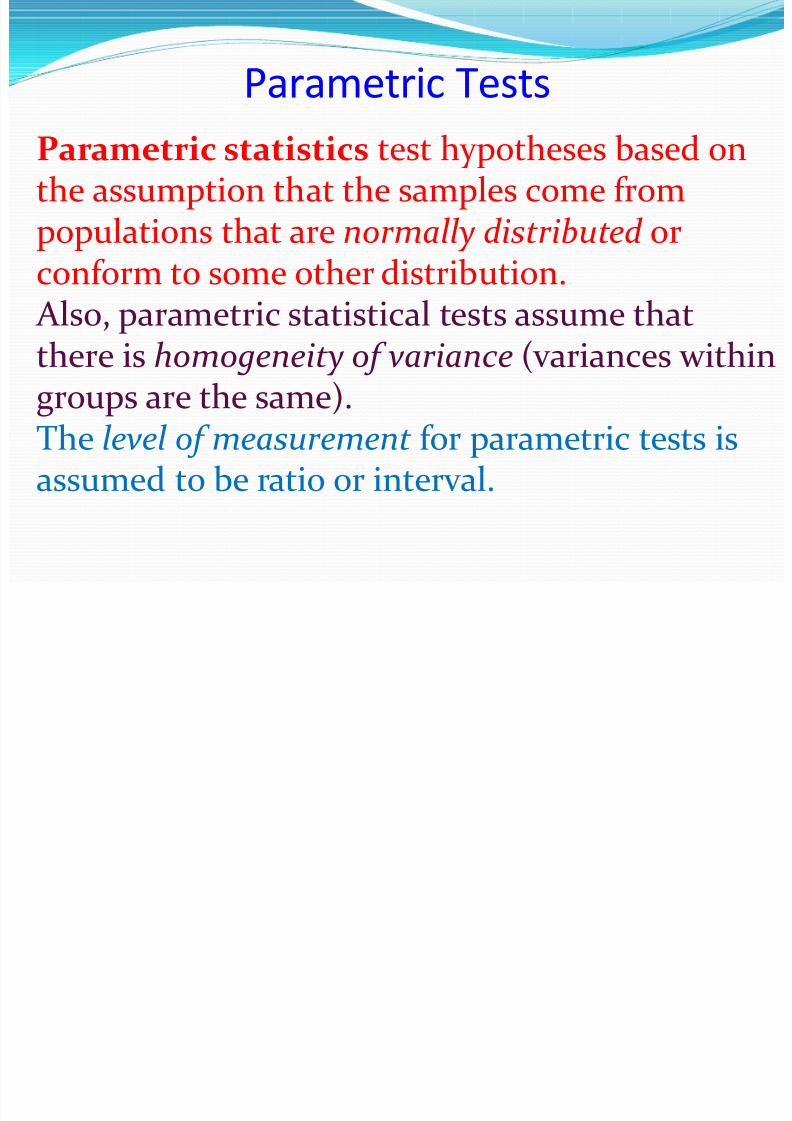
Parametric statistics test hypotheses based onthe assumption that the samples come frompopulations that are normally distributed or
conform to some other distribution. Also, parametric statistical tests assume thatthere is homogeneity of variance (variances within
groups are the same).The level of measurement for parametric tests isassumed to be ratio or interval.
Parametric Tests

7/28/2019 Non Parametric Tests ICSSR RMC DIB&C Dr.S.selvaRani
http://slidepdf.com/reader/full/non-parametric-tests-icssr-rmc-dibc-drsselvarani 7/71
Nonparametric Tests
Nonparametric statistical procedurestest hypotheses that do not requirenormal distribution or variance
assumptions about the populations from which the samples were drawn.
Nonparametric statistical proceduresare designed for ordinal or nominal data.Non-Parametric Tests are versatile.
7/28/2019 Non Parametric Tests ICSSR RMC DIB&C Dr.S.selvaRani
http://slidepdf.com/reader/full/non-parametric-tests-icssr-rmc-dibc-drsselvarani 8/71
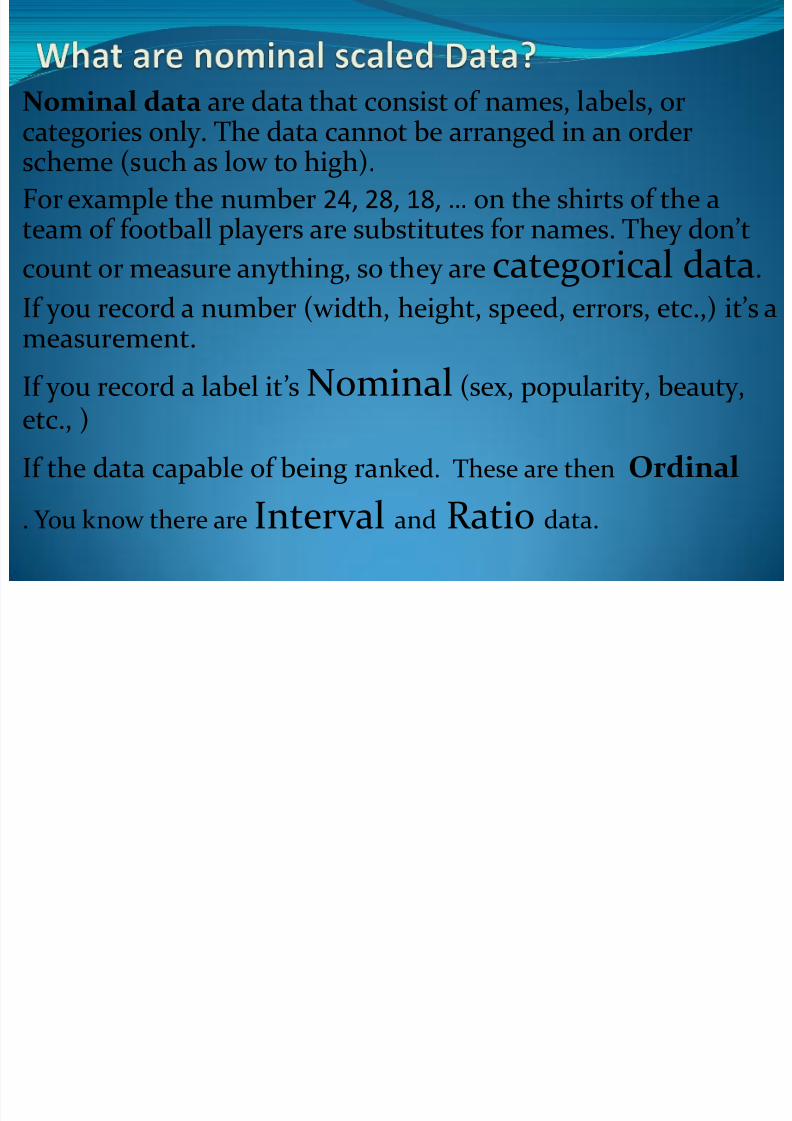
Nominal data are data that consist of names, labels, or
categories only. The data cannot be arranged in an orderscheme (such as low to high).
For example the number 24, 28, 18, … on the shirts of the ateam of football players are substitutes for names. They don’t
count or measure anything, so they are categorical data.If you record a number (width, height, speed, errors, etc.,) it’s ameasurement.
If you record a label it’s Nominal (sex, popularity, beauty,etc., )
If the data capable of being ranked. These are then Ordinal
. You know there are Interval and Ratio data.
7/28/2019 Non Parametric Tests ICSSR RMC DIB&C Dr.S.selvaRani
http://slidepdf.com/reader/full/non-parametric-tests-icssr-rmc-dibc-drsselvarani 9/71
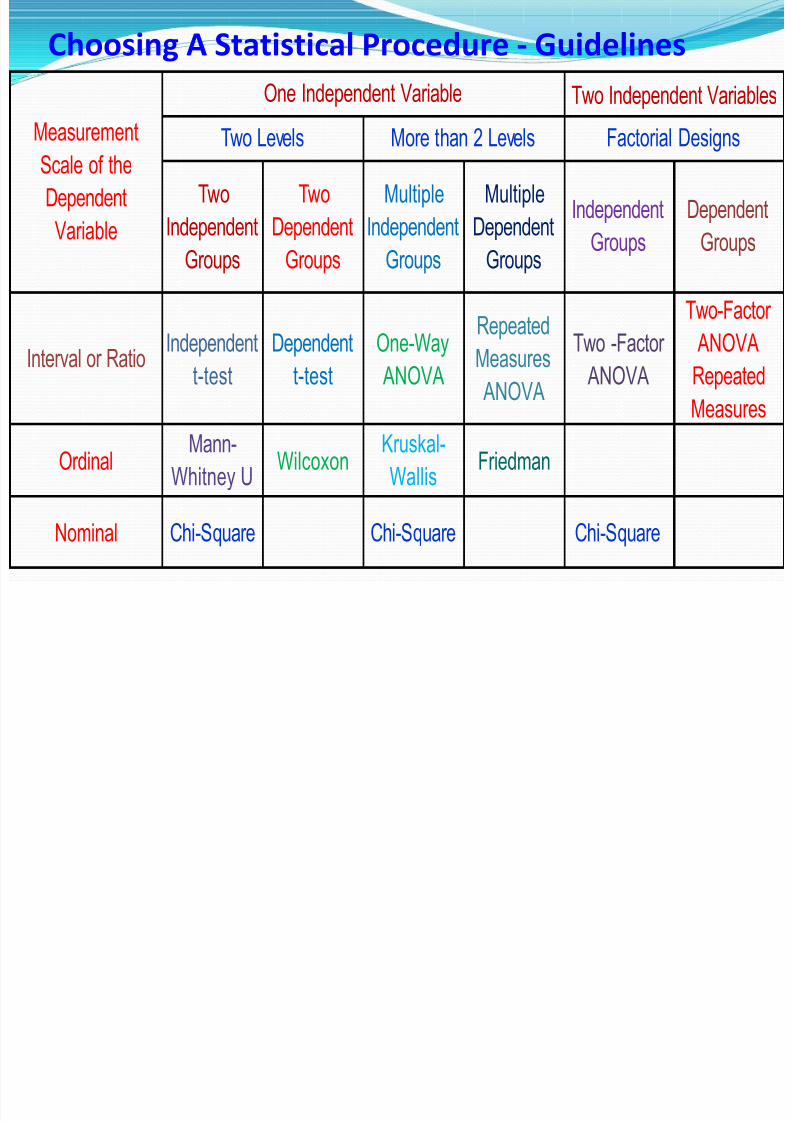
Choosing A Statistical Procedure - Guidelines
Two Independent Variables
Interval or RatioIndependent
t-test
Dependent
t-test
One-Way
ANOVA
Repeated
Measures
ANOVA
Two -Factor
ANOVA
Two-Factor
ANOVA
Repeated
Measures
OrdinalMann-
Whitney UWilcoxon
Kruskal-
WallisFriedman
Nominal Chi-Square Chi-Square Chi-Square
Multiple
Independent
Groups
Multiple
Dependent
Groups
Factorial Designs
Independent
Groups
Dependent
Groups
MeasurementScale of the
Dependent
Variable
One Independent Variable
Two Levels More than 2 Levels
Two
Independent
Groups
Two
Dependent
Groups

7/28/2019 Non Parametric Tests ICSSR RMC DIB&C Dr.S.selvaRani
http://slidepdf.com/reader/full/non-parametric-tests-icssr-rmc-dibc-drsselvarani 10/71
Easy to Compute. Really easy, if weknow!!!
Without making assumptions about
population values or parameters.
Distribution-free Tests.
They compare medians rather than means.
7/28/2019 Non Parametric Tests ICSSR RMC DIB&C Dr.S.selvaRani
http://slidepdf.com/reader/full/non-parametric-tests-icssr-rmc-dibc-drsselvarani 11/71
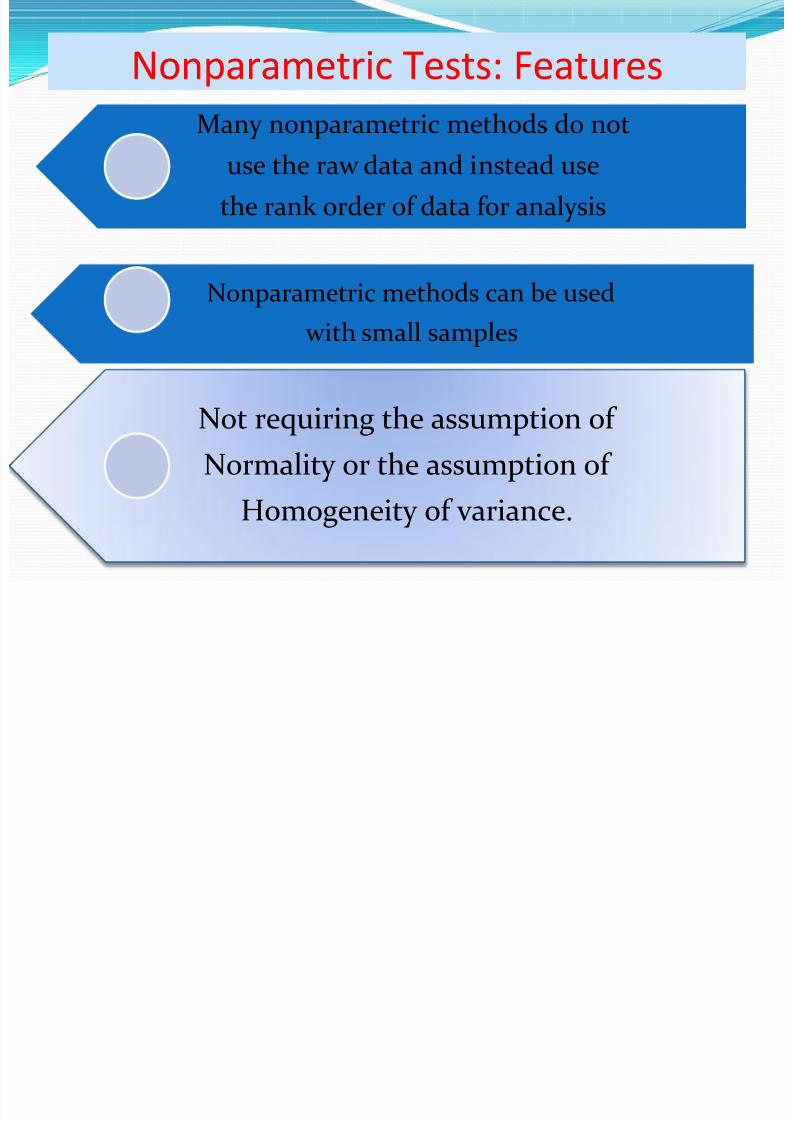
Nonparametric Tests: Features
Many nonparametric methods do notuse the raw data and instead use
the rank order of data for analysis
Nonparametric methods can be used
with small samples
Not requiring the assumption of
Normality or the assumption of
Homogeneity of variance.
7/28/2019 Non Parametric Tests ICSSR RMC DIB&C Dr.S.selvaRani
http://slidepdf.com/reader/full/non-parametric-tests-icssr-rmc-dibc-drsselvarani 12/71
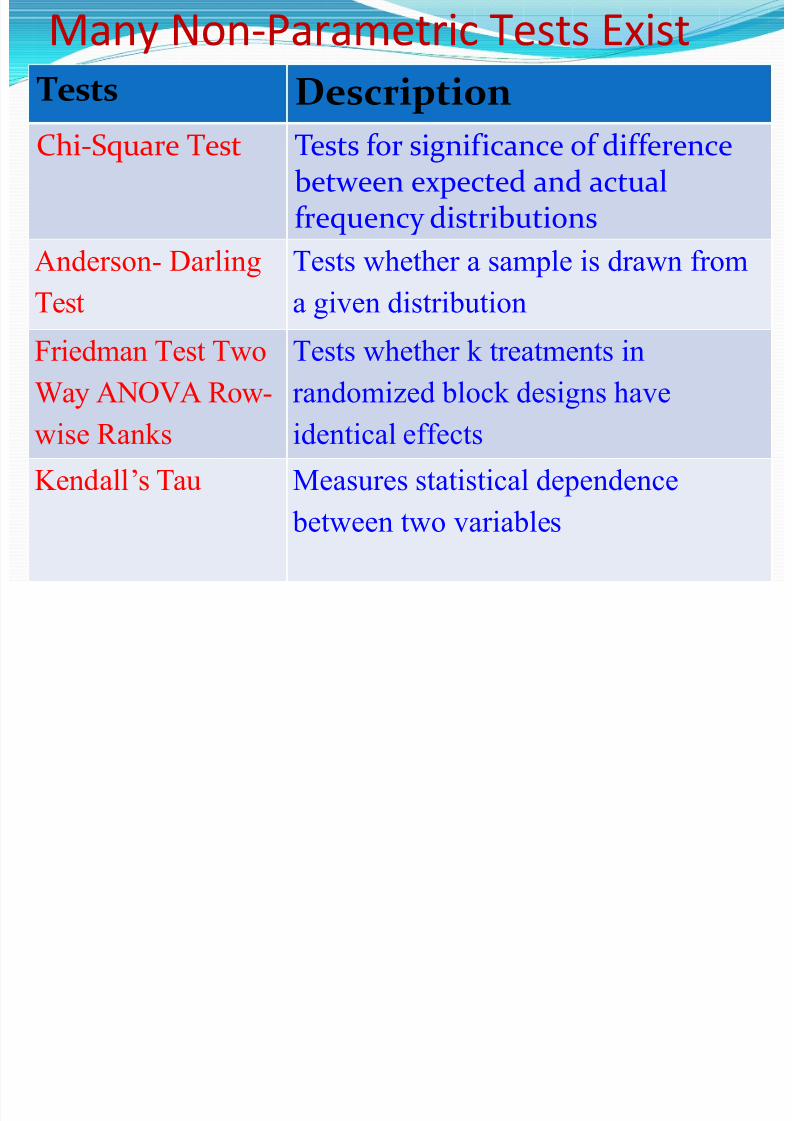
Many Non-Parametric Tests Exist
Tests Description
Chi-Square Test Tests for significance of differencebetween expected and actualfrequency distributions
Anderson- DarlingTest
Tests whether a sample is drawn froma given distribution
Friedman Test Two
Way ANOVA Row-
wise Ranks
Tests whether k treatments in
randomized block designs have
identical effects
Kendall’s Tau Measures statistical dependence
between two variables
7/28/2019 Non Parametric Tests ICSSR RMC DIB&C Dr.S.selvaRani
http://slidepdf.com/reader/full/non-parametric-tests-icssr-rmc-dibc-drsselvarani 13/71
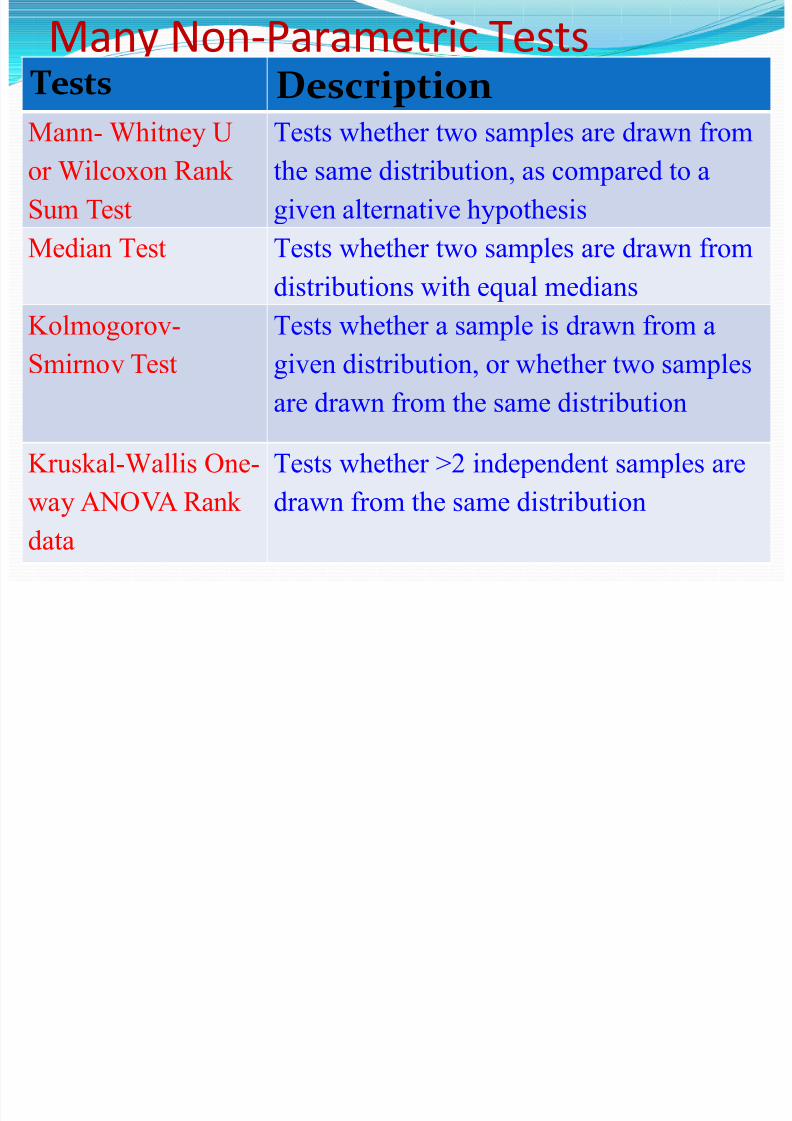
Many Non-Parametric TestsTests Description
Mann- Whitney Uor Wilcoxon Rank
Sum Test
Tests whether two samples are drawn fromthe same distribution, as compared to a
given alternative hypothesis
Median Test Tests whether two samples are drawn from
distributions with equal medians
Kolmogorov-
Smirnov Test
Tests whether a sample is drawn from a
given distribution, or whether two samples
are drawn from the same distribution
Kruskal-Wallis One-
way ANOVA Rank
data
Tests whether >2 independent samples are
drawn from the same distribution
7/28/2019 Non Parametric Tests ICSSR RMC DIB&C Dr.S.selvaRani
http://slidepdf.com/reader/full/non-parametric-tests-icssr-rmc-dibc-drsselvarani 14/71
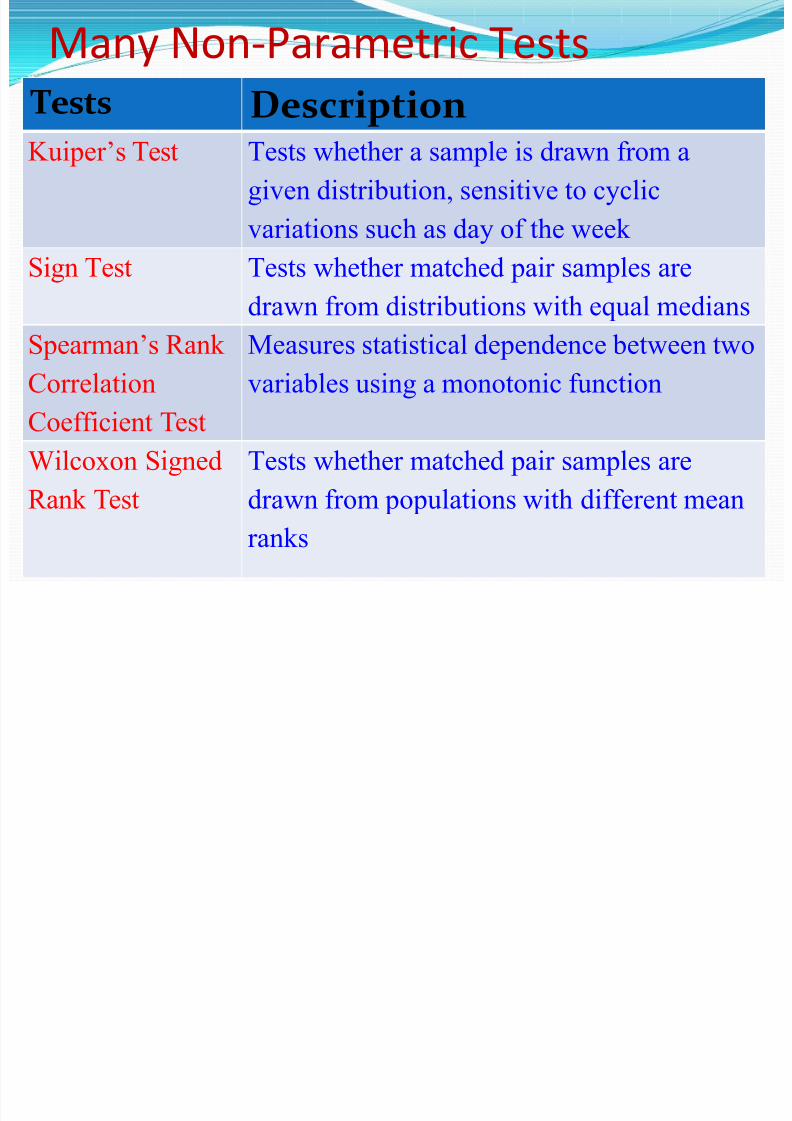
Many Non-Parametric Tests
Tests DescriptionKuiper’s Test Tests whether a sample is drawn from a
given distribution, sensitive to cyclic
variations such as day of the week
Sign Test Tests whether matched pair samples aredrawn from distributions with equal medians
Spearman’s Rank
Correlation
Coefficient Test
Measures statistical dependence between two
variables using a monotonic function
Wilcoxon Signed
Rank Test
Tests whether matched pair samples are
drawn from populations with different mean
ranks

7/28/2019 Non Parametric Tests ICSSR RMC DIB&C Dr.S.selvaRani
http://slidepdf.com/reader/full/non-parametric-tests-icssr-rmc-dibc-drsselvarani 15/71
Caution About Using Non-Parametric tests
The main weakness of nonparametric tests is
that they are less powerful than parametrictests.
They are less likely to reject the null hypothesis
when it is false. We loose some information when data are
ordinal changed.
So, when the assumptions of parametric testscan be met, parametric tests should be usedbecause they are the most powerful testsavailable.
7/28/2019 Non Parametric Tests ICSSR RMC DIB&C Dr.S.selvaRani
http://slidepdf.com/reader/full/non-parametric-tests-icssr-rmc-dibc-drsselvarani 16/71
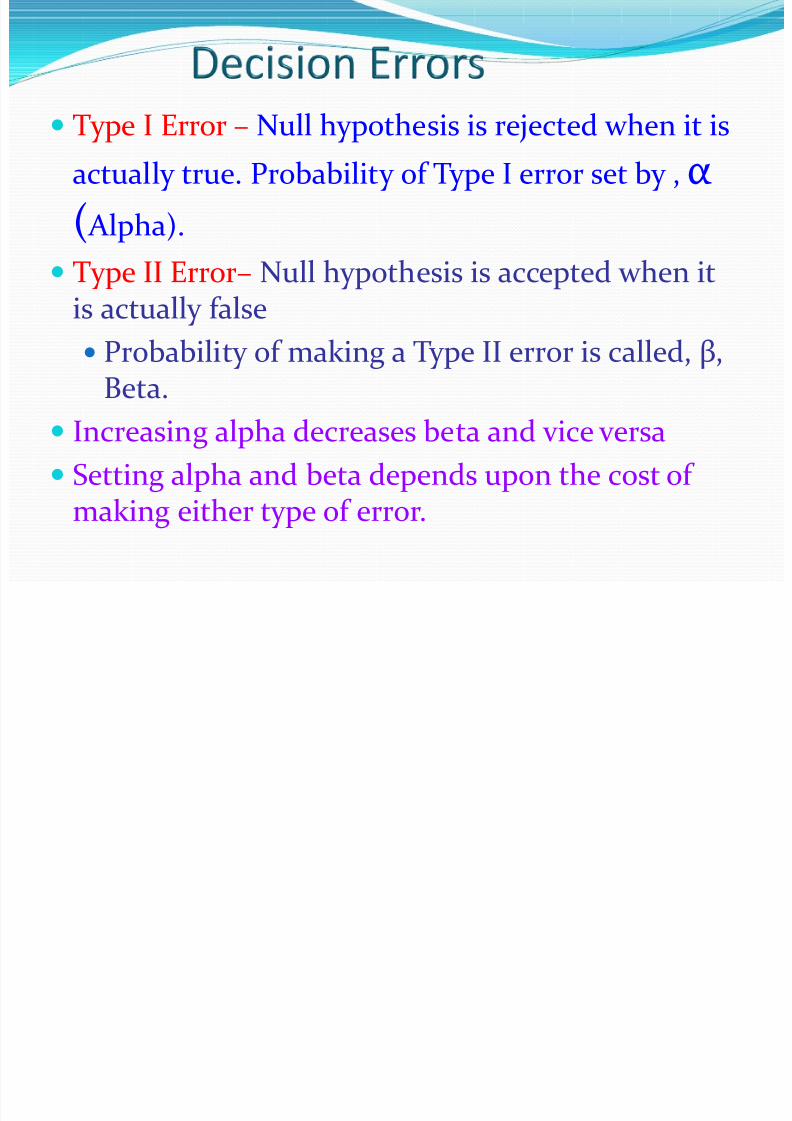
Type I Error – Null hypothesis is rejected when it isactually true. Probability of Type I error set by , α ( Alpha).
Type II Error– Null hypothesis is accepted when itis actually false
Probability of making a Type II error is called, β,Beta.
Increasing alpha decreases beta and vice versa
Setting alpha and beta depends upon the cost of making either type of error.

7/28/2019 Non Parametric Tests ICSSR RMC DIB&C Dr.S.selvaRani
http://slidepdf.com/reader/full/non-parametric-tests-icssr-rmc-dibc-drsselvarani 17/71
Chi-Square Test
7/28/2019 Non Parametric Tests ICSSR RMC DIB&C Dr.S.selvaRani
http://slidepdf.com/reader/full/non-parametric-tests-icssr-rmc-dibc-drsselvarani 18/71
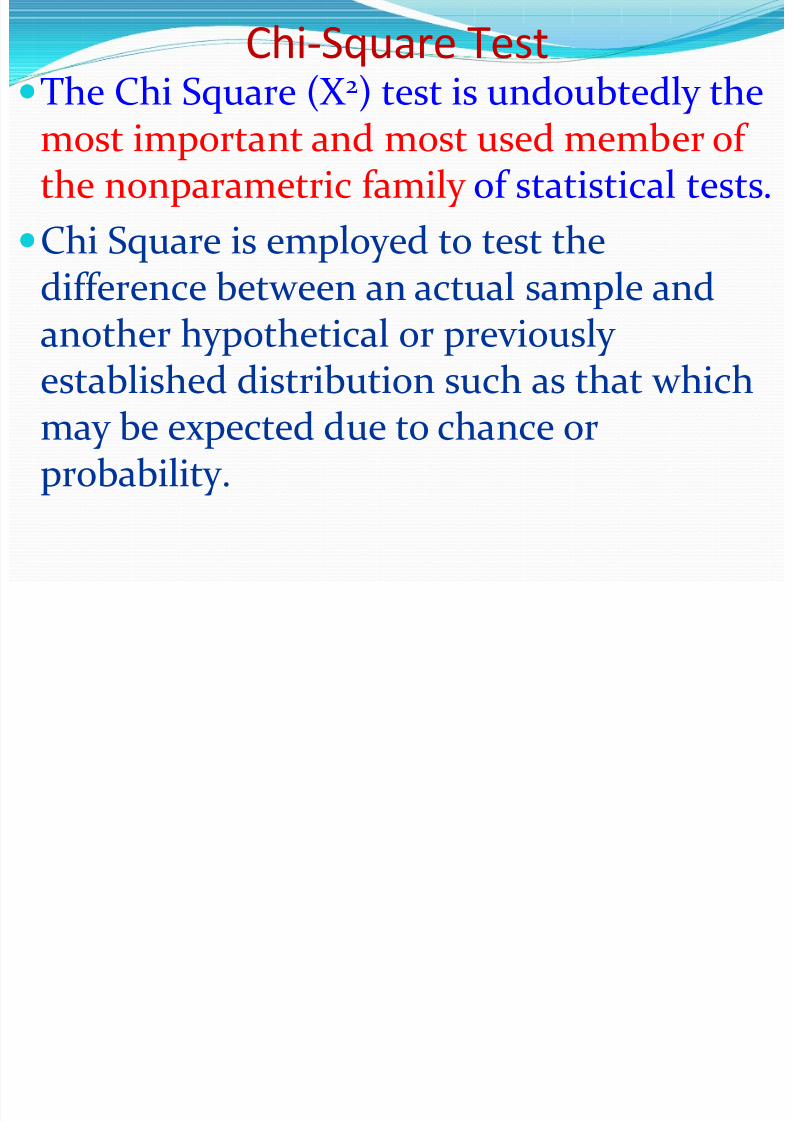
Chi-Square TestThe Chi Square (X 2) test is undoubtedly the
most important and most used member of the nonparametric family of statistical tests.
Chi Square is employed to test the
difference between an actual sample andanother hypothetical or previously established distribution such as that whichmay be expected due to chance orprobability.

7/28/2019 Non Parametric Tests ICSSR RMC DIB&C Dr.S.selvaRani
http://slidepdf.com/reader/full/non-parametric-tests-icssr-rmc-dibc-drsselvarani 19/71
Chi-SquareTestChi Square can also be used to test
differences between two or more actualsamples.
We don’t have scores, we don’t have means. We just have numbers, or frequencies. Inother words, we have nominal data or head-count data.
Counting the Heads, nor their weight!!!
It is versatile with many applications.

7/28/2019 Non Parametric Tests ICSSR RMC DIB&C Dr.S.selvaRani
http://slidepdf.com/reader/full/non-parametric-tests-icssr-rmc-dibc-drsselvarani 20/71
Chi-Square Distribution
7/28/2019 Non Parametric Tests ICSSR RMC DIB&C Dr.S.selvaRani
http://slidepdf.com/reader/full/non-parametric-tests-icssr-rmc-dibc-drsselvarani 21/71
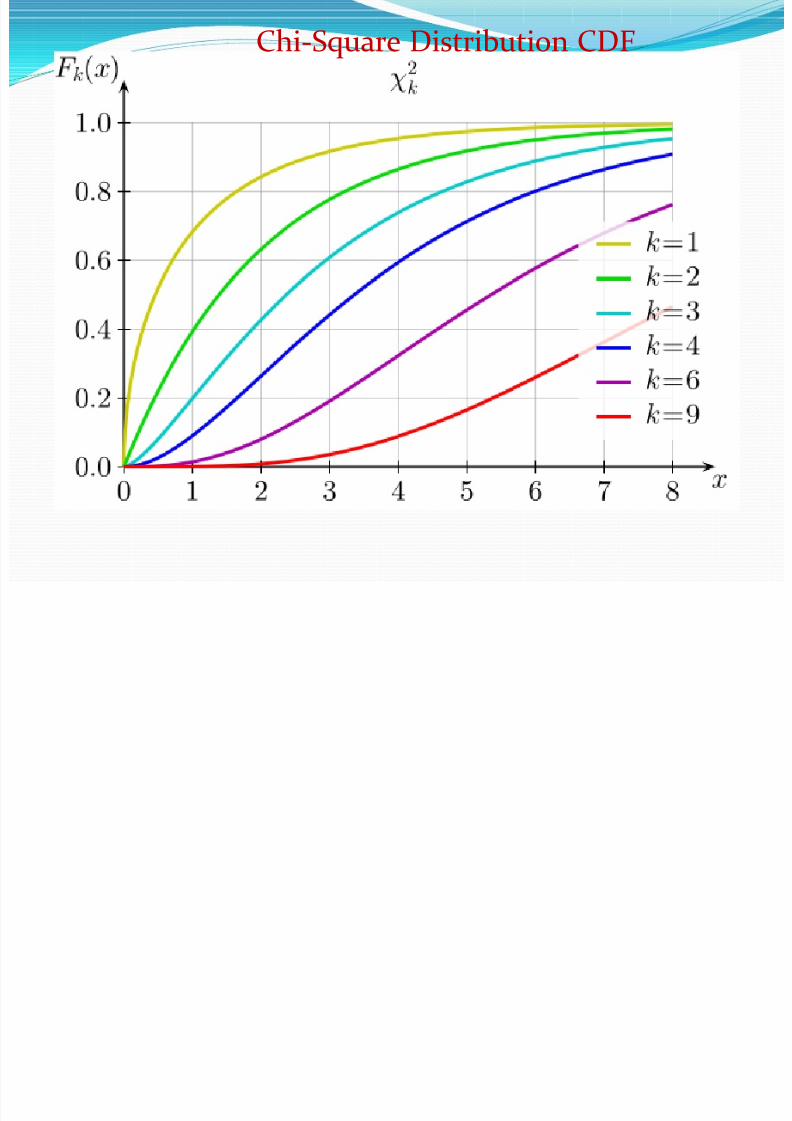
Chi-Square Distribution CDF
7/28/2019 Non Parametric Tests ICSSR RMC DIB&C Dr.S.selvaRani
http://slidepdf.com/reader/full/non-parametric-tests-icssr-rmc-dibc-drsselvarani 22/71
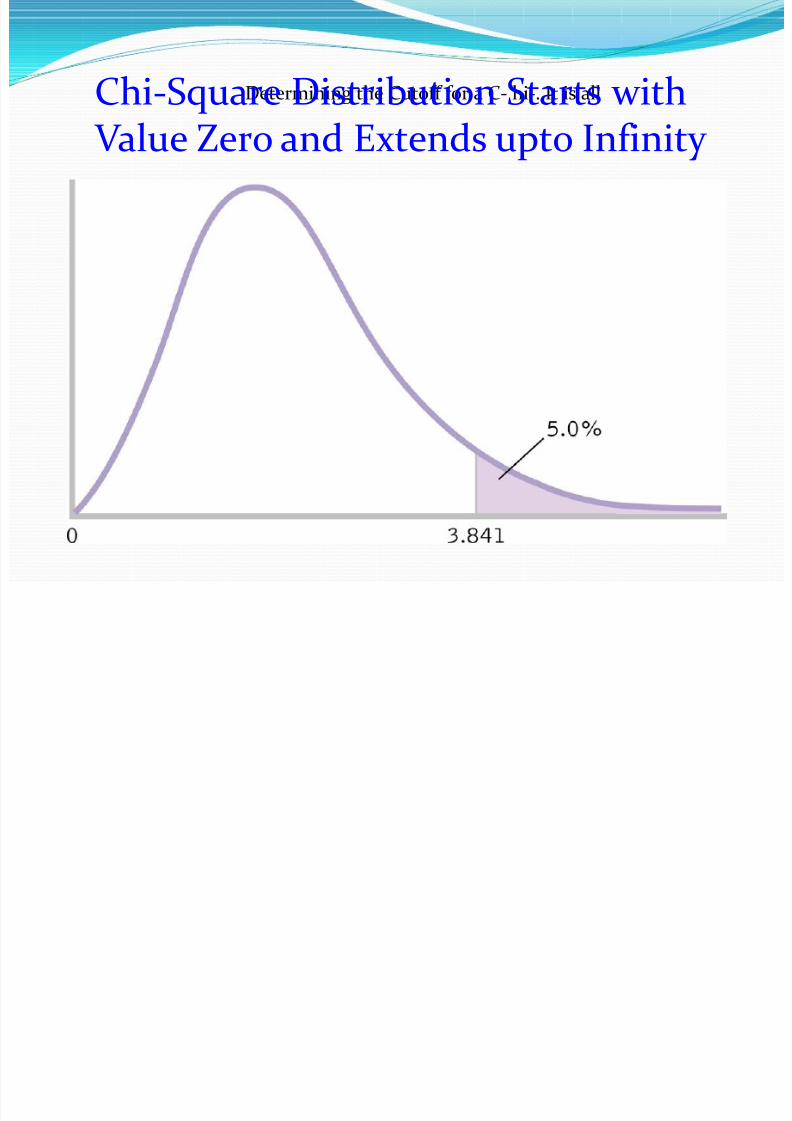
Determining the Cutoff for a C- hi-. It is allChi-Square Distribution Starts with
Value Zero and Extends upto Infinity

7/28/2019 Non Parametric Tests ICSSR RMC DIB&C Dr.S.selvaRani
http://slidepdf.com/reader/full/non-parametric-tests-icssr-rmc-dibc-drsselvarani 23/71
Degreesof
Freedom(df)
Probability ( p)
Chi-Square vales for different Alpha and Degrees of Freedom
-- 0.95 0.90 0.80 0.70 0.50 0.30 0.20 0.10 0.05 0.01 0.001
1 0.004 0.02 0.06 0.15 0.46 1.07 1.64 2.71 3.84 6.64 10.83
2 0.10 0.21 0.45 0.71 1.39 2.41 3.22 4.60 5.99 9.21 13.82
3 0.35 0.58 1.01 1.42 2.37 3.66 4.64 6.25 7.82 11.34 16.27
4 0.71 1.06 1.65 2.20 3.36 4.88 5.99 7.78 9.49 13.28 18.47
5 1.14 1.61 2.34 3.00 4.35 6.06 7.29 9.24 11.07 15.09 20.52
6 1.63 2.20 3.07 3.83 5.35 7.23 8.56 10.64 12.59 16.81 22.46
7 2.17 2.83 3.82 4.67 6.35 8.38 9.80 12.02 14.07 18.48 24.32
8 2.73 3.49 4.59 5.53 7.34 9.52 11.03 13.36 15.51 20.09 26.12
9 3.32 4.17 5.38 6.39 8.34 10.66 12.24 14.68 16.92 21.67 27.88
10 3.94 4.86 6.18 7.27 9.34 11.78 13.44 15.99 18.31 23.21 29.59Nonsignificant Significant
A i Wh ?

7/28/2019 Non Parametric Tests ICSSR RMC DIB&C Dr.S.selvaRani
http://slidepdf.com/reader/full/non-parametric-tests-icssr-rmc-dibc-drsselvarani 24/71
A great question now…. What?Isn’t Chi-Square Parametric!!!!
Chi-square is a statistic that is related to the centrallimit theorem in the sense that proportions are infact means, and that proportions are normally distributed (with a mean of p [not 3.141592653...]
and a variance of [(p) (1-p)].Therefore, we can perform a normal curve test forexamining the difference between proportions suchthat Z squared = chi square on one degree of freedom. Since Z is indubitably a parametric test,and chi square can be related to Z, we can infer thatit is, in fact, parametric.
Chi Sq are Test for Goodness of Fit

7/28/2019 Non Parametric Tests ICSSR RMC DIB&C Dr.S.selvaRani
http://slidepdf.com/reader/full/non-parametric-tests-icssr-rmc-dibc-drsselvarani 25/71
Chi-Square Test for Goodness of Fit Is any theoretical distribution like, Beta, Binomial,
Poisson, Normal or any other a good fit in a given case?
For instance we may assume, gender of new born isbinomial distributed, with q=p=0.5. In families each with four children, we test this. Binomial distribution’sacceptance needs testing here. We may use Chi-Square.
In project management the activity time estimates(pessimistic, most-likely and optimistic) is said to be afour parameter ‘beta’ distributed. We may test thisusing Chi-Square.
In an empirical distribution like, 2 : 3 : 5 as the ratio of number of new-born babies with underweight, normal weight and overweight in a rich country, to its goodnessof fit, we may use Chi-Square.

7/28/2019 Non Parametric Tests ICSSR RMC DIB&C Dr.S.selvaRani
http://slidepdf.com/reader/full/non-parametric-tests-icssr-rmc-dibc-drsselvarani 26/71
D bi d f d l t

7/28/2019 Non Parametric Tests ICSSR RMC DIB&C Dr.S.selvaRani
http://slidepdf.com/reader/full/non-parametric-tests-icssr-rmc-dibc-drsselvarani 27/71
Do birds forage randomly on any tree or are
they choosing particular kind of trees? A study on bird foraging behavior in a forest in Oregon
revealed the following. In a managed forest, 54% of thecanopy volume was Douglas fir, 40% was ponderosapine, 5% was grand fir, and 1% was western larch.
On 156 observations of foraging by nuthatches; 70
observations (45% of the total) in Douglas fir, 79 (51%)in ponderosa pine, 3 (2%) in grand fir, and 4 (3%) in
western larch.
The biological null hypothesis is that the birds forage
randomly, without regard to what species of treethey're in; The statistical null hypothesis is that theproportions of foraging events are equal to theproportions of canopy volume.
7/28/2019 Non Parametric Tests ICSSR RMC DIB&C Dr.S.selvaRani
http://slidepdf.com/reader/full/non-parametric-tests-icssr-rmc-dibc-drsselvarani 28/71
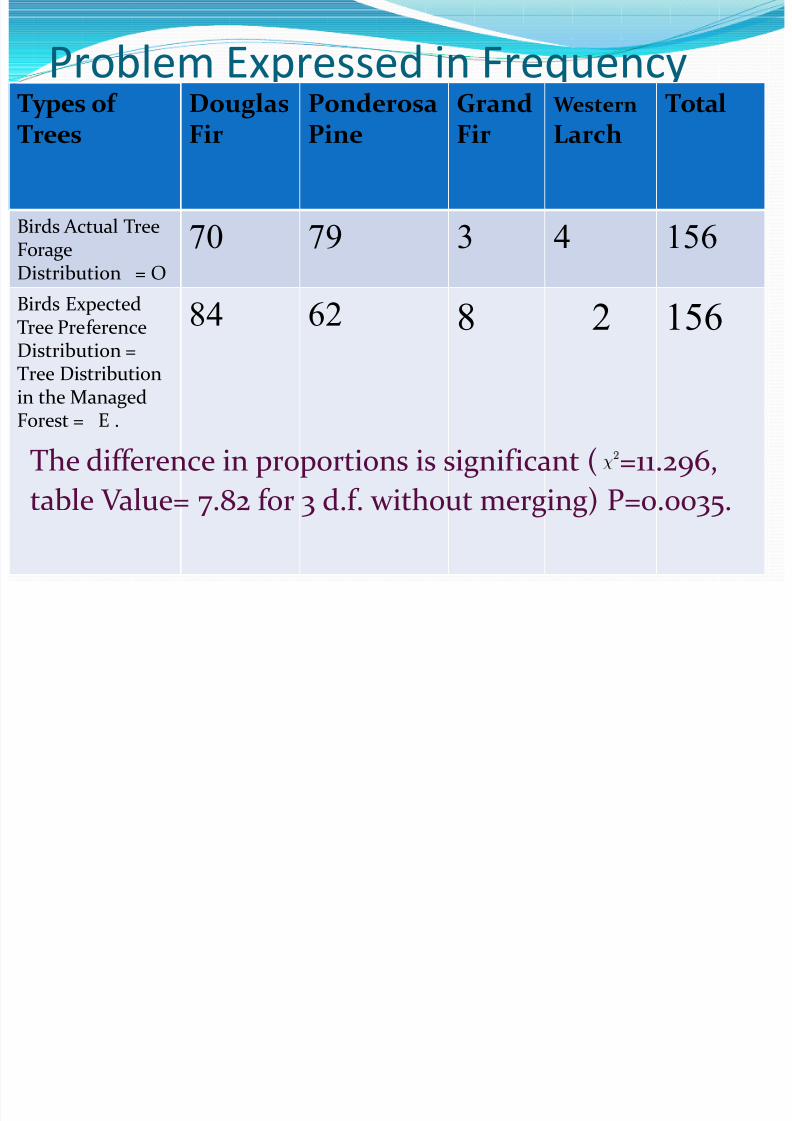
Problem Expressed in FrequencyTypes of
Trees
Douglas
Fir
Ponderosa
Pine
Grand
Fir
Western
Larch
Total
Birds Actual TreeForage
Distribution = O
70 79 3 4 156
Birds ExpectedTree PreferenceDistribution =Tree Distributionin the ManagedForest = E .
84 62 8 2 156
The difference in proportions is significant ( =11.296,
table Value= 7.82 for 3 d.f. without merging) P=0.0035.

7/28/2019 Non Parametric Tests ICSSR RMC DIB&C Dr.S.selvaRani
http://slidepdf.com/reader/full/non-parametric-tests-icssr-rmc-dibc-drsselvarani 29/71
* The formula for calculatingchi-square
Degrees of freedom (df) = n-1 where n is the number of classes
7/28/2019 Non Parametric Tests ICSSR RMC DIB&C Dr.S.selvaRani
http://slidepdf.com/reader/full/non-parametric-tests-icssr-rmc-dibc-drsselvarani 30/71
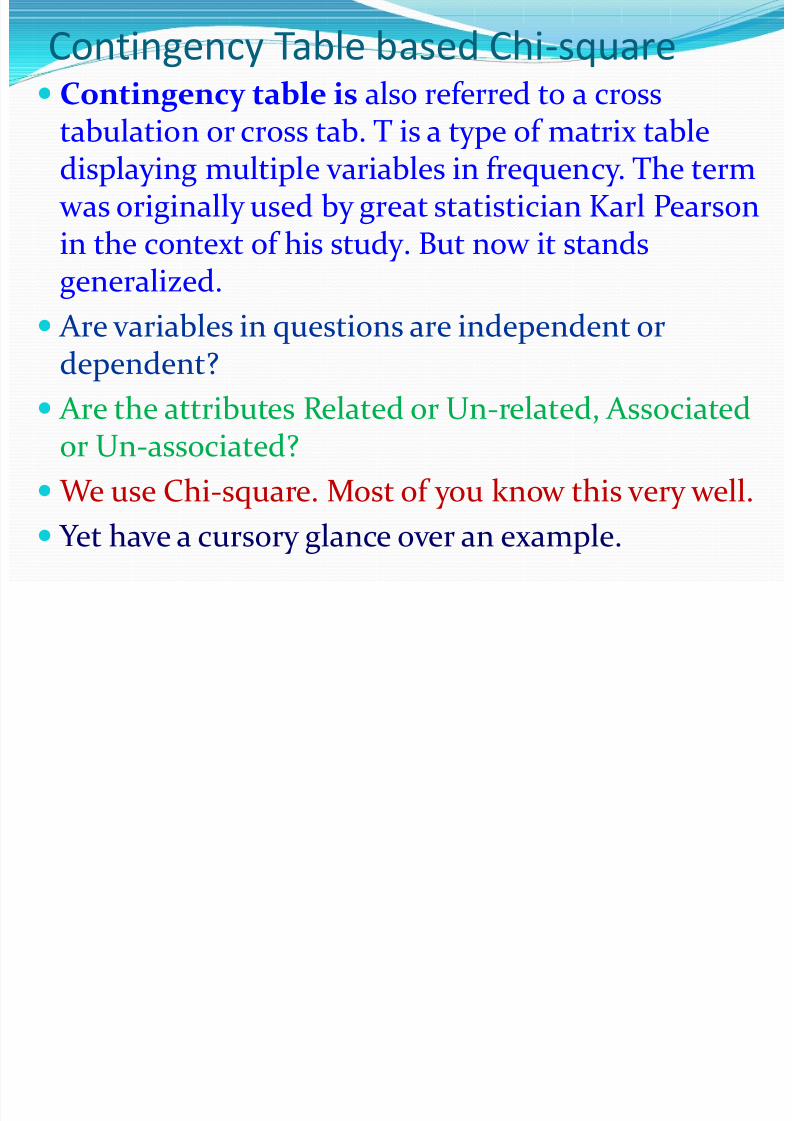
Contingency Table based Chi-square Contingency table is also referred to a cross
tabulation or cross tab. T is a type of matrix tabledisplaying multiple variables in frequency. The term was originally used by great statistician Karl Pearsonin the context of his study. But now it stands
generalized. Are variables in questions are independent or
dependent?
Are the attributes Related or Un-related, Associatedor Un-associated?
We use Chi-square. Most of you know this very well.
Yet have a cursory glance over an example.
Suppose you have the following categorical data

7/28/2019 Non Parametric Tests ICSSR RMC DIB&C Dr.S.selvaRani
http://slidepdf.com/reader/full/non-parametric-tests-icssr-rmc-dibc-drsselvarani 31/71
Asia Africa South
America Totals
Malaria A 31 14 45 90
Malaria B 2 5 53 60
Malaria C 53 45 2 100
Suppose you have the following categorical data
set. Incidence of three types of malaria in three
tropical regions.

7/28/2019 Non Parametric Tests ICSSR RMC DIB&C Dr.S.selvaRani
http://slidepdf.com/reader/full/non-parametric-tests-icssr-rmc-dibc-drsselvarani 32/71
Observed Expected |O -E| (O— E)2 (O— E)2 / E
31 30.96 0.04 0.0016 0.0000516
14 23.04 9.04 81.72 3.546
45 36.00 9.00 81.00 2.25
2 20.64 18.64 347.45 16.83
5 15.36 10.36 107.33 6.99
53 24.00 29.00 841.00 35.04 53 34.40 18.60 345.96 10.06
45 25.60 19.40 376.36 14.70
2 40.00 38.00 1444.00 36.10
We could now set up the following table:
Chi Square = 125.516; DF= (c - 1)(r - 1) = 2(2) = 4
H R j d S B l

7/28/2019 Non Parametric Tests ICSSR RMC DIB&C Dr.S.selvaRani
http://slidepdf.com/reader/full/non-parametric-tests-icssr-rmc-dibc-drsselvarani 33/71
H0 Rejected. See Below.
Df 0.5 0.10 0.05 0.02 0.01
1 0.455 2.706 3.841 5.412 6.635
2 1.386 4.605 5.991 7.824 9.210
3 2.366 6.251 7.815 9.837 11.345
4 3.357 7.779 9.488 11.668 13.277
5 4.351 9.236 11.070 13.388 15.086
Reject Ho because 125.516 is greater than 9.488 (for alpha = 0.05) Thus, we would reject the null hypothesis that there is no
relationship between location and type of malaria.
Inference : There is a relationship between type of malaria and
location.

7/28/2019 Non Parametric Tests ICSSR RMC DIB&C Dr.S.selvaRani
http://slidepdf.com/reader/full/non-parametric-tests-icssr-rmc-dibc-drsselvarani 34/71
7/28/2019 Non Parametric Tests ICSSR RMC DIB&C Dr.S.selvaRani
http://slidepdf.com/reader/full/non-parametric-tests-icssr-rmc-dibc-drsselvarani 35/71
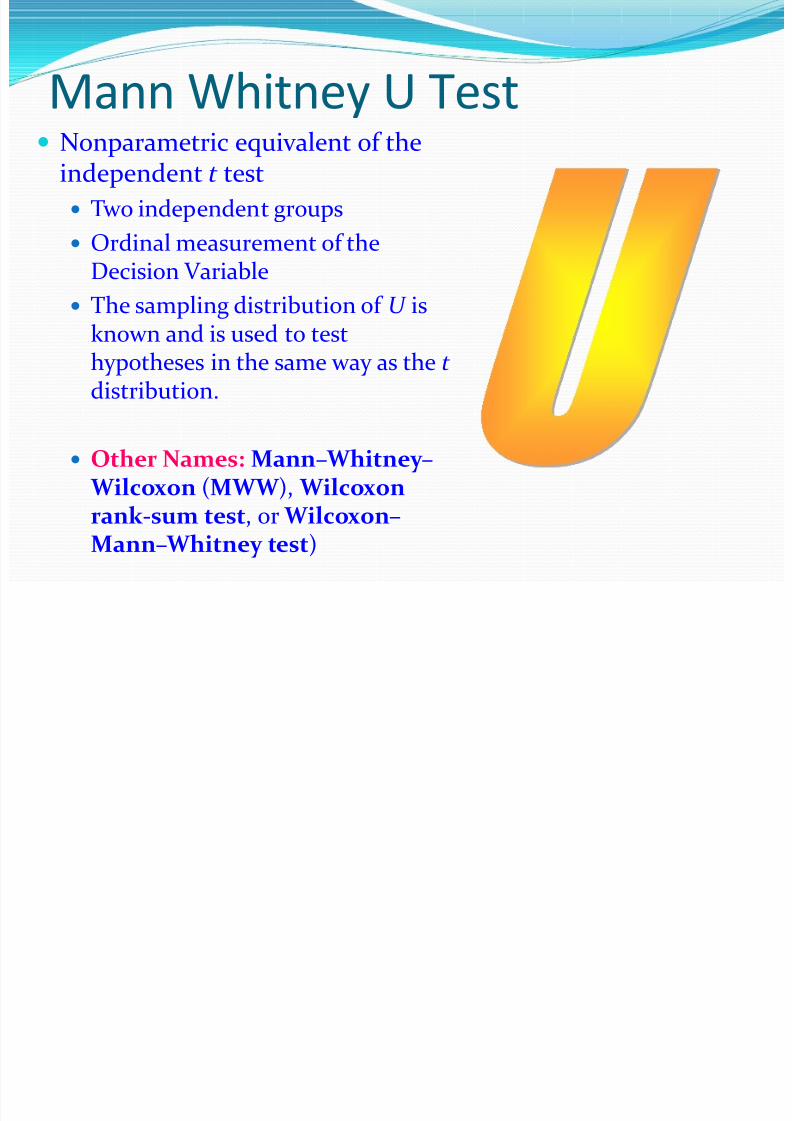
Mann Whitney U Test Nonparametric equivalent of the
independent t test
Two independent groups
Ordinal measurement of the
Decision Variable The sampling distribution of U is
known and is used to testhypotheses in the same way as the t distribution.
Other Names: Mann– Whitney – Wilcoxon (MWW ), Wilcoxonrank-sum test, or Wilcoxon–
Mann– Whitney test)
Income Rank Income Rank

7/28/2019 Non Parametric Tests ICSSR RMC DIB&C Dr.S.selvaRani
http://slidepdf.com/reader/full/non-parametric-tests-icssr-rmc-dibc-drsselvarani 36/71
Mann Whitney U Test
To compute the Mann Whitney U:
Rank the scores inboth groups together
from highest tolowest.
Sum the ranks of thescores for each group.
The sum of ranks foreach group are used tomake the statisticalcomparison.
Rank Total
Income Rank Income Rank
25 12 27 10
32 5 19 17
36 3 16 20
40 1 33 4
22 14 30 7
37 2 17 19
20 16 21 15
18 18 23 1331 6 26 11
29 8 28 9
85 125
7/28/2019 Non Parametric Tests ICSSR RMC DIB&C Dr.S.selvaRani
http://slidepdf.com/reader/full/non-parametric-tests-icssr-rmc-dibc-drsselvarani 37/71
Non-Directional Hypotheses
Null Hypothesis: There is nodifference in scores of the twogroups (i.e. the sum of ranks for
group 1 is no different from thesum of ranks for group 2).
Alternative Hypothesis: There is adifference between the scores of
the two groups (i.e. the sum of ranks for group 1 is significantly different from the sum of ranks forgroup 2).

7/28/2019 Non Parametric Tests ICSSR RMC DIB&C Dr.S.selvaRani
http://slidepdf.com/reader/full/non-parametric-tests-icssr-rmc-dibc-drsselvarani 38/71
Computing the Mann Whitney U Using SPSS
Enter data into SPSS spreadsheet; two columns 1st column: groups; 2nd column: scores (ratings)
Analyze Nonparametric 2 Independent Samples
Select the independent variable and move it to theGrouping Variable box Click Define Groups Enter 1 for group 1 and 2 for group 2
Select the dependent variable and move it to the Test Variable boxMake sure Mann Whitney is selected
Click OK
7/28/2019 Non Parametric Tests ICSSR RMC DIB&C Dr.S.selvaRani
http://slidepdf.com/reader/full/non-parametric-tests-icssr-rmc-dibc-drsselvarani 39/71
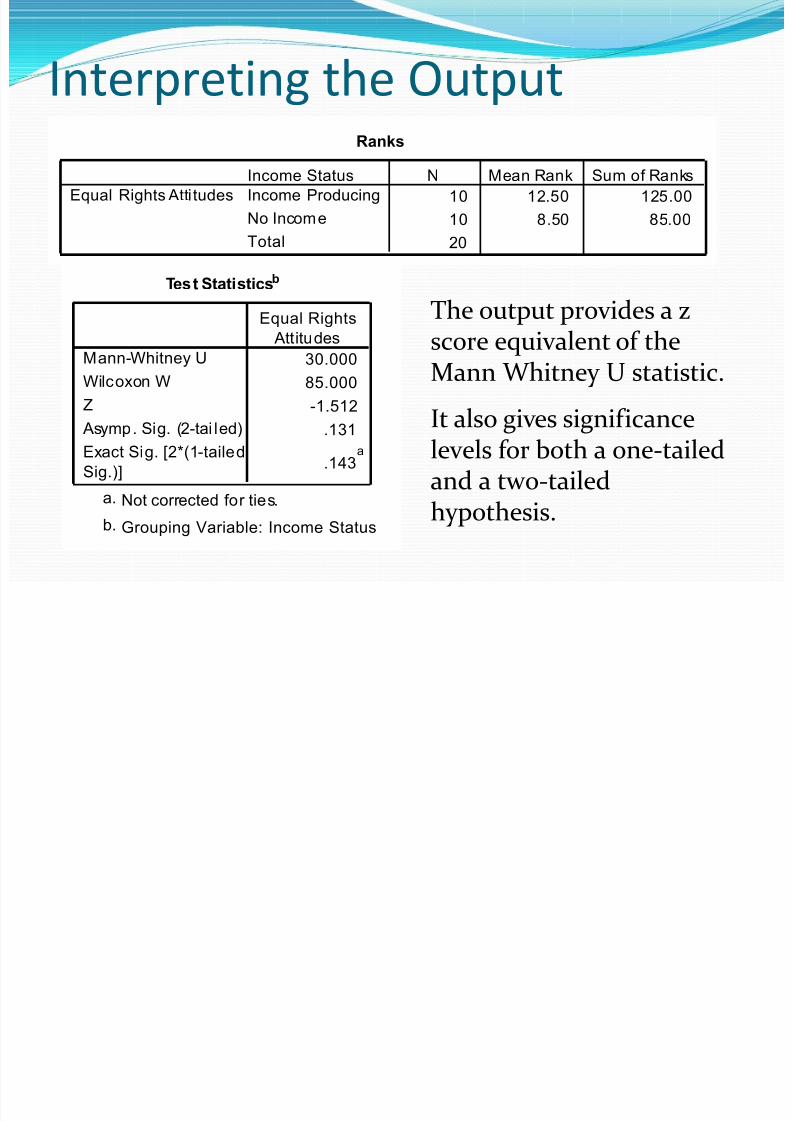
Interpreting the OutputRanks
10 12.50 125.00
10 8.50 85.00
20
Income Status
Income Producing
No Income
Total
Equal Rights Atti tudes
N Mean Rank Sum of Ranks
Test Statisticsb
30.000
85.000
-1.512.131
.143a
Mann-Whitney U
Wilcoxon W
Z
Asymp. Sig. (2-tai led)
Exact Sig. [2*(1-tailed
Sig.)]
Equal Rights
Attitudes
Not corrected for ties.a.
Grouping Variable: Income Statusb.
The output provides a zscore equivalent of theMann Whitney U statistic.
It also gives significancelevels for both a one-tailedand a two-tailedhypothesis.

7/28/2019 Non Parametric Tests ICSSR RMC DIB&C Dr.S.selvaRani
http://slidepdf.com/reader/full/non-parametric-tests-icssr-rmc-dibc-drsselvarani 40/71
where n1
is the sample size for sample 1, and R 1
is the
sum of the ranks in sample 1. Note that it doesn't matter
which of the two samples is considered a sample. Take
either U1 or U2 as U and compute z. Same ǁ result gets.
where, mU andσ
U are the mean andstandard deviation of U . Z ≈ A standardnormal deviate whose significance can bechecked in tables of the normal distbn.

7/28/2019 Non Parametric Tests ICSSR RMC DIB&C Dr.S.selvaRani
http://slidepdf.com/reader/full/non-parametric-tests-icssr-rmc-dibc-drsselvarani 41/71
MW ‘U’ Test
U=R1- [(n1)(n1+1)]/2 =85-[(10)(11)]/2
=85-55=30.
σ= Sq.Rt.
[(n1.n2(n1+n2+1)/12]
= Sq.Rt. (2100/12)=13.23
Mu = n1*n2/2= 50
Z= [U- Mu]/ σ = [30-50]/13.23 =-1.512
U=R2- [(n2)(n2+1)]/2 =125-[(10)(11)]/2
=125-55=70
σ= Sq.Rt.[(n1.n2(n1+n2+1)/12]
= Sq.Rt. (2100/12)=13.23
Mu = n1*n2/2= 50 Z= [70- Mu]/ σ
= [70-50]/13.23 = 1.512
hi

7/28/2019 Non Parametric Tests ICSSR RMC DIB&C Dr.S.selvaRani
http://slidepdf.com/reader/full/non-parametric-tests-icssr-rmc-dibc-drsselvarani 42/71
Mann-Whitney U test II
Pair No Unmaried Married
thorax thorax
width width
1 4 2.8
2 3 2.7
3 2.6 2.6
4 3.85 2.7
5 2.65 2.6
6 2.7 2.6
7 2.85 2.7
8 2.85 2.8
9 3.2 2.9
10 2.9 2.6
7/28/2019 Non Parametric Tests ICSSR RMC DIB&C Dr.S.selvaRani
http://slidepdf.com/reader/full/non-parametric-tests-icssr-rmc-dibc-drsselvarani 43/71
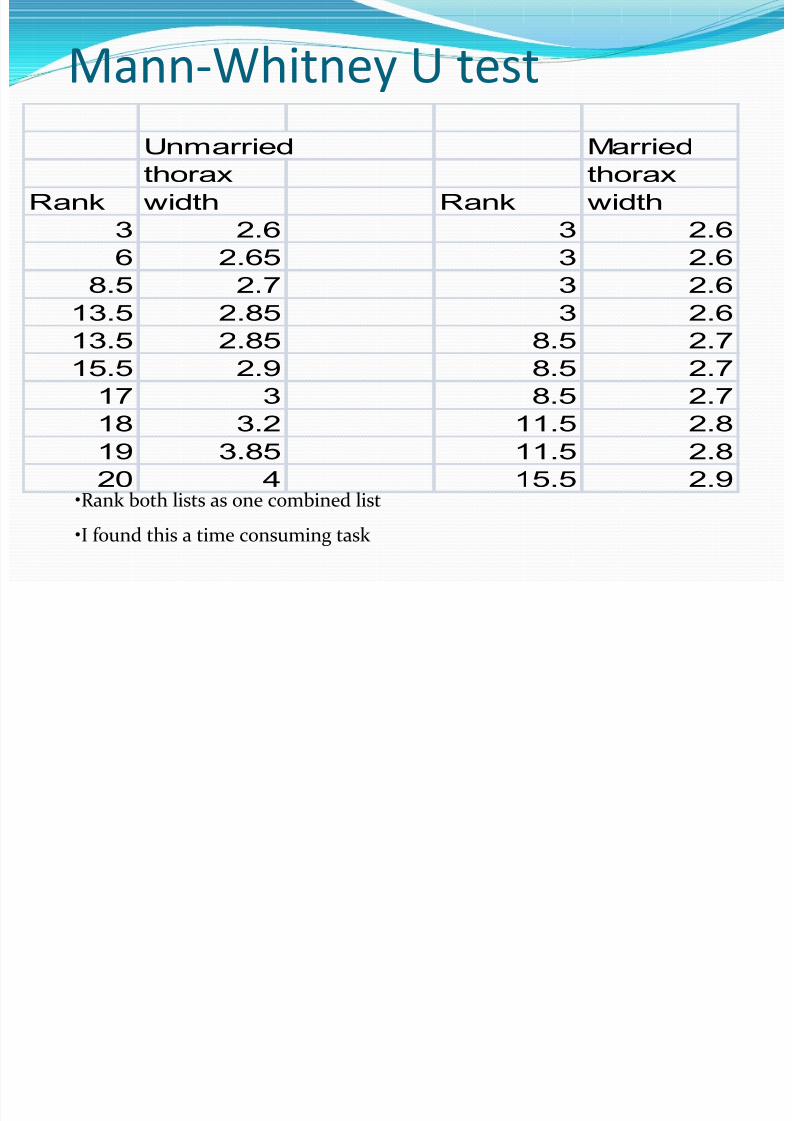
Unmarried Married
thorax thorax
Rank width Rank width
3 2.6 3 2.6
6 2.65 3 2.6
8.5 2.7 3 2.6
13.5 2.85 3 2.6
13.5 2.85 8.5 2.7
15.5 2.9 8.5 2.7
17 3 8.5 2.7
18 3.2 11.5 2.8
19 3.85 11.5 2.8
20 4 15.5 2.9
Mann-Whitney U test
•Rank both lists as one combined list
•I found this a time consuming task
7/28/2019 Non Parametric Tests ICSSR RMC DIB&C Dr.S.selvaRani
http://slidepdf.com/reader/full/non-parametric-tests-icssr-rmc-dibc-drsselvarani 44/71
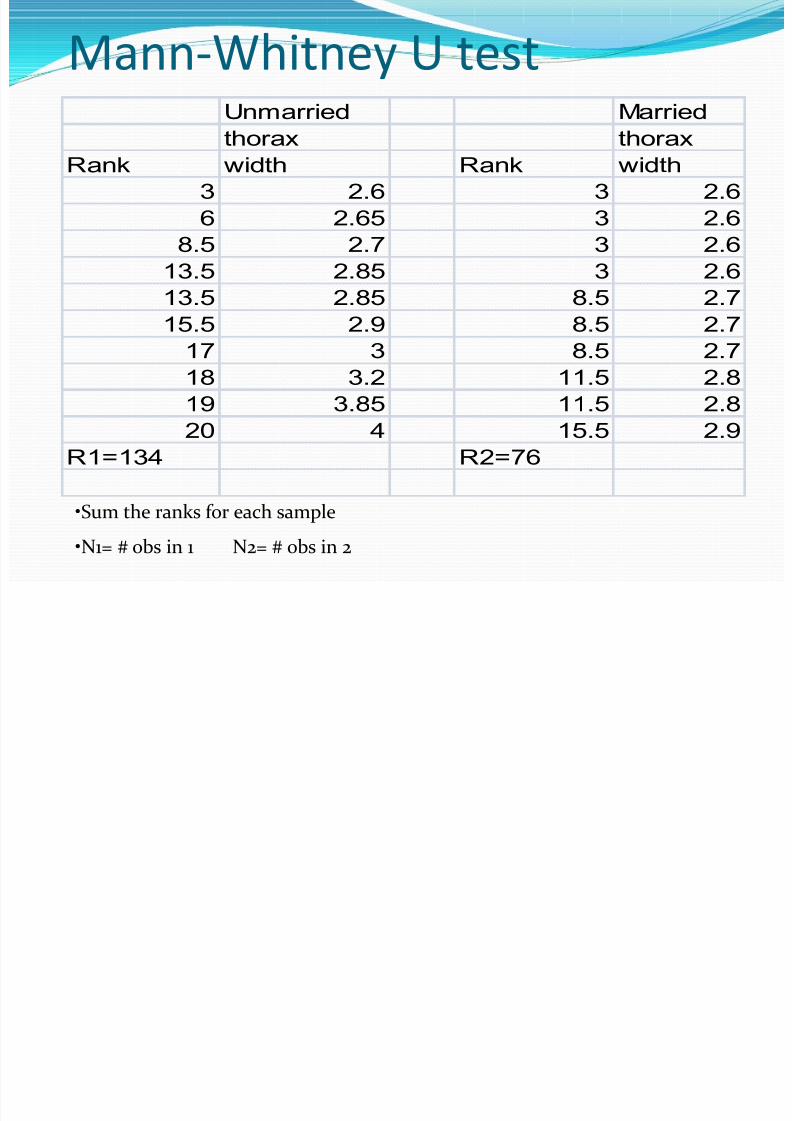
Mann-Whitney U test
•Sum the ranks for each sample
•N1= # obs in 1 N2= # obs in 2
Unmarried Married
thorax thoraxRank width Rank width
3 2.6 3 2.6
6 2.65 3 2.6
8.5 2.7 3 2.6
13.5 2.85 3 2.613.5 2.85 8.5 2.7
15.5 2.9 8.5 2.7
17 3 8.5 2.7
18 3.2 11.5 2.8
19 3.85 11.5 2.820 4 15.5 2.9
R1=134 R2=76

7/28/2019 Non Parametric Tests ICSSR RMC DIB&C Dr.S.selvaRani
http://slidepdf.com/reader/full/non-parametric-tests-icssr-rmc-dibc-drsselvarani 45/71
Wilcoxon Tests
Wilcoxon Dependent Sample

7/28/2019 Non Parametric Tests ICSSR RMC DIB&C Dr.S.selvaRani
http://slidepdf.com/reader/full/non-parametric-tests-icssr-rmc-dibc-drsselvarani 46/71
Wilcoxon Dependent Sample
Signed-Rank Test
Nonparametric equivalent of thedependent (paired-samples) t test
Two dependent groups (withindesign)
Ordinal level measurement of theDV.
The test statistic is T, and thesampling distribution is the T distribution.
Let N be the sample size, thenumber of pairs. Thus, there are atotal of 2N data points.

7/28/2019 Non Parametric Tests ICSSR RMC DIB&C Dr.S.selvaRani
http://slidepdf.com/reader/full/non-parametric-tests-icssr-rmc-dibc-drsselvarani 47/71
Procedure for Testing Hypotheses AboutDifferences in Related Samples
Data : The Data
are computed from pairs of measurementson each of the n elements in the sample.
ssumptions : The random variables
are independent and identically distributed, and theirdistribution is symmetric.
Test Statistic

7/28/2019 Non Parametric Tests ICSSR RMC DIB&C Dr.S.selvaRani
http://slidepdf.com/reader/full/non-parametric-tests-icssr-rmc-dibc-drsselvarani 48/71
Test Statistic
Let R = and
The test statistics
The reading scores in this section represent

7/28/2019 Non Parametric Tests ICSSR RMC DIB&C Dr.S.selvaRani
http://slidepdf.com/reader/full/non-parametric-tests-icssr-rmc-dibc-drsselvarani 49/71
The reading scores in this section represent
differences for 10 randomly selected individuals
who were measured before (Y) and after (X)
taking a speed reading course. These differenceswere determined by the Lilliefors test to be not
normally distributed. Therefore, the Wilcoxon
signed ranks test is used to test with = .01.
Alternate Hypothesis (The mean readingscores are higher after the course).
Null Hypothesis (The mean reading scores are notchanged by the course)
Person Score After Score Before Difference in Rank of Singed Rank

7/28/2019 Non Parametric Tests ICSSR RMC DIB&C Dr.S.selvaRani
http://slidepdf.com/reader/full/non-parametric-tests-icssr-rmc-dibc-drsselvarani 50/71
Course
X1
Course
Y1
Scores
D1 = X1 - Y1
[ D1] R 1
1 261 251 10 7 7
2 292 247 45 8 8
3 317 308 9 6 6
4 253 258 -5 3 -3
5 271 267 4 2 2
6 305 256 49 9 9
7 238 230 8 5 5 8 320 268 52 10 10
9 267 269 -2 1 -1
10 281 275 6 4 4

7/28/2019 Non Parametric Tests ICSSR RMC DIB&C Dr.S.selvaRani
http://slidepdf.com/reader/full/non-parametric-tests-icssr-rmc-dibc-drsselvarani 51/71
= 4.27
TR =Mean of R/(SR /√n) =4.7/(4.27/√10) = 4.7/1.35= 3.48
7/28/2019 Non Parametric Tests ICSSR RMC DIB&C Dr.S.selvaRani
http://slidepdf.com/reader/full/non-parametric-tests-icssr-rmc-dibc-drsselvarani 52/71
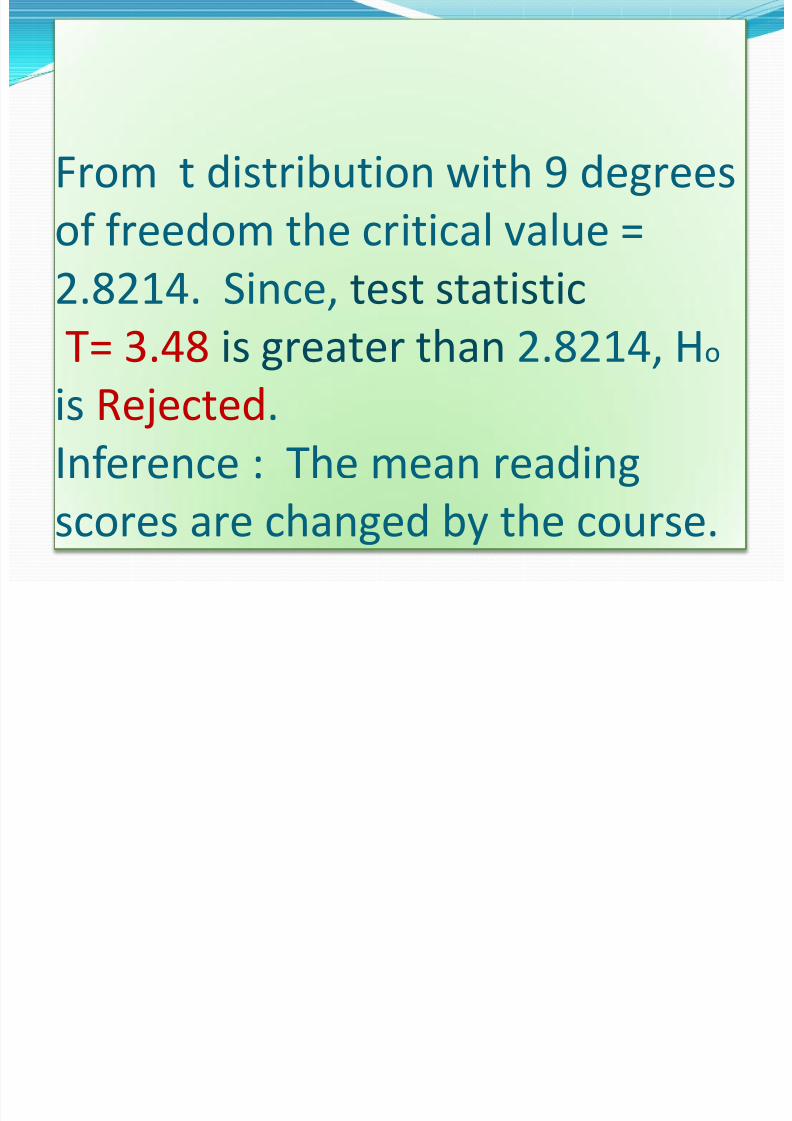
From t distribution with 9 degrees
of freedom the critical value =
2.8214. Since, test statisticT= 3.48 is greater than 2.8214, Ho
is Rejected.Inference : The mean reading
scores are changed by the course.
Computing the Wilcoxon Test Using SPSS

7/28/2019 Non Parametric Tests ICSSR RMC DIB&C Dr.S.selvaRani
http://slidepdf.com/reader/full/non-parametric-tests-icssr-rmc-dibc-drsselvarani 53/71
Computing the Wilcoxon Test Using SPSS
Enter data into SPSS spreadsheet; two columns
1st
column: pretest scores; 2nd
column: post-testscores
Analyze Nonparametric 2 Related Samples
Highlight both variablesmove to the TestPair(s) List Click OK
To Generate Descriptives:
Analyze Descriptive Statistics Explore
Both variables go in the Dependent box
Click StatisticsMake sure Descriptives arechecked Click OK
Wilcoxon Test
7/28/2019 Non Parametric Tests ICSSR RMC DIB&C Dr.S.selvaRani
http://slidepdf.com/reader/full/non-parametric-tests-icssr-rmc-dibc-drsselvarani 54/71
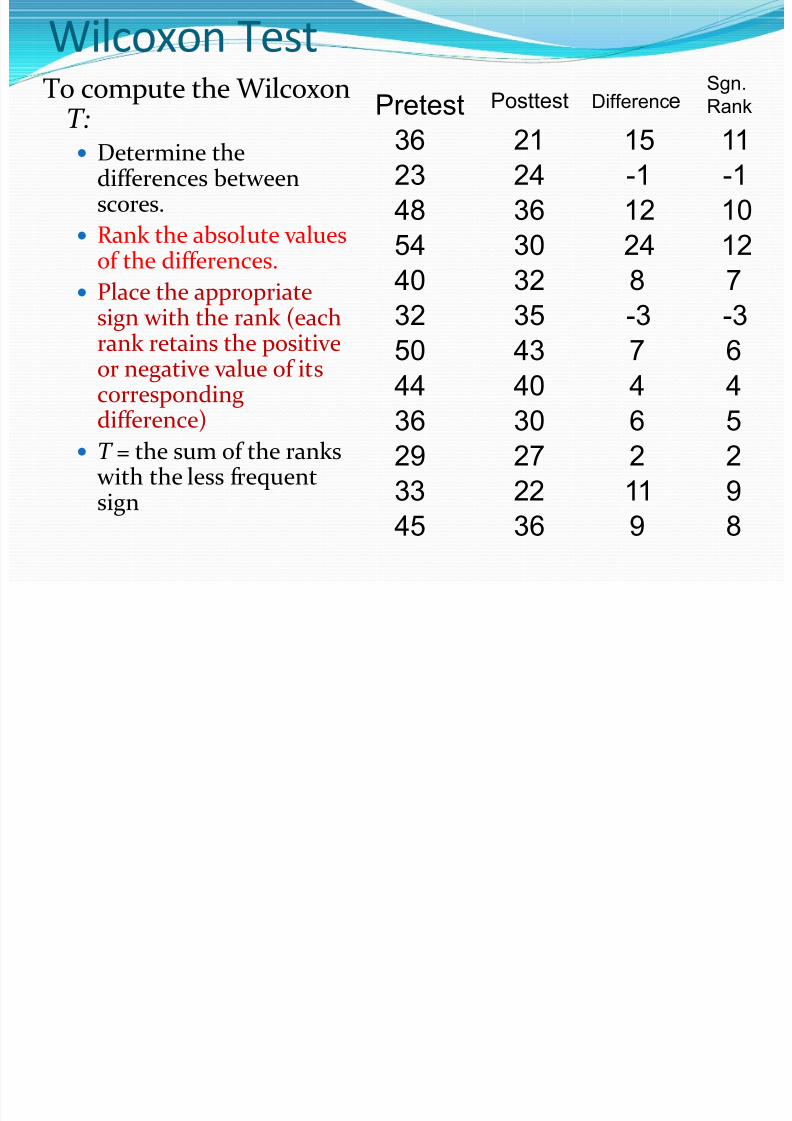
Wilcoxon TestTo compute the Wilcoxon
T: Determine the
differences betweenscores.
Rank the absolute valuesof the differences.
Place the appropriatesign with the rank (eachrank retains the positiveor negative value of itscorresponding
difference) T = the sum of the ranks
with the less frequentsign
Pretest Posttest DifferenceSgn.
Rank
36 21 15 1123 24 -1 -1
48 36 12 10
54 30 24 12
40 32 8 732 35 -3 -3
50 43 7 6
44 40 4 4
36 30 6 529 27 2 2
33 22 11 9
45 36 9 8
7/28/2019 Non Parametric Tests ICSSR RMC DIB&C Dr.S.selvaRani
http://slidepdf.com/reader/full/non-parametric-tests-icssr-rmc-dibc-drsselvarani 55/71
Non-Directional Hypotheses
Null Hypothesis: There is nodifference in scores beforeand after an intervention (i.e.the sums of the positive and
negative ranks will besimilar). Non-Directional Research
Hypothesis: There is a
difference in scores beforeand after an intervention (i.e.the sums of the positive andnegative ranks will bedifferent).
Interpreting the Output

7/28/2019 Non Parametric Tests ICSSR RMC DIB&C Dr.S.selvaRani
http://slidepdf.com/reader/full/non-parametric-tests-icssr-rmc-dibc-drsselvarani 56/71
Interpreting the OutputRanks
10a 7.40 74.00
2b 2.00 4.00
0c
12
Negative Ranks
Positive Ranks
Ties
Total
POSTTEST - PRETES
N Mean Rank Sum of Ranks
POSTTEST < PRETESTa.
POSTTEST > PRETESTb.
POSTTEST = PRETESTc.
Test Statisticsb
-2.746a
.006
Z
Asymp. Sig. (2-tail ed)
POSTTEST -
PRETEST
Based on positive ranks.a.
Wilcoxon Signed Ranks Testb.
The T test statistic is the sumof the ranks with the lessfrequent sign.
The output provides theequivalent z score for the teststatistic.
Two-Tailed significance is
given.

7/28/2019 Non Parametric Tests ICSSR RMC DIB&C Dr.S.selvaRani
http://slidepdf.com/reader/full/non-parametric-tests-icssr-rmc-dibc-drsselvarani 57/71

7/28/2019 Non Parametric Tests ICSSR RMC DIB&C Dr.S.selvaRani
http://slidepdf.com/reader/full/non-parametric-tests-icssr-rmc-dibc-drsselvarani 58/71
The Kruskal-Wallis TestThe Kruskal-Wallis test is a nonparametric test that can be used to
determine whether three or more independent samples were selected
from populations having the same distribution.
H0: There is no difference in the population distributions.
Ha: There is a difference in the population distributions.
Combine the data and rank the values. Then separate
the data according to sample and find the sum of theranks for each sample.
R i= the sum of the ranks for sample i.
Kruskal Wallis Test

7/28/2019 Non Parametric Tests ICSSR RMC DIB&C Dr.S.selvaRani
http://slidepdf.com/reader/full/non-parametric-tests-icssr-rmc-dibc-drsselvarani 59/71
Kruskal-Wallis Test
) )13
1
122
2
2
2
1
2
1
= N
n
R
n
R
n
R
N N H
k
k
Given three or more independent samples, the test
statistic H for the Kruskal-Wallis test is
where k represents the number of samples, niis the size
of the ith sample, N is the sum of the sample sizes, and
Riis the sum of the ranks of the ith sample.
Reject the null hypothesis when H is
greater than the critical number.
(always use a right tail test.)

7/28/2019 Non Parametric Tests ICSSR RMC DIB&C Dr.S.selvaRani
http://slidepdf.com/reader/full/non-parametric-tests-icssr-rmc-dibc-drsselvarani 60/71
You know the one-way ANOVA is an extension of thetwo independent groups t-test to a 3 or morepopulation problem.
The Kruskal-Wallis test is an extension of theMann-Whitney U test to a 3 or more populationproblem
The Kruskal-Wallis test handles k-independent
groups of samples, based on chi-square. Here it isNon-parametric.
Like the Mann-Whiteny U test, this test uses ranks.
Note: Kruskal-Wallis test in the ranktransformed pattern is One-way ANOVA, basedon F test. Here it is Parametric.
7/28/2019 Non Parametric Tests ICSSR RMC DIB&C Dr.S.selvaRani
http://slidepdf.com/reader/full/non-parametric-tests-icssr-rmc-dibc-drsselvarani 61/71
Procedure
1. Combine the observations of the variousgroups
2. Arrange them in order of magnitudefrom lowest to highest
3. Assign ranks to each of the observationsand replace them in each of the groups
4. Original ratio data have thereforebeen converted into ordinal orrankeddata

7/28/2019 Non Parametric Tests ICSSR RMC DIB&C Dr.S.selvaRani
http://slidepdf.com/reader/full/non-parametric-tests-icssr-rmc-dibc-drsselvarani 62/71
5. Ranks are summed in eachgroup and the test statistic, H iscomputed
6. R anks assigned to observationsin each of the k groups are
added separately to give k ranksums
You want to compare the hourly pay rates of accountants

7/28/2019 Non Parametric Tests ICSSR RMC DIB&C Dr.S.selvaRani
http://slidepdf.com/reader/full/non-parametric-tests-icssr-rmc-dibc-drsselvarani 63/71
You want to compare the hourly pay rates of accountants
who work in Michigan, New York and Virginia. To do so,
you randomly select 10 accountants in each state and record
their hourly pay rate as shown below. At the .01 level, can
you conclude that the distributions of accountants’ hourly
pay rates in these three states are different?
MI(1) NY(2) VA(3)
14.24 21.18 17.02
14.06 20.94 20.6314.85 16.26 17.47
17.47 21.03 15.54
14.83 19.95 15.38
19.01 17.54 14.9
13.08 14.89 20.48
15.94 18.88 18.5
13.48 20.06 12.8
16.94 21.81 15.57
7/28/2019 Non Parametric Tests ICSSR RMC DIB&C Dr.S.selvaRani
http://slidepdf.com/reader/full/non-parametric-tests-icssr-rmc-dibc-drsselvarani 64/71
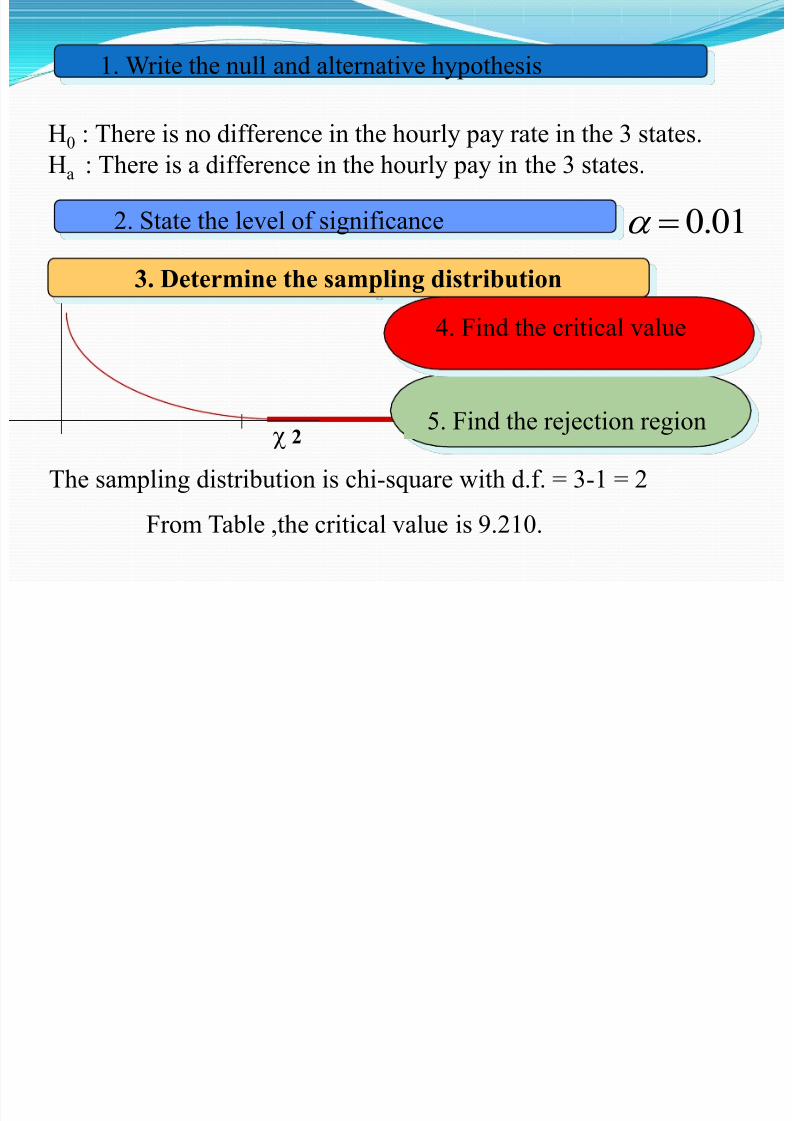
H0 : There is no difference in the hourly pay rate in the 3 states.Ha : There is a difference in the hourly pay in the 3 states.
0.01 =
1. Write the null and alternative hypothesis
2. State the level of significance
3. Determine the sampling distribution
The sampling distribution is chi-square with d.f. = 3-1 = 2
From Table ,the critical value is 9.210.
2 5. Find the rejection region
4. Find the critical value
Data State Rank
12 8 VA 1

7/28/2019 Non Parametric Tests ICSSR RMC DIB&C Dr.S.selvaRani
http://slidepdf.com/reader/full/non-parametric-tests-icssr-rmc-dibc-drsselvarani 65/71
Test Statistic12.8 VA 1
13.08 MI 2
13.48 MI 3
14.06 MI 4
14.24 MI 5
14.83 MI 6
14.85 MI 714.89 NY 8
14.9 VA 9
15.38 VA 10
15.54 VA 11
15.57 VA 12
15.94 MI 13
16.26 NY 14
16.94 MI 1517.02 VA 16
17.47 MI 17.5
17.47 VA 17.5
17.54 NY 19
18.5 VA 20
18.88 NY 21
19.01 MI 22
19.95 NY 2320.06 NY 24
20.48 VA 25
20.63 VA 26
20.94 NY 27
21.03 NY 28
21.18 NY 29
21.81 NY 30
Michigan salaries are in ranks:
2, 3, 4, 5, 6, 7, 13, 15, 17.5, 22The sum = 94.5
New York salaries are in ranks:
8, 14, 19, 21, 23, 24, 27, 28, 29, 30The sum is 223
Virginia salaries are in ranks:
1, 9, 10, 11, 12, 16, 17.5, 20, 25, 26The sum is 147.5
R 94 5 R 223 R 147 5

7/28/2019 Non Parametric Tests ICSSR RMC DIB&C Dr.S.selvaRani
http://slidepdf.com/reader/full/non-parametric-tests-icssr-rmc-dibc-drsselvarani 66/71
R 1= 94.5, R 2 = 223, R 3 =147.5
n1 = 10, n2=10 and n3
=10, so N = 30
H =2 2 212 94.5 223 147.5 3(30 1) 10.76
30(30 1) 10 10 10 =
10.769.210
Make Your Decision
Interpret your decision
The test statistic, 10.76 falls in the rejection region, soReject the null hypothesis
There is a difference in the salaries of the 3 states.
Find the test statistic
7/28/2019 Non Parametric Tests ICSSR RMC DIB&C Dr.S.selvaRani
http://slidepdf.com/reader/full/non-parametric-tests-icssr-rmc-dibc-drsselvarani 67/71
Purpose –
Allows a scientist to test the influence of theindependent variable upon the dependent variable
Controls for the influence of other variables
Conclusions
Primary question – “How reasonable are these results if chance alone were responsible?”
If the results are not due to chance, then the results areattributed to the experimental manipulation
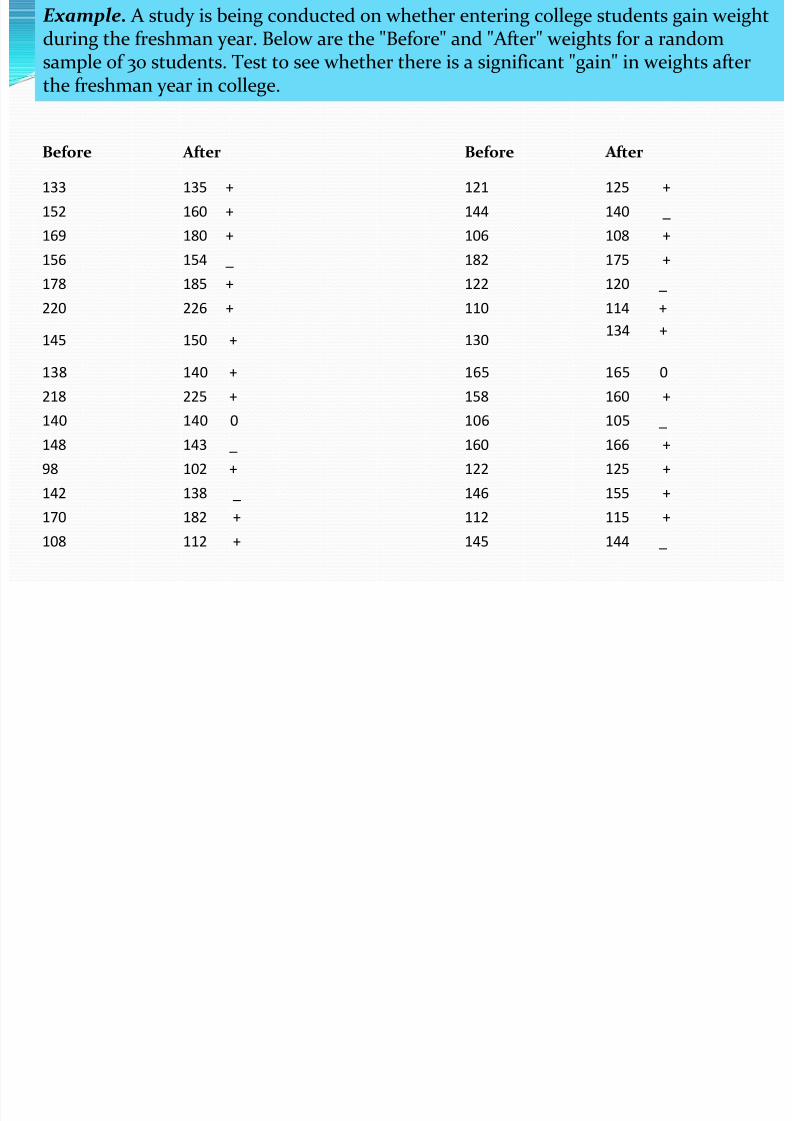
Example. A study is being conducted on whether entering college students gain weightduring the freshman year. Below are the "Before" and "After" weights for a random
7/28/2019 Non Parametric Tests ICSSR RMC DIB&C Dr.S.selvaRani
http://slidepdf.com/reader/full/non-parametric-tests-icssr-rmc-dibc-drsselvarani 68/71
g y gsample of 30 students. Test to see whether there is a significant "gain" in weights afterthe freshman year in college.
Before After Before fter
133 135 + 121 125 +
152 160 + 144 140 _
169 180 + 106 108 +
156 154 _ 182 175 +
178 185 + 122 120 _
220 226 + 110 114 +
145 150 + 130134 +
138 140 + 165 165 0
218 225 + 158 160 +
140 140 0 106 105 _
148 143 _ 160 166 +
98 102 + 122 125 +
142 138 _ 146 155 +
170 182 + 112 115 +
108 112 + 145 144 _
Sign test Calculation

7/28/2019 Non Parametric Tests ICSSR RMC DIB&C Dr.S.selvaRani
http://slidepdf.com/reader/full/non-parametric-tests-icssr-rmc-dibc-drsselvarani 69/71
Sign test Calculation No. of positive Ranks =20; Negative Ranks =8; Ties = 2
Null hypothesis: No difference in weight in pre-poststages
H0: Assumed Population ‘P’ = ‘Q’=0.5
Sample p =20\28 =0.71 & III ly, Sample: q =8\28 =0.29.
SE of Proportion σ= Sq.Rt [(PQ)/n]= Sq.Rt [(.5 * .5)/28]=
0.0298
Z= [p-P]/ SE = [0.71-0.5]/ 0.0298 = 0.21/ 0.0298= 7.05
H0 Rejected at 5% Significance level.
SPSS

7/28/2019 Non Parametric Tests ICSSR RMC DIB&C Dr.S.selvaRani
http://slidepdf.com/reader/full/non-parametric-tests-icssr-rmc-dibc-drsselvarani 70/71
SPSS
After entering the data in the appropriate lists and executing the SIGNTEST
program by entering 2 for the alternative X < Y, we see that there are 20
persons who increased in weight (pos. changes) out of 28 persons who
actually changed weight (changes). If there were "no difference" (i.e., if p =
P(After > Before) = 0.5) ), then there would be only a 0.01785 probability
(from the right-tail P-value) of there being as many as 20 people out of 28
who gained weight. This low p-value gives evidence to reject the claim that
there is no difference in favor of the alternative that there is tendency to gain
weight.

7/28/2019 Non Parametric Tests ICSSR RMC DIB&C Dr.S.selvaRani
http://slidepdf.com/reader/full/non-parametric-tests-icssr-rmc-dibc-drsselvarani 71/71
Thank you


