16
Non-Parametric Tests “There are two kinds of statistics, the kind you look up and the kind you make up.” Rex Stout (Writer)
Non-Parametric Tests
“There are two kinds of statistics, the kind you look up and the kind you make up.”
Rex Stout (Writer)

Non Parametric Tests
• NPTs make no assumptions for normality, equal variances, or outliers
• However the assumptions of independence (spatial & temporal) and design considerations (randomization, sufficient replicates, no pseudoreplication) still apply
• The lack of assumptions makes, NPTs are not as powerful as standard parametric tests
Advantages/Disadvantages

Parametric tests can assume a relationship for comparison
𝑆𝐸𝑥 =𝑠
𝑛 Based on this curve:
• 68.27% confident that the true mean is within 1 𝑆𝐸𝑥of 𝑥 • 95.45% confident that the true mean is within 2 𝑆𝐸𝑥 of 𝑥 • 99.73% confident that the true mean is within 3 𝑆𝐸𝑥 of 𝑥 For confidence intervals: • 95% confident that the true mean is within 1.96 𝑆𝐸𝑥 of 𝑥 𝐶𝐼95 = 𝑥 ± 𝑆𝐸𝑥 ∗ 1.96

Non Parametric Tests
• However, in cases where assumptions are violated and interval data is treated as ordinal, not only are non-parametric tests more proper, they can also be more powerful
Advantages/Disadvantages
Ordinal: quantitative measurement that indicates a relative amount, arranged in rank order, but DOES NOT imply and equal distance between points
E.g. – Ranking of growth performance of 10 trees, where 1 is worst and 10 is best Percentiles or Non-parametric statistics ONLY

Non Parametric Tests Rank based tests
3 Step Procedure:
1. Rank all your observations from 1 to N (1 being assigned to the largest observation)
a. If 2 observations have the same value they split the rank values (e.g. a value of 3.5 for each)
2. Calculate the sum of the ranks for each group/treatment level 3. Calculate the difference in rank-sums between the groups/treatments
If there are no treatment effects, the expectation is that the difference among rank-sums is zero
Non Parametric Tests Rank based tests
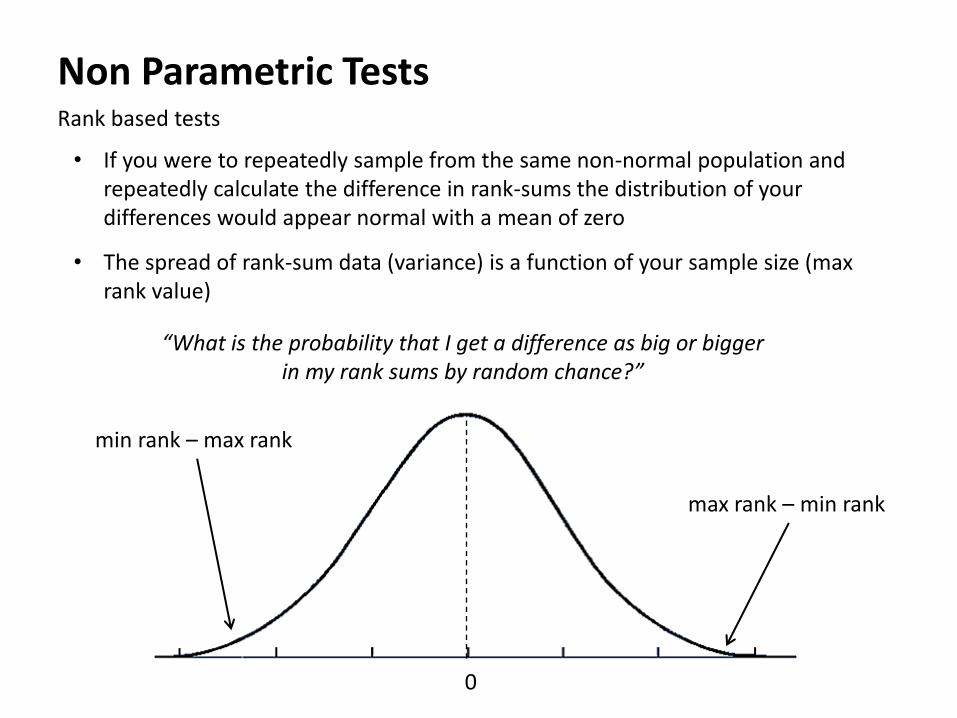
• If you were to repeatedly sample from the same non-normal population and repeatedly calculate the difference in rank-sums the distribution of your differences would appear normal with a mean of zero
• The spread of rank-sum data (variance) is a function of your sample size (max rank value)
0
max rank – min rank
min rank – max rank
“What is the probability that I get a difference as big or bigger in my rank sums by random chance?”

Non Parametric Tests Rank based tests
ID VARIETY YIELD RANK
1 A 104 1
2 A 103 2
3 B 12 3
4 B 11 4
Rank Sum
3
7
Rank Sum
-4
Expectation of rank sum difference A-B = 0
𝐻𝑂: 𝑟𝑠𝐴 − 𝑟𝑠𝐵 = 0 𝐻𝑎: 𝑟𝑠𝐴 − 𝑟𝑠𝐵 ≠ 0

Non Parametric Tests Rank based tests
ID VARIETY YIELD RANK RANK RANK RANK RANK RANK RANK RANK RANK RANK
1 A 104 1 1 1 1 1 1 2 2 2 2
2 A 103 2 2 3 3 4 4 1 1 3 3
3 B 12 3 4 2 4 2 3 3 4 1 4
4 B 11 4 3 4 2 3 2 4 3 4 1
If the rank assigned was purely due to random chance we could have 24 different combinations of ranks 4! = 4*3*2*1 = 24
1 2 9 8 7 6 5 4 3 10
3 3 4 4 5 5 3 3 5 5
7 7 6 6 5 5 7 7 5 5
-4 -4 2 2 0 0 -4 -4 0 0
Rank sum A
Rank sum B
Difference
Non Parametric Tests Rank based tests
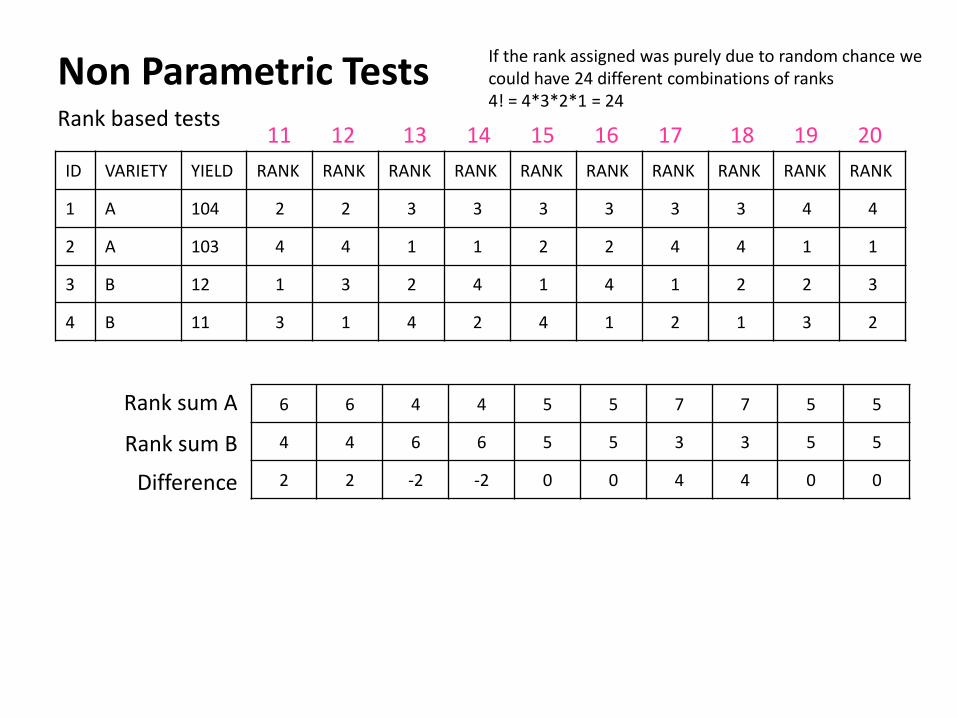
ID VARIETY YIELD RANK RANK RANK RANK RANK RANK RANK RANK RANK RANK
1 A 104 2 2 3 3 3 3 3 3 4 4
2 A 103 4 4 1 1 2 2 4 4 1 1
3 B 12 1 3 2 4 1 4 1 2 2 3
4 B 11 3 1 4 2 4 1 2 1 3 2
If the rank assigned was purely due to random chance we could have 24 different combinations of ranks 4! = 4*3*2*1 = 24
11 12 19 18 17 16 15 14 13 20
6 6 4 4 5 5 7 7 5 5
4 4 6 6 5 5 3 3 5 5
2 2 -2 -2 0 0 4 4 0 0
Rank sum A
Rank sum B
Difference

Non Parametric Tests Rank based tests
ID VARIETY YIELD RANK RANK RANK RANK
1 A 104 4 4 4 4
2 A 103 2 2 3 3
3 B 12 1 3 1 2
4 B 11 3 1 2 1
If the rank assigned was purely due to random chance we could have 24 different combinations of ranks 4! = 4*3*2*1 = 24
21 22 24 23
6 6 7 7
4 4 3 3
2 2 4 4
Rank sum A
Rank sum B
Difference

Non Parametric Tests Rank based tests
What is the probability for each observed difference occurring? • 4 out of 24 have difference of -4 • 4 out of 24 have difference of -2 • 8 out of 24 have difference of 0 • 4 out of 24 have difference of 2 • 4 out of 24 have difference of 4
-4 -2 0 2 4
4
8
Histogram of Differences

-4 -2 0 2 4
4
8
Histogram of Differences
Non Parametric Tests Rank based tests
Our observed difference is -4 P-value = 4/24 = 1/6 = 0.16666
With more samples you would have more histogram breaks – better normal distribution
What is the probability for each observed difference occurring? • 4 out of 24 have difference of -4 • 4 out of 24 have difference of -2 • 8 out of 24 have difference of 0 • 4 out of 24 have difference of 2 • 4 out of 24 have difference of 4
Another ADVANTAGE: Samples do not have to be balanced

Wilcox rank-sum tests T-test equivalent when your data distributions are similarly shaped
Wilcox rank-sum tests in R: wilcox.test(data,mu=a,alternative=“greater”) One sample/One-tailed wilcox.test(sampleA,sampleB,alternative=“two.sided”) Two sample/Two-tailed wilcox.test(before,after,alternative=“two.sided”,paired=T) Two sample/Paired
• P-values for the wilcox tests are estimated in R
• You can ask R for the exact p-value using the option exact=T (default exact=F) BUT this will take R a while to compute!
Wilcoxon Signed Ranks Test – (One sample t-test) Test a hypothesis about the location (median) of a population distribution
Wilcoxon Mann-Whitney Test – (Two sample t-test) Test the null hypothesis that two populations have identical distribution functions against the alternative hypothesis that the two distribution functions differ only with respect to location (median), if at all

Kolmogorov-Smirnov Test T-test equivalent when distributions are of different shape
Kolmogorov-Smirnov test in R: ks.test(sampleA,sampleB,alternative=“greater”) One-tailed ks.test(sampleA,sampleB,alternative=“two.sided”) Two-tailed ks.test(before,after,alternative=“two.sided”,paired=T) Paired
• For one-tailed test, the KS test is used to test whether or not the sample of data is consistent with a specified distribution function
Less powerful at detecting effect of treatment than the Wilcox rank-sum tests
• For a two-tailed test, the KS test is used to test whether or not these two samples may reasonably be assumed to come from the same distribution
Two-sample test ONLY
• P-values for the KS tests are estimated in R
• You can ask R for the exact p-value using the option exact=T (default exact=F) BUT this will take R a while to compute!

Kruskal-Wallis Test One-way ANOVA equivalent for non-normal distributions
Kruskal-Wallis test in R: kruskal.test(RESPONSE~TREATMENT)
• As in ANOVA, a significant treatment effect indicates that at least one population median differs from another
• So, it must be followed up by pair-wise Wilcoxon tests, comparing each of the treatment levels
• And because you are doing multiple comparisons you will have to adjust your p-values to avoid over-inflating your chance of making a Type I Error
• K-W tests the null hypothesis that all populations have identical distribution functions against the alternative hypothesis that at least two of the samples differ only with respect to location (median), if at all
• KW test is a logical extension of the Wilcox tests
Adjusting p-values in R: p.adjust(originalP-value,method="bonferroni",n=numberOfComparisons)

Friedman’s Rank Test Two-way ANOVA with blocks for non-normal distributions
Friedman’s rank test in R: friedman.test(RESPONSE~TREATMENT|BLOCK)
• involves ranking each row (or block) together, then considering the values of ranks by columns
• Non-parametric alternative to analyze a randomized complete block design
![Ch11 [Non-Parametric Tests]](https://static.documents.pub/doc/80x56/577cd3291a28ab9e7896d6ef/ch11-non-parametric-tests.jpg)


