Received: 13 July 2012 – Published in Drink. Water Eng. Sci. Discuss.: 24 August 2012Revised: 21 August 2013 – Accepted: 14 October 2013 – Published: 31 October 2013
Abstract. Existing Dutch guidelines for the design of the drinking water and hot water system of non-residential buildings are based on outdated assumptions on peak water demand or on unfounded assumptionson hot water demand. They generally overestimate peak demand values required for the design of an efficientand reliable water system. Recently, a procedure was developed based on the end-use model SIMDEUM toderive design-demand-equations for peak demand values of both cold and hot water during various time stepsfor several types and sizes of non-residential buildings, viz. offices, hotels and nursing homes. In this paper,the design-demand-equations are validated with measurements of cold and hot water patterns on a per secondbase and with surveys. The good correlation between the simulated water demand patterns and the measuredpatterns indicates that the basis of the design-demand-equations, the SIMDEUM simulated standardised build-ings, is solid. Surveys were held to investigate whether the construction of the standardised buildings basedon the dominant variable corresponds with practice. Surveys show that it is difficult to find relationships toequip the standardised buildings with users and appliances. However, the validation proves that with a properestimation of the number of users and appliances in only the dominant functional room of the standardisedbuildings, SIMDEUM renders a realistic cold and hot water diurnal demand pattern. Furthermore, the newdesign-demand-equations based on these standardised buildings give a better prediction of the measured peakvalues for cold water flow than the existing guidelines. Moreover, the new design-demand-equations can pre-dict hot water use well. In this paper it is illustrated that the new design-demand-equations lead to reliable andimproved designs of building installations and water heater capacity, resulting in more hygienic and economi-cal installations.
1 Introduction
Non-residential users have a significant impact on drink-ing water demand and exhibit a diurnal pattern which canbe completely different from residential users (Loureiro etal., 2010; Blokker et al., 2011). In the Netherlands, non-residential water demand amounts to approximately 28 % ofthe total distributed water. Small-scale business users, de-fined as buildings using less than 10 000 m3 yr−1, use 12 % ofthe total distributed water. Small-scale users include shops,hotels, restaurants, schools, offices, health care institutions,and campsites. Large-scale business users are defined as cus-
tomers that use more than 10 000 m3 yr−1 and are mainlyconcerned with industrial activities (Baggelaar and Geu-dens, 2008). Despite the significant impact of non-residentialusers, limited information relating to their expected water de-mand exists. It is known that the behaviour of the type ofusers varies: an office employee, a hotel guest, a cleaner,kitchen personnel and a patient in a nursing home exhibitvariability in demand, in time of demand, in frequency ofdemand, etc. Some users have similar behaviour to residen-tial users, whereas other have completely different behaviour(Blokker et al., 2011; Pieterse-Quirijns et al., 2009). Studieson water consumption in commercial and industrial sectors,
Published by Copernicus Publications on behalf of the Delft University of Technology.
100 E. J. Pieterse-Quirijns et al.: Non-residential water demand model
Table 1. Old guidelines for maximum momentary flow of cold water in various non-residential buildings (Scheffer, 1994).
Type of non-residential building Relation for peak demand MMFcold (L s−1)
Office – toilets with cistern 1.464+ 0.0019∗ (number of employees)Office – toilets with flushing valve 2.603+ 0.0031∗ (number of employees)Hotel business q
√n+40 %1
Hotel tourist q√
n+70 %Retirement home 1.177+ 0.0092∗ (number of beds)Nursing home 2.257+ 0.0130∗ (number of beds)
ad1: q√
n-method:q√
n= 0.083·√Σ LU, LU is number of loading-units. Every type of tapping point is
credited with loading-units equal to 0.083 L s−1 (300 L h−1). A toilet cistern is, for example, typically0.25 LU.
i.e. hotels and mining residences, show that water consump-tion is influenced by cultural and social norms (Rankin andRousseau, 2006). Water consumption not only varies be-tween countries but also between comparable buildings in thesame country. It is influenced by many factors, such as sea-son and occupancy (Rankin and Rousseau, 2006; Barberánet al., 2013; Cobacho et al., 2005). In hotels, a significantpart of water consumption is due to the needs of guests intheir rooms. Therefore, it depends on occupancy rates, kindof facilities, habits of guests and personnel (Cobacho et al.,2005).
This lack of information creates problems during the de-sign of water infrastructure and in the management of wa-ter demand (Ilemobade et al., 2010). To guarantee a highexpected water demand, pipe diameters in distribution net-works are generally oversized. However, it is understood thatthis overcapacity causes water quality problems, especiallydiscolouration (Vreeburg, 2007). This lack of informationalso complicates the design of drinking water systems insidebuildings as well as the optimal selection of the type and ca-pacity of water heating systems. Badly designed systems cancause stagnant water with health risks, and are less energyefficient and therefore more expensive to operate. The occur-rence ofLegionellain non-residential buildings is an interna-tionally recognised problem (Van der Kooij et al., 2005) thatis related to too high temperatures in the cold water systemor too low temperatures in the hot water system, that can becaused by badly designed hot water circulation systems.
For the design of the drinking water distribution systemoutside as well as inside buildings, understanding the peakvalue of the total water demand, the instantaneous peak de-mand or maximum momentary flow (MMFcold), is essential(Loureiro et al., 2010; Blokker and Van der Schee, 2006).In the Netherlands, existing guidelines provide the MMFcold
for non-residential buildings of various types and sizes (Ta-ble 1). These guidelines are based on measurements carriedout between 1976 and 1980. Total water demand was mea-sured with small time step during several weeks in buildingsof different sizes (Werkgroep momentane waterverbruiken,1985). Presumably, the guidelines are no longer suitable formodern non-residential buildings, that have altered consider-
ably in the past decades with respect to appliances and num-ber and behaviour of users. For example, rest rooms are nowequipped with water saving plumbing fixtures and urinals;in offices the coffee lady has been replaced with machines.Moreover, the working habits have changed, with more flex-ibility in working hours, with open-plan offices and a dif-ference in ratio of men and women and an aim at max-imum occupancy. Hotels are more luxurious and in somecases are extended with facilities for a conference or theatre.Nursing homes have changed in the recent years, aiming atsmall-scale services and residents’ independency. The resi-dents have expectations concerning privacy and continuingtheir personal way of life, resulting in qualitative enhance-ment of facilities and equipment to improve quality of life.The outlined problems, caused by overcapacity, and new de-velopments inLegionellacontrol, suggest that the existingguidelines do not give an accurate insight into peak waterdemand.
Hot water consumption profiles have a significant influ-ence on the hot water system design (Rankin and Rousseau,2006). Understanding hot water demand is essential to selectthe correct type of water heater as well as the design capac-ity of the hot water device. In addition to the peak demandof hot water, i.e. maximum momentary flow (MMFhot), thehot water use (HWU) in different time periods is required forthe choice and design of hot water devices. The desired timeperiod depends on the type of selected water heater system(Scheffer, 1994). For the characteristic values of hot waterdemand (MMFhot and HWU) there are no national and in-ternational guidelines, similar to those for cold demand inTable 1. Suppliers of heating systems use their own companyspecific guidelines.
Because of the described problems with the existing guide-lines and because no guidelines exist for the hot water de-mand, new models for characteristic values of cold and hotwater for non-residential buildings are required. In 2010, aprocedure was developed to derive design-demand-equationsfor the peak demand values of both cold and hot waterfor various types of non-residential buildings, i.e. offices,hotels and nursing homes (Pieterse-Quirijns et al., 2010).The design-demand-equations are based on water demand
Drink. Water Eng. Sci., 6, 99–114, 2013 www.drink-water-eng-sci.net/6/99/2013/
E. J. Pieterse-Quirijns et al.: Non-residential water demand model 101
Table 2. Functional rooms and the type of user who take water in the functional rooms in three categories of non-residential buildings, office,hotel and nursing home.
Functional room Type of users (and reason for variable occupancy)
office hotel nursing home
Meeting area Employees (fulltime/part-timeworking), visitors
Guests (meeting, conference, theatre),employees
Visitors, employees
Lodging – Hotel guests (tourists, business people) ResidentsRestaurant Kitchen personnel Kitchen personnel Kitchen personnelFitness room Employees using the fitness room Hotel guests using the fitness room –Technical/other Number of buckets filled for cleaning, washing machines,. . .
patterns simulated by SIMDEUM, an end-use model whichsimulates residential and non-residential water demand pat-terns (Blokker et al., 2011). In the procedure, SIMDEUMsimulates diurnal water demand patterns, for a specific non-residential building with a certain value of its dominant vari-able. This dominant variable characterises the size of a build-ing, such as the number of employees in an office or the num-ber of beds in a nursing home. A crucial part of the proce-dure is the standardisation of each type of building, meaningthat for a specific value of the dominant variable, a build-ing is constructed with the corresponding number and char-acteristics of appliances (like toilets, showers, etc.) and ofusers (like kitchen personnel, visitors, etc.). The relevant in-formation is not easy to find, since there is much freedomin the design of sanitary installations. Moreover, the numberand behaviour of present non-residential water users is barelyknown. In Sect. 2 of this paper, the background is describedmore extensively.
Before the SIMDEUM based design-demand-equationscan be applied in practice and replace existing guidelines,they need to be validated. For the validation, measurementsof cold and hot water diurnal demand patterns are requiredon a per second base for various buildings, to ensure an accu-rate determination of peak demands. This is the first time thatwater demand patterns (especially hot water demand) will bemeasured on such a small timescale in the Netherlands. Thevalidation procedure consists of two steps.
In the first step, the assumptions of how to standardisebuildings, on which the design-demand-equations are based,are validated with measurements and surveys. The validationstep consists of two phases. Firstly, average simulated diur-nal demand patterns of the standardised buildings are com-pared with measurements of cold and hot water patterns ona per second base for 6 different buildings. Secondly, sur-veys will show whether the construction of the standardisedbuildings based on the dominant variable corresponds withpractice. When correspondence is established between stan-dardised buildings and reality, in both predicted water de-mand patterns and construction of the building, the solid baseof SIMDEUM based design-demand-equations is shown in aproof of concept, i.e. when the construction is reliable, the
prediction of the expected cold and hot water demand in thebuilding will be reliable.
In the second validation step, the outcome of the design-demand-equations is compared to the measured peak demandvalues of cold and hot water. When the basis is solid, this stepshows that the derivation of the design-demand-equations isreliable.
This paper describes the validation of the SIMDEUMbased design-demand-equations. Moreover, the conse-quences for design of distribution systems and heating sys-tems are illustrated, by comparing resulting designs for pipediameter, water meter and heaters from developed design-demand-equations, old guidelines and measured practicalvalues.
2 Background
2.1 Background of SIMDEUM for non-residentialbuildings
SIMDEUM stands for “SIMulation of waterDemand, anEnd-UseModel”. It is a stochastic model based on statisti-cal information of end uses, including statistical data on wa-ter appliances and users (Blokker et al., 2010). SIMDEUM’sphilosophy is that people’s behaviour regarding water use ismodelled, taking into account the differences in installationand water-using appliances. This means that in each build-ing, whether it is residential or non-residential, the charac-teristics of the present water-using appliances and taps (i.e.flow rate, duration of use, frequency of use and the desiredtemperature) are considered as well as the water-using be-haviour of the users who are present (i.e. presence, time ofuse, frequency of use).
SIMDEUM for non-residential water demand follows amodular approach. Each building is composed of functionalrooms, characterised by its typical users and water using ap-pliances (Table 2). The characteristics of the users and theappliances are different for each type of building and are ex-tensively described by Blokker et al. (2011). With this ap-proach, water demand patterns over the day for cold and hotwater demand can be simulated for a specific non-residential
www.drink-water-eng-sci.net/6/99/2013/ Drink. Water Eng. Sci., 6, 99–114, 2013
102 E. J. Pieterse-Quirijns et al.: Non-residential water demand model
Table 3. Different typologies of non-residential buildings within the categories offices, hotels and nursing homes and the dominant functionalroom and dominant variable in each category.
category typology dominant
typology name users Discerning appliances functional room variable
office office A male:female=65 % : 35 %
toilet with 6 L cistern andurinal
meeting area number ofemployees
office B male : female=65 %:35 %
toilet with flushing valveand urinal
office C male : female=65 % : 35 %
toilet with 6 L cistern andno urinal
office D male : female=90 % : 10 %
toilet with 6 L cistern andurinal
hotel business(incl. conference)
business guests 7 types of shower hotel rooms number of hotelrooms
tourist (incl. theatre) tourist guests 7 types of shower
nursing home A: individual room care neededresidents
building. From these daily water demand patterns, the char-acteristic peak demand values of cold and hot water duringvarious time steps can be derived. These characteristics formthe basis for design guidelines.
2.2 Background of SIMDEUM based design-demand-equations for non-residential buildings
For three categories of small-scale non-residential build-ings SIMDEUM based design-demand-equations were de-veloped, viz. offices, hotels and nursing homes. These cat-egories are selected based on the cooperation with the Dutchinstallation sector, where they were mostly interested in thesebuildings (Blokker et al., 2011). These categories are mostoften applied in practice. Moreover, they are characterisedby a generalised construction or standardisation. This in con-trast with, for example, a hospital or a prison, which are morespecific and cannot be captured in a general approach. Withineach category, different typologies of buildings were defined.The typologies can vary in types of appliances, like types oftoilets, flow of showers, and in the type of users, like busi-ness or tourist hotel guests. In Table 3, the defined typologies
within each category are presented. The definition of the ty-pologies is arbitrary. In the presented various typologies, ex-isting building types were used as reference, based on prac-tical experiences given by Uneto-VNI, the Dutch associationof installers.
The aim of the design-demand-equations is to predict thepeak demand values (MMFcold, MMFhot and HWU in dif-ferent time periods) for various types of offices, hotels andnursing homes of arbitrary size. The new design-demand-equations predict the peak demand values as a function of a(dominant) variable. Blokker et al. (2011) presented a sensi-tivity analysis for SIMDEUM for non-residential water de-mand in each of the considered categories. The dominantvariable was established from this sensitivity analysis. Thedominant variable is the functional room or user in a build-ing that contributes most to the pattern and total amount ofwater use in a building. In offices, the main contributor (80–90 %) to water demand is the meeting area with the toilets.The dominant variable for offices therefore is the number ofemployees that use the toilets. In hotels, the main contribu-tor is the hotel rooms (app. 80 %) for hotels without confer-ence and theatre facilities and without laundry. The dominant
Drink. Water Eng. Sci., 6, 99–114, 2013 www.drink-water-eng-sci.net/6/99/2013/
E. J. Pieterse-Quirijns et al.: Non-residential water demand model 103
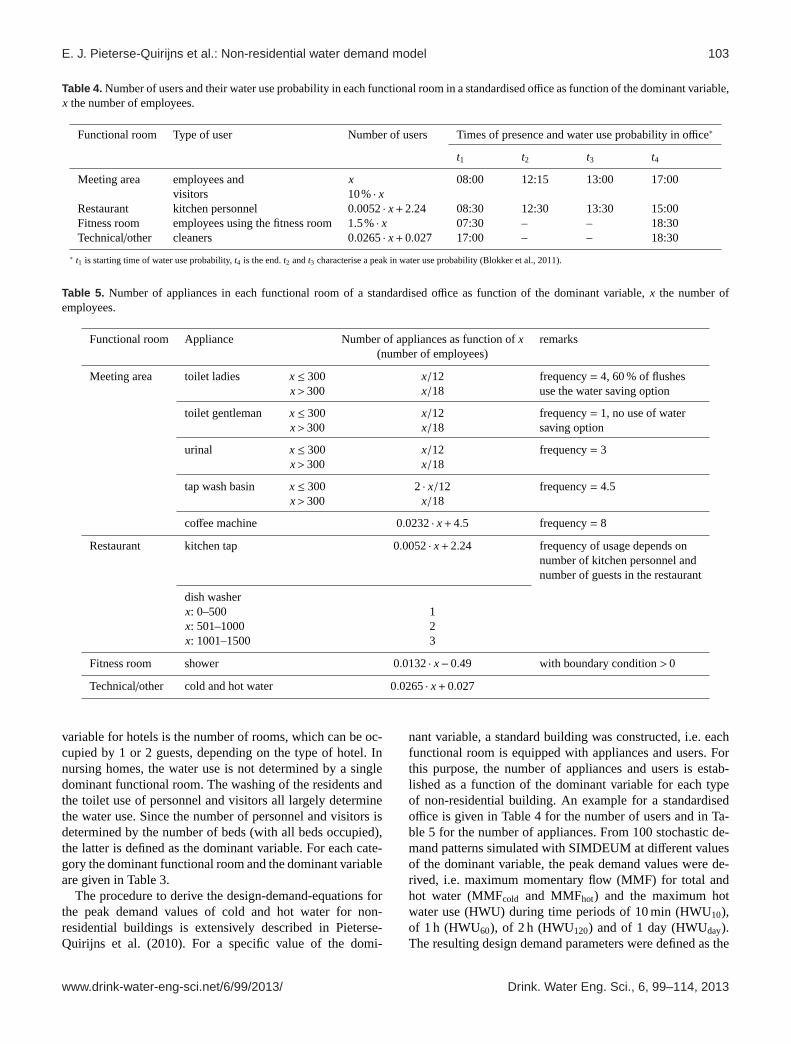
Table 4. Number of users and their water use probability in each functional room in a standardised office as function of the dominant variable,x the number of employees.
Functional room Type of user Number of users Times of presence and water use probability in office∗
t1 t2 t3 t4
Meeting area employees andvisitors
x10%· x
08:00 12:15 13:00 17:00
Restaurant kitchen personnel 0.0052· x+2.24 08:30 12:30 13:30 15:00Fitness room employees using the fitness room 1.5%· x 07:30 – – 18:30Technical/other cleaners 0.0265· x+0.027 17:00 – – 18:30
∗ t1 is starting time of water use probability,t4 is the end.t2 andt3 characterise a peak in water use probability (Blokker et al., 2011).
Table 5. Number of appliances in each functional room of a standardised office as function of the dominant variable,x the number ofemployees.
Functional room Appliance Number of appliances as function ofx remarks(number of employees)
Meeting area toilet ladies x≤ 300 x/12 frequency= 4, 60 % of flushesx>300 x/18 use the water saving option
toilet gentleman x≤ 300 x/12 frequency= 1, no use of waterx>300 x/18 saving option
urinal x≤ 300 x/12 frequency= 3x>300 x/18
tap wash basin x≤ 300 2· x/12 frequency= 4.5x>300 x/18
coffee machine 0.0232· x+4.5 frequency= 8
Restaurant kitchen tap 0.0052· x+2.24 frequency of usage depends onnumber of kitchen personnel andnumber of guests in the restaurant
dish washerx: 0–500 1x: 501–1000 2x: 1001–1500 3
Fitness room shower 0.0132· x−0.49 with boundary condition>0
Technical/other cold and hot water 0.0265· x+0.027
variable for hotels is the number of rooms, which can be oc-cupied by 1 or 2 guests, depending on the type of hotel. Innursing homes, the water use is not determined by a singledominant functional room. The washing of the residents andthe toilet use of personnel and visitors all largely determinethe water use. Since the number of personnel and visitors isdetermined by the number of beds (with all beds occupied),the latter is defined as the dominant variable. For each cate-gory the dominant functional room and the dominant variableare given in Table 3.
The procedure to derive the design-demand-equations forthe peak demand values of cold and hot water for non-residential buildings is extensively described in Pieterse-Quirijns et al. (2010). For a specific value of the domi-
nant variable, a standard building was constructed, i.e. eachfunctional room is equipped with appliances and users. Forthis purpose, the number of appliances and users is estab-lished as a function of the dominant variable for each typeof non-residential building. An example for a standardisedoffice is given in Table 4 for the number of users and in Ta-ble 5 for the number of appliances. From 100 stochastic de-mand patterns simulated with SIMDEUM at different valuesof the dominant variable, the peak demand values were de-rived, i.e. maximum momentary flow (MMF) for total andhot water (MMFcold and MMFhot) and the maximum hotwater use (HWU) during time periods of 10 min (HWU10),of 1 h (HWU60), of 2 h (HWU120) and of 1 day (HWUday).The resulting design demand parameters were defined as the
www.drink-water-eng-sci.net/6/99/2013/ Drink. Water Eng. Sci., 6, 99–114, 2013
104 E. J. Pieterse-Quirijns et al.: Non-residential water demand model
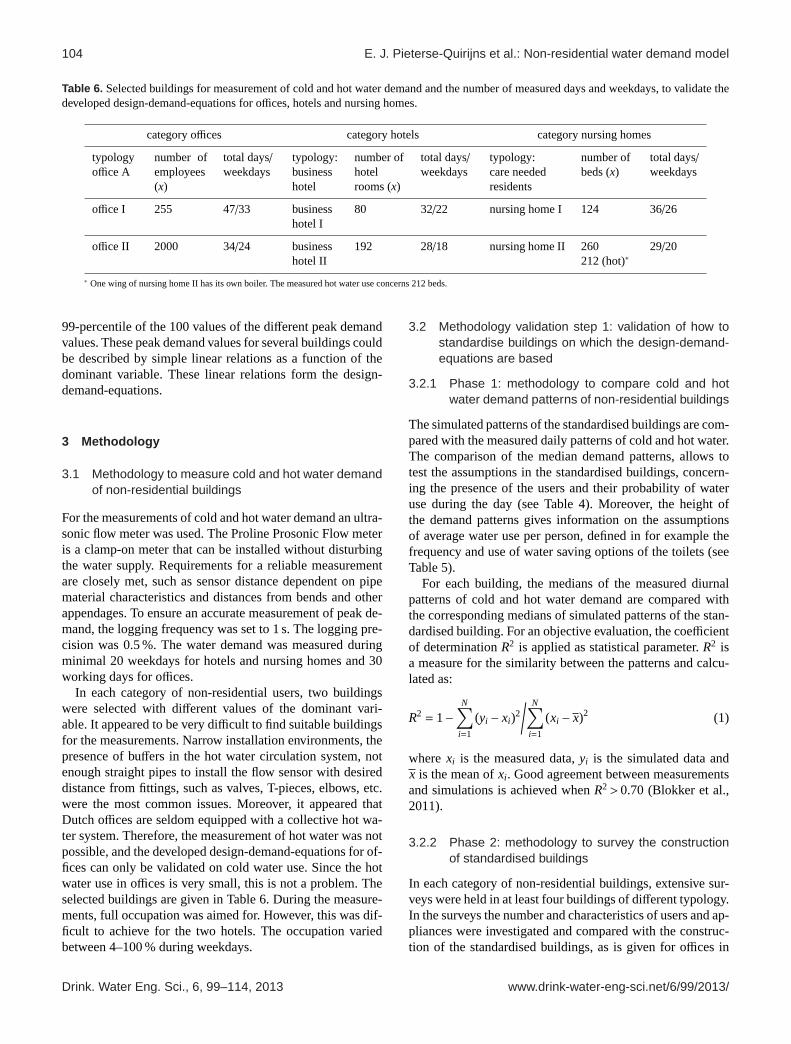
Table 6. Selected buildings for measurement of cold and hot water demand and the number of measured days and weekdays, to validate thedeveloped design-demand-equations for offices, hotels and nursing homes.
category offices category hotels category nursing homes
typologyoffice A
number ofemployees(x)
total days/weekdays
typology:businesshotel
number ofhotelrooms (x)
total days/weekdays
typology:care neededresidents
number ofbeds (x)
total days/weekdays
office I 255 47/33 businesshotel I
80 32/22 nursing home I 124 36/26
office II 2000 34/24 businesshotel II
192 28/18 nursing home II 260212 (hot)∗
29/20
∗ One wing of nursing home II has its own boiler. The measured hot water use concerns 212 beds.
99-percentile of the 100 values of the different peak demandvalues. These peak demand values for several buildings couldbe described by simple linear relations as a function of thedominant variable. These linear relations form the design-demand-equations.
3 Methodology
3.1 Methodology to measure cold and hot water demandof non-residential buildings
For the measurements of cold and hot water demand an ultra-sonic flow meter was used. The Proline Prosonic Flow meteris a clamp-on meter that can be installed without disturbingthe water supply. Requirements for a reliable measurementare closely met, such as sensor distance dependent on pipematerial characteristics and distances from bends and otherappendages. To ensure an accurate measurement of peak de-mand, the logging frequency was set to 1 s. The logging pre-cision was 0.5 %. The water demand was measured duringminimal 20 weekdays for hotels and nursing homes and 30working days for offices.
In each category of non-residential users, two buildingswere selected with different values of the dominant vari-able. It appeared to be very difficult to find suitable buildingsfor the measurements. Narrow installation environments, thepresence of buffers in the hot water circulation system, notenough straight pipes to install the flow sensor with desireddistance from fittings, such as valves, T-pieces, elbows, etc.were the most common issues. Moreover, it appeared thatDutch offices are seldom equipped with a collective hot wa-ter system. Therefore, the measurement of hot water was notpossible, and the developed design-demand-equations for of-fices can only be validated on cold water use. Since the hotwater use in offices is very small, this is not a problem. Theselected buildings are given in Table 6. During the measure-ments, full occupation was aimed for. However, this was dif-ficult to achieve for the two hotels. The occupation variedbetween 4–100 % during weekdays.
3.2 Methodology validation step 1: validation of how tostandardise buildings on which the design-demand-equations are based
3.2.1 Phase 1: methodology to compare cold and hotwater demand patterns of non-residential buildings
The simulated patterns of the standardised buildings are com-pared with the measured daily patterns of cold and hot water.The comparison of the median demand patterns, allows totest the assumptions in the standardised buildings, concern-ing the presence of the users and their probability of wateruse during the day (see Table 4). Moreover, the height ofthe demand patterns gives information on the assumptionsof average water use per person, defined in for example thefrequency and use of water saving options of the toilets (seeTable 5).
For each building, the medians of the measured diurnalpatterns of cold and hot water demand are compared withthe corresponding medians of simulated patterns of the stan-dardised building. For an objective evaluation, the coefficientof determinationR2 is applied as statistical parameter.R2 isa measure for the similarity between the patterns and calcu-lated as:
R2 = 1−N∑
i=1
(yi − xi)2
/ N∑i=1
(xi − x)2 (1)
wherexi is the measured data,yi is the simulated data andx is the mean ofxi . Good agreement between measurementsand simulations is achieved whenR2>0.70 (Blokker et al.,2011).
3.2.2 Phase 2: methodology to survey the constructionof standardised buildings
In each category of non-residential buildings, extensive sur-veys were held in at least four buildings of different typology.In the surveys the number and characteristics of users and ap-pliances were investigated and compared with the construc-tion of the standardised buildings, as is given for offices in
Drink. Water Eng. Sci., 6, 99–114, 2013 www.drink-water-eng-sci.net/6/99/2013/
E. J. Pieterse-Quirijns et al.: Non-residential water demand model 105
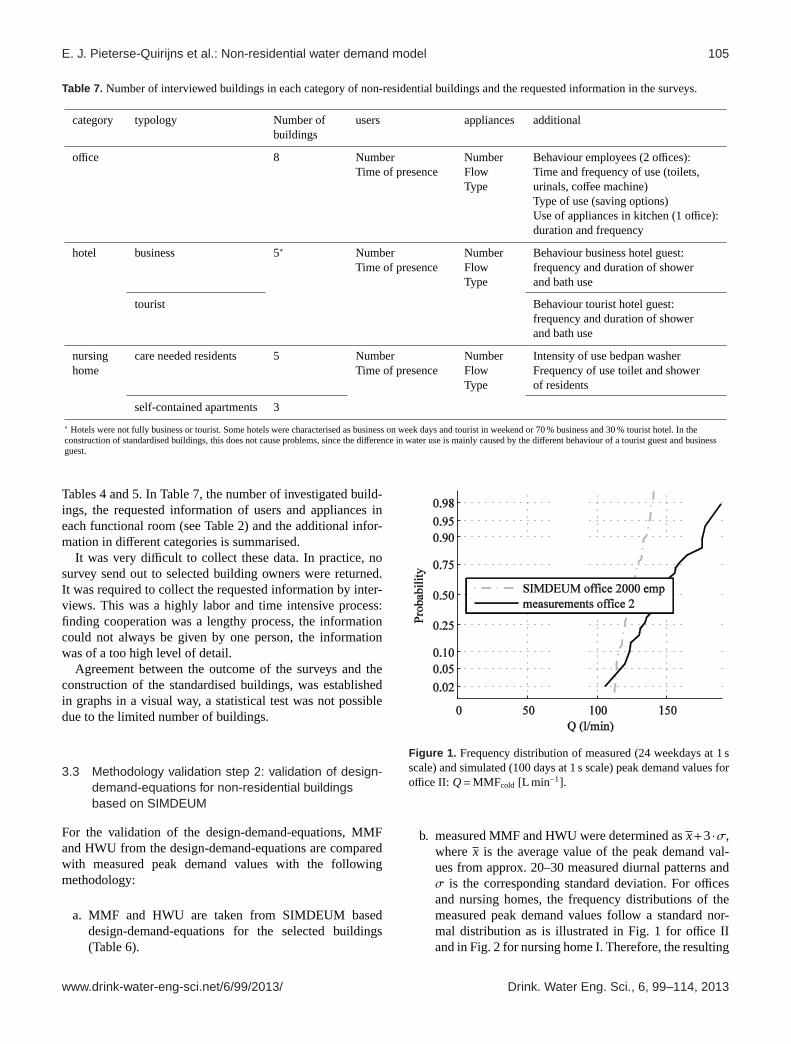
Table 7. Number of interviewed buildings in each category of non-residential buildings and the requested information in the surveys.
category typology Number ofbuildings
users appliances additional
office 8 NumberTime of presence
NumberFlowType
Behaviour employees (2 offices):Time and frequency of use (toilets,urinals, coffee machine)Type of use (saving options)Use of appliances in kitchen (1 office):duration and frequency
hotel business 5∗ NumberTime of presence
NumberFlowType
Behaviour business hotel guest:frequency and duration of showerand bath use
tourist Behaviour tourist hotel guest:frequency and duration of showerand bath use
nursinghome
care needed residents 5 NumberTime of presence
NumberFlowType
Intensity of use bedpan washerFrequency of use toilet and showerof residents
self-contained apartments 3
∗ Hotels were not fully business or tourist. Some hotels were characterised as business on week days and tourist in weekend or 70 % business and 30 % tourist hotel. In theconstruction of standardised buildings, this does not cause problems, since the difference in water use is mainly caused by the different behaviour of a tourist guest and businessguest.
Tables 4 and 5. In Table 7, the number of investigated build-ings, the requested information of users and appliances ineach functional room (see Table 2) and the additional infor-mation in different categories is summarised.
It was very difficult to collect these data. In practice, nosurvey send out to selected building owners were returned.It was required to collect the requested information by inter-views. This was a highly labor and time intensive process:finding cooperation was a lengthy process, the informationcould not always be given by one person, the informationwas of a too high level of detail.
Agreement between the outcome of the surveys and theconstruction of the standardised buildings, was establishedin graphs in a visual way, a statistical test was not possibledue to the limited number of buildings.
3.3 Methodology validation step 2: validation of design-demand-equations for non-residential buildingsbased on SIMDEUM
For the validation of the design-demand-equations, MMFand HWU from the design-demand-equations are comparedwith measured peak demand values with the followingmethodology:
a. MMF and HWU are taken from SIMDEUM baseddesign-demand-equations for the selected buildings(Table 6).
32
1
Figure 1. Frequency distribution of measured (24 weekdays at 1 sec. scale) and simulated 2
(100 days at 1 sec. scale) peak demand values for office II: Q = MMFcold [l/min] 3
4
5
6
Figure 1. Frequency distribution of measured (24 weekdays at 1 sscale) and simulated (100 days at 1 s scale) peak demand values foroffice II: Q=MMFcold [L min−1].
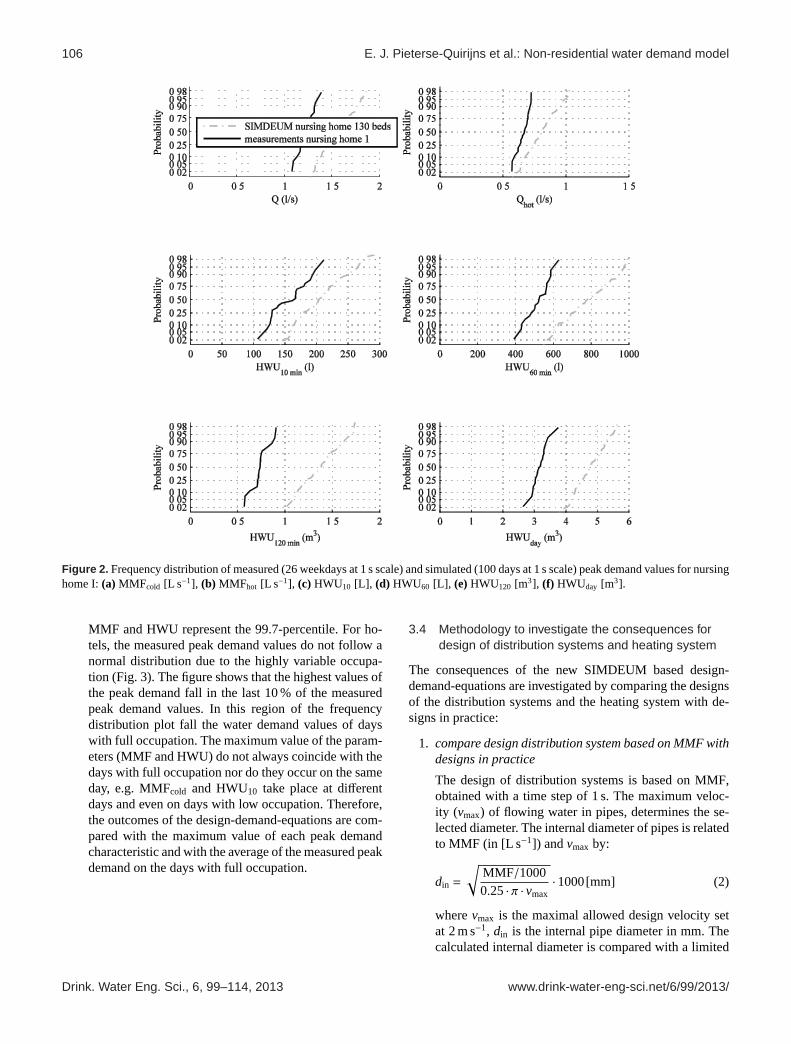
b. measured MMF and HWU were determined asx+3·σ,wherex is the average value of the peak demand val-ues from approx. 20–30 measured diurnal patterns andσ is the corresponding standard deviation. For officesand nursing homes, the frequency distributions of themeasured peak demand values follow a standard nor-mal distribution as is illustrated in Fig. 1 for office IIand in Fig. 2 for nursing home I. Therefore, the resulting
www.drink-water-eng-sci.net/6/99/2013/ Drink. Water Eng. Sci., 6, 99–114, 2013
106 E. J. Pieterse-Quirijns et al.: Non-residential water demand model
33
1
Figure 2. Frequency distribution of measured (26 weekdays at 1 sec. scale) and simulated 2
(100 days at 1 sec. scale) peak demand values for nursing home I: a) MMFcold [l/s], b) MMFhot 3
Figure 2. Frequency distribution of measured (26 weekdays at 1 s scale) and simulated (100 days at 1 s scale) peak demand values for nursinghome I:(a) MMFcold [L s−1], (b) MMFhot [L s−1], (c) HWU10 [L], (d) HWU60 [L], (e)HWU120 [m3], (f) HWUday [m3].
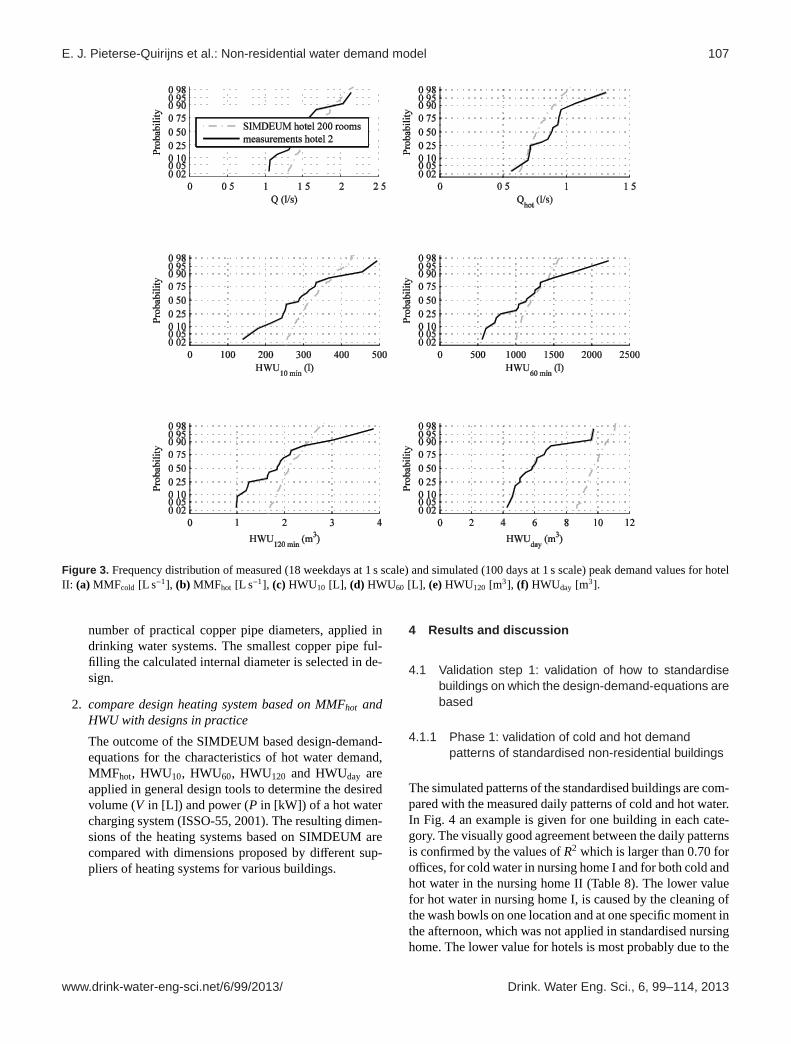
MMF and HWU represent the 99.7-percentile. For ho-tels, the measured peak demand values do not follow anormal distribution due to the highly variable occupa-tion (Fig. 3). The figure shows that the highest values ofthe peak demand fall in the last 10 % of the measuredpeak demand values. In this region of the frequencydistribution plot fall the water demand values of dayswith full occupation. The maximum value of the param-eters (MMF and HWU) do not always coincide with thedays with full occupation nor do they occur on the sameday, e.g. MMFcold and HWU10 take place at differentdays and even on days with low occupation. Therefore,the outcomes of the design-demand-equations are com-pared with the maximum value of each peak demandcharacteristic and with the average of the measured peakdemand on the days with full occupation.
3.4 Methodology to investigate the consequences fordesign of distribution systems and heating system
The consequences of the new SIMDEUM based design-demand-equations are investigated by comparing the designsof the distribution systems and the heating system with de-signs in practice:
1. compare design distribution system based on MMF withdesigns in practice
The design of distribution systems is based on MMF,obtained with a time step of 1 s. The maximum veloc-ity (vmax) of flowing water in pipes, determines the se-lected diameter. The internal diameter of pipes is relatedto MMF (in [L s−1]) andvmax by:
din =
√MMF/10000.25· π · vmax
·1000[mm] (2)
wherevmax is the maximal allowed design velocity setat 2 m s−1, din is the internal pipe diameter in mm. Thecalculated internal diameter is compared with a limited
Drink. Water Eng. Sci., 6, 99–114, 2013 www.drink-water-eng-sci.net/6/99/2013/
E. J. Pieterse-Quirijns et al.: Non-residential water demand model 107
34
1
Figure 3. Frequency distribution of measured (18 weekdays at 1 sec. scale) and simulated 2
(100 days at 1 sec. scale) peak demand values for hotel II: a) MMFcold [l/s], b) MMFhot [l/s], c) 3
Figure 3. Frequency distribution of measured (18 weekdays at 1 s scale) and simulated (100 days at 1 s scale) peak demand values for hotelII: (a) MMFcold [L s−1], (b) MMFhot [L s−1], (c) HWU10 [L], (d) HWU60 [L], (e)HWU120 [m3], (f) HWUday [m3].
number of practical copper pipe diameters, applied indrinking water systems. The smallest copper pipe ful-filling the calculated internal diameter is selected in de-sign.
2. compare design heating system based on MMFhot andHWU with designs in practice
The outcome of the SIMDEUM based design-demand-equations for the characteristics of hot water demand,MMFhot, HWU10, HWU60, HWU120 and HWUday areapplied in general design tools to determine the desiredvolume (V in [L]) and power (P in [kW]) of a hot watercharging system (ISSO-55, 2001). The resulting dimen-sions of the heating systems based on SIMDEUM arecompared with dimensions proposed by different sup-pliers of heating systems for various buildings.
4 Results and discussion
4.1 Validation step 1: validation of how to standardisebuildings on which the design-demand-equations arebased
4.1.1 Phase 1: validation of cold and hot demandpatterns of standardised non-residential buildings
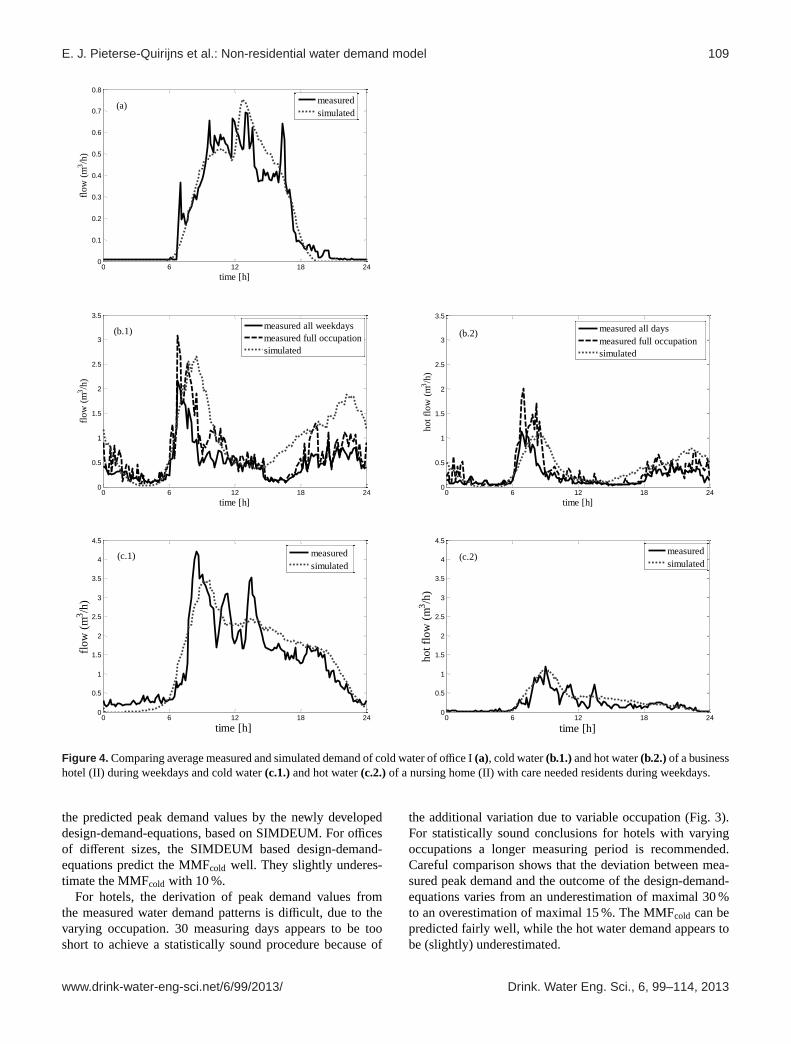
The simulated patterns of the standardised buildings are com-pared with the measured daily patterns of cold and hot water.In Fig. 4 an example is given for one building in each cate-gory. The visually good agreement between the daily patternsis confirmed by the values ofR2 which is larger than 0.70 foroffices, for cold water in nursing home I and for both cold andhot water in the nursing home II (Table 8). The lower valuefor hot water in nursing home I, is caused by the cleaning ofthe wash bowls on one location and at one specific moment inthe afternoon, which was not applied in standardised nursinghome. The lower value for hotels is most probably due to the
www.drink-water-eng-sci.net/6/99/2013/ Drink. Water Eng. Sci., 6, 99–114, 2013
108 E. J. Pieterse-Quirijns et al.: Non-residential water demand model
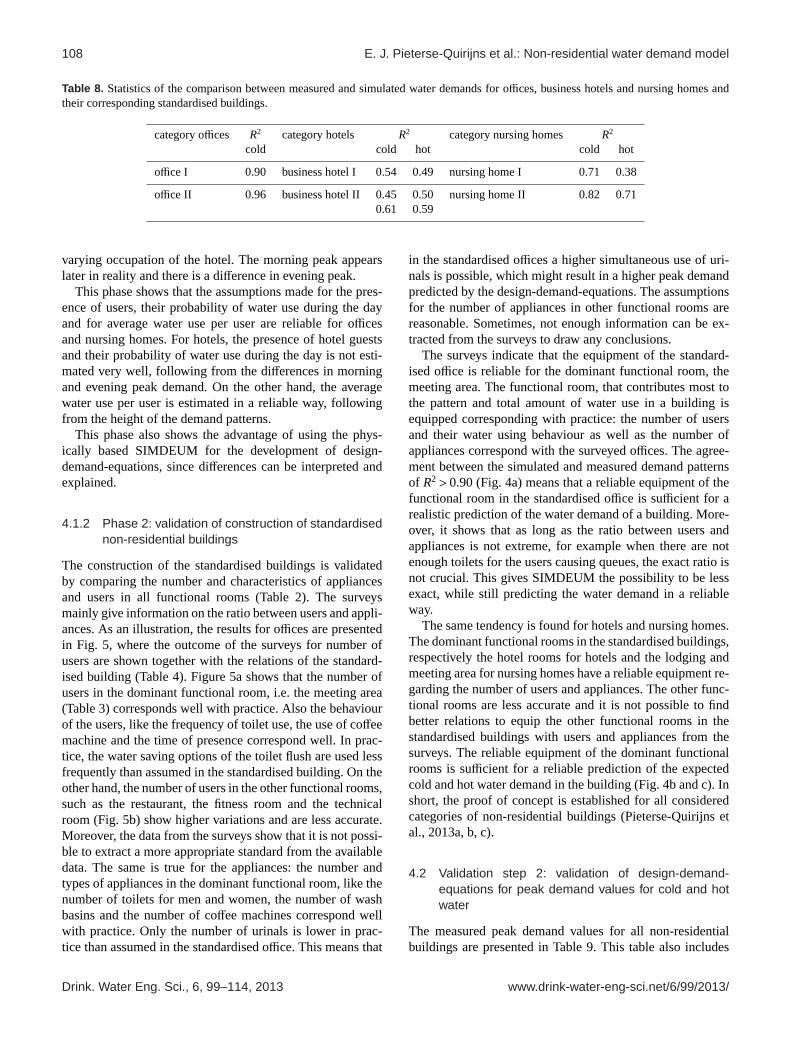
Table 8. Statistics of the comparison between measured and simulated water demands for offices, business hotels and nursing homes andtheir corresponding standardised buildings.
category offices R2 category hotels R2 category nursing homes R2
cold cold hot cold hot
office I 0.90 business hotel I 0.54 0.49 nursing home I 0.71 0.38
office II 0.96 business hotel II 0.45 0.50 nursing home II 0.82 0.710.61 0.59
varying occupation of the hotel. The morning peak appearslater in reality and there is a difference in evening peak.
This phase shows that the assumptions made for the pres-ence of users, their probability of water use during the dayand for average water use per user are reliable for officesand nursing homes. For hotels, the presence of hotel guestsand their probability of water use during the day is not esti-mated very well, following from the differences in morningand evening peak demand. On the other hand, the averagewater use per user is estimated in a reliable way, followingfrom the height of the demand patterns.
This phase also shows the advantage of using the phys-ically based SIMDEUM for the development of design-demand-equations, since differences can be interpreted andexplained.
4.1.2 Phase 2: validation of construction of standardisednon-residential buildings
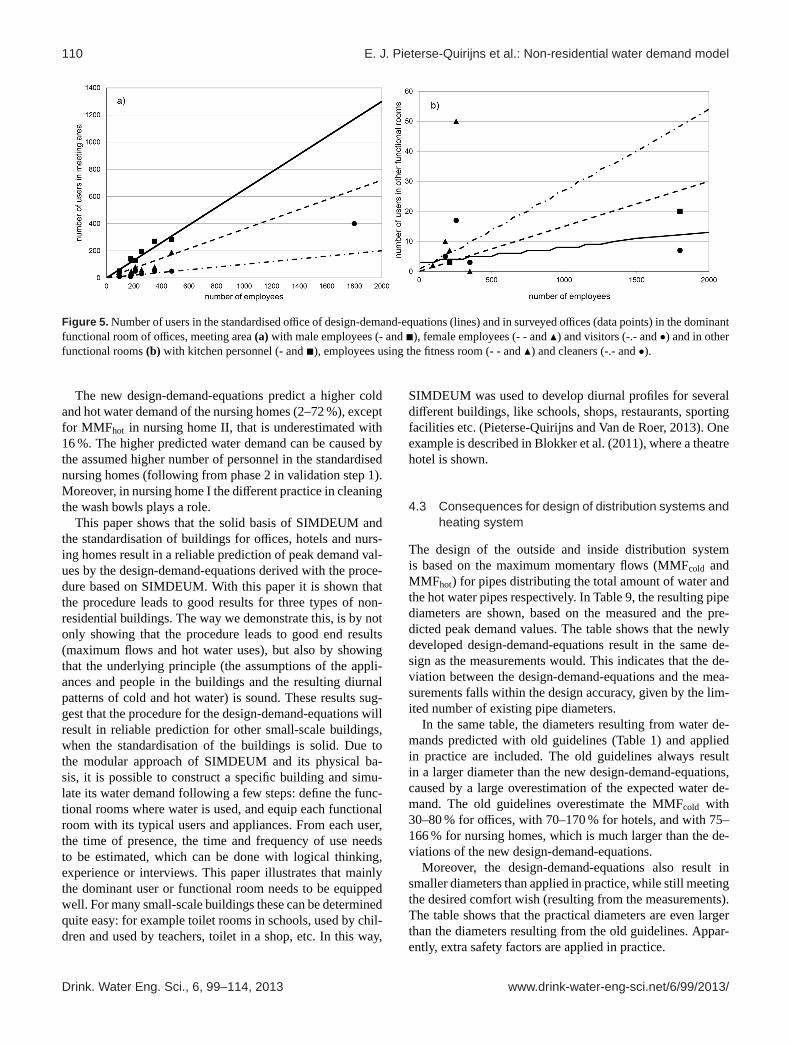
The construction of the standardised buildings is validatedby comparing the number and characteristics of appliancesand users in all functional rooms (Table 2). The surveysmainly give information on the ratio between users and appli-ances. As an illustration, the results for offices are presentedin Fig. 5, where the outcome of the surveys for number ofusers are shown together with the relations of the standard-ised building (Table 4). Figure 5a shows that the number ofusers in the dominant functional room, i.e. the meeting area(Table 3) corresponds well with practice. Also the behaviourof the users, like the frequency of toilet use, the use of coffeemachine and the time of presence correspond well. In prac-tice, the water saving options of the toilet flush are used lessfrequently than assumed in the standardised building. On theother hand, the number of users in the other functional rooms,such as the restaurant, the fitness room and the technicalroom (Fig. 5b) show higher variations and are less accurate.Moreover, the data from the surveys show that it is not possi-ble to extract a more appropriate standard from the availabledata. The same is true for the appliances: the number andtypes of appliances in the dominant functional room, like thenumber of toilets for men and women, the number of washbasins and the number of coffee machines correspond wellwith practice. Only the number of urinals is lower in prac-tice than assumed in the standardised office. This means that
in the standardised offices a higher simultaneous use of uri-nals is possible, which might result in a higher peak demandpredicted by the design-demand-equations. The assumptionsfor the number of appliances in other functional rooms arereasonable. Sometimes, not enough information can be ex-tracted from the surveys to draw any conclusions.
The surveys indicate that the equipment of the standard-ised office is reliable for the dominant functional room, themeeting area. The functional room, that contributes most tothe pattern and total amount of water use in a building isequipped corresponding with practice: the number of usersand their water using behaviour as well as the number ofappliances correspond with the surveyed offices. The agree-ment between the simulated and measured demand patternsof R2>0.90 (Fig. 4a) means that a reliable equipment of thefunctional room in the standardised office is sufficient for arealistic prediction of the water demand of a building. More-over, it shows that as long as the ratio between users andappliances is not extreme, for example when there are notenough toilets for the users causing queues, the exact ratio isnot crucial. This gives SIMDEUM the possibility to be lessexact, while still predicting the water demand in a reliableway.
The same tendency is found for hotels and nursing homes.The dominant functional rooms in the standardised buildings,respectively the hotel rooms for hotels and the lodging andmeeting area for nursing homes have a reliable equipment re-garding the number of users and appliances. The other func-tional rooms are less accurate and it is not possible to findbetter relations to equip the other functional rooms in thestandardised buildings with users and appliances from thesurveys. The reliable equipment of the dominant functionalrooms is sufficient for a reliable prediction of the expectedcold and hot water demand in the building (Fig. 4b and c). Inshort, the proof of concept is established for all consideredcategories of non-residential buildings (Pieterse-Quirijns etal., 2013a, b, c).
4.2 Validation step 2: validation of design-demand-equations for peak demand values for cold and hotwater
The measured peak demand values for all non-residentialbuildings are presented in Table 9. This table also includes
Drink. Water Eng. Sci., 6, 99–114, 2013 www.drink-water-eng-sci.net/6/99/2013/
E. J. Pieterse-Quirijns et al.: Non-residential water demand model 109
35
1
2
3
0 6 12 18 240
0.1
0.2
0.3
0.4
0.5
0.6
0.7
0.8
time [h]
flo
w (
m3/h
)
(a)measured
simulated
0 6 12 18 240
0.5
1
1.5
2
2.5
3
3.5
time [h]
flo
w (
m3/h
)
(b.1)measured all weekdays
measured full occupation
simulated
0 6 12 18 24
0
0.5
1
1.5
2
2.5
3
3.5
time [h]
ho
t fl
ow
(m
3/h
)
(b.2)measured all days
measured full occupation
simulated
0 6 12 18 240
0.5
1
1.5
2
2.5
3
3.5
4
4.5
time [h]
flow
(m
3/h
)
(c.1) measured
simulated
0 6 12 18 24
0
0.5
1
1.5
2
2.5
3
3.5
4
4.5
time [h]
hot
flow
(m
3/h
)
(c.2)measured
simulated
Figure 4. Comparing average measured and simulated demand of cold water of office I (a), cold
water (b.1.) and hot water (b.2.) of a business hotel (II) during weekdays and cold water (c.1.) and
hot water (c.2.) of a nursing home ( II) with care needed residents during weekdays.
Figure 4. Comparing average measured and simulated demand of cold water of office I(a), cold water(b.1.)and hot water(b.2.)of a businesshotel (II) during weekdays and cold water(c.1.)and hot water(c.2.)of a nursing home (II) with care needed residents during weekdays.
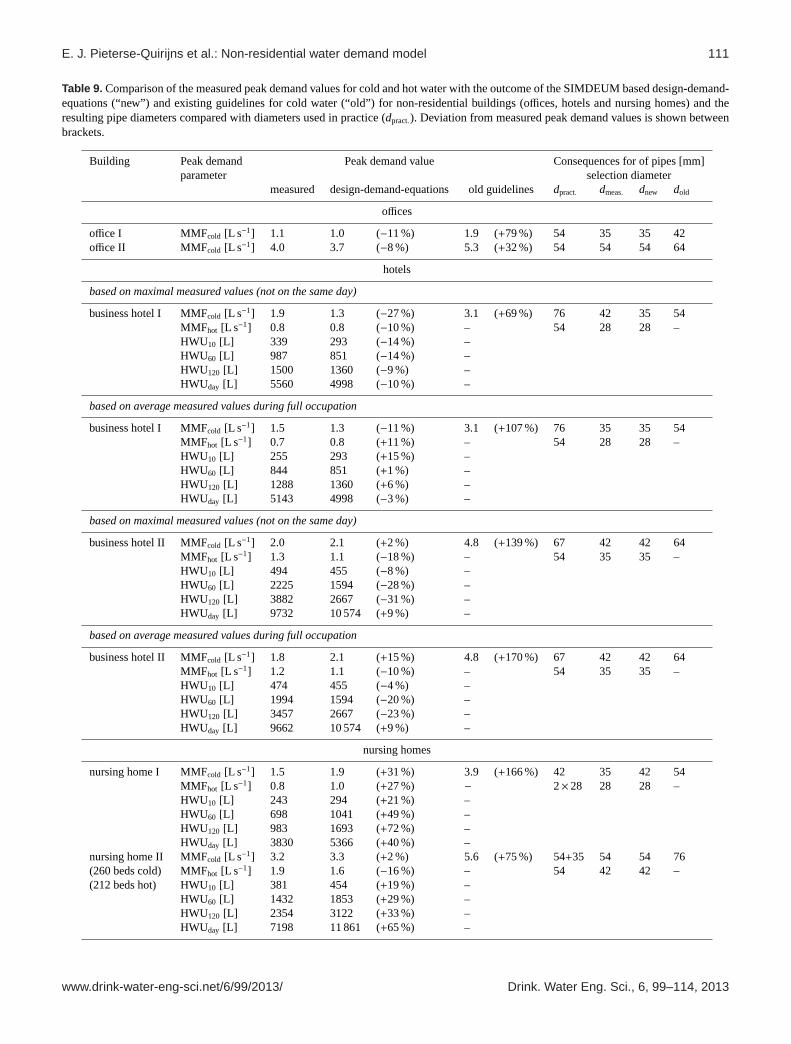
the predicted peak demand values by the newly developeddesign-demand-equations, based on SIMDEUM. For officesof different sizes, the SIMDEUM based design-demand-equations predict the MMFcold well. They slightly underes-timate the MMFcold with 10 %.
For hotels, the derivation of peak demand values fromthe measured water demand patterns is difficult, due to thevarying occupation. 30 measuring days appears to be tooshort to achieve a statistically sound procedure because of
the additional variation due to variable occupation (Fig. 3).For statistically sound conclusions for hotels with varyingoccupations a longer measuring period is recommended.Careful comparison shows that the deviation between mea-sured peak demand and the outcome of the design-demand-equations varies from an underestimation of maximal 30 %to an overestimation of maximal 15 %. The MMFcold can bepredicted fairly well, while the hot water demand appears tobe (slightly) underestimated.
www.drink-water-eng-sci.net/6/99/2013/ Drink. Water Eng. Sci., 6, 99–114, 2013
110 E. J. Pieterse-Quirijns et al.: Non-residential water demand model
Figure 5. Number of users in the standardised office of design-demand-equations (lines) and in surveyed offices (data points) in the dominantfunctional room of offices, meeting area(a) with male employees (- and�), female employees (- - andN) and visitors (-.- and•) and in otherfunctional rooms(b) with kitchen personnel (- and�), employees using the fitness room (- - andN) and cleaners (-.- and•).
The new design-demand-equations predict a higher coldand hot water demand of the nursing homes (2–72 %), exceptfor MMFhot in nursing home II, that is underestimated with16 %. The higher predicted water demand can be caused bythe assumed higher number of personnel in the standardisednursing homes (following from phase 2 in validation step 1).Moreover, in nursing home I the different practice in cleaningthe wash bowls plays a role.
This paper shows that the solid basis of SIMDEUM andthe standardisation of buildings for offices, hotels and nurs-ing homes result in a reliable prediction of peak demand val-ues by the design-demand-equations derived with the proce-dure based on SIMDEUM. With this paper it is shown thatthe procedure leads to good results for three types of non-residential buildings. The way we demonstrate this, is by notonly showing that the procedure leads to good end results(maximum flows and hot water uses), but also by showingthat the underlying principle (the assumptions of the appli-ances and people in the buildings and the resulting diurnalpatterns of cold and hot water) is sound. These results sug-gest that the procedure for the design-demand-equations willresult in reliable prediction for other small-scale buildings,when the standardisation of the buildings is solid. Due tothe modular approach of SIMDEUM and its physical ba-sis, it is possible to construct a specific building and simu-late its water demand following a few steps: define the func-tional rooms where water is used, and equip each functionalroom with its typical users and appliances. From each user,the time of presence, the time and frequency of use needsto be estimated, which can be done with logical thinking,experience or interviews. This paper illustrates that mainlythe dominant user or functional room needs to be equippedwell. For many small-scale buildings these can be determinedquite easy: for example toilet rooms in schools, used by chil-dren and used by teachers, toilet in a shop, etc. In this way,
SIMDEUM was used to develop diurnal profiles for severaldifferent buildings, like schools, shops, restaurants, sportingfacilities etc. (Pieterse-Quirijns and Van de Roer, 2013). Oneexample is described in Blokker et al. (2011), where a theatrehotel is shown.
4.3 Consequences for design of distribution systems andheating system
The design of the outside and inside distribution systemis based on the maximum momentary flows (MMFcold andMMFhot) for pipes distributing the total amount of water andthe hot water pipes respectively. In Table 9, the resulting pipediameters are shown, based on the measured and the pre-dicted peak demand values. The table shows that the newlydeveloped design-demand-equations result in the same de-sign as the measurements would. This indicates that the de-viation between the design-demand-equations and the mea-surements falls within the design accuracy, given by the lim-ited number of existing pipe diameters.
In the same table, the diameters resulting from water de-mands predicted with old guidelines (Table 1) and appliedin practice are included. The old guidelines always resultin a larger diameter than the new design-demand-equations,caused by a large overestimation of the expected water de-mand. The old guidelines overestimate the MMFcold with30–80 % for offices, with 70–170 % for hotels, and with 75–166 % for nursing homes, which is much larger than the de-viations of the new design-demand-equations.
Moreover, the design-demand-equations also result insmaller diameters than applied in practice, while still meetingthe desired comfort wish (resulting from the measurements).The table shows that the practical diameters are even largerthan the diameters resulting from the old guidelines. Appar-ently, extra safety factors are applied in practice.
Drink. Water Eng. Sci., 6, 99–114, 2013 www.drink-water-eng-sci.net/6/99/2013/
E. J. Pieterse-Quirijns et al.: Non-residential water demand model 111
Table 9. Comparison of the measured peak demand values for cold and hot water with the outcome of the SIMDEUM based design-demand-equations (“new”) and existing guidelines for cold water (“old”) for non-residential buildings (offices, hotels and nursing homes) and theresulting pipe diameters compared with diameters used in practice (dpract.). Deviation from measured peak demand values is shown betweenbrackets.
Building Peak demand Peak demand value Consequences for of pipes [mm]parameter selection diameter
measured design-demand-equations old guidelinesdpract. dmeas. dnew dold
www.drink-water-eng-sci.net/6/99/2013/ Drink. Water Eng. Sci., 6, 99–114, 2013
112 E. J. Pieterse-Quirijns et al.: Non-residential water demand model
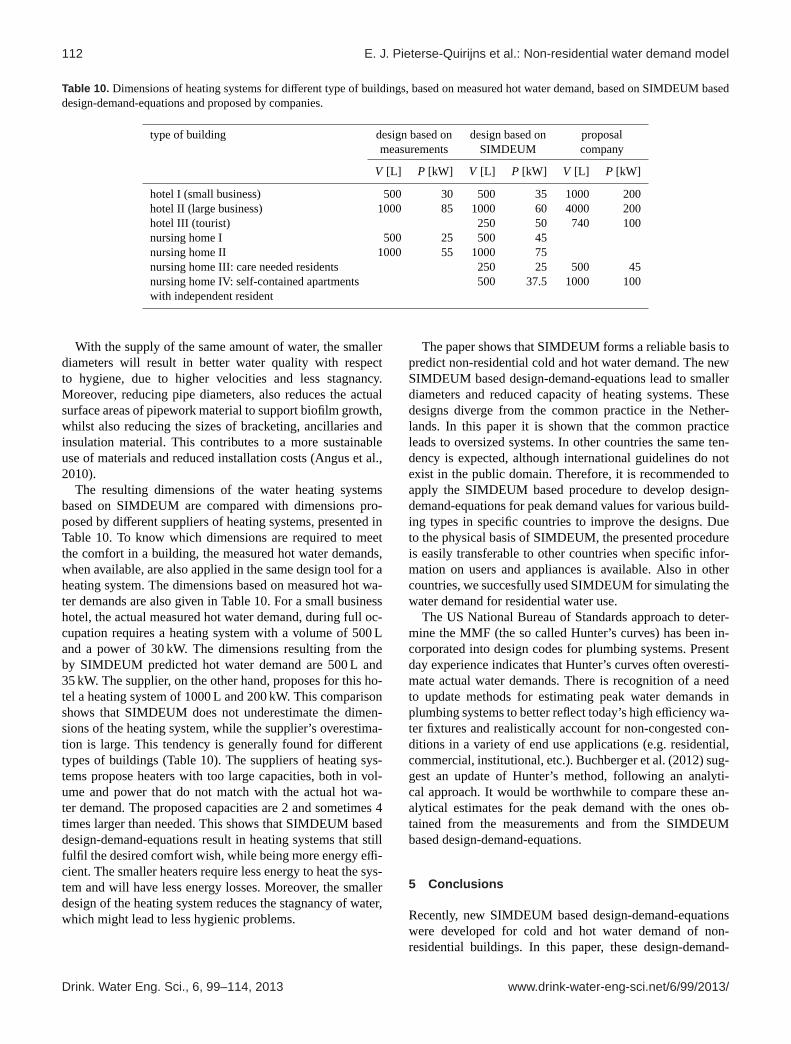
Table 10. Dimensions of heating systems for different type of buildings, based on measured hot water demand, based on SIMDEUM baseddesign-demand-equations and proposed by companies.
type of building design based on design based on proposalmeasurements SIMDEUM company
V [L] P [kW] V [L] P [kW] V [L] P [kW]
hotel I (small business) 500 30 500 35 1000 200hotel II (large business) 1000 85 1000 60 4000 200hotel III (tourist) 250 50 740 100nursing home I 500 25 500 45nursing home II 1000 55 1000 75nursing home III: care needed residents 250 25 500 45nursing home IV: self-contained apartments 500 37.5 1000 100with independent resident
With the supply of the same amount of water, the smallerdiameters will result in better water quality with respectto hygiene, due to higher velocities and less stagnancy.Moreover, reducing pipe diameters, also reduces the actualsurface areas of pipework material to support biofilm growth,whilst also reducing the sizes of bracketing, ancillaries andinsulation material. This contributes to a more sustainableuse of materials and reduced installation costs (Angus et al.,2010).
The resulting dimensions of the water heating systemsbased on SIMDEUM are compared with dimensions pro-posed by different suppliers of heating systems, presented inTable 10. To know which dimensions are required to meetthe comfort in a building, the measured hot water demands,when available, are also applied in the same design tool for aheating system. The dimensions based on measured hot wa-ter demands are also given in Table 10. For a small businesshotel, the actual measured hot water demand, during full oc-cupation requires a heating system with a volume of 500 Land a power of 30 kW. The dimensions resulting from theby SIMDEUM predicted hot water demand are 500 L and35 kW. The supplier, on the other hand, proposes for this ho-tel a heating system of 1000 L and 200 kW. This comparisonshows that SIMDEUM does not underestimate the dimen-sions of the heating system, while the supplier’s overestima-tion is large. This tendency is generally found for differenttypes of buildings (Table 10). The suppliers of heating sys-tems propose heaters with too large capacities, both in vol-ume and power that do not match with the actual hot wa-ter demand. The proposed capacities are 2 and sometimes 4times larger than needed. This shows that SIMDEUM baseddesign-demand-equations result in heating systems that stillfulfil the desired comfort wish, while being more energy effi-cient. The smaller heaters require less energy to heat the sys-tem and will have less energy losses. Moreover, the smallerdesign of the heating system reduces the stagnancy of water,which might lead to less hygienic problems.
The paper shows that SIMDEUM forms a reliable basis topredict non-residential cold and hot water demand. The newSIMDEUM based design-demand-equations lead to smallerdiameters and reduced capacity of heating systems. Thesedesigns diverge from the common practice in the Nether-lands. In this paper it is shown that the common practiceleads to oversized systems. In other countries the same ten-dency is expected, although international guidelines do notexist in the public domain. Therefore, it is recommended toapply the SIMDEUM based procedure to develop design-demand-equations for peak demand values for various build-ing types in specific countries to improve the designs. Dueto the physical basis of SIMDEUM, the presented procedureis easily transferable to other countries when specific infor-mation on users and appliances is available. Also in othercountries, we succesfully used SIMDEUM for simulating thewater demand for residential water use.
The US National Bureau of Standards approach to deter-mine the MMF (the so called Hunter’s curves) has been in-corporated into design codes for plumbing systems. Presentday experience indicates that Hunter’s curves often overesti-mate actual water demands. There is recognition of a needto update methods for estimating peak water demands inplumbing systems to better reflect today’s high efficiency wa-ter fixtures and realistically account for non-congested con-ditions in a variety of end use applications (e.g. residential,commercial, institutional, etc.). Buchberger et al. (2012) sug-gest an update of Hunter’s method, following an analyti-cal approach. It would be worthwhile to compare these an-alytical estimates for the peak demand with the ones ob-tained from the measurements and from the SIMDEUMbased design-demand-equations.
5 Conclusions
Recently, new SIMDEUM based design-demand-equationswere developed for cold and hot water demand of non-residential buildings. In this paper, these design-demand-
Drink. Water Eng. Sci., 6, 99–114, 2013 www.drink-water-eng-sci.net/6/99/2013/
E. J. Pieterse-Quirijns et al.: Non-residential water demand model 113
equations are validated with measurements of both cold andhot water on a per second basis for different buildings andwith surveys.
Firstly, the assumptions of building standardisation, onwhich the design-demand-equations are based, were vali-dated with surveys and measurements of both cold and hotwater on a per second basis for six different non-residentialbuildings, offices, hotels and nursing homes. The validationshows that the model predicts the cold and hot water dailydemand patterns reasonably well to good. The correlation ofthe simulated patterns with the measured patterns indicatesthat the basis of the design-demand-equations is solid.
Moreover, the construction of standardised buildings withusers and appliances is validated with at least four sur-veys per category of non-residential buildings. The valida-tion proves that with a proper estimation of the number ofusers and appliances in only the dominant functional roomof the standardised buildings, SIMDEUM renders a realisticcold and hot water diurnal demand pattern.
With the correspondence between standardised buildingsand reality, in both diurnal water demand patterns and con-struction of the building, the solid base of SIMDEUM baseddesign-demand-equations is proven by the proof of concept,i.e. when the construction is reliable, the prediction of theexpected cold and hot water demand in the building will bereliable.
Secondly, the outcome of the design-demand-equationsis validated. The validation shows that the design-demand-equations predict the cold and hot water demand peak valuesreasonable to good. The deviation of the predicted demandvalues from the measured ones is mostly less than 15 %.Sometimes a higher deviation is found, but less than 30 %.Only the deviation of the predicted hot water demand of nurs-ing homes is higher, caused by a higher assumed numberof personnel or another cleaning practice. These deviationsare much smaller than the deviations of existing guidelinesfor MMFcold which overestimate by 30–170 %. Moreover,the new design-demand-equations give insight into hot wa-ter use, where no existing public guidelines are available.
The new design-demand-equations improve the designof the building installation, expressed as the selected pipediameters, and of the heating system. First of all, thedesign-demand-equations lead to the same pipe diameterand the same heating system as based on the measured peakvalues. This means that the design based on the new rules isreliable. Secondly, the selected pipe diameters are smallerthan the ones used in practice and the ones predicted by theexisting guidelines. This indicates that the common practiceleads to oversized systems, with corresponding potentialquality problems. Also the heater capacity can be reducedbased on the outcome of the design-demand-equations.SIMDEUM based design-demand-equations reduce thedesign of a heater capacity with a factor 2 to 4 comparedto suppliers proposals, while still meeting the desired needand comfort. Thus, the improved insight of the new design-demand-equations will lead to an energy efficient choice of
the hot water systems, and thus save energy. Moreover, thesmaller design of the heating system reduces the possibilityof stagnant water, that might reduce the chance on hygienicproblems.
Edited by: R. Farmani
References
Angus, P., Ingle, S., King, D., and Turner, J.: The effects of usingwater velocity as a technique to control biofilm development inwater supply systems, Water Supply and Drainage for Buildings,CIB W062, Sydney, Australia, 8–10 November, 106–124, 2010.
Baggelaar, P. K. and Geudens, P. J. J. G.: Prognose landelijkedrinkwatervraag t/m 2005, Vewin, Rijswijk, The Netherlands,2008.
Barberán, R., Egea, P., Gracia-de-Rentería, P., and Salvador, M.:Evaluation of water saving measures in hotels: a Spanish casestudy, Int. J. Hosp. Manag., 34, 181–191, 2013.
Blokker, E. J. M. and Van der Schee, W.: Simulation of water de-mands provides insight, Water Supply and Drainage for Build-ings, CIB W062, Taipee, Taiwan, 18–20 September, 2006.
Blokker, E. J. M., Vreeburg, J. H. G., and Van Dijk, J. C.: Simulat-ing residential water demand with a stochastic end-use model, J.Water Res. Pl.-ASCE, 136, 19–26, 2010.
Blokker, E. J. M., Pieterse-Quirijns, E. J., Vreeburg, J. H. G., andvan Dijk, J. C.: Simulating non-residential water demand witha stochastic end-use model, J. Water Res. Pl.-ASCE, 137, 511–520, 2011.
Buchberger, S. G., Blokker, E. J. M., and Cole, D.: Estimating peakwater demands in hydraulic systems I – current practice, WaterDistribution System Analysis, WDSA 2012, Adelaide, Australia,24–27 September 2012.
Cobacho, R., Arregui, F., Parra, J. C., and Cabrera Jr., E.: Improvingefficiency in water use and conservation in Spanish hotels, WaterSci. Technol., 5, 273–279, 2005.
Ilemobade, A. A., Van Zyl, J. E., and Van Zyl, H. J.: New guide-lines for non-domestic water estimation in South Africa, in: Inte-grating Water Systems CCWI 2009, CRC Press/Balkema Leiden,Sheffield, UK, 543–549, 2010.
ISSO-55: ISSO – publicatie 55; Tapwaterinstallaties voor woon – enutiliteitsgebouwen, Stichting ISSO, Rotterdam, The Netherlands,2001.
Loureiro, D., Coelho, S. T., Rebelo, M., Ramalho, P., Ale-gre, H., Covas, D. I. C., and Pina, A.: Correlating waterconsumption behaviour with billing, infrastructure and socio-demographic factors, in: Integrating Water Systems CCWI 2009,CRC Press/Balkema Leiden, Sheffield, UK, 105–111, 2010.
Pieterse-Quirijns, E. J. and Van de Roer, M.: Verbruikspatronenbib-liotheek, KWR, Nieuwegein, The Netherlands, 2013.
Pieterse-Quirijns, E. J., Blokker, E. J. M., and Vogelaar, A. J.:Modelleren van niet-huishoudelijk waterverbruik; waterverbruikvan kantoren, hotels, zorginstellingen en veehouderij, KWR,Nieuwegein, The Netherlands, 2009.
Pieterse-Quirijns, E. J., Blokker, E. J. M., Van der Blom, E.,and Vreeburg, J. H. G.: Modelling characteristic values fornon-residential water use, Water Distribution System Analysis,WDSA 2010, Tuscon, AZ, USA, 12–15 September, 2010.
www.drink-water-eng-sci.net/6/99/2013/ Drink. Water Eng. Sci., 6, 99–114, 2013
114 E. J. Pieterse-Quirijns et al.: Non-residential water demand model
Pieterse-Quirijns, E. J., Beverloo, H., and Van Loon, A.: Validatierekenregels voor waterverbruik hotels, KWR, Nieuwegein, TheNetherlands, 2013a.
Pieterse-Quirijns, E. J., Beverloo, H., and Van Loon, A.: Validatierekenregels voor waterverbruik kantoren, KWR, Nieuwegein,The Netherlands, 2013b.
Pieterse-Quirijns, E. J., Beverloo, H., Van Loon, A., and Kwakkel,M.: Validatie rekenregels voor waterverbruik zorginstellingen,KWR, Nieuwegein, The Netherlands, 2013c.
Rankin, R. and Rousseau, P. G.: Sanitary hot water consumptionpatterns in commercial and industrial sectors in South Africa:impact on heating system design, Energ. Convers. Manage., 47,687–701, 2006.
Scheffer, W. J. H.: Het ontwerpen van sanitaire installaties, Missetuitgeverij bv, Arnhem, The Netherlands, 1994.
Van der Kooij, D., Veenendaal, H. R., and Scheffer, W. J. H.: Biofilmformation and multiplication ofLegionellain a model warm wa-ter system with pipes of copper, stainless steel and cross-linkedpolyethylene, Water Res., 39, 2789–2798, 2005.
Vreeburg, J. H. G.: Discolouration in drinking water systems: Apractical approach, Ph.D. thesis, Delft University of Technology,Delft, The Netherlands, 2007.
Werkgroep momentane waterverbruiken: maximum momentanewaterverbruiken, Kiwa N.V., Nieuwegein. mededeling nr. 93,1985.
Drink. Water Eng. Sci., 6, 99–114, 2013 www.drink-water-eng-sci.net/6/99/2013/