THE STEM REQUIREMENTS OF “NON-STEM” JOBS: EVIDENCE FROM UK ONLINE VACANCY POSTINGS AND IMPLICATIONS FOR SKILLS & KNOWLEDGE SHORTAGES INNA GRINIS* Abstract. Do employers in “non-STEM” occupations (e.g. Graphic Designers, Economists ) seek to hire STEM (Science, Technology, Engineering, and Mathematics) graduates with a higher probability than non-STEM ones for knowledge and skills that they have acquired through their STEM education (e.g. “Microsoft C#”, “Systems Engineering” ) and not sim- ply for their problem solving and analytical abilities? This is an important question in the UK where less than half of STEM graduates work in STEM occupations and where this apparent leakage from the “STEM pipeline” is often considered as a wastage of resources. To address it, this paper goes beyond the discrete divide of occupations into STEM vs. non- STEM and measures STEM requirements at the level of jobs by examining the universe of UK online vacancy postings between 2012 and 2016. We design and evaluate machine learn- ing algorithms that classify thousands of keywords collected from job adverts and millions of vacancies into STEM and non-STEM. 35% of all STEM jobs belong to non-STEM occupa- tions and 15% of all postings in non-STEM occupations are STEM. Moreover, STEM jobs are associated with higher wages within both STEM and non-STEM occupations, even af- ter controlling for detailed occupations, education, experience requirements, employers, etc. Although our results indicate that the STEM pipeline breakdown may be less problematic than typically thought, we also find that many of the STEM requirements of “non-STEM” jobs could be acquired with STEM training that is less advanced than a full time STEM education. Hence, a more efficient way of satisfying the STEM demand in non-STEM oc- cupations could be to teach more STEM in non-STEM disciplines. We develop a simple abstract framework to show how this education policy could help reduce STEM shortages in both STEM and non-STEM occupations. Keywords: STEM Education, Skills Shortages, Machine Learning Date : First version: June 2016. This version: January 2017. *Department of Economics, CEP and SRC, London School of Economics. Email: [email protected]. I am very grateful to Burning Glass Technologies (BGT), especially Hal Bonella, Julia Schreiber and Bledi Taska, for giving me access to the BGT data, and to John Van Reenen, Roland Grinis and participants of the 1st IZA Workshop on the Economics of Education, the 8th Oxford Education Research Symposium, the Systemic Risk Centre research meetings and the LSE Labour work-in-progress seminars for interesting and helpful discussions, comments, and suggestions. This work is part of my Ph.D. research, kindly funded by the Economic and Social Research Council. All errors are mine. 1
Transcript
THE STEM REQUIREMENTS OF “NON-STEM” JOBS:EVIDENCE FROM UK ONLINE VACANCY POSTINGS
AND IMPLICATIONS FOR SKILLS & KNOWLEDGE SHORTAGES
INNA GRINIS*
Abstract. Do employers in “non-STEM” occupations (e.g. Graphic Designers, Economists)
seek to hire STEM (Science, Technology, Engineering, and Mathematics) graduates with a
higher probability than non-STEM ones for knowledge and skills that they have acquired
through their STEM education (e.g. “Microsoft C#”, “Systems Engineering”) and not sim-
ply for their problem solving and analytical abilities? This is an important question in the
UK where less than half of STEM graduates work in STEM occupations and where this
apparent leakage from the “STEM pipeline” is often considered as a wastage of resources.
To address it, this paper goes beyond the discrete divide of occupations into STEM vs. non-
STEM and measures STEM requirements at the level of jobs by examining the universe of
UK online vacancy postings between 2012 and 2016. We design and evaluate machine learn-
ing algorithms that classify thousands of keywords collected from job adverts and millions of
vacancies into STEM and non-STEM. 35% of all STEM jobs belong to non-STEM occupa-
tions and 15% of all postings in non-STEM occupations are STEM. Moreover, STEM jobs
are associated with higher wages within both STEM and non-STEM occupations, even af-
ter controlling for detailed occupations, education, experience requirements, employers, etc.
Although our results indicate that the STEM pipeline breakdown may be less problematic
than typically thought, we also find that many of the STEM requirements of “non-STEM”
jobs could be acquired with STEM training that is less advanced than a full time STEM
education. Hence, a more efficient way of satisfying the STEM demand in non-STEM oc-
cupations could be to teach more STEM in non-STEM disciplines. We develop a simple
abstract framework to show how this education policy could help reduce STEM shortages in
Date: First version: June 2016. This version: January 2017.*Department of Economics, CEP and SRC, London School of Economics. Email: [email protected] am very grateful to Burning Glass Technologies (BGT), especially Hal Bonella, Julia Schreiber and BlediTaska, for giving me access to the BGT data, and to John Van Reenen, Roland Grinis and participants ofthe 1st IZA Workshop on the Economics of Education, the 8th Oxford Education Research Symposium, theSystemic Risk Centre research meetings and the LSE Labour work-in-progress seminars for interesting andhelpful discussions, comments, and suggestions. This work is part of my Ph.D. research, kindly funded bythe Economic and Social Research Council. All errors are mine.
To what extent do recruiters in non-STEM occupations (e.g. Graphic Designers, Artists,
Economists) require and value knowledge and skills that, within the UK education system,
are typically acquired in STEM (Science, Technology, Engineering, and Mathematics) disci-
plines?
Addressing this question is important because in the UK less than half of STEM graduates
work in STEM occupations.1 This apparent leakage from the “STEM pipeline” is often
considered as problematic since STEM education is more expensive and difficult to acquire
than non-STEM one.2 Hence, if recruiters in non-STEM occupations do not really require
and value STEM knowledge and skills and simply like hiring STEM graduates for their
“foundation competencies” (Bosworth et al. [9]), “logical approach to solving problems”
(BIS [42]) or just because they believe that STEM graduates are more capable than their
non-STEM fellows, the UK may be wasting a lot of money and efforts.
Another possibility, however, is that the discrete divide of occupations into STEM vs.
non-STEM is imperfect and does not capture the changing nature of the UK economy, hit by
trends like digitization, the arrival of Big Data, etc. which transform business operations and
infiltrate STEM requirements throughout the economy and, in particular, outside positions
that are typically considered as STEM.3
Indeed, “STEM occupations” are a relatively arbitrary construct. They are identified using
judgment (Mason [41], BIS [42], BIS [8], Greenwood et al. [30], DIUS [17], Chevalier [14]),
data-driven approaches (Bosworth et al. [9], Rothwell [45]), or a combination of both (UKCES
[23]). Most studies recognize that “the issue of precisely where to draw the line between
STEM and non-STEM never goes away” (Bosworth et al. [9]), that “neither Standard
1This finding is robust to different ways of defining STEM occupations and STEM disciplines, e.g. Chevalier[14] examines the LDLHE and finds that 36% of scientific graduates work in scientific occupations six monthsafter graduation. The proportion is 46% three and a half years after graduation. Bosworth et al. [9] findthat core STEM occupations employ only 40% of core STEM degree holders.2Most STEM subjects fall into price categories A to C and therefore receive more funding from the HigherEducation Funding Council For England (HEFCE) than the majority of non-STEM subjects which belongto price group D (HEFCE [18]).3For example, see Brynjolfsson & McAfee [12] for a review of how Big Data is transforming managementpractices.
THE STEM REQUIREMENTS OF “NON-STEM” JOBS 3
Occupational Classification (SOC) system codes nor Standard Industrial Classification (SIC)
codes are particularly valuable to [classify STEM employment]” (BIS [42]), and that “STEM
degree holders working in a non-STEM occupation may still be using their STEM skills”
(Bosworth. et al. [9]).4
The only way to shed more light on this important issue is to go beyond occupations and
measure STEM requirements at the level of jobs. We shall attempt this by examining the
universe of UK online vacancy postings. Our data comes from Burning Glass Technologies
(BGT), a labour market analytics company that collects, deduplicates and processes informa-
tion on all UK online vacancies posted on employer websites, major job boards, government
databases, etc. Where available, BGT collects job titles, occupation, industry and employer
identifiers, education, experience and discipline requirements, wages, geographical locations
... and, most importantly, transforms the job description texts into sets of keywords, e.g:
“SAS - Writing - Data Collection - Econometrics - Project Design - Team Building - SQL - R”
Our goal is to identify STEM jobs as those “involving activities that can only be satisfac-
torily carried out by individuals with STEM skills” (Bosworth et al. [9]). A straightforward
approach would therefore consist in classifying as STEM those vacancy postings that explic-
itly require applicants to possess a STEM degree/qualification. However, unfortunately, only
around 12% of all vacancy postings in our data contain any explicit discipline requirements.
This happens because most UK recruiters prefer to simply describe the open position and
the candidate that they are looking for directly, employing thousands of different keywords.
Hence, instead of relying on whether or not the posting contains an explicit STEM qualifi-
cation requirement, we start by identifying “STEM keywords” - skills and knowledge that are
4Mason [41] applies judgment to the list of SOC occupations to identify those in which “the application ofscientific, engineering and/or technological skills and knowledge is central to the job-holder’s work”. The listin Greenwood et al. [30] “was classified by a panel drawn from across the STE subjects and disciplines andconvened by The Royal Academy of Engineering”. BIS [42] rely on previous studies, their own judgment,preliminary discussions with key organisations and employer interviews to classify occupations into STEMCore, STEM related, STEM unrelated, and sectors into STEM Specialist, STEM Generalist and non-STEM.Bosworth et al. [9] use the Labour Force Survey to classify an occupation as STEM “if at least 15 percent of its workforce is a STEM degree holder and the occupation as a whole employs at least 0.5 per centof the STEM workforce.” However, the problem with using the percentage of STEM degree holders asan indicator for whether or not an occupation is STEM, is that STEM graduates may be attracted to anoccupation for reasons that are unrelated to employers’ demand for STEM knowledge & skills, e.g. highwages. Recognizing this, UKCES [23] complement the proportion of STEM graduates in an occupation witha combined index for numeracy and problem solving skills use based on indicators from the UK Skills andEmployment Survey. The “objective analysis” based on these two indicators outputs a list of 61 occupations.UKCES then refine this list using judgment. For instance, they remove health/medical occupations, teachingoccupations and aircraft pilots as irrelevant, while including other occupations that were not identified asSTEM in the objective analysis but “seem to be core STEM”, e.g. technicians. Rothwell [45] uses O*NETKnowledge scales.
THE STEM REQUIREMENTS OF “NON-STEM” JOBS 4
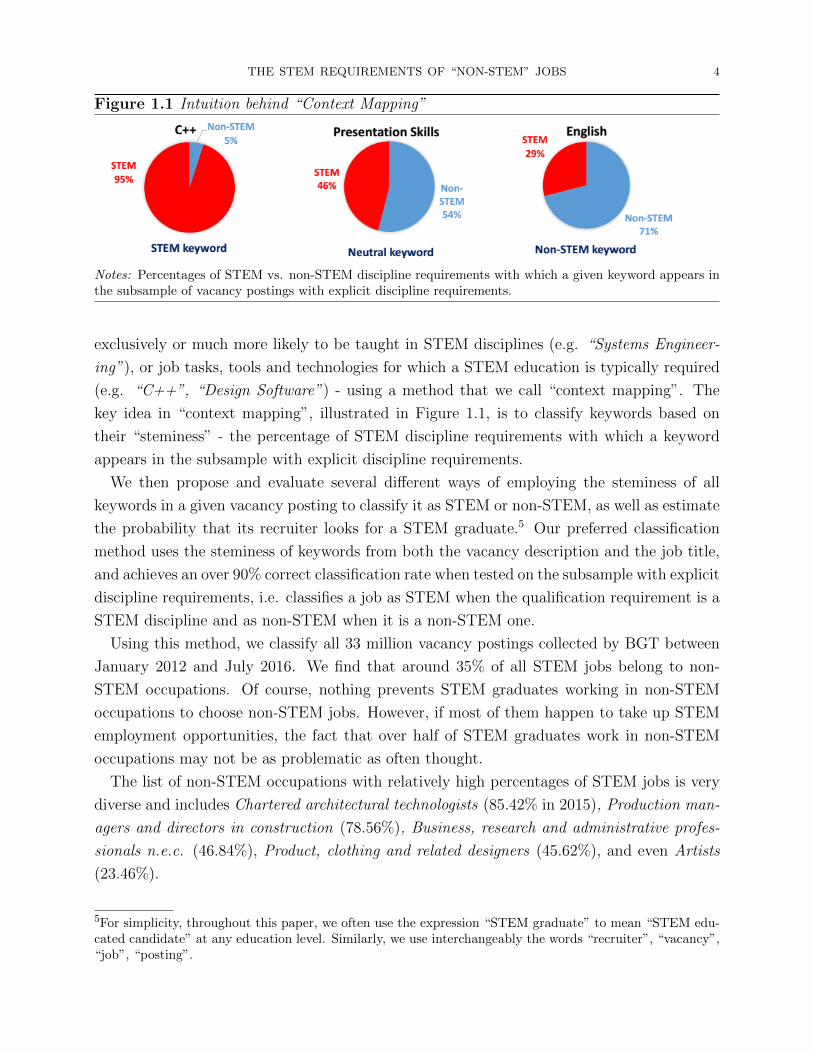
Figure 1.1 Intuition behind “Context Mapping”
Notes: Percentages of STEM vs. non-STEM discipline requirements with which a given keyword appears inthe subsample of vacancy postings with explicit discipline requirements.
exclusively or much more likely to be taught in STEM disciplines (e.g. “Systems Engineer-
ing”), or job tasks, tools and technologies for which a STEM education is typically required
(e.g. “C++”, “Design Software”) - using a method that we call “context mapping”. The
key idea in “context mapping”, illustrated in Figure 1.1, is to classify keywords based on
their “steminess” - the percentage of STEM discipline requirements with which a keyword
appears in the subsample with explicit discipline requirements.
We then propose and evaluate several different ways of employing the steminess of all
keywords in a given vacancy posting to classify it as STEM or non-STEM, as well as estimate
the probability that its recruiter looks for a STEM graduate.5 Our preferred classification
method uses the steminess of keywords from both the vacancy description and the job title,
and achieves an over 90% correct classification rate when tested on the subsample with explicit
discipline requirements, i.e. classifies a job as STEM when the qualification requirement is a
STEM discipline and as non-STEM when it is a non-STEM one.
Using this method, we classify all 33 million vacancy postings collected by BGT between
January 2012 and July 2016. We find that around 35% of all STEM jobs belong to non-
STEM occupations. Of course, nothing prevents STEM graduates working in non-STEM
occupations to choose non-STEM jobs. However, if most of them happen to take up STEM
employment opportunities, the fact that over half of STEM graduates work in non-STEM
occupations may not be as problematic as often thought.
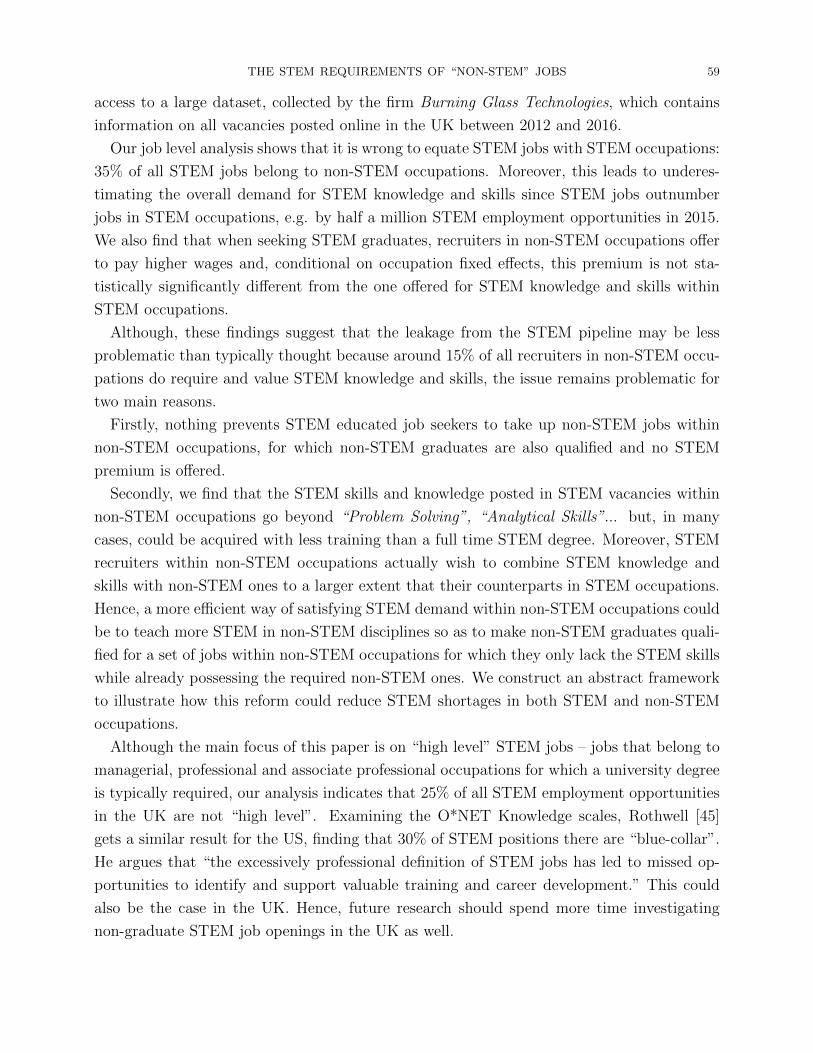
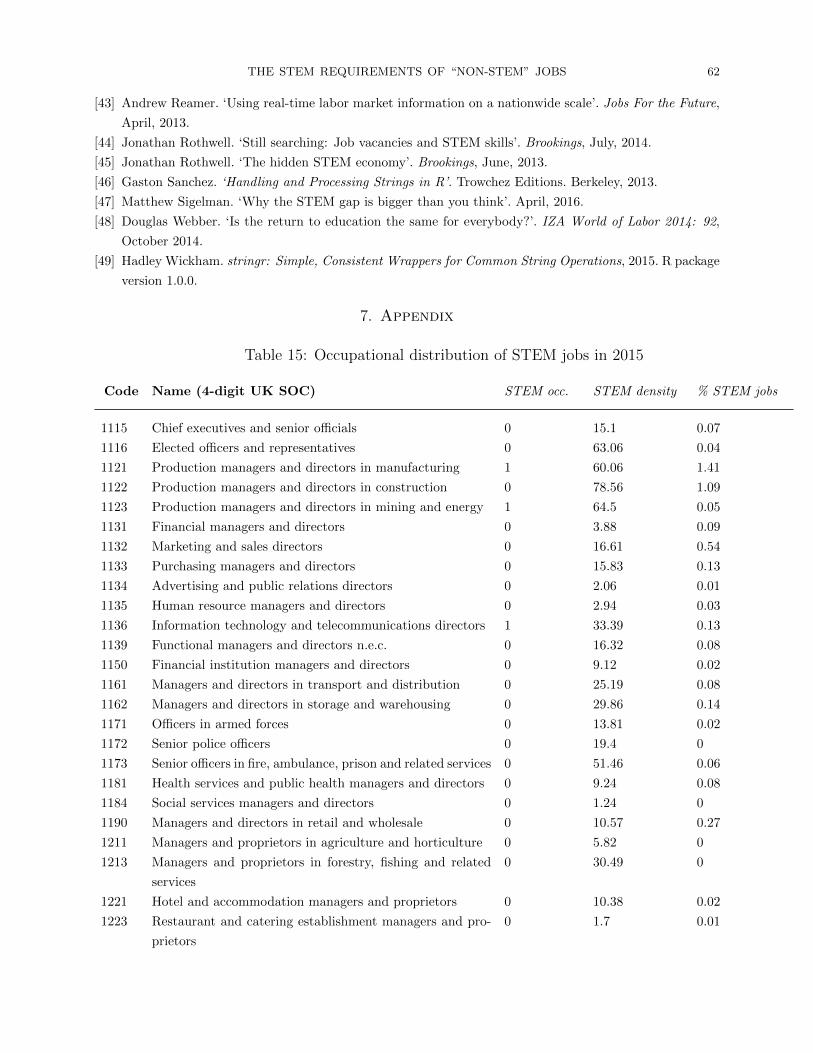
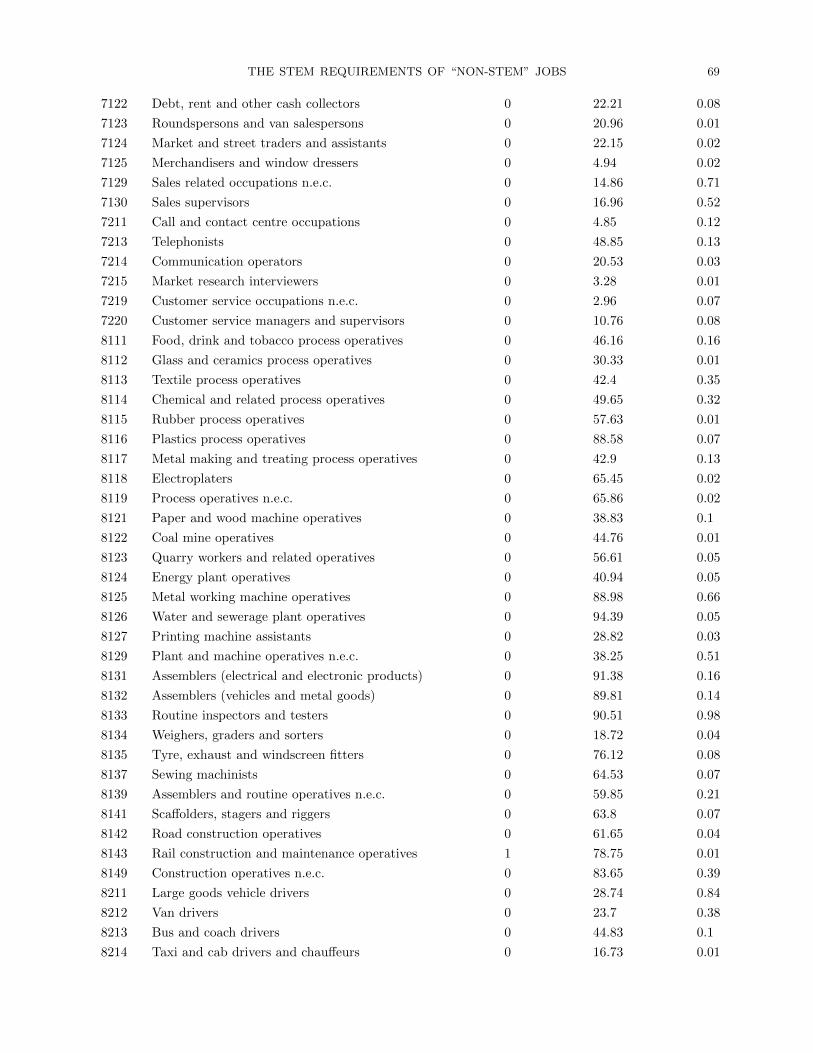
The list of non-STEM occupations with relatively high percentages of STEM jobs is very
diverse and includes Chartered architectural technologists (85.42% in 2015), Production man-
agers and directors in construction (78.56%), Business, research and administrative profes-
sionals n.e.c. (46.84%), Product, clothing and related designers (45.62%), and even Artists
(23.46%).
5For simplicity, throughout this paper, we often use the expression “STEM graduate” to mean “STEM edu-cated candidate” at any education level. Similarly, we use interchangeably the words “recruiter”, “vacancy”,“job”, “posting”.
THE STEM REQUIREMENTS OF “NON-STEM” JOBS 5
Perhaps surprisingly for the literature, where financial occupations are typically considered
as the main non-STEM group poaching STEM graduates, none of them is actually top of
the list in terms of the percentage of jobs classified as STEM. For instance, among the
seven occupations defined as financial in Chevalier [14], Management consultants and business
analysts was the one with the highest percentage of STEM jobs in 2015: 25.33%, followed by
Financial and accounting technicians with only 11.67%. The reason may be that, within the
UK education system, the “numerical skills” for which financial occupations are thought to
be seeking STEM graduates are actually also often transmitted to non-STEM graduates in,
e.g., Finance or Economics degrees. Hence, although numerous jobs in financial occupations
may end up being filled with STEM graduates, when posting their vacancy, few financial
recruiters describe the job as one that could only be undertaken by someone with a STEM
education.
As expected, most of the jobs within STEM occupations are identified as STEM (81% of
all), while, in non-STEM occupations, STEM jobs remain a minority - around 15% of all.
However, even these small percentages add up to a significant number of STEM employment
opportunities outside STEM occupations and ignoring them leads to underestimating the
overall demand for STEM knowledge and skills. For instance, in 2015, 2.66 million STEM
vacancies were advertised online, while the number of jobs posted in STEM occupations
was only 2.15 million. Hence, equating STEM jobs with STEM occupations would make us
underestimate STEM demand by around half a million vacancies.
An important argument often put forward to defend the view that the breakdown of the
STEM pipeline is problematic, is that STEM graduates receive a wage premium only if
they stay in STEM occupations, i.e. “STEM skills are not particularly valued in non-STEM
occupations” (Levy and Hopkins [38]). The evidence often mentioned is the DIUS report [17]
which finds that “science graduates who work in science occupations earn a wage premium
even allowing for other factors. [...] The remainder work in other occupations where they
may well be using the analytical skills acquired during their education; however, they do not
earn a higher wage in these occupations than equivalent people who studied other subjects”.6
In reality, the DIUS report uses the LDLHE and the Labour Force surveys and therefore
cannot distinguish between STEM and non-STEM jobs within non-STEM occupations. By
contrast, our approach allows us to make this distinction. Although our results are not di-
rectly comparable because we examine the wage premium for STEM from the labour demand
side and we do not claim causality and caution that our results could be biased because of
6A similar conclusion is reached by Chevalier [14] who also uses the LDLHE. Accounting for selection intoboth science degrees and science occupations, he finds that the returns to a science degree are small at 2%(and significant at 10% only) and are dominated by the returns to a scientific occupation at 18% (and highlysignificant). The findings in Greenwood et al. [30] are more nuanced. They analyse the Labour Force Surveybetween March 2004 and December 2010, and find that “degrees in STEM are valued by the labour marketanyway but particularly so in STE occupations.”
THE STEM REQUIREMENTS OF “NON-STEM” JOBS 6
some omitted unobserved heterogeneity akin to the “ability bias” on the labour supply side,
we find that STEM jobs are associated with higher wages both within STEM and non-STEM
occupations. The premium remains significant and large even after controlling for a full set
of four-digit occupations, education and experience requirements, counties, one/two digit
industries, employers, etc. Moreover, conditional on a full set of four-digit occupation fixed
effects, there is no statistically significant difference between the wage premium offered for
STEM knowledge and skills in STEM occupations and the one offered in non-STEM ones.
Note that our results do not necessarily contradict but rather extend previous evidence
because, within non-STEM occupations, nothing prevents STEM graduates to take up non-
STEM jobs, for which non-STEM graduates are also perfectly qualified and no premium is
offered. The distinction with previous studies is the finding that around 15% of recruiters in
non-STEM occupations do require STEM knowledge and skills and offer to pay a premium
when doing so.
Overall, our empirical results therefore suggest that the leakage from the STEM pipeline
may be less problematic than previously thought, because a significant proportion of jobs in
non-STEM occupations can only be satisfactorily fulfilled with people possessing a certain
level of STEM knowledge and skills, which, within the UK education system, is typically
acquired through a STEM education. Moreover, our findings suggest that STEM shortages
may exist not only in STEM occupations but also in non-STEM ones.
Nonetheless, the STEM pipeline breakdown remains problematic for two main reasons.
Firstly, as already mentioned, many STEM graduates working in non-STEM occupations
could still be taking up non-STEM jobs. More importantly, there could be more efficient ways
of satisfying the STEM demand in non-STEM occupations than training full-time STEM
graduates.
In fact, an interesting feature distinguishes STEM jobs in STEM occupations from their
counterparts in non-STEM ones: while 60% of all keywords in the median posting of a STEM
job in a STEM occupation are STEM, this number is only 30% for a STEM job in a non-
STEM occupation. This suggests that STEM recruiters in non-STEM occupations are in
reality looking for a certain combination of STEM and non-STEM knowledge and skills that
lies in between the STEM-dominated combination required in STEM occupations and the
predominantly non-STEM one asked for in non-STEM jobs.
A recent report by General Assembly & BGT [3] calls this type of jobs “hybrid” since
they “blend skills from disciplines which are typically found in disparate silos of higher
education.” They identify six “hybrid” job categories, e.g.: Marketing Automation, which
“blends marketing with information technology”, Product Managers who “draw from both
business / marketing and computer programming”, UI/UX Designers who “call on skill sets
from design, programming and even psychology or anthropology.”
THE STEM REQUIREMENTS OF “NON-STEM” JOBS 7
They also note that “while the market increasingly demands these skill cocktails, higher
education programs have been slower to package learning in such cross-disciplinary ways.”
Indeed, the reason why we identify these jobs as STEM occurs precisely because their re-
cruiters are still looking to hire STEM graduates with a higher probability than non-STEM
ones. This may happen because, within the UK education system, non-STEM graduates are
typically unqualified for such “hybrid” positions: even if they possess the required non-STEM
skills, they do not master the STEM ones, which may be more difficult and/or expensive for
the employer to train and are therefore a prerequisite.
However, digging further into the STEM requirements of “non-STEM” jobs (STEM jobs in
non-STEM occupations), we find many skills and knowledge that could certainly be acquired
through appropriate training that is less advanced than a full-time STEM degree - e.g.
learning how to code in, say, “C++” or “Python” does not necessitate a Bachelor in Computer
Sciences. This agrees with the General Assembly & BGT report which also emphasizes that
these new hybrid roles “are accessible with technical training less than a computer science
degree.”
Although increasing the number of people studying STEM disciplines is one of the most
popular solutions proposed to reduce STEM shortages (e.g. Rothwell [44]), our findings
suggest that a more efficient way of satisfying STEM demand within non-STEM occupations
may be to teach more STEM in non-STEM disciplines in order to make non-STEM graduates
qualified for a set of jobs within non-STEM occupations for which they only lack the STEM
skills while already possessing the required non-STEM ones. In Section 5, we construct
a simple abstract framework to illustrate how STEM shortages in STEM and non-STEM
occupations are related and why this reform could help alleviate both.
This paper inscribes itself in the literature that employs online vacancies’ data to investi-
gate labour market dynamics and/or inform education provision policies. Although this type
of data comes with important caveats that we discuss in more details below in Section 2, it
is highly valuable to both academics and policymakers because of its many advantages over
the more constrained and costly surveys which rely on random sampling and are typically
less detailed. Reamer [43], for example, gives an interesting overview of how real-time labour
market information could be used by different federal agencies and trade associations in the
US to better align education programs with current labor market demand. He also discusses
the pros and cons of such usage.
The BGT data itself has already been employed for a variety of internal and external
research projects.
THE STEM REQUIREMENTS OF “NON-STEM” JOBS 8
In the UK, BGT have partnered with the Institute for Public Policy Research (IPPR)
to create an online skills calculator that “compares entry-level employer demand and the
number of learners completing related programmes of study”.7
In the US, the paper most related to our work is Rothwell [44]. He uses a subset of the
BGT data for which the duration of the vacancy is known to show that STEM job openings
take longer to fill than non-STEM positions at all education levels. However, STEM jobs in
Rothwell’s paper are still identified at the occupation level. In particular, he uses O*NET
Knowledge scales, as explained in his other paper [45] that we discuss in some details in
Section 4. He does not seek to use the keywords from the vacancy descriptions to classify
the job postings as STEM or non-STEM directly. Instead, he defines the value of each BGT
keyword, called “skill”, as the average salary cited in the postings containing it. He finds
that more valuable skills are advertised for longer and that STEM positions tend to demand
more valuable skills.
Several academic papers employ US BGT data to investigate the “upskilling” phenomenon
over the business cycle. Ballance et al. [6] find that an increased availability of workers during
downturns leads employers to raise their education and experience requirements. However,
as the authors show in their next paper [5], the upskilling that happened during the Great
Recession has been reversed as the labour market improved from 2010-2014. By contrast,
Hershbein and Kahn [32] argue that Ballance et al. [5] “overstate the degree of downskilling
during the later recovery” and provide evidence that the Great Recession was a time of
“cleansing” during which many firms restructured their production in a manner consistent
with routine-biased technological change, therefore increasing skill requirements permanently.
Hershbein and Kahn [32] use the keywords part of the BGT data to define “computer”
and “cognitive” skill requirements. They designate an ad as requesting computer skills if
it contains the keyword “computer” or one of the keywords categorized as “software” by
BGT themselves (822 keywords in the UK taxonomy). They consider as “cognitive” skills all
BGT keywords that contain “research”, “analysis”, “decision” and “thinking”, e.g.: “Online
Research”, “Logit Analysis”, “Clinical Decision Support”, etc. In the UK BGT taxonomy,
which contains 11,182 distinct keywords overall, this amounts to 280 keywords. Hence, de
facto, Hershbein and Kahn [32] classify less than 10% of all keywords as either “computer” or
“cognitive” skill requirements ((280+822)/11182). The problem is that the unclassified 90%
contain many keywords, like “Algebra”, “Machine Learning”, “Natural Language Process-
ing”, “Graph-Based Algorithms”, etc. which actually correspond to cognitive skill require-
ments without containing the four specific words that Hershbein and Kahn [32] focus on, and
may also require computer skills without being included in the BGT software category. Also,
note that the latter actually includes not only standard software like “Microsoft Excel” or
7http://wheretheworkis.org/
THE STEM REQUIREMENTS OF “NON-STEM” JOBS 9
“MATLAB”, but also many keywords that are not “computer” skills per se, e.g.: “Flickr”,
“LinkedIn”, “Microsoft Live Meeting”. Although the authors argue that they “ensure that
the presence of these keywords correlates with external measures of cognitive skill at the
occupation level”, “many of [their] analyses exploit firm-level information”, and at this more
disaggregated level, such an incomplete classification of the BGT taxonomy could have tan-
gible consequences. Moreover, on UK data, their approach gives some surprising results even
at the occupation level with, e.g. 65.06% of Economists postings requiring cognitive skills in
2015, but only 44.39% of Mathematicians doing so.
Deming and Kahn [16] take a similar approach but go a bit further. This time the goal is to
relate variation in skill demands to firm performance and wage variation within occupations.
Although the authors argue that “the primary contribution of [their] paper is to distill and
analyze the key words and phrases coded from the open text of ads in the BG data”, in reality,
they “distill” less than 20% of the BGT taxonomy by selecting the keywords that contain
around 30 commonly occurring words and phrases, regrouped into 8 categories corresponding
to different types of skills, e.g: cognitive, social, character, writing, etc. They also define
computer and software skills based on the pre-existing BGT software category and the words
“computer” and “spreadsheets” (cf. Table 1 in [16]).
Neither Hershbein and Kahn [32], nor Deming and Kahn [16] show why the fact that they
work with such incomplete classifications of the BGT taxonomy does not affect their results.
In this paper, we also do not manage to classify all BGT keywords into STEM and non-
STEM. However, we classify 85.55% of them and the remaining unclassified keywords appear
very rarely in the postings so that, on average, 99.99% of all keywords collected from a vacancy
with at least one keyword are actually classified. We further implement out-of-sample tests
which recreate the situation of having a certain proportion of unclassified keywords to show
that the number of misclassifications introduced by not being able to classify the remaining
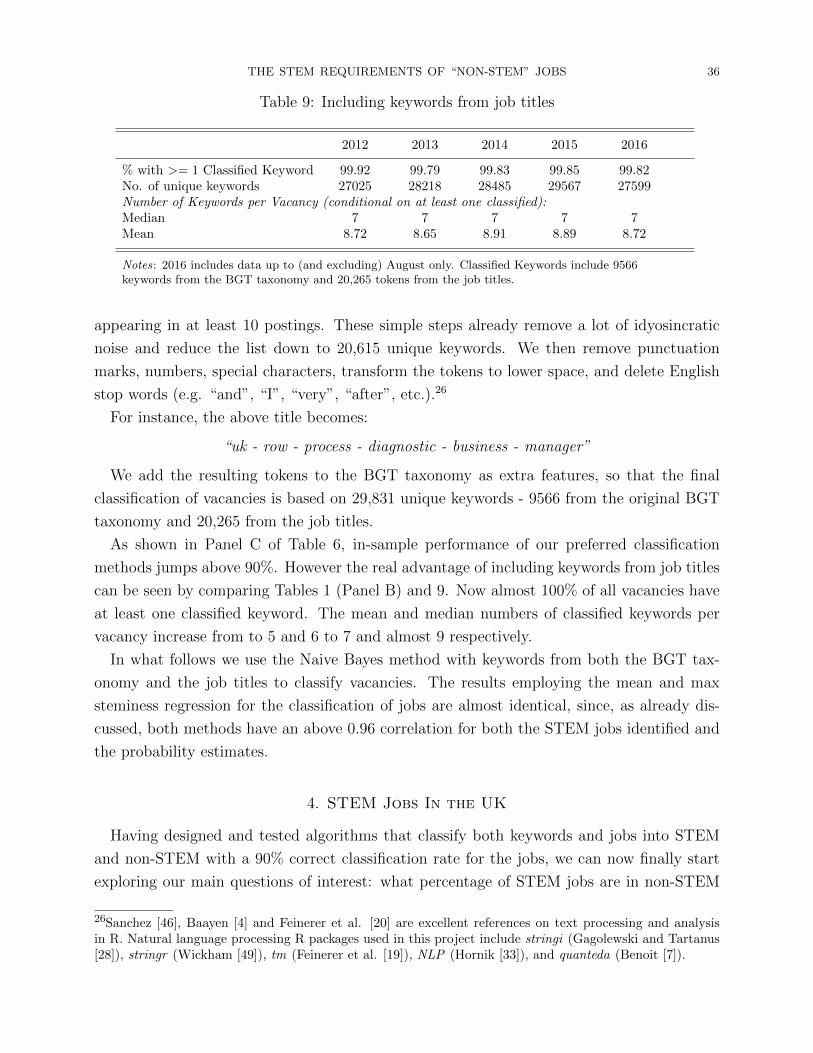
less than 15% is very small. Finally, we process the job titles into sets of keywords and
add them to the BGT taxonomy, so that our eventual classification of jobs into STEM and
non-STEM is based on 29,831 distinct keywords with 99.82% of all vacancies in our data
possessing at least one classified keyword and the median number of classified keywords per
vacancy with at least one being seven.
This paper also contributes to the emerging literature that develops and applies Machine
Learning (ML) and Natural Language Processing (NLP) techniques to problems in Econom-
ics.8 ML consists of “flexible, automatic approaches [...] used to detect patterns within the
8For instance, in labour economics, a recent paper by Frey and Osborne [25] also employs ML to examinethe susceptibility of jobs to computerisation in the US. The authors hand-label 70 out of 702 US occupationsas either automatable or not, then employ this sample to train a Gaussian process classifier and estimatethe probability of computerisation for all 702 occupations as a function of nine O*NET variables that reflectbottlenecks to computerisation (e.g. finger dexterity, originality...). Their findings indicate that about 47percent of total US employment is at high risk of computerisation (probability above 0.7).
THE STEM REQUIREMENTS OF “NON-STEM” JOBS 10
data, with a primary focus on making predictions on future data” (Chiu [15]). It is becoming
an indispensable toolkit for economists working with Big Data where standard approaches,
like simply classifying a selected number of keywords, are not satisfactory and what is re-
quired from the researcher is to design, train and test algorithms that can automatically
perform classification tasks on huge quantities of data.
The rest of the paper is structured as follows. We start by introducing the UK BGT data
in Section 2 and explaining how STEM keywords and jobs are identified in Section 3. We
then study the characteristics of STEM jobs in the UK in Section 4 and analyse the education
policy implications of our empirical findings in Section 5.
2. Data
Nowadays, when wanting to hire someone, employers usually go online and post a job
advert containing information about the vacancy they want to fill and the candidate they
are looking for.
Burning Glass Technologies (BGT), a US labour market analytics company, has been col-
lecting and processing information on all online job postings in the UK since 2012. Currently,
they “spider” (visit) approximately 5,000 websites including major job boards (e.g. Career
Builder, Universal Job Match), government job databases, direct sites of employers of all
sizes and industries, as well as websites of agencies specialised in recruitment (e.g. Michael
Page, Reed England).
BGT robots go online on a daily basis. However, the same vacancy ad spidered several
times on the same or different platforms within a period of two months is removed as a
duplicate. BGT regularly upgrades its infrastructure to enhance coding rules and expand
posting sources, in which case it re-parses the entire database to ensure consistency and
comparability of postings over time. The sample used in this paper runs from January 2012
to and including July 2016.9
Where available, BGT collects the job title, detailed information on occupation and indus-
try identifiers, the employer, the geographic location, education, experience, and discipline
requirements, wages, pay frequencies, salary types, and keywords from the job description
texts. However, since few recruiters explicitly specify all this information in their vacancy
postings and BGT does not impute any missing fields, the data contains many missing values.
Table 1 presents some summary statistics about the numbers of vacancies and the per-
centages of non-missing values in each year. Overall, our sample contains over 33 million
of postings. Only 17.5% and 12.3% of them have minimum education and experience re-
quirements respectively (the percentages are even lower for maximum requirements). The
main reason is that employers often believe such information to be transparent from other
9The sample was received in September 2016, after the August 2016 update.
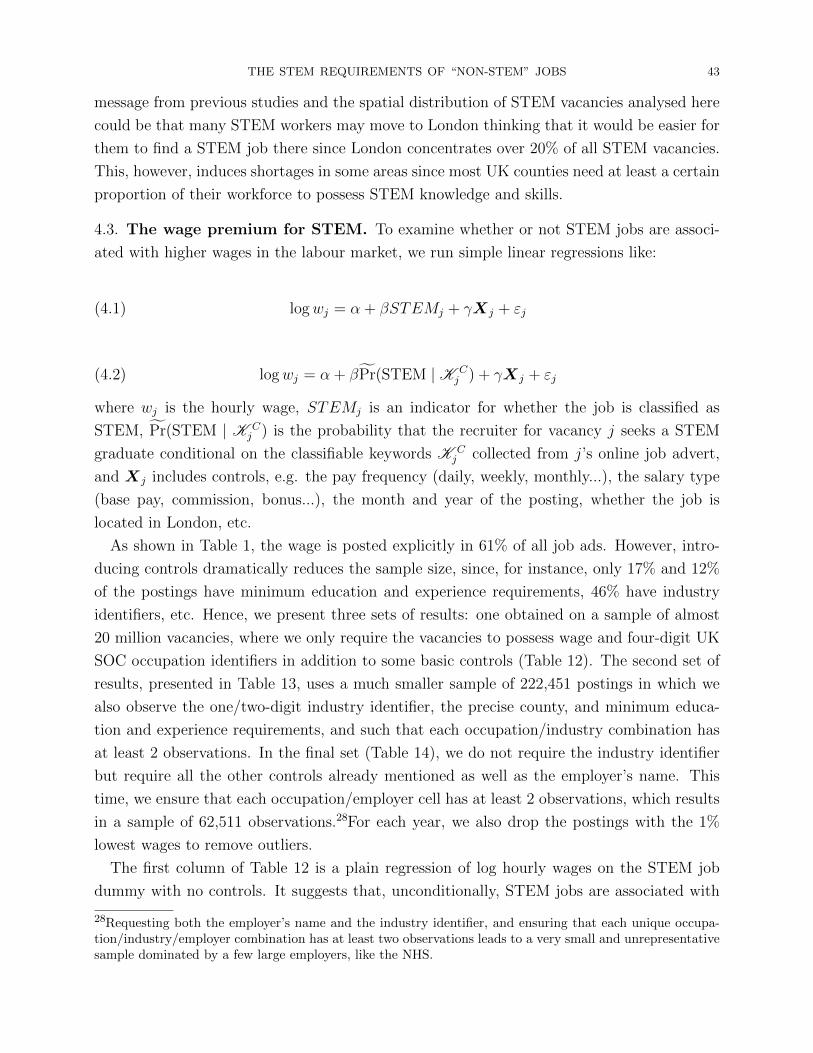
Number of postings 5939705 7041917 6240340 8173962 5667039 33062963% with Job Title 100 100 99.99 100 100 100% with Occupation 99.73 99.54 99.44 99.51 99.48 99.54% with County 95.55 88.88 80.04 77.8 79.66 84.09% with Industry 47.08 45.78 46.96 45.37 45.06 46.01% with Employer 24.86 29.73 30.93 31.85 32.2 30.03% with Education (min) 16.24 18.28 19.02 17.27 16.85 17.56% with Experience (min) 11.22 12.22 12.86 12.74 12.34 12.31% with Salary 63.01 60.05 59.62 60.29 63.04 61.07Hourly Salary (conditional on posting):Min 1.88 1.88 1.88 1.88 1.88 1.88Max 72.12 72.12 72.12 72.12 72.12 72.12Mean 15.58 16.10 16.50 17.17 17.21 16.54
Panel B: Keywords from Job Postings
% with >= 1 Keyword 92.01 89.71 89.94 89.93 89.11 90.12No. of unique keywords 9064 9496 9795 9995 9477 11182Number of Keywords per Vacancy (conditional on posting at least one):Median 4 4 5 5 5 5Mean 6.12 6.11 6.29 6.23 6.17 6.19Max 226 211 115 111 167 226Number of Vacancies per Keyword:Median 59 67 56 71 55 173as % of all postings 0.001 0.001 0.001 0.001 0.001 0.001Mean 3689.97 4067.25 3605.1 4580.86 3285.9 16482.43as % of all postings 0.06 0.06 0.06 0.06 0.06 0.05Most popular Keyword “Communication Skills”% of postings 20.59 21.97 24.04 23.25 22.38 22.5
Panel C: Discipline Requirements
% with >= 1 CIP major 11.43 12.04 13.14 11.75 11.74 12.01of which ...
% with > 1 CIP major 30.72 29.54 30.22 31.04 31.53 30.58% with >= 1 Keyword 98.87 98.68 98.83 98.76 98.53 98.74No. unique CIP majors 394 402 403 403 398 425No. of unique Keywords 8523 8831 8998 9026 8684 9566as % of all Keywords 94.03 93.00 91.86 90.31 91.63 85.55Number of Keywords per Vacancy in this subsample (cond. on >= 1):Median 8 7 8 8 8 8Mean 9.47 9.04 9.17 9.13 9.21 9.19Number of Vacancies per Keyword in this subsample:Median 27.50 29.00 26.00 28.00 25.00 67.00Mean 871.38 963.66 920.79 1071.34 802.01 3767.79% with non-mixed disciplines 90.72 91.00 90.60 90.46 90.34 90.63Correlation with all postings:Keywords (No. times posted) 0.93 0.94 0.95 0.94 0.94 0.94Occupations (4-digit SOC, %s) 0.82 0.81 0.80 0.80 0.81 0.81County (%s) 0.99 1.00 1.00 0.99 0.99 0.99
Notes: Occupation (4-digit UK SOC), Industry (SIC at division or section levels), Education and experiencerequirements in years, Hourly salary (average of min and max if different). CIP stands for Classification ofInstructional Programmes. % with non-mixed disciplines gives the % of vacancies for which all disciplinesposted are either all STEM or all non-STEM.
THE STEM REQUIREMENTS OF “NON-STEM” JOBS 12
characteristics of their job advert. For instance, the recruiter posting an “Aerospace Engi-
neer” vacancy without an education requirement would not expect to receive applications
from people with GCSE as the highest qualification. It should also be clear to the job seeker
that the experience requirement of the vacancy whose title reads “Vice President” is different
from the one with a title containing “Analyst”.
There are several other important caveats to bear in mind when working with online
postings data. Firstly, some misclassifications are unavoidable when collecting data on such
a grand scale. Moreover, not all vacancies are posted online, not all vacancies transform into
real jobs, and sometimes a recruiter might post one vacancy but in reality seek to hire several
people.
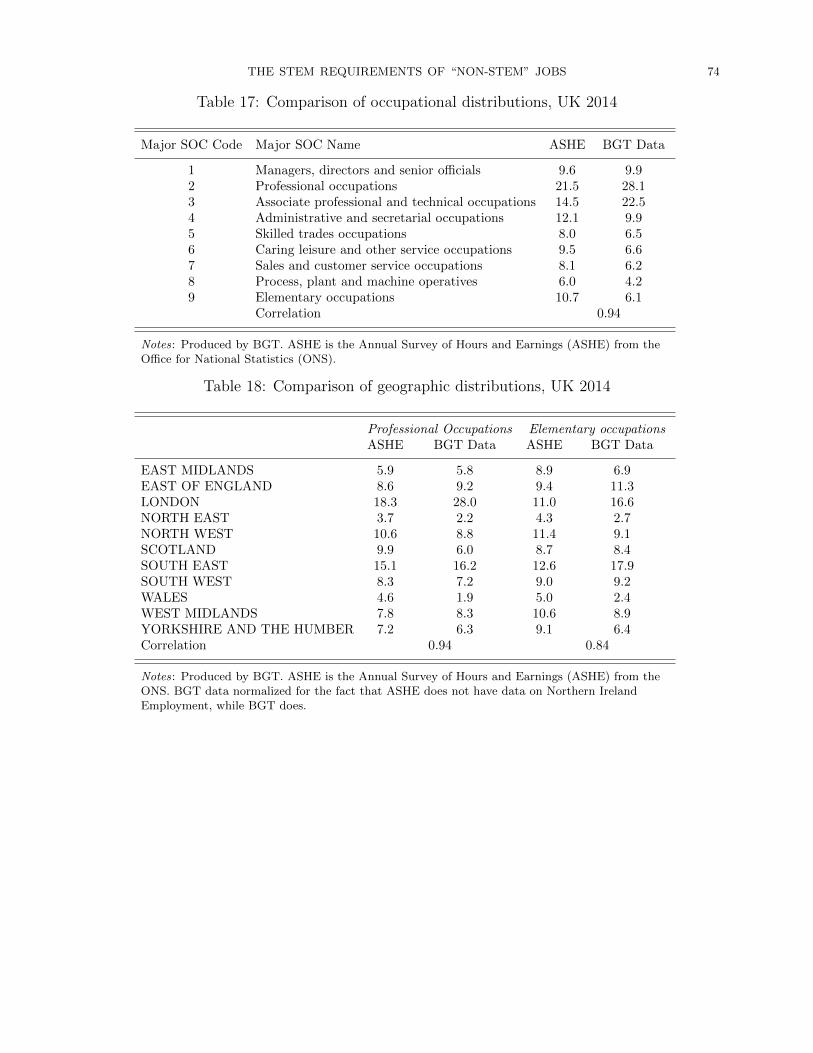
Despite all these shortcomings, occupational and geographic distributions in the BGT
data exhibit high correlations with the occupational and geographic distributions of official
UK employment data (the Annual Survey of Hours and Earnings (ASHE) from the Office
for National Statistics (ONS)). Tables 17 and 18 in the Appendix present the results of a
comparison analysis conducted by BGT for the 2014 sample. The correlation of distributions
across major occupational groups is 0.94 (Table 17). However, as with US data, the UK
data also exhibits an over-representation of positions typically requiring higher education
(professional and associate professional occupations), and an under-representation of those
requiring lower levels of education.10
In terms of geographic distributions, the correlations are also very high: 0.94 for profes-
sional occupations and 0.84 for elementary occupations (cf. Table 18). However, London
postings are over-represented in the BGT sample.
Unfortunately, it is not possible to compare BGT data directly to the vacancies data
from the ONS Labour Market Statistical bulletins because ONS uses three-month rolling
averages (January-March, February-April, March-May, etc.), whereas BGT has a two-months
deduplication window. Hence, a given posting in the BGT sample could appear more than
once in ONS records. This may explain why, for instance, for 2014, ONS has 7.9 million
vacancies, whereas BGT data contains only 6.24 million postings.
Moreover, it is important to remember that while BGT data contains the universe of online
vacancies, both the ASHE and the Labour Market Statistical bulletins are based on surveys
of households or businesses. For instance, the ASHE is based on a 1% sample of employee
jobs, drawn from HM Revenue and Customs Pay As You Earn (PAYE) records. And as the
ONS cautions itself, “results from sample surveys are always estimates, not precise figures.”
2.1. Keywords from Job Postings. What makes BGT data stand out from more tradi-
tional sources of labour market information is the fact that it also contains keywords and
10For the US, Carnevale et al. [13] estimate that 80 to 90% of openings requiring at least a college degreeare posted online, whereas the numbers for those requiring some college (or an Associate’s degree) and thoseonly requiring high school are 30-40% and 40-60% respectively.
THE STEM REQUIREMENTS OF “NON-STEM” JOBS 13
phrases from the vacancy description texts. Concretely, in the data, the vacancy description
text appears as a set of keywords taken out of context, e.g.:11
“Adobe After effects - E-Learning - Multi-Tasking - Audio Editing”
These keywords are collected using “a continuously expanding taxonomy” (Carnevale et
al. [13]). We can think of this taxonomy as the “language” that recruiters employ to describe
the job and the candidate they are looking for. It includes:
The fact that most recruiters prefer to express their skills & knowledge requirements di-
rectly, by simply describing the open position and the candidate that they are looking for,
is an important reason for attempting to identify STEM jobs from the vacancy description
keywords, and not by relying on whether or not the posting contains an explicit STEM
qualification/degree requirement.
However, since our goal is precisely to identify STEM jobs as those whose recruiters would
most likely seek to hire STEM graduates, this sample with explicit discipline requirements
11BGT refers to them as “skills”. However, because they also contain many expressions which strictlyspeaking are not “skills”, we prefer to refer to both single word (e.g. “Research”) and multiple word phrases(“Academic Programme Management”) as simply “keywords”. In practice, we removed the white spacebetween the words in multiple word phrases to avoid treating, for instance, “Lotus Notes” and “LotusNotes”as distinct “keywords”.12Hence, the vacancy representation in our data is closer to what in the information retrieval literature iscalled a “boolean retrieval” rather than a “bag of words” model, although what is collected are specifickeywords and phrases instead of all tokens (cf. Manning et al. [39]).
THE STEM REQUIREMENTS OF “NON-STEM” JOBS 14
constitutes an important first step in our analysis. Within it, STEM jobs are already identi-
fied because we can directly observe whether the discipline posted is STEM or non-STEM.
Merging together observations for Jan. 2012 - Jul. 2016, we obtain almost 4 million
vacancies with explicit discipline requirements. The 425 distinct disciplines posted in these
4 million vacancies correspond to majors from the Classification of Instructional Programs
(CIP) - a taxonomic coding scheme of over 2,000 instructional programs, developed by the
US Department of Education. The CIP has two-digit, four-digit, and six-digit series, and
most of the programs are offered at the post-secondary level.13
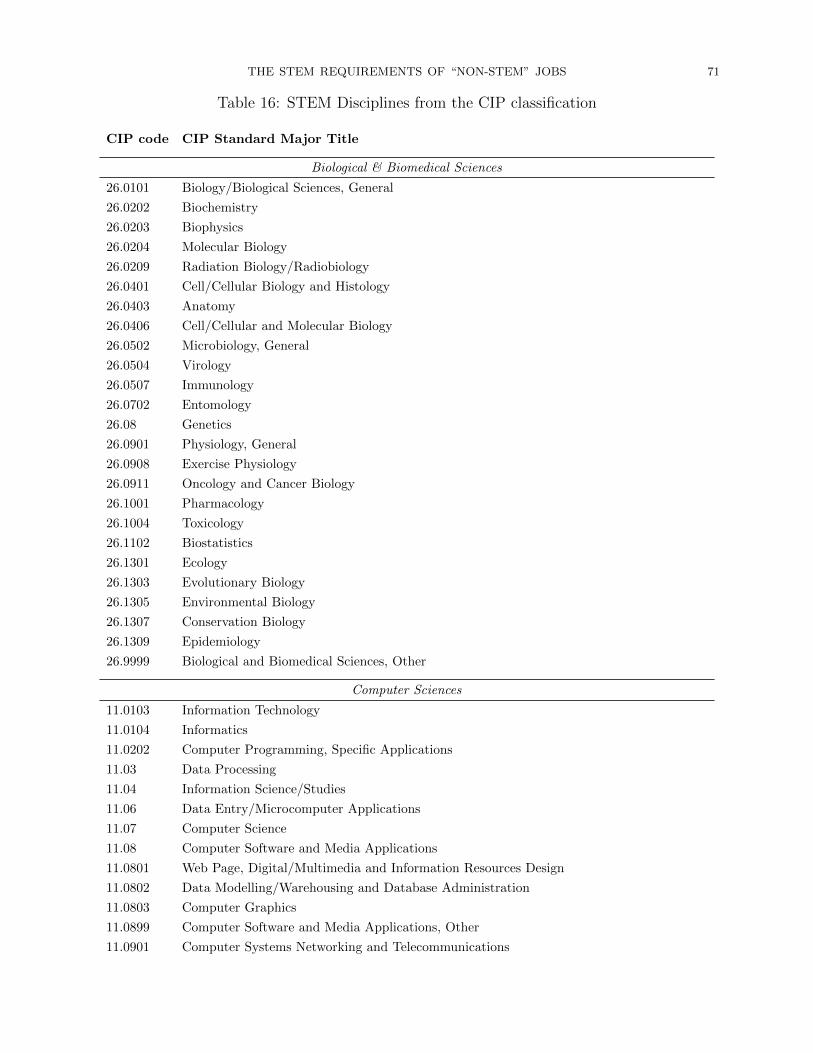
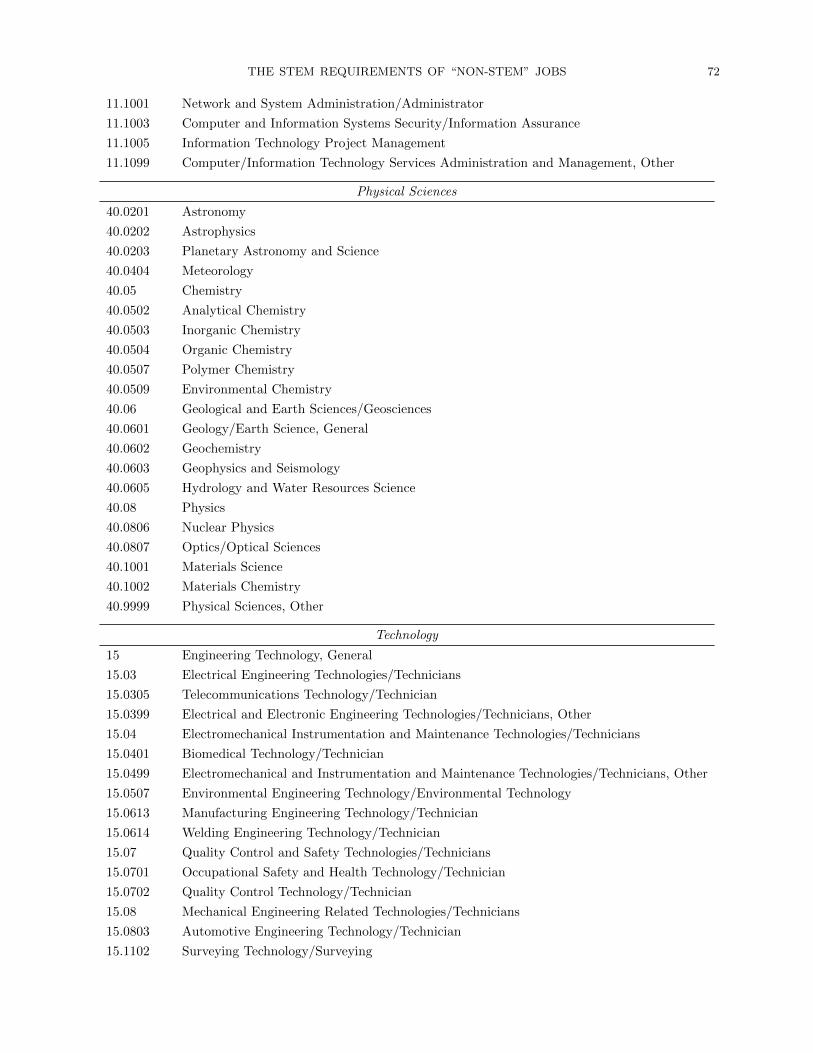
We define STEM disciplines as the majors included in the CIP two-digit series correspond-
ing to: Biological & Biomedical, Physical, and Computer Sciences, Technology, Engineering,
and Mathematics & Statistics. Table 16 in the Appendix provides the full list of disciplines
contained within each group and that appear in our sample. All remaining disciplines in our
data belong to different two-digit series and are therefore classified as non-STEM. Note that
there is disagreement in the literature about whether Medical programs, Agricultural sci-
ences, Environmental sciences and Architecture should be classified as STEM or not. In this
paper, we decided to take the STEM acronym literally and therefore exclude these disciplines.
However, future research could certainly explore alternative classifications.14
Around 30% of postings specify more than one CIP major. For such postings, we re-weight
each major by the number of majors specified so that the overall discipline requirement sums
to one.15
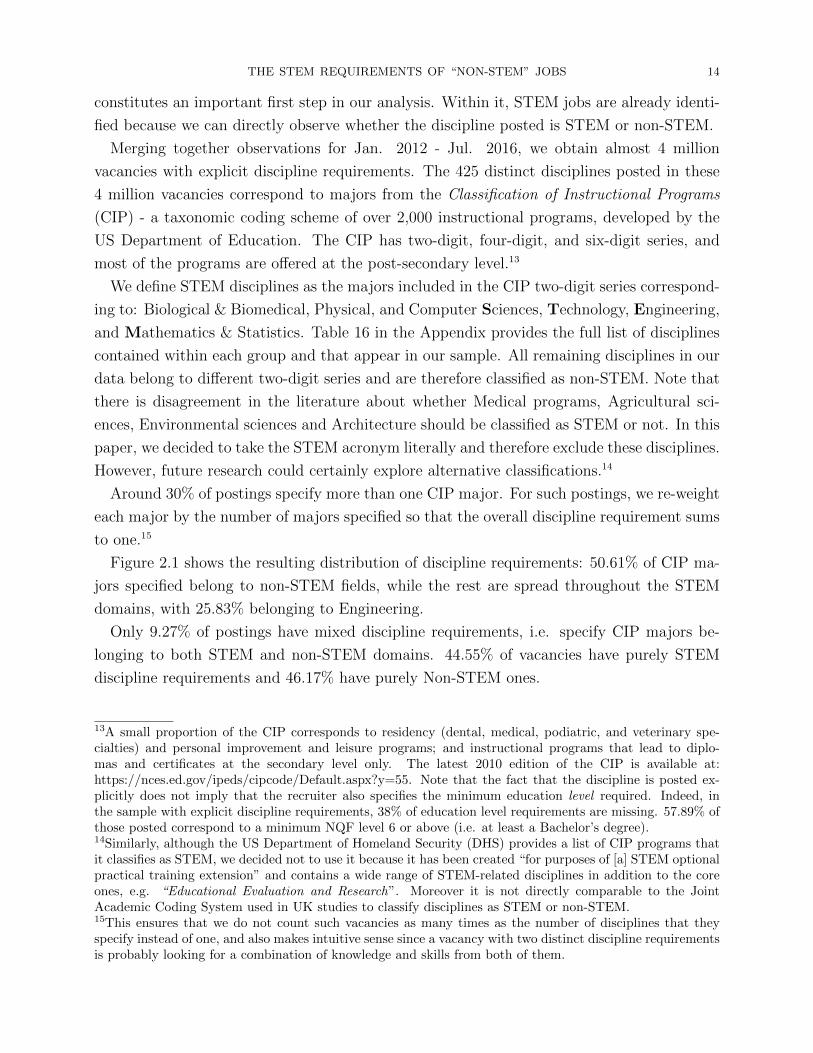
Figure 2.1 shows the resulting distribution of discipline requirements: 50.61% of CIP ma-
jors specified belong to non-STEM fields, while the rest are spread throughout the STEM
domains, with 25.83% belonging to Engineering.
Only 9.27% of postings have mixed discipline requirements, i.e. specify CIP majors be-
longing to both STEM and non-STEM domains. 44.55% of vacancies have purely STEM
discipline requirements and 46.17% have purely Non-STEM ones.
13A small proportion of the CIP corresponds to residency (dental, medical, podiatric, and veterinary spe-cialties) and personal improvement and leisure programs; and instructional programs that lead to diplo-mas and certificates at the secondary level only. The latest 2010 edition of the CIP is available at:https://nces.ed.gov/ipeds/cipcode/Default.aspx?y=55. Note that the fact that the discipline is posted ex-plicitly does not imply that the recruiter also specifies the minimum education level required. Indeed, inthe sample with explicit discipline requirements, 38% of education level requirements are missing. 57.89% ofthose posted correspond to a minimum NQF level 6 or above (i.e. at least a Bachelor’s degree).14Similarly, although the US Department of Homeland Security (DHS) provides a list of CIP programs thatit classifies as STEM, we decided not to use it because it has been created “for purposes of [a] STEM optionalpractical training extension” and contains a wide range of STEM-related disciplines in addition to the coreones, e.g. “Educational Evaluation and Research”. Moreover it is not directly comparable to the JointAcademic Coding System used in UK studies to classify disciplines as STEM or non-STEM.15This ensures that we do not count such vacancies as many times as the number of disciplines that theyspecify instead of one, and also makes intuitive sense since a vacancy with two distinct discipline requirementsis probably looking for a combination of knowledge and skills from both of them.
THE STEM REQUIREMENTS OF “NON-STEM” JOBS 15
Figure 2.1 Distribution of discipline requirements
Notes: 3971988 vacancies with explicit discipline requirements collected between Jan. 2012 and July 2016.
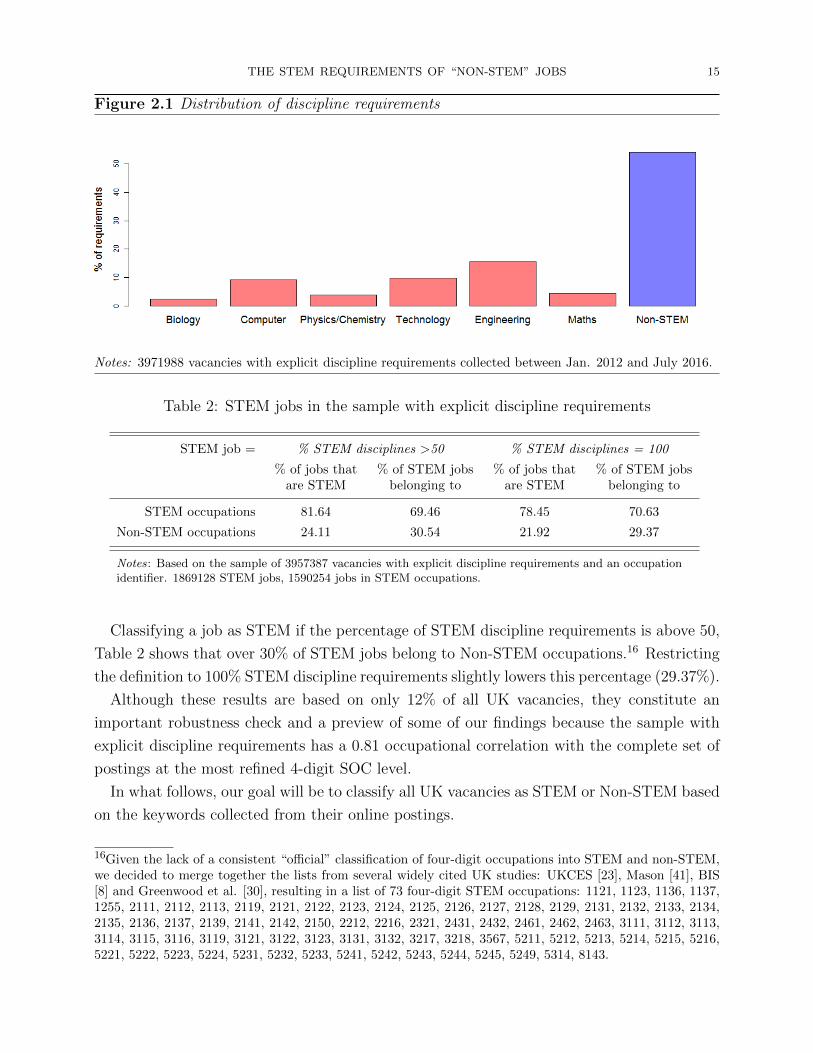
Table 2: STEM jobs in the sample with explicit discipline requirements
Notes: Based on the sample of 3957387 vacancies with explicit discipline requirements and an occupationidentifier. 1869128 STEM jobs, 1590254 jobs in STEM occupations.
Classifying a job as STEM if the percentage of STEM discipline requirements is above 50,
Table 2 shows that over 30% of STEM jobs belong to Non-STEM occupations.16 Restricting
the definition to 100% STEM discipline requirements slightly lowers this percentage (29.37%).
Although these results are based on only 12% of all UK vacancies, they constitute an
important robustness check and a preview of some of our findings because the sample with
explicit discipline requirements has a 0.81 occupational correlation with the complete set of
postings at the most refined 4-digit SOC level.
In what follows, our goal will be to classify all UK vacancies as STEM or Non-STEM based
on the keywords collected from their online postings.
16Given the lack of a consistent “official” classification of four-digit occupations into STEM and non-STEM,we decided to merge together the lists from several widely cited UK studies: UKCES [23], Mason [41], BIS[8] and Greenwood et al. [30], resulting in a list of 73 four-digit STEM occupations: 1121, 1123, 1136, 1137,1255, 2111, 2112, 2113, 2119, 2121, 2122, 2123, 2124, 2125, 2126, 2127, 2128, 2129, 2131, 2132, 2133, 2134,2135, 2136, 2137, 2139, 2141, 2142, 2150, 2212, 2216, 2321, 2431, 2432, 2461, 2462, 2463, 3111, 3112, 3113,3114, 3115, 3116, 3119, 3121, 3122, 3123, 3131, 3132, 3217, 3218, 3567, 5211, 5212, 5213, 5214, 5215, 5216,5221, 5222, 5223, 5224, 5231, 5232, 5233, 5241, 5242, 5243, 5244, 5245, 5249, 5314, 8143.
THE STEM REQUIREMENTS OF “NON-STEM” JOBS 16
3. Identifying STEM Keywords and Jobs
Irrespective of the occupations to which they belong, we want to identify STEM jobs as
those whose vacancy descriptions contain “STEM keywords” - knowledge and skills that are
typically acquired through a STEM education, or software/technological devices/job tasks
that require and apply STEM knowledge & skills. Intuitively, recruiters employing STEM
keywords when describing the job they want to fill and the candidate that they are looking
for will be much more likely to seek to hire people with a STEM education even if they do
not explicitly post a STEM discipline requirement.
Our approach consists of two steps: in Subsection 3.1, we identify STEM keywords using
a method that we call “context mapping”. The key idea in “context mapping”, illustrated
in Figure 1.1, is to classify keywords based on their “steminess” - the percentage of STEM
discipline requirements with which the keywords appear in the sample where we observe both
keywords and discipline requirements. Subsection 3.2 then proposes and evaluates several
different ways of employing the steminess of the keywords found in an online vacancy posting
to classify it as STEM or non-STEM, as well as estimate the probability that its recruiter
looks for a STEM graduate.
3.1. STEM keywords. The classification problem here is very simple: the BGT taxonomy
contains 11,182 distinct keywords and we want to label as “STEM” those which correspond
to knowledge and skills that are typically acquired through a STEM education, or soft-
ware/technological devices/job tasks for which a STEM background is typically required in
the labour market.
In theory, we could inspect all the keywords one by one and manually select those that
seem to be STEM. In practice, this exercise is infeasible because of the thousands of technical
terms, which may or may not be related to STEM, and that would require expert knowledge
Even reading about these terms still leaves a lot of uncertainty and subjectivity in deciding
on how to classify them. By contrast, this classification decision would be obvious to the
recruiters employing these terms in their job descriptions since they should not only have
a precise understanding of what these technical terms mean but also know the education
background that successful job applicants for their advertised positions typically possess.
Luckily, 85.55% of all the BGT taxonomy (9566 keywords) ever appears in the subsample of
vacancies with explicit discipline requirements (cf. Panel C, Table 1). Moreover, as shown in
Fig. 2.1, for a vacancy selected at random from this sample, there is a roughly equal chance of
finding a STEM or a non-STEM discipline requirement. Hence, a simple strategy, illustrated
THE STEM REQUIREMENTS OF “NON-STEM” JOBS 17
in Figure 1.1, is to separate the 9566 “classifiable” keywords into STEM, Neutral and Non-
STEM depending on the discipline “contexts” in which they appear. Intuitively, a proper
STEM skill, knowledge, task should rarely appear together with a non-STEM degree because
it requires a proper STEM education and a STEM qualification. Similarly, non-STEM skills
(e.g. “Cooking”), knowledge (e.g. “French”), tasks (e.g. “Account Reconciliation”) would
rarely appear in STEM contexts since they require a non-STEM education. At the same
time, “Communication skills”, “Leadership”, “Research”, “Presentation skills” are neither
STEM, nor non-STEM specific skills, and therefore should not appear more often in vacancy
descriptions of jobs requiring a STEM education than those requiring a non-STEM one.
These are the “neutral” keywords.
Figure 1.1 shows some concrete examples: 95% of all disciplines with which the keyword
“C++” appears are STEM. By contrast, “English” appears with STEM discipline require-
ments less than 30% of the time.
Let us refer to the percentage of STEM discipline requirements with which a keyword
appears in the sample with both keywords and discipline requirements as its “steminess”.17
After computing the steminess of all keywords, clustering techniques can be used to sepa-
rate them into STEM, Neutral, and non-STEM, then further disentangle the STEM domain
to which a STEM keyword is most likely to be related.
An important implicit assumption behind our strategy is that the subsample used to
classify the keywords has the same underlying properties as the sample of all UK vacancies.
As shown at the bottom of Panel C in Table 1, this seems to be the case since there is a
0.94 correlation between the frequency of posting a given keyword in the subsample with
explicit discipline requirements and the sample of all postings. The correlations between the
occupational and geographic distributions in the two samples are also very high: 0.81 and
0.99.
The insert on the next page shows the detailed steps of our strategy. We call it “context
mapping” because the idea comes from Ethnography - the study of people and cultures.
Ethnographers often seek to understand human behaviour by investigating “the environment
in which the behaviour under study takes place”, i.e. creating a “context mapping”.18 In
our case, to understand whether a keyword should be classified as STEM, neutral or non-
STEM, we look at whether the keyword appears more often with explicit STEM education
requirements than with non-STEM ones, i.e. record the distribution of STEM vs. non-STEM
discipline “contexts” in which the keyword appears.
In Step 1, we simply record, for any vacancy j that belongs to the sample with both
keywords and explicit discipline requirements (VD ∩ VK), the distribution of j’s disciplines
17Credit to Rob Valletta for coining this term at the IZA Workshop. Also, we do not use “stemness” becauseit already has a precise definition in cytology (the study of cells).18cf. http://www.ethnographic-research.com/ethnography/some-particular-methods/context-mapping/
THE STEM REQUIREMENTS OF “NON-STEM” JOBS 18
Algorithm 1 Context Mapping and Clustering
Notation: Let V = j denote the set of vacancies (empty jobs), K = k the set ofkeywords, D = d the set of disciplines.Vacancy j’s online description contains keywords Kj and discipline requirements Dj.Define VD ⊂ V as the subset of vacancies that post at least one discipline requirement:
VD := j|Dj 6= ØSimilarly, VK ⊂ V the vacancies with at least one keyword:
Technology, C5 = Engineering, C6 = Mathematics, and C7 = Non-STEM.Step 1: For all j ∈ VD ∩ VK , record the distribution of j’s discipline requirements over
C as cj = (cj,1, ..., cj,7) with:
cj,p =1
|Dj|∑i∈Dj
I(dj,i ∈ Cp)
where p = 1, ..., 7, I(.) is the indicator function and |.| denotes the cardinality of a set.Step 2: Consider the set of keywords K C ⊂ K such that:
K C := k ∈ Kj|j ∈ VD ∩ VKFor any k ∈ K C , let Vk ⊂ VD∩VK be the subset of vacancies with discipline requirementsthat post k:
Vk := j ∈ VD ∩ VK |k ∈ KjCall Vk the “contexts” in which k appears and create a context mapping for k by takingthe average distribution of disciplines in Vk:
xk = (xk,1, ..., xk,7) with xk,p =1
|Vk|∑j∈Vk
cj,p
The steminess of keyword k is defined as steminessk = 1− xk,7.Step 3: Classify the “classifiable” keywords K C into three clusters G1 = G1, G2, G3
with G1 = STEM, G2 = Neutral and G3 = Non-STEM by minimizing:
arg minGl
3∑l=1
∑k∈Gl
(steminessk − steminessl)2
where steminessl = 1|Gl|∑
k∈Glsteminessk. The optimal parition is found using the algo-
rithm described in Hartigan and Wong [31] with initial centroids selected as 0 (Non-STEM),0.5 (Neutral) and 1 (STEM).Step 4: Let K STEM be the keywords identified in Step 3 as belonging to the STEM
cluster. Classify K STEM into six clusters G2 = G1, ..., G6 where G2 are the six STEMdomains, e.g. G1= Biology,..., G6= Mathematics, by minimizing:
arg minGl
6∑l=1
∑k∈Gl
7∑p=1
(xk,p − xl,p)2
The solution is found as in Step 3 but with initial centroids selected as [I6; 0] with I6 beingthe 6× 6 identity matrix.
THE STEM REQUIREMENTS OF “NON-STEM” JOBS 19
over the six STEM domains and the non-STEM one in the vector cj. This step is necessary
because 30% of vacancies post multiple disciplines. We then focus on the 9566 keywords K C
that ever appear in VD∩VK - the “classifiable” keywords. Whenever a keyword appears in a
vacancy with discipline requirements, it appears in a “context” in which the distribution of
disciplines over the STEM domains and the non-STEM one is given by cj. Step 2 records
the average distribution of disciplines among all the contexts in which k appears as xk. The
steminess of a keyword is simply the proportion of STEM domains in xk. Steps 3 and 4
implement a K−means clustering where we specify both the number of centers and their
initial locations. In Step 3, we use the steminess of the keywords to partition them into
STEM, neutral and non-STEM. The initial centroids are therefore 0, 0.5, and 1 corresponding
to 0% STEM (Non-STEM cluster), 50% STEM (Neutral cluster) and 100% STEM (STEM
cluster). Step 4 classifies the STEM keywords into different STEM domains. The six initial
centroids allocate 100% to each of the STEM domains.19
Figure 3.1 shows examples of randomly selected keywords from the resulting clusters. The
method does not claim to be perfect. Nevertheless, “context mapping” does have the ad-
vantage of systematically classifying over 85% of all the BGT taxonomy, including many
technical terms. More importantly, as Fig. 3.1 and further manual checks suggest, the re-
sulting classification does seem fairly plausible.
For instance, “Step 7 PLC” is classified into the Technology cluster because it is an “en-
gineering system in industrial automation”.20 “NASH” has nothing to do either with John
Nash, or with STEM, or with non-STEM; it is the acronym for either “Non Alcoholic Steato
Hepatitis”, or “News About Software Hardware”, or “Nashville”... Given this ambiguity,
“NASH” cannot help us understand whether or not a job requires STEM knowledge and
skills, hence the algorithm correctly classifies it as a neutral keyword. “800-53” is allocated
to the Computer Sciences cluster since the “NIST Special Publication 800-53” is a catalog
of security controls for federal information systems in the US. It is highly probable that
people who would be referring to this publication in their jobs would also be required to
understand how information systems work and are secured - knowledge that can be acquired
through a degree like “Computer and Information Systems Security/Information Assurance”
(cf. Table 16 in the Appendix).
19Usually, in K-means clustering, the number of clusters is unknown. Researchers “try several differentchoices, and look for the one with the most useful or interpretable solution” (James et al. [34], chapter 10).Moreover, given a number of clusters, their initial locations (the centroids) are picked randomly and theresulting partition depends on this initial random selection. In our case both problems are avoided since thechoices of the number of clusters and their locations are dictated by the type of information that we wishto extract. However, future research could explore more refined clustering or even other approaches: “withthese methods, there is no single right answer—any solution that exposes some interesting aspects of thedata should be considered.”[34] Similarly, while the objective function in K-means clustering is the residualsum of squares, it would certainly be possible to try different criteria.20http://w3.siemens.com/mcms/simatic-controller-software/en/pages/default.aspx
THE STEM REQUIREMENTS OF “NON-STEM” JOBS 20
Figure 3.1 Examples of STEM (by cluster), non-STEM and neutral keywords
Note that keywords like “Mathematics”, “Computer Skills”, “Problem Solving” all appear
in the neutral cluster. This is precisely because within the UK education system, such skills
are not exclusively taught in STEM tracks. For instance, “Mathematics” on its own is of-
ten mentioned as a general basic skill requirement by many different recruiters looking for
STEM and non-STEM graduates alike. It seems that a recruiter looking specifically for a
THE STEM REQUIREMENTS OF “NON-STEM” JOBS 21
Engineering Mathematics & Statistics
Non-STEM Neutral
Notes: Random samples of around 100 distinct keywords collected from UK online vacancies and classifiedusing context mapping and clustering. Size and color are by frequency of being posted. Figures createdusing wordcloud R package by Fellows [22].
Mathematics/Statistics graduate, would use much more precise keywords like “Mathematical
Modelling”, “Statistics”, or technical terms, e.g. “Chi-squared Automatic Interaction Detec-
tion (CHAID)”, “Stochastic Optimisation”, etc. Indeed, the steminess of “Mathematics” is
only 0.395, while it rises to 0.738 for “Statistics” and 0.892 for “Mathematical Modelling”.
Notes: Summary statistics from the classification of 3685 STEM keywords into six STEM domains.
BGT themselves classify 822 keywords as “Software and Programming”. However, some
of the software included in this category could be relatively easily learned/operated with
no STEM background, e.g. “Microsoft Excel”, enterprise software like “Oracle Human Re-
sources”, etc., or do not have much to do with a STEM education, e.g. “Flickr”, “LinkedIn”,
etc. Context mapping classifies these keywords as either neutral or even non-STEM and
clearly separates them from software and programming that do require advanced STEM
knowledge and skills, e.g. “Microsoft C#”, “UNIX Administration”. Interestingly, among
STEM software, statistical packages like “SAS” and “R” are assigned to the Mathematics
& Statistics cluster because they mainly require knowledge of statistical analysis rather than
very advanced computer programming skills. Other types of statistical software like “Stata”
and “E-Views” are assigned to the neutral cluster because they are not more often taught in
STEM disciplines than non-STEM ones. Hence, if such software were the only requirement
the recruiter had, he would not be seeking STEM graduates with a higher probability than
non-STEM ones.
Tables 3 and 4 provide further details on the distribution of discipline requirements within
each cluster identified. For instance, the mean, median and min steminess of STEM keywords
are 0.89, 0.91, and 0.69 respectively, while they are only 0.10, 0.08, and 0 for Non-STEM
keywords respectively. Table 4 suggests that the Biology cluster is the best identified and
most coherent with a 73% average loading on the Biological & Biomedical Sciences for the
THE STEM REQUIREMENTS OF “NON-STEM” JOBS 23
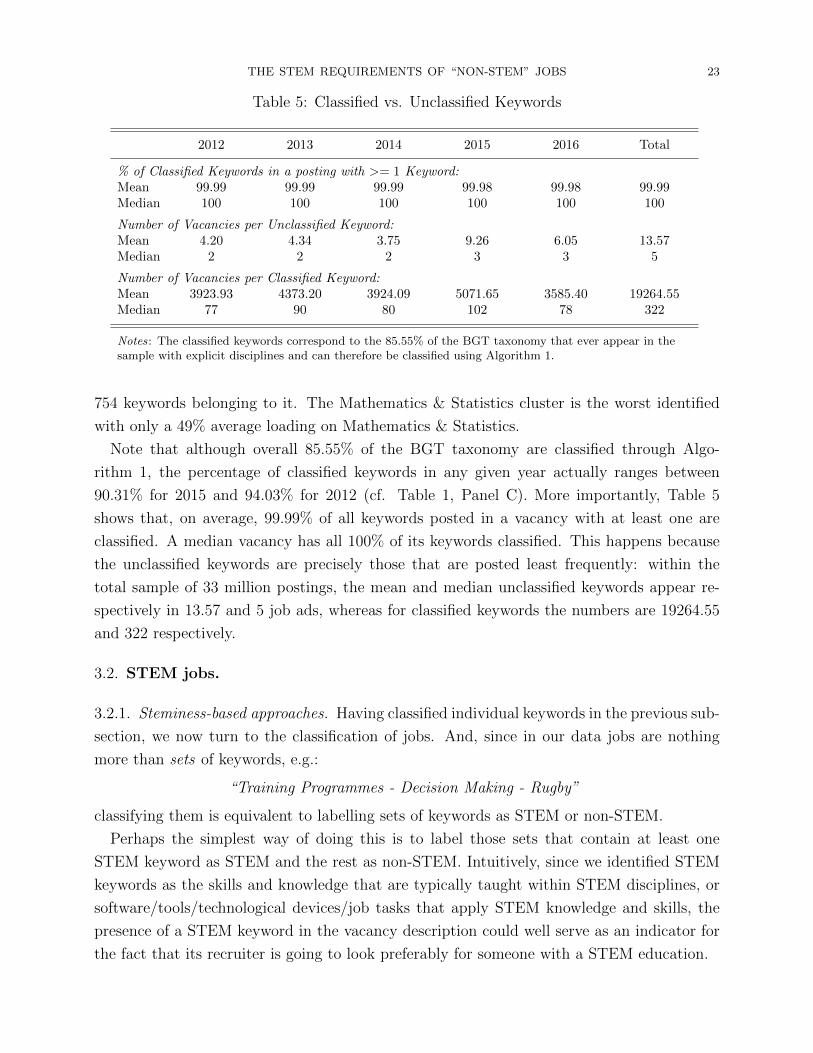
Table 5: Classified vs. Unclassified Keywords
2012 2013 2014 2015 2016 Total
% of Classified Keywords in a posting with >= 1 Keyword:Mean 99.99 99.99 99.99 99.98 99.98 99.99Median 100 100 100 100 100 100
Number of Vacancies per Unclassified Keyword:Mean 4.20 4.34 3.75 9.26 6.05 13.57Median 2 2 2 3 3 5
Number of Vacancies per Classified Keyword:Mean 3923.93 4373.20 3924.09 5071.65 3585.40 19264.55Median 77 90 80 102 78 322
Notes: The classified keywords correspond to the 85.55% of the BGT taxonomy that ever appear in thesample with explicit disciplines and can therefore be classified using Algorithm 1.
754 keywords belonging to it. The Mathematics & Statistics cluster is the worst identified
with only a 49% average loading on Mathematics & Statistics.
Note that although overall 85.55% of the BGT taxonomy are classified through Algo-
rithm 1, the percentage of classified keywords in any given year actually ranges between
90.31% for 2015 and 94.03% for 2012 (cf. Table 1, Panel C). More importantly, Table 5
shows that, on average, 99.99% of all keywords posted in a vacancy with at least one are
classified. A median vacancy has all 100% of its keywords classified. This happens because
the unclassified keywords are precisely those that are posted least frequently: within the
total sample of 33 million postings, the mean and median unclassified keywords appear re-
spectively in 13.57 and 5 job ads, whereas for classified keywords the numbers are 19264.55
and 322 respectively.
3.2. STEM jobs.
3.2.1. Steminess-based approaches. Having classified individual keywords in the previous sub-
section, we now turn to the classification of jobs. And, since in our data jobs are nothing
more than sets of keywords, e.g.:
“Training Programmes - Decision Making - Rugby”
classifying them is equivalent to labelling sets of keywords as STEM or non-STEM.
Perhaps the simplest way of doing this is to label those sets that contain at least one
STEM keyword as STEM and the rest as non-STEM. Intuitively, since we identified STEM
keywords as the skills and knowledge that are typically taught within STEM disciplines, or
software/tools/technological devices/job tasks that apply STEM knowledge and skills, the
presence of a STEM keyword in the vacancy description could well serve as an indicator for
the fact that its recruiter is going to look preferably for someone with a STEM education.
(12) Mean + % STEM 89.47 10.02 11.06 0.804+ Median + Max
Panel C: Including Job Titles
(13) Naive Bayes 90.80 8.20 10.23 0.809
(14) Mean + Max reg. 90.82 8.64 9.74 0.829
Notes: First three columns based on the sample of 3,554,318 vacancies with keywords and non-mixed disciplinerequirements. The correlation column employs the whole training sample (3,921,917 vacancies). In % STEM keywordswe only consider classified ones. Weighted Average Steminess assigns a weight of 1 to any keyword that has beendefined using at least 50 vacancies, then a weight of 0.5 + (No. vacancies/100) to all those that have been classifiedwith less. All regression models (Panel B) include a constant and are estimated using a logit link function on thesample with non-mixed discipline requirements. The dependant variable is a dummy variable equal to 1 if all thediscipline requirements are STEM and 0 if they are all non-STEM. Including job titles (Panel C) increases the trainingsample by 49,891 vacancies.
How well would this simple strategy work if implemented to recognize STEM and non-
STEM jobs within the sample where discipline requirements are posted explicitly, i.e. the
truth is known?
To address this question, we can create a so-called “confusion matrix”:
True outcome
Prediction Non-STEM disciplines STEM disciplines
Non-STEM job Correct classification Misclassified into Non-STEM
STEM job Misclassified into STEM Correct classification
THE STEM REQUIREMENTS OF “NON-STEM” JOBS 25
We classify jobs correctly if we predict STEM when the disciplines posted are indeed STEM
and non-STEM when the explicit discipline requirements are also non-STEM. If our strategy
predicts non-STEM (STEM) whereas the actual disciplines required are STEM (non-STEM),
we have misclassified the job into non-STEM (STEM).
Hence, three indicators that tell us how well our strategy is at classifying jobs are: the
percentage of jobs classified correctly, the % of non-STEM jobs misclassified into STEM and
the % of STEM jobs misclassified as non-STEM.
To avoid ambiguity, we focus on the subsample with non-mixed discipline requirements
(i.e. either all STEM or all non-STEM) when computing the correct classification and mis-
classification rates in Table 6. To gauge the performance of our classifier on the sample with
both mixed and non-mixed requirements, the last column of Table 6 shows the correlation
of the predicted outcome with the % of STEM discipline requirements. Also note that the
tests conducted in Table 6 are in-sample because the sample with explicit discipline require-
ments and keywords (VD ∩VK) used to evaluate our jobs classification strategies is the same
sample that we used in the previous section to compute steminess and classify keywords. We
implement out-of-sample tests in the following subsection.
The first proposed strategy corresponds to model (1). It classifies over 84% of vacancies
correctly. Disagreggating the 16% error rate, the next two columns of the Table show that
the “STEM Keyword” strategy misclassifies over 23% of non-STEM jobs into STEM, but
has a much lower misclassification rate for STEM vacancies into non-STEM: only 8.44%.
The relatively high misclassification rate into STEM occurs both because our classification
of keywords is imperfect, but also because the meaning of a given keyword may be nuanced
by the other keywords that appear with it in the job’s description. In order to improve our
correct classification rate, we therefore need an approach that somehow incorporates together
all the keywords in the set that we want to label.
A direct approach here is to take the average steminess of all keywords in the job’s de-
scription, then classify it as STEM if this average is above a certain threshold. Figure 3.3
shows that the correct classification rate peaks at 89.21% for a threshold of ≥0.49. Model (2)
in Table 6 employs this optimal threshold. Misclassification into STEM drops substantially,
from 23% to 9.7%. However, the misclassification into non-STEM rises by 3.5% pts. Note
that average steminess (model 2) performs better than an indicator for the presence of at
least one STEM keyword (model 1) not only in terms of overall correct classification, but
also in terms of correlation with the % of STEM discipline requirements: 0.762 vs. 0.665.
An important concern is that the steminess of different keywords is computed using samples
of different sizes with a median of 67 postings (cf. Panel C of Table 1). Taking a plain
average gives equal weight to all keywords in the job description. On the one hand, down-
weighting keywords that are defined using smaller sets could improve accuracy because their
THE STEM REQUIREMENTS OF “NON-STEM” JOBS 26
Figure 3.3 Using average steminess above a certain threshold to classify jobs as STEM
Notes: The correct classification rate peaks at 89.21% for a threshold of an average steminess greater thanor equal to 0.49.
steminess is estimated less precisely. On the other hand, however, these keywords often
correspond to some technical STEM terms and down-weighting them could make us believe
that the average steminess of the job description is lower than it actually is. We tried several
different weighting schemes. Overall, results are not very sensitive to the precise weighting.
If anything, accuracy goes slightly down, suggesting that the technical terms argument may
be more important than the precision one. For instance, in model (3) we assign a weight of
1 if a keyword’s steminess is computed using at least 50 vacancies. Otherwise the weight is
0.5 + |Vk|/100. These weights are then normalized by the total weights’ sum before taking
the weighted average.
Although the simple unweighted average steminess performs surprisingly well with an
almost 90% correct classification rate, there are several disadvantages of employing it. The
first one can be seen from comparing the first two histograms in Fig. 3.4. The relatively high
0.762 correlation of average steminess with the true percentage of STEM degree requirements
conceals the fact that the distributions in reality look quite different.
The second disadvantage is interpretation. The intuition is that a job description with a
higher average steminess entails a more advanced requirement of STEM knowledge and skills.
Its recruiter would therefore be more likely to want to hire a worker with a STEM education.
Hence, ideally, we would like to use steminess to build an estimate of the probability of
looking for a STEM graduate.
There are two ways of doing this. Firstly, instead of using mean steminess directly, we can
employ it as the predictor in a regression that models the probability of requiring a STEM
degree. In practice, to ensure that predicted probabilities lie between 0 and 1, we use a
THE STEM REQUIREMENTS OF “NON-STEM” JOBS 27
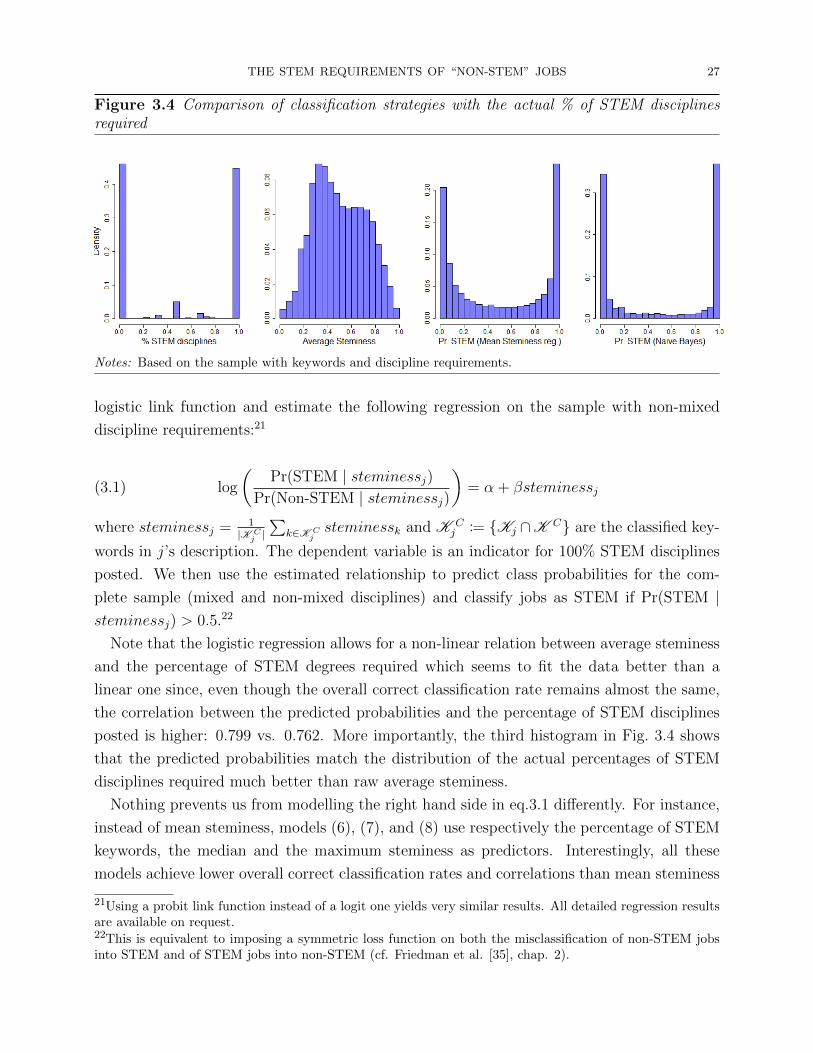
Figure 3.4 Comparison of classification strategies with the actual % of STEM disciplinesrequired
Notes: Based on the sample with keywords and discipline requirements.
logistic link function and estimate the following regression on the sample with non-mixed
discipline requirements:21
(3.1) log
(Pr(STEM | steminessj)
Pr(Non-STEM | steminessj)
)= α + βsteminessj
where steminessj = 1|K C
j |∑
k∈K Cjsteminessk and K C
j := Kj ∩K C are the classified key-
words in j’s description. The dependent variable is an indicator for 100% STEM disciplines
posted. We then use the estimated relationship to predict class probabilities for the com-
plete sample (mixed and non-mixed disciplines) and classify jobs as STEM if Pr(STEM |steminessj) > 0.5.22
Note that the logistic regression allows for a non-linear relation between average steminess
and the percentage of STEM degrees required which seems to fit the data better than a
linear one since, even though the overall correct classification rate remains almost the same,
the correlation between the predicted probabilities and the percentage of STEM disciplines
posted is higher: 0.799 vs. 0.762. More importantly, the third histogram in Fig. 3.4 shows
that the predicted probabilities match the distribution of the actual percentages of STEM
disciplines required much better than raw average steminess.
Nothing prevents us from modelling the right hand side in eq.3.1 differently. For instance,
instead of mean steminess, models (6), (7), and (8) use respectively the percentage of STEM
keywords, the median and the maximum steminess as predictors. Interestingly, all these
models achieve lower overall correct classification rates and correlations than mean steminess
21Using a probit link function instead of a logit one yields very similar results. All detailed regression resultsare available on request.22This is equivalent to imposing a symmetric loss function on both the misclassification of non-STEM jobsinto STEM and of STEM jobs into non-STEM (cf. Friedman et al. [35], chap. 2).
Assuming that keywords are posted independently of each other, this expression simplifies
to:
Pr(STEM | K Cj ) =
Pr(STEM) ·∏
k∈K Cj
Pr(k|STEM)∏k∈K C
jPr(k)
(3.2)
=
∏k∈K C
jPr(STEM|k)
Pr(STEM)nj−1(3.3)
where the last expression follows from observing that Pr(k|STEM) = Pr(k)·Pr(STEM|k)Pr(STEM)
.
THE STEM REQUIREMENTS OF “NON-STEM” JOBS 29
Similarly, the probability of looking for a non-STEM graduate is
Pr(Non-STEM | K Cj ) =
∏k∈K C
j(1− Pr(STEM|k))
(1− Pr(STEM))nj−1(3.4)
We can then classify a job as STEM if Pr(STEM | K Cj ) > Pr(Non-STEM | K C
j ).
In text classification, this approach is known as the “multinomial Naive Bayes classifier”,
also sometimes called the “unigram language model” in the Information Retrieval literature
(cf. Manning et al. [39], chapters 12 and 13). “Multinomial” because the ordering of
the keywords does not matter, “naive” because of the naive assumption of independence.23
Although this assumption is clearly wrong, in practice, there is simply no way of estimating
more complex relationships between keywords given how sparsely they appear in the data
and with each other.
Another practical issue is that because of multiplication, if any of the keywords in the
description has a steminess (non-steminess) of zero, the predicted probability of looking for
a STEM (non-STEM) graduate will be zero no matter the steminess (non-steminess) of the
rest of the keywords. To remedy this issue, we simply need to smooth the steminess and
non-steminess estimates so that they always lie in (0,1).
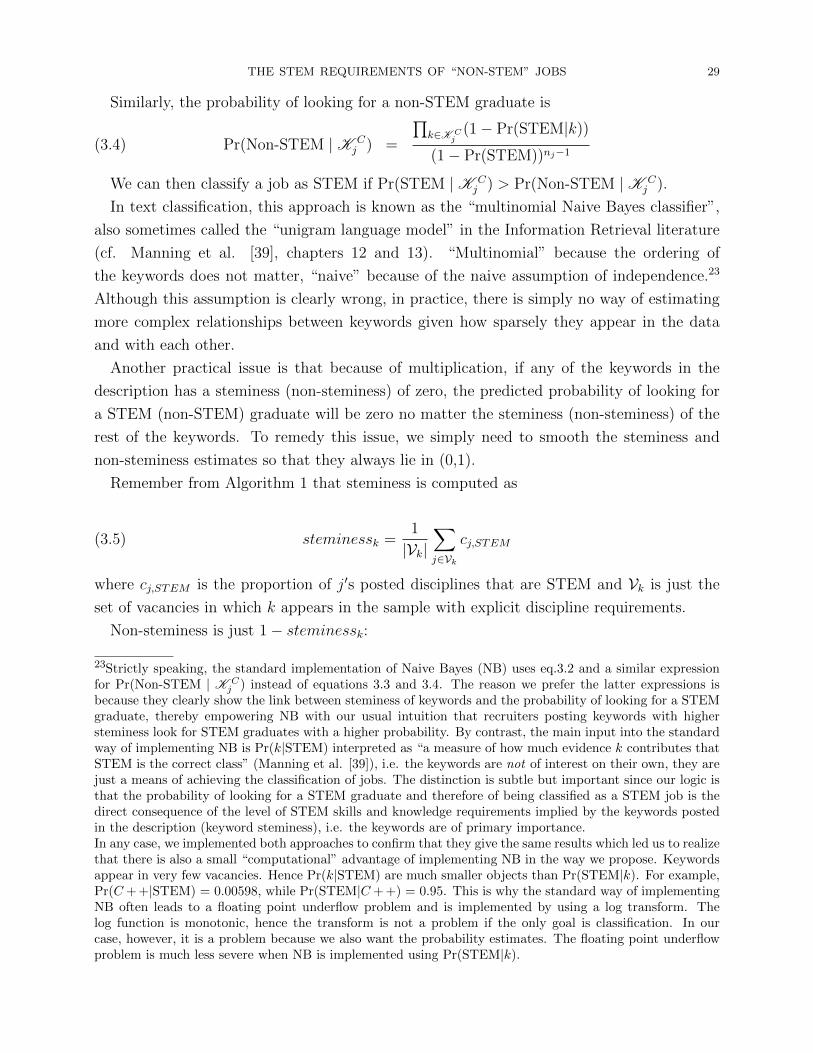
Remember from Algorithm 1 that steminess is computed as
(3.5) steminessk =1
|Vk|∑j∈Vk
cj,STEM
where cj,STEM is the proportion of j′s posted disciplines that are STEM and Vk is just the
set of vacancies in which k appears in the sample with explicit discipline requirements.
Non-steminess is just 1− steminessk:
23Strictly speaking, the standard implementation of Naive Bayes (NB) uses eq.3.2 and a similar expressionfor Pr(Non-STEM | K C
j ) instead of equations 3.3 and 3.4. The reason we prefer the latter expressions isbecause they clearly show the link between steminess of keywords and the probability of looking for a STEMgraduate, thereby empowering NB with our usual intuition that recruiters posting keywords with highersteminess look for STEM graduates with a higher probability. By contrast, the main input into the standardway of implementing NB is Pr(k|STEM) interpreted as “a measure of how much evidence k contributes thatSTEM is the correct class” (Manning et al. [39]), i.e. the keywords are not of interest on their own, they arejust a means of achieving the classification of jobs. The distinction is subtle but important since our logic isthat the probability of looking for a STEM graduate and therefore of being classified as a STEM job is thedirect consequence of the level of STEM skills and knowledge requirements implied by the keywords postedin the description (keyword steminess), i.e. the keywords are of primary importance.In any case, we implemented both approaches to confirm that they give the same results which led us to realizethat there is also a small “computational” advantage of implementing NB in the way we propose. Keywordsappear in very few vacancies. Hence Pr(k|STEM) are much smaller objects than Pr(STEM|k). For example,Pr(C + +|STEM) = 0.00598, while Pr(STEM|C + +) = 0.95. This is why the standard way of implementingNB often leads to a floating point underflow problem and is implemented by using a log transform. Thelog function is monotonic, hence the transform is not a problem if the only goal is classification. In ourcase, however, it is a problem because we also want the probability estimates. The floating point underflowproblem is much less severe when NB is implemented using Pr(STEM|k).
THE STEM REQUIREMENTS OF “NON-STEM” JOBS 30
(3.6) non− steminessk =1
|Vk|∑j∈Vk
cj,Non−STEM
because cj,STEM + cj,Non−STEM = 1.
A simple way of smoothing is just to add a number to both steminess and non-steminess
(Manning et al. [39], chap. 11). In our case, we can always let the keyword appear in at
least one vacancy with perfectly mixed discipline requirements:
(3.7) steminessk =1
|Vk + 1|
∑j∈Vk
cj,STEM + 0.5
(3.8) non− steminessk =1
|Vk + 1|
∑j∈Vk
cj,Non−STEM + 0.5
Smoothing in this ways is like putting a uniform prior on whether the keyword appears
with STEM or non-STEM disciplines and then letting the data update it. In any case, the
correlation between smoothed and unsmoothed estimates for the 9566 classifiable keywords
is over 0.98.
Note that because of smoothing and violations of the independence assumption, the prob-
ability estimates from equations 3.3 and 3.4 may be above one and not sum to one. However,
we can simply normalize them as follows:
(3.9) Pr(STEM | K Cj ) =
Pr(STEM | K Cj )
Pr(STEM | K Cj ) + Pr(Non-STEM | K C
j )
where:
Pr(STEM | K Cj ) =
∏k∈K C
jsteminessk
Pr(STEM)nj−1(3.10)
and
Pr(Non-STEM | K Cj ) =
∏k∈K C
j(non− steminessk)
(1− Pr(STEM))nj−1(3.11)
and similarly for Pr(Non-STEM | K Cj ). The correlations reported in Table 6 are with these
normalized probability estimates.
As we can see the Naive Bayes approach (model 4) does quite well on our data: a correct
classification rate of 89.38% and a correlation of 0.787. The last histogram in Fig. 3.4 suggests
THE STEM REQUIREMENTS OF “NON-STEM” JOBS 31
that the pattern of predicted probabilities matches the distribution of the percentages of
STEM discipline requirements quite well.
Another remarkable finding is that the correlation between STEM jobs identified using
Naive Bayes and those identified using our preferred logistic regression with mean and max
steminess as the predictors is 0.963. The correlation between their predicted probabilities is
even higher: 0.968. This indicates that the two methods identify almost the same jobs as
STEM and gives us confidence that a classification established with either of them will be
accurate.24
3.2.2. Out-of-sample performance & benchmarking against other ML algorithms. At this
point, the reader may have the following concerns about our strategy of classifying jobs
into STEM and non-STEM:
(1) Endogeneity: the tests conducted in Table 6 are in-sample because the sample with
explicit discipline requirements and keywords (VD ∩ VK) used to evaluate our jobs
classification strategies is the same sample that we use to compute steminess. How
well do our preferred algorithms perform out-of-sample, i.e. on data that has not
been used to estimate steminess? This is an important question since our ultimate
goal is to classify all 33 million UK vacancies in our data, most of which do not have
explicit discipline requirements, i.e. won’t be used to estimate steminess for the final
classification.
(2) Unclassified keywords: 15% of all keywords in the BGT taxonomy never appear with
explicit discipline requirements and are therefore unclassified. How does this affect
the performance of our algorithms?
(3) Steminess vs. keywords: our classification methods employ the steminess of all key-
words in a vacancy description to either compute the mean and max steminess and
use them as predictors in a logistic regression model, or to construct the probability
estimate using Bayes formula and the naive assumption. A valid question is why not
simply use the keywords directly instead of steminess to estimate the probability of
looking for a STEM graduate?
We address these concerns by implementing and replicating 50 times the following experi-
ment: we select 250,000 unique vacancies at random from the sample with non-mixed disci-
pline requirements and keywords and split them into training (200,000 vacancies) and test
(50,000) samples. To achieve a fair comparison, all methods discussed in this subsection are
implemented on the same set of 50 randomly selected samples of 250,000 vacancies each.
24We tried an ensemble classifier which labelled a job as STEM only if both methods agreed on its classifi-cation. However, the performance of this ensemble classifier was not better in terms if overall classification:89.41%. Hence, there seems to be no point in pursuing in this direction.
THE STEM REQUIREMENTS OF “NON-STEM” JOBS 32
Table 8: Out-of-sample performance and Benchmarking
Model % Correctlyclassified
% Misclas.into STEM
% Misclas.into
non-STEM
ComputingTime
(hh:mm:ss)
ComputerMemory
(Gigabytes)
% Failed
(1) Mean + Max reg. 89.53 9.71 11.26 00:05:35 4.70 0[0.134] [0.198] [0.191] [00:00:43] [0.001]
Notes: Bootstrapped standard errors in brackets. Averages over 50 runs of the experiment shown. The same set of 50randomly selected samples of 250,000 vacancies each (split into 200,000 vacancies for the training sample and 50,000 forthe test one) was used to evaluate all methods. All R scripts were submitted to the same High Performance Computingcluster and the statistics presented here are those that were output by the system once the jobs had been completed.The RTextTools package (Boydstun et al. [10]) was used for the implementation of the standard classification methods.As discussed in [10], this package employs a set of optimized algorithms, in particular the SparseM package by Koenkerand Ng [37]. The R code for the implementation of all the algorithms is available on request. Computing timecorresponds to the user time which is the time spent on executing the script’s code lines. “User time” is typicallyreported for algorithmic benchmarking and performance analytics because it does not count the “System time” - timespent by the system on opening the files (which in our case was 8 sec or less for the first two methods that employsteminess and between 33 sec and 3 min 45 sec for the standard algorithms).
The results are summarized in Table 8 which reports the average correct classification
and misclassfication rates over all the replications and the bootstrapped standard errors in
brackets. We now discuss in turn why this out-of-sample experiment addresses each point
just identified:
Issue (1) is addressed directly since we are implementing out-of-sample tests. Each time,
the 200,000 vacancies in the training sample are used to train the algorithm, e.g. for the
first method, to estimate steminess for all keywords, then run the logistic regression with
mean and max steminess as the predictors. The trained model is then used to predict the
outcomes for the test sample of 50,000 vacancies. The statistics reported in Table 8 are based
on the performance of our algorithms on these latter test vacancies only. It is reassuring to
THE STEM REQUIREMENTS OF “NON-STEM” JOBS 33
see that both of our preferred methods perform as well out-of-sample as they did in-sample,
with almost 90% correct classification rates.
For the second issue, note that out-of-sample tests recreate the situation of having a certain
proportion of unclassified keywords and therefore allow us to gauge the extra degree of
misclassification generated by not being able to classify all keywords. Concretely, in our
experiment, the training samples contained an average of 6810 distinct keywords. The test
samples had on average 5210 distinct keywords, of which an average 244 were undefined.
On average, 49999 vacancies were classified each time (i.e. one of the vacancies could not
be classified because none of its keywords could be defined). The extra misclassification
introduced by not being able to define all keywords happens to be very small since the
average percentages of vacancies classified correctly in-sample are only slightly higher than
the out-of-sample ones shown in Table 8: 89.73% for the logistic regression with mean and
max steminess as the predictors, and 89.78% for Naive Bayes.
To address issue (3), we implemented several standard machine learning algorithms, often
employed for supervised text classification.25 The one thing they have in common is that
they use the keywords directly, i.e. their implementation starts with the creation of a so-
called “document-term” matrix (more precisely a “vacancy-keyword” matrix in our case)
whose elements are 0-1 vectors that record for each vacancy the keywords collected from its
description. The idea is then to divide the keywords (“the input space”) into a collection of
regions labelled as STEM and non-STEM (cf. Friedman et al. [35], chapt. 4). The methods
differ in how exactly this division is made. For instance, logistic regression with keywords as
predictors (and regularized versions thereof) or linear discriminant analysis (LDA) have linear
decision boundaries. In support vector machines (SVM), a non-linear hyperplane separates
STEM and non-STEM regions, allowing for some misclassifications that we can control with
a cost parameter. Tree-based methods are called so because they try to segment the input
space into a number of non-overlapping regions through a set of splitting rules that can be
summarized in a tree. Bagging, Boosting and Random Forests are just more complex variants
of the plain tree, which involve producing multiple trees, then combining them in order to
yield consensus predictions.
A remarkable finding in Table 8 is that a logistic regression with almost 7,000 distinct
keywords as the predictors (model (3)) achieves a 2.4% pts. lower correct classification rate
than a logistic regression with just two predictors: the mean and the max steminess (model
(1)). Moreover, it is much more computationally intensive: when the keywords are used
25Gareth et al. [34] is an excellent introduction into statistical learning. Friedman et al. [35] provide a moreadvanced treatment of a similar set of topics. In terms of books specifically focused on text analysis, we referthe reader to Feldman and Sanger [21] and the fascinating book on information retrieval by Manning et al.[39].
THE STEM REQUIREMENTS OF “NON-STEM” JOBS 34
directly in the logistic regression, the average run of the experiment takes almost 5 hours
instead of a bit more than 5 minutes, and consumes over 10 more gigabytes.
Tree methods perform worse than our preferred algorithms. Although they misclassify very
few non-STEM vacancies into STEM, this comes at a high price of mislabelling around half
of STEM vacancies as non-STEM. The very large misclassification into non-STEM occurs
because of the way in which trees work: they use the presence of a keyword in a vacancy
description as a split condition. Hence, many STEM vacancies are mistakenly assigned to
the non-STEM group simply because they contain certain keywords that also happen to be
often found in non-STEM vacancies.
The only two methods that seem to perform slightly better than the steminess-based
classification algorithms are LDA and SVM . However, this performance comes at a much
higher computational cost: 8h32 and 95.8 gigabytes on average for LDA, 9h26 and 14.8
gigabytes for SVM. By contrast, our preferred methods take on average less than 6 minutes
and less than 5 gigabytes in each replication of the experiment. We relied on the RTextTools
package by Boydstun et al. [10] for the implementation of models (3) to (10). Although, this
package employs a set of optimized algorithms, in particular those developed by Koenker and
Ng [37] and contained in the SparseM package, there could certainly be more efficient ways of
implementing the standard machine learning algorithms considered here both in R or other
programming environments. Nonetheless, the computational complexity of these methods
is well studied and documented (cf. Manning et al. [39] and Friedman et al. [35], as well
as references therein). The problems become especially acute when the input space is high
dimensional and sparse, which is precisely our case: as both the number of distinct keywords
and vacancies grow, the “vacancy-keyword” matrix becomes increasingly sparse because even
the median keyword appears in very few postings (less than 0.002% in the sample of vacancies
with explicit discipline requirements and keywords, which is the sample on which the final
classification method is trained). Note that regularization (e.g. Lasso, Ridge) here does not
help for two reasons: the optimally selected penalty (though cross-validation) is close to zero.
More importantly, even if we remove 50% of all keywords, we are still left with a very sparse
matrix.
This “sparse sampling in high dimensions” is often referred to as the “curse of dimension-
ality” (Friedman et al. [35]) and is also the reason why many methods (models (8)-(11) in
Table 8) simply fail. For instance, we tried kNN with different numbers of neighbours; how-
ever the method failed because in our data few vacancies have many overlapping keywords
so that the nearest neighbours are numerous but not “close to the target point” (Friedman
et al. [35]).
Indeed, a conceptually more important problem with using the keywords directly is that
this approach treats all the thousands of distinct keywords as completely separate dimensions,
THE STEM REQUIREMENTS OF “NON-STEM” JOBS 35
i.e. it does not allow a keyword like “Budgeting” to be closer to “Budget Management” than
to “Java”.
Employing keyword steminess instead of using the keywords directly is like introducing
one extra step in-between the keywords and the prediction about whether the job is STEM
or not. However, this extra step solves all the problems. The vacancy-keyword matrix is
not needed which saves a lot of computing power. The logistic regression problem is much
simpler in model (1) than model (3) because the predictive relationship is built from just
two continuous predictors (mean and max steminess) instead of several thousands of dummy
variables. In terms of steminess, “Budgeting” (65.59%) is indeed much more similar to
“Budget Management” (63.80%) than to “Java” (95.13%).
Finally, throughout this section, we spent a lot of effort building the intuition behind the
concept of steminess, the context mapping method for classifying keywords and eventually
the steminess-based classification methods for the jobs. By contrast, the intuition underly-
ing most standard machine learning methods presented here seems less straightforward since
many of them were developed with the only goal of yielding accurate predictions, not nec-
essarily being used for inference (Gareth et al. [34]). They treat the keywords as simple
features, with no interest in classifying them or understanding how and why they should or
should not be associated with the probability of looking for a STEM graduate, while the
precise mechanisms used to split these keywords so as to form predictions for the jobs remain
a bit of “black boxes”.
3.2.3. Job Titles. While 90% of vacancies have at least one keyword collected from their
online description, the job title is available in 100% of the cases (cf. Table 1). Employing
keywords from the job titles could therefore not only improve our classification accuracy, but,
more importantly, should allow us to classify more vacancies.
Unlike the vacancy descriptions which are already in the form of sets of keywords in our
data, the job titles appear as sentences, e.g.: “Principal Civil Engineer”, “Uk And Row
Process Diagnostic Business Manager”, “Nurse Advisor”...
We therefore start by tokenizing them, i.e. “chopping character streams into tokens”
(Manning et al. [39]). For instance, tokenizing:
“Uk And Row Process Diagnostic Business Manager”
gives the following set of keywords:
“Uk - And - Row - Process - Diagnostic - Business - Manager”
This produces a list of over 143,000 distinct keywords which contains a lot of noisy terms,
e.g. “aaa”. To reduce and clean it, we implement several natural language processing steps.
Firstly, we match whatever we can with the keywords from the BGT taxonomy. Another
advantage of doing this is to increase the number of vacancies in which a given keyword
from the BGT taxonomy appears. For the remaining keywords, we only focus on those
THE STEM REQUIREMENTS OF “NON-STEM” JOBS 36
Table 9: Including keywords from job titles
2012 2013 2014 2015 2016
% with >= 1 Classified Keyword 99.92 99.79 99.83 99.85 99.82No. of unique keywords 27025 28218 28485 29567 27599Number of Keywords per Vacancy (conditional on at least one classified):Median 7 7 7 7 7Mean 8.72 8.65 8.91 8.89 8.72
Notes: 2016 includes data up to (and excluding) August only. Classified Keywords include 9566keywords from the BGT taxonomy and 20,265 tokens from the job titles.
appearing in at least 10 postings. These simple steps already remove a lot of idyosincratic
noise and reduce the list down to 20,615 unique keywords. We then remove punctuation
marks, numbers, special characters, transform the tokens to lower space, and delete English
stop words (e.g. “and”, “I”, “very”, “after”, etc.).26
For instance, the above title becomes:
“uk - row - process - diagnostic - business - manager”
We add the resulting tokens to the BGT taxonomy as extra features, so that the final
classification of vacancies is based on 29,831 unique keywords - 9566 from the original BGT
taxonomy and 20,265 from the job titles.
As shown in Panel C of Table 6, in-sample performance of our preferred classification
methods jumps above 90%. However the real advantage of including keywords from job titles
can be seen by comparing Tables 1 (Panel B) and 9. Now almost 100% of all vacancies have
at least one classified keyword. The mean and median numbers of classified keywords per
vacancy increase from to 5 and 6 to 7 and almost 9 respectively.
In what follows we use the Naive Bayes method with keywords from both the BGT tax-
onomy and the job titles to classify vacancies. The results employing the mean and max
steminess regression for the classification of jobs are almost identical, since, as already dis-
cussed, both methods have an above 0.96 correlation for both the STEM jobs identified and
the probability estimates.
4. STEM Jobs In the UK
Having designed and tested algorithms that classify both keywords and jobs into STEM
and non-STEM with a 90% correct classification rate for the jobs, we can now finally start
exploring our main questions of interest: what percentage of STEM jobs are in non-STEM
26Sanchez [46], Baayen [4] and Feinerer et al. [20] are excellent references on text processing and analysisin R. Natural language processing R packages used in this project include stringi (Gagolewski and Tartanus[28]), stringr (Wickham [49]), tm (Feinerer et al. [19]), NLP (Hornik [33]), and quanteda (Benoit [7]).
THE STEM REQUIREMENTS OF “NON-STEM” JOBS 37
Table 10: STEM jobs vs. STEM occupations
2012 2013 2014 2015 2016 Total
No. STEM jobs 1949791 2235445 1815294 2655532 1865435 10521497
No. STEM jobs in Non-STEM occ. 633578 798933 643232 914609 645961 3636313
No. STEM jobs in STEM occ. 1316213 1436512 1172062 1740923 1219474 6885184
No. jobs in STEM occ. 1580088 1764163 1495158 2146155 1500800 8486364
% of STEM jobs inSTEM occupations 67.51 64.26 64.57 65.56 65.37 65.44Non-STEM occupations 32.49 35.74 35.43 34.44 34.63 34.56
Notes: Based on the sample of vacancies with a UK SOC identifier (99.5% of all vacancies posted). For the listof STEM occupations cf. Footnote 16. 2016 includes data up to August only.
occupations? Are STEM jobs associated with higher wages? What, if anything, distinguishes
STEM jobs in STEM vs. non-STEM occupations?
When documenting occupational and geographic distributions, we consider the following
two indicators of STEM importance.
Let A be an occupation or a county:
(1)
STEM density of A = 100× #(STEM jobs in A)
#(jobs in A)
(2)
% STEM jobs in A = 100× #(STEM jobs in A)
#(STEM jobs)
While the percentage of STEM jobs simply describes how STEM jobs are distributed across
occupations/counties, the STEM density measures the relative importance of STEM within
an occupation/county. The higher the STEM density, the bigger the proportion of recruiters
within this occupation/county that require STEM skills and knowledge.
4.1. Occupational distribution. The first goal of this paper is to go beyond STEM occu-
pations and quantify the demand for STEM at the level of jobs. Table 10 therefore presents
our main results which indicate that it is wrong to equate STEM demand with STEM occu-
pations.
Firstly, the overall number of STEM jobs is larger than the number of jobs in STEM oc-
cupations. For instance, in 2015, focusing exclusively on STEM occupations leads to under-
stimating the true demand for people with a STEM education by half a million employment
opportunities.
THE STEM REQUIREMENTS OF “NON-STEM” JOBS 38
Secondly, around 35% of all STEM jobs are in non-STEM occupations. Hence, the fact
that over half of STEM graduates work in non-STEM occupations may be less problematic
than often thought if most STEM graduates working in non-STEM occupations are actually
in STEM jobs.
As expected, a much larger proportion of jobs within STEM occupations are STEM than
within non-STEM ones: 81% vs. 15%. However, these aggregate numbers conceal an impor-
tant amount of heterogeneity illustrated in Figure 4.1 which shows the distribution of STEM
densities at the four-digit UK SOC level.
Table 15 in the Appendix contains the precise numbers for 2015. The third column in
this table is a dummy indicator for whether or not the occupation is typically classified as
STEM. Given the absence of a consistent “official” classification of four-digit occupations
into STEM and non-STEM, we decided to merge together the lists from several widely cited
UK studies: UKCES [23], Mason [41], BIS [8] and Greenwood et al.[30] (for the resulting full
list of STEM occupations, cf. Footnote 16).
When interpreting the STEM densities of various occupations, it is important to remember
that while we take the STEM acronym literally, some of these studies have a broader definition
of STEM, which goes beyond Sciences, Technology, Engineering and Mathematics and also
includes subjects like Medicine, Architecture, Environmental Studies, Psychology etc. Hence,
in some cases, for instance Pharmaceutical technicians (3217), we find a low STEM density
in a STEM occupation precisely because of this broader STEM definition effect. In other
cases, however, e.g. Information technology and telecommunications directors (1136), Quality
assurance and regulatory professionals (2462), the relatively low STEM density suggests that
the occupation is less STEM intensive than typically thought.27
The list of non-STEM occupations with relatively high STEM densities is very diverse.
For instance, in 2015, 46.84% of Business, research and administrative professionals n.e.c.
jobs were identified as STEM. 45.62% of Product, clothing and related designers, and even
23.46% of Artists looked for STEM graduates. This finding recalls another passage from
Matthew Sigelman’s inspiring essay on “Why the STEM Gap is Bigger Than You Think”
[47] where the opening quote also comes from: “the list [of job categories where employers
demand coding skills] includes Artists and Designers, which once would have been considered
the antithesis of STEM roles.”
Perhaps surprisingly for the literature, where financial occupations are typically considered
as the main non-STEM group poaching STEM graduates, none of them is actually top of the
list in terms of STEM density. For instance, among the seven occupations defined as financial
27Another caveat to bear in mind is that there may be some misclassifications in our data because of imper-fections in the collection process and/or errors in the online postings themselves. Moreover, as established inthe previous section, our classification algorithm has a 90% correct classification rate, hence it misclassifiesaround 10% of jobs.
THE STEM REQUIREMENTS OF “NON-STEM” JOBS 39
Figure 4.1 STEM density of STEM and Non-STEM Occupations
Notes: STEM density is the percentage of jobs within an occupation that are STEM. All years combined:an observation is a four-digit occupation-year STEM density.
in Chevalier [14], Management consultants and business analysts is the one with the highest
percentage of STEM jobs in 2015: 25.33%, followed by Financial and accounting technicians
with 11.67%. Only 7.59% of Finance and investment analysts and advisers specifically look
for STEM graduates. The reason may be that, within the UK education system, the “nu-
merical skills” for which financial occupations are thought to be seeking STEM graduates
are actually also often transmitted to non-STEM graduates in, e.g., Finance or Economics
degrees. Hence, although numerous jobs in financial occupations may end up being filled
with STEM graduates, when posting their vacancy, not many financial recruiters actually
describe the job as one that could only be undertaken by someone with a STEM education.
The main focus of this paper is on “high-level” STEM jobs - STEM jobs belonging to Man-
agerial, Professional and Associate professional positions which typically require a university
degree - because they constitute 74% of all STEM jobs (cf. fourth column of Table 11, occu-
pation codes 11 - 35), but also because this is where the biggest expenses on STEM education
are and where the STEM pipeline leakage is therefore most problematic.
However, Table 11, which compares the occupational distributions of STEM jobs vs. jobs
in STEM occupations at the two-digit level of the UK SOC, suggests that many lower skill
occupations with relatively high STEM densities are completely missed in the existing classi-
fications of STEM occupations. Indeed, almost all four-digit occupations identified as STEM
in the studies by BIS [8] and Mason [41] that investigate vocational STEM skills and appren-
ticeship training, belong to Skilled Metal, Electrical and Electronic Trades (cf. Table 11, fifth
THE STEM REQUIREMENTS OF “NON-STEM” JOBS 40
Table 11: Occupational distribution of STEM jobs in 2015
Code Name STEMdensity
% of STEMjobs in
% jobs inSTEM occ.
11 Corporate Managers and Directors 24.31 4.33 15.82
12 Other Managers and Proprietors 29.59 2.79 0.16
21 Science, Research, Engineering and TechnologyProfessionals
85.26 39.73 99.77
22 Health Professionals 1.63 0.24 3.23
23 Teaching and Educational Professionals 2.99 0.3 0
24 Business, Media and Public Service Professionals 25.45 6.82 14.8
31 Science, Engineering and Technology AssociateProfessionals
76.12 11.46 100
32 Health and Social Care Associate Professionals 5.92 0.23 15.22
33 Protective Service Occupations 24.47 0.13 0
34 Culture, Media and Sports Occupations 15.73 0.98 0
35 Business and Public Service Associate Professionals 16.04 6.97 1.93
41 Administrative Occupations 5.93 1.27 0
42 Secretarial and related Occupations 4.05 0.28 0
51 Skilled Agricultural and related Trades 20.58 0.09 0
52 Skilled Metal, Electrical and Electronic Trades 89.79 9.23 94
53 Skilled Construction and Building Trades 61.92 2.29 24.33
54 Textiles, Printing and other Skilled Trades 8.45 0.57 0
61 Caring Personal Service Occupations 1.61 0.18 0
62 Leisure, Travel and related Personal ServiceOccupations
7.44 0.26 0
71 Sales Occupations 12.53 1.88 0
72 Customer Service Occupations 6.93 0.43 0
81 Process, Plant and Machine Operatives 60.38 4.74 0.21
82 Transport and Mobile Machine Drivers andOperatives
35.88 2.25 0
91 Elementary Trades and related Occupations 57.81 1.4 0
92 Elementary Administration and ServiceOccupations
12.21 1.16 0
Notes: Based on the sample of vacancies with a UK SOC identifier (99.5% of all vacancies posted). 2-digit UKSOC Classification.
column). However, our analysis suggests that STEM skills required in Skilled Construction
and Building Trades and Process, Plant and Machine Operatives occupations should also
receive more attention in future work since they represent together around 7% of STEM jobs
and have STEM densities above 60%.
THE STEM REQUIREMENTS OF “NON-STEM” JOBS 41
These findings echo a recent US study by Rothwell [45] who argues that: “previous re-
ports on the STEM economy indicate that only highly educated professionals are capable of
mastering and employing sophisticated knowledge in STEM fields. Classifying STEM jobs
based on knowledge requirements, however, shows that 30 percent of today’s high-STEM jobs
are actually blue-collar positions. As defined here, blue-collar occupations include installa-
tion, maintenance, and repair, construction, production, protective services, transportation,
farming, forestry, and fishing, building and grounds cleaning and maintenance, healthcare
support, personal care, and food preparation.”
The reason why Rothwell identifies this category of STEM employment is because he
uses a very different way of identifying STEM occupations, based on data from the O*NET
(Occupational Information Network Data Collection Program) - a comprehensive database
developed by the US Department of Labor, “which uses detailed surveys of workers in every
occupation to thoroughly document their job characteristics and knowledge requirements.”
Rothwell focuses on O*NET Knowledge scales for Biology, Chemistry, Physics, Computers
and Electronics, Engineering and Technology, and Mathematics. These scales are constructed
by asking around 24 workers from each occupation to rate the level of knowledge required
to do their job. For instance, the survey asks the worker: “What level of knowledge of
Engineering and Technology is needed to perform your current job?” It then presents a 1-
7 scale and provides examples of the kinds of knowledge that would score a 2, 4, and 6.
Installing a door lock would rate a 2; designing a more stable grocery cart would rate a 4;
and planning for the impact of weather in designing a bridge would rate a 6 (O*NET [24]).
In some sense, our keywords-based approach of identifying STEM jobs is akin to surveying
not workers as in O*NET, but employers, and this explains why our results also reflect all
the “diversity and depth of the STEM economy”.
4.2. Spatial distribution. Existing studies indicate that London is a “magnet of STEM
workers at the expense of other parts of the country”. For instance, Bosworth et al. [9]
analyse commuting data and find that London has a net gain of 87,000 Core STEM workers,
while the South East, East of England and East Midlands record substantial net losses.
Although London is over-represented in the BGT sample relative to official employment
data (cf. Table 18 in the Appendix), the first map in Figure 4.2 shows that it still has by
far the greatest concentration of all STEM vacancies, explaining why it may be so attractive
to STEM educated job seekers. In 2015, London concentrated 22% of all STEM vacancies
with the next biggest demand for STEM knowledge and skills coming from West Midlands
(which includes Birmingham and Coventry) with only 5.5% of STEM vacancies, followed by
Greater Manchester (3.6%) and West Yorkshire (3.5%). Less than 3% of STEM vacancies
were located in any other county.
THE STEM REQUIREMENTS OF “NON-STEM” JOBS 42
Figure 4.2 The geographical locations of STEM vacancies in 2015
% of STEM jobs in each county STEM density of each county
Notes: Based on the sample of 77.8% of all vacancies with County identifiers in 2015. London includes the 32London boroughs and the City of London. STEM density is the % of jobs within a county that are classifiedas STEM.
In terms of STEM density (second map), the picture is less clear-cut. In 2015, London
had a STEM density of 29.97%, while Cambridgeshire came top with 45.51%. Note that
none of the counties had a STEM density below 10%, suggesting that at least some STEM
knowledge and skills are required in every UK county.
Interviews with STEM employers, analysed in Bosworth et al. [9], reveal that some of them
experience hiring difficulties “because their location is outside of London”. Hence, the overall
THE STEM REQUIREMENTS OF “NON-STEM” JOBS 43
message from previous studies and the spatial distribution of STEM vacancies analysed here
could be that many STEM workers may move to London thinking that it would be easier for
them to find a STEM job there since London concentrates over 20% of all STEM vacancies.
This, however, induces shortages in some areas since most UK counties need at least a certain
proportion of their workforce to possess STEM knowledge and skills.
4.3. The wage premium for STEM. To examine whether or not STEM jobs are associ-
ated with higher wages in the labour market, we run simple linear regressions like:
(4.1) logwj = α + βSTEMj + γXj + εj
(4.2) logwj = α + βPr(STEM | K Cj ) + γXj + εj
where wj is the hourly wage, STEMj is an indicator for whether the job is classified as
STEM, Pr(STEM | K Cj ) is the probability that the recruiter for vacancy j seeks a STEM
graduate conditional on the classifiable keywords K Cj collected from j’s online job advert,
and Xj includes controls, e.g. the pay frequency (daily, weekly, monthly...), the salary type
(base pay, commission, bonus...), the month and year of the posting, whether the job is
located in London, etc.
As shown in Table 1, the wage is posted explicitly in 61% of all job ads. However, intro-
ducing controls dramatically reduces the sample size, since, for instance, only 17% and 12%
of the postings have minimum education and experience requirements, 46% have industry
identifiers, etc. Hence, we present three sets of results: one obtained on a sample of almost
20 million vacancies, where we only require the vacancies to possess wage and four-digit UK
SOC occupation identifiers in addition to some basic controls (Table 12). The second set of
results, presented in Table 13, uses a much smaller sample of 222,451 postings in which we
also observe the one/two-digit industry identifier, the precise county, and minimum educa-
tion and experience requirements, and such that each occupation/industry combination has
at least 2 observations. In the final set (Table 14), we do not require the industry identifier
but require all the other controls already mentioned as well as the employer’s name. This
time, we ensure that each occupation/employer cell has at least 2 observations, which results
in a sample of 62,511 observations.28For each year, we also drop the postings with the 1%
lowest wages to remove outliers.
The first column of Table 12 is a plain regression of log hourly wages on the STEM job
dummy with no controls. It suggests that, unconditionally, STEM jobs are associated with
28Requesting both the employer’s name and the industry identifier, and ensuring that each unique occupa-tion/industry/employer combination has at least two observations leads to a very small and unrepresentativesample dominated by a few large employers, like the NHS.
THE STEM REQUIREMENTS OF “NON-STEM” JOBS 44
28% higher wages. Remember that we define STEM jobs as those whose recruiters look for
STEM educated candidates with a higher probability than for non-STEM educated ones:
STEMj = I(Pr(STEM | K Cj ) > Pr(Non-STEM | K C
j ))
Hence, not all STEM jobs are such that the recruiters seek STEM graduates with a 100%
probability. A more flexible approach is therefore to use the probability of looking for a
STEM graduate instead of the discrete STEM job indicator, i.e. the specification in eq.4.2
instead of eq.4.1. As shown in column (2), the premium offered for seeking a STEM graduate
relative to a non-STEM one sharpens: a 10% pts. rise in the probability of looking for a
STEM graduate is associated with a 3% pts. rise in the wage, so that as we go from looking
for a non-STEM educated worker to seeking a STEM educated one, the wage offered rises
by 32%. Note that this latter specification with the continuous probability instead of the
discrete indicator also seems to provide a better description of the labour market dynamics
since the R2 rises from 5.5% to 5.9%.
The next column contrasts these results to the unconditional wage premium associated
with working in a STEM occupation: 29%.
Columns (4) to (6) replicate these three specifications but now introducing some basic
controls: a dummy for whether the job is located in London, the number of keywords in the
description and the job title, the month and year of the posting, the pay frequency and the
salary type. All estimates drop in size but remain highly significant. One of the reasons is
probably that, as indicated in the previous subsection, a substantial part of STEM jobs are
located in London, where wages are higher anyway because of higher living costs. Hence part
of what appears as the STEM premium in columns (1) to (3) is the London premium, which
disappears once we introduce the London dummy.
TH
EST
EM
RE
QU
IRE
ME
NT
SO
F“N
ON
-ST
EM
”JO
BS
45
Table 12: The wage premium for STEM: regressions with basic controls
∗p<0.1; ∗∗p<0.05; ∗∗∗p<0.01Notes: Standard errors in parentheses, clustered at the four-digit occupation level in columns (9) to (12). The wage is the average of the minimumand maximum hourly salaries posted. STEM job is a dummy for whether the job is classified as STEM. STEM occ. is a dummy for whether thejob belongs to a STEM occupation. Regressions (1)-(3) include constants. Four-digit UK SOC occupations used. No. Keywords is the number ofclassified keywords collected from the job description and the job title.
THE STEM REQUIREMENTS OF “NON-STEM” JOBS 46
Columns (7) and (8) consider specifications where we include together the STEM job
indicator or Pr(STEM | K Cj ), the STEM occupation dummy and an interaction between
them. Note that we are still not controlling for a full set of four-digit UK SOC occupations.
The results seem to indicate that there is a difference between the STEM premium offered
in STEM and non-STEM occupations. For instance, column (8) suggests that the recruiter
looking for a STEM graduate in a non-STEM occupation offers a 25.9% wage premium,
whereas in a STEM occupation, he would offer a 16.2% wage premium for the fact that this
is a STEM occupation and an additional 12.7% premium if looking for a STEM graduate,
i.e. a 28.9% wage premium overall for a STEM job in a STEM occupation. However, as we
introduce a full set of 368 four-digit UK SOC occupation dummies in columns (9) and (10),
the interaction term becomes insignificant suggesting that the premium for STEM in STEM
occupations is not statistically significantly different from the one in non-STEM occupations
once we account for occupation fixed effects (note that standard errors in columns (9) and
(10) are also clustered at the occupation level).
We continue by investigating whether different STEM domains command distinct premia
in columns (11) and (12). This is an interesting question in itself which has already been
investigated from the labour supply side in numerous papers. For instance, Greenwood et
al. [30], who analyse the Labour Force Survey between March 2004 and December 2010, find
that many qualifications have a higher labour market value if they are in a STEM subject.
However, this general finding conceals an important amount of heterogeneity in returns to
different STEM domains at different NQF levels. The authors conclude that “it is not enough
to urge young people to study STEM subjects: they also need to understand that some STEM
qualifications are more valuable than others.” Other interesting contributions include, for
instance, Webber [48] who looks at how average earnings vary by discipline in the US. Bratti
et al. [11] use a British cohort study from 1970 to estimate wage returns by major studied.
Gabe [27] takes a different approach. Instead of the discipline studied, he combines worker
knowledge requirements from the O*NET with wage and demographic information from the
U.S. Census American Community Survey. Although the results from all these papers are
not directly comparable because of different data and methods, a general finding seems to be
that sciences, especially Biology, Physics and Chemistry, are typically associated with lower
earnings than Computer Sciences and Engineering.
In our case, we investigate the heterogeneity in STEM wage premia by defining Biol-
ogy/Biomedicine, Computer Sciences, Engineering etc. indicators which are just equal to 1
if the vacancy description contains keywords belonging to the respective clusters (cf. Algo-
rithm 1 for how keywords are classified into different STEM clusters). Column (11) includes
occupation fixed effects and basic controls, but excludes the probability of looking for a
STEM graduate. Technology and Physics/Chemistry seem to be associated with negative
THE STEM REQUIREMENTS OF “NON-STEM” JOBS 47
wage premia, while the rest of STEM disciplines command positive ones. However, introduc-
ing the STEM probability and its interaction with the STEM occupation dummy in column
(12) attenuates all coefficients and turns the one on Biology/Biomedicine negative. Further
research could perhaps investigate heterogeneity in STEM wage premia in more details, how-
ever it is also important to remember that the separation of keywords into different clusters
is imperfect and the results presented here are therefore only indicative.
In Tables 13 and 14, we decided to concentrate on the continuous measure of STEM re-
quirements; the results with the discrete STEM job indicator are similar and available on
request. We start by reproducing the analogues of columns (2), (3) and (10) from Table 12
to show what these specifications give on these much smaller and less representative samples.
Columns (4) correspond to a regression that only includes full controls: education and expe-
rience requirements (in minimum years), a full set of counties instead of the London dummy,
four-digit UK SOC occupations, and either one/two-digit industry identifiers in Table 13 or
6054 unique employers in Table 14. Columns (5) add the STEM probability and its inter-
action with the STEM occupation indicator terms. Finally, the specification in columns (6)
also contains the different STEM domain dummies.
The main purpose of these sets of results is to show that the wage premium for STEM
does not disappear even after introducing detailed controls for many other observable char-
acteristics that affect wages. It certainly drops in magnitude as the influence of all these
other factors is taken into account, but remains highly significant. The interaction term
also remains insignificant. Most of the coefficients on the STEM domains in columns (6) go
in the same direction as before, even though statistical significance drops, especially in the
regression with employer fixed effects.
It is important to remember that all the results presented in this section are not causal
as there could be an unobserved omitted variable - an analogue of the “ability” bias on the
demand side, that is correlated with both wages and the probability of looking for a STEM
graduate and is confounding our estimates even conditional all the controls introduced in
Tables 13 and 14.29
Nevertheless, this section does provide evidence that controlling for detailed occupations,
industries, employers, geographical locations, education and experience requirements, STEM
jobs are still associated with higher wages in both STEM and non-STEM occupations, and
that, conditional on occupation fixed effects, the premium for STEM does not differ depend-
ing on whether the occupation is STEM or non-STEM.
29It does not seem very plausible though that a recruiter would simply post, say, “C++” in his job advert,just because he thinks that a candidate who knows how to code in C++ is more able than one who doesnot, and not because the job genuinely requires knowledge of C++ or some other equivalent software thatsomeone with knowledge of C++ could certainly easily learn.
THE STEM REQUIREMENTS OF “NON-STEM” JOBS 48
Table 13: The wage premium for STEM: regressions with industry controls
Dependent variable: log(wage)
(1) (2) (3) (4) (5) (6)
Pr(STEM | K Cj ) 0.236∗∗∗ 0.187∗∗∗ 0.125∗∗∗ 0.129∗∗∗
∗p<0.1; ∗∗p<0.05; ∗∗∗p<0.01Notes: Standard errors in parentheses, clustered at the occupation. The wage is theaverage of the minimum and maximum hourly salaries posted. Education &experience requirements are in years (minimum required). Four-digit UK SOCoccupations and one/two-digit SIC industries used.
THE STEM REQUIREMENTS OF “NON-STEM” JOBS 49
Table 14: The wage premium for STEM: regressions with employer controls
Dependent variable: log(wage)
(1) (2) (3) (4) (5) (6)
Pr(STEM | K Cj ) 0.306∗∗∗ 0.172∗∗∗ 0.037∗∗∗ 0.039∗∗∗
∗p<0.1; ∗∗p<0.05; ∗∗∗p<0.01Notes: Standard errors in parentheses, clustered at the employer level (6054 uniqueemployers). The wage is the average of the minimum and maximum hourly salariesposted. Education & experience requirements are in years (minimum required).Four-digit UK SOC occupations.
THE STEM REQUIREMENTS OF “NON-STEM” JOBS 50
As discussed in the introduction, previous studies often find that “STEM graduates [...]
earn more than non-STEM graduates - but only if they work in science or finance occupations”
(DIUS [17]). This finding is based on looking at the wages earned by STEM graduates without
distinguishing between those among them who take up STEM jobs and those who end up in
non-STEM ones. When looking from the labour supply side without making this important
distinction, the wage premium for STEM that exists within non-STEM occupations could
therefore be obscured since nothing prevents STEM graduates to take up non-STEM jobs, for
which non-STEM graduates are also perfectly qualified and for which they therefore receive
no premium. And, actually, 85% of all jobs within non-STEM occupations are non-STEM
and therefore do not offer any wage premium for STEM skills even if they end up being filled
with STEM graduates.
Hence, our results do not directly contradict, but rather extend previous findings. They
are important because they suggest that STEM skills are valued and continue to contribute
positively to productivity even within non-STEM occupations. Moreover, on the basis of
conventional supply and demand, our results seem to be consistent with a shortage of STEM
knowledge and skills across the economy and not only in STEM occupations.
4.4. The STEM requirements of “Non-STEM” jobs. We close this section by paint-
ing in more details the profile of STEM jobs belonging to non-STEM occupations which
constitute the main object of interest in this paper.
In particular, we start by examining the top STEM requirements of STEM jobs belonging
It seems that despite the fact that these recruiters are looking for STEM graduates with a
higher probability than for non-STEM ones, many of the STEM skills and knowledge they
require could actually be acquired with less training than a full-time STEM degree, and could
therefore be taught to non-STEM graduates in order to make them suitable candidates for
such positions.
Moreover, another interesting feature that distinguishes STEM jobs in STEM vs. non-
STEM occupations is the percentage of keywords in the job description that are STEM. In
STEM occupations, 60% of all keywords posted in a median STEM job advert are STEM,
while in non-STEM occupations, this number is only 30% (means are 59.38% and 35.29%
respectively).
Hence it seems that STEM recruiters within non-STEM occupations actually seek to com-
bine STEM and non-STEM knowledge and skills in a certain combination that lies in between
the STEM-dominated combination required in STEM occupations and the predominantly
THE STEM REQUIREMENTS OF “NON-STEM” JOBS 52
non-STEM one asked for in non-STEM jobs (cf. our discussion of “hybrid” jobs in the
Introduction).
5. Implications for STEM Skills & Knowledge Shortages
The previous section documents that a significant proportion of “non-STEM” employers
may specifically look for STEM graduates not because they simply value their “foundation
competencies”, “logical approach to solving problems” or believe that STEM graduates are
intrinsically more capable, but because a STEM education has equipped them with the skills
and knowledge needed to write programs in C++ and JavaScript, create digital designs,
develop user interfaces, work with Big Data, perform statistical analysis in SAS ... The
jobs these employers advertise require and value STEM knowledge and skills despite being
classified into “non-STEM” occupations. In reality, however, many of these STEM skills and
knowledge could be learned with training that is less advanced than a full-time STEM degree
and these “non-STEM” STEM recruiters actually want to combine them with non-STEM
knowledge & skills.
In this section, we develop an abstract framework to think about the implications of these
findings for higher education policies aimed at reducing STEM shortages. In particular,
we illustrate how the STEM shortages experienced by “non-STEM” employers with STEM
requirements and those that persist in traditional STEM occupations are related, and how
teaching more STEM in non-STEM disciplines could help alleviate both.
5.1. The Geometry of Skills & Knowledge Shortages. The first step in analyzing skills
and knowledge shortages is to define them.
Unfortunately, no clear and objective definition exists in the academic literature where
shortages are often understood as a phenomenon that “causes vacancies to remain open
longer” (Haskel & Martin [36]). Unfilled vacancies constitute “dynamic shortages” which
only persist until wages have risen such as to make enough people acquire the scarce skills
and bring the labour market into equilibrium once again (Arrow and Capron [2]).
However, hiring difficulties, unfilled vacancies, wage rises, etc. are all potential conse-
quences of shortages, not their proper definition. Hiring difficulties and unfilled vacancies
may occur for reasons unrelated to shortages, like inefficient human resource recruiters, im-
proper advertising of the job, etc., while raising wages is only one of many responses to
shortages. For instance, the 2016/2017 Talent shortage survey conducted by Manpower-
Group [40] indicates that only 26% of employers respond to shortages by “paying higher
salary packages to recruits”. At the same time, 53% decide to “offer training and devel-
opment to existing staff”, 36% “recruit outside the talent pool”, 28% “explore alternative
sourcing strategies”, 19% completely “change existing work models”, etc.
THE STEM REQUIREMENTS OF “NON-STEM” JOBS 53
Indeed, in practice, there is a great deal of confusion about both the meaning of shortages
and the reactions to them on both sides of the labour market.
Green et al. (1998) [29] analyse the Employer Manpower and Skills Practices Survey (EM-
SPS) where employers were asked separate questions about experiencing (a) skills shortages,
(b) difficulties in filling vacancies, and (c) deficiencies in the ‘qualities’ of their existing work-
force. They find only a partial overlap in the responses to these questions, concluding that
“to equate ‘skill shortage’ with ‘hard-to-fill vacancy’ may be a very risky assumption which,
if falsely made, could lead to unsafe conclusions”.
On the labour supply side, interviews and surveys of STEM students and graduates, anal-
ysed in BIS [42], reveal that most of them “start university with few career ideas”. They
typically choose to study a STEM discipline because of personal interest, enjoyment and/or
aptitude. In their sample, less than a quarter of STEM graduates chose their degrees for
“improved job prospects” and most of those who originally had career purposes in mind when
enrolling in a STEM discipline, did so to keep their career options open. When it comes to
applying for jobs, expected pay is certainly an important factor, but not the main motivating
force. STEM graduates look primarily for “interesting work”.30
Overall, it therefore remains unclear whether or not the potentially equilibrating wage
adjustment mechanism is being used by employers and/or actually translating into more
people acquiring the scarce skills and knowledge. In what follows, we therefore completely
set these mechanisms apart and start from a basic definition of what a shortage is.
According to the British Government’s Training Agency [1], a shortage occurs “when there
are not enough people available with the skills needed to do the jobs which need to be done”.
We shall now try to translate this definition into an abstract framework, then employ it
to conceptualize our empirical findings and think about education policies that could help
reduce STEM shortages experienced in STEM and non-STEM occupations.
5.1.1. Vacancies & Job seekers. Let V denote the set of vacancies (empty jobs). The skills
& knowledge requirements of any vacancy j ∈ V have two components:
• an absolute amount φvj
• a composition θvj : if skills & knowledge are m-dimensional, the composition required
by job j is the m× 1 vector:
θvj = (θvj1, θvj2, ..., θ
vjm)
such that∑m
l=1 θvjl = 1 and θvjl ∈ [0, 1] ∀l is the proportion of j’s overall requirements in the
l−dimension.
30The academic literature also contains many contributions showing that financial incentives have little orno impact of student learning choices at all education levels, cf. Fryer [26] and references therein.
THE STEM REQUIREMENTS OF “NON-STEM” JOBS 54
Figure 5.1 Skills & Knowledge space
Notes: V2 and V3 require the same
amount of skills & knowledge but differ-
ent compositions. V1 and V2 ask for the
same composition but different amounts.
Let Ω be the m-dimensional skills & knowledge space.
The location of vacancy j in Ω is determined by the
vector vj = φvjθ
vj with components vjl = φv
jθvjl.
Figure 5.1 illustrates the idea on a two dimensional
lattice.
Along each blue line (and we have only shown two for
clarity), the same amount of skills & knowledge but a
different composition are required. As we move from the
left to the right, the composition is tilted towards the
X dimension because its loading on the latter increases,
while the share allocated to the Y dimension decreases.
Along each green line, the same composition but a
different amount are required. As we move towards the
North-East, the amount of skills & knowledge required
increases.
For example, vacancies V2 and V3 require the same
amount of skills & knowledge φv2 = φv
3 = 6 but differ-
ent compositions. Vacancies V1 and V2 have the same
compositions θv1 = θv2 = (0.5, 0.5) but require different amounts.
Let S denote the set of job seekers. As with vacancies, the location of candidate i in the
space Ω is characterized by si = φsiθ
si where φs
i is the amount of skills & knowledge possessed
and θsi the m-dimensional composition vector.
An employer requiring amount φvj and composition θvj to fill vacancy j might be indifferent
between a certain subset of candidates located in Zj ⊂ Ω, where Zj could be influenced by
many things but, for clarity, is assumed to only depend on the vacancy’s location here, i.e.
Zj := Z(vj).
Formally, let ω = φθ be a generic element of Ω (which we denote as v and s when referring
to vacancies and graduates respectively).
Definition 1. The qualified subset for vacancy j, Zj is such that for any two elements ω 6= ω′
with ω ∈ Zj and ω′ ∈ Zj:
ω ∼j ω′
i.e. the recruiter for vacancy j is indifferent between the two in terms of knowledge and skills.
In practice, we could think of Zj as the subset of candidates for vacancy j such that it is no
longer differences in the knowledge & skills that these candidates possess which will be the
main determinant of the hiring decision. Other worker characteristics such as work styles,
personality will allow the recruiter to select the best fit for his vacancy. However, here we
THE STEM REQUIREMENTS OF “NON-STEM” JOBS 55
abstract from all this and concentrate on skills & knowledge in terms of which the candidates
all seem equally qualified to the employer.
The existence of such subsets implies that a candidate may be simultaneously qualified for
several vacancies belonging to the same or different occupations. In this case, the question
of establishing whether or not there are “enough” qualified people available to “do the jobs
which need to be done”, i.e. to fill all open vacancies, becomes non-trivial as we cannot
simply count the numbers of vacancies and job seekers at every ω and declare a shortage if
vacancies outnumber candidates.
To determine whether vacancies located at a specific point in the skills & knowledge space
experience a shortage, we start by characterizing the measure space in which vacancies and
job seekers coexist.
For simplicity, suppose that Ω is discrete.
The distribution of the job seekers defines a measure P on Ω. For instance, if the pool
of job seekers is such that none of them is located at ω, i.e. si 6= ω for all i ∈ S, we have
P (ω) = 0. More generally:
(5.1) P (ω) = |i ∈ S|si = ω| and P (Ω) =∑ω∈Ω
P (ω) = |S|
where |.| denotes the cardinality of a set.
In a similar way, we can define a measure Q for the distribution of the vacancies:
(5.2) Q(ω) = |j ∈ V|vj = ω| and Q(Ω) =∑ω∈Ω
Q(ω) = |V|
Definition 2. Vacancies located at ∆ ∈ Ω experience a shortage if:
(5.3) Q(∆) +∑ω∈H∆
Q(ω) > P (Z∆) +∑ω∈L∆
P (ω)
where H∆ := ω ∈ Ω|P (Zω ∩ Z∆) 6= 0, ω 6= ∆ and L∆ := ω ∈ Ω|ω ∈ Zu for u ∈ H∆, ω /∈Z∆. Note that since Zj := Z(vj), Zj = Zh = Z∆ for any j 6= h such that vj = vh = ∆.
The left hand side of eq.5.3 gives the total demand for candidates qualified for vacancies
located at ∆. The first term is simply the number of vacancies at ∆. The second one counts
all the other vacancies that also want to hire job seekers qualified for vacancies at ∆. This
subset of vacancies is denoted by H∆. On the right hand side, the first term gives the number
of candidates qualified for vacancies at ∆, while the second one adjusts this number for the
fact that vacancies in H∆, i.e. which compete with vacancies at ∆ for the job seekers in
Z∆, also have access to a pool of candidates that are qualified for them but unqualified for
vacancies at ∆, and for which they do not compete with ∆-vacancies.
THE STEM REQUIREMENTS OF “NON-STEM” JOBS 56
Example 3. To fully understand the condition for a shortage contained in eq.5.3, we can
look at a simple example with a two-dimensional space in which the problem can be inspected
visually.
For clarity, let’s also assume the following specific form for the qualified subsets, illustrated
in Figure 5.2:
(5.4) Zj = ω ∈ Ω|ωl > vjl,∀l = 1, ..., n
Intuitively, eq.5.4 corresponds to the subset of candidates who have at least as much skills &
knowledge in each dimension as what the vacancy requires.
Figure 5.2 Qualified subset
Notes: The shaded area marks the subset
of candidates who would be qualified for va-
cancy V1 according to eq. 5.4
In Figure 5.2, vacancy 1 is located at (5, 6), while the
job seekers are at s1 = (3, 8) and s2 = (7, 7). The shaded
area to the North-East of vacancy 1 corresponds to Z1 as
defined in eq.5.4. Only candidate 2 belongs to Z1. Candi-
date 1 is unqualified because s11 < v11. In particular, s1
has the right amount of skills & knowledge (φs1 = φv
1 = 11)
but the wrong composition: θs1 = (3/11, 8/11) versus
θv1 = (5/11, 6/11). The skills & knowledge composition
of s2 assigns equal weights to both dimensions. Although
the composition required by the vacancy is slightly tilted
towards the vertical dimension compared to the one pos-
sessed by s2, he is still qualified for the job according to
eq.5.4 because he has more overall skills & knowledge and
is located such that s21 > v11 and s22 > v11.
Example 4. Figure 5.3 illustrates how the condition for
determining the presence of a shortage in eq. 5.3 works in this simple abstract setting by
presenting three possible scenarios with two vacancies and two job seekers. Let the L, M,
and R - subscripts stand for its left, middle, and right panels.
In the left wing panel we have PL(ω) = 1 for ω = s1, s2 with s1 = (1, 6) and s2 = (4, 5)
and PL(ω) = 0 for any other ω ∈ Ω. For the vacancies, QL(ω) = 1 for ω = v1, v2with v1 = (2, 4) and v2 = (5, 1) and QL(ω) = 0 for ω 6= v1, v2. Note that vacancies require
exactly the same amount of skills & knowledge (φv1 = φv
2 = 6) but different compositions: θv1 =
(1/3, 2/3) and θv2 = (5/6, 1/6). Furthermore, the qualified subsets are such that PL(Z1) = 1
and PL(Z2) = 0. Vacancy 2 experiences a shortage since both potential candidates have
inadequate compositions despite having more skills & knowledge that what v2 requires: φs1 =
7 and φs2 = 9. Since PL(Z1 ∩ Z2) = 0, eq.5.3 reads: 1 + 0 > 0 + 0 at ∆ = v2 signaling a
shortage for vacancy 2. By contrast, vacancy 1 does not experience a shortage; the qualified
candidate is s2, and there is enough of him because he is not also qualified for vacancy 2.
THE STEM REQUIREMENTS OF “NON-STEM” JOBS 57
Figure 5.3 Illustrating the condition for shortages in eq. 5.3
Shortage for V2, not for V1 Shortages for both V1 and V2No shortages
Notes: Three possible scenarios with two workers and two vacancies in a two-dimensional skills & knowledgespace are illustrated. As S2 becomes qualified for both vacancies (going from the left to the middle panel),there is no longer “enough” of him, so that both V1 and V2 experience shortages. Moving from the middleto the right panel, both shortages are eliminated by simply making S1 qualified for V1, so that there areenough qualified workers at the level of the economy to simultaneously fill both vacancies.
Eq.5.3 in this case gives 1 + 0 ≤ 1 + 0 since QL(v1) = PL(Z1) = PL(s2) = 1 and the second
terms on both sides are still equal to 0 because PL(Z1 ∩ Z2) = 0.
In the middle panel, we simply change the location of s2 from (4, 5) to (5, 4), i.e. keeping
φs2 = 9 but slightly changing his skills & knowledge composition. Candidate 2 is now the only
qualified candidate for both vacancies and so there is no longer enough of him. Indeed, now
PM(Z1 ∩ Z2) = 1 and eq.5.3 becomes 1 + 1 > 1 + 0 for both vacancies, indicating shortages.
Finally, in the right wing of fig 5.3 we move job seeker 1 from (1, 6) to (2, 5), keeping
everything else as in the middle panel. s1 is now in Z1, i.e. qualified for vacancy 1, while still
remaining outside Z2. Graphically, it is obvious that there are no shortages because there are
enough qualified candidates to fill both vacancies simultaneously. Simply assign s1 to v1 and
s2 to v2. The condition for a shortage in eq.5.3 is violated for both vacancies. For vacancy
2, the equation reads 1 + 1 ≤ 1 + 1 since QR(v2) = 1, PR(Z2) = 1, and PR(Z1 ∩ Z2) = 1. It
is important not to forget the right hand side adjustment PR(s1) = 1. Indeed, although s2
seems to be over-demanded since he is qualified for both vacancies so that total demand for
him is QR(v1) + QR(v2) = 2, it would be wrong to conclude that v2 experiences a shortage
because s2 is the only qualified applicant for it. The reason is that, contrary to the situation
depicted in the middle panel, vacancy 1 now has an alternative qualified candidate: s1.
5.2. Implications for Higher Education provision policies. We can think about s2 as
the STEM graduate and s1 as the non-STEM graduate, X as the STEM dimension and Y
as the non-STEM dimension, v2 as the traditional STEM occupation STEM job, and of v1
as a “non-STEM” STEM job.
The above example illustrates two points:
THE STEM REQUIREMENTS OF “NON-STEM” JOBS 58
• the existence of a shortage cannot be established by looking at some vacancies and job
seekers in isolation, it has to take into account their interdependence at the level of
the economy. Hence, in order to understand why STEM shortages arise and propose
adequate policies to eliminate them, we need to go beyond STEM graduates and
STEM occupations, and include non-STEM graduates and non-STEM occupations.
• shortages can be solved by changing the location of “not-in-shortage” graduates: in
the middle panel of fig. 5.3, the skills & knowledge composition of s1 allocates too little
to the STEM dimension for him to be qualified even for v1- the “non-STEM” job that
nevertheless requires a certain amount of STEM knowledge and skills. Hence both v1
and v2 have to compete for s2. In the right panel, we simply change the composition
of s1 from (1/7, 6/7) to (2/7, 5/7) without adding any skills & knowledge. This solves
shortages for both v1 and v2 because they no longer have to compete for the STEM
graduate s2, and also gives a job to the non-STEM graduate.
These points imply that STEM shortages are not only about “not enough” STEM graduates,
but also about “not enough” STEM skills & knowledge taught in non-STEM disciplines.
A key implication is that the solution to STEM shortages is not only and necessarily to
encourage more students to enroll into STEM degrees, which many of them will avoid, how-
ever high the rewards may be, because following advanced STEM classes for several years
of their lives might be too difficult and/or uninteresting. Instead, introducing more manda-
tory, or at least optional, STEM modules into non-STEM disciplines could help alleviate
shortages by allowing students to enroll in non-STEM degrees while still graduating with the
employer-desired amount of STEM knowledge and skills. Furthermore, this policy could help
alleviate shortages in traditional STEM occupations, since if there are more non-STEM grad-
uates with appropriate STEM training, “non-STEM” STEM employers will be less likely to
look specifically for STEM graduates, who may therefore have to seek jobs in the traditional
STEM occupations more often.
6. Conclusion & Future Research
This paper aims to contribute to the debate on whether the fact that, in the UK, less than
half of STEM graduates work in non-STEM occupations should be considered as a problem
or not necessarily so, and, if yes, what type of education provision policy initiatives could
help resolve it.
We develop a new approach to identifying STEM jobs through the keywords collected
from online vacancy descriptions, and not, as is typically done, by classifying occupations
discretely into STEM vs. non-STEM, then considering all the jobs belonging to the first
group as “STEM” and the rest as “non-STEM”. This approach is made possible by having
THE STEM REQUIREMENTS OF “NON-STEM” JOBS 59
access to a large dataset, collected by the firm Burning Glass Technologies, which contains
information on all vacancies posted online in the UK between 2012 and 2016.
Our job level analysis shows that it is wrong to equate STEM jobs with STEM occupations:
35% of all STEM jobs belong to non-STEM occupations. Moreover, this leads to underes-
timating the overall demand for STEM knowledge and skills since STEM jobs outnumber
jobs in STEM occupations, e.g. by half a million STEM employment opportunities in 2015.
We also find that when seeking STEM graduates, recruiters in non-STEM occupations offer
to pay higher wages and, conditional on occupation fixed effects, this premium is not sta-
tistically significantly different from the one offered for STEM knowledge and skills within
STEM occupations.
Although, these findings suggest that the leakage from the STEM pipeline may be less
problematic than typically thought because around 15% of all recruiters in non-STEM occu-
pations do require and value STEM knowledge and skills, the issue remains problematic for
two main reasons.
Firstly, nothing prevents STEM educated job seekers to take up non-STEM jobs within
non-STEM occupations, for which non-STEM graduates are also qualified and no STEM
premium is offered.
Secondly, we find that the STEM skills and knowledge posted in STEM vacancies within
non-STEM occupations go beyond “Problem Solving”, “Analytical Skills”... but, in many
cases, could be acquired with less training than a full time STEM degree. Moreover, STEM
recruiters within non-STEM occupations actually wish to combine STEM knowledge and
skills with non-STEM ones to a larger extent that their counterparts in STEM occupations.
Hence, a more efficient way of satisfying STEM demand within non-STEM occupations could
be to teach more STEM in non-STEM disciplines so as to make non-STEM graduates quali-
fied for a set of jobs within non-STEM occupations for which they only lack the STEM skills
while already possessing the required non-STEM ones. We construct an abstract framework
to illustrate how this reform could reduce STEM shortages in both STEM and non-STEM
occupations.
Although the main focus of this paper is on “high level” STEM jobs – jobs that belong to
managerial, professional and associate professional occupations for which a university degree
is typically required, our analysis indicates that 25% of all STEM employment opportunities
in the UK are not “high level”. Examining the O*NET Knowledge scales, Rothwell [45]
gets a similar result for the US, finding that 30% of STEM positions there are “blue-collar”.
He argues that “the excessively professional definition of STEM jobs has led to missed op-
portunities to identify and support valuable training and career development.” This could
also be the case in the UK. Hence, future research should spend more time investigating
non-graduate STEM job openings in the UK as well.
THE STEM REQUIREMENTS OF “NON-STEM” JOBS 60
Moreover, future research could also try to merge the analysis of STEM demand presented
here with a similar analysis on the labour supply side, perhaps using a dataset like LinkedIn.
Nowadays, many people acquire STEM human capital not through formal education but
other channels like self-study, online courses, internships. . . This makes the assessment of
the actual supply of STEM knowledge & skills more complex than simply counting the
number of STEM graduates. Although, the existing STEM literature recognizes this as a
problem, so far, no attempts seem to have been made to deal with it and “STEM skills and
knowledge” continue to be used interchangeably with “STEM qualifications”. Clearly, this
has the same flaws as equating “STEM jobs” with “STEM occupations”.
References
[1] Training Agency. ‘Labour market and skill trends 1991/1992’. Employment Department, 1990.
[2] Kenneth J. Arrow and William M. Capron. ‘Dynamic shortages and price rises: the Engineer-scientist’.
Quarterly Journal of Economics, 73(2), 1959.
[3] General Assembly and Burning Glass Technologies. ‘Blurring lines: How business and technology skills
are merging to create high opportunity hybrid jobs’. 2015.
[4] R. H. Baayen. ‘Analyzing Linguistic Data: A Practical Introduction to Statistics Using R’. Cambridge
University Press, 2008.
[5] Joshua Ballance, Alicia Sasser Modestino, and Daniel Shoag. ‘Downskilling: Changes in employer skill
requirements over the business cycle’. Labour Economics, 2016.
[6] Joshua Ballance, Alicia Sasser Modestino, and Daniel Shoag. ‘Upskilling: Do employers demand greater
skill when workers are plentiful?’. Working Paper, February 2016.
[7] Kenneth Benoit and Paul Nulty. quanteda: Quantitative Analysis of Textual Data, 2015. R package
version 0.7.2-1.
[8] BIS. ‘Research into the need for and capacity to deliver STEM related apprenticeship provision in
England’. BIS Research Paper Number 171, March 2014.
[9] Derek Bosworth, Clare Lyonette, Rob Wilson, Marc Bayliss, and Simon Fathers. ‘The supply of and
15.1306 Mechanical Draughting and Mechanical Draughting CAD/CADD
15.1399 Draughting and Design Technology/Technician, General
15.1503 Packaging Science
Engineering
14 ENGINEERING
14.02 Aerospace, Aeronautical and Astronautical Engineering
14.03 Agricultural Engineering
14.04 Architectural Engineering
14.0501 Bioengineering and Biomedical Engineering
14.0701 Chemical Engineering
14.0801 Civil Engineering, General
14.0803 Structural Engineering
14.0804 Transportation and Highway Engineering
14.09 Computer Engineering
14.0902 Computer Hardware Engineering
14.0903 Computer Software Engineering
14.1001 Electrical and Electronics Engineering
14.1004 Telecommunications Engineering
14.12 Engineering Physics
14.1801 Materials Engineering
14.1901 Mechanical Engineering
14.2001 Metallurgical Engineering
14.2101 Mining and Mineral Engineering
14.2201 Naval Architecture and Marine Engineering
14.2701 Systems Engineering
14.3301 Construction Engineering
14.3501 Industrial Engineering
14.3601 Manufacturing Engineering
14.3701 Operations Research
14.3801 Surveying Engineering
14.3901 Geological/Geophysical Engineering
14.4201 Mechatronics, Robotics, and Automation Engineering
Mathematics & Statistics
27.01 Mathematics
27.03 Applied Mathematics
27.0303 Computational Mathematics
27.0305 Financial Mathematics
27.05 Statistics
THE STEM REQUIREMENTS OF “NON-STEM” JOBS 74
Table 17: Comparison of occupational distributions, UK 2014
Major SOC Code Major SOC Name ASHE BGT Data
1 Managers, directors and senior officials 9.6 9.92 Professional occupations 21.5 28.13 Associate professional and technical occupations 14.5 22.54 Administrative and secretarial occupations 12.1 9.95 Skilled trades occupations 8.0 6.56 Caring leisure and other service occupations 9.5 6.67 Sales and customer service occupations 8.1 6.28 Process, plant and machine operatives 6.0 4.29 Elementary occupations 10.7 6.1
Correlation 0.94
Notes: Produced by BGT. ASHE is the Annual Survey of Hours and Earnings (ASHE) from theOffice for National Statistics (ONS).
Table 18: Comparison of geographic distributions, UK 2014
Professional Occupations Elementary occupationsASHE BGT Data ASHE BGT Data
EAST MIDLANDS 5.9 5.8 8.9 6.9EAST OF ENGLAND 8.6 9.2 9.4 11.3LONDON 18.3 28.0 11.0 16.6NORTH EAST 3.7 2.2 4.3 2.7NORTH WEST 10.6 8.8 11.4 9.1SCOTLAND 9.9 6.0 8.7 8.4SOUTH EAST 15.1 16.2 12.6 17.9SOUTH WEST 8.3 7.2 9.0 9.2WALES 4.6 1.9 5.0 2.4WEST MIDLANDS 7.8 8.3 10.6 8.9YORKSHIRE AND THE HUMBER 7.2 6.3 9.1 6.4Correlation 0.94 0.84
Notes: Produced by BGT. ASHE is the Annual Survey of Hours and Earnings (ASHE) from theONS. BGT data normalized for the fact that ASHE does not have data on Northern IrelandEmployment, while BGT does.