HAL Id: hal-01731305 https://hal.archives-ouvertes.fr/hal-01731305 Submitted on 14 Mar 2018 HAL is a multi-disciplinary open access archive for the deposit and dissemination of sci- entific research documents, whether they are pub- lished or not. The documents may come from teaching and research institutions in France or abroad, or from public or private research centers. L’archive ouverte pluridisciplinaire HAL, est destinée au dépôt et à la diffusion de documents scientifiques de niveau recherche, publiés ou non, émanant des établissements d’enseignement et de recherche français ou étrangers, des laboratoires publics ou privés. Non-Tariff Measures: Data and Quantitative Tools of Analysis Jaime de Melo, Alessandro Nicita To cite this version: Jaime de Melo, Alessandro Nicita. Non-Tariff Measures: Data and Quantitative Tools of Analysis. 2018. hal-01731305
Transcript
HAL Id: hal-01731305https://hal.archives-ouvertes.fr/hal-01731305
Submitted on 14 Mar 2018
HAL is a multi-disciplinary open accessarchive for the deposit and dissemination of sci-entific research documents, whether they are pub-lished or not. The documents may come fromteaching and research institutions in France orabroad, or from public or private research centers.
L’archive ouverte pluridisciplinaire HAL, estdestinée au dépôt et à la diffusion de documentsscientifiques de niveau recherche, publiés ou non,émanant des établissements d’enseignement et derecherche français ou étrangers, des laboratoirespublics ou privés.
Non-Tariff Measures: Data and Quantitative Tools ofAnalysis
Jaime de Melo, Alessandro Nicita
To cite this version:Jaime de Melo, Alessandro Nicita. Non-Tariff Measures: Data and Quantitative Tools of Analysis.2018. �hal-01731305�
fondation pour les études et recherches sur le développement international
LA F
ERD
I EST
UN
E FO
ND
ATIO
N R
ECO
NN
UE
D’U
TILI
TÉ P
UBL
IQU
E.
ELLE
MET
EN
ŒU
VRE
AV
EC L
’IDD
RI L
’INIT
IATI
VE
POU
R LE
DÉV
ELO
PPEM
ENT
ET L
A G
OU
VER
NA
NC
E M
ON
DIA
LE (I
DG
M).
ELLE
CO
ORD
ON
NE
LE L
ABE
X ID
GM
+ Q
UI L
’ASS
OC
IE A
U C
ERD
I ET
À L
’IDD
RI.
CET
TE P
UBL
ICAT
ION
A B
ÉNÉF
ICIÉ
D’U
NE
AID
E D
E L’
ÉTAT
FRA
NC
AIS
GÉR
ÉE P
AR
L’AN
R A
U T
ITRE
DU
PRO
GRA
MM
E «I
NV
ESTI
SSEM
ENTS
D’A
VEN
IR»
PORT
AN
T LA
RÉF
ÉREN
CE
«AN
R-10
-LA
BX-1
4-01
».
Non-Tariff Measures: Data and Quantitative Tools of Analysis*Jaime de Melo, Alessandro Nicita
Abstract
This paper provides a tour d’horizon on where we stand with the information, and analysis of Non-Tariff Measures (NTMs). The analysis of NTMs has been fragmentary, not keeping pace with their increasing prevalence and their increasing complexity. Capturing and classifying these NTMs is still a daunting task because of the data limitations identified in this paper: comprehensiveness, diversification, lack of precision, dimensionality, time dimension (NTMs are rarely available for several years which makes it difficult to control for confounding factors). Most NTM data inventories are registered on a binary basis restricting the use of descriptive statistics to a few indices. Disentangling precautionary from protectionist motives of NTMs is difficult as the presence and/or intensity of NTMs is likely to depend on import volumes. Quantity-based and price-based approaches to estimate AVEs are discussed along with methods to measure distortionary costs of NTMs. Examples of ‘top down’ and ‘bottom up’ approaches are shown to reveal some stylized patterns. Among these, trade costs have been falling around the world, but low-income countries are not catching up, for reasons likely to include the uneven effects of reductions in transport costs and the greater cost-raising effects of technical barriers to trade for low-income countries. For all income groups, the average trade restrictiveness of NTMs is estimated to be higher than the average restrictiveness of tariffs and the average restrictiveness of NTMs is estimated to be higher for low-income countries.
* A shorter version of this paper appeared as chapter 2 in Non-Tariff Measures: Economic Assessment and Policy Measures pub-lished by the UNCTAD secretariat. Other chapters are here: https://drive.google.com/file/d/1VJiZVcFZZ7b_1zEdfvidrkW25rslLR1H/view?usp=sharing. The authors thank Olivier Cadot, Jean-Marc Solleder, Peri Silva, and Marcelo Olarreaga for comments. Melo also gratefully acknowledges support from the French National Research Agency under program ANR-10-LABX-14-01.The authors thank Olivier Cadot, Jean-Marc Solleder, Peri Silva, and Marcelo Olarreaga for comments. Melo also gratefully acknowledges support from the French National Research Agency under program ANR-10-LABX-14-01. The authors thank Olivier Cadot, Alessandro Nicita, Jean-Marc Solleder, Peri Silva, and Marcelo Olarreaga for comments. Melo also gratefully acknowledges support from the French National Research Agency under program ANR-10-LABX-14-01.
Jaime de Melo, Ferdi, Cepr, University of Geneva and Geneva Business School.
Alessandro Nicita, United Nations Conference on Trade And Development.
Development Polici e
s
Working Paper
218March
2018
Ferdi WP 218 Melo (de), J. and Nicita, A. >> Non-Tariff Measures: Data and Quantitative Tools of Analysis 1
1. Introduction
Market access depends on and is administered by a large and increasing set of regulations and
requirements that traded goods need to comply with. These regulatory measures are generally
referred to as non-tariff measures (NTMs) and include a wide array of economic policies that have
direct or indirect effects on trade costs. Although NTMs are becoming increasingly widespread in
regulating international trade, their prevalence and effects are still not well understood. In fact, the
analysis related to NTMs has been fragmentary and has not kept pace with their increasing
complexity, resulting in a knowledge gap (UNCTAD, 2013). The reasons for the poor understanding
of the effects of NTMs on international trade and welfare are related to the informational burden of
identifying and collecting information on NTMs and to the complexity in integrating the analysis of
NTMs in economic models.
This chapter provides a discussion of some essential concepts, data, and tools related to the
analysis of the effects of NTMs on aggregate economic outcomes. This chapter reviews some of the
overall methods of analysis while chapter 4 by Melo and Shepherd and chapter 5 by Beghin and
Xiong review how more detailed modelling of particular NTMs (e.g. Rules of Origin, Maximum
residue limits, SPS measures to control pest infestations) help evaluate more accurately their
effects on imports and welfare.
The chapter starts with basic notions necessary to study NTMs: how they are defined, classified and
categorized (section 2). Although the quality and availability of NTMs data has improved recently, it
is important to understand that data on NTMs are subject to limitations on comprehensiveness,
impreciseness, and lack of time series. Data limitations are particularly acute in the case of NTMs
that originate from domestic regulations that affect international trade. These limitations are
discussed in section 3.
The chapter proceeds by illustrating the most commonly used methods to assess the prevalence of
NTMs and to analyze their effects on international trade and other outcomes. Prevalence is often
captured by coverage ratio and frequency indices. These indices, discussed in section 4, provide
simple but useful tools to illustrate the types and number of NTMs that countries apply on
aggregate imports as well as across different sectors. Indices employed to measure compatibility
across regulatory frameworks are also discussed. Section 5 then covers the most commonly used
quantitative methods used to measure the effects of NTMs. These include methods based on price
differentials (the so-called ‘price-gap’ approach) and the methods based on modelling the
sensitivity of trade flows to trade costs such as NTMs. Examples of the application of these methods
to quantifying the aggregate effects of NTMs are provided. Section 6 concludes.
Ferdi WP 218 Melo (de), J. and Nicita, A. >> Non-Tariff Measures: Data and Quantitative Tools of Analysis 2
2. Non-tariff measures: definition, classification and categorization
In very general terms NTMs are defined as government policies that affect international trade. A
formal definition of NTMs is:
"Non-tariff measures (NTMs) are policy measures, other than ordinary customs tariffs, that can
potentially have an economic effect on international trade in goods, changing quantities traded, or
prices or both” (UNCTAD, 2010).
This broad definition includes a very diverse set of policy measures that can be individually as
different from each other as they are collectively different from import tariffs.1 A problem with such
a broad formal definition is that it is largely uninformative as, ultimately, most economic policies
can potentially affect international trade. While some forms of economic policy intervention can be
easily categorized as NTMs as their primary purpose is to affect trade (e.g. import quotas, export
restraints), there is a growing and large number of government policies that are not directed at
international trade for which trade effects are considered externalities (e.g. domestic subsidies,
intellectual property laws, environmental standards). Whether such measures should be
categorized as NTMs is therefore open to interpretation and debate. It is also important to note
that whether a policy measure is identifiable as an NTM depends on the type of regulation as
defined by the legal regulatory text. NTMs do not include issues related to how these policy
measures are actually implemented and/or enforced. Issues related to the implementation of
government regulations or to their enforcement are not defined as NTMs but are generally referred
to as procedural obstacles. 2
A more practical way to identify a policy measure as an NTM is to rely on a ‘proper’ classification.
For this purpose, UNCTAD, in collaboration with other international organizations, has developed a
detailed classification of policy measures that can be considered NTMs. In this classification NTMs
are categorized according to their scope and/or design. NTMs are broadly classified as technical
measures (standards and pre-shipment inspections) and non-technical measures. These are often
further divided into hard measures (e.g. price and quantity control measures), threat measures (e.g.
anti-dumping and safeguards) and other measures (e.g. trade-related finance and investment
measures).
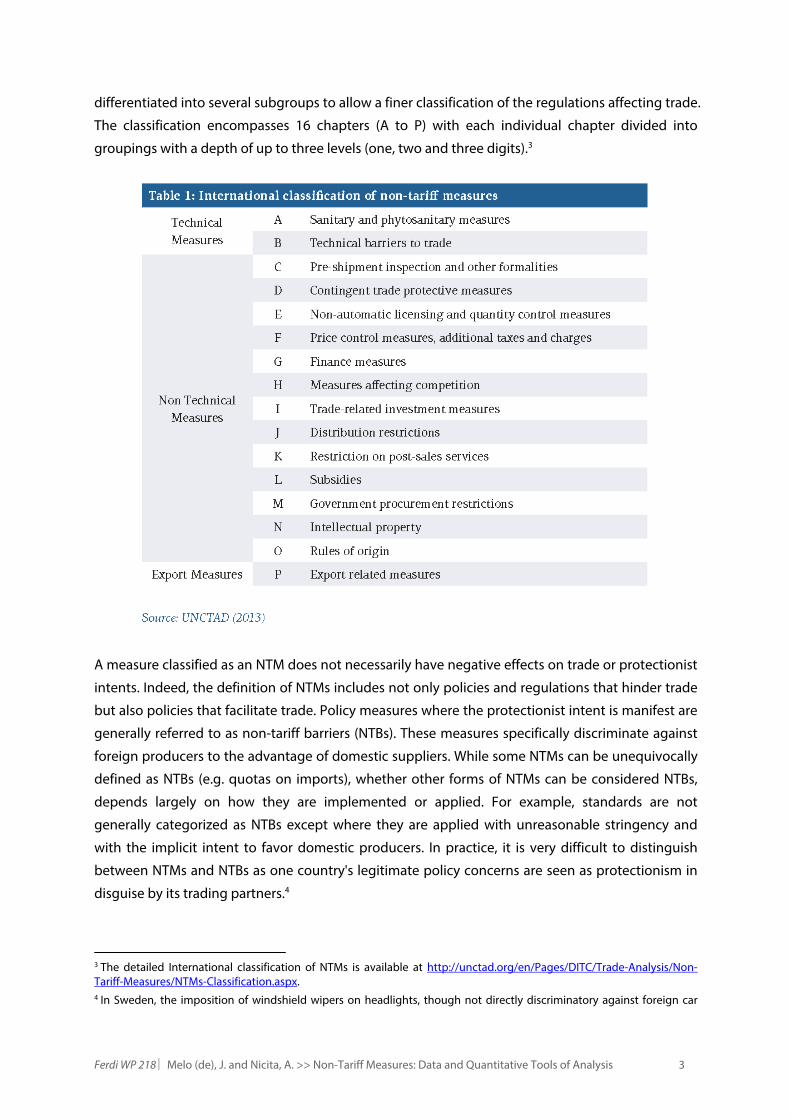
This internationally accepted classification of NTMs summarized in table 1 follows a tree/branch
structure where measures are categorized into “chapters” depending on their scope and/or design,
with each chapter comprising measures with similar objectives. Then each chapter is further
1 The reason for grouping all these policy measures into the general term of NTMs is to be found in the context of the General Agreement on Tariffs and Trade/World Trade Organization. From this perspective, NTMs are separated from import tariffs because, while both tariff and NTMs may impact trade, tariffs on imports stand out as the central policy measure with which negotiated market access commitments are made through negotiated tariff bindings (Staiger, 2012). 2 For example, lengthy procedures required for custom clearance due to inefficiencies at the border are not to be considered NTMs. See Cadot and Mallouche (2012).
Ferdi WP 218 Melo (de), J. and Nicita, A. >> Non-Tariff Measures: Data and Quantitative Tools of Analysis 3
differentiated into several subgroups to allow a finer classification of the regulations affecting trade.
The classification encompasses 16 chapters (A to P) with each individual chapter divided into
groupings with a depth of up to three levels (one, two and three digits).3
A measure classified as an NTM does not necessarily have negative effects on trade or protectionist
intents. Indeed, the definition of NTMs includes not only policies and regulations that hinder trade
but also policies that facilitate trade. Policy measures where the protectionist intent is manifest are
generally referred to as non-tariff barriers (NTBs). These measures specifically discriminate against
foreign producers to the advantage of domestic suppliers. While some NTMs can be unequivocally
defined as NTBs (e.g. quotas on imports), whether other forms of NTMs can be considered NTBs,
depends largely on how they are implemented or applied. For example, standards are not
generally categorized as NTBs except where they are applied with unreasonable stringency and
with the implicit intent to favor domestic producers. In practice, it is very difficult to distinguish
between NTMs and NTBs as one country's legitimate policy concerns are seen as protectionism in
disguise by its trading partners.4
3 The detailed International classification of NTMs is available at http://unctad.org/en/Pages/DITC/Trade-Analysis/Non-Tariff-Measures/NTMs-Classification.aspx. 4 In Sweden, the imposition of windshield wipers on headlights, though not directly discriminatory against foreign car
Ferdi WP 218 Melo (de), J. and Nicita, A. >> Non-Tariff Measures: Data and Quantitative Tools of Analysis 4
As NTMs cover a very wide range of measures it is useful to categorize them along several
dimensions according to their nature, effects, or characteristics. In addition to the commonly used
classification in table 1, NTMs can be categorized in other ways. For example, NTMs can be
classified according to whether they are applied at customs (border measures) or elsewhere
(behind-the-border).5 Border measures can be further divided into import measures (e.g. quotas,
export taxes, voluntary export restraints). Behind-the-border measures are so defined because they
are imposed internally in the domestic economy. Behind-the-border measures include most
technical measures resulting from domestic legislation covering product standards in relation to
health, environmental, technical and other concerns, as well as internal taxes and domestic
subsidies. As discussed by Hoekman and Nicta (2018) in chapter 2 (in this volume), NTMs can also
be categorized according to the specific agreement (or even clauses) they are referred to. For
example, the General Agreement on Tariffs and Trade (GATT) includes a number of clauses aimed
at limiting the use of NTMs and replacing them with tariffs. Moreover, the World Trade
Organization (WTO) governs a number of specific agreements on various types of NTMs, including
rules of origin, subsidies and countervailing measures, government procurement, trade-related
aspect of investment and intellectual property rights, Sanitary and Phytosanitary (SPS) measures
and Technical Barriers to Trade (TBTs).
NTMs can also be categorized according to their impact on different prices leading to four broad
categories of regulations: customs, process, product and consumer. Customs regulations are those
which drive a wedge between world and domestic prices (e.g. inspection fees, import and export
taxes). Product regulations are related to the characteristics of products (e.g. safety standards in
cars or toys or Maximum Residue limits (MRLs) for pesticides). For the purpose of economic analysis,
product regulations drive a wedge between producers’ and consumers’ prices. Consumers’
regulations are primarily consumption taxes (e.g. excise taxes on fuels) but also include regulations
which directly affect the final prices paid by consumers without adding anything to the cost of
production (e.g. minimum import prices). Finally, process regulations affect producer prices as they
regulate methods of production (e.g. labour and environmental standards) when applied to not
only domestic but also foreign producers. Ederington and Ruta (2016) discuss these categories at
greater length and provide a useful concordance table of each category with UNCTAD’s
classification which is used in figure 2 below.6
producers, is viewed by them as raising-their costs (and hence an NTB) while the Swedish regulator claims that it is for safety under snowy conditions. Ederington and Minier (2003) discuss situations where countries distort levels of environmental regulations to favour domestic industries. 5 See Staiger (2012) as an example. 6 An alternative classification, analytically useful, but more difficult to implement, is to distinguish NTMs by the type of costs they impose (e.g. process-adaptation, enforcement and sourcing costs). Enforcement and process-adaptation costs matter mostly for market structure while enforcement and sourcing costs matter for aggregate trade flows. See Yang et al. (2016).
Ferdi WP 218 Melo (de), J. and Nicita, A. >> Non-Tariff Measures: Data and Quantitative Tools of Analysis 5
3. Data on non-tariff measures
The quality and availability of data on NTMs has improved considerably in recent years. The
importance of driving down trade costs led many international institutions and national agencies
to collect information, improve transparency, and provide accurate data on the use and
implementation of many forms of NTMs.
Data sources on NTMs can be broadly divided into general and specific databases. General
databases provide information on the use of a wide variety of NTMs across countries, but do not
provide detailed information on the exact requirements of NTMs (e.g. amount of the quota, MRLs,
actual cost of the import license). On the other hand, specific databases often provide more
detailed information on the actual requirements, but cover only a limited subset of measures as for
example the data bases on MRLs which provide measurable quantities of pesticides in food
products.7 Most often, detailed data are very fragmentary as they are made available only because
of the effort of specific agencies and tailored to specific purposes more related to government and
business concerns than to economic analysis. With this caveat in mind, we present briefly the main
general databases that are freely available to researchers, then discuss their main limitations.
3.1. Data sources
One main source of data on NTMs is the TRAINS (Trade Analysis and Information System) database
maintained by UNCTAD and also available through the WITS (World Integrated Trade Solution)
system. TRAINS is a comprehensive database providing information at a very detailed product level
(Harmonized System (HS) 6 digits or more), covering both tariffs and a large part of the NTMs listed
in figure 1 (the chapters from A to F). Of importance is that TRAINS data provide information on
whether a country has particular NTMs applied to specific products, but do not contain readily
accessible information on the actual requirements. Such detailed information is available through
the UNCTAD Integrated Trade Intelligence Portal (I-TIP). UNCTAD I-TIP is an information repository
system to serve the needs of those seeking more detailed information on trade policy measures. 8
The WTO is another official source of information on NTMs. WTO membership imposes notification
requirements in the areas of many NTMs. However, notification requirements are not always up to
date as many countries do not fully respect the notification commitments. Moreover, notification
requirements relate only to new regulations, resulting in pre-existing regulations not always being
recorded in the data. To soften the under-notification issues, WTO also collects information on
matters that countries raise on Specific Trade Concerns (STCs) when these relate to NTMs. This
7 See the discussion by Beghin and Xiong (2018) in chapter 5 and the case study by Xiong and Beghin (2014) that disentangles the demand-enhancing from the cost-raising effects of MRLs in pesticides for plant products. 8 UNCTAD I-TIP does not provide readily available data but provides the link to the relevant legislation behind measures listed in the TRAINS database. TRAINS data on tariffs and NTMs are available at http://wits.worldbank.org. UNCTAD I-TIP is available at http://i-tip.unctad.org/
Ferdi WP 218 Melo (de), J. and Nicita, A. >> Non-Tariff Measures: Data and Quantitative Tools of Analysis 6
information is then added to the notifications and provided through the WTO integrated trade
portal.9
In addition to these general databases, data on specific types of NTMs are available through various
agencies. For example, the World Bank (WB) maintains the Temporary Trade Barriers Database,
which contains information on all contingent trade measures dating back to the 1980s. The
Organisation for Economic Cooperation and Development (OECD) maintains information on export
restrictions as well as data on consumer and producer support in agricultural products. The
International Trade Centre (ITC) collects and provides information on tariff-rate quotas and rules of
origin, among other NTMs.
Other sources of NTM-related information are national agencies dealing with trade statistics,
especially those with significant resources. For example, some NTMs data are also available
through the European Commission Market Access Database and the United States International
Trade Commission NTMs database. Information on NTMs applied by countries in specific regions is
sometimes available through regional agencies, including United Nations regional commissions.
While the databases described above report official data as provided by government regulations,
information on the use and stringency of NTMs can also be inferred from micro-level data. This
type of information is collected through business surveys and online complaints portals. A good
source of survey data on NTMs is the International Trade Center (ITC). ITC has collected survey data
for large number of countries to investigate the major trade concerns expressed by exporting
firms.10 In relation to online complaints portals, many countries provide a platform for exporting
and importing firms to voice their concerns about difficulties they encounter in their trading
business. As a note of caution, the data collected through surveys or complaints need to be
recognized as subjective and not really comparable across respondents. While these data provide
information on trade impediments, they are not specific to government regulations but
encompass trade costs and procedural obstacles that may not originate from NTMs as defined
above. Moreover, such data are not exhaustive or comprehensive of all types of NTMs. Finally, they
represent the views of firms that have more incentive to respond to surveys or to file complaints.
3.2. Non-tariff measures data limitations
Although the availability and quality of NTMs data are constantly improving, there are various
limitations to consider regarding the use and interpretation of the data on NTMs. These limitations
are largely due to the nature of NTMs themselves, but also to the way in which the data are
collected. There are six main limitations in the use of NTM data. These are set out below.
9 Available at https://i-tip.wto.org 10 See http://ntmsurvey.intracen.org/ntm-survey-data for more information on these data and how to access them.
Ferdi WP 218 Melo (de), J. and Nicita, A. >> Non-Tariff Measures: Data and Quantitative Tools of Analysis 7
Comprehensiveness. The first limitation of the NTMs data is about comprehensiveness. Although
there has been a considerable improvement in the last few years, NTMs data still suffer from
omissions and double counting. Because the original information on NTMs is often dispersed
among a myriad of sources, some specific measure may be missed even by the most meticulous
data collection efforts.11 Moreover, NTMs data can suffer from double counting as identical NTMs
originating from different primary sources of information may refer to the same regulatory
measure.12 In practice, detailed comparisons across countries may not always be possible as the
availability of information on NTMs (as well as data collection efforts) often differs across countries.
Similar problems affect NTM data originating from notifications because notification requirements
are not always respected. Double counting is also a problem of notification; for example, tariff-rate
quotas for agricultural products are often administered through an import licensing procedure.
These two measures are basically one and the same but the former needs to be notified to the
Committee on Agriculture and the latter to the Committee on Import Licensing. Finally, survey data
also suffer from similar problems as they represent the views of firms, which are more likely to
provide information on NTMs that they find restrictive, while omitting information on NTMs that do
not affect them. These issues make data on NTMs subject to systematic biases and measurement
errors.
Lack of precision. A second limitation relates to the inherent imprecision of the NTMs data. Most
NTMs data are qualitative in nature, implying that it is difficult, and often impossible, to ascertain
the stringency of the regulation from its text. For this reason, NTMs data are generally collected and
provided to researchers as a binary variable on the presence (or absence) of a specific NTM. These
data are useful in computing statistics, such as how many and which types of NTMs are imposed by
each country, and/or in each sector. Still, as collected, the data do not allow one to appreciate the
relative importance of these measures for restricting trade or for adding to trade costs. For example,
differences in the number of NTMs applied across sectors or countries should not be unequivocally
interpreted as regulatory stringency as one particular form of NTMs could be much more stringent
than five different NTMs combined. Moreover, equivalence in regulations does not necessarily
imply equivalence in stringency. It is often the case that the implementation and enforcement of
identical NTMs are different across countries, and therefore so are their effects.
Dimensionality. A third issue relates to the dimensionality of the data. As discussed above, NTMs
encompass a very large and heterogeneous number of policy measures. Information on the
presence of very specific types of NTMs is available in many databases on NTMs. On the one hand,
such richness of data is valuable for descriptive purposes as it provides information on exactly
which measures are in place. On the other hand, such wide dimensionality does not find great use
in the econometric assessment of the impact of NTMs. The main reason is collinearity across NTMs
11 For a detailed explanation of how NTMs data are collected see UNCTAD (2016). 12 Some databases control for this. For example, the UNCTAD NTMs data set reports multiple identical observations only when identical NTMs refer to different regulatory texts.
Ferdi WP 218 Melo (de), J. and Nicita, A. >> Non-Tariff Measures: Data and Quantitative Tools of Analysis 8
which makes it very difficult to isolate the effect of one specific measure from that of another.
Collinearity and measurement error explain why most econometric assessments aggregate NTMs
into very broad categories.
Time dimension. A fourth issue is related to the time dimension of the data. Although NTMs data
often provide information on the date of implementation (or the date of notification), this
information may not be sufficiently accurate for time series analysis which would be helpful in
weeding out confounding factors. Here two issues should be considered. The first relates to the
notification data. Measures that have existed for a long time and have never changed are generally
not notified and therefore not accounted for in the data. The reason for this omission is that
countries are generally required to notify only new measures or changes to existing measures. The
second issue relates to the UNCTAD NTMs database. Although UNCTAD data include information
on the date of implementation of the measures, this information cannot be used to construct a
complete time series database. The reason is that UNCTAD data are intended to be a snapshot of
the existing regulations at the time the data were collected. In practice, the data ignore any NTMs
which existed in the past but have been revoked before the data were collected. A more general
problem is whether the date of implementation should be interpreted as the beginning of the
implementation of the specific measure. This may be an incorrect assumption as it is also possible
that any measure recorded in the data may be replacing a very similar measure, for which there is
no trace in the data.
Product-specific requirements. A fifth issue is product-specific regulatory requirements. NTMs data
are available at the HS-6 level, covering more than 5,000 different products. Analysts need to be
aware that since products are intrinsically different, differences in the extent of regulations to
which each product is subjected to reflect, at least in part, this heterogeneity. This issue is of
particular importance for technical measures. For example, sectors such as food products,
chemicals or firearms are, by their very nature, likely to be more heavily regulated than raw
materials. Likewise, in the case of rules of origin, these vary greatly across products (e.g. rules of
origin are more common in final products than in intermediates). Without proper aggregation
methods, overall indicators may just capture differences in trade composition rather than
differences in the use of NTMs or in their stringency.
Endogeneity. A final issue in examining the causal effect of NTMs relates to the effects that NTMs
may have on trade flows. As in the case of tariffs and quotas, there is a potential endogeneity bias
in estimating the effect of trade policies on trade volumes as trade volumes may influence tariff
levels, quotas or NTMs. In addition, political economy arguments suggest that reverse causality is
also of major concern. For example, governments may be prone to overregulate sectors of
importance for domestic producers and consumers, thus imposing NTMs where trade flows are
Ferdi WP 218 Melo (de), J. and Nicita, A. >> Non-Tariff Measures: Data and Quantitative Tools of Analysis 9
larger. If endogeneity is not addressed with instrumental variables, resulting estimates will be
downward biased. 13
The pervasiveness of the problems described here hampers the assessments of NTMs especially
when one seeks to capture the effects of the full range of NTMs characterizing countries’ regulatory
structures. Still, the case studies in Melo and Nicita (2018a) illustrate some of the ways these
problems can be addressed. However, it remains that these problems should be clear to the analyst
because they can potentially influence methods of analysis, interpretation of results, and ultimately,
policy recommendations.
4. Descriptive indicators of non-tariff measures
Methods to study the effects of NTMs are based on a mix of descriptive indicators, models to
describe effects on quantities, prices (or both when studying effects on unit values) and the
associated econometric methods. We first present and illustrate the most commonly used
indicators that summarize the incidence and prevalence of NTMs, then in the next section discuss
some econometric methods to assess the economic effects of NTMs.
The simplest approach to summarizing the prevalence of NTMs on trade is to calculate incidence
indicators (Deardorff and Stern, 1998). These indicators are based on the intensity of the policy
instruments, and measure the degree of regulation without considering its impact on trade or the
economy. Three commonly used incidence indicators are the coverage ratio, the frequency index
and the prevalence score. These indicators are based upon inventory listings of observed NTMs.
The coverage ratio (CR) measures the percentage of trade subject to NTMs, the frequency index (FI)
indicates the percentage of imported products to which NTMs apply, and the prevalence score (PS)
is the average number of NTMs applied to imported products. These indicators are mostly
calculated on overall trade, considering all types of NTMs, but they are also suited to illustrate the
incidence of particular NTMs on specific groups of products (e.g. average number of SPS measures
applied on agricultural products). In notation:
∑
∑100 (1)
∑
∑100 (2)
∑ #
∑100 (3)
13 In a widely cited study on the effect of NTMs on US imports in a cross-section, Trefler (1993) estimated that the effects of NTMs on US imports was increased by a factor of 10 when he took into account the positive correlation between NTMs and the level of imports.
Ferdi WP 218 Melo (de), J. and Nicita, A. >> Non-Tariff Measures: Data and Quantitative Tools of Analysis 10
where subscript k denotes product and i country imposing the NTMs, and where NTMik is a dummy
variable denoting the presence of an NTM (or type of NTMs) in the selected hs aggregation level
(typically HS6 or HS4), #NTM denotes the number of NTMs, X is the value of imports, and D is a
dichotomous variable taking the value 1 when country i imports any quantity of product k, and
zero otherwise.
Another simple useful indicator for NTM analysis is to compute a standard deviation of regulations
that a country applies across products. This will indicate whether that country applies NTMs
uniformly across products, or tends to target particular products or groups. Indeed, NTMs, when
used as trade policy tools, are often targeted to specific products (e.g. a specific import
requirement on rice), while NTMs serving public policy objectives tend to be applied more
uniformly (e.g. pesticide limits on agricultural products). Therefore, such an indicator would not
only measure the dispersion of NTMs across the product but also provide an indication of the
objectives of the regulatory framework.
More sophisticated indices can be constructed to take into account differences in regulatory
intensity across products. This can be done by standardizing the data across products. For example,
an index devised to capture regulatory intensity (RI) (as measured by the number of NTMs) across
countries controlling for product differences can be computed as:
# ##
∑ (4)
where mean (denoted by the overbar) and standard deviation (sdev) are computed at the product
level across countries so as to control for product-specific regulatory differences. The standardized
variable can then be weighed by imports, or weighed by the share of product k in world trade
so as to reduce the endogeneity problem while still giving more importance to products
where trade flows are larger.14 Standardization can also be applied to most other indicators.
NTMs data can also inform on differences (or convergence) in regulatory frameworks between
countries. Information on regulatory divergence is of particular relevance as, more than the
regulation itself, it is often the diversity of regulations across jurisdictions that act as a barrier to
trade. Although the data limitations described above allows only a shallow analysis of regulatory
divergences, an index measuring such divergence can be computed by calculating standardized
numbers of product- type NTMs combinations that are applied identically by any two countries.
Cadot et al. (2015) developed a simple index of regulatory distance. Their measure of regulatory
distance (RD) between country i and j is computed as:
14 As discussed in an earlier footnote, the very presence of NTMs can depend on the level of trade (e.g. governments may be more inclined to impose regulatory measures on products where trade flows are larger). This would result in endogeneity and downward estimates not only in the econometric analysis but also in the descriptive statistics. In calculating average statistics this problem is reduced by using the product world trade instead of a country’s imports. More generally, it is good practice to test the robustness of the weighed indicators by using different sets of weights.
Ferdi WP 218 Melo (de), J. and Nicita, A. >> Non-Tariff Measures: Data and Quantitative Tools of Analysis 11
∑ ∑ (5)
where, as before, NTM is a dichotomous variable taking the value 1 when the country imposes an
NTM of type z on product k, and zero otherwise and N denotes the number of combinations of
products and types of NTMs. Alternatively, N can denote the number of observations where at least
one of the two countries applies the NTM (i.e. observations where both countries have a zero value
are not included in the numerator or denominator). In practical terms, regulatory distance indicates
the percentage of NTMs-product combinations that are not equal across two countries. The lower
the value of the index, the more similar is the regulatory framework of two countries. As with the
other incidence indicators, regulatory distance can be computed at the sector level and on specific
types or groups of NTMs (see figure 7 below).
All these indices suffer from the data limitation described above. However, as illustrated by the
above-mentioned intensity measures, some of the problems with the data can be reduced by
statistical methods and by weighting. For example, aggregating across NTMs and/or products can
reduce problems related to comprehensiveness and dimensionality. While endogeneity is implicit
to the coverage ratio it may be reduced by using world trade instead of national trade as weight.
For frequency indices endogeneity may be reduced by using the total number of HS goods as a
denominator. Clearly, by altering the indices, their interpretation would change accordingly. For
example, a frequency index calculated on the universe of HS products would be interpreted as the
percentage of products subject to NTMs regardless of whether or not they are imported. This
approach could be revealing in cases where the presence of NTMs would make trade impossible
(e.g. prohibitions).
4.1. Incidence of non-tariff measures across products and across countries
The analysis of NTMs often starts by providing statistics on the types of NTMs and how their use
differs across products, sectors and countries. Using the incidence indicators presented above.
Figures 1-7 report these indicators for a large sample of countries, sectors and NTMs 15.
Figure 1a reports frequency and coverage indicators for world trade according to broad types of
NTMs as in the UNCTAD international classification. These indicators show that TBTs are the most
frequent form of NTMs, with almost 40 per cent of product lines and about 55 per cent of world
trade affected. Quantity and price control measures affect about 15 per cent of world trade. Price
control and export measures are also widely used, covering almost 40 per cent of product lines but
less than 20 per cent of world trade. SPS measures affect about 25 per cent of product lines and 10
per cent of world trade. Other types of NTMs are less frequently used and affect a relatively lower
share of world trade. The use of NTMs varies considerably across sectors. Figure 1b illustrates the
15 The data used for figures 1-7 are from the UNCTAD TRAINS NTM database. The data include about 57 countries (the European Union counting as one) covering more than 75 per cent of world trade. To make data more comparable across countries, NTMs classified from the H to O in table 1 are not included in the analysis.
Ferdi WP 218 Melo (de), J. and Nicita, A. >> Non-Tariff Measures: Data and Quantitative Tools of Analysis 12
use of NTMs across three broad economic sectors. Overall, agricultural products tend to be
relatively more regulated than products in other sectors. This is not only in relation to SPS
measures which, by definition, apply mainly to agriculture, but also to TBT, price control and export
measures.
Ferdi WP 218 Melo (de), J. and Nicita, A. >> Non-Tariff Measures: Data and Quantitative Tools of Analysis 13
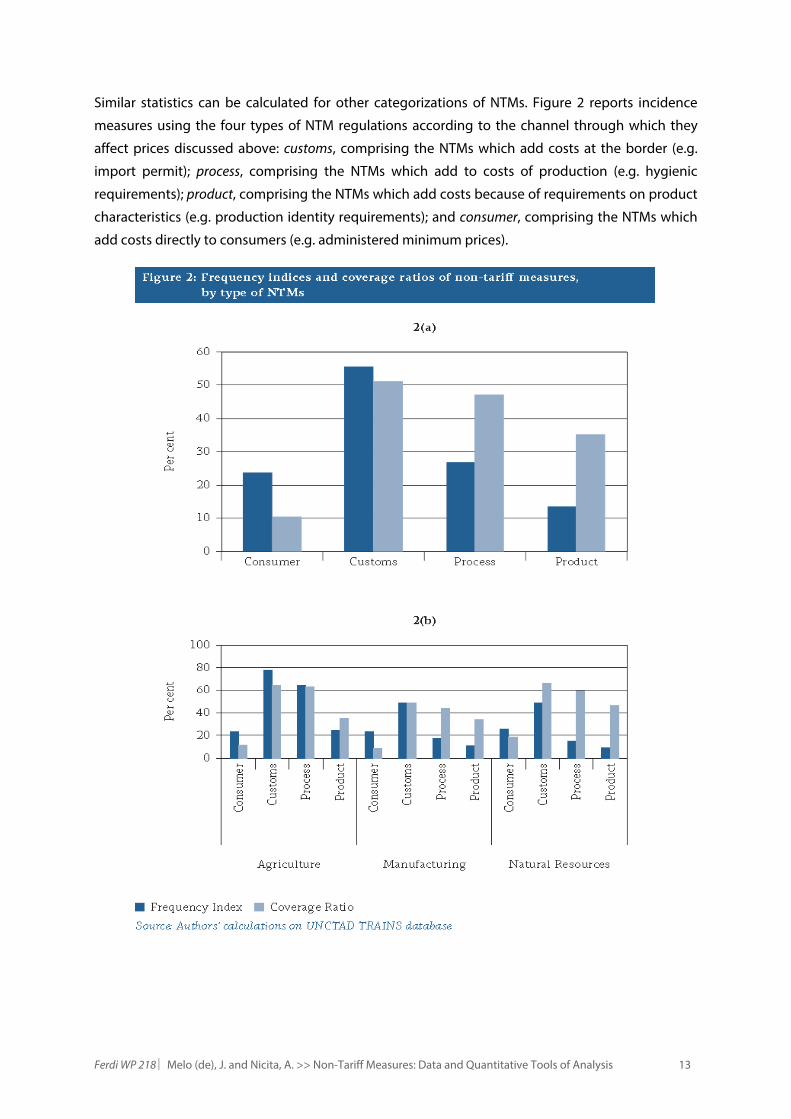
Similar statistics can be calculated for other categorizations of NTMs. Figure 2 reports incidence
measures using the four types of NTM regulations according to the channel through which they
affect prices discussed above: customs, comprising the NTMs which add costs at the border (e.g.
import permit); process, comprising the NTMs which add to costs of production (e.g. hygienic
requirements); product, comprising the NTMs which add costs because of requirements on product
characteristics (e.g. production identity requirements); and consumer, comprising the NTMs which
add costs directly to consumers (e.g. administered minimum prices).
Ferdi WP 218 Melo (de), J. and Nicita, A. >> Non-Tariff Measures: Data and Quantitative Tools of Analysis 14
Overall, measures that add costs at the border are the most frequently used form of NTMs. These
measures affect more than 50 per cent of world trade and about 55 per cent of product lines. NTMs
related to process and products are used less frequently, but they still cover a substantial part of
world trade (about 45 per cent for process measures and about 35 per cent for product measures).
Of note is that the coverage ratios are much larger than the frequency indices for these measures.
There are two likely reasons behind this difference. First, governments often have more incentive
to regulate sectors that are more heavily traded. Second, some of these behind-the-border
measures may have trade-inducing effects, as they guarantee quality and safety. Finally, NTMs that
add costs directly to consumers affect about 25 per cent of products but only 10 per cent of the
value of world trade (figure 2a). As these measures directly increase domestic prices, they have a
negative effect on consumption and thus result in a relatively lower coverage ratio since they
reduce imports. Similar patterns hold across broad economic sectors (figure 2b). One exception is
that process measures are more widely used in agriculture owing to the need to regulate
production processes related to quality and safety standards (about 60 per cent of agricultural
trade is subject to measures regulating production processes)
In the analysis of NTMs it is often of relevance to investigate how heavily regulated a sector is
relative to other sectors, or to the same sector in other countries. A crude index for this type of
analysis is the Prevalence Score (PS) defined in equation (3). This index measures the average
number of NTMs applied on a product, on a sector, or on overall imports. Prevalence scores can be
calculated at any level of disaggregation of the NTMs classification. Although this index does not
measure stringency, it arguably provides some indication of the level of regulatory obligations that
trade flows face. For illustrative purposes figure 3 compares the PSs across countries for agriculture
and manufacturing products along a 450 line. Figure 3a illustrates the average number of different
types of technical NTMs (i.e. SPS+TBT), and figure 3b illustrates the average number of non-
technical NTMs (also at the 3-digit level).
Figure 3 displays several patterns. First, there is substantial variance across countries in the average
number of measures applied to imports, for both technical and non-technical measures. Second,
the agricultural sector is subject to a much larger number of technical measures than the
manufacturing sector in virtually all countries (scatter above the 450 line in figure 3a). Third, there is
little difference in the number of non-technical measures that countries apply to agriculture and
manufacturing (figure 3b).
Ferdi WP 218 Melo (de), J. and Nicita, A. >> Non-Tariff Measures: Data and Quantitative Tools of Analysis 15
Although PSs are informative of the average number of NTMs applied to sectors, a more
appropriate measure of differences in regulatory obligations across countries and sectors is the
Regulatory Intensity (RI) index presented in equation 4. This index standardizes PSs so as to
account for differences in regulatory burdens that are intrinsic to diverse products. Figure 4a plots
regulatory intensity indexes against prevalence score indices, along with a fitted line. Both indices
are computed across technical NTMs at the 3-digit level, taking world trade as weight.
Figure 4a shows that, although there is a strong positive correlation between prevalence score and
regulatory intensity, there are also many outliers (outliers also serve to signal the need for further
scrutiny that might help distinguish between the precautionary and protectionist motives of NTMs).
Ferdi WP 218 Melo (de), J. and Nicita, A. >> Non-Tariff Measures: Data and Quantitative Tools of Analysis 16
Moreover, in many cases the assessment of regulatory burdens leads to different results,
depending on whether burden is measured by RI or PS scores. For example, the degree of
regulatory burden of Australia (AUS) is higher than that of Brazil (BRA) when measured by the RI
index, whereas it is lower when measured by the PS index. As mentioned above, at this level of
aggregation, this discrepancy may reflect differences in the sectoral composition of imports
between the two countries (intrinsic difference in regulatory requirements across products) as well
as differences in regulatory obligations between the two countries.
Ferdi WP 218 Melo (de), J. and Nicita, A. >> Non-Tariff Measures: Data and Quantitative Tools of Analysis 17
Also note that this intrinsic difference was apparent from figure 3a which shows that agricultural
products are subject to a higher number of NTMs (technical measures) than most other products.
However, when measuring the regulatory burden by the RI index, this is not always the case (figure
4b). For example, the regulatory burden that China imposes on its imports of manufacturing
products is relatively stronger than the one it imposes on its imports of agricultural products.
Of greatest concern is how NTMs are correlated with outcome measures like trade variables
(measures of import intensity and product quality), GDP per capita, and tariffs. As a cautionary
note, the relationships involved being complex, modelling and econometric methods can be used
to disentangle their effects (see below and the examples in chapters 4 and 5). Still, descriptive
statistics are often used as preliminary assessments. Here we look at scatter plots of NTM incidence
measures and GDP per capita (figure 5) and at NTM measures with applied tariffs (figure 6).
Figure 5 plots coverage ratios for technical and non-technical measures against GDP per capita.
The following stylized patterns emerge. First, the use of technical measures (SPS and TBT) tends to
increase with the level of per capita income (figure 5a), while it is somewhat the opposite for other
types of NTMs. Regulatory expansion of technical measures is likely to reflect that, as economies
grow richer (and modernize), consumers demand more product variety and more product quality.
Hummels and Lugorvsky (2009) show that the unit value of imports increases with the level of
income, a reflection that consumers’ preferences switch towards higher-quality, safer products.
Expanding regulations may then be a response from regulatory agencies. For non-technical
measures, the negative correlation is driven by a substantial number of low-income countries that
apply these measures across-the-board to most imports. Second, the coverage ratio for non-
technical measures (figure 5b) appears to follow a bimodal distribution suggesting that while
countries are very heterogeneous in the application of technical measures, countries can largely be
grouped between those that are regular users of non-technical NTMs and those that apply them
only sporadically. Finally, although there is a positive correlation between technical measures and
per capita GDP, GDP per capita does not seem to be a particularly good predictor for the use of
NTMs. In other words, the variance in the use of NTMs (both technical and non-technical) is large at
all levels of income.
Ferdi WP 218 Melo (de), J. and Nicita, A. >> Non-Tariff Measures: Data and Quantitative Tools of Analysis 18
Ferdi WP 218 Melo (de), J. and Nicita, A. >> Non-Tariff Measures: Data and Quantitative Tools of Analysis 19
Another recurrent question in the analysis of NTMs is policy substitution, that is, whether countries
use NTMs as alternative instrument to tariffs in pursuing their trade policy objectives, or whether
they use NTMs to support their tariff structure. Figure 6 illustrates the relationship between
prevalence scores and simple average tariffs.
Ferdi WP 218 Melo (de), J. and Nicita, A. >> Non-Tariff Measures: Data and Quantitative Tools of Analysis 20
Figure 6a shows that countries making most use of technical NTMs (SPS and TBTs) tend to be those
that have less restrictive tariffs. On the other hand, countries that have more restrictive tariffs are
also those which use non-technical NTMs the most. Although informative, these results need to be
treated with caution. In particular, the negative correlation of figure 6a between technical
measures and tariffs is probably spurious as GDP per capita is associated both with the use of NTMs
(as shown in figure 5) and with the restrictiveness of tariffs (higher-income countries tend to have
lower tariffs). Similar caution should be taken in interpreting the results for non-technical measures
of figure 6b. Spurious correlation and omitted variables bias are reasons why this is issue is better
investigated with econometric methods.
Particular types of NTMs, in particular technical measures, are relevant for trade in relation to their
stringency, but more so in their differences between trading partners. Although regulatory
divergence is better assessed at the sectoral level, aggregate statistics can provide information on
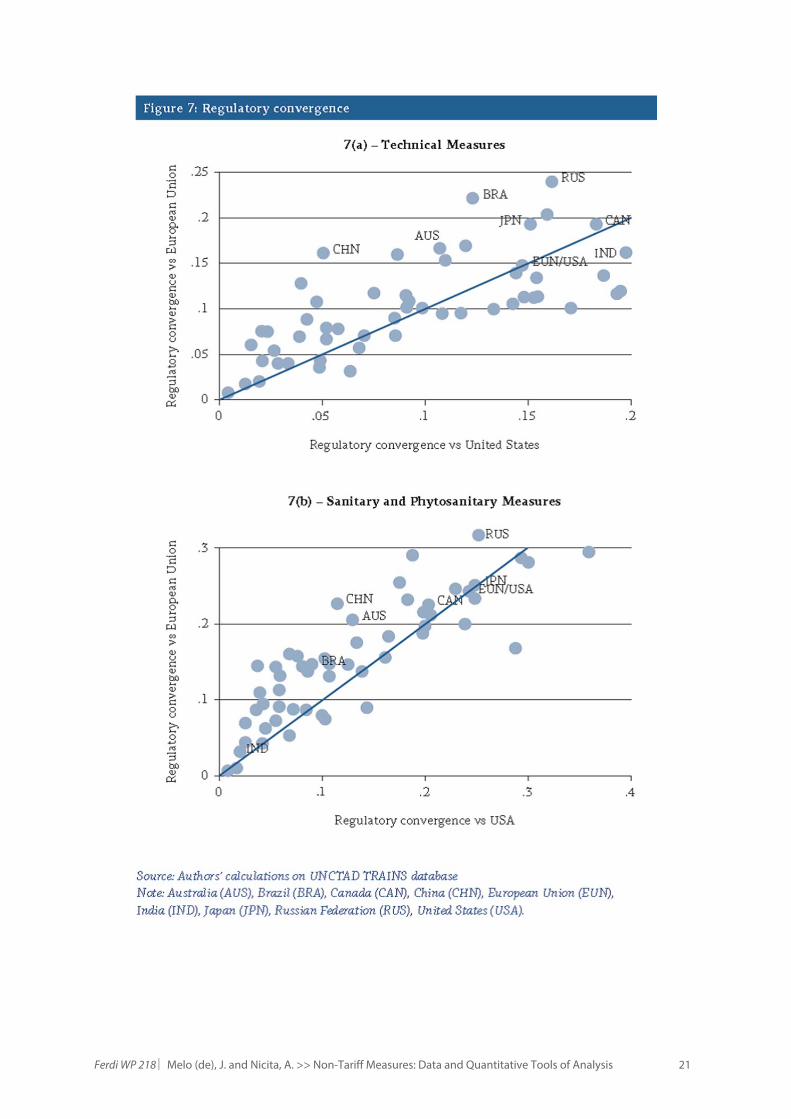
whether regulatory frameworks are relatively different from each other. Figure 7 illustrates
regulatory convergence (constructed as: 1 - regulatory distance) of countries vis-à-vis the United
States and vis-à-vise the European Union (a lower value of the index indicates greater regulatory
proximity). Figure 7a shows regulatory convergence across all technical measures covering overall
trade, while figure 7b shows regulatory convergence calculated only on SPS measures on the
agricultural sector. To facilitate reading, the figures also show a 450 line. Countries below the 450
line have a regulatory framework relatively closer to the United States than to the European Union,
and vice versa for countries above the 450 line.
Figure 7 reveals two stylized patterns. First, there is a significant variance across countries. That is,
the regulatory frameworks of many countries do not resemble either that of the United States or
that of the European Union. Second, there is a substantial correlation between regulatory
convergence to the United States and to the European Union. This correlation is because the
European Union and the United States have relatively high regulatory convergence between each
other (the index is about 0.15 for overall trade and about 0.25 for SPS measures in agriculture).
Therefore, countries whose regulatory framework is similar to that of the European Union also tend
to have regulatory frameworks that are similar to that of the United States. However, the figure
illustrates that some countries have a regulatory structure relatively closer to the European Union
(e.g. Russian Federation) while others are closer to the United States (e.g. Malaysia). Interestingly,
the large majority of countries have a regulatory structure more similar to the European Union than
to the United States in relation to SPS measures in the agricultural sector. This is probably because
the sample has many ACP countries that trade extensively agricultural products with their former
colonial heads that share a close regulatory structure at the EU level.
Ferdi WP 218 Melo (de), J. and Nicita, A. >> Non-Tariff Measures: Data and Quantitative Tools of Analysis 21
Ferdi WP 218 Melo (de), J. and Nicita, A. >> Non-Tariff Measures: Data and Quantitative Tools of Analysis 22
5. Quantitative assessments
Incidence indicators are useful to describe the landscape across NTMs and across products, sectors
and countries but they provide no information on their impact. Because of their diversity, the
quantification of their economic effects requires NTM-specific methodologies. 16 Several challenges
must be faced. First is the diversity of NTM measures, not only in terms of their scope but also in
terms of the mechanism through which they may affect economic variables. That is, the methods
that should be applied for investigating the economic impact of a quota on trade are very different
from the methods used for investigating that of an SPS or TBT measure. Second, the impact of
NTMs on trade depends on specific circumstances (e.g. NTMs are very diverse in type, design and
implementation). Third, only rarely, does one have data on NTMs over time (e.g. changes in the
intensity of MRLs). Of note, is that the dimensionality issues described above are particularly
important as types of NTMs often overlap, therefore making the identification of the effect of
specific NTMs problematic. Therefore, their overall importance, let alone their effects cannot be
computed only on the basis of their prevalence.
Two widely-used methods used to analyze NTMs the effects of NTMs are discussed here along with
examples: (i) the price-gap method; (ii) the econometric method. A third, simulation from
calibrated partial or general equilibrium models, is not covered here. Both approaches quantify the
effects of NTMs on quantities that are then translated into Ad Valorem Equivalents (AVEs),
sometimes referred to as implicit rates of protection even though price increases can reflect
different types of protection.17 Both methods are reviewed here with illustrative examples of the
overall impact of NTMs for a country, a sector or a specific sector in a country or group of countries.
The measure-by-measure analysis of the economic effects of NTMs are discussed in chapters 4 and
5 and in several applications in part II of this book.
5.1. The price-gap method
Ferrantino (2006) distinguishes between the “handicraft” and the “mass produced” econometric
methods to measure the effects on prices. The former, an arithmetic calculation, is suitable to cover
policies for a single product or for a single importing country with a few products. The latter covers
many products and many countries, as for example the evolution of trade costs reported in figure
7c.
The simplest direct measurement of the price impact of NTMs relies on the comparison of the price
of the product (here indexed by k) before and after the application of the measure (this is also
16 Bora et al. (2002) provide an early overview and Ferrantino (2006) offers an exhaustive discussion of the different quantification methods. Cadot et al. (2015) review several recent approaches, and Beghin Martens, and Swinnen (2015) survey the empirical literature on technical NTMs. 17 An increase in the price of a product that is harmful to health or the environment is a protection to the consumer.
Ferdi WP 218 Melo (de), J. and Nicita, A. >> Non-Tariff Measures: Data and Quantitative Tools of Analysis 23
referred to as a price wedge or price gap). An advantage of the price gap method is that it gives an
easy computation and interpretation of AVEs. The simplest expression of the AVE is:
1 (6)
where is the domestic price and is the cost insurance and freight (cif) world price for product
k – that is, the price landed at the border of the specific good (say rice) – t is the tariff and C are
other observable costs all expressed in ad valorem terms (percentages). However, while one can
infer international prices from existing trade statistics, it is often difficult to obtain the
corresponding price prevailing in the domestic market and it is very difficult to capture the other
costs that account for differences between cif border prices and final prices to the consumer.
Indeed, it is often very difficult to distinguish the impact of known NTMs from other factors which
contribute to price gaps, for example internal transportation costs (Dean et al., 2009).
Importantly, NTMs have effects that may not be manifested in prices. In particular, costs related to
NTMs could be internalized by firms which may decide to reduce their mark-ups so as to retain
market share. The price-gap method also assumes perfect substitution between domestic and
imported goods, i.e. homogeneity (or of the same quality). And even when these conditions hold,
the price-gap method can produce strikingly different results. 18 In practice, “handicraft” price-gap
calculations are only useful when all relevant information is available to produce convincing case
studies. Like quantity-based methods, these “Mass-produced” price comparisons rely on the
estimation of unit values from an econometric model. Both are discussed below.
5.2. Econometric Methods
The econometric methods used in part II of the Melo and Nicita volume revolve around detecting
the effects of NTMs on trade. These exercises typically involve two steps. In a first step, import
demand equations are estimated at a disaggregated level that corresponds to the level at which
NTM data are collected. The second step involves algebra to transform the estimated coefficients
into AVEs. Since NTMs are rarely available on a time-series basis, typically, the estimates are cross-
section. These average estimates can be made country-specific once the NTM variables are
interacted with country-specific characteristics like endowments or GDP per capita. However, the
AVE effect estimated at a certain level of a country’s characteristics does not really allow one to go
18 Ferrantino (2006, Box 2) gives examples of the handicraft approach to the price-gap method. The banana conflict (the longest running trade conflict in the World Trading System, lasting 18 years until 2009) is another illustrative example of the handicraft approach to the price-gap method. It revolved around determining the MFN tariff-rate that would replace the Tariff-Rate-Quota (TRQ) that the EU imposed on MFN bananas produced in Latin America to protect ACP suppliers (estimated rents with the TRQ were around $2 billion annually). The negotiations involved agreeing on the ad-valorem tariff that would be applied to so as to maintain the market share of MFN suppliers The ‘dessert’ banana is a homogenous good sold to all destinations in 17 kg. bags, ideally suited for the price-gap method. The EU, and others, chose the price-gap method to determine the tariff equivalent. Estimates of the AVE tariff equivalent diverged by 17% depending on the choice of price series and the tariff rate ranged between 45% and 10% according to authors (see Melo 2015, table 4 for the price-gap calculations and for the narrower range of estimates obtained by econometric and simulation methods).
Ferdi WP 218 Melo (de), J. and Nicita, A. >> Non-Tariff Measures: Data and Quantitative Tools of Analysis 24
beyond the average effect as this estimate does not inform about the actual restrictiveness of a
certain NTM in a given country. In effect, it is only informative if one is interested in the
restrictiveness of the NTM over the entire sample of countries. The same problem also arises with
estimation from variations in trade unit values.
While this is arguably the best that can be done to analyze the effects of NTMs at the macro level
with the available NTM data, these estimates are only as good as is the model at describing trade
flows in the absence of NTMs. This model should include determinants of trade costs beyond NTMs.
Trade models rely on restrictive assumptions that are arguably plausible for predicting trade
patterns at an aggregate level (or for a few sectors, e.g. agriculture and at most a few industry
categories) while NTMs are usually collected at the HS-6 level. One is interested in the effects of
NTMs on outcomes at these disaggregated levels. Whether quantity-based or price-based,
obtaining plausible AVE estimates at this level of disaggregation requires further ad-hoc decisions
at the estimation stage. This creates a tension between ‘top down’ (e.g. the estimates of trade costs
as in figure 7c and ‘bottom up’ approaches methods (as in figures 8 and 9).
It is noteworthy that in all econometric estimates, departures of actual trade from what is predicted
by the regression model (i.e. the residuals) are attributed to the NTMs. Since trade, NTMs and other
trade costs are jointly determined in equilibrium, estimated AVEs are a function of the trade
patterns so that a country with high trade will record a low AVE which, in turn, will validate a high
trade pattern, a reasoning that tends towards circularity. Instruments will help deal with this
endogeneity problem but one is still confronted with isolating the causal effect of NTMs on trade
flows.
With these caveats in mind, two models have been widely used to detect the effects of NTMs
across countries: (i) the factor endowment model where import demands are regressed on factor
endowments, country characteristics, tariffs and dummy variables capturing the presence of NTMS
(see estimates in figure 10), and (ii) the bilateral gravity model (see figure 7c). Even though
typically NTMs are not applied bilaterally, the gravity model has been widely used to estimate the
effects of NTMs because it has become the workhorse model to estimate the impact of trade costs
on aggregate trade flows. Its popularity comes from its close replication of two stylized patterns in
the data: (a) an elasticity of imports and an elasticity of exports to GDP, both very close to unity; (b)
a strong negative relationship between physical distance and trade. In the canonical ‘structural’
gravity model now used in all applications, in equilibrium, bilateral trade flows ( ) are given by:
(7)
where ( , ) are gross output in origin and destination countries, ( ) is world output, (Π ) and ( )
are outward and inward multilateral resistance terms in the origin and destination countries (these
Ferdi WP 218 Melo (de), J. and Nicita, A. >> Non-Tariff Measures: Data and Quantitative Tools of Analysis 25
terms are called multilateral because resistance in i and j depend on all trade costs). 19 ( ), are
bilateral trade costs modelled as iceberg costs (i.e. costs that do not imply the use of other
resources and are proportional to the amount shipped) and measures how trade flows respond
to changes in trade costs. In equilibrium, trade and income are determined jointly and trade costs
are assumed to be independent of trade flows and incomes. In this set up, trade between two
countries depends on the bilateral trade costs relative to the average trade costs they face with all
their trading partners and to internal versus external trade costs. The formulation in equation 7
comes out from a large family of trade models. 20 The formulation does not account for the
observation that bilateral trade costs are highly sensitive to trade volumes (see Hummels (1999)
and Fink et al. (2002)). It predicts that in a frictionless gravity world, bilateral trade would be
proportional to country size and inversely related to trade costs so the gravity model is about
measuring overall trade costs. These trade costs may be due to technology, tastes, market structure,
transport costs and trade policies like NTMs that impede trade between countries relative to a
frictionless world at a product level, though the formulation cannot disentangles the different
elements in these trade costs.
5.3. Application to the evolution of trade costs
Although many recent applications of the gravity model go beyond trade in goods (migration,
financial flows), and are carried out at different levels of aggregation (sectors, products, provinces),
much of its success comes from applications to trade in goods with most estimates at the
aggregate level where the problem of zero trade flows is less problematic. With a few assumptions,
Novy (2013) shows that equation 7 can be inverted to produce an estimate of the geometric
average of aggregate bilateral trade costs between countries on a yearly basis that is independent
19 Multilateral resistance refers to the barriers which country i and j face in their trade with all their trading partners (including internal trade). In applications, it controls for the degree of substitutability of trade among country partners. Multilateral resistance is often controlled for by using importer and exporter fixed effects. However, in the analysis of NTMs the inclusion of fixed effects presents a problem as they generally cancel out the NTM variable (as most NTMs are applied to all imports regardless of their origin). Baier and Bergstrand (2009) show that multilateral resistance can also be controlled for by using first-order Taylor series expansion to generate a linear approximation to the multilateral trade resistance terms. Although the application of this methodology is complex, it can be further simplified by assuming symmetric bilateral trade costs as in Baier and Bergstrand (2009) and Baier, Bergstrand and Mariutto (2014), who use weighted averages of gravity types variables. 20 Anderson and van Wincoop, (2003), Anderson (2011) and Head and Mayer, (2014) give detailed surveys. Equation (7) is the formulation of Anderson and Van Wincoop (2003). Novy (2013) shows that gravity equations result from three families of micro-founded trade models. In the best-known Anderson and van Wincoop (2003) model, production is exogenous and each country consumes all goods by trading a single good with its partners – trade is driven by the love of variety. Eaton and Kortum (2002) concentrate on the supply side in a Ricardian model where each firm’s productivity is drawn from a distribution leading each country to specialize in the lowest-cost good it can produce – trade is driven by relative productivities. Finally, in the heterogeneous firm models of Chaney (2008) and Melitz and Ottaviano (2008), firm productivities are also drawn from a distribution. In Chaney, each firm faces fixed costs of exporting, while in Melitz and Ottaviano firms face sunk costs of entry and firms have a comparative advantage in technology. For a hands-on exhaustive guide on applying and estimating gravity models see Yotov et al. 2016.
Ferdi WP 218 Melo (de), J. and Nicita, A. >> Non-Tariff Measures: Data and Quantitative Tools of Analysis 26
of technology. 21 These calibrated bilateral trade costs cover all costs--including NTMs-- that affect
international trade.
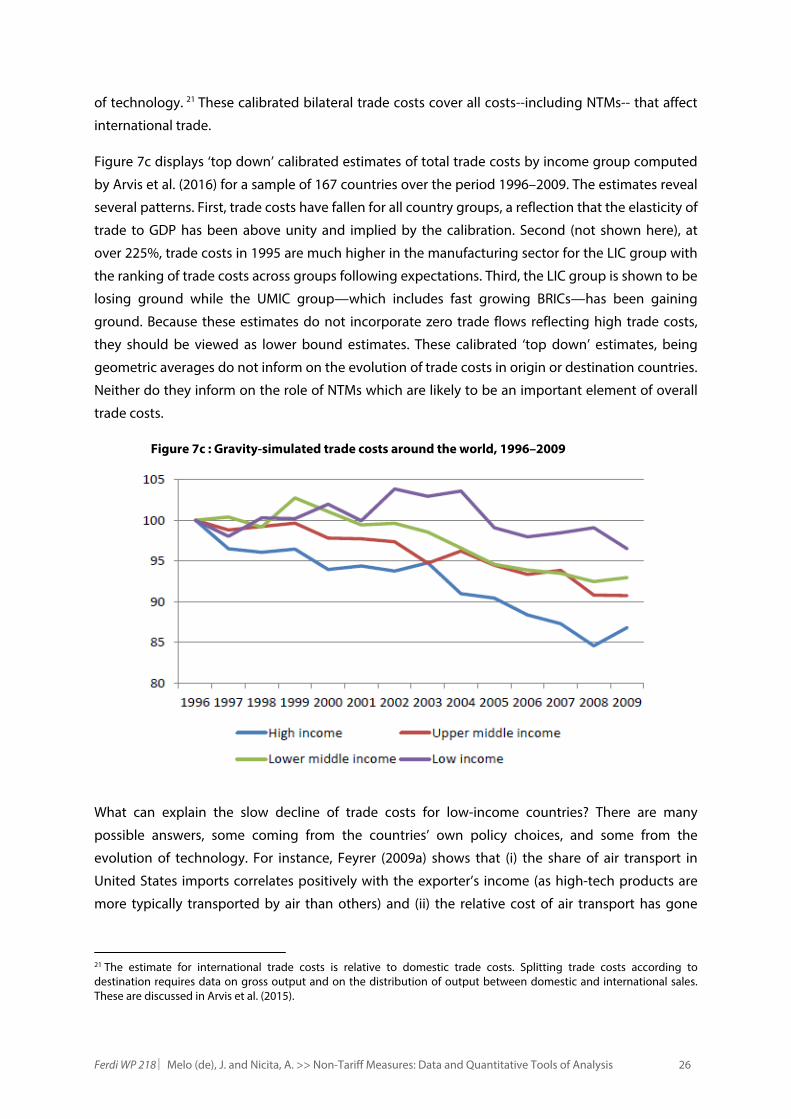
Figure 7c displays ‘top down’ calibrated estimates of total trade costs by income group computed
by Arvis et al. (2016) for a sample of 167 countries over the period 1996–2009. The estimates reveal
several patterns. First, trade costs have fallen for all country groups, a reflection that the elasticity of
trade to GDP has been above unity and implied by the calibration. Second (not shown here), at
over 225%, trade costs in 1995 are much higher in the manufacturing sector for the LIC group with
the ranking of trade costs across groups following expectations. Third, the LIC group is shown to be
losing ground while the UMIC group—which includes fast growing BRICs—has been gaining
ground. Because these estimates do not incorporate zero trade flows reflecting high trade costs,
they should be viewed as lower bound estimates. These calibrated ‘top down’ estimates, being
geometric averages do not inform on the evolution of trade costs in origin or destination countries.
Neither do they inform on the role of NTMs which are likely to be an important element of overall
trade costs.
Figure 7c : Gravity-simulated trade costs around the world, 1996–2009
What can explain the slow decline of trade costs for low-income countries? There are many
possible answers, some coming from the countries’ own policy choices, and some from the
evolution of technology. For instance, Feyrer (2009a) shows that (i) the share of air transport in
United States imports correlates positively with the exporter’s income (as high-tech products are
more typically transported by air than others) and (ii) the relative cost of air transport has gone
21 The estimate for international trade costs is relative to domestic trade costs. Splitting trade costs according to destination requires data on gross output and on the distribution of output between domestic and international sales. These are discussed in Arvis et al. (2015).
Ferdi WP 218 Melo (de), J. and Nicita, A. >> Non-Tariff Measures: Data and Quantitative Tools of Analysis 27
down dramatically compared with sea transport. Thus, because of their initial positioning in the
product ladder, low-income countries stood to gain less from the reduction in air transport costs
and did gain less. Since trade costs also include the effects of NTMs it could also be that the spread
of non-discriminatory NTMs in high-income countries impose, on average, a higher cost burden for
low-income countries as shown by Xiong and Beghin for MRLs on plant products.
5.4. Applications to non-tariff measures
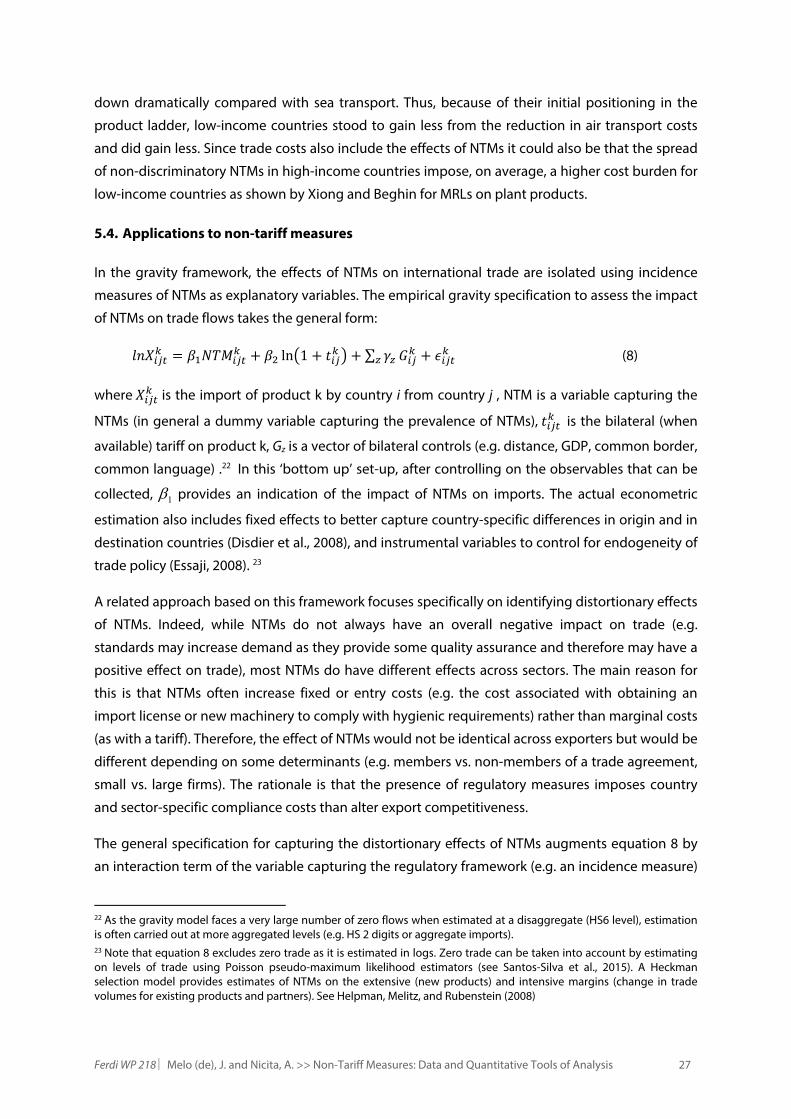
In the gravity framework, the effects of NTMs on international trade are isolated using incidence
measures of NTMs as explanatory variables. The empirical gravity specification to assess the impact
of NTMs on trade flows takes the general form:
ln 1 ∑ (8)
where is the import of product k by country i from country j , NTM is a variable capturing the
NTMs (in general a dummy variable capturing the prevalence of NTMs), is the bilateral (when
available) tariff on product k, Gz is a vector of bilateral controls (e.g. distance, GDP, common border,
common language) .22 In this ‘bottom up’ set-up, after controlling on the observables that can be
collected, 1 provides an indication of the impact of NTMs on imports. The actual econometric
estimation also includes fixed effects to better capture country-specific differences in origin and in
destination countries (Disdier et al., 2008), and instrumental variables to control for endogeneity of
trade policy (Essaji, 2008). 23
A related approach based on this framework focuses specifically on identifying distortionary effects
of NTMs. Indeed, while NTMs do not always have an overall negative impact on trade (e.g.
standards may increase demand as they provide some quality assurance and therefore may have a
positive effect on trade), most NTMs do have different effects across sectors. The main reason for
this is that NTMs often increase fixed or entry costs (e.g. the cost associated with obtaining an
import license or new machinery to comply with hygienic requirements) rather than marginal costs
(as with a tariff). Therefore, the effect of NTMs would not be identical across exporters but would be
different depending on some determinants (e.g. members vs. non-members of a trade agreement,
small vs. large firms). The rationale is that the presence of regulatory measures imposes country
and sector-specific compliance costs than alter export competitiveness.
The general specification for capturing the distortionary effects of NTMs augments equation 8 by
an interaction term of the variable capturing the regulatory framework (e.g. an incidence measure)
22 As the gravity model faces a very large number of zero flows when estimated at a disaggregate (HS6 level), estimation is often carried out at more aggregated levels (e.g. HS 2 digits or aggregate imports). 23 Note that equation 8 excludes zero trade as it is estimated in logs. Zero trade can be taken into account by estimating on levels of trade using Poisson pseudo-maximum likelihood estimators (see Santos-Silva et al., 2015). A Heckman selection model provides estimates of NTMs on the extensive (new products) and intensive margins (change in trade volumes for existing products and partners). See Helpman, Melitz, and Rubenstein (2008)
Ferdi WP 218 Melo (de), J. and Nicita, A. >> Non-Tariff Measures: Data and Quantitative Tools of Analysis 28
and a variable capturing compliance capacity (e.g. firm size, GDP per capita, presence of a trade
agreement). Among the various studies examining distortionary effects of NTMs are Disdier et al.
(2008), Essaji (2008), Xiong and Beghin (2015), Fontagné et al. (2015), Nicita and Murina (2017), and
Nicita and Seiermann (2017). All these studies find that regulatory burdens have a disproportionate
effect on export capacities of low-income countries and smaller firms.
Figure 8 reports costs of compliance across sectors (as measured by AVEs) of NTMs applied in the
Group of 20 (G20) countries on exporters in the least developed countries (LDCs) and non-LDCs. Of
interest in these studies is that the estimated costs of compliance are found to be systematically
higher for LDCs' exporters relative to other exporters.
Kee et al. (2009) propose a somewhat different approach to estimate the effect of NTMs at the
importer and product level. Starting from the assumption that the conditions to represent GDP by
a revenue function are met (i.e. an economy in a perfect competition equilibrium where factors of
production include capital labor and imports), Kee et al. estimate demand for imports for each
country and product. The regression equation of this model takes the form:
ln 1 ∑ , ∑ (9)
where t is the tariff, NTM is a dummy variable capturing the presence of one or more NTMs, C is a
set of z factor endowments (labour, land and capital). As above, k denotes goods and i is the
importing country. The quantity impact of NTMs on trade is given by the coefficients. The ad
valorem equivalent (AVE) can then be calculated using import demand elasticities (Kee et al., 2008).
Thus the method of Kee et al. provides an estimate of an overall trade restrictiveness index (OTRI)
Ferdi WP 218 Melo (de), J. and Nicita, A. >> Non-Tariff Measures: Data and Quantitative Tools of Analysis 29
that measures the average level of protection (aggregating tariffs and NTMs in ad valorem terms),
which would leave aggregate imports at their observed level. That is, the OTRI captures the
average level of protection that all trade policy instruments grant to domestic producers.
Figure 9 illustrates the OTRI faced by exporters in high-, middle- and low-income countries. It
shows that low-income countries tend to face high restrictions in terms of NTMs.
A general problem with estimating directly the impact of NTMs on the value of trade is that NTMs
influence primarily prices. In practice, the imposition of NTMs could result in an increase in price
and a reduction in quantity, leaving the value of trade unaffected (import demand elasticity of
unity). Although this is somewhat taken into account by the use of import demand elasticities in
calculating the AVE, most recent studies have adapted the methods of Kee et al. (2009) to unit
value estimations (Cadot and Gourdon, 2016, Cadot et al. 2015) and to quantity regressions where
import demand elasticities are jointly estimated with AVEs (Kee and Nicita, 2017).
Another problem with estimating AVE relates to possible positive effects of NTMs on trade. As
discussed above, NTMs in the forms of standard may be demand-enhancing and hence trade-
inducing rather than trade-restricting (e.g. because of lower information costs and quality
assurance). This implies that technical NTMs, although increasing the price of the good, may also
induce an increase in quantity traded. This issue is covered at greater length in Chapter 5 of this
volume. With regard to the discussion here, one should note that estimation of technical NTMs
should allow for positive AVE estimates.
Ferdi WP 218 Melo (de), J. and Nicita, A. >> Non-Tariff Measures: Data and Quantitative Tools of Analysis 30
6. Concluding remarks
Goods that are traded must comply with a large and increasing set of regulations and requirements.
This is a reflection of the increasing complexity of traded products and of the increasing demand
for health, safety and environmental standards. While capturing the effects of these NTMs remains
a daunting task, the considerable improvement both in the availability of data on NTMs and in the
methods of analysis has improved our understanding of the effects of these measures. Because of
the intricacies and complexity of NTMs, assessments require a good understanding of the
peculiarity of NTM data as well as the technicalities of economic assessments.
In relation to the data, it is difficult to assemble information into a comprehensive database.
Databases on NTMs are often made up from information originating in regulatory texts. This results
in a number of limitations such as lack of comprehensiveness (it is difficult and costly to
exhaustively collect primary information) and lack of precision (the exact requirements of a
regulation cannot be easily converted into data). As a consequence, most readily available
databases on NTMs consist in a simple inventory on the presence of NTMs. In spite of these
limitations, an application of the simple descriptive statistics presented here can help give
descriptive information on the prevalence of NTMs and on some of their characteristics.
In regard to quantification of the effects of NTMs, analysts are interested in their effects on trade
and welfare. This paper illustrates the approaches in assessing the effects of NTMs and their
limitations. Price-based and quantity-based approaches to estimate AVEs are discussed along with
methods to measure distortionary costs of NTMs. Importantly, the quantification of the effects of
NTMs are subject to a number of econometric challenges (zero trade flows, measurement errors,
difficulty to control for omitted variables and endogeneity). Moreover, collinearity among the
various NTM measures makes it difficult to estimate the effects of specific NTMs. Lack of consistent
and reliable time-series of NTMs presents an important constraint preventing a more precise
estimation of the effects of NTMs.
Ferdi WP 218 Melo (de), J. and Nicita, A. >> Non-Tariff Measures: Data and Quantitative Tools of Analysis 31
References
Anderson, J. (2011). The Gravity Model. Annual Review of Economics, 3(1), 133-60
Anderson J. and van Wincoop E. (2003). Gravity with gravitas: a solution to the border puzzle. American Economic Review. 93(1):170–192.
Arvis J-F, Duval Y, Shepherd B, Utoktham C and Raj A (2015). Trade costs in the developing world: 1996-2010. World Trade Review. 15(3):451–474.
Baier S.L. and Bergstrand J.H. (2009). Bonus vetus OLS: a simple method for approximating international trade-cost effects using the gravity equation. Journal of International Economics. 77(1):77–85.
Baier, S.L., Bergstrand, J.H. and Mariutto R. (2014), Economic Determinants of Free Trade Agreements Revisited: Distinguishing Sources of Interdependence. Review of International Economics, 22: 31–58.
Beghin JC., Martens M., and Swinnen J (2015b). Nontariff measures and standards in trade and global value chains. Annual Review of Resource Economics. 7(1):425–450.
Beghin, J. and B. Xiong (2018. Quantifying Standard-like Non-Tariff Measures and Assessing their Trade and Welfare Effects. Chp. 5 in Melo and Nicita eds.
Bora B., Kuwahara A. and Laird S. (2002). Quantification of Non-tariff Barriers. Policy Issues in International Trade and Commodities Study Series No. 18. United Nations publication.
Cadot, O. and Malouche M. (2012) Non-tariff Measures: A fresh Look at Trade Policy’s New Frontier, CEPR and World Bank
Cadot, O., A. Asprilla, J. Gourdon, C. Knebel and R. Peters (2015) Deep Regional Integration and non-tariff measures: A methodology for data analysis, UNCTAD policy issues in international trade and commodities research study #69: Geneva, United Nations.
Cadot O. and Gourdon J.(2016). Non-Tariff Measures, Preferential Trade Agreements and Prices: New Evidence, Review of World Economics.
Chaney T. (2008). Distorted gravity: the intensive and extensive margins of international trade. American Economic Review. 98(4):1707–1721.
Chen N., and Novy D. (2012). On the measurement of trade costs: direct vs. indirect approaches to quantifying standards and technical regulations. World Trade Review. 11(3)401–414.
Crozet M. and Koenig P. (2010). Structural gravity equations with intensive and extensive margins. Canadian Journal of Economics/Revue canadienne d'économique. 43(1):41–62.
Dean, J., Robert Feinberg, Jose Signoret, Rodney Ludema and Michael Ferrantino (2009) The B.E. Journal of Economic Analysis & Policy, Contributions 9. 1 (2009).
Deardorff A.V. and Stern R.M. (1998). Measurement of Non-tariff Barriers. Studies in International Economics, the University of Michigan.
Disdier A-C, Fontagné L., and Mimouni M. (2008). The impact of regulations on agricultural trade: evidence from the SPS and TBT agreements. American Journal of Agricultural Economics. 90(2):336–350.
Eaton J and Kortum S (2002). Technology, geography, and trade. Econometrica. 70(5):1741–1779.
Ederington J and Minier J (2003). Is environmental policy a secondary trade barrier? An empirical analysis. Canadian Journal of Economics/Revue canadienne d'économique. 36(1):137–154.
Ederington J. and Ruta M. (2016). Non-tariff measures and the world trading system. Handbook of Commercial Policy, Elsevier, North-Holland, also World Bank PRWP #7661
Essaji A. (2008). Technical regulations and specialization in international trade. Journal of International Economics. 76(2):166–176.
Ferrantino M.J. (2006). Quantifying the trade and economic effects of non-tariff measures. Trade Policy Paper No. 28. Organisation for Economic Co-operation and Development.
Ferdi WP 218 Melo (de), J. and Nicita, A. >> Non-Tariff Measures: Data and Quantitative Tools of Analysis 32
Feyrer, J (2009), Trade and Income--Exploiting Times Series in Geography, mimeo, Dartmouth College.
Fink, C. A. Mattoo and C. Neagu (2002) Trade in International Maritime Services: How Much Does Policy Matter, World Bank Economic Review, 16(1), 81-108.
Fontagné L, Orefice G, Piermartini R and Rocha N (2015). Product standards and margins of trade: firm-level evidence. Journal of International Economics. 97(1):29–44.
Gopinath G, Helpman E., and Rogoff K, eds. (2014). Handbook of International Economics. Volume 4. Elsevier.
Head K. and Mayer T. (2014). Gravity Equations: Workhorse, Toolkit, and Cookbook in Gopinath et al. eds.
Helpman, E. Melitz, M. and Rubenstein, Y (2008) Estimating Trade Flows: Trading Partners and Trade Volumes, Quarterly Journal of Economics, 123(2), 441-87.
Hoekman, B. and Nicita A. (2018) Non-Tariff Measures and Trade Facilitation: WTO Disciplines and Policy Space. Chp. 2 in in Melo and Nicita eds.
Hummels, D. (1999) Towards a Geography of Transport Costs, GTAP working paper #1162, Purdue University.
Hummels, D. and V. Lugovsky (2009) International Pricing in a Model of Ideal Variety, Journal of Money, Credit and Banking, 4, 3-33
Kee H.L., Nicita A. and Olarreaga M. (2008). Import demand elasticities and trade distortions. The Review of Economics and Statistics. 90(4):666–682.
Kee H.L., Nicita A. and Olarreaga M. (2009). Estimating trade restrictiveness indices. Economic Journal. 119:172–199.
Kee H.L. and Nicita A. (2017). Trade Frauds, Trade Elasticities and Non-Tariff Measures, mimeo, World Bank. (http://pubdocs.worldbank.org/en/315201480958601753/3-KEE-paper.pdf)
Melitz M.J. and Ottaviano G. (2008). Market size, trade, and productivity. Review of Economic Studies. 75(1)295–316.
Melo, J. de (2015) Bananas, the GATT, the WTO, and EU and US domestic Policies. Journal of Economic Studies, vol. 42, pp. 377-99
Melo J de and Nicita A eds. (2018a). Non-Tariff Measures: Economic Assessment and Policy Measures. UNCTAD, https://drive.google.com/file/d/1VJiZVcFZZ7b_1zEdfvidrkW25rslLR1H/view?usp=sharing
Melo, J. de and B. Shepherd (2018b). The Economics of NTMs: A Primer, chapter 4 in Melo and Nicita eds.
Murina M. and Nicita A. (2017). Trading with conditions: the effect of sanitary and phytosanitary measures on the agricultural exports from low-income countries. The World Economy. 40(1):168–181.
Nicita A. and Seiermann J. (2017), G20 Policies and Export Performance of Least Developed Countries. Policy Issues in International Trade and Commodities Research Study Series No. 75. United Nations publication.
Novy D. (2013). Gravity redux: measuring international trade costs with panel data. Economic Inquiry. 51(1):101–121.
Piermartini R. and Yotov Y. (2016). Estimating trade policy effects with structural gravity. Working Paper Series No. 6009. CESifo Group Munich.
Santos-Silva JM, Tenreyro S. and Windmeijer F. (2015). Testing competing models for non-negative data with many zeros. Journal of Econometric Methods. 4(1):1–18.
Staiger R. (2012). Non-tariff measures and the WTO. Staff Working Paper ERSD-2012- 01. World Trade Organization.
Trefler, D. (1993). Trade liberalization and the Theory of Endogenous Protection. Journal of Political Economy, 101(1), 138-60
UNCTAD (2010). Non-Tariff Measures: Evidence from Selected Developing Countries and Future Research Agenda. United Nations publication.
UNCTAD (2013). Non-Tariff Measures to Trade: Economic and Policy Issues for Developing Countries. United Nations. United Nations publication.
Ferdi WP 218 Melo (de), J. and Nicita, A. >> Non-Tariff Measures: Data and Quantitative Tools of Analysis 33
UNCTAD (2016). Guidelines to Collect Data on Official Non-Tariff Measures. United Nations publication. Available at http://unctad.org/en/PublicationsLibrary/ditctab2014d4_en.pdf
Xiong B. and Beghin J. (2014). Disentangling demand-enhancing and trade-cost effects of maximum residue regulations. Economic Inquiry. 52(3):1190-1203.
Yang, L., O. Cadot, R. Anandikha and S. Urata (2016) “Non-Tariff Measures in ASEAN: A Simple Proposal”, FERD WP#
Yotov Y. (2012). A simple solution to the distance puzzle in international trade. , School of Economics Working Paper Series No 2012-6. LeBow College of Business. Drexel University.
Yotov, Y., Piermatini, R., Monteiro, J.A., and Larch, M. (2016) An Advanced Guide to Trade Policy Analysis: The Structural Gravity Model. Available at https://www.wto.org/english/res_e/booksp_e/advancedwtounctad2016_e.pdf.
“Sur quoi la fondera-t-il l’économie du monde qu’il veut gouverner? Sera-ce sur le caprice de chaque particulier? Quelle confusion! Sera-ce sur la justice? Il l’ignore.”
Pascal
“Sur quoi la fondera-t-il l’économie du monde qu’il veut gouverner? Sera-ce sur le caprice de chaque particulier? Quelle confusion! Sera-ce sur la justice? Il l’ignore.”
Pascal
Created in 2003 , the Fondation pour les études et recherches sur le développement international aims to promote a fuller understanding of international economic development and the factors that influence it.