Non-trivial scaling of self-phasemodulation and three-photon absorption
in III-V photonic crystal waveguides
Chad Husko1,2∗, Sylvain Combrie1, Quynh Vy Tran1, FabriceRaineri3,4, Chee Wei Wong2, Alfredo De Rossi1∗
1Thales Research and Technology, Route Departementale 128, 91767 Palaiseau, France2 Optical Nanostructures Laboratory, Columbia University, New York, NY 10027 USA
3 Laboratoire de Photonique et de Nanostructures (CNRS UPR 20), Route de Nozay, 91460Marcoussis, France
Abstract: We investigate the nonlinear response of photonic crystalwaveguides with suppressed two-photon absorption. A moderate decreaseof the group velocity (∼ c/6 to c/15, a factor of 2.5) results in a dramatic (×30) enhancement of three-photon absorption well beyond the expected scal-ing, ∝ 1/v3
g. This non-trivial scaling of the effective nonlinear coefficientsresults from pulse compression, which further enhances the optical fieldbeyond that of purely slow-group velocity interactions. These observationsare enabled in mm-long slow-light photonic crystal waveguides owing tothe strong anomalous group-velocity dispersion and positive chirp. Ournumerical physical model matches measurements remarkably.
References and links1. S. Harris, “Electromagnetically Induced Transparency,” Physics Today 50, 36 (1997).2. L. Hau, S. Harris, Z. Dutton, and C. Behroozi, “Light speed reduction to 17 metres per second in an ultracold
atomic gas,” Nature 397, 594 (1999).3. J. Longdell, E. Fraval, M. Sellars, and N. Manson, “Stopped light with storage times greater than one second
using electromagnetically induced transparency in a solid,” Phys. Rev. Lett. 95, 63601 (2005).4. L. Deng and M. Payne, “Inhibiting the onset of the three-photon destructive interference in ultraslow propagation-
enhanced four-wave mixing with dual induced transparency,” Phys. Rev. Lett. 91, 243902 (2003).5. X. Yang, M. Yu, D.-L. Kwong, and C. W. Wong, “All-optical analogue to electromagnetically induced trans-
parency in multiple coupled photonic crystal cavities,” Phys. Rev. Lett. 102, 173902 (2009).6. T. Baba, “Slow light in photonic crystals,” Nat. Photonics 2, 465 (2008).7. T. F. Krauss, “Why do we need slow light?” Nat. Photonics 2, 448 (2008).8. Y. Vlasov, M. O’Boyle, H. Hamann, and S. McNab, “Active control of slow light on a chip with photonic crystal
waveguides,” Nature 438, 65 (2005).9. M. A. Foster, R. Salem, D. F. Geraghty, A. C. Turner-Foster, M. Lipson, and A. L. Gaeta, “Silicon-chip-based
ultrafast optical oscilloscope,” Nature 456, 81 (2008).10. M. Pelusi, F. Luan, T. Vo, M. Lamont, S. Madden, D. A. Bulla, D.-Y. Choi, B. Luther-Davies, and B. Eggle-
ton, “Photonic-chip-based radio-frequency spectrum analyser with terahertz bandwidth,” Nat. Photonics 3, 139(2009).
11. J. Topolancik, B. Ilic, and F. Vollmer, “Experimental Observation of Strong Photon Localization in DisorderedPhotonic Crystal Waveguides,” Phys. Rev. Lett. 99, 253901 (2007).
#114956 - $15.00 USD Received 31 Jul 2009; revised 19 Sep 2009; accepted 13 Nov 2009; published 23 Nov 2009
(C) 2009 OSA 7 December 2009 / Vol. 17, No. 25 / OPTICS EXPRESS 22442
12. R. Engelen, D. Mori, T. Baba, and L. Kuipers, “Two regimes of slow-light losses revealed by adiabatic reductionof group velocity,” Phys. Rev. Let. 101, 103901 (2008).
13. A. Baron, A. Ryasnyanskiy, N. Dubreuil, P. Delaye, Q. Tran, S. Combrie, A. De Rossi, R. Frey, and G. Roosen,“Light localization induced enhancement of third order nonlinearities in a GaAs photonic crystal waveguide,”Opt. Express 17, 552 (2009).
14. M. Soljacic and J. D. Joannopoulos, “Enhancement of nonlinear effects using photonic crystals,” Nat. Materials3, 211 (2004).
15. J. F. McMillan, M. Yu, D.-L. Kwong, and C. W. Wong, “Observations of spontaneous Raman scattering in siliconslow-light photonic crystal waveguides,” Appl. Phys. Lett. 93, 251105 (2008).
16. Y. Okawachi, M. Bigelow, J. E. Sharping, Z. Zhu, A. Schweinsberg, D. J. Gauthier, R. W. Boyd, and A. L. Gaeta,“Tunable All-Optical Delays via Brillouin Slow Light in an Optical Fiber,” Phys. Rev. Lett. 94, 153902 (2005).
17. G. A. Siviloglou, S. Suntsov, R. El-Ganainy, R. Iwanow, G. I. Stegeman, D. N. Christodoulides, R. Morandotti,D. Modotto, A. Locatelli, C. D. Angelis, F. Pozzi, C. R. Stanley, and M. Sorel, “Enhanced third-order nonlineareffects in optical AlGaAs nanowires,” Opt. Express 14, 9327 (2006).
18. C. Monat, B. Corcoran, M. Ebnali-Heidari, C. Grillet, B. Eggleton, T. White, L. O’Faolain, and T. F. Krauss,“Slow light enhancement of nonlinear effects in silicon engineered photonic crystal waveguides,” Opt. Express17, 2944 (2009).
19. K. Inoue, H. Oda, N. Ikeda, and K. Asakawa, “Enhanced third-order nonlinear effects in slow-light photonic-crystal slab waveguides of line defect,” Opt. Express 17, 7206 (2009).
20. T. Carmon and K. J. Vahala, “Visible continuous emission from a silica microphotonic device by third-harmonicgeneration,” Nat. Physics 3, 430 (2007).
21. P. P. Markowicz, H. Tiryaki, H. Pudavar, P. N. Prasad, N. N. Lepeshkin, and R. W. Boyd, “Dramatic Enhancementof Third-Harmonic Generation in Three-Dimensional Photonic Crystals,” Phys. Rev. Lett. 92, 083903 (2004).
22. B. Corcoran, C. Monat, C. Grillet, D. Moss, B. Eggleton, T. White, L. O’Faolain, and T. F. Krauss, “Green lightemission in silicon through slow-light enhanced third-harmonic generation in photonic-crystal waveguides,” Nat.Photonics 3, 206 (2009).
23. S. Combrie, Q. V. Tran, E. Weidner, A. De Rossi, S. Cassette, P. Hamel, Y. Jaouen, R. Gabet, and A. Talneau, “In-vestigation of group delay, loss and disorder in a Photonic Crystal Waveguide by Low-Coherence Reflectometry,”Appl. Phys. Lett. 90, 231104 (2007).
24. G. Stegeman, “Material figures of merit and implications to all-optical waveguide switching,” Proc. SPIE 1852,75 (1993).
25. J. Kang, A. Villeneuve, M. Sheik-Bahae, G. Stegeman, K. Al-Hemyari, J. S. Aitchison, and C. N. lronside,“Limitation due to three-photon absorption on the useful spectral range for nonlinear optics in AlGaAs belowhalf band gap,” Appl. Phys. Lett. 65, 147 (1994).
26. A. Villeneuve, C. C. Yang, G. I. Stegeman, C.-H. Lin, and H.-H. Lin, “Ultrafast all-optical switching in semicon-ductor nonlinear directional couplers at half the band gap,” Appl. Phys. Lett. 62, 2465 (1993).
27. J. Aitchison, D. C. Hutchings, J. U. Kang, G. I. Stegeman, and A. Villeneuve, “The Nonlinear Optical Propertiesof AlGaAs at the Half Band Gap,” IEEE J. Quantum Electron. 33, 341 (1997).
28. S. Combrie, S. Bansropun, M. Lecomte, O. Parillaud, S. Cassette, H. Benisty, and J. Nagle, “Optimization of aninductively coupled plasma etching process of GaInP/GaAs based material for photonic band gap applications,”J. Vac. Sci. Technol. B 23, 1521 (2005).
29. Q. Tran, S. Combrie, P. Colman, and A. De Rossi, “Photonic crystal membrane waveguides with low insertionlosses ,” Appl. Phys. Lett. 95, 061105 (2009).
30. E. Weidner, S. Combrie, A. De Rossi, Q. Tran, and S. Cassette, “Nonlinear and bistable behavior of an ultrahigh-Q GaAs photonic crystal nanocavity,” Appl. Phys. Lett. 90, 101118 (2007).
31. A. Parini, P. Hamel, A. De Rossi, S. Combrie, Q. Tran, Y. Gottesman, R. Gabet, A. Talneau, Y. Jaoun, andG. Vadal, “Time-Wavelength Reflectance Maps of Photonic Crystal Waveguides: A New View on Disorder-Induced Scattering,” IEEE J. of Lightwave Tech. 26, 3794 (2008).
32. S. G. Johnson and J. D. Joannopoulos, “Block-iterative frequency-domain methods for Maxwell’s equations in aplanewave basis,” Opt. Express 8, 173 (2001).
33. Rigorous intensity autocorrelation measurements of the pulse were carried out at each wavelength and currentsetting.
34. E. Kuramochi, M. Notomi, S. Hughes, A. Shinya, T. Watanabe, and L. Ramunno, “Disorder-induced scatteringloss of line-defect waveguides in photonic crystal slabs,” Phys. Rev. B 72, 161318 (2005).
35. B.S. Wherrett, “Scaling rules for multiphoton interband absorption in semiconductors,” J. Opt. Soc. Am. B 1, 67(1984).
36. S. Huges, L. Ramunno, J. F. Young, and J. Sipe, “Extrinsic Optical Scattering Loss in Photonic Crystal Waveg-uides: Role of Fabrication Disorder and Photon Group Velocity,” Phys. Rev. Lett. 94, 033903 (2005).
37. S. Combrie, E. Weidner, A. De Rossi, S. Bansropun, S. Cassette, A. Talneau, and H. Benisty, “Detailed analysisby Fabry-Perot method of slab photonic crystal line-defect waveguides and cavities in aluminium-free materialsystem,” Opt. Express 14, 7353 (2006).
38. A group-index dependent effective area for the slow-light PhCWG is included in the fifth-order nonlinear scaling,
#114956 - $15.00 USD Received 31 Jul 2009; revised 19 Sep 2009; accepted 13 Nov 2009; published 23 Nov 2009
(C) 2009 OSA 7 December 2009 / Vol. 17, No. 25 / OPTICS EXPRESS 22443
with A5e f f defined as: A5e f f = V5e f fa =
[(∫n2 ε|E|2dV )3∫n2
ε|E|6dV
]1/2
.
39. J. I. Dadap, N. C. Panoiu, X. Chen, I. Hsieh, X. Liu, C. Chou, E. Dulkeith, S. J. McNab, F. Xia, W. M. J. Green,L. Sekaric, Y. A. Vlasov, and R. M. Osgood, Jr, “Nonlinear-optical phase modification in dispersion-engineeredSi photonic wires,” Opt. Express 16, 1280 (2008).
40. W. Ding, C. Benton, A. Gorbach, W. Wadsworth, J. Knight, D. Skryabin, M.Gnan, M. Sorrel, and R. M.De La Rue, “Solitons and spectral broadening in long silicon-on-insulator photonic wires,” Opt. Express 16,3310 (2008).
41. G. P. Agrawal, Nonlinear Fiber Optics (Academic, 2007).42. N. A. R. Bhat and J. Sipe, “Optical pulse propagation in nonlinear photonic crystals,” Phys. Rev. E 64, 056604
(2001).43. The vector definition is applicable to materials with large indices of refraction and tight confinement such as
PhCWGs: A3e f f = V3e f fa =
(∫n2
ε|E|2dV )2
∫n2
ε3 (|E·E|2+2|E|4dV
. The scalar definition is the typical: Ae f f = Ve f fa = (
∫n2 ε|E|2dV )2∫n2
ε|E|4dV.
44. M. Sheik-Bahae, D. Hagan, and E. W. Van Stryland, “Dispersion and band-gap scaling of the electronic Kerreffect in solids associated with two-photon absorption,” Phys. Rev. Lett. 65, 96 (1990).
45. The often cited linear loss definition, Le f f (linear) = (1− e−αL)/α , is not applicable in our current experimentto estimate φmax. We derive a more appropriate definition for when three-photon absorption, as opposed to linear
loss, is the dominant loss term: Le f f NL(ThPA) = 1Io√αα3
arctan
[2L3e f f Io
√αα3
1+e−αL√
1+2α3I2o L3e f f
], to be detailed elsewhere.
46. S. Kubo, D. Mori, and T. Baba, “Low-group-velocity and low-dispersion slow light in photonic crystal waveg-uides,” Opt. Lett. 32, 2981 (2007).
1. Introduction
Slow-light nonlinearities have been remarkably observed through quantum coherence and inter-ference in atomic systems, with group velocities of tens of meters per second and sub-100 kHzbandwidths[1, 2, 3, 4]. In solid-state systems such as photonic crystal cavities [5] or waveguides[6, 7, 8], modest slow group velocities of down to c/300 in comparison has been achieved butpossess THz bandwidths for chip-scale optical signal processing [9, 10]. The strong ab-initiostructural dispersion in slow-light photonic crystals waveguides (PhCWGs) not only gives riseto localized modes[11, 12, 13], but also dramatic enhancement of resonant and non-resonantnonlinearities[14, 15]. Third-order processes have also recently been observed for slow-light[16], self-phase modulation (SPM) [17, 18, 19], and third-harmonic generation in optical mi-crostructures [20, 21, 22]. Here we present the first observations of self-phase modulationlimited only by three-photon-absorption as well as evidence for pulse compression in slow-light GaInP photonic crystal waveguides. In contrast to previous self-phase modulation workin PhCWG[13, 18, 19], which was limited by the third-order two-photon absorption (TPA),here the nonlinear loss term is the fifth-order three-photon absorption. The different orders ofthe desirable and undesirable nonlinearities, along with tight modal confinement of the pho-tonic crystal, lead to the observation of novel optical effects. Remarkably the three-photonabsorption process demonstrates a 30-fold enhancement, and departs from the expected (1/v3
g)scaling, even when taking into account slow-light disorder scattering. Pulse compression wasfurther observed in our positive chirp due to the interaction of the Kerr effect with anomalousgroup velocity dispersion(GVD). These series of measurements show excellent match with ournumerical simulations including group-velocity-dependent nonlinearities and losses, and meas-ured group velocity dispersion through optical low-coherence reflectometry [23].
The origin of slow-light in photonic crystals arises from coherent Bragg reflections due tothe in-plane periodic PhCWG lattice, leading to an ultra-flat dispersion of the transverse electric(TE) field. At these so-called slow-light frequencies, the light effectively travels slowly throughthe lattice via multiple Bragg reflections, leading to an enhanced local field density. The localfield enhancement scales inversely with the group velocity, thus decreasing the threshold ofintensity-dependent nonlinear effects such as Kerr, multi-photon absorption, or Raman scatte-ring [6, 14, 15]. The combination of the engineered group velocity enhancement, along with
#114956 - $15.00 USD Received 31 Jul 2009; revised 19 Sep 2009; accepted 13 Nov 2009; published 23 Nov 2009
(C) 2009 OSA 7 December 2009 / Vol. 17, No. 25 / OPTICS EXPRESS 22444
the small modal effective area of PhCWGs (≈ 2× 10⁻¹³ m2), yields outstanding control overthe optical modes.
The optical Kerr-effect has long been studied for its utility in nonlinear all-optical de-vices [14, 24]. In addition to the desirable Kerr term, each material also has a nonlinear multi-photon absorption term. This fundamental material property induces several detrimental effects,such as: (a) limiting the Kerr-induced phase-shift, also called self-phase modulation (SPM); (b)inducing nonlinear and free-carrier absorption losses; (c) distorting the pulse via free-carrierdispersion; as well as (d) restricting the spectral range of any potential nonlinear optical devicessuch as all-optical switches[25]. In fact, several early studies point out that the wavelength rangeof the two-photon absorption (TPA) tail depends strongly on the quality of the molecular beamepitaxy (MBE) sample growth [25, 26, 27]. These fundamental obstacles must be overcome inorder to achieve practical nonlinear devices, such as all-optical switches, on-chip. With this in-sight, we selected the material system GaInP (Eg=1.9 eV) for its desirable nonlinear properties.With an energy bandgap at least 300 meV above the TPA range (Eg > 2hω), the GaInP sampleinvestigated here is well outside the range of potential defect states and the sole nonlinear lossmechanism is three-photon absorption (ThPA). Importantly, ThPA is negligible at the opticalintensities required for the Kerr-effects (> π phase-shifts) observed experimentally in this pa-per. The complete suppression of TPA and small impact of ThPA on the GaInP PhCWG openthe possibility of a significant spectral window for all-optical signal processing[25].
Wavele
ng
th (μ
m)
Time delay (ps)
(b)
1510 1520 1530 1540 15500.1
1
10
Tra
nsm
issi
on
(%
)
Wavelength (nm)
(a) 6.6 7.5 8.8 10.712.614.2
τdelay
|β2
| (
ps2
/m
m)
ng
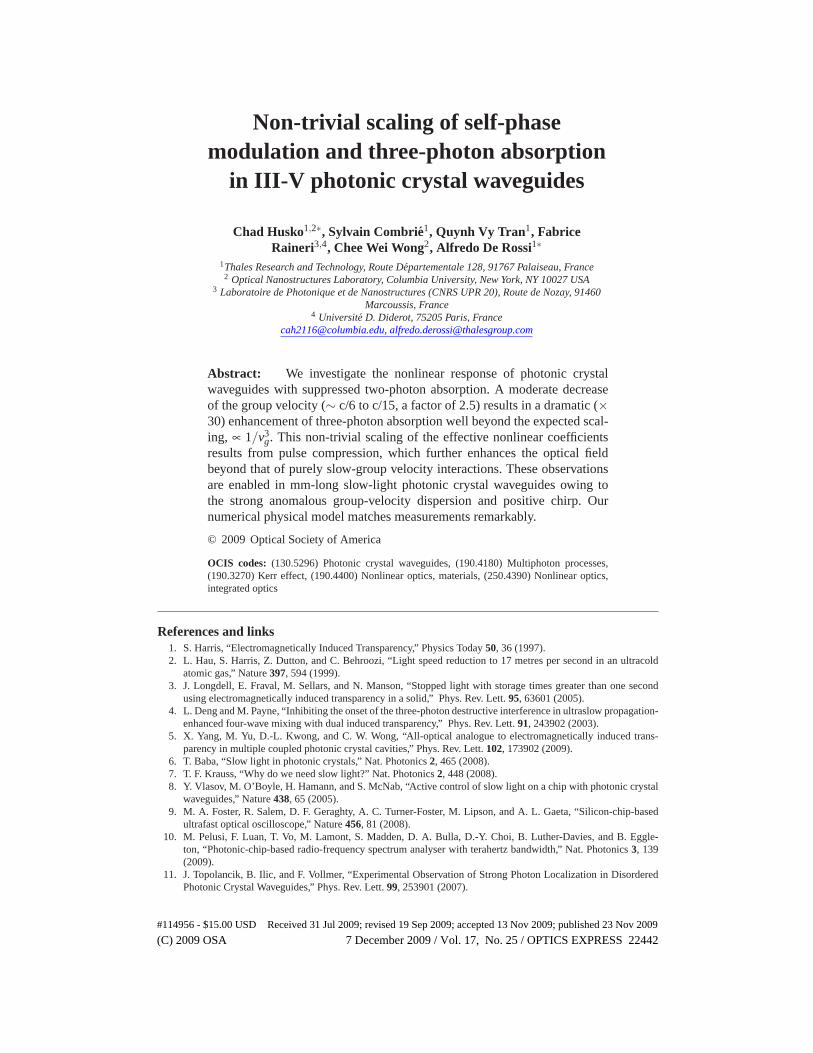
Fig. 1. (Color online) Linear properties: (a) Measured PhCWG transmission and corre-sponding ng of 6.6, 7.5, 8.8, 10.7, 12.6, 14.2, respectively, from low-coherence reflectome-try after Refs. [23, 31]. Inset: SEM image with scale bar of 1 μm. (b) Sample optical low-coherence reflectometry (OLCR) data used to extract ng = c τdelay
L . Inset: Extracted groupindices versus derived GVD coefficients.
#114956 - $15.00 USD Received 31 Jul 2009; revised 19 Sep 2009; accepted 13 Nov 2009; published 23 Nov 2009
(C) 2009 OSA 7 December 2009 / Vol. 17, No. 25 / OPTICS EXPRESS 22445
2. Experiment
2.1. Sample details and linear characterization
Our PhCWG sample is a W1 GaInP membrane of 190 nm thickness, with a hexagonal latticeconstant a of 480 nm, hole radius r ≈ 0.23a, and 1.5 mm length. The fabrication has beendescribed elsewhere [28] and the linear PhCWG transmission is illustrated in Figure 1(a). Wecarefully designed integrated mode-adapters [29] to reduce losses to ∼ 5 dB/facet at 1526nm [30] and suppress Fabry-Perot oscillations, though disordered propagation due to the latticeis clearly seen at the slow-light onset region [31]. Optical low-coherence reflectometry [23, 31][Fig. 1(b)] was used to extract the group indices. and the group velocity dispersion (GVD)[Fig. 1(b) inset] computed using complete 3D planewave expansion [32], with measurement-consistent group indices.
For the nonlinear measurements, we employed a wavelength-tunable mode-locked fiber laser(PriTel) with ≈ 3 to 5 ps pulses [33] (characterized with autocorrelator) at 22 MHz withtransverse-electric (electric-field in-plane) polarization. The output pulse monitored with aspectrum analyzer and an oscilloscope. The peak power coupled to the PhCWG Pc is definedas: Pc = ηKcPin, where the input peak power Pin (output power Pout) includes the objective loss(2 dB), mode mismatch (2 dB) η [29], with the coupling coefficient, Kc. The insertion loss dueto disorder varies with slow-light [34]; the values of which are extracted directly from Eqn. 1below.
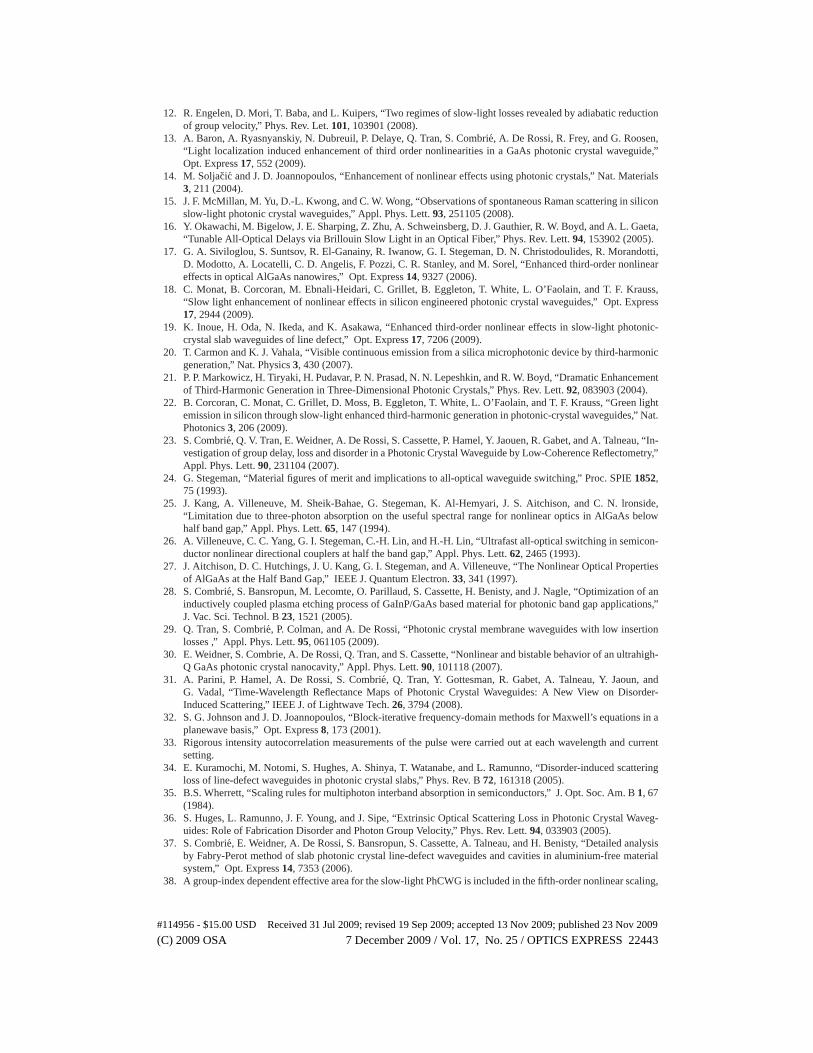
In Fig. 2(a), we first examined Pin −Pout at different group velocities and same input powerrange to illustrate the enhanced nonlinear absorption processes. At the largest group velocities,Pin−Pout is linear while at smaller group velocities the output power begins to saturate, indicat-ing the distinct onset and slow-light enhancement of ThPA, an intensity dependent loss mech-anism, in the slow-light regime. The nonlinear propagation equation (∂P/∂ z = −αP−α3P3)with symmetric input-output coupling gives:
1T 2 =
P2in
P2out
=1
η2K4c e−2αL +
2α3e f f L3e f f
K2c e−2αL P2
in, (1)
where α3e f f = α3A2
5e f f
(ngno
)3includes the 5th-order modal effective area, and L3e f f = (1 −
e−2αL)/(2α). The bulk α3 coefficient, ∼ 6× 10⁻²⁶m3/W 2, was calculated from a well-citedmodel[35], experimentally verified for the similar AlGaAs material in Ref. [27].
In Fig. 2(b), we illustrate an example plot of 1/T 2 versus P2in to extract the effective nonlinear
ThPA coefficient and coupling factor Kc at a particular group index ng of 8.8. We note thematerial-dispersion of the nonlinear susceptibilities is negligible within our measurementrange. An example two-photon absorption (1/T versus Pin) analysis [27] [Fig.2(c)] showsclear mismatch of the experimental data (blue squares) with the TPA fit (dashed line). Similarfits occur for all group velocities investigated, thus confirming the sample experiences onlythree-photon absorption. We note that, for the group velocities we examined, the linear losscoefficient α has been observed to scale [12, 34, 36] approximately as n2
g, with our measuredvalues of 1 dB/mm at 1526 nm [37]. In the semilog plot of Fig. 2(d), we illustrate the extractedthree-photon α3e f f values in the slow-light regime. In this first observation of three-photonabsorption in PhCWGs, we further emphasize that a surprising 30-fold enhancement inthree-photon coefficient from 0.15 to 4 W−2cm−1 was observed with ng increasing only from6.6 to 14.2. While the field enhancement of nonlinear absorption due to slow-light can bepredicted from the material(α3) and device parameters (ng) and is known to obey a prescribed
#114956 - $15.00 USD Received 31 Jul 2009; revised 19 Sep 2009; accepted 13 Nov 2009; published 23 Nov 2009
(C) 2009 OSA 7 December 2009 / Vol. 17, No. 25 / OPTICS EXPRESS 22446
1/
T
Pin (W)
(c)
α3
eff
(W
-2-c
m-1
)
ng
(d)α3eff (exp.)
α3eff =α3
A25eff
(ng
no
)3
Po
ut (W
)Pin (W)
(a)
1/
T2
Pin2 (W2)
(b)
Fig. 2. (Color online) Nonlinear measurements: (a): Pin −Pout depending on the group ve-locity. The increased curvature corresponds to larger nonlinear absorption due to slow-lightenhanced three-photon absorption (ThPA) at longer wavelengths. Key: 1526 nm(circles),1530nm(diamonds), 1534 nm(squares), 1538 nm(upward triangles), 1541 nm(downwardtriangles), and 1544 nm(stars). (b) Sample plot of the inverse transmission squared (1/T 2)versus P2
in at 1534 nm (ng=8.8). The points are experimental data and the line is the bestfit to extract the effective ThPA coefficient α3e f f . The key is the same as in (a). (c) Exam-ple inverse transmission (1/T ) versus Pc plot depicting the mismatch of (and negligible)two-photon absorption in our slow-light GaInP PhCWGs, for the same experimental dataof panel (b). (d) Extracted α3e f f (black dots) versus group index with the expected scalingof ThPA (solid red curve)
trend[14], here the deviation in the shape of the trajectory with group index (ng) is markedlydifferent than the scaling predicted from exclusively slow-light effects, an indication thatsome other field enhancement effect is involved. Moreover, this enhancement is by far fasterthan the predicted scaling from the definition of the ThPA coefficient [38], α3
A25e f f
( ngno
)3 ≈ 5.8
enhancement expected from simple slow-light effects. We now further elaborate on this pointin terms of pulse self-phase modulation due to the optical Kerr effect.
2.3. Nonlinear characterization - Kerr-effect
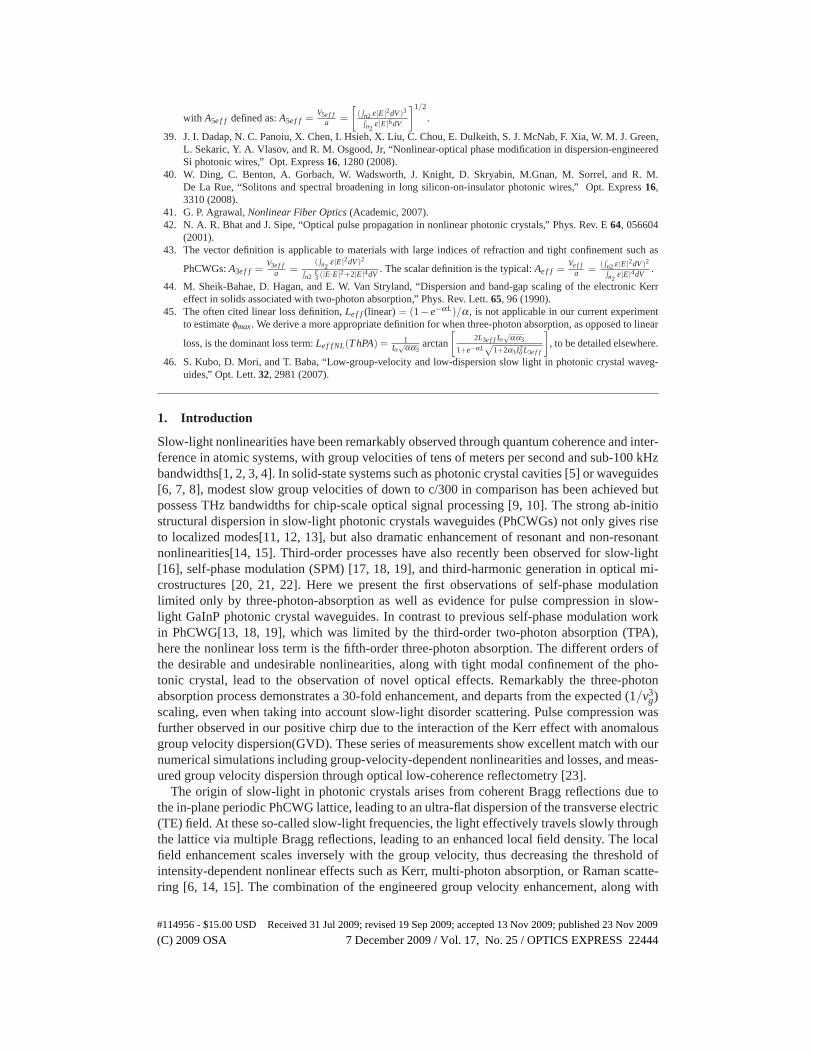
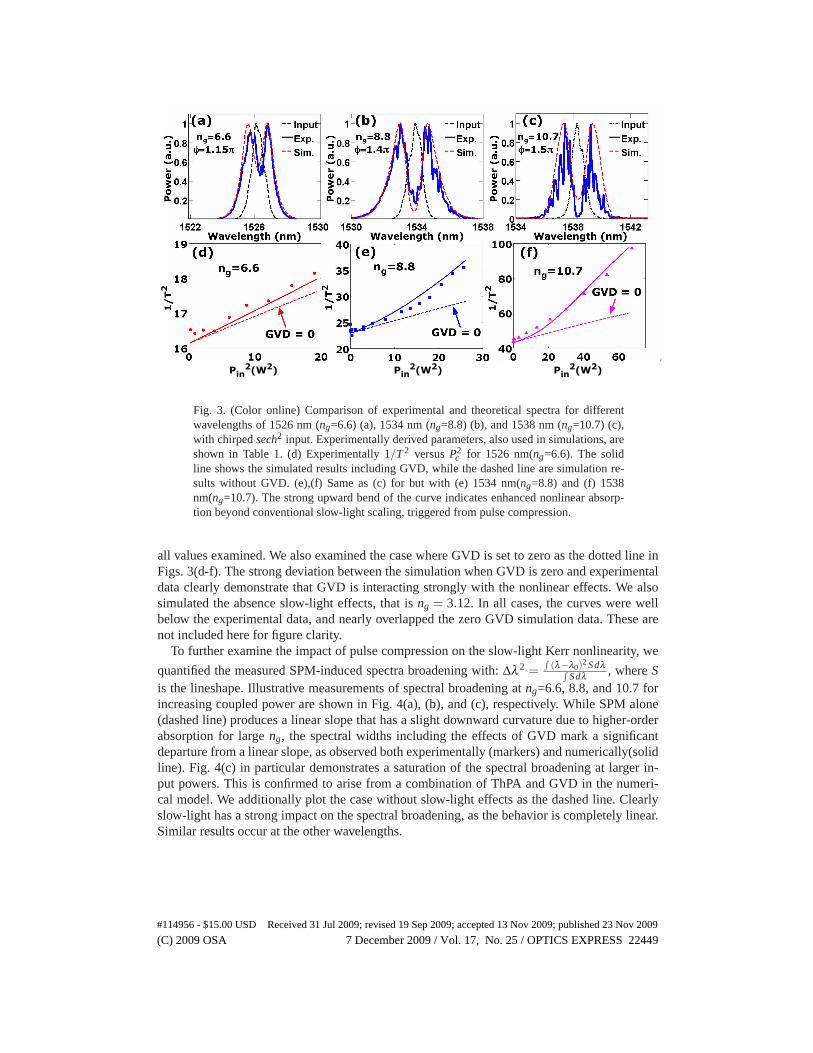
To further illuminate this nontrivial scaling, we measured the output spectra at different slowgroup velocities [1526, 1534, and 1538 nm in Figs. 3(a), (b), and (c) respectively]. At increasedinput intensities, the pulses undergo stronger Kerr self-phase modulation with the associatedspectral broadening. In each plot, we show examples of low (dot-dashed black line) and high(>2 W; solid blue line) power spectra. For group indices less than ∼ 10, a clear increase inspectral width was observed with increasing group index, while maintaining the same coupledpeak power. The fine-peaked structure in the pulse spectra is due to disorder-enhanced scatte-ring [31]. The high-power spectra exhibit symmetric double-peak structures characteristic of
#114956 - $15.00 USD Received 31 Jul 2009; revised 19 Sep 2009; accepted 13 Nov 2009; published 23 Nov 2009
(C) 2009 OSA 7 December 2009 / Vol. 17, No. 25 / OPTICS EXPRESS 22447
Kerr-induced SPM, where the pulse spectral symmetry rules out free-carrier dispersion gener-ated by ThPA [18] or third-order dispersion [39, 40].
Table 1. Parameters used in numerical simulationsParameter Value Value Value Value.Wavelength λ (nm) 1526 1530 1534 1538Pulse duration (FWHM) τ(ps) 5.0 4.4 4.5 3.0Chirp C 1.3 1.1 1.2 0.2Time-bandwidth product Δν τ 0.74 0.69 0.69 0.33Peak Power Pc(W ) 1.85 2.2 2.25 2.35Group index ng 6.6 7.5 8.8 10.7GVD β2(ps2/mm) −0.6 −0.97 −1.4 −2.2Eff. ThPA α3,e f f (cm−1W−2) 0.24 0.40 0.61 0.66SPM gain γ(cm−1W−1) 6.75 7.96 9.7 13.0
To further quantify our experimental results, we performed numerical simulations of thenonlinear Schrodinger equation[41]:
∂A∂ z
= −α2
A− α3e f f
2|A|4A+ iko
n2
A3e f f|A|2A− i
β2
2∂ 2A∂ t2 (2)
where A is the pulse envelope amplitude with Pc = |A|2, β2 [ps2/mm] the GVD parameter, z isthe propagation direction, and t defined in a moving reference frame. The effective nonlinear co-efficients are defined according to Ref. [42, 43] and modes from planewave expansion [32]. Wecomputed A5e f f for the fifth-order nonlinearity, ThPA, and A3e f f for the third-order Kerr nonlin-earity. Our calculations show that A5e f f ≈ 0.75A3e f f over the wavelength range and waveguidegeometry examined here. The third-order area A3e f f ranged from 2 and 2.6×10⁻¹³ m2 for thewavelengths examined, an increase far smaller than the slow-light scaling. Assuming a conser-vative absorbed energy per pulse due to ThPA of 20%, for a (∼4 ps) this corresponds to ∼pJor less distributed along the full length of the waveguide (1.5 mm). At the repetition rate (22MHz) of the laser, the average absorbed power would then be on the order of tens of μW. Thusat the power levels used in the experiment, free-carrier effects contribute negligibly to the pulsedynamics in the GaInP material. Positive chirped (chirp parameter C) hyperbolic-secant inputpulses[41], such as those generated by the mode-locked fiber laser in the experiment, are used.The variation of the chirp over the wavelength range is a characteristic property of the laser.A Kerr n2 coefficient of 8×10⁻¹⁴cm2/W [44], scaled with n2
g, along with the experimentally-extracted values of α3e f f are used in our model. Table 1 summarizes the measured parametersin our model, with the peak power within 10% of measured values (uncertainty from chirp andpulsewidth).
The resulting simulated spectra with chirp and GVD at three different group indices, ng=6.6,8.8, and 10.7 in Figs. 3(a), (b), and (c), respectively, show remarkable matches with ourmeasurements. To examine the effects of chirp and GVD on ThPA, in Fig. 3(d), (e), and (f)we demonstrate 1/T2 versus P2
c generated strictly from experimental parameters. The completephysical model not only describes the higher-order nonlinear absorption (1/T2 versus P2
c ), butalso captures its scaling to larger values in both slope and curvature at lower group velocities.The inclusion of anomalous GVD in the model, and thus the possibility of pulse compression,not only reproduces the slight upward bending, but also rigorously and correctly predicts theincrease of the effective absorption beyond the n3
g scaling. We note that higher order dispersionis still negligible. The slight upward bending in 1/T 2 vs. P2
in plot is the signature of pulse-compression. We emphasize that despite this small bending, the fit for α3e f f are quite good for
#114956 - $15.00 USD Received 31 Jul 2009; revised 19 Sep 2009; accepted 13 Nov 2009; published 23 Nov 2009
(C) 2009 OSA 7 December 2009 / Vol. 17, No. 25 / OPTICS EXPRESS 22448
1/
T2
Pin2(W2)
ng=6.6
GVD = 0
(d)
GVD = 0
ng=8.8
1/
T2
Pin2(W2)
(e)
φ=1.15πng=6.6
Po
wer
(a.u
.)
Wavelength (nm)
(a)ng=8.8φ=1.4π
Po
wer
(a.u
.)
Wavelength (nm)
(b)
(f)
1/
T2
Pin2(W2)
ng=10.7
GVD = 0
ng=10.7φ=1.5π
Po
wer
(a.u
.)
Wavelength (nm)
(c)
Fig. 3. (Color online) Comparison of experimental and theoretical spectra for differentwavelengths of 1526 nm (ng=6.6) (a), 1534 nm (ng=8.8) (b), and 1538 nm (ng=10.7) (c),with chirped sech2 input. Experimentally derived parameters, also used in simulations, areshown in Table 1. (d) Experimentally 1/T 2 versus P2
c for 1526 nm(ng=6.6). The solidline shows the simulated results including GVD, while the dashed line are simulation re-sults without GVD. (e),(f) Same as (c) for but with (e) 1534 nm(ng=8.8) and (f) 1538nm(ng=10.7). The strong upward bend of the curve indicates enhanced nonlinear absorp-tion beyond conventional slow-light scaling, triggered from pulse compression.
all values examined. We also examined the case where GVD is set to zero as the dotted line inFigs. 3(d-f). The strong deviation between the simulation when GVD is zero and experimentaldata clearly demonstrate that GVD is interacting strongly with the nonlinear effects. We alsosimulated the absence slow-light effects, that is ng = 3.12. In all cases, the curves were wellbelow the experimental data, and nearly overlapped the zero GVD simulation data. These arenot included here for figure clarity.
To further examine the impact of pulse compression on the slow-light Kerr nonlinearity, we
quantified the measured SPM-induced spectra broadening with: Δλ 2 =∫
(λ−λ0)2 Sdλ∫Sdλ , where S
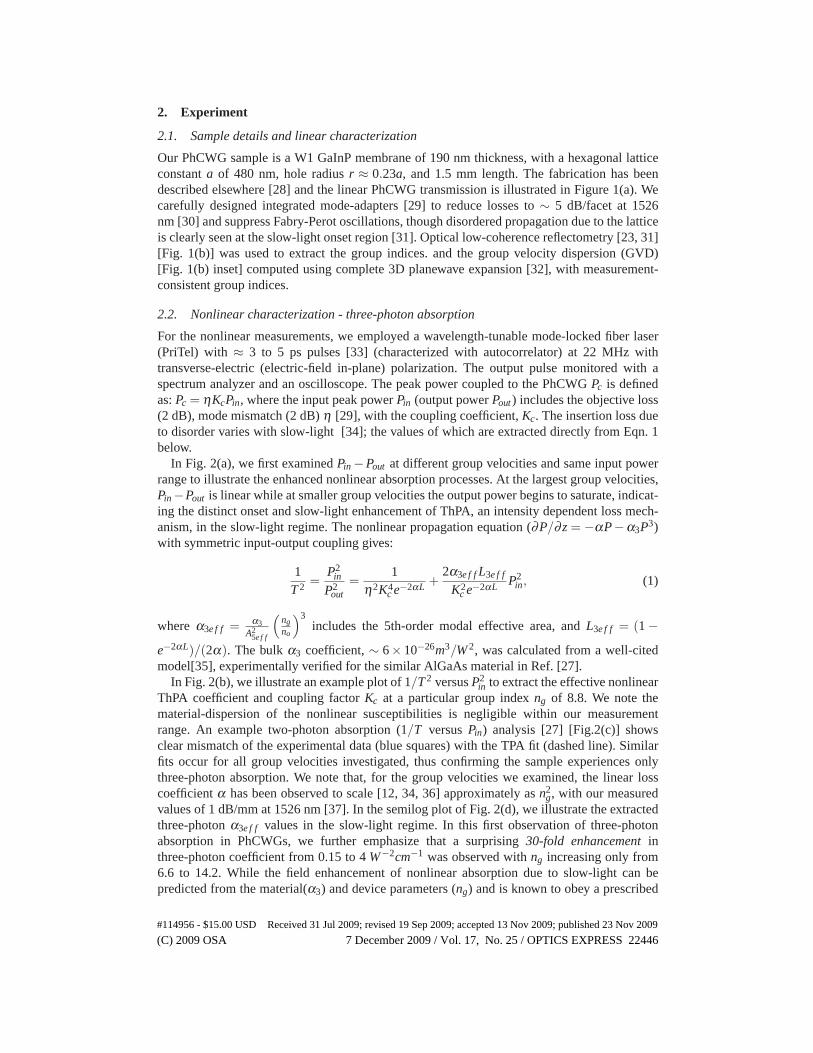
is the lineshape. Illustrative measurements of spectral broadening at ng=6.6, 8.8, and 10.7 forincreasing coupled power are shown in Fig. 4(a), (b), and (c), respectively. While SPM alone(dashed line) produces a linear slope that has a slight downward curvature due to higher-orderabsorption for large ng, the spectral widths including the effects of GVD mark a significantdeparture from a linear slope, as observed both experimentally (markers) and numerically(solidline). Fig. 4(c) in particular demonstrates a saturation of the spectral broadening at larger in-put powers. This is confirmed to arise from a combination of ThPA and GVD in the numeri-cal model. We additionally plot the case without slow-light effects as the dashed line. Clearlyslow-light has a strong impact on the spectral broadening, as the behavior is completely linear.Similar results occur at the other wavelengths.
#114956 - $15.00 USD Received 31 Jul 2009; revised 19 Sep 2009; accepted 13 Nov 2009; published 23 Nov 2009
(C) 2009 OSA 7 December 2009 / Vol. 17, No. 25 / OPTICS EXPRESS 22449
N>1
N(P
max
)=[L
d/
Ln
l]1
/2
ng
(d)
ng
L/
LD
(e)
α3
eff (
W-2
-cm
-1)
ng
C γ
eff
2(W
-cm
)-2 (f)
GVD = 0
ng=6.6R
MS
wid
th (
nm
)
Pc (W)
(a)
GVD = 0
ng=8.8
Pc (W)
RM
S w
idth
(n
m) (b)
RM
S w
idth
(n
m)
Pc (W)
GVD = 0
ng=10.7
without slow-light
(c)
Fig. 4. (Color online)(a) and (b) RMS pulse broadening (nm) as a function of coupledinput power Pc at: (a) 1526 nm (ng=6.6), (b) 1534 nm (ng=8.8) and (c) 1538 nm (ng=10.7).The points are experimental data, the solid line is simulation with GVD, and the dashedline is without GVD. We also show the case without slow-light (e.g. ng = 3.12) in (c) asthe dashed line. (d) N =
√LD/LNL versus ng at Pin −max(W), the max peak power input
into the PhCWG. For values of N > 1, the pulse has the possibility of being compressed.(e) Plot of L/LD vs. ng. In addition to N > 1, the pulse must also propagate a minimumlength, related to the dispersion length LD, before compression can occur. (f) Effectivenonlinear absorption, α3e f f and square of the effective SPM coefficient,γ2
e f f , rescaled witha suitable constant, C. The local field enhancement of the two effects scales as predicted.The experimental values demonstrate non-trivial scaling.
2.4. Discussion of non-trivial scaling
Thus far we have observed trends in both our ThPA and Kerr measurements that do notobey conventional slow-light scalings. Clearly a field enhancement effect beyond slow-lightenhancement is occurring in the sample. Based on the necessity of including GVD in ourmodeling, and with knowledge that pulse compression (resulting from the interaction of theKerr self-phase modulation and anomalous dispersion) causes increased peak power of anoptical pulse [41], we investigated pulse compression as a source of the additional local fieldin our PhCWG. We first computed the dispersion length, LD, (∼ 14 mm at 1526 nm and1.3 mm at 1538 nm) and the nonlinear length, LNL, (∼ 1.3 mm at 1526 nm and 0.45 mmat 1538 nm) [41] at the various pulse center frequencies of our slow-light experiments. Theresults, N =
√LD/LNL, are plotted in Fig. 4(d). For N > 1 and β2C < 0, pulse compression
is possible[41]. There is, however, an additional criterium to observe pulse compression.The requirement is that the pulse must propagate a minimum distance compared to LD, thedispersion length, and depends on N. This implies that the physical device length must becomparable to LD, typically at least LD/2 [41]. Figure 4(e) demonstrates the second keyparameter, the L/LD ratio, for the experimental data. While N is always greater than one, thedispersion length here decreases such that L/LD increases from L/LD = 0.1 to LD = 1.4 as ng
goes from 6.6 to 12.6. Thus while the pulses of the lowest three group indices ng experience
#114956 - $15.00 USD Received 31 Jul 2009; revised 19 Sep 2009; accepted 13 Nov 2009; published 23 Nov 2009
(C) 2009 OSA 7 December 2009 / Vol. 17, No. 25 / OPTICS EXPRESS 22450
some compression (N > 1 and L/LD ≈ 0.1 − 0.3), the larger ng values experience morecompression since they possess both N > 1 and ratios of L/LD > 0.5. Thus both criteria havebeen met. This accounts for the faster than predicted scaling of α3e f f .
We now utilize the extracted broadening data to determine the effective SPM coefficient γe f f
from the nonlinear phase φmax = γe f f PcLe f f and spectral broadening: ΔλΔλ0
=√
1+ 43√
3φ 2
max.
Here the effective length Le f f is limited only by ThPA and hence must be defined differentlyfrom the typical linear loss parameter [45]. The enhancement of the three-photon absorptionand SPM broadening are related through the field enhancement factor, κ , relating the propa-gating pulse power to the electric field energy density: |E|2 = κP. We thus have γe f f ∝ κ andα3,e f f ∝ κ2, implying that α3e f f scales as γ2
e f f . In Fig. 4(f), we examine α3e f f (black circles)
and γ2e f f (red squares; scaled by a constant C) – the curves are remarkably similar, highlighting
unambiguously that the non-trivial scalings of Kerr and ThPA have a common physical origin,that of strong field enhancement consistent with pulse compression.
3. Conclusion
We have demonstrated nonlinear scaling of the nonlinear enhancement beyond the limitsof slow-light photonic crystal waveguides. This non-trivial scaling has been analyzed withexperimental data of both self-phase modulation and three-photon absorption and furtherreinforced with a nonlinear propagation model. The origin of this non-trivial scaling beyondthe slow-light regime is derived from an additional local field enhancement due to pulsecompression. As Kerr is a third-order effect in field, while ThPA is a weaker fifth-ordernonlinear effect, dispersion engineering to include pulse compression can greatly reduce thethreshold of SPM, while carefully managing ThPA and its undesirable properties. The abilityto engineer PhCWG dispersion[8], such as with low group velocity dispersion [46] to preciselycontrol the pulsewidth, while completely suppressing TPA, make GaInP PhCWGs promisingfor compact broadband ultra-fast optics.
Acknowledgments
This work was supported by the European Commission (project GOSPEL), the Fulbright Grant(C. Husko), the National Science Foundation, and the New York State Foundation for Science,Technology and Innovation. We thank R. Gabet and Y. Jaouen (Telecom ParisTech) for OLCRsetup and acknowledge discussions with J. F. McMillan.
#114956 - $15.00 USD Received 31 Jul 2009; revised 19 Sep 2009; accepted 13 Nov 2009; published 23 Nov 2009
(C) 2009 OSA 7 December 2009 / Vol. 17, No. 25 / OPTICS EXPRESS 22451