39
Non-Utilization Study Employment Security Department July 2021 Julie York | Program Research & Evaluation Analyst [email protected]

Non-Utilization Study Employment Security Department
July 2021
Julie York | Program Research & Evaluation Analyst

Non-Utilization Study
Executive Summary The purpose of this study is to identify potential barriers and challenges that customers may experience
during the benefit application process for Paid Family and Medical Leave.
This study sought to answer the following questions:
1. Why are customer claims being denied? Do their demographic and employment characteristics
differ from all applicants1?
2. For those who were approved but never used leave, do their demographic and employment
characteristics differ from all applicants? Did they attempt to file weekly claims?
Through administrative data analysis, discussion groups with Customer Care Team specialists, and a
customer survey, we sought to learn more about common challenges experienced during the benefit
application, redeterminations, and weekly claims processes.
Key Findings
Of all benefit applications submitted between July 1, 2020 and April 1, 2021, 109,125 applications were
approved (86 percent). Those customers successfully filed weekly claims and received benefits. However,
12,737 applications (10 percent) were denied. Another 5,577 applications (four percent) were approved,
but never received benefits. These groups will be the focus of this report.
Most applications were for family bonding or medical leave. Bonding and pregnancy complication claims
had higher rates of approval and receipt of benefits, while family care, family military, and medical claims
had higher rates of denial or approval without receipt of benefits.
Of those applications that were approved but never received benefits:
- 35 percent attempted to file weekly claims, while 65 percent did not.
- 1,926 customers did attempt to file weekly claims and were denied because:
o On 62 percent (of weekly claims), customers reported they were working or using paid
time off.
o On 29 percent, customers reported they were receiving L&I workers’ compensation or
unemployment insurance benefits.
o On eight percent, customers reported they did not miss eight consecutive hours of work.
o One percent were denied for other reasons, such as customers were unable to establish
good cause to backdate their weekly claim or they had exhausted their leave.
1 This study includes all customers who applied, regardless of the final approval or denial status of their application.

All applications that are denied are assigned a denial reason. 12 percent had more than one denial reason.
Below are the five most common denial reasons:
1. The employee has not worked 820 hours and did not meet the hours worked requirement to be
eligible for leave.
2. The employee did not provide sufficient medical certification.
3. The employee failed to respond to a factfinding letter.
4. The employee applied for leave for a past date and was unable to establish good cause.
5. The employee did not provide sufficient identification.
Demographic Comparisons
To better understand the demographic characteristics of those who are experiencing challenges during
the benefit application process, we compared the demographic characteristics of all applicants to those
who were approved and received benefits, those who were approved and did not receive benefits, and
those whose claims were denied.
Age
- Customers ages 30 to 39 had higher rates of approval and receipt of benefits, likely related to the
high numbers of approved bonding and pregnancy complication claims. Customers ages 18 to
29, 40 to 49, and 50 to 59 had lower rates of approval and receipt of benefits, aside from those
whose age was not available.
- Customers ages 50 to 59 and 60+ had higher rates of approval without receipt of benefits.
- Aside from customers whose ages weren’t available, customers ages 18 to 29 had the highest
rates of denial.
Gender
- Those who identified as female had higher rates of approval and receipt of benefits.
- Those who identified as male, nonbinary, or who preferred not to disclose their gender, had
higher rates of denial and of approval without receipt of benefits.
Racial-Ethnic Identity
- Those who identified as white, East Asian, and who preferred not to disclose their racial-ethnicity
identity had higher rates of approval and receipt of benefits.
- Those who identified as Southeast Asian, South Asian, and Native Hawaiian or Pacific Islander had
higher rates of approval without receipt of benefits.
- Those who identified as Native Hawaiian, American Indian or Alaska Native, and Black or African
American had the highest rates of denial.

Employment Characteristic Comparisons
We also compared the employment characteristics of all applicants to those who were approved and
received benefits, those who were approved and did not receive benefits, and those whose claims were
denied.
Average Hourly Wage
- Customers making an average of $24-$33 an hour, $33-$49 an hour, and $49 or more an hour
had higher rates of approval and receipt of benefits, while customers making up to $18 and $18-
$24 an hour had lower rates of approval.
- Customers in the two highest wage groups had higher of approval without receipt of benefits.
- Customers in the two lowest wage groups had higher rates of denial.
- Approximately one percent of customers were missing wage information, all of which were
denied. When hours and wages cannot be established during the application process, fact finding
must be performed. If customers do not respond to fact finding and earnings and hours worked
during the qualifying period cannot be established, claims cannot be approved. Those whose
claims were denied for this reason are not included in this sample.
Employer Size & Employer Count
- In general, the differences in approval and denial for those who worked for small and large
employers were nominal. However, those whose employer information was not available had
lower rates of approval and higher rates of denial.
- The differences between those who worked for one employer and more than one employer were
also nominal when looking at employer count. Likewise, those who were missing employer
information had lower rates of approval without receipt of benefits and higher rates of denial.
- The conclusions we can draw from the differences for those with missing employer information
are limited given the need to establish hours and wages for approval.
Findings from the Customer Survey: Approved, But Did Not Receive Benefits
The administrative data analysis provided some context as to why a customer might be approved to take
leave, but never received benefits. We reached out to customers directly to find out more. The survey was
sent to 950 customers, of which 14 percent responded.
- 16 percent of respondents said the process was too confusing or challenging during an already
difficult or stressful time.
- 32 percent of respondents did not know they were supposed to file a weekly claim, were unable
to file a weekly claim, or weren’t sure why they were unable to receive benefits.
- 16 percent of respondents said they received other paid time off or government benefits.
- Many customers expressed frustration, and when asked if they would apply for paid family or
medical leave benefits again in the future if they experienced qualifying event, 26 percent said
they would not.
- Those who said they wouldn’t apply again in the future expressed frustration that it took too long
to receive payment and they had to return to work, claiming it was not worth the effort. The

majority were most frustrated that they were never able to talk with someone on the phone and
get their questions answered.
Findings from the Customer Care Team Specialist Focus Groups
In line with the findings from the customer survey, Customer Care Team (CCT), Specialists expressed what
they felt were the most common points of confusion for customers during the benefit application process:
- What is considered an acceptable medical certification form.
- Applying before the qualifying event occurs.
- Hours and wages not being reported or being reported incorrectly.
- What to expect if a redetermination is requested.
- How to answer the questions on the weekly claim questionnaire.
For a complete list of the topics discussed during the focus groups, including key process improvement
themes and policy clarifications, see Appendix D.
Conclusion
The purpose of this study was to uncover common challenges experienced during the benefit application
process. It is our hope that this study provides useful insights into opportunities to streamline the
application, redetermination, and weekly claims processes, and better support customers in accessing the
benefit. Thank you to the Customer Care Team Specialists who participated in our discussion groups and
provided valuable ideas for improving processes, communication, training, and resources.
The key takeaways from this study are:
1. The benefit application and weekly claims processes can be difficult to navigate, especially during
an already stressful and challenging time. This study provides a first look at the specific
demographic and employment characteristics of customers with the lowest rates of approval with
receipt of benefits, and the highest rates of denial and of approval without receipt of benefits.
2. There were 4,773 claims in the sample that were denied because the customer did not meet the
820 hours worked requirement. Some workers truly may not have been eligible. However, at least
1,000 claims were denied for not meeting the 820 hours requirement because they were missing
wage information. These customers did not upload alternative documentation. Given this,
increasing the completeness and accuracy of employee wage reporting will likely have a
substantial positive impact on benefit customers.
3. Input from customers and CCT specialists allude to the complexities of and the opportunities to
streamline the application process. Given that the two main reasons a claim may be denied are
insufficient medical certification forms and not meeting the 820 hours worked requirement,
qualifying event documentation and employment verification are two areas of the application
process that could benefit from further process improvement study.

4. Concurrently, the findings from the customer survey and CCT specialist focus groups suggest that
the weekly claims questionnaire and weekly claims process could benefit from further process
improvement study.
In the future, we’d like to explore the following research questions related to this study:
- Do certain demographic groups experience claim denial reasons more commonly than others?
For example, are customers ages 60+ who apply for medical leave and are denied failing to
provide sufficient medical certification or failing to meet the hours worked requirement? Are
customers being denied because they aren’t eligible or because they fail to provide the
information needed?
- What are the challenges that those whose primary language is not English experience during the
benefit application process? Do they differ from that of all applicants?
- How can the benefit application and weekly claims questionnaire be improved?
- Who are the customers who interact with both Paid Family and Medical Leave and
Unemployment Insurance?
- How can the medical leave for pregnancy and childbirth to bonding transition be improved?
- What sorts of communication and training are most effective for employers?
- What proportion of the Washington worker population is eligible to receive Paid Family and
Medical Leave benefits and experiences a qualifying event each year?

Non-Utilization Study
Table of Contents
Introduction, Data and Methods, Population of Interest 1
Demographic Comparisons 5
Employment Characteristic Comparisons 7
Findings from Customer Survey: Approved, But Did Not Receive Benefits 9
Findings from Customer Care Team Specialist Focus Groups 12
Conclusion 13
Appendix A: Customer Survey 15
Appendix B: Customer Survey Respondent Demographics 19
Appendix C: Customer Care Team Specialist Focus Group Protocol 22
Appendix D: A complete list of topics discussed during CCT Specialist Focus
Groups 23
Appendix E: Weekly Claims Questionnaire 31

1
Introduction The purpose of this study is to identify potential barriers/challenges that customers may experience to
accessing Paid Family and Medical Leave.
Data and Methods
Research Questions
This study sought to answer the following questions:
1. Why are customer claims being denied? Do their demographic and employment characteristics
differ from that of all applicants?
2. Why are there customers who were approved but never received benefits? Do their demographic
and employment characteristics differ from that of all applicants?
To answer these questions, this study used administrative and claims data collected from Paid Leave
customers during the application process and wage reports filed by employers during premium collection
to draw comparisons between all customers who submitted applications between July 1, 2020 and April 1,
2021 to those who were approved and never received benefits, and those whose claims were denied.
Paid Family and Medical Leave Administrative Data
The sample includes 127,439 applications submitted by 102,121 customers. All customers who applied
between July 1, 2020 and April 1, 2021 and whose leave start date was on or before May 2, 2021 were
included. Customers who applied during the first six months of 2020 were not included because their
application experience may have been atypical.2 The end date of April 1, 2021 was chosen because the
average time to re-adjudicate a claim from initial denial, to a redetermination and approval is about 43
days. This allows enough time for applications that may have been submitted and were denied on or
around April 1st to be potentially re-adjudicated. The leave start date of May 2, 2021 was chosen to ensure
customers had sufficient time to receive their determination letter and begin filing weekly claims.
Benefit Application Data
At the time of application, customers are asked for pertinent details of their family or medical leave, their
demographics, and their current employment information. This study used the following variables from
the application data: customer birthdate, racial, ethnic, and gender identity, and claim information, such as
qualifying event type and leave type.
2 When benefits launched in January 2020, the program received significantly more applications than anticipated. As a
result, customers who applied during this time experienced processing delays and other challenges that may have
made their application experience atypical to customers who applied after July 1, 2020.

2
Claim-Linked Quarterly Wage and Employer Information In addition, as part of the application and eligibility verification process, each claim is linked to the
customer’s employer wage records and any additional documentation of hours and wages the employee
provides to determine the amount of leave available to them and their weekly benefit amount. This study
used quarterly wages, quarterly hours worked, average employee count, and employer count from the
employer wage reports to estimate average hourly wage and business size for each customer and to
construct a comparison sample of all applicants.
An average hourly wage was calculated by taking the average of quarterly wages over hours worked for
each customer in each quarter that reports were available and linked to a claim. We were unable to link
hours and wages for approximately 3,665 claims during the time period. As a proxy, we estimated their
average hourly wage using their weekly benefit amount, which is determined at the time of application
using wages from the highest two quarters during their qualifying period. After approximation, there were
still 1,240 customers whose applications were denied and whose wages we could not approximate
because hours and wages were not established during the application process. As a result a claim year
was not established and their weekly benefit amount was not calculated. A count of employers and
employer size was also obtained for each customer using the wage reports. Employer size was calculated
using the average employee count reported by the employer where the employee worked the most hours
in a quarter during the time period.
Customer Survey: Approved, But Did Not Receive Benefits
A survey was sent out directly from the Leave and Care Division by email to 950 customers who were
approved but never successfully filed weekly claims to receive leave benefits and were approaching the
end of their claim year. Because it was sent out by email, it did not include those who submitted their
applications by paper. It was open for 10 days, with reminders sent on days seven and nine. The focus of
the survey was to ask customers why they did not receive paid leave benefits during their approved leave
time. Appendix A shows a copy of the survey, which included optional questions about customer
demographics. A total of 136 responses were recorded, for a response rate of approximately 14 percent.
Appendix B shows the demographics of respondents, including age, gender identity, ethnic heritage, and
employer size, compared to all applicants. Data was also collected from respondents about primary
language, hours worked per week, education level, annual income, and primary industry of employment,
but as we do not collect these data for all applicants, no comparisons were drawn. It is important to note
that the demographics of respondents are not necessarily representative of all applicants. This survey
presents valuable insights of the experiences of this group; however, they may not be generalizable to all
applicants.
Customer Care Team Specialist Focus Groups
To learn more about the challenges experienced during the benefit application, weekly claim filing, and
redetermination processes, two one-hour focus groups were conducted with Customer Care team
specialists in June 2021. A total of eight specialists from various teams participated. There was a wide
representation of teams that worked on benefit application adjudication, weekly claims, redeterminations,
and employer compliance.

3
Themes arose related to 1) the customer experience including common hang ups during the benefit
application and weekly claims filing process, and 2) the CCT specialist experience, including points of
policy clarification, technology, resource sharing/collaboration, and workflow. Appendix C shows a copy
of the focus group protocol, including a list of the general questions that were asked. Although the
findings of these focus groups will be discussed in more detail in the body of this report, a complete list of
the topics discussed are included in Appendix D.
Population of Interest Figure 1.A. illustrates the distribution of the populations of interest within all applications submitted. Of all
benefit applications submitted during the period, 109,125 (86 percent) were approved. Those customers
successfully filed weekly claims and received benefits. However, 12,737 applications (10 percent) were
denied. Another 5,577 applications (four percent) were approved, but those customers did not receive
benefits. These groups will be the focus of this report.
Figure 1.A. Claim Level Distribution by Group and Leave Type
Source: WA Paid Leave Administrative Data, All Applications Submitted between 7/1/2020 - 4/1/20213
3 Unless otherwise stated, all data referenced in this report is WA Paid Leave Administrative Data collected from all
applications submitted between 7/1/2020 – 4/1/2021, regardless of their final approval or denial.
Family Bonding
36%
Family Care11%
Family Military < 1 %
Medical44%
Pregnancy Complications
8%
Approved, Took Leave
86%
Approved, Never
Took Leave 4%
Denied, Never Took Leave
10%

4
Table 1.B. illustrates the distribution of leave type at the claim level. Most applications were submitted
were for family bonding or medical leave. Bonding and pregnancy complication claims had higher rates of
approval and receipt of benefits, while family care, family military, and medical claims had higher rates of
approval without receipt of benefits and of denial.
Table 1.B. Claim Level Distribution by Leave Type and Group
Approved, Took Leave
Approved, Never Took Leave
Denied, Never Took Leave
Family Bonding 91% 3% 6%
Family Care 76% 9% 14%
Family Military 63% 6% 31%
Medical 82% 5% 13%
Pregnancy Complication 91% 1% 8%
Of those who were approved and never received benefits:
- 35 percent attempted to file weekly claims, while 65 percent did not.
- 1,926 customers did attempt to file weekly claims and were denied because:
o On 62 percent (of weekly claims), customers reported they were working or using paid
time off.
o On 29 percent, customers reported they were receiving L&I workers’ compensation or
unemployment insurance benefits.
o On eight percent, customers reported they did not miss eight consecutive hours of work.
o One percent were denied for other reasons, such as customers were unable to establish
good cause to backdate their weekly claim or they had exhausted their leave.
Of those applications that were denied and never received benefits, 12 percent had more than one denial
reason associated. Table 1.C below shows the most common denial reasons.
Table 1.C. Most Common Claim Denial Reasons
Count of Denial Reasons4
1. Employee Has Not Worked 820 Hours 4,806
2. Did Not Provide Sufficient Medical Certification 4,378
3. Failure to Respond to Fact Finding Letter 960
4. Applied for Past Date but Unable to Establish Good Cause 885
5. Insufficient Employee Identification 236
4 A claim may have more than one denial reason, so a claim may be represented more than once in these counts.

5
For those whose claims were denied because the applicant did not meet the hours worked requirement,
was this because their wage information was not reported correctly or because they did not work enough
hours?
- Of the applications that were denied for this reason, approximately eight percent were missing
wage information and did not upload alternative documentation.
- Applications that were denied but were not missing wage information showed that these
customers worked a median of 184 hours and an average of 209 hours per quarter.
Table 1.D. shows the distribution of applications by electronic and paper submission. Most customers
submitted their applications online, but there was a small proportion who applied by paper application via
mail. Those who submitted paper applications had lower rates of approval, and higher rates of approval
and denial without receipt of benefits. Statistical tests showed there is a significant relationship between
submission type and probability of approval and receipt of benefits.5 A customer may request a paper
application because their preferred language is not English,6 or they may have limited computer or
internet access. The process to apply by mail and receive benefits is more involved as customers must file
their weekly claims by phone. It is likely that this group faces more barriers to accessing benefits than
those who apply online.
Table 1.D. Claim Level Distribution by Application Submission Type
Approved, Took
Leave Approved, Never
Took Leave Denied, Never Took
Leave All Applications
Submitted
Electronic 86% 4% 10% 126,320
Paper 79% 8% 13% 1,119
Demographic Comparisons To better understand the demographic characteristics of those who are experiencing barriers to accessing
Paid Family and Medical Leave, we compared the demographic characteristics of all applicants to those
who were approved and never received benefits, and those whose claims were denied. The following
demographic comparisons are presented at the customer level and customers are only represented once.
Those who were approved and took leave also includes anyone whose application was originally denied,
but they reapplied (or their application was re-adjudicated and later approved) and took leave.
Age
Table 2.A. shows the distribution of customers by age. Customers ages 30 to 39 had the highest rates of
approval and receipt of benefits, likely related to the high numbers of approved bonding and pregnancy
complication claims mentioned above. Customers ages 18 to 29, 40 to 49, 50 to 59, and 60+ had lower
rates of approval and receipt of benefits, aside from those whose age was not available. Customers ages
50 to 59 and 60+ had the highest rates of approval without receipt of benefits.
5 Chi-Square Tests of Independence were used to test levels of association for all categorical variable comparisons in
this report. 6 Customers whose preferred language is not English may only apply by paper application.
6
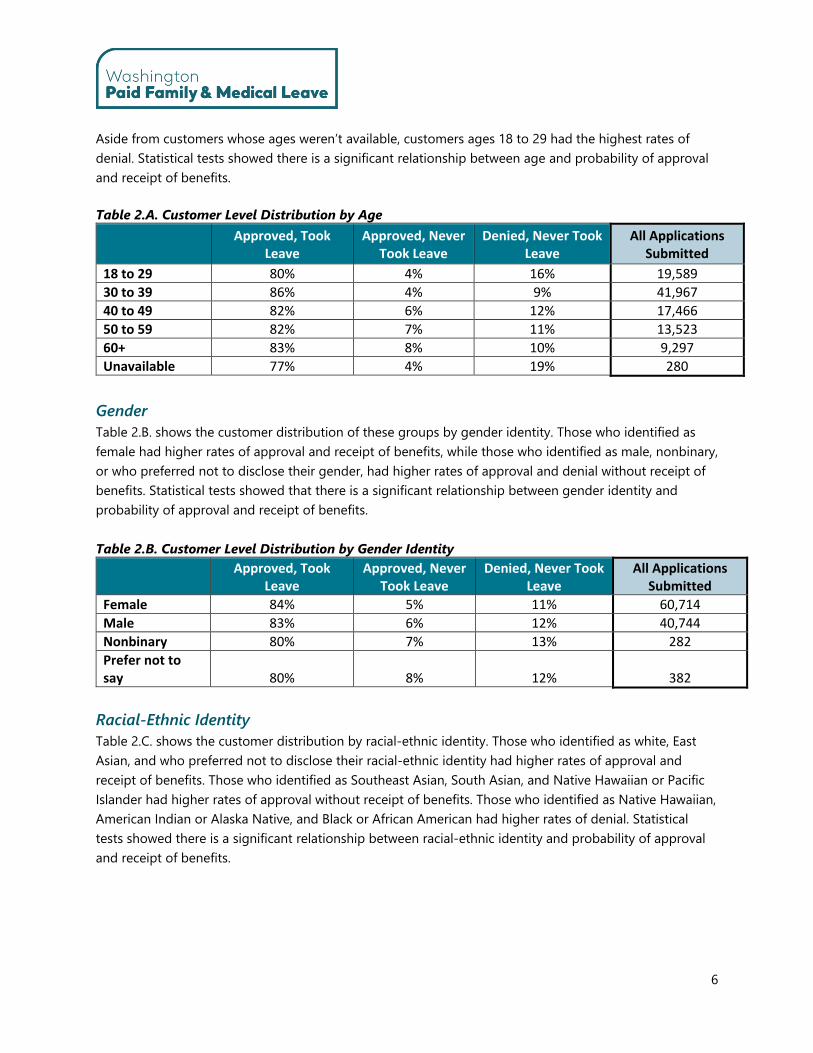
Aside from customers whose ages weren’t available, customers ages 18 to 29 had the highest rates of
denial. Statistical tests showed there is a significant relationship between age and probability of approval
and receipt of benefits.
Table 2.A. Customer Level Distribution by Age
Approved, Took Leave
Approved, Never Took Leave
Denied, Never Took Leave
All Applications Submitted
18 to 29 80% 4% 16% 19,589
30 to 39 86% 4% 9% 41,967
40 to 49 82% 6% 12% 17,466
50 to 59 82% 7% 11% 13,523
60+ 83% 8% 10% 9,297
Unavailable 77% 4% 19% 280
Gender
Table 2.B. shows the customer distribution of these groups by gender identity. Those who identified as
female had higher rates of approval and receipt of benefits, while those who identified as male, nonbinary,
or who preferred not to disclose their gender, had higher rates of approval and denial without receipt of
benefits. Statistical tests showed that there is a significant relationship between gender identity and
probability of approval and receipt of benefits.
Table 2.B. Customer Level Distribution by Gender Identity
Approved, Took
Leave Approved, Never
Took Leave Denied, Never Took
Leave All Applications
Submitted
Female 84% 5% 11% 60,714
Male 83% 6% 12% 40,744
Nonbinary 80% 7% 13% 282
Prefer not to say 80% 8% 12% 382
Racial-Ethnic Identity
Table 2.C. shows the customer distribution by racial-ethnic identity. Those who identified as white, East
Asian, and who preferred not to disclose their racial-ethnic identity had higher rates of approval and
receipt of benefits. Those who identified as Southeast Asian, South Asian, and Native Hawaiian or Pacific
Islander had higher rates of approval without receipt of benefits. Those who identified as Native Hawaiian,
American Indian or Alaska Native, and Black or African American had higher rates of denial. Statistical
tests showed there is a significant relationship between racial-ethnic identity and probability of approval
and receipt of benefits.

7
Table 2.C. Customer Level Distribution by Racial-Ethnic Identity
Approved, Took
Leave Approved, Never
Took Leave Denied, Never Took
Leave All Applications
Submitted
AIAN alone 79% 4% 17% 562
Black alone 79% 5% 16% 4,968
East Asian alone 87% 5% 8% 2,293
Latinx alone 80% 5% 15% 14,921
Middle Eastern alone 81% 4% 15% 276
NHOPI alone 74% 6% 20% 1,551
Another racial-ethnic identity 82% 5% 14% 5,560
Prefer not to say 86% 5% 9% 3,458
South Asian alone 84% 6% 9% 2,096
Southeast Asian alone 82% 6% 12% 3,108
Employment Characteristic Comparisons
Average Hourly Wage
Table 3.A. shows the customer distribution by average hourly wage across groups. Customers in the three
highest wage groups had higher rates of approval and receipt of benefits, while customers in the two
lowest wage groups had lower rates of approval. Customers in the two highest wage groups had higher
rates of approval without receipt of benefits. Customers in the two lowest wage groups also had higher
rates of denial.
Approximately one percent of customers were missing wage information, all of which were denied. When
hours and wages cannot be established, fact finding must be performed. If customers do not respond to
fact finding and earnings and hours worked during the qualifying period cannot be established, claims
cannot be approved. Statistical tests showed that there is a significant relationship between average
hourly wage and probability of approval and receipt of benefits.
Table 3.A. Customer Level Distribution by Average Hourly Wage
Approved, Took Leave
Approved, Never Took
Leave
Denied, Never Took Leave
All Applications Submitted
Up to $18 77% 4% 19% 20,826
$18 to $24 84% 5% 11% 20,837
$24 to $33 87% 5% 8% 19,708
$33 to $49 87% 6% 7% 19,831
$49+ 87% 6% 6% 19,680
Unavailable - - 100% 1,240

8
Employer Size
Table 3.B. shows the customer distribution by employer size. The differences in approval and denial for
those who worked for small and large employers were nominal. However, those whose employer
information was not available had lower rates of approval and higher rates of denial. Statistical tests
showed there is a significant relationship between employer size and probability of approval and receipt
of benefits, but it is hard to say how much of that is related to employer size and how much is related to
the need to verify hours and wages in order to approve a claim.
Table 3.B Customer Level Distribution by Employer Size
Approved, Took Leave
Approved, Never Took
Leave
Denied, Never Took Leave
All Applications Submitted
Large Employer 85% 6% 9% 69,719
Small Employer 85% 4% 11% 15,041
Unavailable 76% 4% 20% 17,362
Employer Count
Table 3.C. shows the customer distribution by employer count. Those with one employer had slightly
higher rates of approval with receipt of benefits, compared to those with multiple employers. Those with
multiple employers had slightly higher rates of approval without receipt of benefits than those with one
employer. Like wage and employer size, those who were missing employer information had lower rates of
approval without receipt of benefits and higher rates of denial. Statistical tests showed that there is a
significant relationship between employer count and probability of receipt of benefits, but as above, the
conclusions we can draw are limited given the need to establish hours and wages for approval.
Table 3.C. Customer Level Distribution by Employer Count
Approved, Took Leave
Approved, Never Took Leave
Denied, Never Took Leave
All Applications Submitted
Multiple Employers 84% 6% 11% 4,399
One Employer 85% 5% 10% 81,666
Unavailable 76% 4% 20% 16,057
9
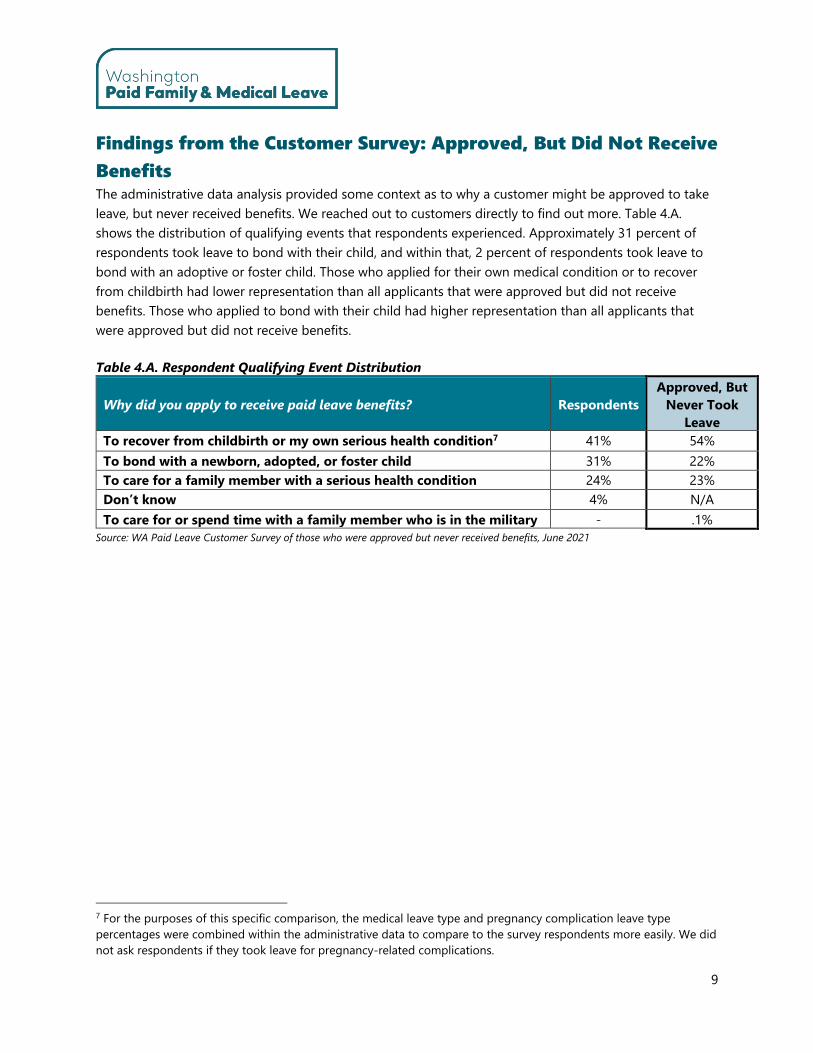
Findings from the Customer Survey: Approved, But Did Not Receive
Benefits The administrative data analysis provided some context as to why a customer might be approved to take
leave, but never received benefits. We reached out to customers directly to find out more. Table 4.A.
shows the distribution of qualifying events that respondents experienced. Approximately 31 percent of
respondents took leave to bond with their child, and within that, 2 percent of respondents took leave to
bond with an adoptive or foster child. Those who applied for their own medical condition or to recover
from childbirth had lower representation than all applicants that were approved but did not receive
benefits. Those who applied to bond with their child had higher representation than all applicants that
were approved but did not receive benefits.
Table 4.A. Respondent Qualifying Event Distribution
Why did you apply to receive paid leave benefits? Respondents
Approved, But
Never Took
Leave
To recover from childbirth or my own serious health condition7 41% 54%
To bond with a newborn, adopted, or foster child 31% 22%
To care for a family member with a serious health condition 24% 23%
Don’t know 4% N/A
To care for or spend time with a family member who is in the military - .1%
Source: WA Paid Leave Customer Survey of those who were approved but never received benefits, June 2021
7 For the purposes of this specific comparison, the medical leave type and pregnancy complication leave type
percentages were combined within the administrative data to compare to the survey respondents more easily. We did
not ask respondents if they took leave for pregnancy-related complications.
10
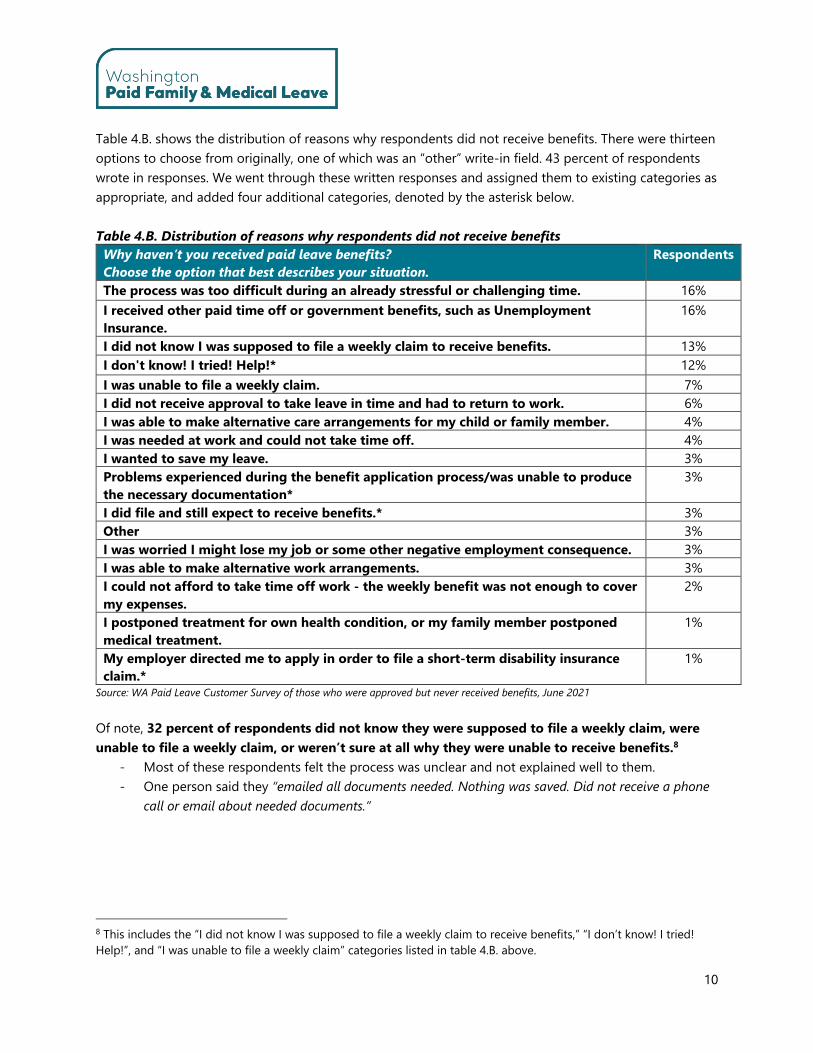
Table 4.B. shows the distribution of reasons why respondents did not receive benefits. There were thirteen
options to choose from originally, one of which was an “other” write-in field. 43 percent of respondents
wrote in responses. We went through these written responses and assigned them to existing categories as
appropriate, and added four additional categories, denoted by the asterisk below.
Table 4.B. Distribution of reasons why respondents did not receive benefits
Why haven’t you received paid leave benefits?
Choose the option that best describes your situation.
Respondents
The process was too difficult during an already stressful or challenging time. 16%
I received other paid time off or government benefits, such as Unemployment
Insurance.
16%
I did not know I was supposed to file a weekly claim to receive benefits. 13%
I don't know! I tried! Help!* 12%
I was unable to file a weekly claim. 7%
I did not receive approval to take leave in time and had to return to work. 6%
I was able to make alternative care arrangements for my child or family member. 4%
I was needed at work and could not take time off. 4%
I wanted to save my leave. 3%
Problems experienced during the benefit application process/was unable to produce
the necessary documentation*
3%
I did file and still expect to receive benefits.* 3%
Other 3%
I was worried I might lose my job or some other negative employment consequence. 3%
I was able to make alternative work arrangements. 3%
I could not afford to take time off work - the weekly benefit was not enough to cover
my expenses.
2%
I postponed treatment for own health condition, or my family member postponed
medical treatment.
1%
My employer directed me to apply in order to file a short-term disability insurance
claim.*
1%
Source: WA Paid Leave Customer Survey of those who were approved but never received benefits, June 2021
Of note, 32 percent of respondents did not know they were supposed to file a weekly claim, were
unable to file a weekly claim, or weren’t sure at all why they were unable to receive benefits.8
- Most of these respondents felt the process was unclear and not explained well to them.
- One person said they “emailed all documents needed. Nothing was saved. Did not receive a phone
call or email about needed documents.”
8 This includes the “I did not know I was supposed to file a weekly claim to receive benefits,” “I don’t know! I tried!
Help!”, and “I was unable to file a weekly claim” categories listed in table 4.B. above.

11
What’s more is that approximately 16 percent of respondents said the process was too confusing or
challenging during an already difficult or stressful time.
- Many people found the process too difficult to navigate when they were ill or recovering from
surgery or an illness.
- Others said they were unable to reach anyone by phone or email, and that they spent a significant
amount of time waiting on the phone, to the point that they ran out of time, had to return to
work, or gave up.
- Two people expressed problems experienced during the application process, like their medical
form being faxed before their account was fully set up, or an employer-related discrepancy.
- One person said it “took way too long to receive my benefits,” while another said “filing weekly was
too complicated.”
- Another said, “Can't figure out how to claim. I'm very bad with computers I really need an actual
person to help walk me through it.”
Approximately 16 percent of respondents said they received other paid time off or government
benefits.
- One person said, “This is a great program and I had planned to use benefits after the birth of my
child. I ended up not needing the PFML benefits due to other benefits offered during the pandemic
and a change in circumstances. The process was a bit confusing and my employer HR representative
was not very helpful. It would be nice if employers received more training to be able to help their
employees.”
- At least two people said they were receiving unemployment benefits, but they weren’t sure.
o “I never knew why it said that I received other employment benefits from the government -
because I did not. The only thing I can think of is the 1200$ Covid stimulus check.”
o “I was told I am getting an unemployment insurance That time. And I was thinking that’s
two different programs with different deductions from my salary.”
- One person is now on disability, unemployed, and would like to apply for a past date but is
unsure if they can.
o “I can still work, but not in the same capacity my old job requires. I'm now on disability &
don't have a job to save in my absence. I do need to be employed, do I not? I'm not sure if
last year still counts but would like to know if I can file for back benefits! An injury, & 3
surgeries in 8 months leaves my head in a blur! “
In general, the findings from this survey allude to several points of confusion for customers related to the
application and weekly claims process. Many customers expressed frustration, and when asked if they
would apply for paid family or medical leave benefits again in the future if they experienced
qualifying event, 26 percent said they would not. Those who said they wouldn’t apply again in the
future expressed frustration that it took too long to receive payment and they had to return to work,
claiming it was not worth the effort. The majority were most frustrated that they were never able to talk
with someone on the phone and get their questions answered.

12
Findings from the CCT Specialist Focus Groups In line with the findings from the customer survey, Customer Care Team (CCT), Specialists expressed what
they felt were the most common points of confusion for customers during the benefit application process:
1. What is considered an acceptable medical certification form. We allow many different types
of medical certification forms, which maximizes ease of use for the applicant, but can make it hard
for the CCT. Specialists feel they lack examples of forms that are acceptable, for example, what
sections to use from an FMLA form. Allowing specialists to “use their adjudicative power” can
result in inconsistencies with what each specialist will fact find for, approve, or deny.
2. Applying before the qualifying event occurs. This happens often, and specialists said they have
heard that some employers are encouraging their employees to apply ahead of time or customers
are being misinformed that they should apply ahead of time.
3. Hours and wages not being reported or being reported incorrectly, which requires fact
finding for specialists and causes frustration for the applicant. One idea that specialists had was
that when a customer applies, their hours/wages prepopulate the application, allowing them to
review if they think it is correct, or not. If it isn’t, they could be prepared to upload pay stubs prior
to the first review.
4. What to expect if a redetermination is requested. Specialists expressed that customers often
submit a request for review because they have unanswered questions. They may also submit a
request for review multiple times because they aren’t sure it went through. One idea that
specialists had is to create the functionality to send a confirmation email to the customer when
they submit a request for review, detailing how long they can expect the process to take. Another
is to limit the number of requests for review that customers can submit at a time.
5. How to answer the questions on the weekly claim questionnaire. One idea that specialists had
is to make it a requirement to watch the weekly claims video as part of the benefit application
process. As it is, they claim it is hard for customers to find on the website.
For a complete list of the topics discussed during the focus groups, including key process improvement
themes and policy clarifications, see Appendix D.

13
Conclusion The purpose of this study was to uncover common challenges experienced during the benefit application
process. It is our hope that this study provides useful insights into opportunities to streamline the
application, redetermination, and weekly claims processes, and better support customers in accessing the
benefit. Thank you to the Customer Care Team Specialists who participated in our discussion groups and
provided valuable ideas for improving processes, communication, training, and resources.
The key takeaways from this study are:
1. The benefit application and weekly claims processes can be difficult to navigate, especially during
an already stressful and challenging time. This study provides a first look at the specific
demographic and employment characteristics of customers with the lowest rates of approval with
receipt of benefits, and the highest rates of denial and of approval without receipt of benefits.
2. There were 4,773 claims in the sample that were denied because the customer did not meet the
820 hours worked requirement. Some workers truly may not have been eligible. However, at least
1,000 claims were denied for not meeting the 820 hours requirement because they were missing
wage information. These customers did not upload alternative documentation. Given this,
increasing the completeness and accuracy of employee wage reporting will likely have a
substantial positive impact on benefit customers.
3. Input from customers and CCT specialists allude to the complexities of and the opportunities to
streamline the application process. Given that the two main reasons a claim may be denied are
insufficient medical certification forms and not meeting the 820 hours worked requirement,
qualifying event documentation and employment verification are two areas of the application
process that could benefit from further process improvement study.
4. Concurrently, the findings from the customer survey and CCT specialist focus groups suggest that
the weekly claims questionnaire and weekly claims process could benefit from further process
improvement study.
In the future, we’d like to explore the following research questions related to this study:
- Do certain demographic groups experience claim denial reasons more commonly than others?
For example, are customers ages 60+ who apply for medical leave and are denied failing to
provide sufficient medical certification or failing to meet the hours worked requirement? Are
customers being denied because they aren’t eligible or because they fail to provide the
information needed?
- What are the challenges that those whose primary language is not English experience during the
benefit application process? Do they differ from that of all applicants?
- How can the benefit application and weekly claims questionnaire be improved?
- Who are the customers who interact with both Paid Family and Medical Leave and
Unemployment Insurance?
- How can the medical leave for pregnancy and childbirth to bonding transition be improved?

14
- What sorts of communication and training are most effective for employers?
- What proportion of the Washington worker population is eligible to receive Paid Family and
Medical Leave benefits and experiences a qualifying event each year?

15
Appendix
Appendix A: Customer Survey
Paid Family and Medical Leave Survey
We would like to understand more about why you applied for but have not received Paid Family or Medical
Leave benefits. Your responses will help us understand any challenges you experienced so we can better
support you in the future and make improvements to our program.
1. What month were you approved to receive paid leave benefits?
Dropdown list, pick one: MONTH
2. Why did you apply to receive paid leave benefits? (choose one)
a. To bond with a newborn child
b. To bond with an adopted or foster child
c. To care for a family member with a serious health condition
d. To recover from childbirth or my own serious health condition
e. To care for or spend time with a family member who is in the military
f. Don’t know
3. Why haven’t you received paid leave benefits? (choose the option that best describes your situation)
a. I did not receive notice of approval to take leave in time and had to return to work.
b. I was worried I might lose my job or experience some other negative employment
consequence.
c. I received other paid time off or government benefits, such as Unemployment Insurance.
d. I could not afford to take time off work - the weekly benefit was not enough to cover my
expenses.
e. I was able to make alternative work arrangements.
f. I was needed at work and could not take time off.
g. I postponed treatment for own health condition, or my family member postponed medical
treatment.
h. I wanted to save my leave.
i. I was unable to file a weekly claim.
j. I did not know I was supposed to file a weekly claim to receive benefits.
k. The process was too difficult to handle during an already stressful or challenging time.
l. I was able to make alternative care arrangements for my child or family member.
m. Other – write in
4. If you were to experience a family or medical event in the future, would you be likely to apply to
receive paid leave benefits again? (choose one)
a. Yes
b. No

16
5. Why or why not?
Write in
6. Are there any other issues that weren’t mentioned above or that impacted your decision not to file a
weekly claim to receive benefits that you would like us to know about?
Write in
7. Would you be willing to participate in a brief interview with a Paid Leave member so we can learn
more about your experience?
Yes/No
8. If yes, please provide your name, email address, and phone number, and we will reach out to talk with
you soon.
The following questions are optional and will help us learn a little bit more about you.
9. What is your age? Choose one.
a. 17 or younger
b. 18-29
c. 30-39
d. 40-49
e. 50-59
f. 60+
10. What is your gender identity? Choose one.
a. Male
b. Female
c. Nonbinary
d. Prefer not to say
11. Which of the following best describes your ethnic heritage? Check all that apply.
a. White
b. Black or African American
c. American Indian or Alaska Native
d. South Asian or South Asian American
e. East Asian or East Asian American
f. Southeast Asian or Southeast Asian American
g. Native Hawaiian or other Pacific Islander
h. Hispanic or Latinx
i. Middle Eastern or Arab American
j. Prefer not to say

17
k. Other – write in
12. What is your primary language? Choose one.
a. Amharic
b. Arabic
c. English
d. Spanish
e. Farsi
f. Japanese
g. Khmer
h. Korean
i. Lao
j. Marshallese
k. Oromo
l. Punjabi
m. Russian
n. Somali
o. Tagalog
p. Ukrainian
q. Vietnamese
r. Chinese languages
s. Other write in
13. Approximately how many hours a week do you work in total?
a. 20 hours or less
b. 21-39 hours
c. 40 hours
d. 41-60 hours
e. 61 hours or more
f. Not employed
14. Which of the following best describes your education level? Choose one.
a. Less than high school
b. GED or High school diploma
c. Some college or associate’s
d. Bachelor’s degree or higher
e. Don’t know
15. What is your annual income? Choose one.
a. Less than $50,000
b. $50,000 - $75,000
c. $75,001 - $99,999
d. $100,000 or more

18
16. In what industry do you work primarily or the most hours? Choose one.
a. Agriculture, forestry, fishing and hunting
b. Mining
c. Utilities
d. Construction
e. Manufacturing
f. Wholesale trade
g. Retail trade
h. Transportation and warehousing
i. Information
j. Finance and insurance
k. Real estate and rental and leasing
l. Professional and technical services
m. Management of companies and enterprises
n. Administrative and waste services
o. Educational services
p. Healthcare and social assistance
q. Arts, entertainment and recreation
r. Accommodation and food services
s. Other services, except public administration
t. Public administration
u. Don’t know
17. I know you may not know the exact number, but if you had to guess, how many employees currently
work for your employer in Washington state, including yourself? Choose one.
a. 1 (self-employed)
b. 2-49 employees
c. 50 or more employees
d. Don’t know

19
Appendix B: Customer Survey Respondent Demographics
What is your age?
Respondents
Approved, But Never Took Leave
18 to 29 4% 14%
30 to 39 30% 33%
40 to 49 23% 21%
50 to 59 22% 18%
60+ 18% 13%
Did not answer/unavailable 4% -
What is your gender identity?
Respondents
Approved, But Never Took Leave
Female 59.5% 56%
Male 39% 43%
Nonbinary - 0%
Prefer not to say/did not answer 1.5% 1%
Which of the following best describes your ethnic heritage? Check all that apply.
Respondents*
Approved, But Never Took Leave
American Indian or Alaska Native alone
0.7% .5%
Black alone 5.1% 4.6%
East Asian alone 2.2% 2%
Latinx alone 10.3% 13.6%
Middle Eastern alone 0.7% 0.2%
Native Hawaiian/Other Pacific Islander alone
0.7% 1.7%
Other 0.0% 5.2%
Prefer not to say/did not answer 11.0% 3.5%
South Asian alone 5.1% 2.6%
Southeast Asian alone 3.7% 3.5%
White alone 66.2% 62.6%
*Percentages don't sum to 100% because respondents could pick more than one racial-ethnic identity.

20
What is your primary language? Respondents
Amharic 1%
Arabic 0%
English 84%
Spanish 3%
Farsi 0%
Japanese 0%
Khmer 0%
Korean 1%
Lao 0%
Marshallese 0%
Oromo 0%
Punjabi 0%
Russian 1%
Somali 0%
Tagalog 2%
Ukrainian 0%
Vietnamese 0%
Chinese languages 0%
Other (please specify) 2%
Did not answer 5%
Approximately how many hours a week do you work?
Respondents
20 hours or less 2%
21-39 hours 13%
40 hours 50%
41-60 hours 24%
61 hours or more 1%
Not employed 4%
Did not answer 5%
Which of the following best describes your education level?
Respondents
Less than high school 1%
GED or High school diploma 10%
Some college or associate’s 45%
Bachelor’s degree or higher 41%
Did not answer 4%

21
What is your annual income? Respondents
Less than $50,000 27%
$50,000 - $75,000 29%
$75,001 - $99,999 21%
$100,000 or more 18%
Did not answer 5%
In what industry do you work primarily or the most hours?
Respondents
Agriculture, forestry, fishing and hunting 1%
Mining 0%
Utilities 1%
Construction 4%
Manufacturing 7%
Wholesale trade 0%
Retail trade 7%
Transportation and warehousing 4%
Information 6%
Finance and insurance 5%
Real estate and rental and leasing 0%
Professional and technical services 7%
Management of companies and enterprises 0%
Administrative and waste services 0%
Educational services 7%
Healthcare and social assistance 33%
Arts, entertainment and recreation 1%
Accommodation and food services 3%
Other services, except public administration 4%
Public administration 3%
Don’t know 1%
Did not answer 7%
I know you may not know the exact number, but if you had to guess, how many employees currently work for your employer in Washington state, including yourself?
Respondents
Approved, But Never Took Leave
Small employer (49 or fewer employees) 13% 11%
Large employer (50 or more employees) 74% 75%
Don’t know 9% N/A
Unavailable/did not answer 5% 14%
22
Appendix C: CCT Specialist Focus Group Protocol
June 2021
Focus Group Sessions
Paid Family & Medical Leave Specialists
Introduction
We would like to hear more about what your day to day is like to learn what is working and where there
might be room for improvement.
We’d like to record this session for transcription, so that we can refer to it for our analysis. Is that okay, and
would it be okay if we quoted you, if we don’t identify you?
Focus Group Questions & Structure
1. Opening questions:
a. Walk us through your day-to-day process and workflow
i. Describe happy path vs complicated case
2. Key Questions
a. How do CCT teams work together? How do you collaborate and exchange information?
b. Which part of the process takes the most time? What can be done to shorten it?
c. What is something you wish you knew about the adjudication process when you started?
d. What is a good “hack” you found that makes your job easier?
e. Are there certain steps in the process that cause hang ups for some customers and not
others?
i. Where do you think customers get the most confused in the application process?
ii. What resources/tools do you use the most to accomplish your job? Why are they
useful? What tools don’t you use?
3. Closing questions
a. If you had a magic wand, what are two things you would fix?
b. Is there anything we should have talked about, but didn’t?

23
Appendix D: A complete list of topics discussed during the CCT Specialist Focus Groups
Key Process Improvement Themes
1. Specialists emphasized the need to streamline the process and make it easier for customers to
navigate. They also recognized that it is a new program that has grown a lot and quickly, and with
that comes many policy changes and clarifications. The claims adjudication process is complex, with
many gray areas, and they spend a lot of time searching for answers to one-off, unique situations and
recent policy changes. Within these gray areas, they’ve noticed that there is a lack of common
understanding across teams:
“Across the board for applications, weekly claims, redeterminations, anybody that you ask – you
might get – how many teams are there? There are 15 different teams, 15 different SDMs, 15
different leads. Everybody has a different answer for processes. Clarification, communication, policy,
all of those things are problematic.”
2. Many specialists expressed that there was plenty of resource sharing within their teams, but
not necessarily across teams. They had several ideas for tools and resources they would be helpful
to them, including:
- A chronological list that details all the recent policy changes in the same place.
- More email templates. There is a lot of confusion among specialists about what they can send in
an email without divulging any personally identifiable information, beyond the templates
provided. They feel the existing templates are too generic and often get passed over by the
customer. They expressed it would be helpful to have email templates, like the ones that already
exist in letter form, for the following situations: 1) verification of leave types for new parents who
may be eligible to take medical and family leave and who apply in the wrong order, 2) birth
verification or missing birth certificate, 3) qualifying event documentation (to show the event
occurred), and 4) fact finding for good cause to backdate.
- Many specialists expressed that the case note template has been extremely helpful to
standardize notes.
- Many specialists expressed that OneNote has been a very helpful tool because it is
customizable, you can share it with other specialists, and you can search within others’ notebooks.
Specialists feel it would be useful to have more training on how to leverage OneNote with
emphasis on sharing notebooks across teams.
3. Finally, they expressed frustration with the structure of their workdays, including:
- The lack of a consistent schedule from week to week, with phone time occurring at different times
of the day, making it difficult to establish a routine.
- The one- to two-hour chunks of phone time scheduled in the middle of the day does not feel like
the most efficient use of time.
- Having to stop and take call backs during phone time is very time consuming. It results in having
to constantly stop and switch gears and takes time away from processing applications.

24
Complete List of Topics Discussed
Benefit Applications
Employers - Missing hours and wages
- Customers are being told by their
employers to apply for benefits before
their qualifying event occurs. Customers
don’t understand, and there’s a lack of
employer education.
Common hang ups in the application process - Short-term disability companies require
employees to apply for Paid Family &
Medical Leave benefits before they can
file a short-term disability claim.
Employees think what they submitted to
SDI will also work for Paid Leave, which is
not always the case.
- Because of the broad range of documents
we accept as medical certification,
customers aren’t submitting the right
documents, which requires specialists to
fact find. Sometimes, they can get them
on the phone and help them upload the
correct documents, but a lot of times,
they leave a message and never hear
back.
- Customers have to wait too long to speak
to a specialist. Once they do get through,
they don’t want to let the specialist go. It
results in a lot of walking people through
the application process over the phone.
- Is there a way to relax the qualifying event
requirements so that customers can fill
out their forms prior to the event, when
possible? This is a huge point of confusion
for many customers. They often submit
prior to their event.
- When customers submit a request for
review, there is nothing that tells them
that request has gone through. As a
result, they call to make sure it was
received or they click the button multiple

25
times, which creates another case in the
queue and in turn delays their application
further. There should be a way for the
system to send customers a notification
that we have received their request and
what to expect during the process.
- Can we resolve some issues related to
redeterminations over the phone?
Specialists understand there are separate
teams working on redeterminations, but,
for example, there are many customers
who call in to request a review to get an
extension and this is easily resolvable over
the phone.
- When someone’s claim year starts over,
they have to provide new ID verification, a
new medical certification (even if the
previous medical certification covers the
dates outside the claim year). The system
lets them submit a new application but
doesn’t tell them they need to upload
these items again, which creates the need
for specialists to call and tell them.
- How can we better use the application as
a tool to gather the information we need
to process their application?
o For each individual employer, ask
if there was any range of time
they did not work, received
unemployment, or used sick or
vacation so that when specialists
are looking at hours and wages,
they don’t have to call to get that
information. It’s already in the
application.
o Could we add a question to the
application that is open-ended –
is there any additional
information you want us to know
(that isn’t obvious on the
application)?

26
Medical Certifications - Customers will submit a doctor’s note as
medical certification, which excuses them
from work, but does not state the serious
health condition.
- Materials provided don’t include the leave
dates.
- Serious Health Condition Form – could we
make this into one page? So often,
customers will upload only the second
page with the doctor’s signature, and
specialists will have to call to request they
reupload it with both pages (to include
their own signature).
- When intermittent leave use is indicated
on a medical certification, some specialists
are approving intermittent leave
extensions when the employee is released
for light duty without the required
employer documentation, which requires
more factfinding.
Weekly Claims - Many customers call in because their
weekly claim was denied, and they need
to correct it. There are a few questions on
the weekly claims questionnaire that are
confusing to customers, including:
o Question 1: Did you or will you
receive workers’ compensation or
unemployment insurance benefits
for the time period for which
you’re requesting leave? Many
customers aren’t familiar with
workers’ compensation and it
doesn’t mention Labor &
Industries. They assume it means
compensation from their
employer. Could we add a
question mark that specifically
mentions L&I?
o Question 2: Hours worked during
the period. Customers will often
respond with how many hours
they would normally work, not

27
what the hours they actually
worked.
o Question 3: Hours you were or
will be paid for time off from your
employer that is not considered a
supplemental benefit payment
during this period. The question
mark with a link to ‘what does this
mean’ is helpful, but there should
be more explanation of what
supplemental benefits are.
o Question 5: Have you experienced
a change that could impact the
duration of your leave? Could we
take this question out or make it
open-ended? People answer yes all
the time, which delays processing
on a claim that wouldn’t normally
be delayed. There is not currently a
place for customers to provide
notes or additional context to their
weekly claim.
- Many customers have not seen the weekly
claim video. It is hard to find on the
website. Can we make it a requirement
that customers must watch this video as
part of the benefit application process?
Customer Care Team Specialist Internal Issues? Need a better name for this category.
Points of Policy Clarification - There is confusion among specialists
about the order in which benefit
applications and redeterminations should
be processed. For example, when a
customer applies for medical and bonding
at the same time, but the qualifying event
has not occurred yet. They get a soft
denial for their medical claim, which turns
into a redetermination. Do you process
the bonding claim while the medical claim
is going through the redetermination? Do
you wait for the medical claim to be
approved before you approve the
bonding claim?

28
- There is confusion among specialists
about what date to use on adoption
paperwork when adjudicating bonding
claims for adoptions.
- For medical certifications that are filled
out for both interval leave and
consecutive leave – specialists aren’t
reading the medical duration properly,
resulting in leave shortages and
customers having to wait an additional
four weeks for an extension that could
have been incorporated into the
approved leave duration at the time of
application. Are specialists supposed to
approve through the date that customers
are released to return to work, or the date
that they expect to return to work and use
leave intermittently?
- For medical certifications related to
cosmetic or plastic surgery. One specialist
said a customer couldn’t be approved for
leave unless they provide an explanation
of benefits showing the surgery was
covered by insurance. Another specialist
was told that as long as it doesn’t say
“cosmetic surgery,” it should be approved.
CRM - Could we create a function that notifies or
alerts specialists when a new email is
received, a new document is uploaded,
etc?
- Could we create a home or landing page
that summarizes all the information for a
given applicant? It would include one
page with all the claims that have been
filed, all the notes from each application,
etc.
Cross-team Collaboration & Communication - Specialists share within their teams, but
not outside of their teams.
- There is a lot of hesitation to reach
outside of your team.
- Some specialists expressed that because
the division has grown so much and so

29
quickly, it is hard to know who is a lead or
a Service Delivery Manager, or who to go
to with questions.
Tools/Resources - It would be nice to have more email
templates for one-off or unique situations.
Often times, specialists aren’t able to get
ahold of customers over the phone and
they don’t have the email template that
communicates what they need, so they
end up having to send a letter which
delays the application process further.
- Many specialists expressed that the case
note template in OneNote has been
extremely helpful to standardize notes.
- There are a lot of resources on
SharePoint, such as the team maps, that
are not readily available or that specialists
maybe are not aware of.
- Many specialists expressed that OneNote
has been a very helpful tool because it is
customizable. It is also helpful because
you can share it with other specialists and
search for answers if a live person is not
available when a question arises. There
should be more training for all specialists
on how to use OneNote and how to share
it across teams.
- It would be helpful to have a written
resource that details all the policy
changes in chronological order.
Workflow and Work Schedules - Many specialists expressed that not
having a regular schedule from week to
week can be really difficult for
establishing a routine.
- They also expressed that the one- to two-
hour chunks of phone time scheduled in
the middle of the day did not feel like the
most efficient use of their time. They
would prefer a chunk of time either at the
beginning or end of the day or that it be
more consistent.

30
- In addition, they expressed that having to
stop and take call backs during phone
time is very time consuming. It results in
having to constantly stop and switch
gears, and takes time away from
processing applications.

31
Appendix E: Weekly Claims Questionnaire

32
The Employment Security Department is an equal opportunity employer/program. Auxiliary aid and services are available upon request to individuals
with disabilities. Language assistance services for limited English proficient individuals are available free of charge. Washington Relay Service: 711


![FORESTRY OUTLOOK STUDY FOR AFRICA: [BOTSWANA]• Utilization of wood and non-wood forest products • Research • Extension and public education • Institutional development 1.3.2.](https://static.documents.pub/doc/80x56/5f8d65dde51db90a3d644c87/forestry-outlook-study-for-africa-botswana-a-utilization-of-wood-and-non-wood.jpg)


