MMRR 2011: Volume 1 (4) Blackwell, S., Baugh, D., Montgomery, M., Ciborowski, G., Waldron, C., Riley, G. E1 Medicare & Medicaid Research Review 2011: Volume 1, Number 4 A publication of the Centers for Medicare & Medicaid Services, Center for Strategic Planning Noncompliance in the Use of Cardiovascular Medications in the Medicare Part D Population Steven A. Blackwell, David K. Baugh, Melissa A. Montgomery, Gary M. Ciborowski, Charles J. Waldron, & Department of Health and Human Services, Centers for Medicare & Medicaid Services Gerald F. Riley OBJECTIVES: (1) to assess non-compliance among Medicare Part D recipients for the cardiovascular medication classes; (2) to identify the probability of noncompliance for each medication class when controlling for the potential risk factors of age, gender, race/ethnic origin, census region, disease burden, dual eligibility enrollment status, Part D plan status, relative out-of-pocket (OOP) non-class costs, and relative OOP daily class costs. DESIGN: Cross sectional retrospective review of 2007 Centers for Medicare & Medicaid Services (CMS) Part D data. All drugs within a drug class were used to conduct the assessment. FINDINGS: Non-compliance was found to be lower than previously reported. Patients who are male, age 65 to 74, Black, or residing in the South are associated with higher noncompliance for cardiovascular medications among the therapeutic classes we studied. Dual eligibility enrollment is typically associated with improved compliance; enrollment in a Medicare Advantage Prescription Drug (MAPD) plan may or may not improve compliance dependent on the therapeutic class under study. Increased disease burden is associated with lower compliance. OOP non-class costs had an opposing effect on compliance as compared to OOP daily costs; higher OOP non-class costs were associated with better compliance. CONCLUSION: Identifying patient characteristics that may contribute positively or negatively to medication compliance is an essential step to improved therapy. As a strategy to improve compliance, the proper selection of therapy that fits a particular patient is paramount. KEYWORDS: Medicare, Part D, Cardiovascular, Noncompliance doi: http://dx.doi.org/10.5600/MMRR.001.04.A05
Transcript
MMRR 2011: Volume 1 (4)
Blackwell, S., Baugh, D., Montgomery, M., Ciborowski, G., Waldron, C., Riley, G. E1
Medicare & Medicaid Research Review 2011: Volume 1, Number 4
A publication of the Centers for Medicare & Medicaid Services,
Center for Strategic Planning
Noncompliance in the Use of Cardiovascular Medications in the Medicare Part D Population
Steven A. Blackwell, David K. Baugh, Melissa A. Montgomery, Gary M. Ciborowski, Charles J.
Waldron, & Department of Health and Human Services, Centers for Medicare & Medicaid Services
Gerald F. Riley
OBJECTIVES: (1) to assess non-compliance among Medicare Part D recipients for the cardiovascular medication classes; (2) to identify the probability of noncompliance for each medication class when controlling for the potential risk factors of age, gender, race/ethnic origin, census region, disease burden, dual eligibility enrollment status, Part D plan status, relative out-of-pocket (OOP) non-class costs, and relative OOP daily class costs. DESIGN: Cross sectional retrospective review of 2007 Centers for Medicare & Medicaid Services (CMS) Part D data. All drugs within a drug class were used to conduct the assessment. FINDINGS: Non-compliance was found to be lower than previously reported. Patients who are male, age 65 to 74, Black, or residing in the South are associated with higher noncompliance for cardiovascular medications among the therapeutic classes we studied. Dual eligibility enrollment is typically associated with improved compliance; enrollment in a Medicare Advantage Prescription Drug (MAPD) plan may or may not improve compliance dependent on the therapeutic class under study. Increased disease burden is associated with lower compliance. OOP non-class costs had an opposing effect on compliance as compared to OOP daily costs; higher OOP non-class costs were associated with better compliance. CONCLUSION: Identifying patient characteristics that may contribute positively or negatively to medication compliance is an essential step to improved therapy. As a strategy to improve compliance, the proper selection of therapy that fits a particular patient is paramount.
KEYWORDS: Medicare, Part D, Cardiovascular, Noncompliance
doi: http://dx.doi.org/10.5600/MMRR.001.04.A05
MMRR 2011: Volume 1 (4)
Blackwell, S., Baugh, D., Montgomery, M., Ciborowski, G., Waldron, C., Riley, G. E2
Introduction
Medication noncompliance, that is a patient does not take medications as they have been prescribed in the course of care, is a frequent phenomenon in the elderly patient (Munger, Van Tassell, & LaFleur, 2007). Among the elderly, rates of noncompliance have been estimated to be between 25% and 59%. (Col, Fanale, & Kronholm, 1990; Roter, et al., 1998; Tangalos & Zarowitz, 2006). Up to 10% of hospital admissions are believed to be attributed to noncompliance (Sullivan & Kreling, 1990; Malhotra, Karan, Pandhi, & Jain, 2001; Hope, Wu, Tu, Young, & Murray, 2004
For cardiovascular patients, medication noncompliance appears in all types of cardiovascular disease. Patient noncompliance continues to be problematic whether patients suffer from hypertension, coronary artery disease, or the more symptomatic ischemic heart disease—where episodes of chest pains due to noncompliance may exist, (
).
Kardas, 2004; Newby et al., 2006
Previous studies addressing noncompliance have considered patient characteristics, such as gender, age, race/ethnic origin, area of residence, dual eligibility enrollment, managed care status, disease burden, and patient out-of-pocket (OOP) costs as potential risk factors for noncompliance (
). Thus, we still need to identify factors that may explain why patients do not take their medications.
Jin, Sklar, Min Sen Oh, & Chuen, 2008; Hertz, Unger, & Lustik, 2005; Yu, Nicol, Yu, & Ahn, 2005; Obisesan, Vargas, & Gillum, 2000; Yanos, 2001; Sherman et al., 2009; Billups, Malone, & Carter, 2000; Schmittdiel et al., 2009). For the Part D population, current studies assessing the effect of Part D on medication compliance have typically focused on patient OOP costs (Schmittdiel et al., 2009
Our primary research objective was to assess non-compliance among Medicare Part D recipients for eight therapeutic classes of cardiovascular medication classes: antianginals, antihypertensives, antiarrhythmics, antihyperlipidemics, beta blockers, calcium channel blockers, cardiotonics, and diuretics. We use national enrollment data to conduct the study. Our second research objective was to identify the probability of noncompliance for each medication class when controlling for the potential risk factors. We incorporate each of the aforementioned risk factors that may impact noncompliance for cardiovascular medication use among Part D recipients into this study: age, gender, race/ethnic origin, census region, disease burden, dual eligibility enrollment status, Part D plan status, relative OOP non-class costs, and relative OOP daily class costs.
).
Methods
Data
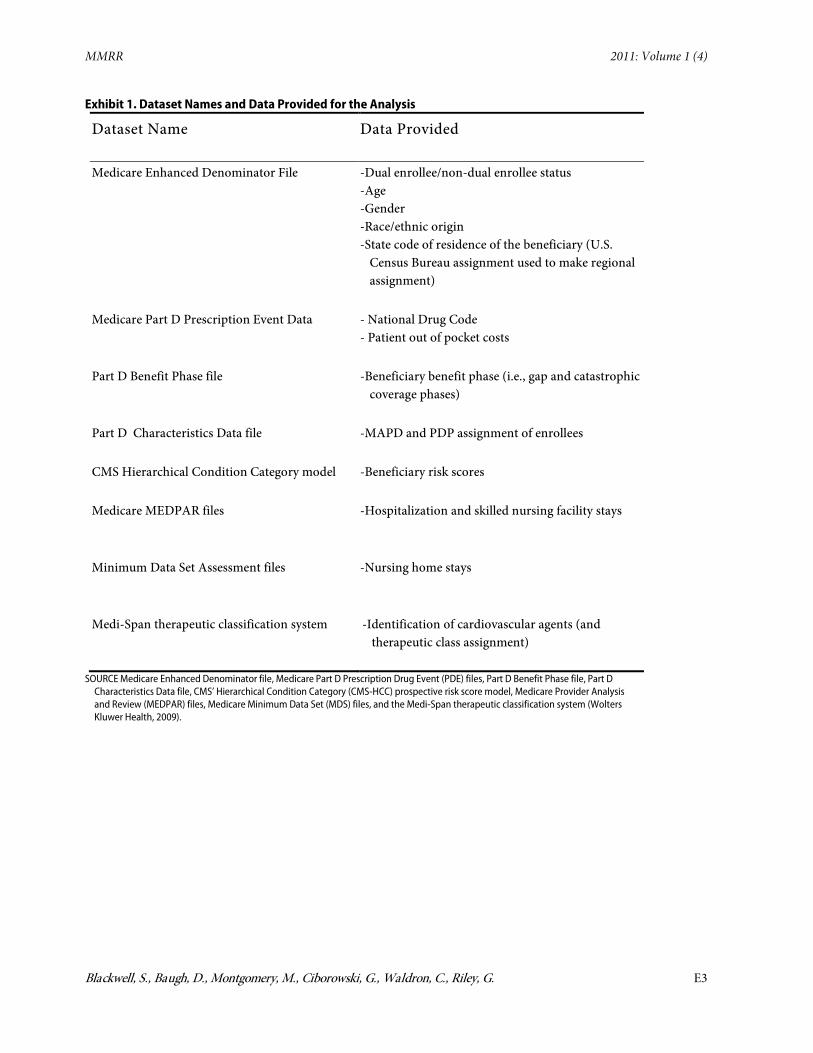
Calendar year 2007 data were obtained from the Medicare Enhanced Denominator file, Medicare Part D Prescription Drug Event (PDE) files, Part D Benefit Phase file, Part D Characteristics Data file, CMS’ Hierarchical Condition Category (CMS-HCC) prospective risk score model, Medicare Provider Analysis and Review (MEDPAR) files, Medicare Minimum Data Set (MDS) files, and the Medi-Span therapeutic classification system (Wolters Kluwer Health, 2009) (Exhibit 1). The
MMRR 2011: Volume 1 (4)
Blackwell, S., Baugh, D., Montgomery, M., Ciborowski, G., Waldron, C., Riley, G. E3
Exhibit 1. Dataset Names and Data Provided for the Analysis
Dataset Name Data Provided
Medicare Enhanced Denominator File -Dual enrollee/non-dual enrollee status -Age -Gender -Race/ethnic origin -State code of residence of the beneficiary (U.S.
Census Bureau assignment used to make regional assignment)
Medicare Part D Prescription Event Data - National Drug Code - Patient out of pocket costs
Part D Benefit Phase file -Beneficiary benefit phase (i.e., gap and catastrophic coverage phases)
Part D Characteristics Data file -MAPD and PDP assignment of enrollees
CMS Hierarchical Condition Category model -Beneficiary risk scores
Medicare MEDPAR files -Hospitalization and skilled nursing facility stays
Minimum Data Set Assessment files -Nursing home stays
Medi-Span therapeutic classification system -Identification of cardiovascular agents (and therapeutic class assignment)
SOURCE Medicare Enhanced Denominator file, Medicare Part D Prescription Drug Event (PDE) files, Part D Benefit Phase file, Part D Characteristics Data file, CMS’ Hierarchical Condition Category (CMS-HCC) prospective risk score model, Medicare Provider Analysis and Review (MEDPAR) files, Medicare Minimum Data Set (MDS) files, and the Medi-Span therapeutic classification system (Wolters Kluwer Health, 2009
).
MMRR 2011: Volume 1 (4)
Blackwell, S., Baugh, D., Montgomery, M., Ciborowski, G., Waldron, C., Riley, G. E4
Medicare Enhanced Denominator file provided the demographic data of dual enrollee/non-dual enrollee status, age, gender, race/ethnicity, and census region. The Medicare Part D PDE files provided the National Drug Code (NDC) and patient OOP costs for each prescription fill. We used the Part D Characteristics Data file to identify Medicare Advantage Prescription Drug Plan (MAPD) enrollment versus Prescription Drug Plan (PDP) enrollment. The CMS-HCC prospective risk score model provided beneficiary risk scores. Medicare MEDPAR files were used to identify hospitalization visits and skilled nursing facility stays, while the MDS files were used to identify nursing home stays. We obtained therapeutic class assignment from the Medi-Span system.
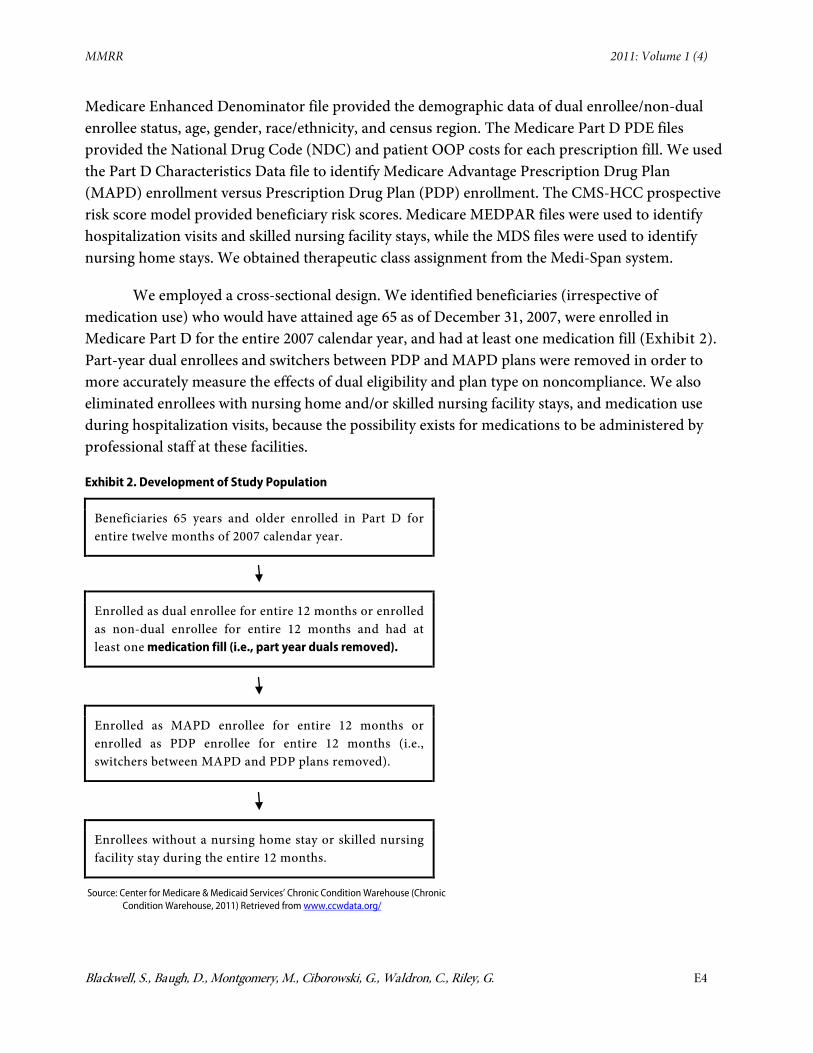
We employed a cross-sectional design. We identified beneficiaries (irrespective of medication use) who would have attained age 65 as of December 31, 2007, were enrolled in Medicare Part D for the entire 2007 calendar year, and had at least one medication fill (Exhibit 2). Part-year dual enrollees and switchers between PDP and MAPD plans were removed in order to more accurately measure the effects of dual eligibility and plan type on noncompliance. We also eliminated enrollees with nursing home and/or skilled nursing facility stays, and medication use during hospitalization visits, because the possibility exists for medications to be administered by professional staff at these facilities.
Exhibit 2. Development of Study Population
Beneficiaries 65 years and older enrolled in Part D for entire twelve months of 2007 calendar year.
Enrolled as dual enrollee for entire 12 months or enrolled as non-dual enrollee for entire 12 months and had at least one medication fill (i.e., part year duals removed).
Enrolled as MAPD enrollee for entire 12 months or enrolled as PDP enrollee for entire 12 months (i.e., switchers between MAPD and PDP plans removed).
Enrollees without a nursing home stay or skilled nursing facility stay during the entire 12 months.
Source: Center for Medicare & Medicaid Services’ Chronic Condition Warehouse (Chronic Condition Warehouse, 2011) Retrieved from www.ccwdata.org/
MMRR 2011: Volume 1 (4)
Blackwell, S., Baugh, D., Montgomery, M., Ciborowski, G., Waldron, C., Riley, G. E5
We initially report the population characteristics of census region, gender, age group, race/ethnic origin, disease burden, dual eligibility status, PDP status, and relative OOP costs. Regional assignment was based on United States Census regions (U.S. Census Bureau, 2010
Age, race/ethnic origin, disease burden, benefit phase, and relative OOP costs were coded as categorical variables. Age was divided into the groups of 65-74, 75-84, and 85 and over. We divided race/ethnicity into the groups of Black, Hispanic, White, and Other.
) using the Social Security Administration’s (SSA) state code of residence of the beneficiary (resident in the Medicare Enhanced Denominator file) (Research Data Assistance Center [ResDAC], 2010). State codes identifying beneficiary residence outside of the continental United States were classified as “Other.”
Disease burden was assigned to the study population using the CMS-HCC prospective health risk adjuster score model for calendar year 2007. The model is a risk adjustment model used for Medicare reimbursement. The model is used to predict cost of care of an individual in a given year even though it does not explicitly reflect how sick an individual may be in a given year. For the study, we use the model as a proxy for disease burden with the realization of this limitation. A higher risk score signified increased disease burden. We divided disease burden into the quartile groups of low, medium-low, medium-high, and high for the respective population.
Relative OOP cost assignment was reported as two separate variables: (1) daily relative OOP costs per therapeutic class (i.e., called relative OOP class costs) and (2) yearly relative OOP costs for all drugs excluding the therapeutic class under study (i.e., called relative OOP non-class costs). Our reasoning for constructing two separate OOP cost measures, based on within class and excluded class, is that each may have a separate impact on medication compliance. Higher OOP costs for medications within the same therapeutic class may lead to higher noncompliance; higher OOP costs for all medications external to the therapeutic class under study may also impact compliance for the therapeutic class under study. The cost measures were divided into the quartiles of low, medium-low, medium-high, and high. Assignment to the respective group was mutually exclusive and exhaustive.
The study addresses eight separate populations based on medication therapeutic classes within the cardiovascular medication category: antianginals, antihypertensives, antiarrhythmics, antihyperlipidemics, beta blockers, calcium channel blockers, cardiotonics, and diuretics. Each study population was limited to individuals who utilized medications within the specific therapeutic class. An enrollee could be counted in more than one population if a claim existed for the relevant medication. However, we performed separate analyses for each population which allowed a patient to be counted only once within the respective population.
Measures
Compliance was defined using the medication possession ratio (MPR), modified measure (Vanderpoel, Hussein, Watson-Heidari, & Perry, 2004; Hess, Raebel, Conner, & Malone, 2006). We
MMRR 2011: Volume 1 (4)
Blackwell, S., Baugh, D., Montgomery, M., Ciborowski, G., Waldron, C., Riley, G. E6
assessed the number of days in the measurement period where at least two prescriptions for the same medication or another medication in the same therapeutic class were captured in the Part D PDE data. To construct this measure, for each patient, the total days’ supply (covered days) was the numerator. The denominator was the sum of the number of days from the first dispensing (of a medication in the therapeutic class) up to, but not including, the date of last dispensing (of the same medication or another medication in the therapeutic class) and the number of days’ supply obtained at the last dispensing minus the number of days the patient spent in the hospital during the period. This value was multiplied by 100 to provide a compliance percent value that could be averaged to find an overall study compliance value. We defined noncompliance as an MPR<80%, a cutoff score commonly used in the literature for many medication studies to define poor compliance (Rudd, 1993; Skaer, Sclar, Markowski, & Won, 1993; Duncan & Rogers, 1998; Gary, Crum, Cooper-Patrick, Ford, & Brancati, 2000).
Analysis
We began our analysis with separate descriptive analyses of our eight therapeutic classes. Next, we examined and compared the within group percentage of noncompliance for each of the eight therapeutic classes. We then performed eight separate individual-level logistic regression analyses to assess the risk of noncompliance within each therapeutic class. The variables of census region, gender, age group, racial/ethnic origin, disease burden, dual eligibility status, PDP status, relative OOP non-class costs and relative OOP daily class costs were addressed as potential predictors of compliance. Results were reported as odds ratios (OR) along with p values and 95% confidence intervals (CIs). Analyses of the data were performed using SAS software (SAS Institute, Inc., 2010). The proc logistic procedure was utilized to perform the logistic regression analyses.
Results
A. Descriptive Analysis
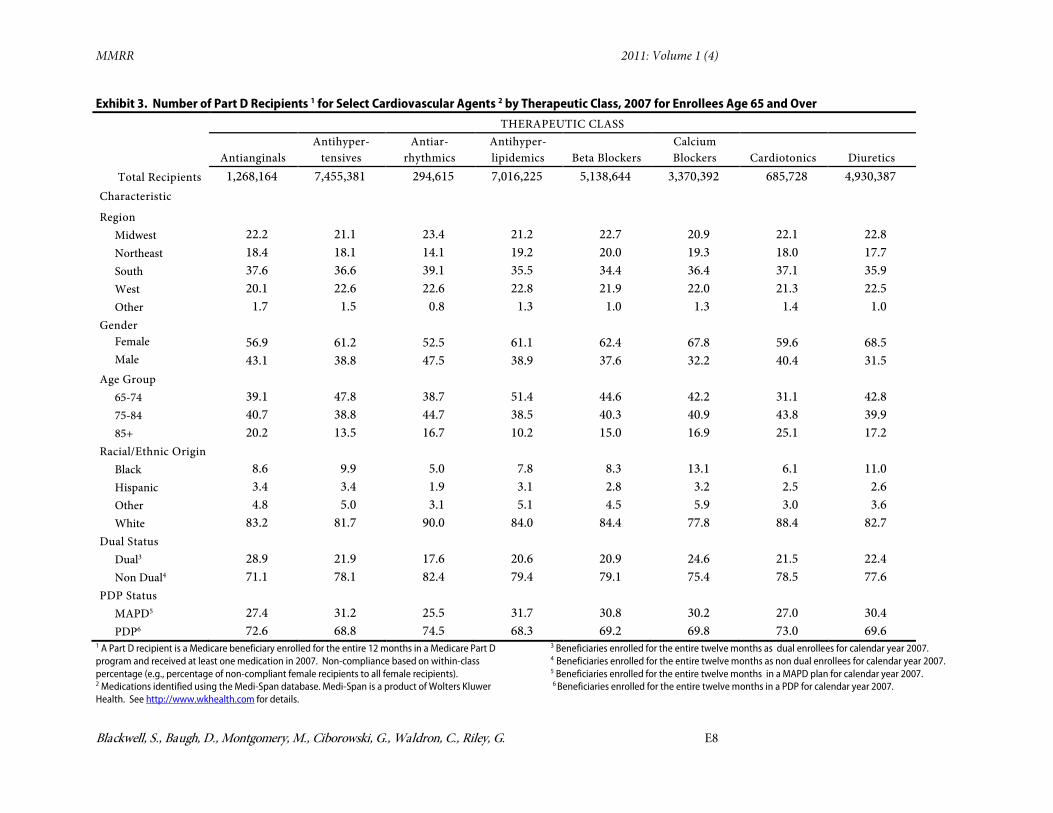
Antihypertensives had the largest number of recipients at 7.5 million (Exibit 3
). Antiarrhythmics had the lowest at 0.3 million. For each of the eight therapeutic classes, the South region had the largest number of recipients. By gender, there were more females than males for each therapeutic class. By age group, the 75-84 year old group had the largest number of recipients for antianginals, antiarrhythmics, and cardiotonics. The 65-74 year old group had the largest number of recipients for the remaining therapeutic classes. For racial/ethnic origin, there were more White recipients than Black or Hispanic recipients for each therapeutic class. By disease burden, recipients were evenly divided across the four groups of highest, medium high, medium low, and lowest for each therapeutic class. By dual eligibility status, there were more non duals than duals for each therapeutic class. For PDP status, there were more PDP recipients than MAPD.
MMRR 2011: Volume 1 (4)
Blackwell, S., Baugh, D., Montgomery, M., Ciborowski, G., Waldron, C., Riley, G. E7
B. Percentage of Within Group Noncompliance
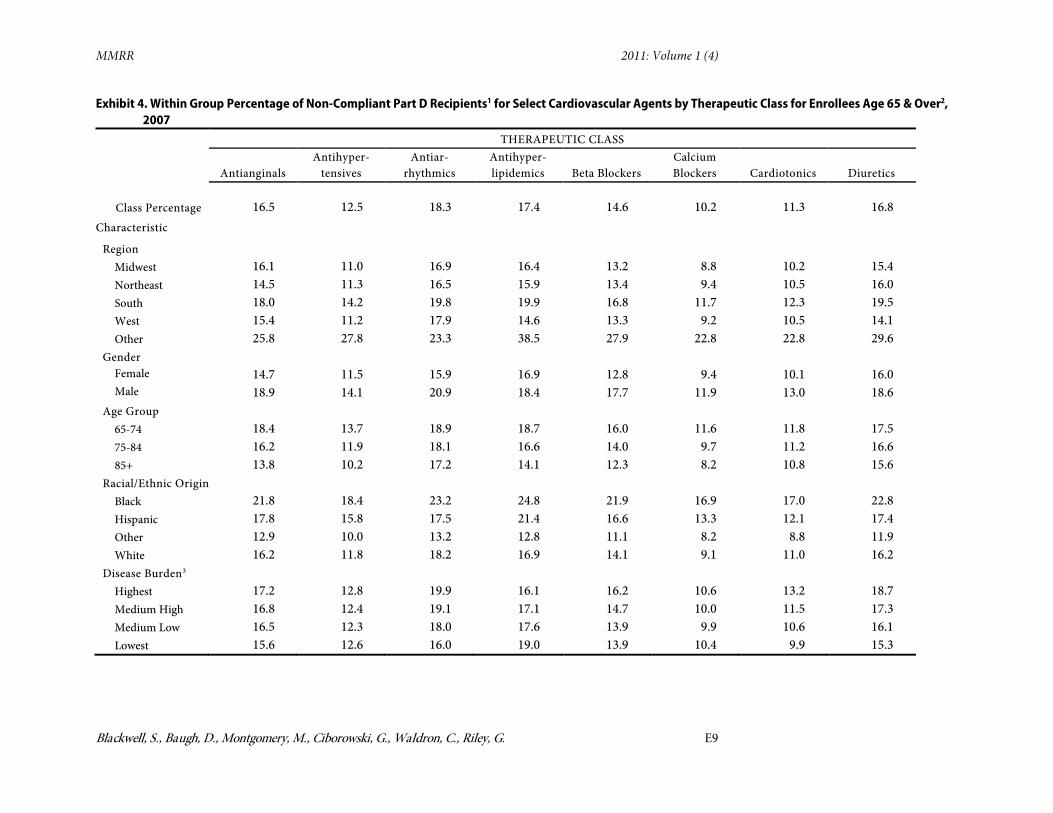
Exhibit 4 presents the within group percentages of noncompliance (e.g., percentage of non-compliant female recipients compared to all female recipients) for each therapeutic class. Within the U.S. census regions, the South region had the greatest percentage of noncompliance for each therapeutic class. The least noncompliance by region varied based on the therapeutic class under consideration. The Midwest region had the least percentage of noncompliance for antihypertensives, beta blockers, calcium blockers, and cardiotonics. The Northeast region had the least percentage of noncompliance for antianginals and antiarrhythmics. The West region had the least percentage of noncompliance for antihyperlipidemics and diuretics.
For gender and age group, males and the 65 to 74 age group consistently had the greatest percentage of noncompliance. Females and the 85 and over age group had the least percentage of noncompliance across all therapeutic classes. By race/ethnic origin, Blacks had the highest percentage of noncompliance for each therapeutic class. When excluding the “Other” group, Hispanics were the least noncompliant for antiarrhythmics; Whites were the least noncompliant for the remaining therapeutic classes.
For disease burden, recipients with the highest disease burden had the highest percentage of noncompliance for antianginals, antihypertensives, antiarrhythmics, beta blockers, calcium blockers, cardiotonics, and diuretics; recipients with the lowest disease burden were the most noncompliant for antihyperlipidemics. Additionally, recipients with the highest disease burden had the least percentage of noncompliance with antihyperlipidemics, whereas recipients with the lowest disease burden had the least percentage of noncompliance with antianginals, antiarrhythmics, cardiotonics, and diuretics. Recipients with medium low disease burden had the least percentage of noncompliance with antihypertensives and calcium blockers. Recipients with medium low and lowest within-group disease burden were tied for least noncompliance with beta blockers.
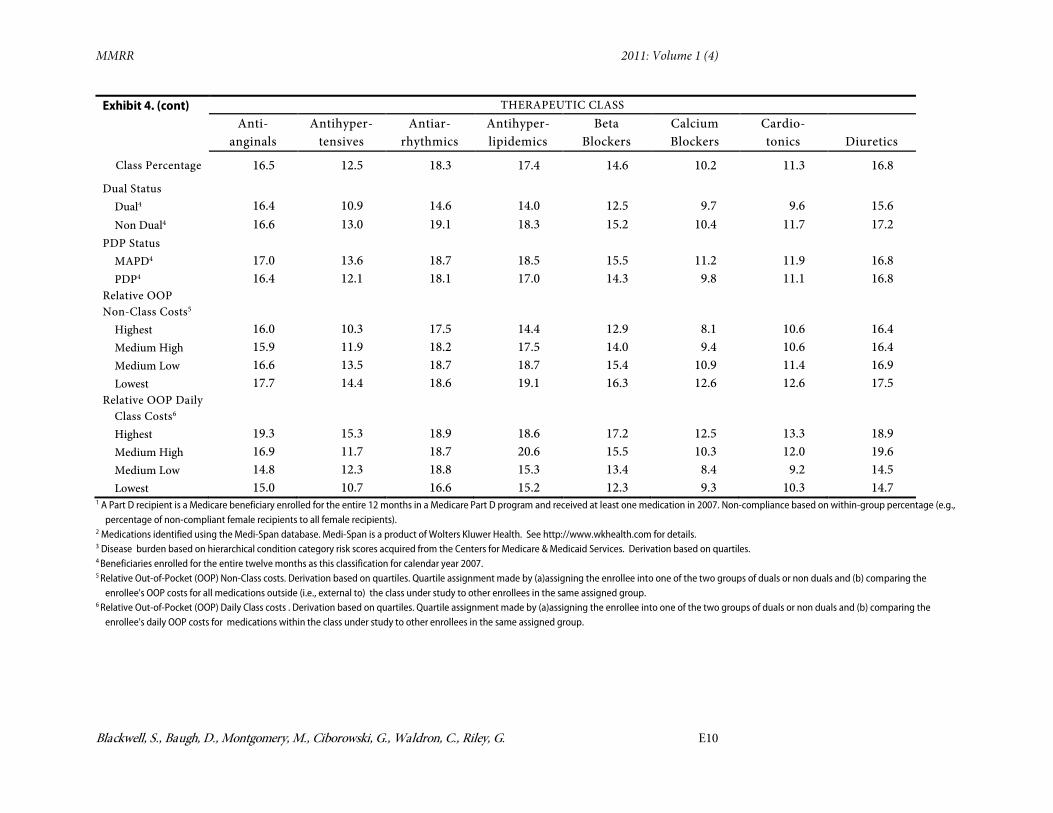
Regarding dual status and PDP status, non duals had the highest percentage of noncompliance for each therapeutic class. MAPD recipients had the highest percentage of noncompliance for each therapeutic class except diuretics; MAPD and PDP recipients were tied for noncompliance for the diuretics therapeutic class.
By relative OOP non-class costs, recipients with the highest non-class costs had the lowest noncompliance for each therapeutic class. Recipients with the lowest non-class costs had the highest noncompliance.
For relative OOP daily class costs, recipients with the lowest daily class costs had the lowest noncompliance. Recipients with the highest daily class costs had the highest noncompliance.
MMRR 2011: Volume 1 (4)
Blackwell, S., Baugh, D., Montgomery, M., Ciborowski, G., Waldron, C., Riley, G. E8
Exhibit 3. Number of Part D Recipients 1 for Select Cardiovascular Agents 2 by Therapeutic Class, 2007 for Enrollees Age 65 and Over THERAPEUTIC CLASS
1 A Part D recipient is a Medicare beneficiary enrolled for the entire 12 months in a Medicare Part D program and received at least one medication in 2007. Non-compliance based on within-class percentage (e.g., percentage of non-compliant female recipients to all female recipients). 2 Medications identified using the Medi-Span database. Medi-Span is a product of Wolters Kluwer Health. See http://www.wkhealth.com for details.
3 Beneficiaries enrolled for the entire twelve months as dual enrollees for calendar year 2007. 4 Beneficiaries enrolled for the entire twelve months as non dual enrollees for calendar year 2007. 5 Beneficiaries enrolled for the entire twelve months in a MAPD plan for calendar year 2007. 6 Beneficiaries enrolled for the entire twelve months in a PDP for calendar year 2007.
Blackwell, S., Baugh, D., Montgomery, M., Ciborowski, G., Waldron, C., Riley, G. E9
Exhibit 4. Within Group Percentage of Non-Compliant Part D Recipients1 for Select Cardiovascular Agents by Therapeutic Class for Enrollees Age 65 & Over2
1 A Part D recipient is a Medicare beneficiary enrolled for the entire 12 months in a Medicare Part D program and received at least one medication in 2007. Non-compliance based on within-group percentage (e.g., percentage of non-compliant female recipients to all female recipients).
2 Medications identified using the Medi-Span database. Medi-Span is a product of Wolters Kluwer Health. See http://www.wkhealth.com for details. 3 Disease burden based on hierarchical condition category risk scores acquired from the Centers for Medicare & Medicaid Services. Derivation based on quartiles. 4 Beneficiaries enrolled for the entire twelve months as this classification for calendar year 2007. 5 Relative Out-of-Pocket (OOP) Non-Class costs. Derivation based on quartiles. Quartile assignment made by (a)assigning the enrollee into one of the two groups of duals or non duals and (b) comparing the
enrollee's OOP costs for all medications outside (i.e., external to) the class under study to other enrollees in the same assigned group. 6 Relative Out-of-Pocket (OOP) Daily Class costs . Derivation based on quartiles. Quartile assignment made by (a)assigning the enrollee into one of the two groups of duals or non duals and (b) comparing the
enrollee's daily OOP costs for medications within the class under study to other enrollees in the same assigned group.
MMRR 2011: Volume 1 (4)
Blackwell, S., Baugh, D., Montgomery, M., Ciborowski, G., Waldron, C., Riley, G. E11
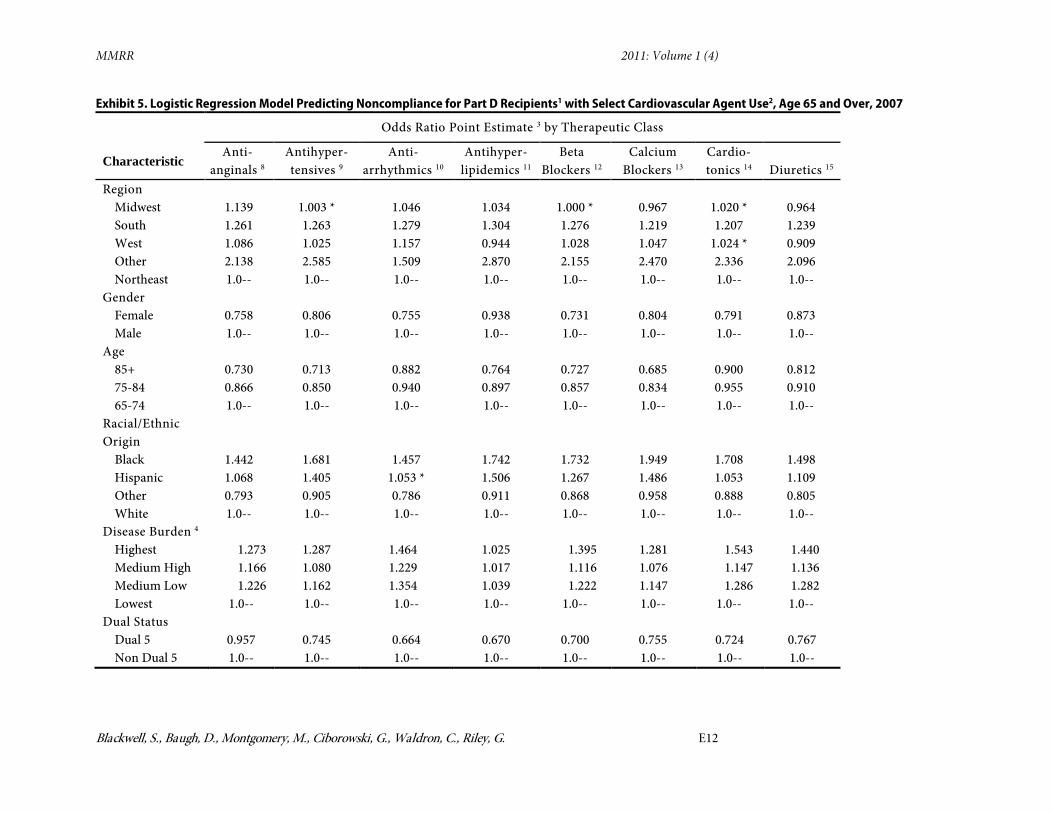
C. Logistic Regression Analysis
Exhibit 5
Regarding gender and age, we found that females were less likely to be noncompliant as compared to males, for each therapeutic class. Recipients age 85 and over, as well as recipients age 75 to 84, were less likely to be noncompliant as compared to recipients age 65 to 74.
presents the results of the eight separate odds ratio analyses to assess the likelihood of noncompliance within each of the cardiovascular medication therapeutic classes. Using the Northeast region as the reference group, we found that elderly recipients residing in any of the remaining United States regions were more likely to be noncompliant with antianginals and antiarrhythmics (throughout the regression analysis section we report results holding all other independent variables constant). We also found that residence in the South region consistently showed a higher likelihood of noncompliance as compared to the Northeast region for each therapeutic class.
For race/ethnic origin, we found Black recipients were more likely to be noncompliant, compared to White beneficiaries for each therapeutic class. Hispanic recipients were more likely to be noncompliant,compared to White recipients for each therapeutic class, with the exception of antiarrhythmics. For antiarrhthmics, Hispanics were not different from Whites. For disease burden, recipients with the highest disease burden were more likely to be noncompliant as compared to beneficiaries with the lowest disease burden for each therapeutic class. Recipients with medium high risk scores and medium low risk scores were also more likely to be noncompliant, as compared to recipients with the lowest risk scores for each therapeutic class.
Dual recipients were less likely to be noncompliant compared to non-dual recipients. MAPD recipients were less likely to be noncompliant compared to PDP recipients for antianginals, antiarrhythmics, cardiotonics, and diuretics. MAPD recipients were more likely to be noncompliant compared to PDP recipients for antihypertensives, antihyperlipidemics, beta blockers, and calcium blockers.
For relative OOP non-class costs, recipients with the highest non-class costs were less likely to be noncompliant compared to beneficiaries with the lowest non-class costs. Recipients with medium high non-class costs and medium low non-class costs were also less likely to be noncompliant, compared to recipients with the lowest non-class costs for each therapeutic class. Recipients with the highest OOP daily class costs were more likely to be noncompliant, compared to beneficiaries with the lowest daily class costs. Recipients with medium high daily costs and medium low daily costs were also more likely to be noncompliant, compared to recipients with the lowest daily class costs for each therapeutic class.
MMRR 2011: Volume 1 (4)
Blackwell, S., Baugh, D., Montgomery, M., Ciborowski, G., Waldron, C., Riley, G. E12
Exhibit 5. Logistic Regression Model Predicting Noncompliance for Part D Recipients1 with Select Cardiovascular Agent Use2, Age 65 and Over, 2007
1 A Part D recipient is a Medicare beneficiary enrolled for 12 months in a Medicare Part D program and who received at least one medication. Non-compliance based on within-class percentage (e.g., percentage of non-compliant females to all female recipients).
2 Medications identified using the Medi-Span database. Medi-Span is a product of Wolters Kluwer Health. See http://www.wkhealth.com for details. 3 Higher ratio (>1) = greater odds for noncompliance. Asterisk denotes p > 0.05 . 4 Disease burden based on hierarchical condition category risk scores acquired from the Centers for Medicare & Medicaid Services. Derivation based on quartiles. 5 Enrollees enrolled for the entire twelve months as this classification for calendar year 2007. 6 Relative Out-of-Pocket (OOP) Non-Class costs . Derivation based on quartiles. Quartile assigment made by (a)assigning the enrollee into one of the two groups of duals or
non duals and (b) comparing the enrollee's OOP costs for all medications outside (i.e., external to) the class under study to other enrollees in the same assigned group. 7 Relative Out-of-Pocket (OOP) Daily Class costs. Derivation based on quartiles. Quartile assigment made by (a)assigning the enrollee into one of the two groups of duals or
non duals and (b) comparing the enrollee's daily OOP costs for medications within the class under study to other enrollees in the same assigned group. 8 Max-rescaled R2 = 0.0220. 9 Max-rescaled R2 = 0.0335. 10 Max-rescaled R2 = 0.0202. 11 Max-rescaled R2 = 0.0348. 12 Max-rescaled R2 = 0.0353. 13 Max-rescaled R2 = 0.0410. 14 Max-rescaled R2 = 0.0253. 15 Max-rescaled R2
= 0.0254.
MMRR 2011: Volume 1 (4)
Blackwell, S., Baugh, D., Montgomery, M., Ciborowski, G., Waldron, C., Riley, G. E14
Discussion
Noncompliance among cardiovascular patients is a well-known occurrence (Kardas, 2007). Although efficacious treatments exist for cardiovascular disease, many patients do not take their medication regularly, thereby negating potential benefits. This study is among the first to use national enrollment data to examine a pharmaceutically relevant issue of medication noncompliance, and potential factors contributing to noncompliance, for cardiovascular medication use among Part D recipients. We conducted our analysis by separately focusing on distinct medication therapeutic classes comprising the cardiovascular category. All drugs within a drug class were used to conduct each assessment. This approach allowed us to identify gaps and illuminate general trends for cardiovascular medication use. Findings from this study can be grouped into five broad categories. First, non-compliance among Part D recipients was lower than previously reported. Second, patients who are male, age 65 to 74, Black, or residing in the South region were associated with higher noncompliance for cardiovascular medications among the therapeutic classes we studied. Third, dual eligibility enrollment was typically associated with improved compliance for these agents; enrollment in a MAPD plan may or may not have improved compliance dependent on the therapeutic class under study. Fourth, increased disease burden was associated with higher noncompliance. Fifth, OOP non-class costs had an opposing effect on compliance as compared to OOP daily costs. For the therapeutic classes we studied, higher OOP non-class costs were associated with a lower likelihood of noncompliance, whereas higher OOP daily costs were associated with a higher likelihood of noncompliance.
Previous studies addressing medication noncompliance have found noncompliance rates to be between 33% and 50%, depending on the length of therapy and disease being treated (LaFleur & Oderda, 2004; Osterberg & Blaschke, 2005; Insull, 1997). For cardiovascular disease, patients diagnosed with hypertension have been frequently studied, with noncompliance rates being at the higher end of the spectrum (Jin, Sklar, Min Sen Oh, & Chuen, 2008). By assessing all drugs within a drug class, we found noncompliance among Part D recipients to be lower than previously reported. Within group noncompliance in our separate study, populations ranged from a high of 16.8% for diuretics to a low of 10.2% for calcium blockers. For diuretics, unwanted side effects such as frequent urination may be problematic, especially when traveling or undertaking outdoor activities. Regarding calcium blockers, our within group findings suggest that, when alternative agents exist to treat a cardiovascular condition, such as hypertension, among which calcium blockers are one option, calcium blockers may be the better choice based on the potential for improved compliance. We suggest further research examining compliance among cardiovascular agents to treat hypertension, such as beta blockers, antihypertensives, and calcium blockers, may be warranted.
Alternatively, we found that patients who are male, younger, Black,or residing in the South region were associated with a higher likelihood of noncompliance among the therapeutic classes we studied. Previous research addressing gender has provided inconsistent results (Jin,
MMRR 2011: Volume 1 (4)
Blackwell, S., Baugh, D., Montgomery, M., Ciborowski, G., Waldron, C., Riley, G. E15
Sklar, Min Sen Oh, & Chuen., 2008). Some studies suggest that females are more noncompliant than males, while others suggest the opposite. A prior study of Medicaid elderly enrollees by Monane et al. (1996), using New Jersey Medicaid data, found no significant relationship between gender and compliance. Our study populations differ from that study in that we addressed both Medicaid and non-Medicaid recipients. Across each cardiovascular therapeutic class under study, we found a greater likelihood of noncompliance among males. We suggest that providing targeted information to males regarding the importance of cardiovascular medication compliance may be helpful. Examples include continual reminders by the provider during provider/patient encounters regarding the importance of compliance, and pamphlets that encourage compliance among both genders, but address males as being the more problematic gender.
Previous studies assessing compliance among the aged are somewhat inconsistent. Several studies have found age to be related to increased compliance (Sirey, Bruce, Alexopoulos, Perlick, Friedman, & Meyers, 2001; Kim et al., 2002; Senior, Marteau, & Weinman, 2004; Hertz, Unger, & Lustik, 2005). A few studies have found elderly patients to be more noncompliant than their younger counterparts (Benner, Glynn, Mogun, Neuman, Weinstein, & Avorn, 2002; Balbay,Annakkaya, Arbak, Bilgin, & Erbas, 2005). When assessing compliance solely among Medicaid recipients age 65 and over, Monane et al. (1996) found that old age was associated with better compliance. As indicated previously, our findings are more robust than Monane et al.’s, in that we included non-Medicaid enrollees. Notwithstanding, our findings agree with Monane et al. We found the eldest elderly (i.e., age 85 and over) to be less likely to be noncompliant in their medication use (i.e., more compliant), compared to the youngest elderly (i.e., age 65 to 74) across all cardiovascular therapeutic medication classes. One explanation is that these eldest elderly were found to have fewer cardiovascular medications to take as compared to their younger counterparts (data not shown). Thus, the eldest elderly may be healthier. We suggest that further research is warranted that makes comparisons solely within the 65 and older population when examining factors that may influence noncompliance in the elderly. However, comparing the under 65 disabled to the 65 and older population may also be insightful.
Regarding racial/ethnic origin, previous studies indicate that Whites have better compliance compared to Blacks (Raiz, Kilty, & Henry, 1999; Thomas et al., 2001; Yu, Nicol, Yu, & Ahn, 2005). Our findings agree. We found Whites were more likely to be compliant across all cardiovascular therapeutic classes compared to Blacks. We also found Hispanics were less likely to be compliant as compared to Whites, for all of the therapeutic classes we studied, with antiarrhythmics as the exception. Providing targeted information (as suggested previously for males) to Blacks and Hispanics, regarding the importance of cardiovascular medication compliance, may prove beneficial.
We also found that an association may exist between noncompliance and area of residence. Beneficiaries living in the South were most likely to be noncompliant, compared to those living in the North, for cardiovascular medications. This finding is alarming, considering
MMRR 2011: Volume 1 (4)
Blackwell, S., Baugh, D., Montgomery, M., Ciborowski, G., Waldron, C., Riley, G. E16
previous work by Obisesan, Vargas, and Gillum (2000) found Southerners to be at an increased risk for hypertension, a major risk factor for stroke, as compared to their non-Southern counterparts. Such relationships are likely a function of obesity, smoking, diet, etc.—factors leading to treatment to begin with.
Regarding dual eligibility enrollment, a previous study by Yanos (2001), using Medicare Current Beneficiary Survey data, found that the use of antipsychotic medication was significantly greater among dually enrolled individuals than among those who were enrolled in Medicare only. Our findings add to this previous work by suggesting differences in medication compliance may exist between beneficiaries dually enrolled and beneficiaries non-dually enrolled. In specific, we found dual eligibility enrollment to be associated with a lower likelihood of noncompliance with cardiovascular agent use for each therapeutic class we studied.
For PDP status, we initially found MAPD recipients to be generally more noncompliant than PDP recipients based on our within-group analysis. However, when holding all other predictors constant in our odds ratio analysis, we found noncompliance by PDP status varied by therapeutic class. More research is needed to tease out differences that may exist.
Regarding the impact of disease burden on compliance, the literature suggests that a positive association may exist between compliance and the number of chronic conditions presented by a patient (Billups, Malone, & Carter, 2000). Our findings do not support this for cardiovascular medication use among our study recipients. Our study addressed out-of-pocket costs and disease burden concurrently in the model, which differs from the previous work where patient out-of-pocket costs were not considered concurrently with disease burden when medication compliance was assessed. We initially found in our within-group analysis that individuals with the highest disease burden had the highest percentage of noncompliance with the exception of antihyperlipidemics. For antihyperlipidemics, individuals with the highest disease burden had the lowest percentage for noncompliance. Nevertheless, when holding all other predictors constant in our odds ratio analysis, we found cardiovascular recipients with higher disease burden more likely to be noncompliant as compared to enrollees with the lowest disease burden across all therapeutic classes, including the antihyperlipidemic class.
Current studies examining the effect of Medicare Part D on compliance are mixed (Schmittdiel et al., 2009). As indicated by Schmittdiel et al. (2009), some studies suggest Medicare Part D’s introduction improved compliance and decreased out-of-pocket costs, while others found evidence that increased drug costs decreased medication compliance, especially for those entering the coverage gap. Our findings suggest costs drive compliance. For our Part D cardiovascular recipients, increased daily OOP costs have a negative impact on compliance. However, compliance improves when external OOP medication costs increase. Perhaps patients are making financial trade-offs and choosing to purchase the less expensive medication among all medications prescribed.
MMRR 2011: Volume 1 (4)
Blackwell, S., Baugh, D., Montgomery, M., Ciborowski, G., Waldron, C., Riley, G. E17
Limitations
First, our data sources did not include patient income, which may affect affordability of the drugs and hence compliance. Unobserved cost-related factors may have impacted our findings in that the experience of duals in Part D, with respect to out-of-pocket costs, is different from non duals. Our analysis did not include the impact of gap phase (i.e., doughnut hole) entry or catastrophic phase entry. Additionally, administrative data cannot verify consumption or that a patient took the medication as prescribed.
Second, compliance values obtained from administrative data only provide assessments of possession. Thus, an overestimation of actual compliance is likely. On the other hand, by using a measure of compliance based on prescriptions filled via claims data, we may have misclassified some compliant beneficiaries as noncompliant, if beneficiaries received free samples from their prescribers. Thus, an underestimation of actual compliance may have occurred.
Third, the length of the assessment period may be problematic when using administrative data, as both shorter (e.g., <60 days) and longer (e.g., >90 days) time periods introduce potential bias when estimating medication compliance (Christensen et al., 1997). Compliance measures based on administrative data have not correlated well with patient reported compliance (Grossberg, Zhan, & Gross, 2004; Guénette, Moisan, Preville, & Boyer, 2005). Administrative data can, therefore, provide the researcher only an estimate of the highest possible level of medication consumption.
Despite these limitations, administrative data are convenient, noninvasive, objective, and inexpensive to obtain. In addition, compliance estimates based on administrative data appear to be associated with clinical outcomes (Grossberg, Zhan, & Gross, 2004; Weiden, Kozma, Grogg, & Locklear, 2004). Furthermore, while it may seem obvious it is important to note that possession of a medication is required prior to consuming it. Therefore, administrative data are frequently used to indicate medication possession and can serve as a convenient proxy for more invasive and costly measures of compliance.
Fourth, the cross-sectional design precludes measurement of previous behavior/drug fills during early months of the cross-section. Censoring is also likely to be common with this design. An alternative approach would be an inception cohort (i.e., new user design); however, an inception cohort may suffer from this same shortcoming when assessing all drugs within a drug class, because moving a patient from one drug to another within the same class would constitute a “new use.”
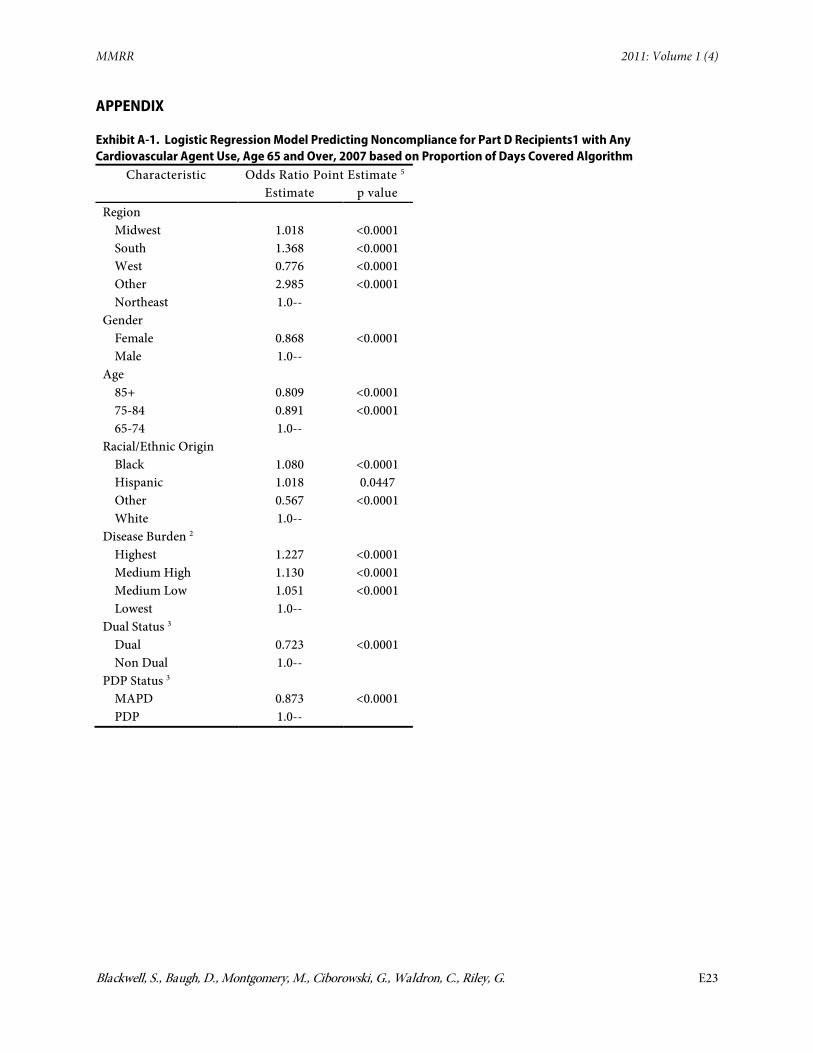
Fifth, the adherence measure used in the study is subject to natural variations in cardiovascular medication use. The problem is challenging and cannot be perfectly addressed. One possible approach would be to conduct an overall analysis using the proportion of days covered (PDC) for any cardiovascular medication. This would address overall gaps in treatment
MMRR 2011: Volume 1 (4)
Blackwell, S., Baugh, D., Montgomery, M., Ciborowski, G., Waldron, C., Riley, G. E18
of the underlying condition, rather than deficits in medication use by class. In the Appendix, we present our findings following this latter approach for comparison by the reader (Table 5
Lastly, the CMS-HCC risk score may be considered a proxy for plan cost, whereas we construed the variable as a proxy for patient disease burden.
).
Conclusion
It is encouraging to note that with the implementation of the Part D program, we found medication compliance rates for our study to be superior to rates previously reported in the literature. This finding is particularly reassuring when considering that medication therapy management is an important objective of the Part D program.
However, our results also suggest that the patients who are male, younger, Black, or residing in the South region are associated with a higher likelihood of noncompliance for cardiovascular agents. Dual eligibility enrollment was associated with a higher likelihood of improved compliance. Increased disease burden was associated with a higher likelihood of noncompliance. Increased OOP costs were associated with noncompliance. However, when OOP costs for other medications in a recipient’s medication regimen increase as compared to the therapeutic class under study, compliance for the therapeutic class under study improves.
Identifying patient characteristics that may contribute positively or negatively to medication compliance is an essential step to improved therapy. As a strategy to improve compliance, the proper selection of therapy that fits a particular patient is paramount. We are hopeful that our findings will assist Part D plans in their continual efforts to improve medication compliance, by providing a clearer picture of patient characteristics associated with less than optimal compliance based on medication therapeutic class, as well as provide potential areas for future research that should prove quite beneficial. Acknowledgments The authors are with the Office of Research, Development, and Information, Centers for Medicare & Medicaid Services (CMS). This research is internally funded. The views and opinions expressed in this article are those of the authors and do not necessarily reflect the views of the CMS. The authors received input and guidance from the following individuals in the development of this article (in alphabetical order by last name): Bill Clark, Renee Mentnech, and Noemi Rudolph. The article was substantially improved by the contributions of these individuals.
Correspondence Steven A. Blackwell, PhD, JD, Department of Health and Human Services—Centers for Medicare & Medicaid Services, Mail Stop C3-21-28, 7500 Security Boulevard, Baltimore, MD 21244, [email protected], Tel: 410-786-8652, Fax: 410-786-5610
MMRR 2011: Volume 1 (4)
Blackwell, S., Baugh, D., Montgomery, M., Ciborowski, G., Waldron, C., Riley, G. E19
References
Balbay, O., Annakkaya, A. N., Arbak, P., Bilgin, C., & Erbas, M. (2005). Which patients are able to adhere to tuberculosis treatment? A study in a rural area in the northwest part of Turkey. Japanese Journal of Infectious Diseases, 58, 152–158. PubMed
Benner, J. S., Glynn, R. J., Mogun, H., Neuman, P., Weinstein, M. C., & Avorn, J. (2002). Long-term persistence in use of statin therapy in elderly patients. Journal of the American Medical Association, 288, 455–461. PubMed doi:10.1001/jama.288.4.455
Billups, S. J., Malone, D. C., & Carter, B. L. (2000). Relationship between drug therapy noncompliance and patient characteristics, health-related quality of life, and health care costs. Pharmacotherapy, 20(8), 941–949. PubMed doi:10.1592/phco.20.11.941.35266
Christensen, D. B., Williams, B., Goldberg, H. I., Martin, D. P., Engelberg, R., & LoGerfo, J. P. (1997). Assessing compliance to antihypertensive medications using computer-based pharmacy records. Medical Care, 35, 1164–1170. PubMed doi:10.1097/00005650-199711000-00008
Col, N., Fanale, J. E., & Kronholm, P. (1990). The role of medication noncompliance and adverse drug reactions in hospitalizations of the elderly. Archives of Internal Medicine, 150, 841–845. PubMed doi:10.1001/archinte.150.4.841
Duncan, J. C., & Rogers, R. (1998). Medication compliance in patients with chronic schizophrenia: implications for the community management of mentally disordered offenders. Journal of Forensic Sciences, 43, 1133–1137. PubMed
Gary, T. L., Crum, R. M., Cooper-Patrick, L., Ford, D., & Brancati, F. (2000). Depressive symptoms and metabolic control in African Americans with type 2 diabetes. Diabetes Care, 23, 23–29. PubMed doi:10.2337/diacare.23.1.23
Grossberg, R., Zhan, Y., & Gross, R. (2004). A time-to-prescription-refill measure of antiretroviral adherence predicted changes in viral load in HIV. Journal of Clinical Epidemiology, 57, 1107–1110. PubMed doi:10.1016/j.jclinepi.2004.04.002
Guénette, L., Moisan, J., Preville, M., & Boyer, R. (2005). Measures of adherence based on self-report exhibited poor agreement with those based on pharmacy records. Journal of Clinical Epidemiology, 58, 924–933. PubMed doi:10.1016/j.jclinepi.2005.02.002
Hertz, R. P., Unger, A. N., & Lustik, M. B. (2005). Adherence with pharmacotherapy for type 2 diabetes: a retrospective cohort study of adults with employer-sponsored health insurance. Clinical Therapeutics, 27, 1064–1073. PubMed doi:10.1016/j.clinthera.2005.07.009
Hess, L. M., Raebel, M. A., Conner, D. A., & Malone, D. C. (2006). Measurement of adherence in pharmacy administrative databases: a proposal for standard definitions and preferred measures. The Annals of Pharmacotherapy, 40, 1280–1288. PubMed doi:10.1345/aph.1H018
Blackwell, S., Baugh, D., Montgomery, M., Ciborowski, G., Waldron, C., Riley, G. E20
Hope, C. J., Wu, J., Tu, W., Young, J., & Murray, M. D. (2004). Association of medication adherence, knowledge, and skills with emergency department visits by adults 50 years or older with congestive heart failure. American Journal of Health-System Pharmacy, 61, 2043–2049. PubMed
Insull, W. (1997). The problem of compliance to cholesterol altering therapy. Journal of Internal Medicine, 241, 317–325. PubMed doi:10.1046/j.1365-2796.1997.112133000.x
Jin, J., Sklar, G. E., Min Sen Oh, V., & Chuen, L. S. (2008). Factors affecting therapeutic compliance: a review from the patient’s perspective. Therapeutics and Clinical Risk Management, 4(1), 269–286. PubMed
Kardas, P. (2004). Comparison of once daily versus twice daily oral nitrates in stable angina pectoris. The American Journal of Cardiology, 94, 213–216. PubMed doi:10.1016/j.amjcard.2004.03.067
Kardas, P. (2007). Compliance, clinical outcome, and quality of life of patients with stable anginal pectoris receiving once-daily betaxolol versus twice daily metoprolol: a randomized controlled trial. Vascular Health and Risk Management, 3(2), 235–242. PubMed doi:10.2147/vhrm.2007.3.2.235
Kim, Y. S., Sunwoo, S., Lee, H. R., Lee, K. M., Park, Y. W., Shin, H. C., . . . Huh, B. Y. (2002). Determinants of non-compliance with lipid-lowering therapy in hyperlipidemic patients. Pharmacoepidemiology and Drug Safety, 11, 593–600. PubMed doi:10.1002/pds.730
LaFleur, J., & Oderda, G. M. (2004). Methods to measure patient compliance with medication regimens. Journal of Pain & Palliative Care Pharmacotherapy, 18, 81–87. PubMed
Malhotra, S., Karan, R. S., Pandhi, P., & Jain, S. (2001). Drug related medical emergencies in the elderly: role of adverse drug reactions and non-compliance. Postgraduate Medical Journal, 77, 703–707. PubMed doi:10.1136/pmj.77.913.703
Monane, M., Bohn, R. L., Gurwitz, J. H., Glynn, R. J., Levin, R., & Avorn, J. (1996). Compliance with antihypertensive therapy among elderly Medicaid enrollees: the roles of age, gender, and race. American Journal of Public Health, 86, 1805–1808. PubMed doi:10.2105/AJPH.86.12.1805
Munger, M. A., Van Tassell, B. W., & LaFleur, J. (2007). Medication Nonadherence: an unrecognized cardiovascular risk factor. Medscape General Medicine, 9(3), 58. PubMed
Newby, L. K., LaPointe, N. M., Chen, A. Y., Kramer, J. M., Hammil, B. G., DeLong, E. R., . . . Califf, R. M. (2006). Long-term adherence to evidence-based secondary prevention therapies in coronary artery disease. Circulation, 113, 203–212. PubMed doi:10.1161/CIRCULATIONAHA.105.505636
Obisesan, T. O., Vargas, M., & Gillum, R. (2000). Geographic variation in stroke risk in the United States: region, urbanization, and hypertension in the third national health and nutrition examination survey. Stroke, 31, 19–25. PubMed doi:10.1161/01.STR.31.1.19
Blackwell, S., Baugh, D., Montgomery, M., Ciborowski, G., Waldron, C., Riley, G. E21
Osterberg, L., & Blaschke, T. (2005). Adherence to medication. The New England Journal of Medicine, 353, 487–497. PubMed doi:10.1056/NEJMra050100
Raiz, L. R., Kilty, K. M., & Henry, M. L. (1999). Medication compliance following renal transplantation. Transplantation, 68, 51–55. PubMed doi:10.1097/00007890-199907150-00010
Research Data Assistance Center (ResDAC) (2010). Retrieved from http://www.resdac.umn.edu/ddvh/CMS_Part_D_Denominator_File_jul_2009.pdf.
Roter, D. L., Hall, J. A., Merisca, R., Nordstrom, B., Cretin, D., & Svarstad, B. (1998). Effectiveness of interventions to improve patient compliance. A meta-analysis. Medical Care, 36, 1138–1161. PubMed doi:10.1097/00005650-199808000-00004
Rudd, P. The measurement of compliance: medication taking. Developmental Aspects of Health Compliance Behavior. Krasnegor NA, Epstein L, Johnson SF, Yaffe SJ, Eds. Hillsdale, NJ, Lawrence Erlbaum Associates, 1993, p. 185-213.
SAS Institute, Inc. (2010), Reviewed September 20, 2010 from http://www.sas.com/ Schmittdiel, J. A., Ettner, S. L., Fung, V., Huang, J., Turk, N., Quiter, E., . . . Mangoine, C. (2009)
Medicare Part D coverage gap and diabetes beneficiaries. http://www.AMJC.com.;15(3),189-193
Senior, V., Marteau, T. M., & Weinman, J. (2004). Self-reported adherence to cholesterol-lowering medication in patients with familial hypercholesterolaemia: the role of illness perceptions. Cardiovascular Drugs and Therapy, 18, 475–481. PubMed doi:10.1007/s10557-004-6225-z
Sherman, B. W., Frazee, S. G., Fabius, R. J., Broome, R. A., Manfred, J. R., & Davis, J. C. (2009). Impact of workplace health services on adherence to chronic medications. The American Journal of Managed Care, 15(7), e53–e59. PubMed
Sirey, J. A., Bruce, M. L., Alexopoulos, G. S., Perlick, D. A., Friedman, S. J., & Meyers, B. S. (2001). Stigma as a barrier to recovery: perceived stigma and patient-rated severity of illness as predictors of antidepressant drug adherence. Psychiatric Services (Washington, D.C.), 52, 1615–1620. PubMed doi:10.1176/appi.ps.52.12.1615
Skaer, T. L., Sclar, D. A., Markowski, D. J., & Won, J. K. H. (1993). Effect of value-added utilities on prescription refill compliance and Medicaid health care expenditures: a study of patients with non-insulin-dependent diabetes mellitus. Journal of Clinical Pharmacy and Therapeutics, 18, 295–299. PubMed doi:10.1111/j.1365-2710.1993.tb00591.x
Sullivan, S. D., & Kreling, D. H. (1990). Noncompliance with medication regimens and subsequent hospitalizations: a literature analysis and cost of hospitalization estimate. Journal of Research in Pharmaceutical Economics, 2, 19–33.
Tangalos, E. G. & Zarowitz, B. J. (2006). Medication management in the elderly. Annals of Long Term Care., 14(8), 27–31.
Blackwell, S., Baugh, D., Montgomery, M., Ciborowski, G., Waldron, C., Riley, G. E22
Thomas, L. K., Sargent, R. G., Michels, P. C., Richter, D. L., Valois, R. F., & Moore, C. G. (2001). Identification of the factors associated with compliance to therapeutic diets in older adults with end stage renal disease. Journal of Renal Nutrition, 11, 80–89. PubMed doi:10.1016/S1051-2276(01)98615-7
U.S. Census Bureau (2010), Retrieved from http://www.census.gov/geo/www/us_regdiv.pdf Vanderpoel, D. R., Hussein, M. A., Watson-Heidari, T., & Perry, A. (2004). Adherence to a
fixed-dose combination of rosiglitazone maleate/metformin hydrochloride in subjects with type 2 diabetes mellitus: a retrospective database analysis. Clinical Therapeutics, 26, 2066–2075. PubMed doi:10.1016/j.clinthera.2004.12.018
Wolters Kluwer Health, (2009). Master Drug Data Base. Retrieved from http://www.medispan.com/marketing/ContentPage.aspx?contentId=09e0f1ed-80a9-4a87-8bc9-ad778d7b6615
Weiden, P. J., Kozma, C., Grogg, A., & Locklear, J. (2004). Partial compliance and risk of rehospitalization among California Medicaid patients with schizophrenia. Psychiatric Services Washington, D.C.), 55, 886–891. PubMed doi:10.1176/appi.ps.55.8.886
Yanos, P. T. (2001). Characteristics and service use patterns of nonelderly Medicare beneficiaries with schizophrenia. Psychiatric Services (Washington, D.C.), 52, 1644–1650. PubMed doi:10.1176/appi.ps.52.12.1644
Yu, Y. F., Nicol, M. B., Yu, A. P., & Ahn, J. (2005). Persistence and adherence of medications for chronic overactive bladder/urinary incontinence in the California Medicaid program. Value in Health, 8, 495–505. PubMed doi:10.1111/j.1524-4733.2005.00041.x
Blackwell, S., Baugh, D., Montgomery, M., Ciborowski, G., Waldron, C., Riley, G. E23
APPENDIX
Exhibit A-1. Logistic Regression Model Predicting Noncompliance for Part D Recipients1 with Any Cardiovascular Agent Use, Age 65 and Over, 2007 based on Proportion of Days Covered Algorithm
Characteristic Odds Ratio Point Estimate
5 Estimate p value
Region Midwest 1.018 <0.0001 South 1.368 <0.0001 West 0.776 <0.0001 Other 2.985 <0.0001 Northeast 1.0--
Gender Female 0.868 <0.0001 Male 1.0--
Age 85+ 0.809 <0.0001 75-84 0.891 <0.0001 65-74 1.0--
Racial/Ethnic Origin Black 1.080 <0.0001 Hispanic 1.018 0.0447 Other 0.567 <0.0001 White 1.0--
Disease Burden 2 Highest 1.227 <0.0001 Medium High 1.130 <0.0001 Medium Low 1.051 <0.0001 Lowest 1.0--
Dual Status 3 Dual 0.723 <0.0001 Non Dual 1.0--
PDP Status 3 MAPD 0.873 <0.0001 PDP 1.0--
MMRR 2011: Volume 1 (4)
Blackwell, S., Baugh, D., Montgomery, M., Ciborowski, G., Waldron, C., Riley, G. E24
Exhibit A-1 (cont.)
Characteristic Odds Ratio Point
Estimate
5 Estimate p value
Relative OOP Non-Class Costs 4 Highest 0.522 <0.0001 Medium High 0.585 <0.0001 Medium Low 0.684 <0.0001 Lowest 1.0--
Relative OOP Daily Class Costs 4 Highest 2.430 <0.0001 Medium High 1.948 <0.0001 Medium Low 1.458 <0.0001 Lowest 1.0--
1 Recipients with hospital stays excluded from this analysis. 2Based on CMS' hierarchical condition category risk scores . 3 Enrolled for the entire twelve months as this classification for calendar year 2007. 4 Quartile assigment made by (a)assigning the enrollee into one of the two groups of
duals or non duals and (b) comparing the enrollee's OOP costs to other enrollees in the group.
Medicare & Medicaid Research Review is a peer-reviewed, online journal reporting data and research that informs current and future directions of the Medicare, Medicaid, and Children’s Health Insurance programs. The journal seeks to examine and evaluate health care coverage, quality and access to care for beneficiaries, and payment for health services.
http://www.cms.gov/MMRR/
U.S. Department of Health & Human Services Kathleen Sebelius,
Secretary Centers for Medicare & Medicaid Services
Marilyn Tavenner Acting Administrator
Center for Strategic Planning Anthony D. Rodgers,
Deputy Administrator and Director
Editor-in-Chief David M. Bott, Ph.D. Senior Editor Cynthia Riegler, M.A.
Editorial Board
Gerald S. Adler, M.Phil. CMS/Center for Strategic Planning
Andrew Bindman, M.D. University of California, San Francisco
William J. Buczko, Ph.D. CMS/Innovation Center
Todd Caldis, Ph.D., J.D. CMS/Office of the Actuary
Craig F. Caplan, M.A. CMS/ Innovation Center
Melissa A. Evans, Ph.D. CMS/Center for Medicare
John Hsu, M.D., M.B.A, M.S.C.E. Harvard Medical School
Jesse M. Levy, Ph.D. CMS/ Innovation Center
Jennifer Polinski, Sc.D, M.P.H. Brigham & Women's Hospital Isidor R. Strauss, F.S.A.
CMS/Office of the Actuary Fred G. Thomas, Ph.D., C.P.A.
CMS/ Innovation Center Robert Weech-Maldonado, Ph.D. University of Alabama at Birmingham
Published by the Centers for Medicare & Medicaid Services All material in the Medicare & Medicaid Research Review is in the public domain and may be duplicated without permission.