22 IEEE TRANSACTIONS ON INSTRUMENTATION AND MEASUREMENT. VOL. 38, NO. I. FEBRUARY 1989 Noncontacting Electrical Conductivity Sensor for Remote, Hostile Environments Abstract-A device for measuring the electrical conductivity at the surface of a large or semi-infinite body at centimeter scale has been developed. The high frequency noncontacting measurement uses single turn transmitter and receiver loops to generate and detect eddy cur- rents in the material to be probed. Response is linear in conductivity over the four decades of interest in geophysical investigations. The me- chanical design of the sensor makes it insensitive to temperature and pressure changes, and to accelerations, impact, and abrasion. There- fore, it is operable in remote, hostile environments such as deep boreholes. I. INTRODUCTION LECTRICAL conductivity is an important quantity in E a number of sensing applications such as nondestruc- tive evaluation of materials, biological investigations, and geophysical exploration. For example, the conductivity of an earth formation depends on its mineralogy and on the composition of fluids residing in its interstices. Neigh- boring layers in sedimentary formations can have conduc- tivity contrasts of as much as 10 000: 1, ranging from lop3 to 10’ S/m. Therefore, centimeter scale electrical measurements of earth formations can be very helpful in identifying and determining the geometry of sedimentary bedding. This is particularly true in situations where sam- ple collection or visual examination of the formations is difficult or impossible, as for instance in deep boreholes. Well bores, especially those drilled for oil production, are unusually harsh environments in which to make phys- ical measurements. Such wells may be as much as 10-km deep; pressures of 140 MPa and temperatures of 175°C are commonly encountered. The instrumentation must also be able to withstand considerable shock, impact, and abrasion not only underground but also en route to and at wellsites. When conductivity sensors are used to determine the geometry of formations, as for instance their dip and strike, additional requirements are imposed. The dip plane is best measured by correlating conductivity profiles mea- sured along three or, more commonly, four tracks spaced around the borehole wall. The four sensors and their sup- Manuscript received July 9, 1988. R. L. Kleinberg and D. D. Griffin are with Schlumberger-Doll Re- W. C. Chew is with the Department of Electrical and Computer Engi- IEEE Log Number 8824668. search, Ridgefield, CT 06877. neering, University of Illinois, Urbana, 1L 61801. porting arms must close to a diameter of no more than 12 cm to slide into a well bore which might be 15 cm in diameter. This puts an important limitation on the size of the sensors. During the measurements, the arms are opened to place the sensors in proximity to the formation. IV. EXISTING METHODS Electrical conductivity instrumentation used in well bores is typically of the focused electrode type [ 11. A low frequency current is injected from an electrode into the earth, and the impedance of the formation near the elec- trode is determined by a measurement of the electrode voltage. This technique is satisfactory when a conductive path exists between the electrode and the formation, as when a well is filled with saline water. However, if the well is filled with oil the voltage drop will be dominated by the oil resistance, even if only a thin film of oil sepa- rates electrode from the formation. When electrode measurements are not possible, a non- contacting “induction” method can be used [2]. Alter- nating current in a coil generates an oscillating magnetic field, which in turn creates an electromotive force which drives eddy currents in the formation. These eddy cur- rents generate a secondary magnetic field, which may be sensed by one or more receiver coils. The voltage induced in a receiver coil is, to the lowest approximation, linearly proportional to formation conductivity and quadratically proportional to frequency. Induction measurements are now used routinely in geo- physical well logging [ l ] . These measurements are made using coils wound on a mandrel which is more or less centralized in the borehole. The operating frequency is around 20 kHz, and the coils are about a meter apart. To obtain a usable signal level, the coils consist of hundreds of turns of wire. The use of metal structural components is held to an absolute minimim, as metal parts give spu- rious signals many orders of magnitude larger than for- mation signals. The spatial resolution of this measure- ment is about a meter. Merely scaling down the apparatus is not a viable route to a centimeter scale measurement. 111. THE MICROINDUCTION SENSOR Since the magnetic field of a current carrying loop is inherently unfocused, centimeter resolution implies a comparable depth of investigation. Thus a miniaturized, 0018-9456/89/0200-0022$01 .OO O 1989 IEEE
Transcript
22 IEEE TRANSACTIONS ON INSTRUMENTATION A N D MEASUREMENT. VOL. 38, NO. I . FEBRUARY 1989
Noncontacting Electrical Conductivity Sensor for Remote, Hostile Environments
Abstract-A device for measuring the electrical conductivity at the surface of a large or semi-infinite body at centimeter scale has been developed. The high frequency noncontacting measurement uses single turn transmitter and receiver loops to generate and detect eddy cur- rents in the material to be probed. Response is linear in conductivity over the four decades of interest in geophysical investigations. The me- chanical design of the sensor makes it insensitive to temperature and pressure changes, and to accelerations, impact, and abrasion. There- fore, it is operable in remote, hostile environments such as deep boreholes.
I . INTRODUCTION LECTRICAL conductivity is an important quantity in E a number of sensing applications such as nondestruc-
tive evaluation of materials, biological investigations, and geophysical exploration. For example, the conductivity of an earth formation depends on its mineralogy and on the composition of fluids residing in its interstices. Neigh- boring layers in sedimentary formations can have conduc- tivity contrasts of as much as 10 000: 1, ranging from lop3 to 10’ S/m. Therefore, centimeter scale electrical measurements of earth formations can be very helpful in identifying and determining the geometry of sedimentary bedding. This is particularly true in situations where sam- ple collection or visual examination of the formations is difficult or impossible, as for instance in deep boreholes.
Well bores, especially those drilled for oil production, are unusually harsh environments in which to make phys- ical measurements. Such wells may be as much as 10-km deep; pressures of 140 MPa and temperatures of 175°C are commonly encountered. The instrumentation must also be able to withstand considerable shock, impact, and abrasion not only underground but also en route to and at wellsites.
When conductivity sensors are used to determine the geometry of formations, as for instance their dip and strike, additional requirements are imposed. The dip plane is best measured by correlating conductivity profiles mea- sured along three or, more commonly, four tracks spaced around the borehole wall. The four sensors and their sup-
Manuscript received July 9, 1988. R. L. Kleinberg and D. D. Griffin are with Schlumberger-Doll Re-
W. C . Chew is with the Department of Electrical and Computer Engi-
IEEE Log Number 8824668.
search, Ridgefield, CT 06877.
neering, University of Illinois, Urbana, 1L 61801.
porting arms must close to a diameter of no more than 12 cm to slide into a well bore which might be 15 cm in diameter. This puts an important limitation on the size of the sensors. During the measurements, the arms are opened to place the sensors in proximity to the formation.
IV. EXISTING METHODS Electrical conductivity instrumentation used in well
bores is typically of the focused electrode type [ 11. A low frequency current is injected from an electrode into the earth, and the impedance of the formation near the elec- trode is determined by a measurement of the electrode voltage. This technique is satisfactory when a conductive path exists between the electrode and the formation, as when a well is filled with saline water. However, if the well is filled with oil the voltage drop will be dominated by the oil resistance, even if only a thin film of oil sepa- rates electrode from the formation.
When electrode measurements are not possible, a non- contacting “induction” method can be used [ 2 ] . Alter- nating current in a coil generates an oscillating magnetic field, which in turn creates an electromotive force which drives eddy currents in the formation. These eddy cur- rents generate a secondary magnetic field, which may be sensed by one or more receiver coils. The voltage induced in a receiver coil is, to the lowest approximation, linearly proportional to formation conductivity and quadratically proportional to frequency.
Induction measurements are now used routinely in geo- physical well logging [ l ] . These measurements are made using coils wound on a mandrel which is more or less centralized in the borehole. The operating frequency is around 20 kHz, and the coils are about a meter apart. To obtain a usable signal level, the coils consist of hundreds of turns of wire. The use of metal structural components is held to an absolute minimim, as metal parts give spu- rious signals many orders of magnitude larger than for- mation signals. The spatial resolution of this measure- ment is about a meter. Merely scaling down the apparatus is not a viable route to a centimeter scale measurement.
111. THE MICROINDUCTION SENSOR Since the magnetic field of a current carrying loop is
inherently unfocused, centimeter resolution implies a comparable depth of investigation. Thus a miniaturized,
0018-9456/89/0200-0022$01 .OO O 1989 IEEE
KLEINBERG er al. : ELECTRICAL CONDUCTIVITY SENSOR 23
Formation
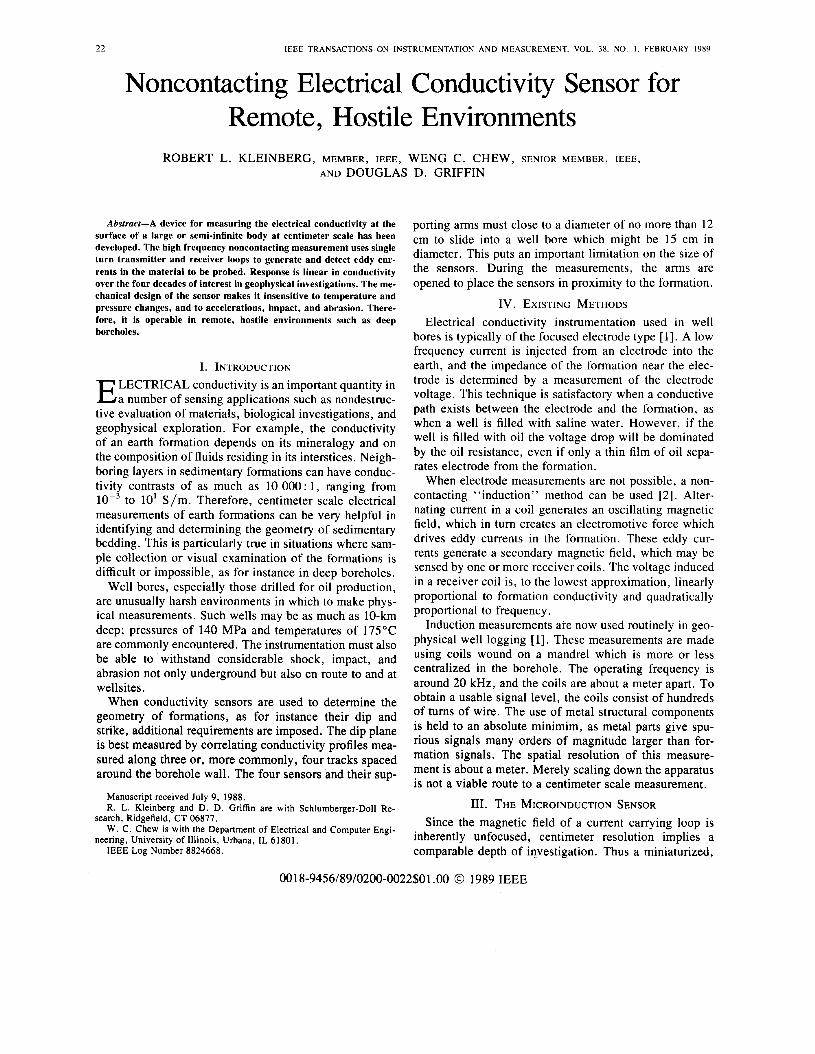
Fig. 1. The microinduction sensor concept. A current I in the transmitter loop creates a primary magnetic field. The primaty field creates an elec- tromotive force which drives eddy currents in the formation, which in turn radiate a secondary magnetic field. The secondary field produces unequal voltages in the two receiver loops. The difference voltage VL is sensed across the receiver load ZL.
or “microinduction”, sensor must be placed at the sur- face of the material body to be probed. Fig. 1 shows a representative implementation. One transmitter loop is flanked by two symmetrically placed receiver loops con- nected in series opposition. The direct mutual induction between the transmitter and a single receiver is far larger than the formation signal, and only very accurate sym- metrical placement of the receivers with respect to the transmitter permits cancellation of this signal. The receiv- ers are unequally coupled to the formation, so a net signal arises from the secondary magnetic field produced by the eddy currents.
The signal level obtainable from the sensor when it is placed near a homogeneous formation is [3]
V, = 2?rw2p21nrn,aG (1)
w is the operating frequency, I is the transmitter current, n, is the number of turns in the transmitter coil, n, is the number of turns in each of the receiver coils, p is the magnetic permeability of the formation, (T is the conduc- tivity of the formation, and G is a geometrical factor which depends on the coil dimensions and the distance between the sensor and formation. The geometrical factor, and hence, the signal level, increases with coil radii. The ge- ometrical factor, and the response of the sensor to inho- mogeneous formations and in cases of imperfect appli- cation, have been calculated and are reported elsewhere
The sensor must be compact and stable with respect to temperature and pressure variations. On both counts, multiturn coils are undesirable. Therefore, the antennas consist of single turn loops, which may be printed on ce- ramic substrates using photolithographic techniques. The use of these techniques enable sensors to be constructed rapidly and economically.
Since the antennas are small and consist of a single turn, the sensor must be operated at a frequency high enough to ensure an adequate signal level. One upper limit is the self resonant frequency of the loops, which is on the order of 100 MHz in the assembled sensor. Moteover, maxi- mum sensitivity and linearity is obtained when the pene- tration of the magnetic fields in the formation is not lim-
~ 3 1 .
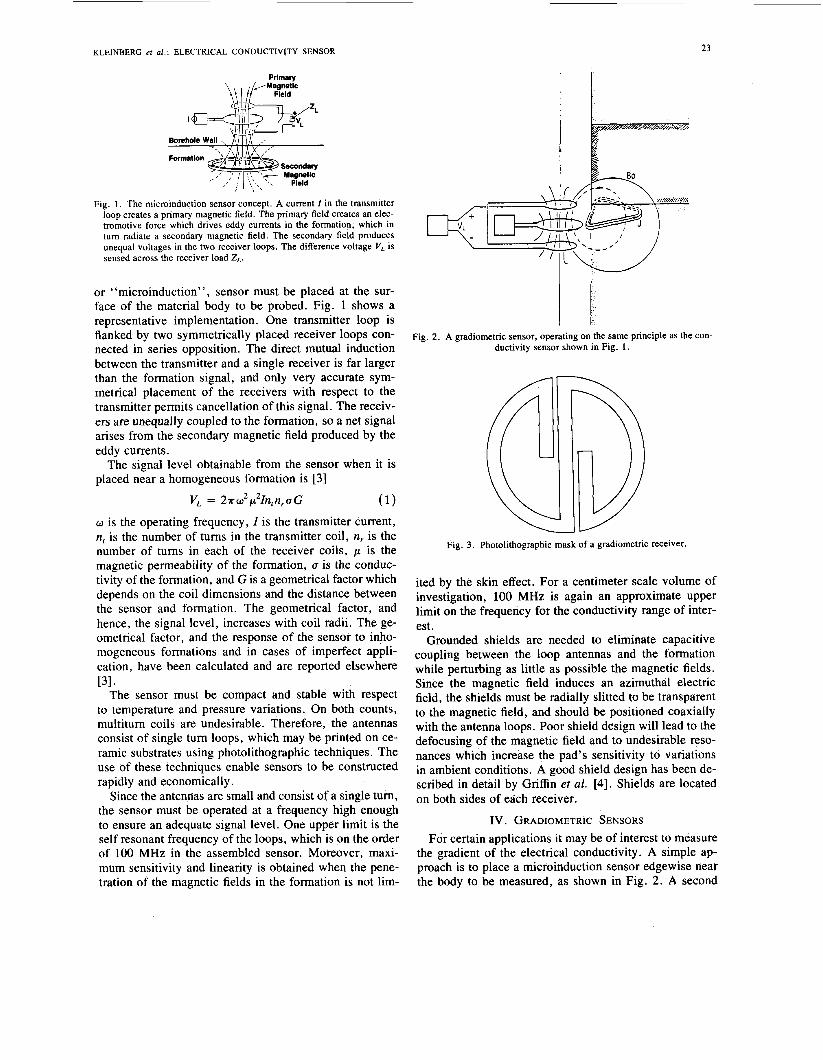
Fig. 2. A gradiometric sensor, operating on the same principle as the con- ductivity sensor shown in Fig. 1 .
Fig. 3. Photolithographic mask of a gradiometric receiver.
ited by the skin effect. For a centimeter scale volume of investigation, 100 MHz is again an approximate upper limit on the frequency for the conductivity range of inter- est.
Grounded shields are needed to eliminate capacitive coupling between the loop antennas and the formation while perturbing as little as possible the magnetic fields. Since the magnetic field induces an azimuthal electric field, the shields must be radially slitted to be transparent to the magnetic field, and should be positioned coaxially with the antenna loops. Poor shield design will lead to the defocusing of the magnetic field and to undesirable reso- nances which increase the pad’s sensitivity to variations in ambient conditions. A good shield design has been de- scribed in detail by Griffin et al. [4]. Shields are located on both sides of each receiver.
IV. GRADIOMETRIC SENSORS For certain applications it may be of interest to measure
the gradient of the electrical conductivity. A simple ap- proach is to place a microinduction sensor edgewise near the body to be measured, as shown in Fig. 2 . A second
24 IEEE TRANSACTIONS ON INSTRUMENTATION AND MEASUREMENT, VOL. 38. NO. I , FEBRUARY 1989
o l O - ' 10' 102 10' 106
I I
108
20 KHr m w
L L
10'2 I
loo 10' 10' los 10' Conductivity (S/m)
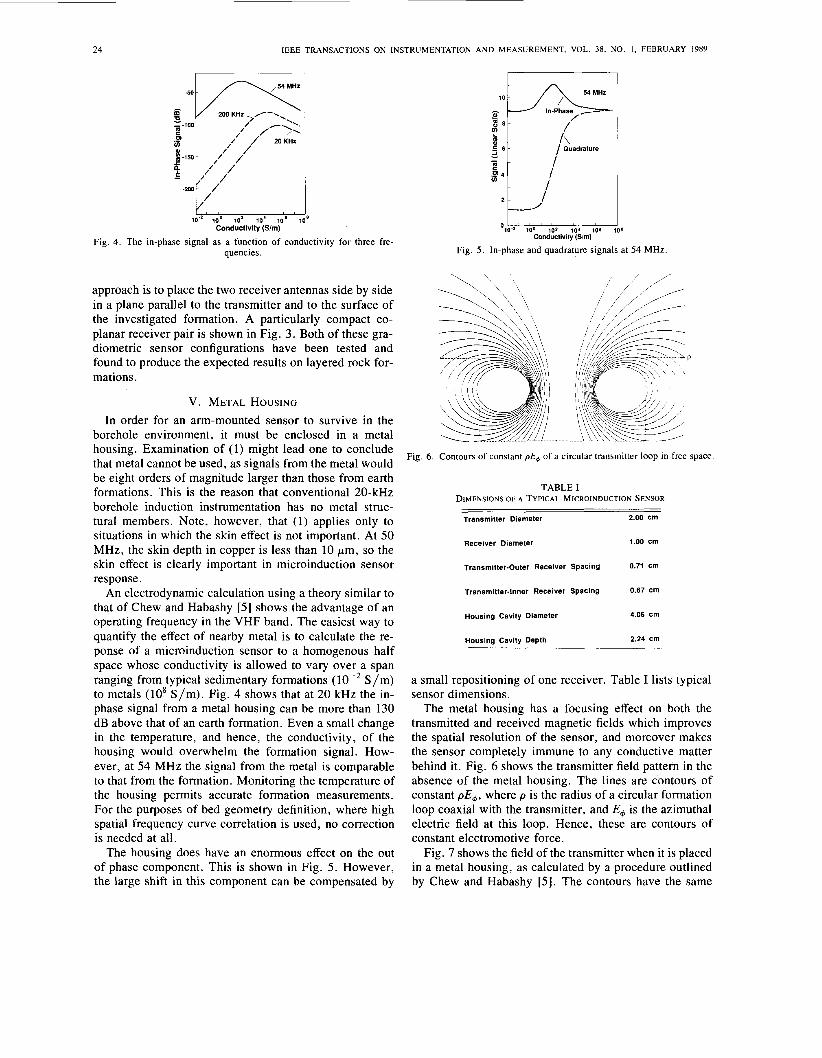
Fig. 4. The in-phase signal as a function of conductivity for three fre- quencies.
approach is to place the two receiver antennas side by side in a plane parallel to the transmitter and to the surface of the investigated formation. A particularly compact co- planar receiver pair is shown in Fig. 3. Both of these gra- diometric sensor configurations have been tested and found to produce the expected results on layered rock for- mations.
V. METAL HOUSING In order for an arm-mounted sensor to survive in the
borehole environment, it must be enclosed in a metal housing. Examination of (1) might lead one to conclude that metal cannot be used, as signals from the metal would be eight orders of magnitude larger than those from earth formations. This is the reason that conventional 20-kHz borehole induction instrumentation has no metal struc- tural members. Note, however, that (1) applies only to situations in which the skin effect is not important. At 50 MHz, the skin depth in copper is less than 10 pm, so the skin effect is clearly important in microinduction sensor response.
An electrodynamic calculation using a theory similar to that of Chew and Habashy [5] shows the advantage of an operating frequency in the VHF band. The easiest way to quantify the effect of nearby metal is to calculate the re- ponse of a microinduction sensor to a homogenous half space whose conductivity is allowed to vary over a span ranging from typical sedimentary formations ( S/m) to metals (10' S/m). Fig. 4 shows that at 20 kHz the in- phase signal from a metal housing can be more than 130 dB above that of an earth formation. Even a small change in the temperature, and hence, the conductivity, of the housing would overwhelm the formation signal. How- ever, at 54 MHz the signal from the metal is comparable to that from the formation. Monitoring the temperature of the housing permits accurate formation measurements. For the purposes of bed geometry definition, where high spatial frequency curve correlation is used, no correction is needed at all.
The housing does have an enormous effect on the out of phase component. This is shown in Fig. 5. However, the large shift in this component can be compensated by
I\ 1 Quadrature
Fig. 6 . Contours of constant PE, of a circular transmitter loop in free space.
TABLE I DIMENSIONS OF A TYPICAL MICROINDUCTION SENSOR
Transmitter Diameter 2.00 cm
Receiver Diameter 1.00 cm
Transmitter-Outer Receiver Spacing 0.71 cm
Transmitter-Inner Receiver Spacing 0.67 cm
Housing Cavity Diameter 4.06 cm
Housing Cavity Depth 2.24 cm
a small repositioning of one receiver. Table I lists typical sensor dimensions.
The metal housing has a focusing effect on both the transmitted and received magnetic fields which improves the spatial resolution of the sensor, and moreover makes the sensor completely immune to any conductive matter behind it. Fig. 6 shows the transmitter field pattern in the absence of the metal housing. The lines are contours of constant PE+, where p is the radius of a circular formation loop coaxial with the transmitter, and E+ is the azimuthal electric field at this loop. Hence, these are contours of constant electromotive force.
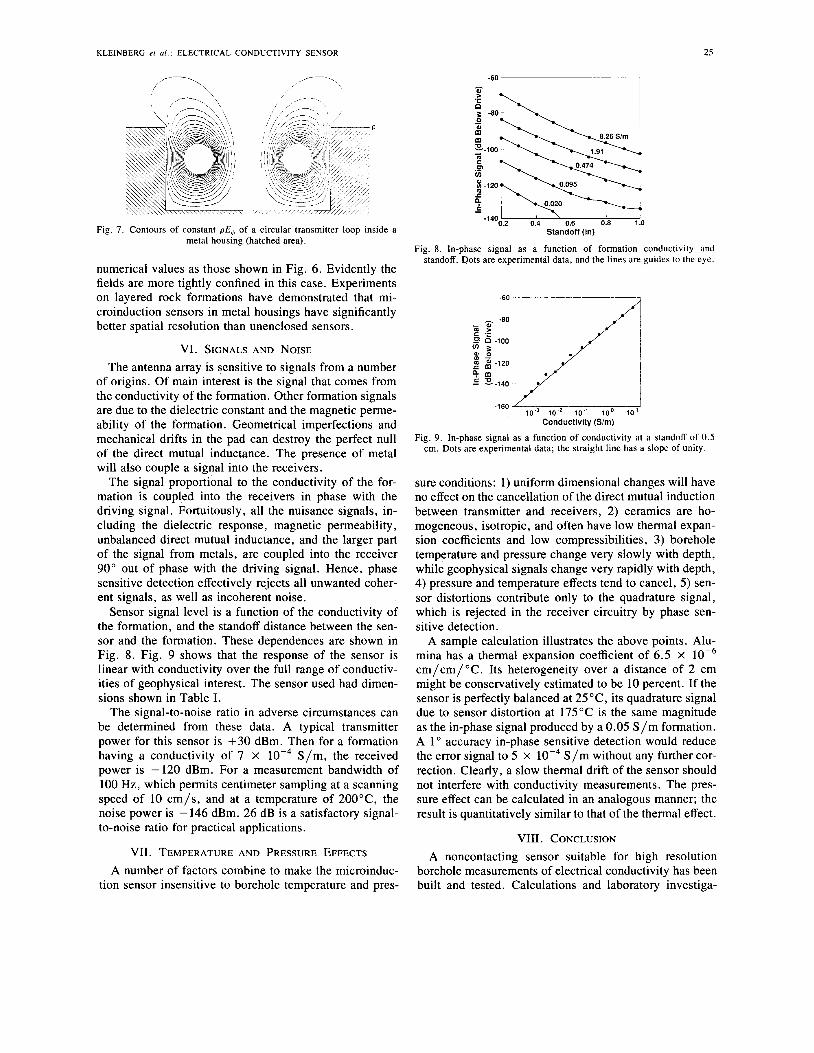
Fig. 7 shows the field of the transmitter when it is placed in a metal housing, as calculated by a procedure outlined by Chew and Habashy [ 5 ] . The contours have the same
KLEINBERG et a l . : ELECTRICAL CONDUCTIVITY SENSOR 25
Fig. 7. Contours of constant PE+ of a circular transmitter loop inside a metal housing (hatched area).
numerical values as those shown in Fig. 6. Evidently the fields are more tightly confined in this case. Experiments on layered rock formations have demonstrated that mi- croinduction sensors in metal housings have significantly better spatial resolution than unenclosed sensors.
VI. SIGNALS AND NOISE The antenna array is sensitive to signals from a number
of origins. Of main interest is the signal that comes from the conductivity of the formation. Other formation signals are due to the dielectric constant and the magnetic perme- ability of the formation. Geometrical imperfections and mechanical drifts in the pad can destroy the perfect null of the direct mutual inductance. The presence of metal will also couple a signal into the receivers.
The signal proportional to the conductivity of the for- mation is coupled into the receivers in phase with the driving signal. Fortuitously, all the nuisance signals, in- cluding the dielectric response, magnetic permeability, unbalanced direct mutual inductance, and the larger part of the signal from metals, are coupled into the receiver 90" out of phase with the driving signal. Hence, phase sensitive detection effectively rejects all unwanted coher- ent signals, as well as incoherent noise.
Sensor signal level is a function of the conductivity of the formation, and the standoff distance between the sen- sor and the formation. These dependences are shown in Fig. 8. Fig. 9 shows that the response of the sensor is linear with conductivity over the full range of conductiv- ities of geophysical interest. The sensor used had dimen- sions shown in Table I.
The signal-to-noise ratio in adverse circumstances can be determined from these data. A typical transmitter power for this sensor is +30 dBm. Then for a formation having a conductivity of 7 x lop4 S/m, the received power is -120 dBm. For a measurement bandwidth of 100 Hz, which permits centimeter sampling at a scanning speed of 10 cm/s, and at a temperature of 200°C, the noise power is - 146 dBm. 26 dB is a satisfactory signal- to-noise ratio for practical applications.
VII. TEMPERATURE AND PRESSURE EFFECTS A number of factors combine to make the microinduc-
tion sensor insensitive to borehole temperature and pres-
Standoff (in)
Fig. 8. In-phase signal as a function of formation conductivity and standoff. Dots are experimental data, and the lines are guides to the eye.
-60 I / I i -160
1 0 ' ~ IO-^ 10" ioo IO' Conductivity (Sirn)
Fig. 9. In-phase signal as a function of conductivity at a standoff of 0.5 cm. Dots are experimental data; the straight line has a slope of unity.
sure conditions: 1) uniform dimensional changes will have no effect on the cancellation of the direct mutual induction between transmitter and receivers, 2) ceramics are ho- mogeneous, isotropic, and often have low thermal expan- sion coefficients and low compressibilities, 3) borehole temperature and pressure change very slowly with depth, while geophysical signals change very rapidly with depth, 4) pressure and temperature effects tend to cancel, 5) sen- sor distortions contribute only to the quadrature signal, which is rejected in the receiver circuitry by phase sen- sitive detection.
A sample calculation illustrates the above points. Alu- mina has a thermal expansion coefficient of 6.5 X lop6 cm/cm/"C. Its heterogeneity over a distance of 2 cm might be conservatively estimated to be 10 percent. If the sensor is perfectly balanced at 25"C, its quadrature signal due to sensor distortion at 175°C is the same magnitude as the in-phase signal produced by a 0.05 S /m formation. A 1 " accuracy in-phase sensitive detection would reduce the error signal to 5 X S/m without any further cor- rection. Clearly, a slow thermal drift of the sensor should not interfere with conductivity measurements. The pres- sure effect can be calculated in an analogous manner; the result is quantitatively similar to that of the thermal effect.
VIII. CONCLUSION A noncontacting sensor suitable for high resolution
borehole measurements of electrical conductivity has been built and tested. Calculations and laboratory investiga-
26 IEEE TRANSACTIONS ON INSTRUMENTATION A N D MEASUREMENT, VOL. 38. NO. I . FEBRUARY 1989
tions have shown that there are no major barriers to the use of the sensor in remote, hostile environments. Engi- neered sensors designed along the lines described here are now in use in a deployed oil base mud dipmeter.
ACKNOWLEDGMENT
The authors wish to thank Dr. B. Clark for his partici- pation in any early phase of this project, Dr. E. Y. Chow for his signal processing studies, Dr. M. P. Ekstrom and A. Dumont for their advice and encouragement, and Dr. T. M. Habashy for his aid in clarifying the manuscript.
REFERENCES [l] D. V. Ellis, Well Loggingfor Earth Scientists. New York: Elsevier,
1987. [2] J. H. Moran and K. S. Kunz, “Basic theory of induction logging and
application to study of two-coil sondes,” Geophysics, vol. 27, p. 829, 1962.
[3] W. C. Chew and R. L. Kleinberg, “Theory of microinduction mea- surements,” IEEE Trans. Geosci. Remote Sensing, vol. 26, pp. 707- 719, Nov. 1988.
[4] D. D. Griffin, W. C . Chew, B. Clark, and R. L. Kleinberg, “Appa- ratus for microinductive investigation of earth formations with im- proved electroquasistatic shielding,” U.S. Patent 4 739 272, 1988.
[5] W. C. Chew and T. M. Habashy, “The use of vector transforms in solving some electromagnetic scattering problems,” IEEE Trans. An- tennas Propagat., vol. AP-34, p. 871, 1986.