United States Department of Agriculture Nondestructive Methods Forest Service Forest for Detecting Defects in Products Laboratory Research Softwood Logs Paper FPL-RP-546 . . Kristin C. Schad Daniel L. Schmoldt Robert J. Ross
Transcript
United StatesDepartment ofAgriculture Nondestructive MethodsForest Service
Forest for Detecting Defects inProductsLaboratory
Research Softwood LogsPaperFPL-RP-546
. .
Kristin C. SchadDaniel L. SchmoldtRobert J. Ross
AbstractWood degradation and defects, such as voids and knots, affectthe quality and processing time of lumber. The ability todetect internal defects in the log can save mills time andprocessing costs. In this study, we investigated three nonde-structive evaluation techniques for detecting internal wooddefects. Sound wave transmission, x-ray computed tomogra-phy, and impulse radar were used to examine white spruceand balsam fir logs. Computed tomography resulted in thehighest resolution for voids, knots, and high moisture con-tent areas, but at a very high price. Both sound wave trans-mission and impulse radar were able to detect large voids andareas of degradation, and these techniques showed some sensi-tivity to very knotty logs. None of the methods was able todetect small pockets of decay. The use of radar requires anexperienced operator because of the difficulty of interpretingthe data.
Schad, Kristin C.; Schmoldt, Daniel L.; Ross, Robert J. 1996.Nondestructive methods for detecting defects in softwood logs.Res. Pap. FPL–RP–546. Madison, WI: U.S. Department of Agriculture,Forest Service, Forest Products Laboratory. 13 p.
A limited number of free copies of this publication are available to thepublic from the Forest Products Laboratory, One Gifford Pinchot Drive,Madison, WI 53705–2398. Laboratory publications are sent to more than1,000 libraries in the United States and elsewhere.
The Forest Products Laboratory is maintained in cooperation with theUniversity of Wisconsin.
The United States Department of Agriculture (USDA) prohibits discrimi-nation in its programs on the basis of race, color, national origin, sex,religion, age, disability, political beliefs, and marital or familial status.Persons with disabilities who require alternative means of communicationof program information (braille, large print, audiotape, etc.) should contactthe USDA Office of Communications at (202) 720–2791. To file a com-plaint, write the Secretary of Agriculture, U.S. Department of Agriculture,Washington, DC 20250, or call (202) 720–7327 (voice), or (202) 720–1127(TTD). USDA is an equal employment opportunity employer.
The use of trade or firm names in this publication is for reader informationand does not imply endorsement by the U.S. Department of Agriculture ofany product or service.
IntroductionSoftwood can be degraded by fungi or other organisms at anytime—either while the tree is growing or after it has beenfelled, sawn into logs, and stored. Some degradation makeswhole logs or portions of logs undesirable for lumber.Knowing the sites of degradation in a log, as well as the sitesof defects such as knots and voids, can improve the process-ing of logs into lumber. For example, unsound sections of alog can be consolidated as logs are bucked in the woodlot orin the log yard. In addition, a better opening face can beselected during sawing, thus improving yield. However,current visual methods of assessing logs cannot detectinternal defects.
Researchers have proposed a number of techniques for detect-ing internal defects in logs. These include x-ray computedtomography (CT) (Benson–Cooper and others 1982), nuclearmagnetic resonance (Chang and others 1987), microwaves(Birkeland and Holoyen 1987), and ultrasonic CT (Han andBirkeland 1992). Other researchers have used sound wavetransmission (Lee 1965) and impulse radar to test large,wooden components of structures in situ. Each of thesemethods is able to detect certain internal features, but theyexact a price in terms of time and expense. Not all of thesetradeoffs are well defined. Nevertheless, as processing wastebecomes an increased liability in mill operations, internal logscanning will become more common. Therefore, it is neces-sary to improve our understanding of different flaw detectionmethods for logs and to identify their advantages and disad-vantages.
Nondestructive evaluation (NDE) methods, by definition, donot change the end-use capabilities of materials that aretested. In this study, we compared three NDE methods: soundwave transmission, x-ray CT, and impulse radar. In soundwave transmission, the transmission time of a sound wave ismeasured as it travels through a specimen. This technique
has been used in a variety of wood evaluation applications,including veneer grading (Sharp 1985), wetwood detection(Ross and others 1992, Verkasalo and others 1993), andevaluation of wooden members in structures (Hoyle andPellerin 1978). Computer tomography generates a cross-sectional density map of a specimen by passing x-raysthrough a plane of the material. The attenuation of x-rays islinearly related to material density. This technique has beenused extensively in the medical field and, more recently, inmany industrial areas. It has also been shown to be useful forevaluating logs (Benson–Cooper and others 1982, Funt andBryant 1987, Wagner and others 1989). Impulse radar (alsocalled ground-penetrating radar) sends radio wave pulsesthrough a material and captures the signal as it echoes backto the transmitter. This method has been widely used forgeotechnical investigations (Stanfill and McMillan 1985).Although sound wave transmission and impulse radar NDEmethods have not been previously used for logs, their appli-cation to large wooden components of structures, such asbuildings, bridges, and utility poles, indicates that theymight be successfully used to examine logs.
In this paper we briefly describe sound wave transmission,x-ray CT, and impulse radar and report the results of testsusing these NDE methods.
Description of NDE MethodsAll NDE methods use some form of energy propagationthrough or around a material to infer some important charac-teristics about the specimen being examined. This energymay result from static or dynamic loading or may be gener-ated by electromagnetic or elastic waves. Characteristicsfrequently of interest are the external geometry or orientationof the specimen; its global integrity, such as strength; andlocal features, such as the location and size of surface or in-ternal defects.
Kristin C. Schad, General EngineerDaniel L. Schmoldt, Research Forest Products TechnologistRobert J. Ross, Supervisory General EngineerForest Products Laboratory, Madison, Wisconsin
2
Sound Wave TransmissionSound waves can be generated within a material in one ofseveral ways. First, sound can be generated by the materialitself as a result of the sudden movement of stressed portions.Sounds are emitted and propagation is related to the dynamiceffects of any defects within the material. In a technique re-ferred to as acoustic emission inspection, a piezoelectric sen-sor is used to detect the sound. Second, sound can be gener-ated externally by a contacting piezoelectric transducer. Soundwaves generated in this manner are received by a secondtransducer (pitch–catch or through-transmission) or are re-flected to the generating transducer (pulse–echo). These wavesare often above the audible frequency range, and hence, thisinspection method is referred to as acousto-ultrasonic testingor ultrasonic testing. Third, sound waves can be produced byimpacting the material with an instrument, such as a ham-mer, which generates an elastic wave within the specimen.The frequency of this wave may or may not be ultrasonic.A timer connected to the point of impact and some otherlocation on the surface of the specimen can be used to meas-ure the transmission time of the sound wave and hence itsvelocity. This method is referred to as sound wave transmis-sion, and it is the method used in our study.
Computed Tomography
High-energy electromagnetic radiation, in the form of x-raysor gamma rays, can be used to generate highly detailed im-ages of materials. X-ray (or gamma ray) scanning indirectlymeasures the density of a material through the attenuation ofthe rays as they pass through a specimen. As photons areabsorbed and scattered by incident matter in a specimen, theintensity of the measured x-rays is reduced. The greater themass of the specimen within a volume (that is, the greaterthe density), the greater the attenuation of the x-rays or lossof x-ray energy.
Tomographic x-ray scans of logs are produced by sending x-rays through the two smallest dimensions of the specimen.Because the attenuation of each ray is the cumulative effectof all the small volumes in its path, the contribution of eachvolume cannot be determined from a single ray. Therefore,many individual rays are sent through each small volume inthe material. The attenuation resulting from each volume canthen be computed from all the x-rays passing through it.Since the resulting tomograph, or image, must be computed,the technique is called computed tomography (CT). Thisprocedure generates a two-dimensional scan plane image orcross section. Successive scan planes are generated along thelongest dimension to produce a detailed scan of the entirespecimen.
Impulse RadarRadar waves reside in the microwave portion of the electro-magnetic spectrum. Because of their long wavelengths, theyare able to penetrate deeply into materials. Radar waves re-flect from any boundaries contained in the material. Becauseclear wood provides relatively insignificant boundaries,abrupt changes caused by defect interfaces with clear woodgenerate more noticeable reflections. The relative time delaysbetween the reflections from such interfaces can create a mapof where discontinuities exist in the material.
An early NDE application of radar was the location of subter-ranean objects, such as buried drums. Extensive use in thisarea led to the term “ground-penetrating radar.” A later NDEapplication of impulse radar has been the inspection of struc-tures in situ. An antenna can be passed along a specimen togenerate a specimen length–depth map of internal reflections.This map can be interpreted to indicate the sites of variousinterfaces and the types of internal objects represented by thereflections.
Study Materials and MethodsMaterialsFive logs, three balsam fir (Abies balsamea, L.) and twowhite spruce (Picea glauca, Moench), were shipped from thePukall Lumber Company in Woodruff, Wisconsin, to theForest Products Laboratory in Madison, Wisconsin, for test-ing. The logs varied in length and diameter (Table 1). Log 1had a large hole in the butt end (Fig. 1), and log 3 had a fewsmall voids on one end. These were the only visible signs ofdegradation on any logs.
The five sample logs were harvested in winter. They werestored outside in much the same way as they would be storedat a sawmill. Sound wave measurements were taken in Juneand July 1993, the logs were scanned by CT in February1994, and impulse radar was performed in June 1994.
Table 1. Description of study logs
Log Length Diameter (in. (mm))
Species no. (in. (mm)) Butt end Small end
Balsam fir 1 101 (2,565) 14 (357) 12 (305)
2 124 (3,150) 12 (305) 11 (279)
3 198 (5,029) 15 (381) 12 (305)
White spruce 4 200 (5,080) 15 (381) 12 (305)
5 195 (4,953) 15 (381) 13 (330)
3
During this time span, some drying of the logs occurred.However, because all three techniques have been shown to beeffective for dry and wet material, the only effects introducedby this time delay were additional cracking of the logs andpossibly more advanced decay.
Sound Wave TransmissionThe first test was sound wave through-transmission (Figs. 2and 3). The logs were supported off the ground by two saw-horses. Six-inch (152-mm) spikes were driven into the logfor approximately 1 in. (25.4 mm) to mark the start and stoplocations for measurements of sound wave transmission timethrough the diameter. Care was taken to locate the spikes
away from obvious defects. An accelerometer was attached toeach spike and then connected to a Metriguard StresswaveTimer (Model 239A). A sound wave was sent through thewood to the receptor spike via a hammer tap on the end ofthe impact spike. The timer displayed the travel time of thesound wave between accelerometers. The impact spike wasthen moved 6 in. (152 mm) and sound transmission timewas measured again; this process was repeated to the end ofthe log. A log-length set of times was taken in three loca-tions on each log, approximately 120° apart (Fig. 4).
Computed TomographyLogs were scanned via an arrangement with the AdvancedComputed-Tomography Inspection System located at theNASA Marshall Space Flight Center in Huntsville, Ala-bama. The industrial-scale CT unit consists of a scanningtable that rotates and that also translates in two dimensions,vertical and front to back. Therefore, to obtain log cross-sections, it was necessary to stand the logs on end. To facili-
Figure 1—Decay and loss of wood material onbutt end of log 1. (M93 30157-4)
Stresswave
received
Impactapplied➞➞➞➞
Figure 2—Schematic depiction of sound wavetransmission test.
Figure 3—Positioning of log for sound wave trans-mission test. Each log was supported by sawhorses.Figure shows placement of impact and receptor spikes,attachment of accelerometers, and connection to timer.(M93 0157-12)
4
tate this process, the logs were cut into sections 4 to 5 ft(1.2 to 1.5 m) in length, with one end flat enough so that thelog could stand on end with little vibration when rotated. Forlogs 2 to 5, scans were taken every 6 in. (152 mm) to coin-cide with the sound wave measurements taken previously(Fig. 5). Because the sound wave transmission measurementsobtained for log 1 were highly erratic, this log was scannedevery 3 in. (76 mm).
Each CT image slice is 0.12 in. (3 mm) thick. Images have apixel size of 1024 by 1024, where each pixel represents0.016 in. (0.415 mm). Each pixel is represented by a 16-bitnumber and therefore requires 2 MB of storage. Image fileswere transferred electronically over the Internet to VirginiaTech University.
One limitation of this study and its results with regard to CTscanning is that the scanner was calibrated for industrialapplications. That is, the materials commonly scanned withthis unit are large specimens of very dense metals, such asrocket engines and entire automobiles. Consequently, the CTunit was calibrated to give CT number values for materialsmuch denser than wood. Whereas a typical range of CT num-bers for any scanned material (including wood) would be0 to 2047, without recalibration the CT numbers for thewood samples in our study typically ranged from 0 to 65.Therefore, although the spatial resolution in this study washigh (0.016 in. [0.415 mm] per pixel), the density resolutionwas very low (approximately 66 density levels). This meansthat our ability to distinguish different density areas in logswas severely limited—by a factor of 30 (2048 divided by66)—compared to the differences in density that can typicallybe obtained by CT imaging.
Impulse RadarThe impulse radar test was performed at the Forest ProductsLaboratory by the staff of Detection Sciences, Inc., of Car-lisle, Massachusetts. A 1.2-GHz radar antenna was run alongthe length of the log. A hand-held switch was used to elec-tronically mark the log position of the antenna on thegraphic chart recorder, which produced a printed scan of thedata.
This continuous scanning method was performed longitudi-nally for each log section, coincident with the path of thesound wave measurements and perpendicular to the CT scans(Fig. 6). The process yielded a total of three graphic chartsper log section.
Based on prior experience, the testing staff knew that impulseradar detects the nonuniformity of material on the basis ofsignal velocity. Much nonuniformity along the length of alog results from the presence of knots. Therefore, the testingstaff first created a simulated log scan by holding the antennastationary and recording a radar chart. This chart served as areference for the comparison of other scans.
Destructive VerificationAfter the NDE tests were completed, the logs were sawnevery 6 in. (152 mm) to coincide with the locations of thesound wave and CT tests. Soon after sawing, log cross-sections were photographed to provide a basis for comparisonto the NDE results.
Stress wave paths
6 in.
3 ft
1 ft
2 ft
3 ft
2 ft
1 ft
Figure 4—Scan lines for sound wave transmission test.Longitudinal scan lines were spaced 120º apart. Meas-urements were taken at 6-in. (152-mm) intervals alongscan lines.
6 in.
Figure 5—Location of CT scans.
5
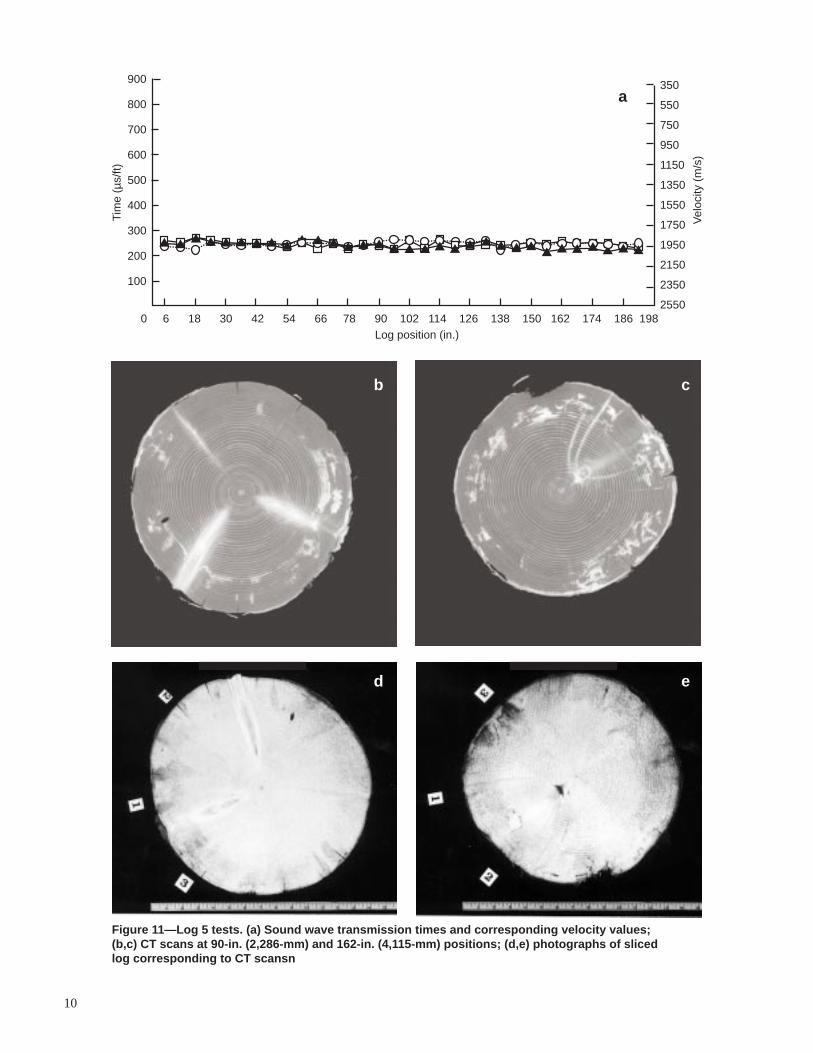
Results and DiscussionFigures 7 to 11 show the results of NDE and destructive testson the five sample logs. Each figure shows (a) sound wavetransmission time per unit distance for three scan lines for alllog scan positions, (b) representative CT scans, showinghigh density (light shading) and low density (dark shading)areas, and (c) representative photographs of sawn logs. In thephotographs of sawn logs, the numbers indicate approximatelocations of sound wave tests.
Sound Wave TransmissionSound wave transmission time (or velocity) appeared to dis-tinguish between areas of high degradation and sound woodand to locate large voids. Defects were indicated by longertransmission times (lower velocity). Sound wave transmis-sion did not appear sensitive to less extensive voids or pock-ets of decay, as evident by comparing the transmission timeat the 36-in. (914-mm) position with its corresponding CTimage (Fig. 7).
Transmission times were also somewhat sensitive tovery knotty areas of logs, as shown by highly varyingtransmission times (Fig. 8a) for the knotty areas at the30- in. (762-mm) and 72-in. (1,829-mm) positions (Fig. 8b).
In other instances, this relationship was not as clear cut. Forexample, at the 18-in. (457-mm) position, the knots nearlylie in a single plane in contrast to the almost total absence ofknots at the 102-in. (2,591-mm) position. For these log po-sitions, there did not seem to be any noticeable difference intransmission times, although the two positions varied greatlyin the number of defects. Although large voids, severely de-graded material, and extremely knotty areas increase soundtransmission time, it can be difficult to identify the type ofdefect or to determine if multiple defects are present. How-ever, a pattern is sometimes formed, as in the butt end oflog 1 (Fig. 7a), which enables the operator to make an edu-cated guess that this is highly degraded material or a void.
To obtain transmission time, the bark on the log must bepenetrated or removed. Once this is accomplished, the tech-nique can be performed quickly and requires little training.The equipment is relatively inexpensive.
Computed TomographyThe CT scanner used in this study was able to locate knots,large and small voids, and areas of high moisture content.(Note the caveat of scanner calibration and density resolutionmentioned previously.) Voids were displayed as dark areas(similar to background) on the CT images, corresponding tothe density of air (Fig. 7b). Areas of high density such asknots, including high moisture content areas, were displayedby very light shading on the CT images (Fig. 9b). One prob-lem in interpreting these CT images was that knots are alsohigher in density than the surrounding wood, as are areaswith high moisture content. Therefore, it is sometimes diffi-cult to determine where an area of high moisture contentstops and a knot begins (Fig. 9b). Birkeland and Holoyen(1987) noted the same problem with high moisture areaswhen scanning Norway spruce (Picea abies, L.), as did Somand others (1992) and Taylor and others (1984). With CTimages of higher density resolution, it is possible that knotsand high moisture content areas would have different CTnumbers and, consequently, would appear differently in theimages. If a log does not have large areas of high moisturecontent, a CT scan will locate knots with extreme accuracy,as shown in Figure 10b.
As examined in this study, CT scanning has several draw-backs. First, obtaining enough scans to produce a representa-tive set of images for a log can be time-consuming. How-ever, a scanner that is optimized for this type of scanningcould generate images very quickly and therefore greatlymitigate this problem. Second, highly skilled personnel arerequired to maintain and operate CT equipment. Finally, thecost of a CT scanner is approximately two orders of magni-tude greater than that of sound wave transmission equipment.These limitations indicate that the information gained fromthe use of CT must be carefully weighed against the highcost of this technology.
Figure 7—Log 1 tests. (a) Sound wave transmission times and corresponding velocity values;(b,c) CT scans at 6-in. (152-mm) and 36-in. (914-mm) positions; (d,e) photographs of sliced logcorresponding to CT scans. 1 in. = 25.4 mm; 1 ft = 0.3048 m.
Figure 8—Log 2 tests. (a) Sound wave transmission times and corresponding velocity values;(b,c) CT scans at 30-in. (762-mm) and 72-in. (1,829-mm) positions; (d,e) photographs of slicedlog corresponding to CT scans.
Figure 9—Log 3 tests. (a) Sound wave transmission times and corresponding velocity values;(b,c) CT scans at 6-in. (152-mm) and 36-in. (914-mm) positions; (d,e) photographs of sliced logcorresponding to CT scans.
Figure 10—Log 4 tests. (a) Sound wave transmission times and corresponding velocity values;(b,c) CT scans at 48-in. (1,219-mm) and 120-in. (3,048-mm) positions; (d,e) photographs of slicedlog corresponding to CT scans.
Figure 11—Log 5 tests. (a) Sound wave transmission times and corresponding velocity values;(b,c) CT scans at 90-in. (2,286-mm) and 162-in. (4,115-mm) positions; (d,e) photographs of slicedlog corresponding to CT scansn
a
b c
d e
10
11
Impulse RadarOperators of the impulse radar equipment were able to distin-guish between basically sound wood and wood with majordefects or voids (Detection Sciences, Inc. 1994). When a se-verely degraded log was tested, the chart was wavy, with de-pressed or elevated reflection signals (Fig. 12a). On the otherhand, the chart from the test of a relatively sound log wasrelatively smooth (Fig. 12b). Impulse radar was not able tolocate small voids or pockets of decay or to distinguish be-tween different types of internal degradation. Using the simu-lated radar chart as a reference, the investigators were able torank the log sections subjectively on the basis of uniformityof radar charts (Table 2).
The labeling of signal reflections as “wavy” or “depressed”can be quite subjective. Therefore, the impulse radar methodprovides only a rough indication of where defects may befound. All radar transmission planes typically pass throughthe log pith, which is generally degraded material and regis-ters as a defect. Therefore, interpretation of a impulse radarchart needs to account for this omnipresent degradation.
An operator can perform impulse radar without touching thewood; only moderate skill is required to conduct testing at afairly quick pace. The price of the equipment is also moder-ate, about twice as much as that of sound wave transmissionequipment.
Destructive VerificationFigure 13 shows degradation in a small block of wood re-moved from the 6-in. (152-mm) position in log 4. Fungalinfection, bacterial growth, and pit degradation in this areawere severe. Other samples tested from areas similar inappearance to that marked on Figure 13 showed no degrada-tion. Therefore, at the high spatial and low density resolutionused in this study, CT imaging could not reliably detect thistype of decay. Likewise, sound wave transmission and im-pulse radar were not sensitive to small areas of degradation.
ConclusionsThe results of our study led to the following conclusions:
• Sound wave transmission, x-ray computed tomography(CT), and impulse radar can be used to detect large areas ofinternal degradation and large voids in logs.
• None of the nondestructive evaluation methods testedcan locate small pockets of decay. Computed tomographyis able to detect small areas of void and advanced degrada-tion. However, in our study, failure to recalibrate the CTscanner for wood material, which reduced our ability todistinguish density differences, could have been partiallyresponsible for the insensitivity of CT in our tests.
• All three techniques can detect the presence of knots invery knotty wood. CT can also precisely locate regions ofhigh moisture content and other high density areas.
• The use of impulse radar may be limited by the difficultyof interpreting the data. Although the scientist from De-tection Sciences, Inc. was able to use the data to distin-guish between basically sound wood and wood with majordefects or voids, none of the current investigators was ableto do so. The pulse-echo charts do not generate a repeat-able numerical value (as does sound wave transmission),nor do they provide a detailed or easily interpretable image(as does CT). Consequently, we have considerable doubtconcerning the use of impulse radar for the nondestructiveevaluation of logs.
• Impulse radar equipment is about twice as expensive asequipment used for sound wave transmission, and CTequipment can be at least 100 times as costly. The highcost of CT equipment and operation demands carefulexamination of its potential benefits for the operation of aparticular mill.
Table 2—Ranking of log sections onbasis of uniformity of radar chart
Log sectiona Rankb
4–2 1
4–1 2
4–3 3
4–4 4
3–3 5
3–4 6
1–2 7
5–1 8
5–4 9
5–2 10
5–3 11
3–2 12
3–1 13
2–2 14
2–1 15
aSection 1–1 not included because of degradation level.bLow values indicate greater uniformity; that is, relative freedom from large knots. Conversely, high values indicate presence of many large knots.
12
a b
Figure 12—Pattern of impulse charts depended on the amount of wood degradation. (a) Impulse chartfrom severely degraded log, showing depressed or elevated reflection signals; (b) impulse chart fromrelatively sound log.
a b
Figure 13—Extensive degradation at 6-in. (152-mm) position of log 4. (a) CT image; (b) micrograph of woodremoved from log at places indicated in CT image (750x). Removed wood was approximately 0.005 by0.006 in. (0.13 by 0.15 mm).
13
Future Research NeedsWe recommend further experiments to refine the testing tech-niques used with sound wave transmission on large members.These could include an investigation of the size and extent ofdefects that are discernible by sound wave transmission time.Alternative arrangements for sound wave transmission testscould also be tried, such as the use of a fixed impact spikewith a movable receptor spike. Future studies might alsofocus on relating aspects of sound wave transmission to thequantity and quality of lumber recovered, as an alternative tovisual log grading.
Whereas CT scanning can provide a great deal of informationabout the internal features of a log, there has not been a con-certed effort to merge the latest CT hardware with imageprocessing and log processing software. Advancements inthese areas should be monitored in hopes of obtaining rapidscans at a much lower cost and being able to automaticallyapply that information to estimating lumber yield or opti-mizing log breakdown at the headrig.
A full-scale study of logs should be performed using a sys-tematic approach to determine the type of degradation presentand the extent to which different NDE methods respond toindividual types of degradation. However, based on our expe-riences with impulse radar in this study, we cannot recom-mend that this technique be included in further investigationson NDE methods for evaluating logs.
ReferencesBenson–Cooper, D.M.; Knowles, R.L.; Thompson, F.J.;Cown, D.J. 1982. Computed tomograpic scanning for thedetection of defects within logs. Bull. 8. Forest ResearchInstitute, New Zealand Forest Service, Rotorua, New Zea-land. 9 p.
Birkeland, R.; Holoyen, S. 1987. Industrial methods forinternal scanning of log defects: A progress report on an on-going project in Norway. In: Szymani, R., ed. Proceedings,2d international conference on scanning technology in saw-milling; 1987 October 1–2; Oakland/Berkeley Hills CA.San Francisco, CA: Forest Industries/World Wood.
Chang, S.J.; Wang, P.C.; Olson, J.R. 1987. Nuclearmagnetic resonance imaging of hardwood logs. In: Szymani,R., ed. Proceedings, 2d international conference on scanningtechnology in sawmilling; 1987, October 1–2; Oak-land/Berkeley Hills, CA. San Francisco, CA: Forest Indus-tries/World Wood. 8 p.
Detection Sciences, Inc. 1994. Inspection of wood withimpulse radar. Final Rep. Research Joint Venture AgreementFPL–94–2326. Madison, WI: U.S. Department of Agricul-ture, Forest Service, Forest Products Laboratory. 26 p.
Funt, B.V.; Bryant, E.C. 1987. Detection of internal logdefects by automatic interpretation of computer tomographyimages. Forest Products Journal. 37(1): 56–62.
Han, W.; Birkeland, R. 1992. Ultrasonic scanning of logs.Industrial Metrology. 2(3/4): 253–282.
Hoyle, R.J.; Pellerin, R.F. 1978. Stress wave inspection ofa wood structure. In: Pellerin, R.F.; Galligan, W.L., eds.Proceedings, 4th nondestructive testing of wood symposium;1978 August 28–30; Vancouver, WA. Pullman, WA: Engi-neering Extension Service, Washington State University:33–45.
Lee, I.D.G. 1965. Ultrasonic pulse velocity testing consid-ered as a safety measure for timber structures. In: Galligan,W.L., ed. Proceedings , 2d nondestructive testing of woodsymposium; 1965 April; Spokane, WA. Pullman, WA: Col-lege of Engineering Research Division, Washington StateUniversity: 185–203
Ross, R.J.; Ward, J.C.; TenWolde, A. 1992. Identifyingbacterially infected oak by stress wave nondestructive evalua-tion. Res. Pap. FPL–RP–512. Madison WI: U.S. Depart-ment of Agriculture, Forest Service, Forest Products Labora-tory. 6 p.
Sharp, D.J. 1985. Nondestructive testing techniques formanufacturing LVL and predicting performance. In: Pellerin,R.F.; McDonald, K.A., eds. Proceedings, 5th nondestructivetesting of wood symposium; 1985 September 9–11; Pull-man, WA. Pullman, WA: Conferences and Institutes, Wash-ington State University: 99–108.
Som, S.; Wells, P.; Davis, J. 1992. Automated feature ex-traction of wood from tomographic images. In: Proceedings,2d international conference on automation, robotics and com-puter vision; 1992 September 15–18, Singapore: 5 p.
Stanfill III, D.F.; McMillan, K.S. 1985. Radar mappingof gasoline and other hydrocarbons in the ground. In: Pro-ceedings, 6th national conference on management of uncon-trolled hazardous waste sites; 1985 November; Cincinnati,OH. Washington, DC: Hazardous Materials Control ResearchInstitute: 269–274.
Verkasalo, E.; Ross, R.J; TenWolde, A.; Youngs, R.L.1993. Properties related to drying defects in red oak wetwood.Res. Pap. FPL–RP–516. Madison, WI: U.S. Department ofAgriculture, Forest Service, Forest Products Laboratory.10 p.
Wagner, F.G.; Taylor, F.W.; Steele, P.H.; Harless,T.E.G. 1989. Benefit of internal log scanning. In: Szymani,R., ed. Proceedings, 3d international conference on scanningtechnology in sawmilling; 1989, October 5–6; San FranciscoCA. San Francisco, CA: Forest Industries/World Wood: 7 p.


![Examination Of The Nondestructive Evaluation Of Composite ... of... · only of detecting damage that exceeds 20% of full strength [1]. A reliable method or methods of nondestructive](https://static.documents.pub/doc/80x56/5e1e7b544bf03f2d9013eddd/examination-of-the-nondestructive-evaluation-of-composite-of-only-of-detecting.jpg)


