Nondilute diffusion from first principles: Li diffusion in LixTiS2
Anton Van der Ven, John C. Thomas, and Qingchuan XuDepartment of Materials Science and Engineering, The University of Michigan, Ann Arbor, Michigan 48109, USA
Benjamin Swoboda and Dane MorganDepartment of Materials Science and Engineering, The University of Wisconsin Madison, Madison, Wisconsin 53706, USA
�Received 18 June 2008; revised manuscript received 27 August 2008; published 26 September 2008�
We investigate Li diffusion in the favorable intercalation compound LixTiS2 as a function of Li concentra-tion, x, from first principles. We find that Li ions hop between neighboring octahedral interstitial sites of theTiS2 host by passing through an adjacent tetrahedral site. The migration barriers for these hops are significantlyreduced when the end points belong to a divacancy. We use a cluster expansion within kinetic Monte Carlosimulations to describe the configuration dependence of the migration barriers and predict a diffusion coeffi-cient that varies by several orders of magnitude with Li concentration, exhibiting a maximum close to x=0.5. The kinetic Monte Carlo simulations predict that diffusion is mediated predominantly by divacancies. Wealso find that the migration barriers depend strongly on the c-lattice parameter, which decreases as Li ions areremoved from LixTiS2.
Intercalation compounds form a remarkable class of ma-terials that are capable of reversibly absorbing large quanti-ties of guest atoms at room temperature without undergoingmajor structural modification. While graphite is probably themost familiar intercalation compound, other examples in-clude oxides �LixCoO2, NaxCoO2, LixFePO4, and Ni�OH�2�,sulfides �LixTiS2, AgxTiS2, and LixTaS2�, polymers, and or-ganic molecular crystals.1–4 A common feature among allintercalation compounds is their open and flexible crystalstructure, which acts as host for intercalating guest ions ormolecules.5,6 Depending on the chemistry and structure ofthe host, guest species can range from alkali metals, to ha-lides, to hydrogen, and even include molecules such as H2O,OH−, and CO3
2−.6,7 The electronic structure of the host ismodified upon intercalation of a guest with the same inter-calation compound often exhibiting a variety of electronic,magnetic, and optical properties as the concentration ischanged. NaxCoO2, for example, possesses favorable ther-moelectric properties8 and becomes superconducting at lowtemperature upon removal of 66% Na and simultaneous in-tercalation of water molecules.9
Guest species can be intercalated electrochemically, en-abling precise control over concentration. As a result, severalintercalation compounds have proven to be superb electrodesin primary and secondary batteries.1,3,4 The anode of a Libattery is often graphite, which intercalates Li between itstwo-dimensional graphitic sheets, while the cathode is typi-cally a transition-metal oxide such as LixCoO2 or LixFePO4,in which Li occupies interstitial sites of the oxygen or phos-phate framework.1–5 The ability to electrochemically tuneelectronic, magnetic, and optical properties of intercalationcompounds also makes these materials attractive for manyother applications, including electrochromic displays.10
The kinetics of room-temperature intercalation processesplays a crucial role in determining the performance of a bat-tery or an electrochromic device. Increasing the composition
of guest ions within the intercalation compound, for ex-ample, requires diffusion of the guest species from the sur-face to the interior of the particle. Since the composition ofthe intercalating specie can vary from zero to complete fill-ing of available interstitial sites of the host, diffusion pre-dominantly occurs in nondilute regimes where short-rangeand long-range order among the intercalating species im-poses complex correlations between successive atomichops.11
The large variety of intercalation compound crystal struc-tures and chemistries leads to qualitative differences of dif-fusion mechanisms that remain poorly understood andlargely uncharacterized. Many important lithium intercala-tion compounds have a layered crystal structure in which Liintercalates between two-dimensional transition-metal oxideor transition-metal sulfide slabs.1,5 The layered intercalationcompounds exhibit several crystallographic variants differingin slab structure and in the manner in which the slabs arestacked.5 The local crystallographic environment available toguest ions affects the type of long-range and short-range or-der that prevails among guest ions at nondilute concentra-tions as well as atomic hop mechanisms and barriers.
In an effort to contribute to our understanding of the roleof stacking and anion chemistry on Li diffusion in layeredintercalation compounds, we investigate diffusion in LixTiS2from first principles. While LixTiS2 is no longer consideredan attractive cathode material for Li-ion batteries due to itslow voltage compared to that of transition-metal oxides suchas LixCoO2, LixNiO2, and LixCo0.33Ni0.33Mn0.33O2, it wasrecognized early on as having favorable intercalationkinetics.1,4 In part this can be attributed to the fact that Liremoval from LiTiS2 does not lead to structural modifica-tions of the host as what occurs, for example, in LixCoO2below x�0.3.12–15 Compared to the ionic bonding that char-acterizes transition-metal oxides, bonding within the sulfidestends to be more covalent;16,17 however, it is not clear howthese differences in bonding affect migration barriers for Litransport. Although the TiS2 slabs have the same structure asthe MO2 slabs of many Li transition-metal oxides, the higher
degree of covalency in LixTiS2 leads to a different stackingsequence of the slabs from that which typically prevails inthe more ionic transition-metal oxides. Variations in stackingsequence should also lead to difference in Li-transportmechanisms.
The goal of this work is to elucidate collective transport inconcentrated intercalation compounds from first principles.The approach uses atomic-scale energies from first principlesto parametrize an easily evaluated cluster expansion Hamil-tonian, which can then be used in thermodynamic �MonteCarlo �MC�� and kinetic �kinetic Monte Carlo� simulations todetermine diffusion constants. In Sec. II, we describe aKubo-Green formalism to calculate diffusion coefficients forinterstitial diffusion in the nondilute regime with kineticMonte Carlo simulations. These simulations require an accu-rate description of the dependence of the migration barriersfor Li diffusion on local Li concentration and degree of or-der. To this end, we introduce a mixed-basis cluster expan-sion to describe the configuration dependence of migrationbarriers in nondilute solids. In Sec. III, we apply this formal-ism to predict the finite-temperature thermodynamic proper-ties of LixTiS2 as well as its concentration dependent Li dif-fusion coefficients. The results are discussed and comparedwith current understanding of diffusion mechanisms inlithium transition-metal oxides in Sec. IV.
II. METHOD
At the macroscopic level, Li transport within intercalationcompounds can be described by Fick’s first law, which re-lates the Li flux to a gradient in Li concentration through aproportionality constant called the Li chemical diffusion co-efficient D. This chemical diffusion coefficient is a macro-scopic metric for the Li-ion mobility within the host crystalstructure and typically depends on the overall Li concentra-tion. The chemical diffusion coefficient can be factored as aproduct of a self-diffusion coefficient, DJ, and a thermody-namic factor, �, according to18
D = DJ� . �1�
The thermodynamic factor, �, serves as a measure for thedeviation of the Li chemical potential from thermodynamicideality. It emerges when deriving Fick’s first law from themore rigorous phenomenological flux expressions from irre-versible thermodynamics that relate the Li flux, not to a gra-dient in concentration but to a gradient in chemicalpotential.19 The thermodynamic factor for interstitial diffu-sion can be conveniently expressed as18
� =
�� �Li
kBT�
� ln x, �2�
where �Li corresponds to the Li chemical potential, kB toBoltzmann constant, T to the absolute temperature, and x tothe Li concentration �the fraction of interstitial Li sites withinthe host occupied by Li�.
The self-diffusion coefficient, DJ, contains all the kineticinformation about the diffusing Li ions but is also indirectly
affected by thermodynamic properties such as the equilib-rium degree of short-range and long-range order, as this caninfluence ionic mobility. Within the linear response theory ofthe statistical mechanics of kinetic processes occurring closeto equilibrium, we can relate kinetic rate coefficients such asDJ to fluctuations that occur at equilibrium. For interstitialdiffusion, the self-diffusion coefficient can be writtenas18,20–22
DJ =1
2dt
1
N�i=1
N
�Ri�t��2� , �3�
where t is the time, d is the dimension of the interstitiallattice �d=2 for two-dimensional diffusion as in LiTiS2�, N isthe number of Li ions within the crystal, and �Ri�t� are vec-tors that connect the end points of the trajectory of the ith Liion after time t. The brackets indicate an ensemble average.The self-diffusion coefficient is a metric of the square of thedisplacement of the center of mass of all diffusing Li ionsafter time t and therefore measures a collective mobility. Ifcross correlations between different diffusing Li ions are ne-glected when evaluating the square in Eq. �3�, we obtain anexpression for the tracer diffusion coefficient,18
D� =1
2dt
1
Ni=1
N
��Ri�t��2� , �4�
which measures the individual Li mobility.The various metrics of Li mobility can be calculated nu-
merically with kinetic Monte Carlo simulations,23,24 whichsample representative Li trajectories, provided an accuratedescription of individual stochastic hop events is available.The trajectories for each Li ion are a result of a sequence ofindividual atomic hops that occur with frequencies that canbe approximated with transition state theory by25
� = �� exp�− �E
kBT� , �5�
where �E is the activation barrier. The vibrational prefactor�� within the harmonic approximation can be written as
�� =
�i
3M
�i
�j
3M−1
� j�
. �6�
The �i are the 3M normal-mode vibrational frequencies ofthe solid when the migrating atom resides at the initial stateof the hop and the � j� are the 3M −1 nonimaginary normal-mode vibrational frequencies of the solid when the migratingatom resides at the saddle point of the hop corresponding tothe activated state �M is the total number of atoms in thesolid�. The activation barrier �E, as emerges in Vineyard’s25
derivation of Eq. �5�, is equal to the difference in energy ofthe fully relaxed activated state and the fully relaxed initialstate of the hop. Additional contributions to the activationfree energy, e.g., from anharmonic contributions and changes
VAN DER VEN et al. PHYSICAL REVIEW B 78, 104306 �2008�
104306-2
in electronic or magnetic states during the transition, are notincluded in the above expression.
In an intercalation compound, the thermodynamic factorand kinetic quantities such as �i, �i�, and �E depend on thespatial and temporal variations of the degree of configura-tional disorder within the solid �Li-vacancy disorder inLixTiS2�. This dependence on the local configuration needsto be accounted for in kinetic Monte Carlo simulations. It ishere that the cluster expansion formalism from alloytheory11,26–28 becomes invaluable as a tool to extrapolate ac-curate first-principles migration barriers calculated for a fewatomic arrangements to determine the migration barrier forany arrangement of atoms in a crystalline solid. The clusterexpansion makes it possible to rapidly obtain accurate envi-ronment dependent on-lattice energies and hopping barriersnecessary to determine transition rates. The speed of thecluster expansion energy calculations makes conventionaland kinetic Monte Carlo simulations practical. With a clusterexpansion, kinetic Monte Carlo is used to sample large num-bers of trajectories of interacting diffusing particles to enablethe evaluation of Kubo-Green expressions for the self-diffusion coefficients, Eq. �3�,11,28 while conventional MonteCarlo generates thermodynamic data to obtain the thermody-namic factor �Eq. �2��.11 The results of the Monte Carlosimulations can then be combined to give the complete dif-fusion coefficient according to Eq. �1�.
The cluster expansion formalism is a general tool to rep-resent the configuration dependence of a physical property ofa crystal such as the total energy.26,27 Here we introduce ageneralization of the usual approach by using two distinctbasis sets, which we will call a mixed-basis cluster expan-sion. The mixed-basis approach is used here to take advan-tage of dilute occupancy on one sublattice to simplify thecluster expansion. We will consider a binary alloy �Li andvacancies� only. Generalization to multicomponent systemsis formally straightforward �although often difficult in prac-tice due to an explosion of terms in the expansion�. Thecluster expansion basis for a lattice is obtained by taking thetensor products of a set of basis functions for each latticesite. We can distinguish between two common basis-functionsets to denote occupancy on a site: the spin basis and theoccupation basis. The spin basis for a particular site i has theform �1,�i�, where �i=1 if site i has a Li and �i=−1 if thesite is vacant, while the occupation basis has the form �1, pj�,where pj =1 if the site j has a Li and pj =0 if the site isvacant. A particular arrangement within the crystal is thenfully characterized by a vector of occupation variables��� , p��= ��1 , . . . ,�MS
, p1 , . . . , pMO�, where MS is the number
of sites characterized with a spin basis and MO is the numberof sites characterized with an occupation basis.
Different basis choices have different advantages. Thespin variables are useful for defining an orthonormal basis,which can aid in formal manipulation and may enhance thestability of fitting especially in nondilute regimes. However,the occupation basis has the advantage that the basis func-tions pj are strictly zero for vacancies, which allows simpli-fication for dilute Li concentrations through not writingterms that are zero �we will see this below�. The occupationbasis also has advantages when working with many speciesas discussed in Ref. 29.
Any property of a crystal that depends on configuration�e.g., fully relaxed total energy� can be expanded in terms ofpolynomials of the basis functions for each site. These poly-nomials, also referred to as cluster functions, consist of prod-ucts of basis functions for sites belonging to different clus-ters of sites within the crystal. A general cluster expansionusing two different basis sets can be written as
E��� ,p�� = ��Ls
J������ � + �Lo
J�p��
+ ��Ls,�Lo
J������ ��p�� , �7�
where Ls and Lo are the sublattices described with spin andoccupation bases, respectively, and � and are clusters ofsites �e.g., point, pair, triplet, etc., clusters� on Ls and Lo,respectively. The �� are cluster functions and are equal tothe product of spin basis functions on the sites of the cluster�. The are analogous cluster functions for the occupationbasis and are equal to products of the occupation basis clus-ter functions on the sites of . Explicitly, the cluster func-tions can be written as
�� = �i��
�i; = �j�
pj .
The sum over � in Eq. �7� is taken to include the emptycluster but this is not included in the sum over or thedouble sum over � and to avoid double counting. Thecoefficients of the cluster functions in Eq. �7� are called ef-fective cluster interactions �ECI�.
Equation �7� is general for a binary system using the twobasis sets on two different sublattices �e.g., octahedral sitesand tetrahedral sites for Li occupancy in LixTiS2�. We nowrestrict the application to cases where the sublattice de-scribed with the occupation basis has dilute Li concentra-tions. This will be the case for the tetrahedral sites in theLixTiS2 system. The use of the occupation basis allows asimple expression in the dilute limit if we assume that two Lion the occupation sublattice, Lo, never interact. Then thesecond term in Eq. �7� reduces to point contributions fromthe occupation lattice with all other terms automaticallyequal to zero since they contain a factor pi=0. This simpli-fication does not occur if the spin basis is used on the occu-pation lattice since no cluster function is zero for any occu-pation. We now use the simplification allowed by the diluteoccupation of the occupation lattice to rewrite Eq. �7� as
E��� ,p�� = ��Ls
J������ � + ��Ls,j�Lo
J�j����� �pj . �8�
We will use Eq. �8� to represent the energy of Li on theoctahedral �Ls� and tetrahedral �Lo� sublattices in LixTiS2.The result of Eq. �8� shows that this formalism is equivalentto the local cluster expansion introduced in Refs. 11, 30, and31, where the J�j have a local symmetry enforced by point j.The above derivation rigorously connects the local clusterexpansion introduced to describe activated states11 to a moregeneral formulation, showing that the local cluster expansionis equivalent to the full mixed-basis cluster expansion in thedilute limit on the occupation sublattice.
NONDILUTE DIFFUSION FROM FIRST PRINCIPLES: Li… PHYSICAL REVIEW B 78, 104306 �2008�
104306-3
III. RESULTS
The sulfur atoms of LiTiS2 form two-dimensional trian-gular lattices stacked in an ABAB sequence1,4 leading to ahexagonally close-packed anion sublattice. The Ti and Liions alternately fill octahedral sites between the close-packedsulfur planes. The crystal can be viewed as an array of TiS2slabs separated by layers of Li �see Fig. 1�a�� and is oftenreferred to as an O1 crystal structure using the nomenclatureintroduced by Delmas et al.5 Due to the ABAB stacking se-quence of the sulfur atoms, the Li ions occupy sites directlyabove and below the Ti ions. The Li-octahedral sites of theLi layer therefore share faces with the Ti-octahedral sites ofthe adjacent metal layers, a crystallographic feature that isabsent in the more ionic oxide intercalation compounds hav-ing the O3 crystal structure, which are characterized by anABCABC oxygen stacking sequence. This crystallographicdifference between O1 LiTiS2 and O3 layered transition-metal oxides leads to differences in Li transport characteris-tics between the two classes of materials.
A. Thermodynamics
The electrochemical removal of Li from LiTiS2 results inthe creation of Li vacancies between the TiS2 slabs introduc-ing configurational disorder. To describe the energy for arbi-trary arrangements of the Li ions between the TiS2 slabs, weconstructed a binary cluster expansion expressed in terms ofspin basis variables �i assigned to each octahedral site i thatis +1 if a Li resides there and −1 if the site is vacant. Notethat this corresponds to the spin basis portion of the clusterexpansion described in Sec. II. The tetrahedral site propertieswill be described with the occupation basis, discussed in Sec.III C below. To parametrize the expansion coefficients of the
cluster expansion, we fit to the energies of 195 different Li-vacancy configurations over the octahedral sites of LixTiS2,all calculated with local-density approximation �LDA� usingprojector augmented wave �PAW� pseudopotentials32,33 asimplemented in the VASP code.34,35 We used LDA as thisapproximation to density-functional theory �DFT� correctlypredicts the observed contraction of the c-lattice parameterof LixTiS2 when the Li concentration is reduced below x=0.5,36 while generalized gradient approximation �GGA� in-correctly predicts an expansion of the lattice parameter cwith decreasing Li concentration. Past studies on layeredtransition-metal oxides demonstrated the sensitivity of mi-gration barriers for Li diffusion to variations in the c-latticeparameter.11,37 The equilibrium c-lattice parameters predictedby LDA for LixTiS2 at various concentrations are consis-tently smaller than the experimental values. At x=1, for ex-ample, the predicted c-lattice parameter is 6.06 Å comparedto an experimental value of approximately 6.2 Å �2.2%�,while for x=0, the predicted c-lattice parameter is 5.48 Åcompared to an experimental value of approximately 5.7 Å�3.9%�.36 All calculations were performed nonmagneticallyas the inclusion of spin polarization had a negligible effecton the formation energies at different Li concentrations.
Figure 2 illustrates the calculated formation energies forthe different configurations used in the fit of the cluster ex-pansion where negative formation energies indicate a ten-dency for Li-vacancy ordering at intermediate Li concentra-tions. Below x=0.25, the most stable ordered phasescorrespond to staged configurations whereby Li ions segre-gate to alternating layers leaving the remaining layers empty.This is consistent with experimental observations of a non-uniform distribution of Li ions between alternating layers inLixTiS2 at low Li concentrations.36 In contrast to the stagingtransformations in LixC6 graphite38 and LixCoO2,13,14 thestaging in LixTiS2 is not accompanied by a shuffling of theTiS2 slabs across the empty Li layers.
We used a least-squares fit to determine numerical valuesfor the ECI of the cluster expansion and selected terms to beincluded in the expansion with a genetic algorithm that mini-mizes the cross-validation score of the fit.39,40 The resultingcluster expansion contains 25 ECI corresponding to theempty cluster, point cluster, 11 pair clusters, nine triplet clus-
TiS2
TiS2
Li OcTe
Oc
A
B
A
B
III
(a)
(b) (c)
FIG. 1. �Color online� �a� Crystal structure of LixTiS2 consistingof a periodic stacking of TiS2 slabs between which Li ions canintercalate. The sulfur ions �circles� form a hexagonal close-packedsublattice, while the Ti and Li ions occupy alternating layers ofoctahedrally coordinated interstitial sites. Li migration betweenneighboring octahedral sites passes through adjacent tetrahedralsites �redrawn from �Ref. 43��. �b� Li hop into an isolated vacancy�circles are Li, squares are vacancies, and triangles are tetrahedralsites within the Li layer�. �c� Li hop into a divacancy.
-0.08
-0.06
-0.04
-0.02
0
0 0.2 0.4 0.6 0.8 1
Formation
energy(eV)
Li concentration
FIG. 2. �Color online� Calculated formation energies of 195Li-vacancy configurations within the Li layers of LixTiS2. The for-mation energies were calculated with LDA using the PAW methodas implemented in VASP.
VAN DER VEN et al. PHYSICAL REVIEW B 78, 104306 �2008�
104306-4
ters, and three quadruplet clusters. The terms appearing inthe cluster expansion include not only interactions betweensites within the same Li layer but also between sites of ad-jacent Li layers. The root-mean-square error between the 195LDA-PAW energies and the cluster-expanded values is 4meV per LixTiS2 formula unit, while the cross-validationscore is 5 meV per LixTiS2.
The cluster expansion can be implemented in grand ca-nonical Monte Carlo simulations to calculate finite-temperature thermodynamic properties. Among them is theopen cell voltage, which is linearly related to the Li chemicalpotential within LixTiS2 according to the Nernst equation,
V�x� = − ��Li�x� − �Lireference�/e ,
where �Li�x� is the Li chemical potential in LixTiS2 as afunction of x �expressed in electron volt�, �Li
reference is the Lichemical potential in the reference anode �which we take tobe metallic Li and therefore constant�, and e is the charge ofan electron. Figure 3 illustrates calculated voltage curves forLixTiS2 at 300 and 450 K. The sloping voltage profile indi-cates solid solution behavior characterized by an absence ofany long-range order among Li ions and vacancies. The pla-teau between x=0.28 and 0.37 at 300 K corresponds to afirst-order phase transformation between a stage I form ofLixTiS2 above x=0.37 �i.e., Li uniformly distributed betweenall Li layers� to a stage II form of LixTiS2 below 0.28 �i.e., Lidistributed between alternating Li layers only�. Further Liremoval leads to a second-order phase transformation from
the stage II compound to a dilute form of LixTiS2 where Liions are again uniformly distributed among all intercalationlayers.
Monte Carlo simulations applied to the cluster expansionalso allow us to construct a phase diagram depicting phasestability as a function of Li concentration and temperature.Figure 4 illustrates the calculated phase diagram for LixTiS2between 200 and 600 K. For most temperatures and compo-sitions, LixTiS2 exists as a solid solution with respect to Liions and vacancies within the Li layers. Around x=0.25,however, the stage II form of LixTiS2 is predicted to be stablein which the Li ions segregate to alternating Li layers. Thestage II phase is stable upon heating up to 600 K and isseparated from stage I solid solutions by a second-order tran-sition line except at low temperature �below �380 K� wherea two-phase-coexistence region emerges. The two-phase-coexistence region was determined by comparing grand ca-nonical free energies of the stage II and stage I phases ob-tained with free-energy integration of the chemical potentialwith respect to the average number of Li. The second-ordertransition lines were determined by tracking the temperatureand compositions where an order parameter that character-izes the stage II phase becomes zero. Numerical inaccuraciesduring free-energy integration prevented a precise determi-nation of the two-phase-coexistence bounds around 380 Kwhere transition from stage II to stage I changes from firstorder to second order.
An important part of the chemical diffusion coefficient, D,according to Eq. �1�, is the thermodynamic factor �. Whilethe thermodynamic factor, given by Eq. �2�, can be calcu-lated by taking a numerical derivative of the Li chemicalpotential with respect to ln�x�, it can also be determined di-rectly in grand canonical Monte Carlo simulations by aver-aging over fluctuations in the number of Li ions at fixedchemical potential using18
� = N�
� N� − N�2�, �9�
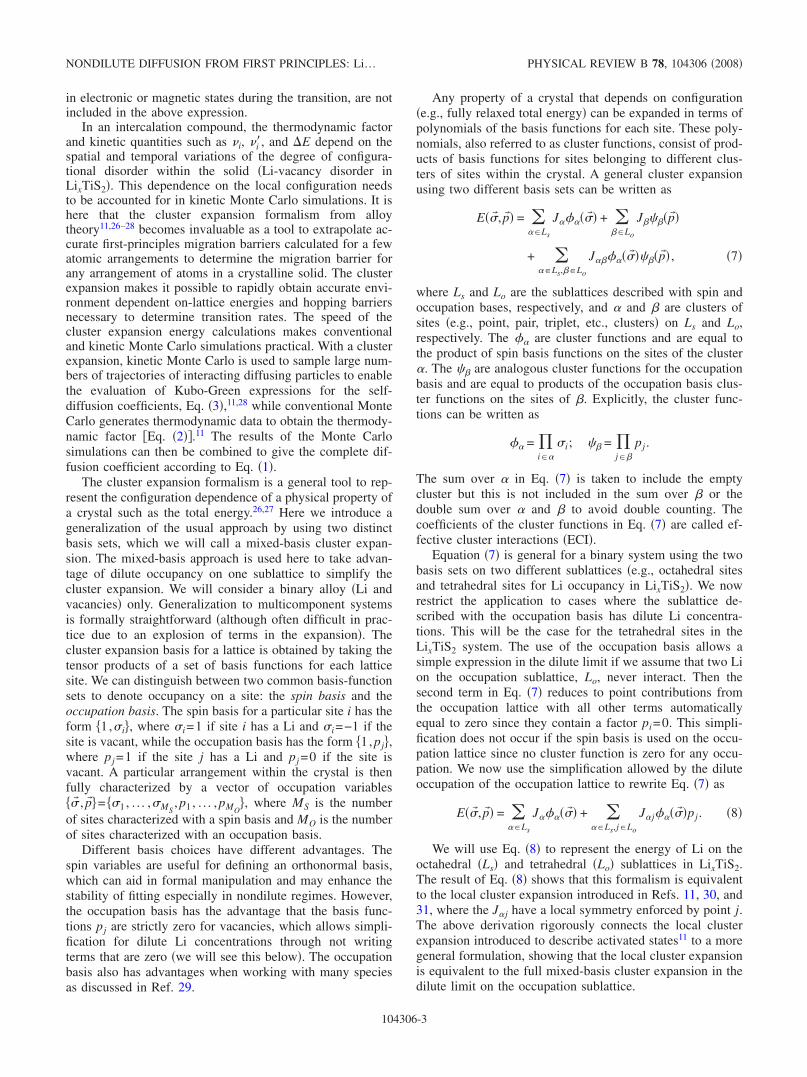
where N is the number of Li ions in a Monte Carlo cell andthe brackets correspond to ensemble averages at constanttemperature and Li chemical potential. Figure 5 illustratesthe calculated thermodynamic factor at 300 K as a functionof the Li concentration. The gap between 0.28 and 0.37 is thetwo-phase region where the thermodynamic factor is not de-
1.6
1.8
2
2.2
2.4
2.6
0 0.2 0.4 0.6 0.8 1
Voltage
Li concentration
(a)
1.6
1.8
2
2.2
2.4
2.6
Voltage
0 0.2 0.4 0.6 0.8 1Li concentration
(b)
FIG. 3. �Color online� Calculated voltage curves at �a� 300 Kand at �b� 450 K. The voltage curves were calculated with grandcanonical Monte Carlo simulations applied to a cluster expansionfor the configurational energy of Li-vacancy disorder over the oc-tahedral sites of LixTiS2.
Li concentration
Tem
per
atu
re(K
elvi
n)
Stage II
Stage Isolid solution
0 0.1 0.2 0.3 0.4200
300
400
500
600
0.5
FIG. 4. Calculated temperature composition phase diagram ofLixTiS2.
NONDILUTE DIFFUSION FROM FIRST PRINCIPLES: Li… PHYSICAL REVIEW B 78, 104306 �2008�
104306-5
fined �similar gaps appear in Figs. 8–10�. The thermody-namic factor can be viewed as a measure of the extent towhich the compound deviates from thermodynamic ideality.In the dilute limit where interactions among Li ions are neg-ligible, the thermodynamic factor is close to 1. As the Li ionsbegin to interact with each other with increasing concentra-tion, the thermodynamic factor deviates from 1. The dip inthe thermodynamic factor at x�0.07 is a result of thesecond-order phase transformation at which fluctuations inLi density become very large. As the concentration corre-sponding to the second-order transition is approached, it be-comes increasingly difficult to achieve a net Li flux by im-posing a gradient in concentration. This is known as criticalslowing down and is manifested in a decreasing thermody-namic factor.
The thermodynamic factor is larger than 1 at nondilute Liconcentrations and away from the second-order phase tran-sition. In LixTiS2, � ranges between 10 and 20 for most Liconcentrations diverging only as x approaches 1 where thedeviation from thermodynamic ideality is the largest as thenLixTiS2 effectively becomes a stoichiometric compound thatis very resistant to fluctuations in number of Li ions at fixedLi chemical potential �i.e., small denominator in Eq. �9��. Infact, the thermodynamic factor always peaks at stoichio-metric compositions where Li-vacancy ordering is thermody-namically stable,11,41 although in LixTiS2 ordering at stoichi-ometric compositions is absent above 300 K.
B. Hop mechanisms and migration barriers
Li diffusion in intercalation compounds occurs by a va-cancy mechanism, whereby individual Li ions hop intoneighboring vacant sites. Crystallographically, the least con-stricted pathway for Li migration between neighboring octa-hedral sites of layered transition-metal oxides and sulfideshaving the O3 and O1 crystal structure is through an adjacenttetrahedral site. This is schematically illustrated in Fig. 1�a�.The Li-octahedral sites form a two-dimensional triangularlattice with the tetrahedral sites occupying approximately thecenter of each triangle �Fig. 1�b��. Consistent with the crys-tallography of these compounds, first-principles investiga-tions of diffusion in LixCoO2 showed that favorable Li mi-gration paths pass through tetrahedral sites,11,42 while recentNMR measurements43 have provided strong evidence that
the same occurs in LixTiS2. There are differences relevant fordiffusion; however, between the O3 layered transition-metaloxides having an ABCABC oxygen stacking sequence andO1 LiTiS2 with its ABAB sulfur stacking sequence. In thelayered transition-metal oxides, the tetrahedral sites of the Lilayers share faces with octahedral transition-metal sites,while in LiTiS2 they do not. This leads to important differ-ences in the energy landscape along a hop between the twoclasses of intercalation compounds.
The migration barriers in the layered intercalation com-pounds are very sensitive to the Li concentration and ar-rangement in the vicinity of the hopping Li ion.11 A distinc-tion can be made between two different local environmentsdepending on the occupancy of neighboring octahedral sitessurrounding the tetrahedral site along the hop path �Figs.1�b� and 1�c��. In one local environment, the tetrahedral site,when occupied by the migrating Li ion, has a neighboring Liin an adjacent octahedral site �Fig. 1�b��. This local environ-ment will occur when a Li ion migrates to an isolated va-cancy surrounded by Li. A qualitatively different local envi-ronment exists when the migrating Li ion follows a paththrough a tetrahedral site that does not share a face withoccupied octahedral sites. This local environment occurswhen the end point of the hop belongs to a divacancy �Fig.1�c��.
We explored the energy landscape along migration pathsbetween neighboring octahedral Li sites in LixTiS2 with thenudged-elastic band method as implemented in VASP. Weused supercells containing 24 LixTiS2 units �2�3a�2�3a�2c supercell, where a and c are the primitive unit-cell lat-tice parameters� and performed calculations with a 3�3�3 k-point grid. All nudged-elastic band calculations wereperformed at constant volume �using the fully relaxed vol-ume and cell dimensions of the initial state of the hop�. Theimages for the nudged-elastic band calculations were inter-polated between Li occupancy in the initial octahedral siteand Li occupancy of the intermediate tetrahedral site. In allconfigurations considered, the tetrahedral sites were found tobe a low-energy stable intermediate state of a Li hop betweenneighboring octahedral sites.
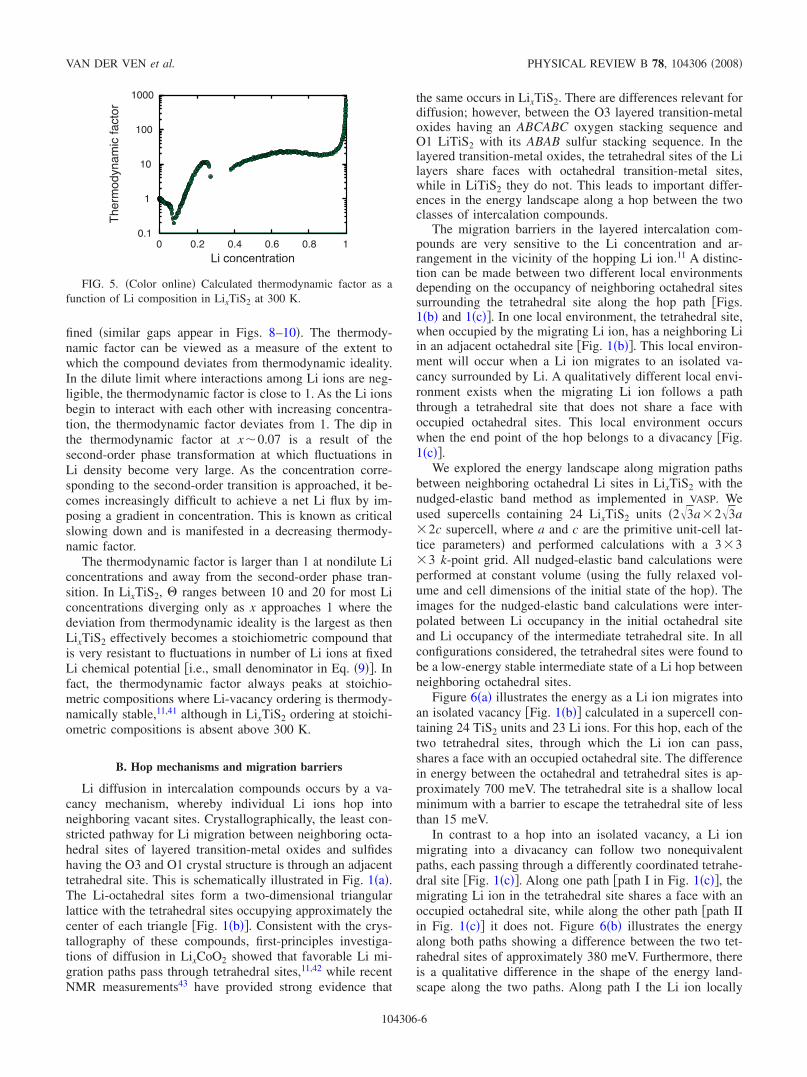
Figure 6�a� illustrates the energy as a Li ion migrates intoan isolated vacancy �Fig. 1�b�� calculated in a supercell con-taining 24 TiS2 units and 23 Li ions. For this hop, each of thetwo tetrahedral sites, through which the Li ion can pass,shares a face with an occupied octahedral site. The differencein energy between the octahedral and tetrahedral sites is ap-proximately 700 meV. The tetrahedral site is a shallow localminimum with a barrier to escape the tetrahedral site of lessthan 15 meV.
In contrast to a hop into an isolated vacancy, a Li ionmigrating into a divacancy can follow two nonequivalentpaths, each passing through a differently coordinated tetrahe-dral site �Fig. 1�c��. Along one path �path I in Fig. 1�c��, themigrating Li ion in the tetrahedral site shares a face with anoccupied octahedral site, while along the other path �path IIin Fig. 1�c�� it does not. Figure 6�b� illustrates the energyalong both paths showing a difference between the two tet-rahedral sites of approximately 380 meV. Furthermore, thereis a qualitative difference in the shape of the energy land-scape along the two paths. Along path I the Li ion locally
0.1
1
10
100
1000
0 0.2 0.4 0.6 0.8 1
Thermodynamicfactor
Li concentration
FIG. 5. �Color online� Calculated thermodynamic factor as afunction of Li composition in LixTiS2 at 300 K.
VAN DER VEN et al. PHYSICAL REVIEW B 78, 104306 �2008�
104306-6
samples an identical environment as a Li ion migrating intoan isolated vacancy �Fig. 1�b��. The energy along this path isalso very similar to that of a hop into an isolated vacancy�compare Figs. 6�a� with 6�b��. The absence of occupied ad-jacent octahedral sites along path II renders the tetrahedralsite energetically more favorable. Furthermore, the tetrahe-dral site along path II is a deep local minimum with an en-ergy barrier of 150 meV to escape the tetrahedral site. Theincreased energy along path I as compared to that along pathII is a result of the electrostatic repulsion when a Li ionenters a tetrahedral site that shares a face with an occupiedoctahedral site.
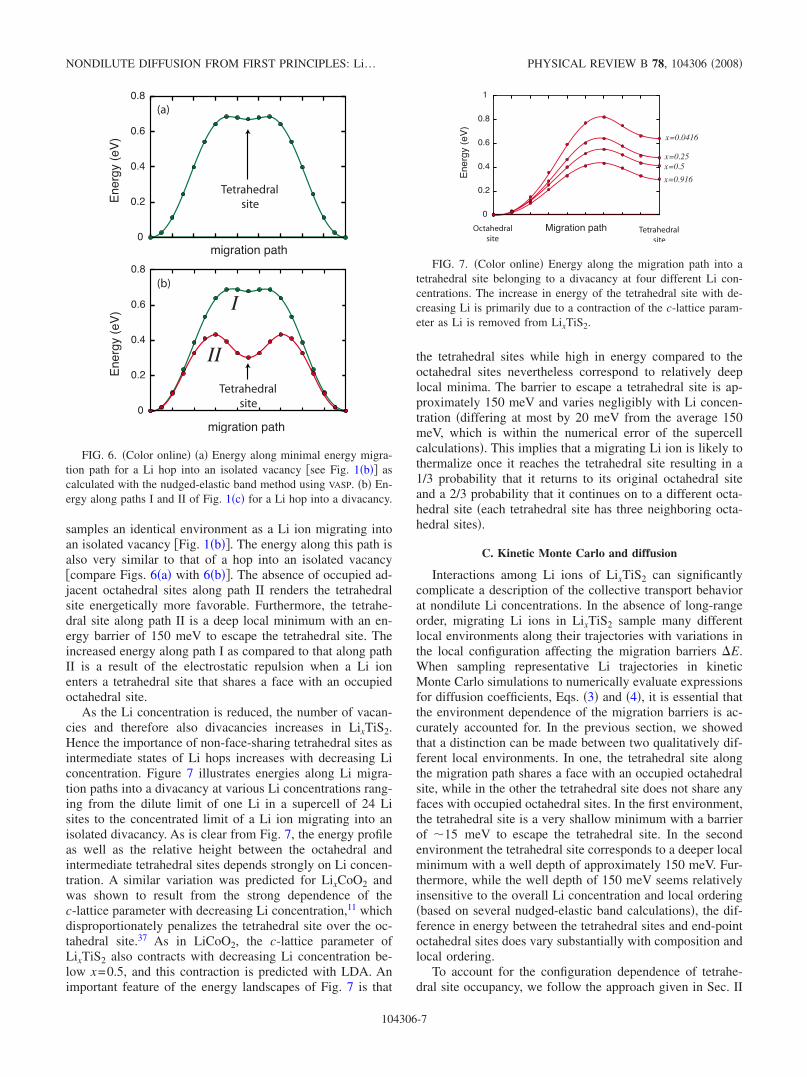
As the Li concentration is reduced, the number of vacan-cies and therefore also divacancies increases in LixTiS2.Hence the importance of non-face-sharing tetrahedral sites asintermediate states of Li hops increases with decreasing Liconcentration. Figure 7 illustrates energies along Li migra-tion paths into a divacancy at various Li concentrations rang-ing from the dilute limit of one Li in a supercell of 24 Lisites to the concentrated limit of a Li ion migrating into anisolated divacancy. As is clear from Fig. 7, the energy profileas well as the relative height between the octahedral andintermediate tetrahedral sites depends strongly on Li concen-tration. A similar variation was predicted for LixCoO2 andwas shown to result from the strong dependence of thec-lattice parameter with decreasing Li concentration,11 whichdisproportionately penalizes the tetrahedral site over the oc-tahedral site.37 As in LiCoO2, the c-lattice parameter ofLixTiS2 also contracts with decreasing Li concentration be-low x=0.5, and this contraction is predicted with LDA. Animportant feature of the energy landscapes of Fig. 7 is that
the tetrahedral sites while high in energy compared to theoctahedral sites nevertheless correspond to relatively deeplocal minima. The barrier to escape a tetrahedral site is ap-proximately 150 meV and varies negligibly with Li concen-tration �differing at most by 20 meV from the average 150meV, which is within the numerical error of the supercellcalculations�. This implies that a migrating Li ion is likely tothermalize once it reaches the tetrahedral site resulting in a1/3 probability that it returns to its original octahedral siteand a 2/3 probability that it continues on to a different octa-hedral site �each tetrahedral site has three neighboring octa-hedral sites�.
C. Kinetic Monte Carlo and diffusion
Interactions among Li ions of LixTiS2 can significantlycomplicate a description of the collective transport behaviorat nondilute Li concentrations. In the absence of long-rangeorder, migrating Li ions in LixTiS2 sample many differentlocal environments along their trajectories with variations inthe local configuration affecting the migration barriers �E.When sampling representative Li trajectories in kineticMonte Carlo simulations to numerically evaluate expressionsfor diffusion coefficients, Eqs. �3� and �4�, it is essential thatthe environment dependence of the migration barriers is ac-curately accounted for. In the previous section, we showedthat a distinction can be made between two qualitatively dif-ferent local environments. In one, the tetrahedral site alongthe migration path shares a face with an occupied octahedralsite, while in the other the tetrahedral site does not share anyfaces with occupied octahedral sites. In the first environment,the tetrahedral site is a very shallow minimum with a barrierof �15 meV to escape the tetrahedral site. In the secondenvironment the tetrahedral site corresponds to a deeper localminimum with a well depth of approximately 150 meV. Fur-thermore, while the well depth of 150 meV seems relativelyinsensitive to the overall Li concentration and local ordering�based on several nudged-elastic band calculations�, the dif-ference in energy between the tetrahedral sites and end-pointoctahedral sites does vary substantially with composition andlocal ordering.
To account for the configuration dependence of tetrahe-dral site occupancy, we follow the approach given in Sec. II
0
0.2
0.4
0.6
0.8Energy(eV)
migration path
(a)
Tetrahedralsite
0
0.2
0.4
0.6
0.8
Energy(eV)
migration path
I
II
(b)
Tetrahedralsite
FIG. 6. �Color online� �a� Energy along minimal energy migra-tion path for a Li hop into an isolated vacancy �see Fig. 1�b�� ascalculated with the nudged-elastic band method using VASP. �b� En-ergy along paths I and II of Fig. 1�c� for a Li hop into a divacancy.
0
0.2
0.4
0.6
0.8
1
Energy(eV)
Migration path
x=0.916x=0.5x=0.25
x=0.0416
Octahedralsite
Tetrahedralsite
FIG. 7. �Color online� Energy along the migration path into atetrahedral site belonging to a divacancy at four different Li con-centrations. The increase in energy of the tetrahedral site with de-creasing Li is primarily due to a contraction of the c-lattice param-eter as Li is removed from LixTiS2.
NONDILUTE DIFFUSION FROM FIRST PRINCIPLES: Li… PHYSICAL REVIEW B 78, 104306 �2008�
104306-7
and introduce extra terms to our cluster expansion of Sec.III A to link the tetrahedral and octahedral sites. We use amixed-basis cluster expansion, introducing an occupationvariable pj for each tetrahedral site j that is one if it is occu-pied by Li and zero if it is vacant. As discussed in Sec. II, theuse of these occupation variables, as opposed to the spinbasis �that can be 1 and −1�, is more convenient in diluteconcentration limits. Since the tetrahedral sites have signifi-cantly higher energies than the octahedral sites, they arerarely occupied and only as intermediate states of Li hopsbetween neighboring octahedral sites. We parametrized theinteraction coefficients that connect tetrahedral sites with oc-tahedral sites by fitting to the energies of 27 configurationswith one occupied tetrahedral site calculated in supercellscontaining 24 LixTiS2 units. The root-mean-square error be-tween the LDA-PAW formation energies for these configu-rations and the cluster expansion predicted formation ener-gies is less than 3 meV per unit cell, and the leave one outcross-validation score is 4 meV per unit cell. The extra termsconnecting the tetrahedral sites with octahedral sites includeda point term �for the tetrahedral site�, three pairs consistingof a tetrahedral site and a neighboring octahedral site, andtwo triplet terms connecting a tetrahedral site with two octa-hedral sites.
With the additional terms accounting for tetrahedral occu-pancy, we have an accurate cluster expansion that describesthe configuration dependence of the end-point energies andthe intermediate tetrahedral sites for any Li hop in LixTiS2.Within our kinetic Monte Carlo simulations, we used Eq. �5�from transition state theory to calculate Li-ion hop frequen-cies. We used the following rules to determine the migrationbarrier for each hop. If the tetrahedral site along the migra-tion path does not share faces with occupied octahedral sites,the barrier to migrate into the tetrahedral site is the differencein energy between the tetrahedral site and the initial octahe-dral site plus 150 meV. The barrier to escape the tetrahedralsite is 150 meV. If the tetrahedral site along the migrationpath does share a face with an occupied octahedral site, thenthe barrier is the difference in energy between the tetrahedraland octahedral sites plus 15 meV. The barrier to escape thosetetrahedral sites is 15 meV. For all hops, the energies of thetetrahedral and octahedral sites were calculated with the clus-ter expansion such that the effects of composition and localorder/disorder on migration barriers are rigorously included.It should be noted that the treatment of the tetrahedral site asa stable local minimum in which the Li thermalizes is ques-tionable for hops into tetrahedral sites that share a face withan occupied octahedral site since the well depth is only about15 meV. However, as emerges from the kinetic Monte Carlosimulations, the generally high barrier of these types of hopsmakes them very rare events so their contribution to theoverall diffusivity �except for high Li content� is negligible.
While we did not attempt to describe the dependence ofthe vibrational prefactors appearing in Eq. �5� on local con-figurational disorder, we used different values depending onwhether the Li ion migrates into a tetrahedral site or out of atetrahedral site. These values were calculated from first prin-ciples within the local harmonic approximation using VASP
where gamma-point vibrational frequencies of the migratingLi-ion were determined by perturbing the atom performing
the hop and calculating restoring forces. Based on calcula-tions in various configurations, we used a value of ��=5�1012 Hz for Li hopping into a tetrahedral site if it does notshare a face with an occupied octahedral site, ��=9.5�1012 Hz for Li hopping out of this site, ��=3.5�1012 Hz for Li hopping into a tetrahedral site if it shares aface with an occupied octahedral site, and ��=6.5�1012 Hz for Li hops out of that site. These values areconsistent with recent 7Li spin alignment echo NMR mea-surements on LixTiS2.43
To calculate diffusion coefficients at finite temperature,we used a standard kinetic Monte Carlo algorithm as firstproposed by Bortz et al.23 and described elsewhere.11,24 Thekinetic Monte Carlo simulation cell contained 12�12�12Li sites. For each Li concentration �initialized to be a randomconfiguration�, we performed 1000 Monte Carlo �MC�passes, where each MC pass corresponds to performing asmany Li hops as there are Li sites. After each hop, the tra-jectories, �Ri�t�, and the time were updated as described in,for example, Ref. 24. Values for the tracer and self-diffusioncoefficients were collected for averaging purposes startingafter the first 500 MC passes. The whole process was re-peated 50 times starting from the Li configuration of theprevious ensemble run, to ensure that sufficient uncorrelatedvalues for D� and DJ were sampled. For kinetic Monte Carlosimulations at concentrations where the stage II phase is pre-dicted to be stable, we initiated the Monte Carlo cell byperforming grand canonical Monte Carlo simulations andkept the last configuration after 1000 Monte Carlo passes.This ensured that the cell had a distribution of Li betweenalternating Li layers representative of the staged phase.
Figure 8 illustrates calculated diffusion coefficients at 300K as a function of Li concentration. The chemical diffusioncoefficient was obtained by multiplying the self-diffusion co-efficient DJ with the thermodynamic factor � according toEq. �1�. As is clear from Fig. 8, the diffusion coefficients allhave a very strong dependence on Li concentration exhibit-ing a maximum close to x=0.5 and varying by several ordersof magnitude over the whole concentration interval. The dif-fusion coefficients decreases rapidly as the Li concentrationis reduced below x=0.55. The tracer diffusion coefficient isalso always less than the self-diffusion coefficient.
The kinetic Monte Carlo simulations show that Li trans-port is dominated by hops into divacancies. Figure 9 illus-
10-16
10-14
10-12
10-10
0 0.2 0.4 0.6 0.8 1
Diffusioncoefficients
(cm2 /s)
Li concentration
DDJ
D*
FIG. 8. �Color online� The tracer �black squares�, self �filledcircles�, and chemical �empty circles� diffusion coefficients calcu-lated with kinetic Monte Carlo simulations.
VAN DER VEN et al. PHYSICAL REVIEW B 78, 104306 �2008�
104306-8
trates the fraction of hops involving tetrahedral sites that donot share faces with occupied octahedral sites. These hopscan only occur when the end point of the hop belongs to adivacancy. As is clear from Fig. 9, divacancy hops dominateover the entire concentration range with hops into isolatedvacancies only occurring appreciably as x approaches one.The migration barriers associated with divacancies are sig-nificantly lower than those into isolated vacancies �whichinvolve tetrahedral sites that share a face with an occupiedoctahedral site�. However, the divacancy concentration isvery low at high Li concentration, increasing with decreasingLi concentration. This is shown in Fig. 10, which illustratesthe average number of divacancies around a Li ion as a func-tion of concentration. The rapid increase in divacancy con-centration as x is reduced from one is responsible for a simi-lar increase in the diffusion coefficients. Below x=0.55,however, the diffusion coefficients decrease again in spite ofthe continued increase in the number of divacancies. Thisdecrease in the diffusion coefficients results from an increasein the migration barriers at low Li concentration. As is clearfrom Fig. 7, the difference in energy between tetrahedral andoctahedral occupancy increases with decreasing Li concen-tration due to a contraction of the c-lattice parameter. Withinthe kinetic Monte Carlo simulations, we are accurately cap-turing this concentration dependence of the energy differencebetween tetrahedral and octahedral occupancy with the clus-ter expansion.
IV. DISCUSSION
Common among the various layered transition-metal ox-ides and sulfides such as LixCoO2, LixNiO2, and LixTiS2 isthat Li hops between neighboring octahedral sites passthrough �or close to� an intermediate tetrahedral site. Further-more, Li migration barriers in all these intercalation com-pounds are substantially lower when the end point of the hopbelongs to a divacancy as opposed to an isolated vacancy.The latter configuration results in a large electrostatic penaltyas the migrating Li occupying the intermediate tetrahedralsite then shares a face with an occupied octahedral site. As isdemonstrated here for LixTiS2 and in a previous study of Lidiffusion in LixCoO2 �Ref. 11� the dominant diffusion-mediating complex in the layered intercalation compounds isa divacancy. This leads to a strong concentration dependenceof the diffusion coefficient at high Li concentration wherethe concentration of divacancies diminishes with Li concen-tration above x=0.5. Another commonality between the lay-ered transition-metal oxides and LixTiS2 is a tendency for thec-lattice parameter to contract significantly as Li is removedbelow x=0.55. This contraction penalizes the tetrahedral siteover the octahedral site leading to higher migration barriers.The increase in migration barriers with decreasing Li con-centration causes a drop in the diffusion coefficient at diluteLi concentrations.
The difference in stacking sequence between LixTiS2 andthe layered transition-metal oxides such as LixCoO2 do resultin qualitative differences in transport behavior between thetwo classes of materials. In the layered transition-metal ox-ides with ABCABC oxygen stacking, the tetrahedral sites inthe Li layers are energetically penalized as they share a facewith a transition-metal ion. In fact, a first-principles investi-gation of diffusion in LixCoO2 showed that the tetrahedralsite along a path connecting neighboring octahedral sites ac-tually corresponds to an activated state �i.e., saddle point� atdilute lithium concentrations where the face-sharing Co ionshave an effective valence close to +4.11 At high Li concen-trations where the effective valence of face-sharing Co ionsis closer to +3, the tetrahedral site corresponds to a veryshallow energy minimum with an energy barrier to leave thetetrahedral site of approximately 25 meV.11
In contrast to the oxides, the tetrahedral sites of LixTiS2do not share faces with the Ti ions. When the tetrahedral siteis part of a divacancy, it corresponds to a relatively stablelocal minimum with well depth around 150 meV. The Lihops between neighboring octahedral sites should then occurin two steps with the migrating Li thermalizing in the tetra-hedral site before performing a second hop to an octahedralsite. This is consistent with claims made in a report on NMRmeasurements of Li diffusion in LixTiS2.43,44 The likelihoodthat Li ions will thermalize in the tetrahedral site before con-tinuing with its trajectory reduces overall Li mobility in thelayered crystal structure as these thermalized Li ions have a1/3 probability to migrate back to its original octahedral site.Hence, when compared to hopping in LixCoO2, although thetetrahedral sites in LixTiS2 are not electrostatically penalizeddue to face-sharing transition-metal ions, their enhanced lo-cal stability reduces the efficiency of Li hops between neigh-boring octahedral sites.
0.8
0.9
1
Fractionofdivacancyhops
0 0.2 0.4 0.6 0.8 1Li concentration
FIG. 9. �Color online� Fraction of Li hops into divacancies as afunction of Li concentration. Only at concentrations close to x=1 isthere any appreciable hopping into isolated Li vacancies.
0
1
2
3
4
5
6
0 0.2 0.4 0.6 0.8 1
numberofdivacancies
Li concentration
FIG. 10. �Color online� Equilibrium number of divacancies sur-rounding each Li ion as a function of Li concentration calculatedwith grand canonical Monte Carlo simulations.
NONDILUTE DIFFUSION FROM FIRST PRINCIPLES: Li… PHYSICAL REVIEW B 78, 104306 �2008�
104306-9
To estimate the effect of intermediate thermalization inthe tetrahedral sites on the tracer diffusion coefficient, weperformed two types of kinetic Monte Carlo simulations inthe dilute limit of a single Li ion: one set of simulationstreated the tetrahedral sites as a metastable intermediate state�i.e., Li ions are assumed to thermalize in the tetrahedral sitebefore continuing on�, while the other set of simulationstreated the tetrahedral sites as activated states. The hop fre-quencies when treating the tetrahedral sites as activatedstates were set equal to one-half the hop frequency needed tohop into the tetrahedral sites when assuming the tetrahedralsites as metastable states �the factor of 1/2 emerges because aLi hop through an activated tetrahedral site has two octahe-dral sites to choose from�. In the limit of a single diffusing Liion, every hop has the same migration barrier, thereby allow-ing us to isolate the effect of an intermediate metastable tet-rahedral state from variations in migration barriers due toconfigurational disorder. For an isolated Li ion, the clusterexpansion predicts a tetrahedral versus octahedral energy of670 meV, which gives a barrier for the octahedral to tetrahe-dral site hop of 820 meV. Calculations of tracer diffusioncoefficients �after averaging over 5000 independent runs�showed that thermalization in the tetrahedral sites �in thedilute limit� leads to a reduction in the tracer diffusion coef-ficient by a factor of approximately two-thirds compared tonot allowing thermalization in the tetrahedral sites �this isconsistent with the fact that when a Li ion thermalizes in atetrahedral site it has a 1/3 chance to hop back to its initialstate�. At room temperature �300 K�, the reduction factor ofabout 2/3 was found to be independent of whether the energybarrier to get out of the metastable tetrahedral site is 150 or 0meV, which is consistent with the hop from the octahedral totetrahedral sites being rate limiting �as is confirmed below�.
A barrier of 150 meV to escape a tetrahedral site also doesnot have a measurable effect on the effective migration bar-rier as extracted from the slope of the natural logarithm ofthe tracer diffusion coefficient, D�, versus 1 /kBT, where D�
was calculated at temperature increments of 10 K between250 and 350 K in the dilute limit of a single diffusing Li ion.In this temperature interval, the effective migration barrierextracted from the temperature dependence of D� was equal�within the error of the least square regression� to the actualmigration barrier within the kinetic Monte Carlo simulationsto migrate into the tetrahedral site �both were about 820meV�. This implies that the rate-limiting steps for diffusionare hops from octahedral sites to tetrahedral sites.
Li diffusion coefficients and transport properties inLixTiS2 have been investigated experimentally with variousprobes.43–50 A common method of measuring Li diffusioncoefficients in electrode materials is within an electrochemi-cal cell. These measurements, however, introduce a varietyof uncertainties related to the difficulty of precisely charac-terizing geometrical dimensions of the intercalation com-pound particles47,49 as well as the difficulty to distinguishbetween Li diffusion in the intercalation compound fromother dynamic processes occurring in the electrolyte, thecounter electrode and at interfaces. NMR measurements havealso been applied to elucidate Li transport mechanisms inLixTiS2,43–45,48,50 which is very powerful in probing atomichop characteristics but provides less insight about correlated
atomic transport at nondilute Li concentrations.Kanehori et al.49 compared their electrochemically mea-
sured diffusion coefficients of single-crystal LixTiS2 usingcurrent pulse and galvanostatic methods with previous mea-surements of Li diffusion coefficients in LixTiS2 �Fig. 5 ofRef. 49�. With the exception of one study reviewed by Kane-hori et al.,49 all measured diffusion coefficients have valuesbetween 10−9 and 10−7 cm2 /s depending on the Li concen-tration. The exception was a study by West et al., whichaccording to Kanehori et al.,49 reported diffusion coefficientsranging between 10−11 and 2�10−10 cm2 /s. The qualitativedependence of Li diffusion coefficients on Li concentrationin three of the studies are very similar to that predicted inthis work, exhibiting low diffusion coefficients in the dilute�x close to zero� and concentrated �x close to one� regimeswith large diffusion coefficients at intermediate concentra-tions. The measurements of Kanehori et al.,49 for example,exhibit a maximum in the diffusion coefficient at x=0.5. Avariety of these studies are complicated by the fact that theLixTiS2 samples used in the measurements had excess Ti inthe Li layer, which affects Li mobility by blocking sites andby modifying the equilibrium c-lattice parameter of the host.
While the qualitative variation of D with Li concentrationpredicted in this work is observed experimentally, there is alarge quantitative discrepancy between measured and calcu-lated diffusion coefficients. A major source of this discrep-ancy can be attributed to the under prediction of the c-latticeparameter with LDA as the calculated migration barriers arevery sensitive to the c-lattice parameter. Figure 11 illustratesthe variation of the difference in energy between tetrahedraland octahedral occupancies as a function of c-lattice param-eter. These energies were calculated in a supercell containing24 LixTiS2 units with a Li divacancy. A variation of thec-lattice parameter by 3% leads to a change in thetetrahedral-octahedral energy difference by 150 meV. Atroom temperature, errors in migration barriers of this orderwill translate into an error in diffusion coefficients of twoorders of magnitude due to the exponential dependence ofthe hop frequencies on migration barriers. LDA under pre-dicts the c-lattice parameter in LixTiS2 by values rangingbetween 2%–3.8% with a larger error in the c-lattice param-eter at dilute Li concentrations. The increased error in c at
00.050.10.150.20.250.30.35
6 6.05 6.1 6.15 6.2 6.25 6.3
∆E(eV)
c-lattice parameter (A)o
LDAlattice
parameter experimentallattice
parameter
FIG. 11. �Color online� Variation of the energy of tetrahedraloccupancy relative to octahedral occupancy next to a divacancy as afunction of c-lattice parameter ��E is the difference in energy be-tween the tetrahedral and octahedral sites of Fig. 1�c��.
VAN DER VEN et al. PHYSICAL REVIEW B 78, 104306 �2008�
104306-10
low x is likely the origin for a more dramatic drop in thecalculated diffusion coefficients with decreasing Li concen-tration as compared to the experimentally measured coeffi-cients at low Li concentrations. In general, predicted diffu-sion coefficients at low temperature will be very sensitive toDFT errors in calculated migration barriers, which, as inLixTiS2, may originate in large part from the incorrect pre-diction of lattice parameters.
V. CONCLUSION
We have performed a first-principles investigation of Lidiffusion in LixTiS2 using a mixed-basis cluster expansionapproach to describe the configuration dependence of the Limigration barriers in kinetic Monte Carlo simulations. First-principles electronic structure calculations within the local-density approximation to density-functional theory predictthat Li migrates between neighboring octahedral sites bypassing through an adjacent tetrahedral site. The migrationbarriers for Li hops are found to be very sensitive to the localenvironment with lower migration barriers occurring whenLi hops into a divacancy as opposed to an isolated Li-vacancy. Furthermore, consistent with other layered interca-lation compounds, we find that the migration barriers arevery sensitive to the c-lattice parameter of the LixTiS2 host
structure. This leads to an increase in the migration barrierwith decreasing Li concentration due to the contraction ofthe c-lattice parameter as Li is removed from LixTiS2. Thetracer, self, and chemical diffusion coefficients calculated byevaluating Kubo-Green expressions within kinetic MonteCarlo simulations all exhibit a maximum close to x=0.5 inqualitative agreement with experiment. The decrease in thediffusion coefficients at low Li concentration results from acontraction of the c-lattice parameter, while the decrease indiffusion coefficients at high Li concentration arises from adecrease in the concentration of diffusion-mediating divacan-cies. We attribute a large part of the quantitative disparitybetween calculated and measured diffusion coefficients tothe systematic under prediction of the c-lattice parameter ofLixTiS2 with LDA, which is largest at dilute Li concentra-tions.
ACKNOWLEDGMENTS
We are grateful to Brian Puchala for helpful discussions.This research was supported in part by a grant from the pe-troleum research fund �PRF� of the American Chemical So-ciety �ACS PRF Grant No. 46584-G10�. D.M. and B.S.gratefully acknowledge support from the Department of En-ergy �DOE� Nuclear Engineering Research Initiative �NERI�Program under Award No. DE-FC07-06ID14747.
1 M. S. Whittingham, Prog. Solid State Chem. 12, 41 �1978�.2 M. M. Thackeray, Prog. Solid State Chem. 25, 1 �1997�.3 J. M. Tarascon and M. Armand, Nature �London� 414, 359
�2001�.4 M. S. Whittingham, Chem. Rev. �Washington, D.C.� 104, 4271
�2004�.5 C. Delmas, C. Fouassier, and P. Hagenmuller, Physica B & C
99, 81 �1980�.6 P. Oliva, J. Leonardi, J. F. Laurent, C. Delmas, J. J. Braconnier,
M. Figlarz, F. Fievet, and A. Deguibert, J. Power Sources 8, 229�1982�.
7 A. Van der Ven, D. Morgan, S. Y. Meng, and G. Ceder, J. Elec-trochem. Soc. 153, A210 �2006�.
8 K. Koumoto, I. Terasaki, and R. Funahashi, MRS Bull. 31, 206�2006�.
9 K. Takada, Nature �London� 422, 53 �2003�.10 P. R. Somani and S. Radhakrishnan, Mater. Chem. Phys. 77, 117
�2003�.11 A. Van der Ven, G. Ceder, M. Asta, and P. D. Tepesch, Phys.
Rev. B 64, 184307 �2001�.12 G. G. Amatucci, J. M. Tarascon, and L. C. Klein, J. Electrochem.
Soc. 143, 1114 �1996�.13 A. Van der Ven, M. K. Aydinol, G. Ceder, G. Kresse, and J.
Hafner, Phys. Rev. B 58, 2975 �1998�.14 A. Van der Ven, M. K. Aydinol, and G. Ceder, J. Electrochem.
Soc. 145, 2149 �1998�.15 Z. H. Chen, Z. H. Lu, and J. R. Dahn, J. Electrochem. Soc. 149,
A1604 �2002�.16 M. K. Aydinol, A. F. Kohan, G. Ceder, K. Cho, and J. Joannopo-
ulos, Phys. Rev. B 56, 1354 �1997�.17 L. Benco, J. L. Barras, M. Atanosov, C. Daul, and E. Deiss, J.
Solid State Chem. 145, 503 �1999�.18 R. Gomer, Rep. Prog. Phys. 53, 917 �1990�.19 S. R. de Groot and P. Mazur, NonEquilibrium Thermodynamics
�Dover, Mineola, 1984�.20 R. Zwanzig, J. Chem. Phys. 40, 2527 �1964�.21 G. Mazenko, J. R. Banavar, and R. Gomer, Surf. Sci. 107, 459
�1981�.22 B. J. Berne and R. Pecora, Dynamic Light Scattering �Dover,
Mineola, 2000�.23 A. B. Bortz, M. H. Kalos, and J. L. Lebowitz, J. Comput. Phys.
17, 10 �1975�.24 F. M. Bulnes, V. D. Pereyra, and J. L. Riccardo, Phys. Rev. E 58,
86 �1998�.25 G. H. Vineyard, J. Phys. Chem. Solids 3, 121 �1957�.26 J. M. Sanchez, F. Ducastelle, and D. Gratias, Physica A 128, 334
�1984�.27 D. De Fontaine, in Solid State Physics, edited by H. Ehrenreich
and D. Trunbull �Academic, New York, 1994�, p. 33.28 A. Van der Ven and G. Ceder, Phys. Rev. Lett. 94, 045901
�2005�.29 F. Zhou, G. Grigoryan, S. R. Lustig, A. E. Keating, G. Ceder,
and D. Morgan, Phys. Rev. Lett. 95, 148103 �2005�.30 D. Morgan, J. D. Althoff, and D. de Fontaine, J. Phase Equilib.
19, 559 �1998�.31 A. Van der Ven and G. Ceder, Phys. Rev. B 71, 054102 �2005�.32 P. E. Blochl, Phys. Rev. B 50, 17953 �1994�.33 G. Kresse and D. Joubert, Phys. Rev. B 59, 1758 �1999�.
NONDILUTE DIFFUSION FROM FIRST PRINCIPLES: Li… PHYSICAL REVIEW B 78, 104306 �2008�
104306-11
34 G. Kresse and J. Furthmuller, Phys. Rev. B 54, 11169 �1996�.35 G. Kresse and J. Furthmuller, Comput. Mater. Sci. 6, 15 �1996�.36 J. R. Dahn and R. R. Haering, Solid State Commun. 40, 245
�1981�.37 K. Kang and G. Ceder, Phys. Rev. B 74, 094105 �2006�.38 S. A. Safran, Solid State Phys. 40, 183 �1987�.39 A. van de Walle and G. Ceder, J. Phase Equilib. 23, 348 �2002�.40 G. L. W. Hart, V. Blum, M. J. Walorski, and A. Zunger, Nat.
Mater. 4, 391 �2005�.41 A. Van der Ven and G. Ceder, Electrochem. Solid-State Lett. 3,
301 �2000�.42 M. Catti, Phys. Rev. B 61, 1795 �2000�.43 M. Wilkening and P. Heitjans, Phys. Rev. B 77, 024311 �2008�.44 M. Wilkening, W. Kuchler, and P. Heitjans, Phys. Rev. Lett. 97,
065901 �2006�.45 B. G. Silbernagel and M. S. Whittingham, J. Chem. Phys. 64,
3670 �1976�.46 A. Honders, J. M. der Kinderen, A. H. van Heeren, J. H. W. de
Wit, and G. H. J. Broers, Solid State Ionics 15, 265 �1985�.47 T. Yamamoto, S. Kikkawa, and M. Koizumi, Solid State Ionics
17, 63 �1985�.48 K. Matsumoto, R. Nagai, T. Asai, and S. Kawai, Solid State
Ionics 25, 233 �1987�.49 K. Kanehori, F. Kirino, T. Kudo, and K. Miyauchi, J. Electro-
chem. Soc. 138, 2216 �1991�.50 W. Kuchler, P. Heitjans, A. Payer, and R. Schollhorn, Solid State
Ionics 70-71, 434 �1994�.
VAN DER VEN et al. PHYSICAL REVIEW B 78, 104306 �2008�