Fax:Kluwer Health, 351 West Camden Street, Baltimore, MD 21202-2436. Phone: 410-528-4050. Permissions: Permissions & Rights Desk, Lippincott Williams & Wilkins, a division of Wolters
http://hyper.ahajournals.org/subscriptions/Subscriptions: Information about subscribing to Hypertension is online at
at UNIV ZIEKENHUIS GENT POLIKLIN on October 19, 2010 hyper.ahajournals.orgDownloaded from
Noninvasive Evaluation of Left Ventricular AfterloadPart 1: Pressure and Flow Measurements and Basic Principles of Wave
Conduction and Reflection
Julio A. Chirinos, Patrick Segers
Abstract—The mechanical load imposed by the systemic circulation to the left ventricle is an important determinant ofnormal and abnormal cardiovascular function. Left ventricular afterload is determined by complex time-varyingphenomena, which affect pressure and flow patterns generated by the pumping ventricle and cannot be expressed as asingle numeric measure or described in terms of pressure alone. Left ventricular afterload is best described in terms ofpressure-flow relations. High-fidelity arterial applanation tonometry can be used to record time-resolved central pressurenoninvasively, whereas contemporary noninvasive imaging techniques, such as Doppler echocardiography andphase-contrast MRI, allow for accurate assessments of aortic flow. Central pressure and flow can be analyzed usingsimplified biomechanical models to characterize various components of afterload, with great potential for mechanisticunderstanding of the role of central hemodynamics in cardiovascular disease and the effects of therapeutic interventions.In the first part of this tutorial, we review noninvasive techniques for central pressure and flow measurements and basicconcepts of wave conduction and reflection as they relate to the interpretation of central pressure-flow relations.Conceptual descriptions of various models and methods are emphasized over mathematical ones. Our review is aimedat helping researchers and clinicians apply and interpret results obtained from analyses of left ventricular afterload inclinical and epidemiological settings. (Hypertension. 2010;56:555-562.)
The mechanical load imposed by the systemic circulationto the pumping ventricle is an important determinant of
normal cardiovascular function and plays an important role inthe pathophysiology of various cardiac conditions, includinghypertensive heart disease, heart failure, postinfarction leftventricular (LV) remodeling, left-sided regurgitant valvularlesions, aortic stenosis, aortic coarctation, and congenitalconditions with a systemic right ventricle (eg, congenitallycorrected transposition of the great arteries).
LV afterload is the impedance (load) against which the LVmust work to promote forward flow (eject blood). In thepresence of a normal aortic valve, LV afterload is largelydetermined by the properties of the arterial tree (“arterialload”).1,2 Although arterial pressure is taken as a usefulsurrogate of LV afterload in clinical practice, in reality,complex time-varying phenomena determine LV afterload,which ultimately affect, in a reciprocal fashion, the pressureand flow generated by the pumping ventricle. Pressure is notonly dependent on afterload but also strongly influenced byventricular structure and function.3 Therefore, LV afterloadcannot be expressed as a single number, nor can it bedescribed in terms of pressure alone, but should be describedin terms of pressure-flow relations, which allow the quanti-
fication of “steady” (nonpulsatile) load and various compo-nents of pulsatile load.1,4 Although pulsatile LV afterload isfairly complex, it can be quantified and summarized usingrelatively simple mechanical models of the systemic circula-tion. In the first part of this tutorial, we review noninvasivetechniques for aortic pressure and flow measurements anddescribe basic models of pulsatile wave conduction andreflection. In the second part, we review analytic methodsused to assess LV afterload using basic physiological princi-ples. Although material properties of the arterial wall (arterialstiffness) are important in cardiovascular disease, we considerthem only in the context of their functional consequences forthe pumping heart. We refer the reader to excellent literatureregarding arterial stiffness,5,6 which is not the focus of thistutorial. Similarly, it would be impossible to extensivelyreference landmark contributions from investigators in thisarea. We cite only general reviews and a limited number oforiginal research publications. Extensive references to origi-nal research contributions can be found elsewhere.1,4
Noninvasive Pressure MeasurementsArterial applanation tonometry can be used to obtain high-fidelity pressure wave forms from the carotid artery, which is
Received May 31, 2010; first decision June 24, 2010; revision accepted July 29, 2010.From the Department of Medicine, Philadelphia Veterans’ Affairs Medical Center-University of Pennsylvania (J.A.C.), Philadelphia, Pa; Biofluid,
Tissue, and Solid Mechanics for Medical Applications (P.S.), IBiTech, Ghent University, Ghent, Belgium.Correspondence to Julio A. Chirinos, Room 8B-111, University and Woodland Avenues, Philadelphia, PA 19104. E-mail
morphologically similar to (and, therefore, may be an accept-able noninvasive surrogate of) the aortic pressure wave form.7
Arterial tonometry is based on the principle that, when theartery is immobilized and the arterial wall is flattened againsta pressure sensor, pressure within the lumen is directlytransmitted to the sensor. The carotid waveform needs to becalibrated, preferably using mean and diastolic pressure,which can be assessed at the brachial artery.8 This approachis justified because mean and diastolic pressures exhibit littlevariation between the upper limb and the central arteries, incontrast to systolic pressure, which increases variably fromthe aorta to the brachial artery because of the phenomenon ofpulse pressure amplification.1,8 With proper technique, high-fidelity recordings of carotid pressure are feasible in mostsituations, although great operator skill may be required insome cases, particularly among obese individuals or thosewith a small stroke volume (ie, heart failure patients). Evenwith proper technique, high-quality recordings may not bepossible in some cases. Technical issues regarding carotidtonometry are discussed in the online Data Supplement,available at http://hyper.ahajournals.org.
For completeness, it is to be mentioned that radial arterialtonometry and application of a transfer function are oftenused to assess aortic pressure.1 Although this approach allowsfor a reliable assessment of central systolic pressure (pro-vided that radial artery waveforms are adequately calibrated),it may be less suited when the central pressure waveform isrequired in all of its detail, as will be the case here.9 However,it should also be recognized that there are systematic differ-ences between the carotid and aortic pressure wave forms,such as a greater early systolic carotid upstroke slope com-pared with the aortic wave form.10 Although these differencesmay affect the assessment of specific components of LVafterload (and should be kept in mind), detailed analyses ofLV afterload using tonometry-derived carotid pressureclosely correlate with those derived from invasive aorticmeasurements.11
Noninvasive Flow MeasurementsThe 2 most accurate noninvasive techniques for flow mea-surements in the proximal arterial system are pulsed-waveDoppler (PW-Doppler) echocardiography and cardiac phase-contrast MRI (PC-MRI).12 Flow measurements with PW-Doppler rely on the principle that the Doppler shift ofreflected ultrasound waves induced by moving blood parti-cles is proportional to the velocity of those particles.1 PW-Doppler is an inexpensive, safe and convenient method tomeasure flow velocities, and there is widespread expertise inits use (Table). Important technical details for measuringblood flow with PW-Doppler include adequate sample posi-tion, sample volume, gain settings, and Doppler beam orien-tation. Although proximal aortic flow can be difficult tointerrogate consistently and reproducibly, LV outflow tract(LVOT) velocities can be adequately interrogated with PW-Doppler in most subjects. Flow velocities must be convertedto volume flow by multiplying velocity times LVOT cross-sectional area at the exact point of PW-Doppler interroga-tion.1,13,14 This method assumes a flat-flow profile across theLVOT and is highly dependent on the accuracy of cross-
sectional area estimations, which in most studies have reliedon LVOT anteroposterior diameter measurements from theparasternal long axis view, assuming a circular area(�*radius2).13,14 This method has several limitations, in-cluding LVOT eccentricity (noncircularity); therefore, ourpreferred method is 3D echocardiography. Technical tipsand considerations for measurements of LVOT velocityand area measurements with PW-Doppler and 3D echocar-diography are described in the Data Supplement, figures,and movies available online at http://hyper.ahajournals.org.
PC-MRI relies on the fact that, when 2 opposing magneticgradient pulses are applied to static nuclei aligned in amagnetic field, the effects of the pulses on nuclear spinscancel each other out, but if a particle moves in the timebetween the pulses, a phase shift of the nuclear spins withinthe moving particle is accumulated, which is proportional tothe velocity of movement along the gradient’s direction. WithPC-MRI, velocity maps along any given anatomic plane canbe generated. When the gradient direction is applied perpen-dicular to the cross-sectional vessel plane (“through-plane”velocity encoding; Figure 1), the velocity distribution overthe vessel cross-sectional area is measured, without assuminga flat-flow profile. Among other parameters, PC-MRI re-quires a user-defined velocity-encoding sensitivity, whichshould be as low as possible to adequately resolve flowvelocities, yet higher than peak velocity in the region ofinterest to avoid aliasing. Although velocity-encoding sensi-tivity should be tailored to individual measurements, a goodstarting point for most proximal aortic flow measurements is130 to 150 cm/s. PC-MRI data are acquired over severalcardiac cycles, and consistent cardiac timing in each cycle isassumed. An important technical consideration is that flowmeasurements may be affected by phase-offset errors causedby in-homogeneities of the magnetic field environment (eddycurrents and concomitant gradient effects). Even small back-ground velocity offset errors can result in significant errors in
Table. Advantages and Disadvantages of Pulsed-WaveDoppler and Phase-Contrast MRI for Measurements ofAortic Flow
volumetric flow, because summation of phase offset acrossthe entire cross-sectional area of the aorta occurs (largervessels being associated with greater phase-offset errors). Thepreferred method for phase-offset correction is based on dataacquisition from a stationary phantom.15 If phantom data arenot acquired, information from stationary tissue located in theimaging plane16 may be used to compensate for phase-offset.Other potential problems in PC-MRI that should be kept inmind include signal loss because of turbulent flow andpulsation artifacts. Finally, the anatomic plane should beprescribed exactly perpendicular to the flow direction, param-eters should be set to obtain a temporal resolution that meetsminimum requirements for planned pressure-flow analytictechniques, and the prescription of the region of interest(aortic lumen) during postprocessing should be as precise aspossible. Magnitude images are particularly useful to identifythe vessel lumen during systole (because of its high flow-related signal intensity). The precise delineation of the aorticlumen in diastole can be challenging, particularly whenmagnitude images are used in isolation; matched phaseimages should always be assessed simultaneously, becausethey can be very helpful in separating the diastolic lumen (in
which low-velocity flow occurs) from the adjacent statictissue. Figure 1 shows an example of through-plane PC-MRImeasurements of proximal aortic flow. Table 1 summarizesadvantages and disadvantages of PW-Doppler and PC-MRI.
Basic Concepts for Afterload Assessments UsingPressure and Flow MeasurementsThe terminology “resistance” (R) originates from electriccircuit theory and applies to signals that do not vary in time(such as direct current). Ohm’s law is well known, withresistance being the ratio of the potential difference (voltage)over a conductor and the electric current. To describe resis-tance to electric current that fluctuates over time (eg, alter-nating current), the term impedance (Z) is used. Impedance isa more general formulation than resistance (which it actuallyincludes) but varies with the frequency of fluctuations in theelectric signal (R is the value of Z at zero-frequency). Theseterms have been “borrowed” to describe hemodynamic phe-nomena.1,4 Analogous to the dampening of electric flow byelectric devices, R and Z in hemodynamics refer to dampen-ing of blood flow by blood vessels, expressing the relationbetween pressure (voltage) and flow (current). By conven-
Figure 1. Measurement ofproximal aortic flow withPC-MRI. A, Magnitude image.B, Phase image, which repre-sents the through-plane veloc-ity map. C shows the ascend-ing aortic flow profile atvarious time points. D showsmean flow velocity; bars repre-sent SDs of voxel-wise velocityat each time point during ejec-tion. Note the wide variation invelocity, the nonflat-flow pro-file, and simultaneous forward(light blue) and backward (darkblue) flow during late systole(arrowheads). E shows nettime-resolved volumetric flow.Analyses were performed withthe freely available softwareSegment.20 See also supple-mental movie 5.
Chirinos and Segers LV Afterload Assessment Part 1 557
at UNIV ZIEKENHUIS GENT POLIKLIN on October 19, 2010 hyper.ahajournals.orgDownloaded from
tion, the term “resistance” is typically used to describenonoscillatory opposition to flow, whereas the term “imped-ance” is used for opposition to fluctuating (pulsatile) flow.
Assuming for the sake of simplicity that the downstreampressure at the end of a vessel of finite length (uniform ingeometry and mechanical properties) is 0, resistance to flowimposed by the vessel equals the ratio between mean pressureat its upstream end and mean flow through the vessel(Pm/Qm) and is, according to Poiseuille’s law, directlyproportional to vessel length and inversely proportional to thefourth power of vessel radius. Impedance to pulsatile flowimparted by a given vessel segment is defined, in analogy, asthe ratio of pulsatile change in pressure/pulsatile change inflow in that particular vessel. In the absence of reflectedwaves in the vessel, this property is called characteristicimpedance (Zc). It can be approximated as �*PWV/A, where� is blood density, pulse wave velocity (PWV) is thepropagation speed of the pulse through that vessel, and A isvessel cross-sectional area (which, assuming a circular cross-section, is proportional to radius to the power of 2).1 PWV (acommonly used index of segmental stiffness), is directlyrelated to the square root of wall elastic modulus andinversely proportional to the square root of vessel radius (ie,radius to the power of 0.5).4,5,17 Therefore, Zc depends on thestiffness of the vessel but is also highly dependent on vesselradius, being inversely proportional to its power of 2.5.17
Input ImpedanceThe resistance and impedance to flow imposed by a singlevessel of finite length or by a vessel segment must be clearlydistinguished from the summed resistance/impedance of anentire vascular bed. Because the arterial system is composedof a network of nonuniform, branching vessels with differentgeometries and wall properties that interact with each other, itis impossible to define the impedance of the arterial systembased on single vessel properties. Indeed, the LV only sensesthe “summed” mechanical load imposed by all of the vesselsdownstream of the LVOT. The complex pattern of summedimpedance imposed by a vascular bed downstream of aparticular point (and which can be fully assessed by measur-ing time-varying flow and pressure at that particular point) iscalled input impedance1,4,13,14 (note the difference from char-acteristic impedance, Zc). Therefore, by analyzing proximalaortic pressure and flow, the impedance of the entire arterialtree is obtained, which is effectively what the heart “sees.”Aortic input impedance is, therefore, not a measure of aorticproperties but rather reflects the load imparted by the proxi-mal aorta and all of the arterial segments distal to it, includingthe effects of wave reflections.
Analyses of aortic input impedance are often done in thefrequency domain. Any signal with periodicity, as can bereasonably assumed for arterial pressure and flow waves insteady-state (stable) conditions, can be decomposed into itssteady (nonpulsatile or zero-frequency) component and itsharmonic components, which, by definition, have a frequencythat is a multiple of heart rate (fundamental frequency). Themathematical technique used for harmonic decomposition ofpressure and flow signals is the Fourier transform.1,13,14 Eachharmonic component is a pure sinusoidal wave with 3 basic
properties: modulus (amplitude), period (which determines itstemporal frequency, f), and phase angle (which is a numericexpression of its position in time relative to the beginning ofeach fundamental period, or cardiac cycle; Figure 2). Whensteady and harmonic components of a waveform are addedarithmetically, the original waveform is obtained. The num-ber of harmonic components within a waveform that can bediscerned depends on the temporal resolution of the acquiredsignal and equals half the number of time points availablewithin one fundamental period. Most of the energy andrelevant details contained in human pressure and flow waveforms are found in the first 10 harmonics, which, therefore,can be obtained if �20 measurement points across the cardiaccycle are available.1 This is an important consideration,because it determines the minimal effective temporal resolu-tion required for flow measurements, which influences pre-scribed PC-MRI acquisition parameters. As will be dis-cussed in more detail later in this tutorial, once the
A Period duration (T)
Am
plitu
de (m
odul
us)
Phase (position in time relative to the parent wave)
B
φ
φ
φ
φ
Fundamental Period
Time
HarmonicPeriod
Figure 2. A, Properties of sinusoidal waves: period duration (T),amplitude (modulus), and phase angle, which describes theposition in time of the sinusoidal wave relative to the parentwave. B shows a pressure waveform and a hypothetical thirdharmonic of arbitrary amplitude with different phase angles.These hypothetical third harmonics are shown for illustrationpurposes only and are mutually exclusive and different from theactual pressure wave third harmonic. If the harmonic periodstarts simultaneously with the fundamental period, phase angleis 0° (top harmonic). If the harmonic is delayed (1/4) of a cyclerelative to the parent wave, phase angle is 90° (middle har-monic). If the harmonic is delayed (1/2) a cycle relative to theparent wave, phase angle is 180° (bottom harmonic). A phaseangle range of 0° to 360° describes any possible relative posi-tion of the harmonic.
558 Hypertension October 2010
at UNIV ZIEKENHUIS GENT POLIKLIN on October 19, 2010 hyper.ahajournals.orgDownloaded from
harmonic components of pressure and flow are known,modulus of input impedance is calculated at each fre-quency as the ratio of pressure modulus/flow modulus,whereas phase angle of input impedance is calculated aspressure phase angle minus flow phase angle (P��Q�).
A more intuitive approach to pressure-flow analyses relieson assessing relationships between pressure and flow waveswhen these are analyzed “directly” in the time domain ratherthan decomposed into their harmonics.1,17 Before furtherdiscussing frequency- or time-domain analyses of pressure-flow relations, it is useful to consider extremely simplemodels of blood flow and pressure in elastic tubes.
Model 1: Pulsatile Pressure and Flow in a SingleElastic Tube of Infinite Length (Absence ofReflected Waves)The effects of intermittent flow injection into a single elastictube of infinite length illustrate pressure-flow relations in theabsence of reflected waves. Under such conditions, pulsatileenergy imparted from one end of the tube promotes forwardflow and increases pressure within the tube. Measured flowand pressure signals demonstrate exactly the same shape(Figure 3). The amount of pressure rise (�P) versus flow rise(�Q; vertical scale in pressure and flow curves in Figure 3)for any given amount of imparted energy is determined by theZc of the tube (therefore, Zc��P/�Q). The plot of instanta-neous pressure versus instantaneous flow data points corre-sponds to a straight line. The slope of this line is identical tothe ratio of �P/�Q and, therefore, represents Zc (Figure 3,bottom left panel); in reality, pressure-flow relations inhuman vessels are not perfectly linear, but these concepts doapply during early phases of the cardiac cycle. In addition,because pressure and flow wave forms are identical, theamplitude (modulus) of any harmonic relative to the parentwave is identical for pressure and flow, and, therefore, whenanalyzed in the frequency domain, modulus of input imped-ance is the same at all of the nonzero frequencies (ie, the ratiobetween the amplitude of pressure harmonics over the am-plitude of the respective flow harmonics is the same for every
harmonic pair). This constant impedance modulus is also iden-tical to Zc (Figure 3, bottom middle panel). If Zc is known,pressure and flow can be scaled in the vertical axis and theirwave forms superposed (Figure 3, bottom right panel).
Model 2: Pressure and Flow in a Single ElasticTube of Finite Length in the Presence ofWave ReflectionsIf we consider an alternative model in which a pulse of flowis injected into an elastic tube of finite length with a“reflector” of the closed-end type at its end (the “impedance”terminating the tube is higher than its characteristic imped-ance), the energy imparted to the tube promotes forward flowand increases pressure within the lumen. Flow and pressuresignals measured during this initial period of time demon-strate exactly the same shape, like in the previous model.Assuming that the fluid within the tube is incompressible (asis the case with blood within vessels), the energy waveimparted to the tube is transmitted along its wall at a finitespeed (PWV) until it encounters the reflector on the otherside. The energy wave is then reflected and transmitted“backward,” promoting flow away from the reflector (back-ward flow) and an increase in pressure in the lumen. Assum-ing that no energy loss occurs along the tube and wavereflection is complete (100% of the energy is reflected), thereflected pressure signal is an exact copy of the forwardpressure, whereas the flow signal is an exact “negative”version of the original flow (at the site of the reflection, thenet pressure doubles, whereas net flow is 0). Therefore, thekey difference between the forward and backward waves isthat the forward wave manifests as increased pressure andflow, whereas the reflected wave manifests as increasedpressure and inverse (or decreased forward) flow, the mag-nitude of pressure increase and backward flow induced bywave reflections being a function of the initial forward energyand the proportion of energy being reflected.
With progressive decreases in tube length or progressiveincreases in its PWV, progressively greater superimpositionof forward and reflected pressure and flow waves occurs.
Zc = ∆ P / ∆ Q
Impe
danc
eM
odul
us
Zc
Frequency1 2 3 4 5 6 7
Pres
sure
(P)
Flow (Q) Time
Pres
sure
(P)
Pres
sure
(P)
Flow
(Q)
Flow
(Q)
Slope=Zc
Figure 3. Pulsatile pressure and flow in a singleelastic tube of infinite length.
Chirinos and Segers LV Afterload Assessment Part 1 559
at UNIV ZIEKENHUIS GENT POLIKLIN on October 19, 2010 hyper.ahajournals.orgDownloaded from
Eventually, forward and backward components merge into asingle wave from which forward versus backward signalsmay be difficult to discern based on pressure alone or flowalone. However, because, in the absence of wave reflections,pressure and flow wave forms should be identical (as inmodel 1), differences in the shape of the pressure versus theflow wave forms (which are induced by wave reflections) canbe quantified as long as the 2 wave forms can be relatedquantitatively to each other (ie, properly “scaled” in thevertical axis). This scaling can be achieved if the parameterthat describes the quantitative relationship between pulsatilepressure and flow in the absence of wave reflections isknown. This parameter is Zc, which can be measured fromearly pressure and flow data points in the proximal tube,before the reflected wave returns, using the ratio of early�P/�Q or the slope of the early pressure-flow relation. Thisis the basis for wave separation analysis,13,18 which is used toquantify reflected waves in the arterial circulation in the timedomain, as discussed in part 2 of this tutorial.
The description above is based on analysis of physics ofwave reflection in the time domain, but a similar reasoningcan be applied for the frequency domain.1,14 When consider-ing the wave as a composite of sine waves with differentfrequencies, manifestations of the reflected wave will dependon the frequency of the sine wave considered. If a givenharmonic of the incident wave has a wavelength equal totwice the length of the tube (ie, reflection site located at 1⁄2wavelength), the distance traveled by the wave before return-ing to the point of origin will correspond exactly to a fullwavelength of that particular harmonic. Therefore, round-triptransit time corresponds exactly to the harmonic period(Figure 4A), and the reflected harmonic is delayed a fullperiod relative to its forward counterpart. This causes forwardand backward harmonics to be in phase. Two sine waves thatare in phase, when added, will produce a sine wave of greateramplitude or modulus (constructive interference, Figure 4A,left). On the other hand, when a sine wave is subtracted froma wave that is in phase and has the same frequency, it willcancel it out (destructive interference, Figure 4A, right).Because reflected energy (for a reflection of the closed endtype) increases pressure and decreases (“inverts”) flow, theformer occurs for the pressure harmonic, whereas the latteroccurs for the flow harmonic. Therefore, modulus of inputimpedance (pressure modulus/flow modulus) at that particu-lar frequency will be high. On the other hand, for a harmonicof wavelength equal to 4 times the distance of the tube(reflection site located at 1⁄4 wavelength), round-trip dis-tance corresponds to half a wavelength, round-trip transittime corresponds to half the harmonic period, and thereflected harmonic is therefore delayed half a periodrelative to the forward harmonic (ie, is 180° out of phase).The reflected pressure harmonic adds to the incidentpressure harmonic and cancels it out, whereas the reflectedflow harmonic subtracts from the incident flow harmonic,increasing its amplitude (Figure 4B). Therefore, modulus ofinput impedance at that frequency is minimized. Theseprinciples also apply when partial rather than full reflectionsoccur (Figure 5). It follows that input impedance tends to theminima at one-quarter wavelength frequency (and its odd
multiples, eg, 3/4 and 5/4) and to the maxima at (1/2)wavelength (2/4) and all of the other even multiples of quarterwavelength (4/4, 6/4, etc), by an amount proportional to theamount of reflected energy. Therefore, the reflected wave inthe frequency domain manifests as oscillations of impedancemodulus about a mean non-zero value (which is the Zc of thetube). In addition, as illustrated in Figure 5, for frequenciescorresponding with 1/4 wavelength (1/4, 1/2, 3/4, etc) thetotal pressure and flow harmonics are in phase, so thatimpedance phase angle (P��Q�) is 0. For intermediatefrequencies, phase angle varies between �90 (eg, 3/8) and�90° (eg, 5/8). Finally, according to these principles, one cancalculate the distance to the reflection site when the lowestfrequency corresponding with a phase angle of 0 and imped-ance minimum are known, as long as the PWV of the tube isalso known.
Pressure FlowATT TT
Forward Wave
ReflectedWave
Interference
TotalSignal
Pressure FlowBTT TT
Forward Wave
ReflectedWave
Interference
TotalSignal
Figure 4. Illustration of constructive and destructive interferenceas determinants of the “quarter-wavelength rule.” When thereflection site is located at (1/2) wavelength, round trip transittime (TT) equals a full period of the harmonic (4A), causing for-ward and backward harmonics to be in phase, which maximizesthe pressure harmonic amplitude, but minimizes the flow har-monic, because the latter it is not only delayed but also“inverted” (negative sign). Impedance modulus (P/Q modulus) atthat frequency is maximized. When the reflection site is locatedat (1/4) wavelength (4B), the round trip TT corresponds with halfthe harmonic period and the reflected harmonic is 180° out ofphase, minimizing the pressure harmonic and maximizing theflow harmonic. Impedance modulus at that frequency is mini-mized. In this example, reflection of 100% of forward energy isassumed.
560 Hypertension October 2010
at UNIV ZIEKENHUIS GENT POLIKLIN on October 19, 2010 hyper.ahajournals.orgDownloaded from
Forward and Reflected Waves in the HumanArterial TreeAt the beginning of each cardiac cycle, the heart generates aforward-traveling energy pulse that results in increased pres-sure and forward flow in the proximal aorta during early
systole. If proximal aortic Zc is high because of a stiff wall,a small aortic diameter, or both, the amount of pressureincrease is relatively large for any given early systolicflow.1,14,17 The energy wave generated by the LV (incidentwave) is transmitted by conduit vessels and partially reflected
Figure 5. Principle of constructive and destructive interference with partial wave reflection in a tube with length of 1 meter and PWV of10 m/s. An initial forward wave (dashed line) is generated. In this example, reflection coefficient is 0.75 and the amplitude of thereflected wave (gray line) is 75% of the incident wave amplitude. Total measured pressure harmonics (black continuous lines, left) arethe sum of corresponding forward and backward pressure harmonics. Total measured flow harmonics (black continuous lines, right) arethe sum of forward and backward flow harmonics. For a frequency of 2.5 Hz (top row), the reflection site is located at (1/4) wavelength(wavelength at PWV of 10 m/s�10/2.5�4 m�4 times the length of the tube). Round trip distance (2 m) equals half a wavelength, roundtrip transit-time equals half the harmonic period, and the reflected harmonic is delayed half a period relative to the forward harmonic(180° out of phase), with maximal destructive interference for pressure (left), maximal constructive interference for flow (right), and mini-mal modulus of impedance (not shown). Pressure and flow harmonics have the same phase, and impedance phase (pressure phaseminus flow phase) is 0. At a frequency of 5 Hz (third row), wavelength�10/5�2 m. Round-trip distance (2 m) equals a full wavelength,round-trip transit time equals the harmonic period, and reflected and forward harmonics are in phase, with maximal constructive inter-ference for pressure (left), maximal destructive interference for flow (right), and maximal modulus of impedance (not shown). Rows 2and 4 represent intermediate cases. Pressure amplitude (1.00 AU), flow amplitude (0.05 AU), and Zc (1/0.05�20.00 AU) are expressedin arbitrary units.
Chirinos and Segers LV Afterload Assessment Part 1 561
at UNIV ZIEKENHUIS GENT POLIKLIN on October 19, 2010 hyper.ahajournals.orgDownloaded from
at sites of impedance mismatch, such as points of branchingor change in wall diameter or material properties along thearterial tree. Multiple small reflections are conducted back tothe heart and merge into a “net” reflected wave, composed ofthe contributions of the scattered backward reflections. Thisreflected wave is often looked at as one single discrete wave,originating from an “effective” reflection site (which adheresto the conceptual view of the arterial system as a tube with asingle reflection site as described above), but it is important torealize that the reflected wave is the resultant of scatteredreflections, originating from distributed reflection sites. Thetime of arrival of the reflected wave to the proximal aortadepends on the location of reflection sites and on the PWV ofconduit vessels, particularly the aorta, which, in turn, isinfluenced by wall stiffness as described above.1,14,17 Thedistance to the reflection sites is strongly dependent on bodyheight. Finally, it should be noted that complex reflectionsites may induce phase shifts between the incident andreflected wave that result in differences between the calcu-lated effective reflection distance and the actual anatomicdistance to these sites.19
PerspectivesWave conduction and reflections are important determinantsof LV afterload and central arterial hemodynamics. Analysesof central pressure-flow relations can be very informativeregarding the relatively complex set of events related to wavereflections in the arterial tree, as will be discussed in part 2 ofthis tutorial.
oretical, Experimental and Clinical Principles. 5th ed. London, UK:Oxford University Press; Hodder Arnold; 2005.
2. Kass DA. Ventricular arterial stiffening: integrating the pathophysiology.Hypertension. 2005;46:185–193.
3. Segers P, Stergiopulos N, Westerhof N. Quantification of the contributionof cardiac and arterial remodeling to hypertension. Hypertension. 2000;36:760–765.
4. Segers P, Verdonck P. Principles of vascular physiology. In: Lanzer P,Topol E, eds. Panvascular Medicine: Integrated Clinical Management.Berlin, Germany: Springer-Verlag; 2002.
5. Laurent S, Cockcroft J, Van Bortel L, Boutouyrie P, Giannattasio C,Hayoz D, Pannier B, Vlachopoulos C, Wilkinson I, Struijker-Boudier H.Expert consensus document on arterial stiffness: methodological issuesand clinical applications. Eur Heart J. 2006;27:2588–2605.
6. Vlachopoulos C, Aznaouridis K, Stefanadis C. Clinical appraisal of ar-terial stiffness: the Argonauts in front of the Golden Fleece. Heart.2006;92:1544–1550.
7. Colan SD, Borow KM, Neumann A. Use of the calibrated carotid pulsetracing for calculation of left ventricular pressure and wall stressthroughout ejection. Am Heart J. 1985;109:1306–1310.
8. Mahieu D, Kips J, Rietzschel ER, De Buyzere ML, Verbeke F, GillebertTC, De Backer GG, De Bacquer D, Verdonck P, Van Bortel LM, SegersP. Noninvasive assessment of central and peripheral arterial pressure(waveforms): implications of calibration methods. J Hypertens. 2010;28:300–305.
9. Segers P, Rietzschel E, Heireman S, De Buyzere M, Gillebert T,Verdonck P, Van Bortel L. Carotid tonometry versus synthesized aortapressure waves for the estimation of central systolic blood pressure andaugmentation index. Am J Hypertens. 2005;18:1168–1173.
10. Chen CH, Ting CT, Nussbacher A, Nevo E, Kass DA, Pak P, Wang SP,Chang MS, Yin FC. Validation of carotid artery tonometry as a means ofestimating augmentation index of ascending aortic pressure. Hypertension.1996;27:168–175.
11. Kelly R, Fitchett D. Noninvasive determination of aortic inputimpedance and external left ventricular power output: a validation andrepeatability study of a new technique. J Am Coll Cardiol. 1992;20:952–963.
13. Segers P, Rietzschel ER, De Buyzere ML, Vermeersch SJ, De Bacquer D,Van Bortel LM, De Backer G, Gillebert TC, Verdonck PR. Noninvasive(input) impedance, pulse wave velocity, and wave reflection in healthymiddle-aged men and women. Hypertension. 2007;49:1248–1255.
14. Mitchell GF. Clinical achievements of impedance analysis. Med Biol EngComput. 2009;47:153–163.
15. Chernobelsky A, Shubayev O, Comeau CR, Wolff SD. Baseline cor-rection of phase contrast images improves quantification of blood flow inthe great vessels. J Cardiovasc Magn Reson. 2007;9:681–685.
16. Heiberg E, Sjogren J, Ugander M, Carlsson M, Engblom H, Arheden H.Design and validation of Segment: freely available software for cardio-vascular image analysis. BMC Med Imaging. 10:1.
17. Mitchell GF. Arterial stiffness and wave reflection in hypertension:pathophysiologic and therapeutic implications. Curr Hypertens Rep.2004;6:436–441.
18. Westerhof N, Sipkema P, van den Bos GC, Elzinga G. Forward andbackward waves in the arterial system. Cardiovasc Res. 1972;6:648–656.
19. Westerhof BE, van den Wijngaard JP, Murgo JP, Westerhof N. Locationof a reflection site is elusive: consequences for the calculation of aorticpulse wave velocity. Hypertension. 2008;52:478–483.
20. Heiberg E, Markenroth K, Arheden H. Validation of free software forautomated delineation and MRI flow analysis. J Cardiovasc Magn Reson.2007;9:375–376.
562 Hypertension October 2010
at UNIV ZIEKENHUIS GENT POLIKLIN on October 19, 2010 hyper.ahajournals.orgDownloaded from
TITLE: Non-Invasive Evaluation of Left Ventricular Afterload
Part 1: Pressure and Flow Measurements and Basic Principles of
Wave Conduction and Reflection
Julio A. Chirinos1; Patrick Segers2.
(1) Philadelphia VA Medical Center and University of Pennsylvania, Philadelphia, PA, USA.
(2) Biofluid, Tissue and Solid Mechanics for Medical Applications (bioMMeda); IBiTech, Ghent
University, Belgium.
Address for correspondence Julio A. Chirinos, MD. Rm 8B111. University and Woodland Avenues. Philadelphia, PA. email: [email protected] Tel +1(215)200-7779. Fax +1(215)823-5400.
at UNIV ZIEKENHUIS GENT POLIKLIN on October 19, 2010 hyper.ahajournals.orgDownloaded from
Technical considerations for carotid arterial applanation tonometry Various technical aspects must be considered to obtain high-fidelity recordings of carotid pressure, which are feasible in most situations. Carotid tonometry is best performed in the supine position. A rolled towel under the neck and slight extension and/or rotation of the subject's head may help bring the carotid artery anteriorly and/or stabilize it between the tonometer and underlying anatomic structures. This maneuver may tighten the skin overlying the artery, particularly among subjects with short necks, impeding adequate flattening of the arterial wall. This can be overcome by relaxation/opening of the jaw. The tonometer can be oriented antero-posteriorly or slightly medially, the latter being useful to take advantage of the support provided by laryngeal cartilage for arterial immobilization. The amount of pressure exerted by the operator on the tonometer should be high enough to acquire a clear signal, but excessive pressure has the potential to result in subject discomfort, vagal responses and/or the inability to record the pressure nadir. The later problem can be detected by the presence of a flat late diastolic pressure profile, rather than the expected asymptotic exponential fall. To minimize error, carotid pressure is typically recorded over several seconds and signal-averaged, because noise decreases as a root function of the number of analyzed beats. Carotid pressure wave form calibration
The carotid waveform needs to be calibrated, preferably using mean and diastolic pressure (MAP and DBP) which can be assessed at the brachial artery.1 This approach is justified because MAP and DBP exhibit little variation between the upper limb and the central arteries, in contrast to systolic pressure (SBP), which variably increases from the aorta to the brachial artery due to the phenomenon of pulse pressure amplification1, 2. The most accurate method to measure brachial DBP is the auscultatory method, carefully performed by a trained operator, although by itself, this method does not provide MAP. Oscillometric methods accurately measure MAP with less operator dependency but are not as accurate as the auscultatory method to measure DBP.2 A useful approach is to record a tonometric brachial pressure waveform, which can be calibrated using cuff SBP and DBP determined at the same site.1 MAP can then be computed via integration of the brachial pressure waveform. However, an adequate brachial pressure waveform recording may not be achievable in all individuals.3 Several groups have used radial pressure wave forms calibrated with brachial systolic and diastolic pressures to obtain mean arterial pressure via integration of the wave form. This approach may be limited, however, by the considerable and variable degree of brachial to radial amplification4, 5. Finally, MAP can be empirically computed from brachial SBP and DBP by adding 40% of pulse pressure to the value of DBP, although this approach carries the risk of systematic error because wave reflections systematically affect the brachial pressure wave form factor (level of MAP relative to SBP and DBP).1 Technical considerations for flow measurements with Doppler echocardiography Important technical details for measuring blood flow with PW-Doppler include adequate sample position, sample volume, gain settings and Doppler beam orientation, which must be perfectly aligned to the direction of blood flow (zero-insonation angle) to avoid underestimation of flow velocities. When a zero-insonation angle is not possible due to anatomic or acoustic window limitations, mathematical corrections can be performed as long as the insonation angle is known, but large offsets from the zero-angle should be avoided. Although proximal aortic flow can be difficult to interrogate consistently and reproducibly, left ventricular outflow tract (LVOT)
at UNIV ZIEKENHUIS GENT POLIKLIN on October 19, 2010 hyper.ahajournals.orgDownloaded from
velocities can be adequately interrogated with PW-Doppler in most subjects. Flow velocities must be converted to volume flow by multiplying velocity times the cross-sectional area of the LVOT at the exact point of PW-Doppler interrogation.2, 3, 6 This method assumes a flat flow profile across the vessel lumen and is highly dependent on the accuracy of cross-sectional area estimations. The LVOT tends to be cone-shaped, with the minimal cross-sectional area occurring just below the aortic annulus,6 although careful examination of LVOT anatomy with 3D-techniques often reveals a slightly more proximal narrowest segment, with widening just underneath the aortic annulus. When PW-Doppler signals are acquired, the point of maximal flow velocities in the LVOT is identified proximal to the aortic valve and the velocity signal from that point is recorded, because according to the continuity equation, this must correspond to the minimal cross-sectional LVOT area, which can be subsequently identified and measured in anatomic images. Left ventricular outflow tract (LVOT) area measurements In most studies, LVOT area estimations rely on measurements of the LVOT antero-posterior diameter from the parasternal long axis view (supplemental movie 1), assuming a circular area (π*LVOT radius2).3, 6 This method has the following limitations: (1) The anatomic interrogation plane must correspond exactly to the center of the LVOT lumen, or diameter will be underestimated; (2) Errors in diameter measurements are squared during LVOT-area computations; (3) The assumption of a circular LVOT does not hold in most individuals.7 LVOT shape is almost always elliptical, with the antero-posterior diameter usually being shorter than its orthogonal counterpart (Supplemental Figure-S1). Our preferred approach is the use of full-volume 3D-echocardiography, which can be used for offline multi-planar reconstruction to identify 2 LVOT orthogonal long-axis planes, from which a 3rd plane orthogonal to the first two (true cross-section) can be prescribed (Supplemental Figures S2-3; Supplemental movies 2-4). Freezing the volume in mid-systole and translating the cross-sectional plane allows for the identification of the minimal LVOT cross-sectional area, which can be traced digitally (Supplemental Figure S2B-C). In a recent study among 58 adults, we found a mean 2.98 mm-difference of between the antero-posterior and its orthogonal diameter and a mean 0.4 cm2-difference between 3D- and 2D-derived LVOT area, although it varied widely, in some subjects being>1 cm2. Furthermore, there was only a moderate correlation between 2D- and 3D-measurements (R2=0.58; unpublished data).
at UNIV ZIEKENHUIS GENT POLIKLIN on October 19, 2010 hyper.ahajournals.orgDownloaded from
1. Mahieu D, Kips J, Rietzschel ER, De Buyzere ML, Verbeke F, Gillebert TC, De Backer GG, De Bacquer D, Verdonck P, Van Bortel LM, Segers P. Noninvasive assessment of central and peripheral arterial pressure (waveforms): implications of calibration methods. J Hypertens. 2010;28:300-305.
2. Nichols WW and O'Rourke MF. McDonald’s blood flow in arteries. Theoretical, Experimental and Clinical Principles. . 5 ed: Oxford University Press; 2005.
3. Segers P, Rietzschel ER, De Buyzere ML, Vermeersch SJ, De Bacquer D, Van Bortel LM, De Backer G, Gillebert TC, Verdonck PR. Noninvasive (input) impedance, pulse wave velocity, and wave reflection in healthy middle-aged men and women. Hypertension. 2007;49:1248-1255.
4. Verbeke F, Segers P, Heireman S, Vanholder R, Verdonck P, Van Bortel LM. Noninvasive assessment of local pulse pressure: importance of brachial-to-radial pressure amplification. Hypertension. 2005;46:244-248.
5. Segers P, Mahieu D, Kips J, Rietzschel E, De Buyzere M, De Bacquer D, Bekaert S, De Backer G, Gillebert T, Verdonck P, Van Bortel L. Amplification of the pressure pulse in the upper limb in healthy, middle-aged men and women. Hypertension. 2009;54:414-420.
6. Mitchell GF. Clinical achievements of impedance analysis. Med Biol Eng Comput. 2009;47:153-163.
7. Doddamani S, Bello R, Friedman MA, Banerjee A, Bowers JH, Jr., Kim B, Vennalaganti PR, Ostfeld RJ, Gordon GM, Malhotra D, Spevack DM. Demonstration of left ventricular outflow tract eccentricity by real time 3D echocardiography: implications for the determination of aortic valve area. Echocardiography. 2007;24:860-866.
at UNIV ZIEKENHUIS GENT POLIKLIN on October 19, 2010 hyper.ahajournals.orgDownloaded from
Supplemental Figure S1. In this cardiac computed tomography (CT) scan, the antero-posterior LVOT diameter (yellow line) is shown as measured from the LVOT view (which is equivalent to the echocardiographic parasternal long axis view; supplemental Movie 1). This anatomic plane, as shown on the top left panel of Figure S1, corresponds closely to the green diameter on the bottom-right image (2.25 cm), which shows a properly prescribed cross-section of the LVOT. Notice that the LVOT is highly eccentric (not circular) and that the antero-posterior LVOT diameter (green line) is much shorter than its orthogonal diameter (2.9 cm; purple line), which cannot evaluated from the 2D-LVOT view (or parasternal long axis view). In this particular case, assumption of circularity would lead to an estimated LVOT area of 3.8 cm, whereas true cross-sectional area is 4.97 cm2.
at UNIV ZIEKENHUIS GENT POLIKLIN on October 19, 2010 hyper.ahajournals.orgDownloaded from
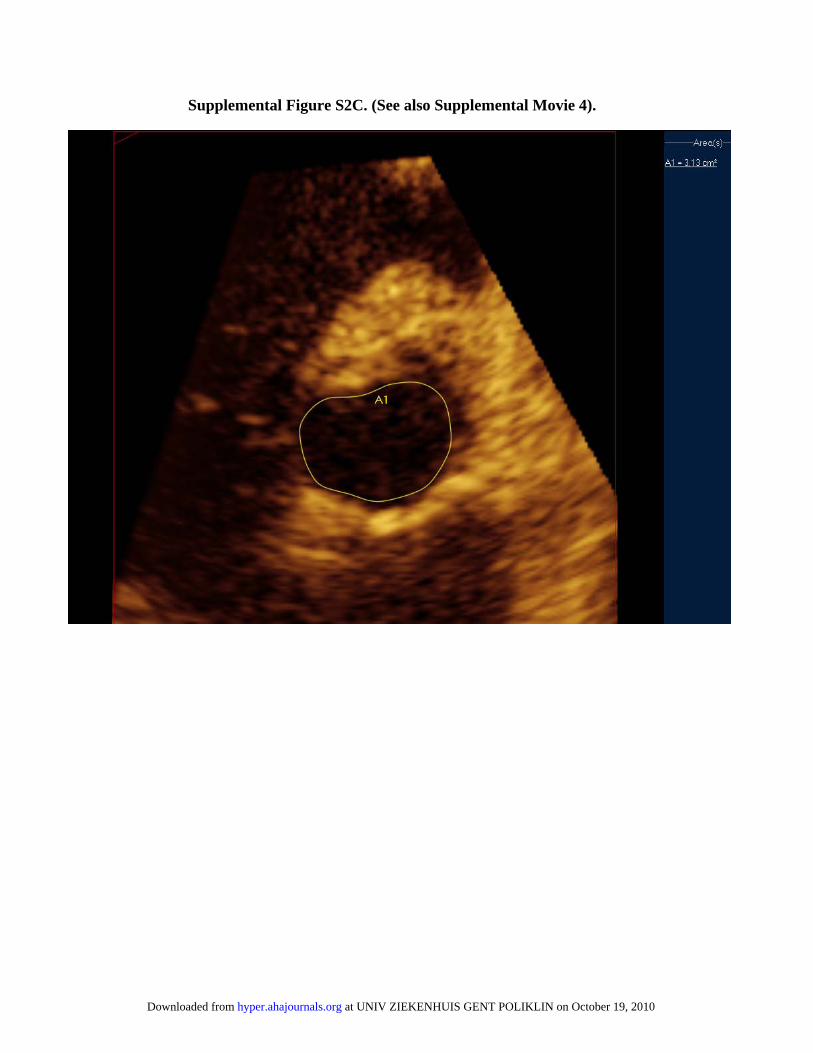
Supplemental Figure S2. Figure S2A shows a full volume of the LVOT obtained with 3D-echocardiography from the parasternal window (also see Supplemental Movie 2). The volume was used for off-line multiplanar reconstruction, which allows for the prescription of 2 LVOT orthogonal long axis planes and a true LVOT cross-sectional plane. The volume allows visualization of multiple parallel slices. Figure S2B and Supplemental Movie 3 shows these parallel planes from a plane distal to the aortic valve/annulus (top panels) to several LVOT cross-sectional planes (below the aortic annulus). These can be used to identify the narrowest LVOT cross-sectional area during ejection (Figure S2C, Supplemental Movie 4), which can then be traced digitally, as shown.
Supplemental Figure S2A (also see Supplemental Movie 2).
at UNIV ZIEKENHUIS GENT POLIKLIN on October 19, 2010 hyper.ahajournals.orgDownloaded from
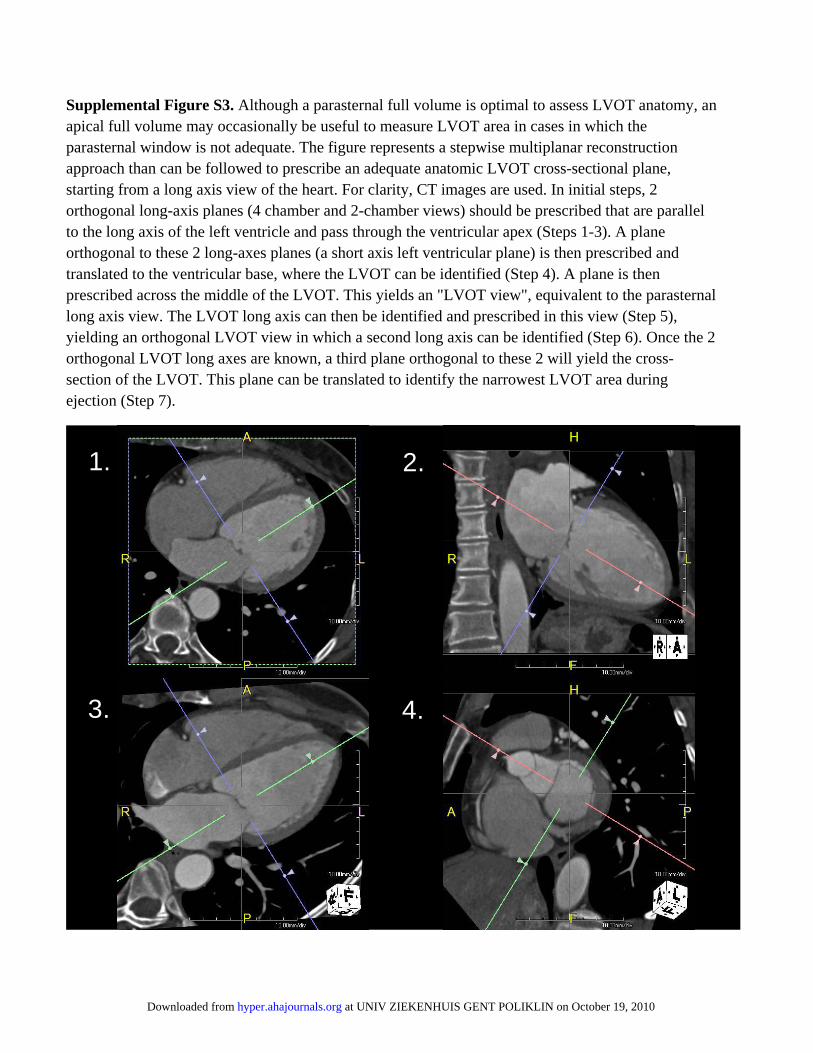
Supplemental Figure S3. Although a parasternal full volume is optimal to assess LVOT anatomy, an apical full volume may occasionally be useful to measure LVOT area in cases in which the parasternal window is not adequate. The figure represents a stepwise multiplanar reconstruction approach than can be followed to prescribe an adequate anatomic LVOT cross-sectional plane, starting from a long axis view of the heart. For clarity, CT images are used. In initial steps, 2 orthogonal long-axis planes (4 chamber and 2-chamber views) should be prescribed that are parallel to the long axis of the left ventricle and pass through the ventricular apex (Steps 1-3). A plane orthogonal to these 2 long-axes planes (a short axis left ventricular plane) is then prescribed and translated to the ventricular base, where the LVOT can be identified (Step 4). A plane is then prescribed across the middle of the LVOT. This yields an "LVOT view", equivalent to the parasternal long axis view. The LVOT long axis can then be identified and prescribed in this view (Step 5), yielding an orthogonal LVOT view in which a second long axis can be identified (Step 6). Once the 2 orthogonal LVOT long axes are known, a third plane orthogonal to these 2 will yield the cross-section of the LVOT. This plane can be translated to identify the narrowest LVOT area during ejection (Step 7).
1. 2.
3. 4.
at UNIV ZIEKENHUIS GENT POLIKLIN on October 19, 2010 hyper.ahajournals.orgDownloaded from