Research Article Nonlinear Absorption Kinetics of Self-Emulsifying Drug Delivery Systems (SEDDS) Containing Tocotrienols as Lipophilic Molecules: In Vivo and In Vitro Studies Saeed Alqahtani, 1 Alaadin Alayoubi, 1 Sami Nazzal, 1 Paul W. Sylvester, 1 and Amal Kaddoumi 1,2 Received 22 January 2013; accepted 21 March 2013 Abstract. Self-emulsifying drug delivery systems (SEDDS) have been broadly used to promote the oral absorption of poorly water-soluble drugs. The purpose of the current study was to evaluate the in vivo oral bioavailability of vitamin E isoforms, δ-tocotrienol (δ-T3) and γ-tocotrienol (γ-T3) administered as SEDDS, as compared to commercially available UNIQUE E® Tocotrienols capsules. Results from studies in rats showed that low dose treatment with δ-T3 (90%) and γ-T3 (10%) formulated SEDDS showed bioavailability of 31.5% and 332%, respectively. However, bioavailability showed a progressive decrease with increased treatment dose that displayed nonlinear absorption kinetics. Additional in vitro studies examining cellular uptake studies in Caco 2 cells revealed that the SEDDS formulation increased passive permeability of δ-T3 and γ-T3 by threefold as compared to the commercial capsule formulation. These studies also showed that free surfactants decreased δ-T3 and γ-T3 absorption. Specifically, combined treatment cremophor EL or labrasol with tocotrienols caused a 60–85% reduction in the cellular uptake of δ-T3 and γ-T3 and these effects appear to result from surfactant-induced inhibition of the δ-T3 and γ-T3 transport protein Niemann–Pick C1-like 1 (NPC1L1). In summary, results showed that SEDDS formulation significantly increases the absorption and bioavailability δ-T3 and γ-T3. However, this effect is self-limiting because treatment with increasing doses of SEDDS appears to be associated with a corresponding increase in free surfactants levels that directly and negatively impact tocotrienol transport protein function and results in nonlinear absorption kinetics and a progressive decrease in δ-T3 and γ-T3 absorption and bioavailability. KEY WORDS: cremophor EL; labrasol; NPC1L1; SEDDS; tocotrienols. INTRODUCTION A large portion of newly discovered drugs are lipophilic in nature. As a result, these drugs often display poor solubility, limited absorption and low bioavailability. Several approaches have been used to improve the oral bioavailability of many lipophilic drugs including lipid-based formulations (1–3). This approach enhances oral bioavailability through several well established mechanisms. First, co-administration of lipids causes a delay in the rate of gastric emptying and enhances drug solubility by stimulating the secretion of endogenous com- pounds such as bile salts and phospholipids into the gastroin- testinal (GI) tract (4,5). Second, lipid-based formulations increase the incorporation of these drugs into lipoproteins, which facilitate more lymphatic absorption (6–8) and thereby bypassing hepatic portal system metabolism (9–11). Self-emulsifying drug delivery systems (SEDDS) is an example of a lipid-based formulation strategy that has been successfully used to increase bioavailability of lipophilic drugs with poor aqueous solubility (4,7,12–15). SEDDS are composed of oils (synthetic or natural), surfactants, and co-solvents (4,16,17) and upon exposure to GI fluids and mild agitation, will form oil-in-water (o/w) emulsions with droplet size ranging from 100 to 300 nm (18,19). These small droplets provide a very large surface area that allows for more solubilization and partitioning (20), and ultimately results in a significant improve- ment in oral absorption and bioavailability of lipophilic drugs. Selection of SEDDS formulation components is governed by criteria that include: chemical stability, purity, drug compatibil- ity, solvent capacity, digestibility, and miscibility (21). Furthermore, amounts and proportions of these components are critical for SEDDS formulations stability and performance. Lipid composition and/or amount of surfactants may inversely affect the drug solubilization and in vivo performance (15,22). Tocotrienols are members of the vitamin E family of compounds that display a wide range of health benefits including neuroprotective, anticancer, antiplatelet, and Electronic supplementary material The online version of this article (doi:10.1208/s12248-013-9481-7) contains supplementary material, which is available to authorized users. 1 Department of Basic Pharmaceutical Sciences, College of Pharmacy, University of Louisiana at Monroe, Monroe, Louisiana 71201, USA. 2 To whom correspondence should be addressed. (e-mail: [email protected]) The AAPS Journal ( # 2013) DOI: 10.1208/s12248-013-9481-7 1550-7416/13/0000-0001/0 # 2013 American Association of Pharmaceutical Scientists
Transcript
Research Article
Nonlinear Absorption Kinetics of Self-Emulsifying Drug Delivery Systems(SEDDS) Containing Tocotrienols as Lipophilic Molecules:In Vivo and In Vitro Studies
Saeed Alqahtani,1 Alaadin Alayoubi,1 Sami Nazzal,1 Paul W. Sylvester,1 and Amal Kaddoumi1,2
Received 22 January 2013; accepted 21 March 2013
Abstract. Self-emulsifying drug delivery systems (SEDDS) have been broadly used to promote the oralabsorption of poorly water-soluble drugs. The purpose of the current study was to evaluate the in vivooral bioavailability of vitamin E isoforms, δ-tocotrienol (δ-T3) and γ-tocotrienol (γ-T3) administered asSEDDS, as compared to commercially available UNIQUE E® Tocotrienols capsules. Results fromstudies in rats showed that low dose treatment with δ-T3 (90%) and γ-T3 (10%) formulated SEDDSshowed bioavailability of 31.5% and 332%, respectively. However, bioavailability showed a progressivedecrease with increased treatment dose that displayed nonlinear absorption kinetics. Additional in vitrostudies examining cellular uptake studies in Caco 2 cells revealed that the SEDDS formulation increasedpassive permeability of δ-T3 and γ-T3 by threefold as compared to the commercial capsule formulation.These studies also showed that free surfactants decreased δ-T3 and γ-T3 absorption. Specifically,combined treatment cremophor EL or labrasol with tocotrienols caused a 60–85% reduction in thecellular uptake of δ-T3 and γ-T3 and these effects appear to result from surfactant-induced inhibition ofthe δ-T3 and γ-T3 transport protein Niemann–Pick C1-like 1 (NPC1L1). In summary, results showed thatSEDDS formulation significantly increases the absorption and bioavailability δ-T3 and γ-T3. However,this effect is self-limiting because treatment with increasing doses of SEDDS appears to be associatedwith a corresponding increase in free surfactants levels that directly and negatively impact tocotrienoltransport protein function and results in nonlinear absorption kinetics and a progressive decrease in δ-T3and γ-T3 absorption and bioavailability.
A large portion of newly discovered drugs are lipophilic innature. As a result, these drugs often display poor solubility,limited absorption and low bioavailability. Several approacheshave been used to improve the oral bioavailability of manylipophilic drugs including lipid-based formulations (1–3). Thisapproach enhances oral bioavailability through several wellestablishedmechanisms. First, co-administration of lipids causesa delay in the rate of gastric emptying and enhances drugsolubility by stimulating the secretion of endogenous com-pounds such as bile salts and phospholipids into the gastroin-testinal (GI) tract (4,5). Second, lipid-based formulationsincrease the incorporation of these drugs into lipoproteins,
which facilitate more lymphatic absorption (6–8) and therebybypassing hepatic portal system metabolism (9–11).
Self-emulsifying drug delivery systems (SEDDS) is anexample of a lipid-based formulation strategy that has beensuccessfully used to increase bioavailability of lipophilic drugswith poor aqueous solubility (4,7,12–15). SEDDS are composedof oils (synthetic or natural), surfactants, and co-solvents(4,16,17) and upon exposure to GI fluids and mild agitation,will form oil-in-water (o/w) emulsions with droplet size rangingfrom 100 to 300 nm (18,19). These small droplets provide a verylarge surface area that allows for more solubilization andpartitioning (20), and ultimately results in a significant improve-ment in oral absorption and bioavailability of lipophilic drugs.Selection of SEDDS formulation components is governed bycriteria that include: chemical stability, purity, drug compatibil-ity, solvent capacity, digestibility, and miscibility (21).Furthermore, amounts and proportions of these componentsare critical for SEDDS formulations stability and performance.Lipid composition and/or amount of surfactants may inverselyaffect the drug solubilization and in vivo performance (15,22).
Tocotrienols are members of the vitamin E family ofcompounds that display a wide range of health benefitsincluding neuroprotective, anticancer, antiplatelet, and
Electronic supplementary material The online version of this article(doi:10.1208/s12248-013-9481-7) contains supplementary material,which is available to authorized users.1 Department of Basic Pharmaceutical Sciences, College of Pharmacy,University of Louisiana at Monroe, Monroe, Louisiana 71201, USA.
2 To whom correspondence should be addressed. (e-mail:[email protected])
The AAPS Journal (# 2013)DOI: 10.1208/s12248-013-9481-7
1550-7416/13/0000-0001/0 # 2013 American Association of Pharmaceutical Scientists
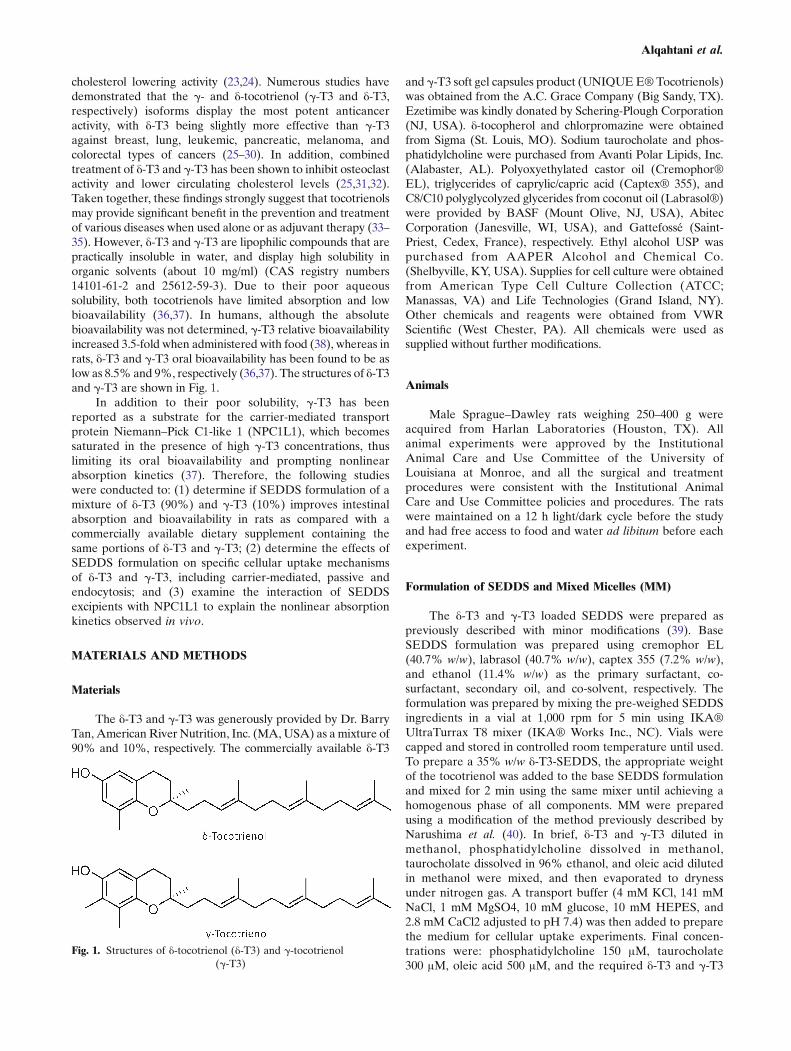
cholesterol lowering activity (23,24). Numerous studies havedemonstrated that the γ- and δ-tocotrienol (γ-T3 and δ-T3,respectively) isoforms display the most potent anticanceractivity, with δ-T3 being slightly more effective than γ-T3against breast, lung, leukemic, pancreatic, melanoma, andcolorectal types of cancers (25–30). In addition, combinedtreatment of δ-T3 and γ-T3 has been shown to inhibit osteoclastactivity and lower circulating cholesterol levels (25,31,32).Taken together, these findings strongly suggest that tocotrienolsmay provide significant benefit in the prevention and treatmentof various diseases when used alone or as adjuvant therapy (33–35). However, δ-T3 and γ-T3 are lipophilic compounds that arepractically insoluble in water, and display high solubility inorganic solvents (about 10 mg/ml) (CAS registry numbers14101-61-2 and 25612-59-3). Due to their poor aqueoussolubility, both tocotrienols have limited absorption and lowbioavailability (36,37). In humans, although the absolutebioavailability was not determined, γ-T3 relative bioavailabilityincreased 3.5-fold when administered with food (38), whereas inrats, δ-T3 and γ-T3 oral bioavailability has been found to be aslow as 8.5% and 9%, respectively (36,37). The structures of δ-T3and γ-T3 are shown in Fig. 1.
In addition to their poor solubility, γ-T3 has beenreported as a substrate for the carrier-mediated transportprotein Niemann–Pick C1-like 1 (NPC1L1), which becomessaturated in the presence of high γ-T3 concentrations, thuslimiting its oral bioavailability and prompting nonlinearabsorption kinetics (37). Therefore, the following studieswere conducted to: (1) determine if SEDDS formulation of amixture of δ-T3 (90%) and γ-T3 (10%) improves intestinalabsorption and bioavailability in rats as compared with acommercially available dietary supplement containing thesame portions of δ-T3 and γ-T3; (2) determine the effects ofSEDDS formulation on specific cellular uptake mechanismsof δ-T3 and γ-T3, including carrier-mediated, passive andendocytosis; and (3) examine the interaction of SEDDSexcipients with NPC1L1 to explain the nonlinear absorptionkinetics observed in vivo.
MATERIALS AND METHODS
Materials
The δ-T3 and γ-T3 was generously provided by Dr. BarryTan, American River Nutrition, Inc. (MA,USA) as a mixture of90% and 10%, respectively. The commercially available δ-T3
and γ-T3 soft gel capsules product (UNIQUEE®Tocotrienols)was obtained from the A.C. Grace Company (Big Sandy, TX).Ezetimibe was kindly donated by Schering-Plough Corporation(NJ, USA). δ-tocopherol and chlorpromazine were obtainedfrom Sigma (St. Louis, MO). Sodium taurocholate and phos-phatidylcholine were purchased from Avanti Polar Lipids, Inc.(Alabaster, AL). Polyoxyethylated castor oil (Cremophor®EL), triglycerides of caprylic/capric acid (Captex® 355), andC8/C10 polyglycolyzed glycerides from coconut oil (Labrasol®)were provided by BASF (Mount Olive, NJ, USA), AbitecCorporation (Janesville, WI, USA), and Gattefossé (Saint-Priest, Cedex, France), respectively. Ethyl alcohol USP waspurchased from AAPER Alcohol and Chemical Co.(Shelbyville, KY, USA). Supplies for cell culture were obtainedfrom American Type Cell Culture Collection (ATCC;Manassas, VA) and Life Technologies (Grand Island, NY).Other chemicals and reagents were obtained from VWRScientific (West Chester, PA). All chemicals were used assupplied without further modifications.
Animals
Male Sprague–Dawley rats weighing 250–400 g wereacquired from Harlan Laboratories (Houston, TX). Allanimal experiments were approved by the InstitutionalAnimal Care and Use Committee of the University ofLouisiana at Monroe, and all the surgical and treatmentprocedures were consistent with the Institutional AnimalCare and Use Committee policies and procedures. The ratswere maintained on a 12 h light/dark cycle before the studyand had free access to food and water ad libitum before eachexperiment.
Formulation of SEDDS and Mixed Micelles (MM)
The δ-T3 and γ-T3 loaded SEDDS were prepared aspreviously described with minor modifications (39). BaseSEDDS formulation was prepared using cremophor EL(40.7% w/w), labrasol (40.7% w/w), captex 355 (7.2% w/w),and ethanol (11.4% w/w) as the primary surfactant, co-surfactant, secondary oil, and co-solvent, respectively. Theformulation was prepared by mixing the pre-weighed SEDDSingredients in a vial at 1,000 rpm for 5 min using IKA®UltraTurrax T8 mixer (IKA® Works Inc., NC). Vials werecapped and stored in controlled room temperature until used.To prepare a 35% w/w δ-T3-SEDDS, the appropriate weightof the tocotrienol was added to the base SEDDS formulationand mixed for 2 min using the same mixer until achieving ahomogenous phase of all components. MM were preparedusing a modification of the method previously described byNarushima et al. (40). In brief, δ-T3 and γ-T3 diluted inmethanol, phosphatidylcholine dissolved in methanol,taurocholate dissolved in 96% ethanol, and oleic acid dilutedin methanol were mixed, and then evaporated to drynessunder nitrogen gas. A transport buffer (4 mM KCl, 141 mMNaCl, 1 mM MgSO4, 10 mM glucose, 10 mM HEPES, and2.8 mM CaCl2 adjusted to pH 7.4) was then added to preparethe medium for cellular uptake experiments. Final concen-trations were: phosphatidylcholine 150 μM, taurocholate300 μM, oleic acid 500 μM, and the required δ-T3 and γ-T3
Fig. 1. Structures of δ-tocotrienol (δ-T3) and γ-tocotrienol(γ-T3)
Alqahtani et al.
concentrations in each experiment. The micellar solution wasthoroughly vortexed and stirred at 37°C for 30 min.
Physical Characterization of SEDDS Formulation
Intensity-weighted mean particle size, populationdistribution (Polydispersity Index, PI) which is a measureof homogeneity and width of the size distribution, andZeta potential (ξ) of SEDDS were measured by photoncorrelation spectroscopy (PCS) at 23°C and a fixed angleof 90° using Nicomp™ 380 ZLS submicron particle sizeanalyzer (PSS Inc., Santa Barbara, CA). Before analysis,SEDDS were reconstituted in transport buffer to obtain afinal tocotrienols concentrations of 1 mg/ml for δ-T3 and0.1 mg/ml for γ-T3. When needed, samples for sizeanalysis were diluted further with 0.2 ml-filtered anddeionized water in order to minimize multiple-particlescattering and to achieve an optimal scattering intensity of300 KHz. The size was recorded for 3 min with viscosityand dielectric constant of the medium set to 1.33 and 78.5,respectively. The intensity-weighted mean diameter of theparticles was calculated based on Stokes–Einstein law bycurve fitting of the correlation function. The Zetapotential of the SEDDS was measured using the sameinstrument (Nicomp™380 ZLS) under zeta mode, andZeta potential was measured using the Helmholz–Smoluchowsky equation. The stability of SEDDS formu-lation was also observed by measuring the particle sizeafter 3 weeks of storage in refrigerated conditions (4–8°C)to monitor any change in particle size over the period ofthe experiment. Analyses were performed in triplicatesunless otherwise specified.
In Vivo Pharmacokinetic Studies
All animal experiments were performed under fed conditions.For the intravenous (i.v.) administration study, 10 mg/kg of δ-T3and 1 mg/kg of γ-T3 was emulsified as described previously withthe aid of Tween 80 and labrasol in sterilized water beforeadministration into the femoral vein of anesthetized rats byintraperitoneal injection of 1.0 g/kg urethane (41). Blood sampleswere withdrawn at 0, 0.084, 0.25, 0.5, 1, 2, 4, 6, 8, and 10 h. For oraladministration, 0.5, 2.5, and 25 mg/kg doses of δ-T3 prepared asSEDDS or capsule were administered to the rats via oral gavage.About 45 min following the oral administration, rats wereanesthetized with urethane and blood samples were collected at1, 2, 3, 4, 6, 8, 10, and 12 h. The blood samples were withdrawnfrom the femoral artery. The blood samples were collected inheparinized Eppendorf tubes. The samples were then centrifugedat 13,000 rpm for 10 min. The separated plasma was stored at−20°C until analysis by HPLC. Four rats were used for the i.v.experiment and three rats/dose for the oral experiment. Plasmalevels versus time profiles were plotted and fitted using a PK-Plusmodule in Gastroplus™ (Simulation Plus Inc., Lancaster, CA).Non-compartmental model was used to calculate the meanresidence time and the systemic clearance. The area under thecurve (AUC) was calculated by the trapezoidal rule method. Thei.v. data were found to best fit a two-compartmental model fromwhich the central compartment (Vc) and peripheral compartmentvolume of distribution (V2) were calculated.
In Vitro Studies
Cell Culture
Caco2 cells were cultured in Dulbecco’s Modified EagleMedium supplemented with 20% fetal bovine serum (FBS) and2.5% antibiotics (penicillin and streptomycin) in a humidifiedincubator with 5% CO2 at 37°C. Cells were cultured on 75 cm2flask at a density of 1×10⁶ cells/flask and were then harvested at90% confluence with trypsin–EDTA. Cells were seeded onto a48-well plate at a density of 50,000 cells/well. When confluent,uptake studies were performed as described below. Allexperiments were conducted in triplicate.
Cell Uptake Studies for SEDDS, MM, and Capsule
The δ-T3 and γ-T3 loaded SEDDS, MM and capsule werediluted in transport buffer to prepare different concentrationsranging from 1 to 25 μM for δ-T3 and 0.1–2.5 μM for γ-T3. Twohundredmicroliters from each concentration of SEDDS,MM, andcapsule were added and incubated for 45 min. At the end of theexperiment, cells were washed twice with ice-cold PBS and lysedwith 100 μl lysis buffer overnight at 4°C before analysis by HPLC.
NPC1L1 Inhibition Studies
To investigate the effect of formulation on the carrier-mediated uptake of δ-T3 and γ-T3 by NPC1L1, inhibition studiesof NPC1L1 by ezetimibe (selective inhibitor of NPC1L1) wereperformed (40,42,43). After washing the cells with warm PBS, cellswere pre-incubated with 50 μM ezetimibe for 30 min. Cells werethen treatedwith 1, 5, 10, 25 μMof δ-T3 and 0.1, 0.5, 1, 2.5 μMofγ-T3 prepared as SEDDS or capsule with or without 50 μMezetimibe for 45 min. At the end of the experiment, cells werewashed twice with ice-cold PBS and lysed with 100 μl lysis bufferfor overnight at 4°C before analysis by HPLC.
Passive Uptake Studies
To measure the passive uptake of SEDDS formulation andcapsule, a cellular uptake experiment at 4°C was conducted.Different concentrations of δ-T3 (1, 5, 10, 25 μM) and γ-T3 (0.1,0.5, 1, 2.5 μM) loaded SEDDSor capsule were added to the cells at4°C or 37°C for 45 min. After the treatment period, cells werewashed, lysed, and analyzed by HPLC.
Endocytosis Inhibition Studies
To study the contribution of endocytosis process to thecellular uptake of δ-T3 and γ-T3 delivered as SEDDS orcapsules endocytosis inhibition studies were performed. Cellswere incubated with required concentrations of δ-T3 and γ-T3 in presence and absence of chlorpromazine, a clathrin-mediated endocytosis inhibitor (44). After washing with warmPBS, cells were pre-incubated with 50 μM chlorpromazine for30 min. Then, different concentrations of δ-T3 (1, 5, 10,25 μM) and γ-T3 (0.1, 0.5, 1, 2.5 μM) loaded SEDDS orcapsule with or without 50 μM chlorpromazine were added tothe cells for 45 min. At the end of the experiment, cells werewashed, lysed, and analyzed by HPLC.
Nonlinear Absorption Kinetics of SEDDS Containing Tocotrienols
Cellular Uptake Studies of MM with Cremophor EL,Labrasol, or Captex
To investigate the effect of individual SEDDS excip-ients on the cellular uptake of tocotrienols and theirpossible contribution to the in vivo nonlinear kineticsbehavior of δ-T3 and γ-T3 the following experiments wereperformed. Cells were treated with δ-T3 and γ-T3 pre-pared as MM at different concentrations and exact amountof cremophor EL (1.6%, w/v), labrasol (1.6%, w/v), orcaptex (0.3%, w/v) for 45 min. Cremophor EL, labrasol, orcaptex were added at concentrations comparable to thosein SEDDS. Then, the cells were washed with cold PBS andlysed with 100 μl of lysis buffer for overnight at 4°C beforeanalysis by HPLC.
Concentration-Dependent Studies of CremophorEL and Labrasol
To 10 μM δ-T3 and 1 μM γ-T3 prepared as MM differentconcentrations of cremophor EL and labrasol were added.Cremophor EL at 0.1%, 0.5%, 0.75%, 1%, w/v or labrasol at0.01%, 0.05%, 0.1%, 0.25%, w/v with MM containing δ-T3and γ-T3 were incubated with the cells for 45 min. At the endof the experiment, cells were washed twice with ice-cold PBSand lysed with 100 μl lysis buffer overnight at 4°C beforeanalysis by HPLC.
HPLC Analysis of Plasma Samples and Cell Lysate
Quantification of δ-T3 and γ-T3 in the plasma samples andcell lysate was fully validated and achieved by an isocraticProminence Shimadzu HPLC system (Columbia, MD) asdescribed previously (37,45). The system consisted of a SIL 20-AHT autosampler, fluorescence detector (Shimadzu, RF10AXL) and a LC-20AB pump connected to a Dgu-20A3 degasser.Data acquisition was achieved by LC Solution software version1.22 SP1. The chromatographic conditions were a XDB-C18Column (5 μm, 150×4.6mm i.d.; Agilent, CA,USA), the mobilephase consisted of methanol, ethanol, and acetonitrile(85:7.5:7.5, v/v/v) delivered at a 1.0 ml/min flow rate. The δ-T3andγ-T3 in plasma and cell lysatewere detected byfluorescencedetection set at 298 nm excitation and 325 nm emission. Thetotal run time was 7 min with retention times of 4.0 and 4.8 minfor δ-T3 and γ-T3, respectively. The injection volume was 20 μl.The extraction of δ-T3 andγ-T3 from the plasmawas performedas described previously (37). In brief, 50 μl plasma and 50 μlethanol containing 1% ascorbic acid and 1 μg/ml δ-tocopherol(internal standard) were added in a glass tube and vortex mixed,followed by the addition 1.0 ml hexane. The mixture wasvortexed for 90 s before centrifugation for 10 min at5,000 rpm. Eight hundred microliters of the supernatantwere then transferred to another glass tube and evaporat-ed to dryness by a centrifugal evaporator (Centrivapconcentrator, Kansas City, MO, USA) followed by recon-stitution with 100 μl methanol before 20 μl injection ontothe HPLC column. For the extraction of δ-T3 and γ-T3from the cell lysate, 1:1 precipitation with acetonitrilefollowed by centrifugation at 13,000 rpm for 10 min wasperformed before injection into the HPLC.
Data Analysis
GraphPad Prism, version 6.00 (GraphPad Software, SanDiego, CA, USA) was used to perform all statistical analysis.The observed maximum concentration (Cmax) and the time ofpeak (Tmax) were obtained directly from the individualplasma concentration versus time profiles. The AUC wascalculated using the trapezoidal rule method. Vmax and KM
were determined from nonlinear regression of the concentra-tion versus cellular uptake curves by GraphPad Prism. Theresults were presented as mean±SD. P values<0.05 wereconsidered statistically significant.
RESULTS
Characterization of SEDDS Formulation
The mean droplet size, PI, and Zeta potential values ofdispersion generated by SEDDS formulation are 211±14 nm,0.5±0.04, and −25±3, respectively (Supplementary Table SI). Inorder to determine the stability of SEDDS formulation in thesolution, SEDDS formulation has been dispersed in transportbuffer and stored at 4°C for 3 weeks. After 3 weeks, the meandroplet size, PI, and Zeta potential values were not significantlydifferent from the original values, and were 234±5 nm, 0.35±0.02, and −28±3, respectively. Detailed characterization of theSEDDS formulation has been published previously (39,46).
Intravenous Pharmacokinetic Studies
The mean plasma concentrations versus time profiles ofδ-T3 and γ-T3 following i.v. administration to rats are shownin Supplementary Fig. S1, and the associated pharmacokineticparameters are presented in Table I. A two-compartmentmodel provided the best fit of the data for both compounds.Both δ-T3 and γ-T3 exhibited bi-exponential pharmacokinet-ics in plasma and the apparent terminal elimination phase waswell defined 3 h post-dose. The volumes of distribution ofboth isoforms were significantly different where in the centralcompartment (Vc) δ-T3 and γ-T3 values were 0.08±0.01 and0.5±0.1 l/kg, respectively, while in the peripheral compart-ment (V2) were 0.2±0.02 and 0.95±0.01 l/kg, respectively.Such difference could be related to differences in theirbindings to α-tocopherol transfer protein (α-TTP). Availablestudies indicated the affinity of δ-T3 to α-TTP is relatively
Table I. Pharmacokinetic Parameters of δ-T3 and γ-T3 Following i.v.Administration of 10 mg/kg, and 1 mg/ml, Respectively (n04)
Pharmacokinetic parameter δ-T3 γ-T3
AUC, μg h/ml 29.3±2.4 5.7±0.6MRT, h 1.1±0.3 1.1±0.1Vc, l/kg 0.08±0.01 0.5±0.1V2, l/kg 0.2±0.01 0.95±0.01CL, l/h/kg 0.4±0.04 1.9±0.2T1/2, h 3±0.3 2.3±0.1
Each value represents the mean±SDMRT mean residence time, Vc central compartment volume ofdistribution, V2 peripheral compartment volume of distribution, CLsystemic clearance
Alqahtani et al.
higher than that of γ-T3 (47). The half-lives for δ-T3 and γ-T3were 3.1±0.3 and 2.3±0.12 h, respectively, and their clear-ances were 0.4±0.03 and 1.9±0.2 l/h/kg, respectively.Differences in rate of metabolism were reported to be higherfor γ-T3 than δ-T3 which may explain γ-T3 greater clearancecompared to δ-T3 (48).
Oral Bioavailability Studies
The mean plasma concentrations versus time profilesfollowing oral administration of different doses of δ-T3 (0.5, 2.5,25 mg/kg) and γ-T3 (0.05, 0.25, 2.5 mg/kg) as SEDDS orcommercially available capsules to fed rats are shown inSupplementary Fig. S2. The oral pharmacokinetic parameters ofδ-T3 following administration of both formulations are listed inTable II. Peak concentration (Cmax) and time of peak concentra-tion (Tmax) were obtained directly from individual plasmaconcentration–time profile of each rat. The area under the plasmaconcentration–time curve from time zero to time t was calculatedand the absolute bioavailability for each dose of δ-T3 and γ-T3from SEDDS and capsule was calculated using the followingequation:
F ¼ AUCoral AUCiv=ð Þ � Doseiv Doseoral=ð Þ½ �:As illustrated in Table II, plasma concentration of δ-T3
at all doses are significantly higher for rats administered withSEDDS formulation compared to capsules (P<0.05). TheCmax values for 0.5, 2.5, 25 mg/kg doses of δ-T3 from SEDDSwere192±7, 255±27, and 640±33 ng/ml, respectively, compared to 38±4, 69±6, and 460±96 ng/ml, respectively, from capsule. In addition,Table II lists corresponding AUC values from both formulationsat different doses. The AUC of 0.5, and 2.5 mg/kg of δ-T3 fromSEDDS were significantly higher compared to capsule (P<0.05),
whereas, the AUC of 25 mg/kg from SEDDS was highercompared to capsule but was not significant (P>0.05).Consequently, the bioavailability of δ-T3 was significantly higherwith 0.5 and 2.5 mg/kg doses administered with SEDDS, seven-and threefolds, respectively, compared to the same doses fromcapsule (Table II).
γ-T3 presents in both formulations in low amount (10% oftotal tocotrienols) and was analyzed to investigate SEDDSformulation on its bioavailability. The mean plasma concentra-tions versus time profiles of γ-T3 following oral administration inrats are shown in Supplementary Fig. S3, and the associatedpharmacokinetic parameters are presented in Table III. Therewere no significant differences in Cmax and AUC values of 0.05and 0.25 mg/kg from SEDDS and capsule. The low doses of γ-T3showed higher bioavailability compared to 2.5 mg/kg dose fromSEDDS and capsules. However, the Cmax and AUC values of2.5 mg/kg from SEDDS were significantly higher compared tocapsule (P<0.01). These findings demonstrated that δ-T3 and γ-T3 incorporated into SEDDS have different behavior whereunlike γ-T3 at low doses δ-T3 bioavailability was significantlyenhanced compared to capsule. This was evident by comparingthe AUC values of both isoforms at 2.5 mg/kg. At this dose, whilea significant difference between SEDDS and capsule wasobserved with δ-T3 and γ-T3, the effect of SEDDS formulationon δ-T3 bioavailability was more obvious compared to γ-T3(Tables II and III). Nevertheless, both isoforms delivered asSEDDS or capsules demonstrated nonlinear kinetics.
In Vitro Studies
Cell Uptake Studies of SEDDS, MM, and Capsule
Different concentrations in the ranges 1–25 μM (0.4–10 μg/ml) of δ-T3 and 0.1–2.5 μM (0.04–1 μg/ml) of γ-T3
Table II. Comparative Pharmacokinetic Parameters of δ-T3 Oral Absorption when Delivered as SEDDS or Capsule Following 0.5, 2.5, 25 mg/kg Oral Administration to Rats (n03)
Each value represents the mean±SD***P<0.001; significantly enhanced levels of δ-T3 delivered in SEDDS formulation compared to capsule at 0.5 and 2.5 mg/kg doses
Table III. Comparative Pharmacokinetic Parameters of γ-T3 Oral Absorption when Delivered as SEDDS or Capsule Following 0.05, 0.25, 2.5mg/kg Oral Administration to Rats (n03)
Each value represents the mean±SD**P<0.01, significantly enhanced levels of γ-T3 delivered in SEDDS formulation compared to capsule at 2.5 mg/kg dose
Nonlinear Absorption Kinetics of SEDDS Containing Tocotrienols
prepared as SEDDS, MM, or capsule were incubated withCaco2 cells for 45 min based on findings from previous work
(49). MM were used as they represent the end product ofingested oil in the intestinal lumen that is readily available forabsorption (1,49). As illustrated in Fig. 2, the cellularuptake of δ-T3 and γ-T3 prepared as SEDDS weresignificantly higher compared to the same concentrationsfrom MM or capsule (P<0.001). Vmax and KM for δ-T3and γ-T3 uptake from SEDDS, MM, and capsule werecalculated and showed higher values with SEDDS com-pared to other formulations. The Vmax value for δ-T3from SEDDS was significantly higher with 141±6 ng/mgprotein/45 min compared to 58±3.6 and 37.6±2.9 ng/mgprotein/45 min from MM and capsule, respectively. TheKM values for δ-T3 from SEDDS, MM, or capsule were26.6±2.5, 22.9±1.7, and 9.6±0.9 μM, respectively.Similarly, the Vmax value for γ-T3 from SEDDS wassignificantly higher with 10.9±2.1 ng/mg protein/45 com-pared to 5.3±1.2 and 3.7±0.9 ng/mg protein/45 min fromMM and capsule, respectively. The KM values for γ-T3from SEDDS, MM, or capsule were 2±0.3, 1.9±0.2, and1.2±0.1 μM, respectively. These uptake results demon-strated that incorporation of δ-T3 and γ-T3 into SEDDSformulation significantly increased overall cellular uptakeat high and low concentrations.
NPC1L1 Inhibition Studies
In our previous work, concentration-dependent stud-ies have been conducted with ezetimibe against γ-T3cellular uptake and showed that 50 μM of ezetimibe hasmaximum NPC1L1 inhibition effect (49). Based on thisfinding, different concentrations ranges of δ-T3 (1–25 μM)and γ-T3 (0.1–2.5 μM) prepared as SEDDS or capsulewith or without 50 μM of ezetimibe were tested and theresults are shown in Fig. 3. The cellular uptake of δ-T3and γ-T3 from SEDDS or capsule were significantlyreduced in presence of ezetimibe (P<0.05). Although,the uptake of both δ-T3 and γ-T3 from SEDDS is higherthan that from capsule, there was no difference in thepercent decrease (40–45%) in the uptake of δ-T3 and γ-T3 from SEDDS or capsule. These results further confirmthe major role of NPC1L1 in the uptake of γ-T3 (37), andto the uptake of δ-T3. In addition, this data demonstratethe limited effect of SEDDS formulation in reducingNPC1L1 interaction with tocotrienols.
Fig. 2. Cellular uptake (ng/mg protein/45 min) following incubation with various concentrations of a δ-T3and b γ-T3 loaded SEDDS, MM, or capsule. Each value represents the mean±SD from three independentexperiments
Fig. 3. Cellular uptake (in nanogram per milligram protein) followingincubation with various concentrations of a δ-T3 and b γ-T3 loadedSEDDS or capsule with or without 50 μM ezetimibe. Each valuerepresents the mean±SD from three independent experiments.*Indicates significantly different cellular uptake of δ-T3 and γ-T3from SEDDS with ezetimibe compared to its absence (P<0.05).**Indicates significantly different cellular uptake of δ-T3 and γ-T3from capsule with ezetimibe compared to its absence (P<0.01)
Alqahtani et al.
Passive Uptake Studies
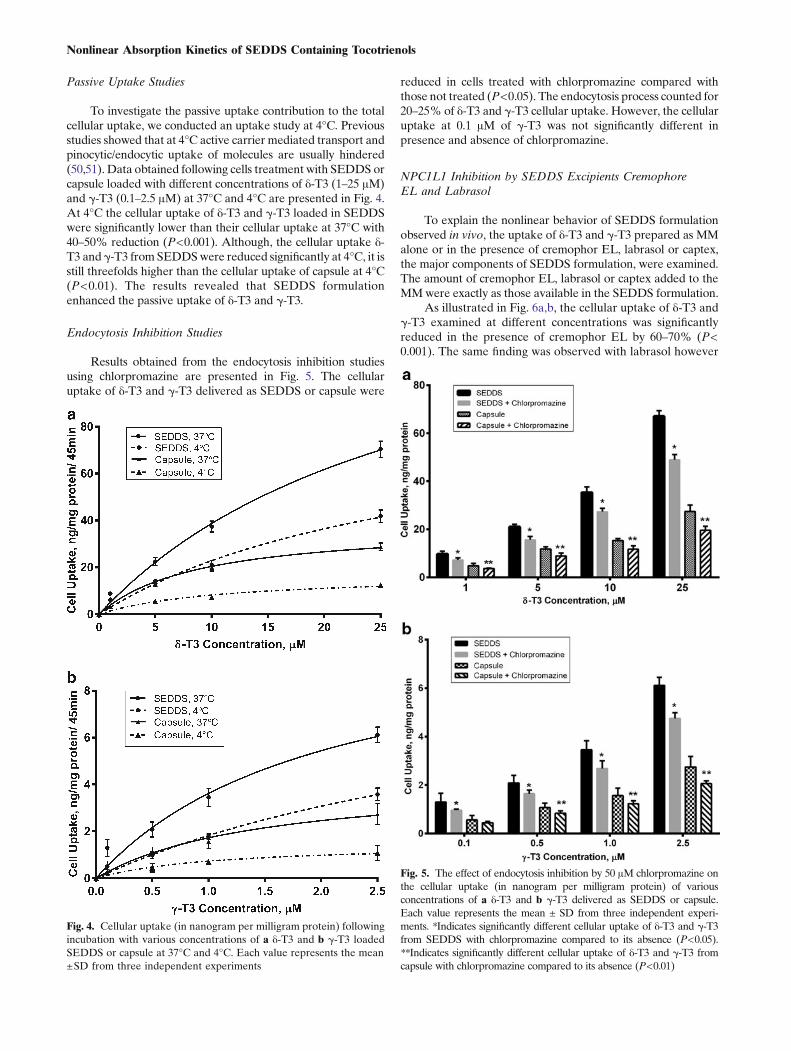
To investigate the passive uptake contribution to the totalcellular uptake, we conducted an uptake study at 4°C. Previousstudies showed that at 4°C active carrier mediated transport andpinocytic/endocytic uptake of molecules are usually hindered(50,51). Data obtained following cells treatment with SEDDS orcapsule loaded with different concentrations of δ-T3 (1–25 μM)and γ-T3 (0.1–2.5 μM) at 37°C and 4°C are presented in Fig. 4.At 4°C the cellular uptake of δ-T3 and γ-T3 loaded in SEDDSwere significantly lower than their cellular uptake at 37°C with40–50% reduction (P<0.001). Although, the cellular uptake δ-T3 and γ-T3 from SEDDSwere reduced significantly at 4°C, it isstill threefolds higher than the cellular uptake of capsule at 4°C(P<0.01). The results revealed that SEDDS formulationenhanced the passive uptake of δ-T3 and γ-T3.
Endocytosis Inhibition Studies
Results obtained from the endocytosis inhibition studiesusing chlorpromazine are presented in Fig. 5. The cellularuptake of δ-T3 and γ-T3 delivered as SEDDS or capsule were
reduced in cells treated with chlorpromazine compared withthose not treated (P<0.05). The endocytosis process counted for20–25% of δ-T3 and γ-T3 cellular uptake. However, the cellularuptake at 0.1 μM of γ-T3 was not significantly different inpresence and absence of chlorpromazine.
NPC1L1 Inhibition by SEDDS Excipients CremophoreEL and Labrasol
To explain the nonlinear behavior of SEDDS formulationobserved in vivo, the uptake of δ-T3 and γ-T3 prepared as MMalone or in the presence of cremophor EL, labrasol or captex,the major components of SEDDS formulation, were examined.The amount of cremophor EL, labrasol or captex added to theMMwere exactly as those available in the SEDDS formulation.
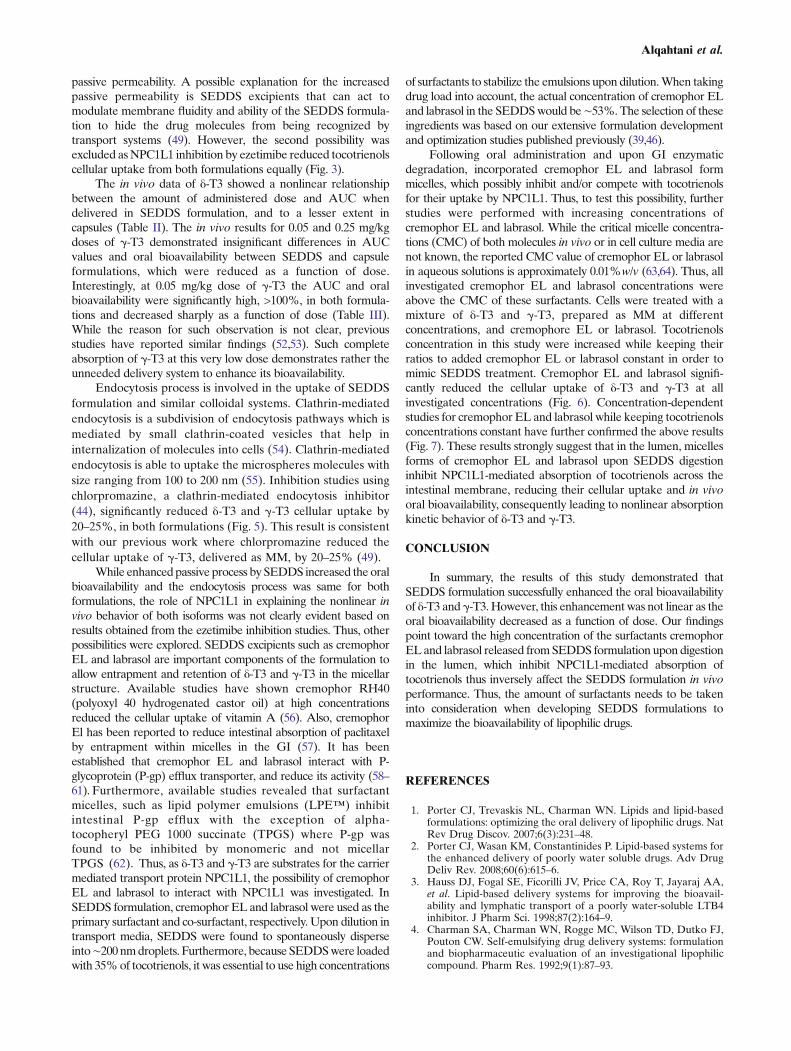
As illustrated in Fig. 6a,b, the cellular uptake of δ-T3 andγ-T3 examined at different concentrations was significantlyreduced in the presence of cremophor EL by 60–70% (P<0.001). The same finding was observed with labrasol however
Fig. 4. Cellular uptake (in nanogram per milligram protein) followingincubation with various concentrations of a δ-T3 and b γ-T3 loadedSEDDS or capsule at 37°C and 4°C. Each value represents the mean±SD from three independent experiments
Fig. 5. The effect of endocytosis inhibition by 50 μM chlorpromazine onthe cellular uptake (in nanogram per milligram protein) of variousconcentrations of a δ-T3 and b γ-T3 delivered as SEDDS or capsule.Each value represents the mean ± SD from three independent experi-ments. *Indicates significantly different cellular uptake of δ-T3 and γ-T3from SEDDS with chlorpromazine compared to its absence (P<0.05).**Indicates significantly different cellular uptake of δ-T3 and γ-T3 fromcapsule with chlorpromazine compared to its absence (P<0.01)
Nonlinear Absorption Kinetics of SEDDS Containing Tocotrienols
to a different extent compared to cremophore where labrasolsignificantly decreased the cellular uptake of δ-T3 and γ-T3by 70–85% (P<0.001) (Fig. 6c,d). Captex, on the other hand,did not show any effect on the cellular uptake of eitherisoform (data not shown).
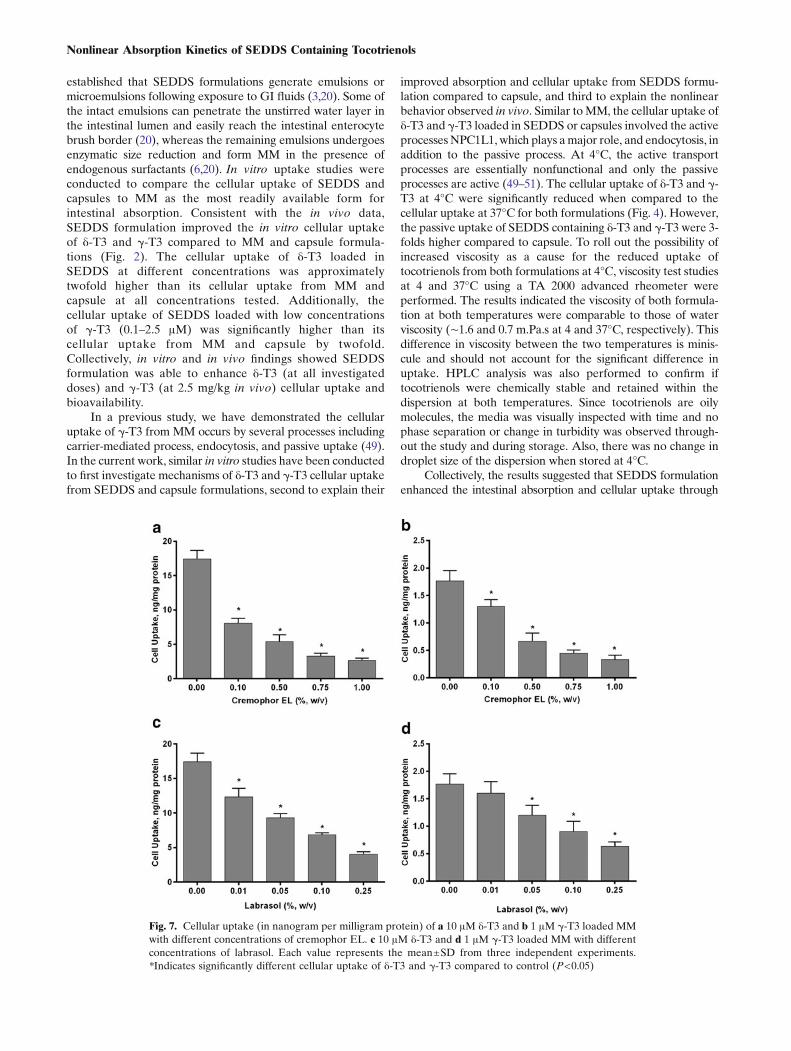
To further investigate the effect of cremophor EL andlabrasol on the cellular uptake of δ-T3 and γ-T3, weconducted concentration-dependent studies for bothcremophor EL and labrasol. Viability of the cells followingtreatment with different concentrations of cremophor EL orlabrasol was confirmed by visual inspection under themicroscope. Treated cells looked healthy at all concentrationsexcept with labrasol at concentrations larger than 0.25%(w/v) where cells de-attachment, a sign of toxicity, wasobserved. Thus, labrasol at concentrations higher than0.25% were not tested. Different concentrations ofcremophor EL (0.1–1.0%, w/v) with 10 μM δ-T3 and 1 μMγ-T3 loaded MM have been tested and the results are shownin Fig. 7a,b. As cremophor EL concentration increased, thecellular uptake of both δ-T3 and γ-T3 significantly decreasedcompared to the cellular uptake in absence of cremophor ELby 50% up to 85% reduction with higher concentration (P<0.001). Similarly, labrasol (0.01–0.25%, w/v) significantlyreduced the cellular uptake of δ-T3 and γ-T3 in concentrationdependent manner (30% to 75%) (Fig. 7c,d). These findingssuggested that the presence of cremophor EL or Labrasolmicelles significantly reduced the cellular uptake of δ-T3 andγ-T3 at high and low concentrations of δ-T3 and γ-T3.
DISCUSSION
Themain objective of the current study was to enhance thein vivo bioavailability of both tocotrienol isoforms. To do so, δ-T3 and γ-T3 were packaged in a SEDDS formulation, theninvestigated for their in vivo performance at different doses andwere compared to a commercially available product known asUNIQUE E®. Each soft gel capsule of this product contains125 mg tocotrienols, 90% of which is δ-T3 and the remaining10% is γ-T3. The SEDDS formulation showed significantlyhigher oral bioavailability for δ-T3 at 0.5 and 2.5 mg/kg dosesbut not at 25 mg/kg where no improvement was observedcompared to capsules. On the other hand, the bioavailability ofγ-T3 from SEDDS was similar to that from capsule at 0.05 and0.25mg/kg and significantly higher at 2.5mg/kg than the capsule.Collectively, these findings indicate that in the dose rangesinvestigated the effect of SEDDS on the enhanced bioavailabil-ity of δ-T3 is more pronounced than that for γ-T3. However, thissignificant improvement in the absorption of δ-T3 from SEDDS,and to a lesser extent for γ-T3, was found to display nonlinearkinetics (Tables II and III). As the in vivo data from the oraladministration studies demonstrated that oral clearances of bothvitaminE isoforms (0.03–0.04 and 0.2–0.25 l/h/kg for δ-T3 andγ-T3, respectively) and elimination half-lives (3.6–4.0 and 2.5–3.0 h for δ-T3 and γ-T3, respectively) are constant as a functionof dose, we hypothesized that the nonlinear characteristics couldbe explained by a saturable absorption process. Therefore, invitro studies were performed to test this hypothesis. It is well
Fig. 6. Cellular uptake (in nanogram per milligram protein) following incubation with variousconcentrations of a δ-T3 and b γ-T3 loaded MM in presence and absence of cremophor EL. c δ-T3 andd γ-T3 loaded MM in presence and absence of labrasol. Each value represents the mean±SD from threeindependent experiments. *Indicates significantly different cellular uptake of δ-T3 and γ-T3 in presenceand absence of cremophor EL or labrasol (P<0.05)
Alqahtani et al.
established that SEDDS formulations generate emulsions ormicroemulsions following exposure to GI fluids (3,20). Some ofthe intact emulsions can penetrate the unstirred water layer inthe intestinal lumen and easily reach the intestinal enterocytebrush border (20), whereas the remaining emulsions undergoesenzymatic size reduction and form MM in the presence ofendogenous surfactants (6,20). In vitro uptake studies wereconducted to compare the cellular uptake of SEDDS andcapsules to MM as the most readily available form forintestinal absorption. Consistent with the in vivo data,SEDDS formulation improved the in vitro cellular uptakeof δ-T3 and γ-T3 compared to MM and capsule formula-tions (Fig. 2). The cellular uptake of δ-T3 loaded inSEDDS at different concentrations was approximatelytwofold higher than its cellular uptake from MM andcapsule at all concentrations tested. Additionally, thecellular uptake of SEDDS loaded with low concentrationsof γ-T3 (0.1–2.5 μM) was significantly higher than itscellular uptake from MM and capsule by twofold.Collectively, in vitro and in vivo findings showed SEDDSformulation was able to enhance δ-T3 (at all investigateddoses) and γ-T3 (at 2.5 mg/kg in vivo) cellular uptake andbioavailability.
In a previous study, we have demonstrated the cellularuptake of γ-T3 from MM occurs by several processes includingcarrier-mediated process, endocytosis, and passive uptake (49).In the current work, similar in vitro studies have been conductedto first investigate mechanisms of δ-T3 and γ-T3 cellular uptakefrom SEDDS and capsule formulations, second to explain their
improved absorption and cellular uptake from SEDDS formu-lation compared to capsule, and third to explain the nonlinearbehavior observed in vivo. Similar toMM, the cellular uptake ofδ-T3 and γ-T3 loaded in SEDDS or capsules involved the activeprocessesNPC1L1, which plays amajor role, and endocytosis, inaddition to the passive process. At 4°C, the active transportprocesses are essentially nonfunctional and only the passiveprocesses are active (49–51). The cellular uptake of δ-T3 and γ-T3 at 4°C were significantly reduced when compared to thecellular uptake at 37°C for both formulations (Fig. 4). However,the passive uptake of SEDDS containing δ-T3 and γ-T3 were 3-folds higher compared to capsule. To roll out the possibility ofincreased viscosity as a cause for the reduced uptake oftocotrienols from both formulations at 4°C, viscosity test studiesat 4 and 37°C using a TA 2000 advanced rheometer wereperformed. The results indicated the viscosity of both formula-tion at both temperatures were comparable to those of waterviscosity (∼1.6 and 0.7 m.Pa.s at 4 and 37°C, respectively). Thisdifference in viscosity between the two temperatures is minis-cule and should not account for the significant difference inuptake. HPLC analysis was also performed to confirm iftocotrienols were chemically stable and retained within thedispersion at both temperatures. Since tocotrienols are oilymolecules, the media was visually inspected with time and nophase separation or change in turbidity was observed through-out the study and during storage. Also, there was no change indroplet size of the dispersion when stored at 4°C.
Collectively, the results suggested that SEDDS formulationenhanced the intestinal absorption and cellular uptake through
Fig. 7. Cellular uptake (in nanogram per milligram protein) of a 10 μM δ-T3 and b 1 μM γ-T3 loaded MMwith different concentrations of cremophor EL. c 10 μM δ-T3 and d 1 μM γ-T3 loaded MM with differentconcentrations of labrasol. Each value represents the mean±SD from three independent experiments.*Indicates significantly different cellular uptake of δ-T3 and γ-T3 compared to control (P<0.05)
Nonlinear Absorption Kinetics of SEDDS Containing Tocotrienols
passive permeability. A possible explanation for the increasedpassive permeability is SEDDS excipients that can act tomodulate membrane fluidity and ability of the SEDDS formula-tion to hide the drug molecules from being recognized bytransport systems (49). However, the second possibility wasexcluded asNPC1L1 inhibition by ezetimibe reduced tocotrienolscellular uptake from both formulations equally (Fig. 3).
The in vivo data of δ-T3 showed a nonlinear relationshipbetween the amount of administered dose and AUC whendelivered in SEDDS formulation, and to a lesser extent incapsules (Table II). The in vivo results for 0.05 and 0.25 mg/kgdoses of γ-T3 demonstrated insignificant differences in AUCvalues and oral bioavailability between SEDDS and capsuleformulations, which were reduced as a function of dose.Interestingly, at 0.05 mg/kg dose of γ-T3 the AUC and oralbioavailability were significantly high, >100%, in both formula-tions and decreased sharply as a function of dose (Table III).While the reason for such observation is not clear, previousstudies have reported similar findings (52,53). Such completeabsorption of γ-T3 at this very low dose demonstrates rather theunneeded delivery system to enhance its bioavailability.
Endocytosis process is involved in the uptake of SEDDSformulation and similar colloidal systems. Clathrin-mediatedendocytosis is a subdivision of endocytosis pathways which ismediated by small clathrin-coated vesicles that help ininternalization of molecules into cells (54). Clathrin-mediatedendocytosis is able to uptake the microspheres molecules withsize ranging from 100 to 200 nm (55). Inhibition studies usingchlorpromazine, a clathrin-mediated endocytosis inhibitor(44), significantly reduced δ-T3 and γ-T3 cellular uptake by20–25%, in both formulations (Fig. 5). This result is consistentwith our previous work where chlorpromazine reduced thecellular uptake of γ-T3, delivered as MM, by 20–25% (49).
While enhancedpassive process by SEDDS increased the oralbioavailability and the endocytosis process was same for bothformulations, the role of NPC1L1 in explaining the nonlinear invivo behavior of both isoforms was not clearly evident based onresults obtained from the ezetimibe inhibition studies. Thus, otherpossibilities were explored. SEDDS excipients such as cremophorEL and labrasol are important components of the formulation toallow entrapment and retention of δ-T3 and γ-T3 in the micellarstructure. Available studies have shown cremophor RH40(polyoxyl 40 hydrogenated castor oil) at high concentrationsreduced the cellular uptake of vitamin A (56). Also, cremophorEl has been reported to reduce intestinal absorption of paclitaxelby entrapment within micelles in the GI (57). It has beenestablished that cremophor EL and labrasol interact with P-glycoprotein (P-gp) efflux transporter, and reduce its activity (58–61). Furthermore, available studies revealed that surfactantmicelles, such as lipid polymer emulsions (LPE™) inhibitintestinal P-gp efflux with the exception of alpha-tocopheryl PEG 1000 succinate (TPGS) where P-gp wasfound to be inhibited by monomeric and not micellarTPGS (62). Thus, as δ-T3 and γ-T3 are substrates for the carriermediated transport protein NPC1L1, the possibility of cremophorEL and labrasol to interact with NPC1L1 was investigated. InSEDDS formulation, cremophor EL and labrasol were used as theprimary surfactant and co-surfactant, respectively. Upon dilution intransport media, SEDDS were found to spontaneously disperseinto∼200nmdroplets. Furthermore, because SEDDSwere loadedwith 35%of tocotrienols, it was essential to use high concentrations
of surfactants to stabilize the emulsions upon dilution.When takingdrug load into account, the actual concentration of cremophor ELand labrasol in the SEDDSwould be∼53%.The selection of theseingredients was based on our extensive formulation developmentand optimization studies published previously (39,46).
Following oral administration and upon GI enzymaticdegradation, incorporated cremophor EL and labrasol formmicelles, which possibly inhibit and/or compete with tocotrienolsfor their uptake by NPC1L1. Thus, to test this possibility, furtherstudies were performed with increasing concentrations ofcremophor EL and labrasol. While the critical micelle concentra-tions (CMC) of both molecules in vivo or in cell culture media arenot known, the reported CMC value of cremophor EL or labrasolin aqueous solutions is approximately 0.01%w/v (63,64). Thus, allinvestigated cremophor EL and labrasol concentrations wereabove the CMC of these surfactants. Cells were treated with amixture of δ-T3 and γ-T3, prepared as MM at differentconcentrations, and cremophore EL or labrasol. Tocotrienolsconcentration in this study were increased while keeping theirratios to added cremophor EL or labrasol constant in order tomimic SEDDS treatment. Cremophor EL and labrasol signifi-cantly reduced the cellular uptake of δ-T3 and γ-T3 at allinvestigated concentrations (Fig. 6). Concentration-dependentstudies for cremophor EL and labrasol while keeping tocotrienolsconcentrations constant have further confirmed the above results(Fig. 7). These results strongly suggest that in the lumen, micellesforms of cremophor EL and labrasol upon SEDDS digestioninhibit NPC1L1-mediated absorption of tocotrienols across theintestinal membrane, reducing their cellular uptake and in vivooral bioavailability, consequently leading to nonlinear absorptionkinetic behavior of δ-T3 and γ-T3.
CONCLUSION
In summary, the results of this study demonstrated thatSEDDS formulation successfully enhanced the oral bioavailabilityof δ-T3 and γ-T3.However, this enhancement was not linear as theoral bioavailability decreased as a function of dose. Our findingspoint toward the high concentration of the surfactants cremophorELand labrasol released fromSEDDS formulation upon digestionin the lumen, which inhibit NPC1L1-mediated absorption oftocotrienols thus inversely affect the SEDDS formulation in vivoperformance. Thus, the amount of surfactants needs to be takeninto consideration when developing SEDDS formulations tomaximize the bioavailability of lipophilic drugs.
REFERENCES
1. Porter CJ, Trevaskis NL, Charman WN. Lipids and lipid-basedformulations: optimizing the oral delivery of lipophilic drugs. NatRev Drug Discov. 2007;6(3):231–48.
2. Porter CJ, Wasan KM, Constantinides P. Lipid-based systems forthe enhanced delivery of poorly water soluble drugs. Adv DrugDeliv Rev. 2008;60(6):615–6.
3. Hauss DJ, Fogal SE, Ficorilli JV, Price CA, Roy T, Jayaraj AA,et al. Lipid-based delivery systems for improving the bioavail-ability and lymphatic transport of a poorly water-soluble LTB4inhibitor. J Pharm Sci. 1998;87(2):164–9.
4. Charman SA, Charman WN, Rogge MC, Wilson TD, Dutko FJ,Pouton CW. Self-emulsifying drug delivery systems: formulationand biopharmaceutic evaluation of an investigational lipophiliccompound. Pharm Res. 1992;9(1):87–93.
Alqahtani et al.
5. Pouton CW. Formulation of poorly water-soluble drugs for oraladministration: physicochemical and physiological issues and thelipid formulation classification system. Eur J Pharm Sci Off J EurFed Pharm Sci. 2006;29(3–4):278–87.
6. O’Driscoll CM. Lipid-based formulations for intestinal lymphaticdelivery. Eur J PharmSciOff JEur Fed PharmSci. 2002;15(5):405–15.
7. Larsen A, Holm R, Pedersen ML, Mullertz A. Lipid-basedformulations for danazol containing a digestible surfactant,Labrafil M2125CS: in vivo bioavailability and dynamic in vitrolipolysis. Pharm Res. 2008;25(12):2769–77.
8. Karpf DM, Holm R, Kristensen HG, Mullertz A. Influence ofthe type of surfactant and the degree of dispersion on thelymphatic transport of halofantrine in conscious rats. Pharm Res.2004;21(8):1413–8.
9. Trevaskis NL, Charman WN, Porter CJ. Lipid-based deliverysystems and intestinal lymphatic drug transport: a mechanisticupdate. Adv Drug Deliv Rev. 2008;60(6):702–16.
10. Trevaskis NL, McEvoy CL, McIntosh MP, Edwards GA,Shanker RM, Charman WN, et al. The role of the intestinallymphatics in the absorption of two highly lipophilic cholesterolester transfer protein inhibitors (CP524,515 and CP532,623).Pharm Res. 2010;27(5):878–93.
11. Holm R, Hoest J. Successful in silico predicting of intestinallymphatic transfer. Int J Pharm. 2004;272(1–2):189–93.
12. Porter CJ, Kaukonen AM, Boyd BJ, Edwards GA, CharmanWN. Susceptibility to lipase-mediated digestion reduces the oralbioavailability of danazol after administration as a medium-chainlipid-based microemulsion formulation. Pharm Res.2004;21(8):1405–12.
13. Sek L, Boyd BJ, Charman WN, Porter CJ. Examination of theimpact of a range of Pluronic surfactants on the in-vitrosolubilisation behaviour and oral bioavailability of lipidic formu-lations of atovaquone. J Pharm Pharmacol. 2006;58(6):809–20.
14. Yap SP, Yuen KH. Influence of lipolysis and droplet size ontocotrienol absorption from self-emulsifying formulations. Int JPharm. 2004;281(1–2):67–78.
15. Han SF, Yao TT, Zhang XX, Gan L, Zhu C, Yu HZ, et al. Lipid-based formulations to enhance oral bioavailability of the poorlywater-soluble drug anethol trithione: effects of lipid compositionand formulation. Int J Pharm. 2009;379(1):18–24.
16. Constantinides PP. Lipid microemulsions for improving drugdissolution and oral absorption: physical and biopharmaceuticalaspects. Pharm Res. 1995;12(11):1561–72.
17. Balakrishnan P, Lee BJ, Oh DH, Kim JO, Hong MJ, Jee JP, et al.Enhanced oral bioavailability of dexibuprofen by a novel solidself-emulsifying drug delivery system (SEDDS). Eur J PharmBiopharm: Official Journal of Arbeitsgemeinschaft furPharmazeutische Verfahrenstechnik eV. 2009;72(3):539–45.
18. Gao P, Morozowich W. Development of supersaturatable self-emulsifying drug delivery system formulations for improving theoral absorption of poorly soluble drugs. Expert Opin Drug Deliv.2006;3(1):97–110.
19. Pouton CW. Lipid formulations for oral administration of drugs:non-emulsifying, self-emulsifying and ‘self-microemulsifying’drug delivery systems. Eur J Pharm Sci Off J Eur Fed PharmSci. 2000;11 Suppl 2:S93–8.
20. Hauss DJ. Oral lipid-based formulations. Adv Drug Deliv Rev.2007;59(7):667–76.
21. Pouton CW, Porter CJ. Formulation of lipid-based deliverysystems for oral administration: materials, methods and strate-gies. Adv Drug Deliv Rev. 2008;60(6):625–37.
22. Cuine JF, Charman WN, Pouton CW, Edwards GA, Porter CJ.Increasing the proportional content of surfactant (CremophorEL) relative to lipid in self-emulsifying lipid-based formulationsof danazol reduces oral bioavailability in beagle dogs. PharmRes. 2007;24(4):748–57.
23. Aggarwal BB, Sundaram C, Prasad S, Kannappan R.Tocotrienols, the vitamin E of the 21st century: its potentialagainst cancer and other chronic diseases. Biochem Pharmacol.2010;80(11):1613–31.
24. Sen CK, Khanna S, Roy S. Tocotrienols in health and disease:the other half of the natural vitamin E family. Mol Asp Med.2007;28(5–6):692–728.
25. Wong RS, Radhakrishnan AK, Ibrahim TA, Cheong SK. Delta-and gamma-tocotrienols induce classical ultrastructural apoptotic
changes in human T lymphoblastic leukemic cells. MicroscMicroanal Off J Microsc Soc Am Microbeam Anal Soc MicroscSoc Can. 2012;18(3):462–9.
26. Ji X, Wang Z, Sarkar FH, Gupta SV. Delta-tocotrienol augmentscisplatin-induced suppression of non-small cell lung cancer cellsvia inhibition of the Notch-1 pathway. Anticancer Res.2012;32(7):2647–55.
27. Ji X, Wang Z, Geamanu A, Goja A, Sarkar FH, Gupta SV.Delta-tocotrienol suppresses Notch-1 pathway by upregulatingmiR-34a in nonsmall cell lung cancer cells. Int J Cancer.2012;131(11):2668–77.
28. Fernandes NV, Guntipalli PK, Mo H. d-delta-Tocotrienol-mediated cell cycle arrest and apoptosis in human melanomacells. Anticancer Res. 2010;30(12):4937–44.
29. Shibata A, Nakagawa K, Sookwong P, Tsuduki T, Asai A,Miyazawa T. alpha-Tocopherol attenuates the cytotoxic effect ofdelta-tocotrienol in human colorectal adenocarcinoma cells.Biochem Biophys Res Commun. 2010;397(2):214–9.
30. McIntyre BS, Briski KP, Gapor A, Sylvester PW.Antiproliferative and apoptotic effects of tocopherols andtocotrienols on preneoplastic and neoplastic mouse mammaryepithelial cells. Proc Soc Exp Biol Med Soc Exp Biol Med.2000;224(4):292–301.
31. Brooks R, Kalia P, Ireland DC, Beeton C, Rushton N. Directinhibition of osteoclast formation and activity by the vitamin Eisomer gamma-tocotrienol. Int J Vit Nutr Res InternationaleZeitschrift fur Vitamin- und Ernahrungsforschung Journal inter-national de vitaminologie et de nutrition. 2011;81(6):358–67.
32. Zaiden N, Yap WN, Ong S, Xu CH, Teo VH, Chang CP, et al.Gamma delta tocotrienols reduce hepatic triglyceride synthesis andVLDL secretion. J Atheroscler Thromb. 2010;17(10):1019–32.
33. Constantinou C, Neophytou CM, Vraka P, Hyatt JA, Papas KA,Constantinou AI. Induction of DNA damage and caspase-independent programmed cell death by vitamin E. NutrCancer. 2012;64(1):136–52.
34. Kani K, Momota Y, Harada M, Yamamura Y, Aota K, YamanoiT, et al. gamma-tocotrienol enhances the chemosensitivity ofhuman oral cancer cells to docetaxel through the downregulationof the expression of NF-kappaB-regulated anti-apoptotic geneproducts. Int J Oncol. 2013;42(1):75–82.
35. Gupta SC, Kim JH, Prasad S, Aggarwal BB. Regulation ofsurvival, proliferation, invasion, angiogenesis, and metastasis oftumor cells through modulation of inflammatory pathways bynutraceuticals. Cancer Metastasis Rev. 2010;29(3):405–34.
36. Yap SP, Yuen KH, Lim AB. Influence of route of administrationon the absorption and disposition of alpha-, gamma- and delta-tocotrienols in rats. J Pharm Pharmacol. 2003;55(1):53–8.
37. Abuasal B, Sylvester PW, Kaddoumi A. Intestinal absorption ofgamma-tocotrienol is mediated by Niemann–Pick C1-like 1: insitu rat intestinal perfusion studies. Drug Metab Dispos Biol FateChem. 2010;38(6):939–45.
38. Yap SP, Yuen KH, Wong JW. Pharmacokinetics and bioavail-ability of alpha-, gamma- and delta-tocotrienols under differentfood status. J Pharm Pharmacol. 2001;53(1):67–71.
39. Alayoubi A, Satyanarayanajois SD, Sylvester PW, Nazzal S.Molecular modelling and multisimplex optimization oftocotrienol-rich self emulsified drug delivery systems. Int JPharm. 2012;426(1–2):153–61.
40. Narushima K, Takada T, Yamanashi Y, Suzuki H. Niemann–PickC1-like 1 mediates alpha-tocopherol transport. Mol Pharmacol.2008;74(1):42–9.
41. Abuasal BS, Qosa H, Sylvester PW, Kaddoumi A. Comparison ofthe intestinal absorption and bioavailability of gamma-tocotrienoland alpha-tocopherol: in vitro, in situ and in vivo studies. BiopharmDrug Dispos. 2012;33(5):246–56.
42. Davis HR, Veltri EP. Zetia: inhibition of Niemann–Pick C1 Like1 (NPC1L1) to reduce intestinal cholesterol absorption and treathyperlipidemia. J Atheroscler Thromb. 2007;14(3):99–108.
43. Yu L. The structure and function of Niemann–Pick C1-like 1protein. Curr Opin Lipidol. 2008;19(3):263–9.
44. Durymanov MO, Beletkaia EA, Ulasov AV, Khramtsov YV,Trusov GA, Rodichenko NS, et al. Subcellular trafficking andtransfection efficacy of polyethylenimine-polyethylene glycolpolyplex nanoparticles with a ligand to melanocortin receptor-1. JControl Release Off J Control Release Soc. 2012;163(2):211–9.
Nonlinear Absorption Kinetics of SEDDS Containing Tocotrienols
45. Abuasal B, Thomas S, Sylvester PW, Kaddoumi A. Developmentand validation of a reversed-phase HPLC method for the determi-nation of gamma-tocotrienol in rat and human plasma. BiomedChromatogr BMC. 2011;25(5):621–7.
46. Ali H, Nazzal M, Zaghloul AA, Nazzal S. Comparison betweenlipolysis and compendial dissolution as alternative techniques forthe in vitro characterization of alpha-tocopherol self-emulsifieddrug delivery systems (SEDDS). Int J Pharm. 2008;352(1–2):104–14.
47. Upadhyay J, Misra K. Towards the interaction mechanism oftocopherols and tocotrienols (vitamin E) with selected metabo-lizing enzymes. Bioinformation. 2009;3(8):326–31.
48. Sontag TJ, Parker RS. Influence of major structural features oftocopherols and tocotrienols on their omega-oxidation bytocopherol-omega-hydroxylase. J Lipid Res. 2007;48(5):1090–8.
49. Abuasal BS, Lucas C, Peyton B, Alayoubi A, Nazzal S, SylvesterPW, et al. Enhancement of intestinal permeability utilizing solidlipid nanoparticles increases gamma-tocotrienol oral bioavail-ability. Lipids. 2012;47(5):461–9.
50. Hu Y, Litwin T, Nagaraja AR, Kwong B, Katz J, Watson N, et al.Cytosolic delivery of membrane-impermeable molecules indendritic cells using pH-responsive core-shell nanoparticles.Nano Lett. 2007;7(10):3056–64.
51. Tomoda H, Kishimoto Y, Lee YC. Temperature effect onendocytosis and exocytosis by rabbit alveolar macrophages. JBiol Chem. 1989;264(26):15445–50.
52. Ward KW, Azzarano LM, Evans CA, Smith BR. Apparentabsolute oral bioavailability in excess of 100% for a vitronectinreceptor antagonist (SB-265123) in rat. I. Investigation ofpotential experimental and mechanistic explanations.Xenobiotica Fate Foreign Comp Biol Syst. 2004;34(4):353–66.
53. Ward KW, Hardy LB, Kehler JR, Azzarano LM, Smith BR.Apparent absolute oral bioavailability in excess of 100% for avitronectin receptor antagonist (SB-265123) in rat. II. Studiesimplicating transporter-mediated intestinal secretion.Xenobiotica Fate Foreign Comp Biol Syst. 2004;34(4):367–77.
54. Wang LH, Rothberg KG, Anderson RG. Mis-assembly ofclathrin lattices on endosomes reveals a regulatory switch forcoated pit formation. J Cell Biol. 1993;123(5):1107–17.
55. Rejman J, Oberle V, Zuhorn IS, Hoekstra D. Size-dependentinternalization of particles via the pathways of clathrin- andcaveolae-mediated endocytosis. Biochem J. 2004;377(Pt 1):159–69.
56. Karpf DM, Holm R, Garafalo C, Levy E, Jacobsen J, MullertzA. Effect of different surfactants in biorelevant medium on thesecretion of a lipophilic compound in lipoproteins using Caco-2cell culture. J Pharm Sci. 2006;95(1):45–55.
57. Bardelmeijer HA, Ouwehand M, Malingre MM, Schellens J,Beijnen JH, van Tellingen O. Entrapment by Cremophor ELdecreases the absorption of paclitaxel from the gut. CancerChemother Pharmacol. 2002;49(2):119–25.
58. Rege BD, Kao JP, Polli JE. Effects of nonionic surfactants onmembrane transporters in Caco-2 cell monolayers. Eur J PharmSci Off J Eur Fed Pharm Sci. 2002;16(4–5):237–46.
59. Shono Y, Nishihara H, Matsuda Y, Furukawa S, Okada N, FujitaT, et al. Modulation of intestinal P-glycoprotein function bycremophor EL and other surfactants by an in vitro diffusionchamber method using the isolated rat intestinal membranes. JPharm Sci. 2004;93(4):877–85.
60. Lin Y, ShenQ, Katsumi H, OkadaN, Fujita T, Jiang X, et al. Effectsof Labrasol and other pharmaceutical excipients on the intestinaltransport and absorption of rhodamine123, a P-glycoproteinsubstrate, in rats. Biol Pharm Bull. 2007;30(7):1301–7.
61. Nerurkar MM, Burton PS, Borchardt RT. The use of surfactantsto enhance the permeability of peptides through Caco-2 cells byinhibition of an apically polarized efflux system. Pharm Res.1996;13(4):528–34.
62. Constantinides PP, Wasan KM. Lipid formulation strategies forenhancing intestinal transport and absorption of P-glycoprotein(P-gp) substrate drugs: in vitro/in vivo case studies. J Pharm Sci.2007;96(2):235–48.
63. Kessel D. Properties of cremophor EL micelles probed byfluorescence. Photochem Photobiol. 1992;56(4):447–51.
64. Koga K, Kusawake Y, Ito Y, Sugioka N, Shibata N, Takada K.Enhancing mechanism of Labrasol on intestinal membranepermeability of the hydrophilic drug gentamicin sulfate. Eur JPharm Biopharm: Off J Arbe i t sgemeinschaf t furPharmazeutische Verfahrenstechnik eV. 2006;64(1):82–91.