Page 1
1
Nonlinear desorption activation energy from TPD curves:
analysis of the influence of initial values for the regression
procedure
Carlo Pirola1, Alessandro Di Michele2
1Università degli Studi di Milano, Dipartimento di Chimica, via Golgi 19 - 20133 Milano (Italy)
3Università degli Studi di Perugia, Dipartimento di Fisica e Geologia, via Pascoli – 06123
Perugia (Italy)
*To whom correspondence should be addressed
Tel: ++39/0250314283
Fax: ++39/0250314300
E-mail: [email protected]
Page 2
2
Abstract
Thermal Programmed Desorption (TPD) is a powerful technique for materials and catalysts
characterization. By analysing TPD curves it is possible to calculate important parameters as the
desorption activation energy 𝐸𝑑, that depends on the surface coverage (𝜃) by a non linear polynomial
function, i.e. 𝐸𝑑(𝜃) = ∑ 𝛼𝑘(1 − 𝜃)𝑘𝑁𝑘=0 .
The Polanyi-Wigner equation −𝑑𝜃
𝑑𝑇= (
𝐴(𝜃)
𝛽) 𝜃𝑛𝑒𝑥𝑝 (
−𝐸𝑑(𝜃)
𝑅𝑇) can be used as theoretical basis to
calculate this parameter, by a fitting regression procedure starting from experimental TPD data.
Different degrees (k) for this polynomial equation and different initial values of the frequency factor
𝐴(𝜃) were considered and discussed to obtain univocal value of desorption energy.
Three different Pt and Co based catalysts, suitable for hydrogenation reactions, have been considered
as case studies for the application and validation of the proposed calculation procedure.
Keywords: TPD, Desorption Energy, Polanyi-Wigner equation, Regression, Initial values.
Page 3
3
1. Introduction
Temperature Programmed Desorption (TPD) is a well known technique for materials and
heterogeneous catalysts characterization [1], usually coupled with Temperature Programmed
Reduction (TPR) [2] experiments. Several reviews discussed the usefulness of TPD and its principles
[3,4]. Typically, in a TPD experiment we put a small amount of sample in a quartz reactor located in a
furnace. The first operation is to flow the catalyst with an inert gas to clean the surface. Then a reacting
gas is continuously sent to the reactor and it is adsorbed on the catalyst surface, depending on its
chemico-physical properties. Subsequently, the temperature of the catalyst is increased using a carrier
gas flow, with a temperature program β(t) = dT/dt (with the temperature T usually being a linear
function of the time t). The change of composition of the exiting gas, desorbed from the surface upon
heating, is quantified with a TCD detector as a function of temperature. Thermal transient techniques
can be used for the determination of detailed kinetics of adsorption, desorption and surface reaction
phenomena [5][6].
Adsorption phenomena occur if the attractive interaction between a molecule and a surface overcomes
the disordering effect due to thermal motion. Physisorption takes place when the attractive force is
the result of van-der-Waals attractions and the dissociation energy is approximately 50 kJ/mol[4].
Differently, chemisorption phenomena should be considered when chemical bonds are formed and
they are characterised by dissociation energies greater than 50 kJ/mol [4]. An important characteristic
of molecular chemisorption is the dissociation of the adsorbed molecules due to the weakening of
intramolecular bonds.
TPD curves can be interpreted for the determination of kinetic and thermodynamic parameters of
desorption processes, as the frequency factor and desorption activation energy [7] [8]. An example of
application of this concept is reported in Kanervo et al. [4] where the combination of TPD experiments
and kinetic analysis were used for studying microkinetics of heterogeneous porous catalysts.
Complex shape TPD curves and multiple peaks often characterize thermal gas desorptions of catalysts
with heterogeneous surfaces, as metal oxides, polycrystalline metals [9]. These TPD diagrams are
Page 4
4
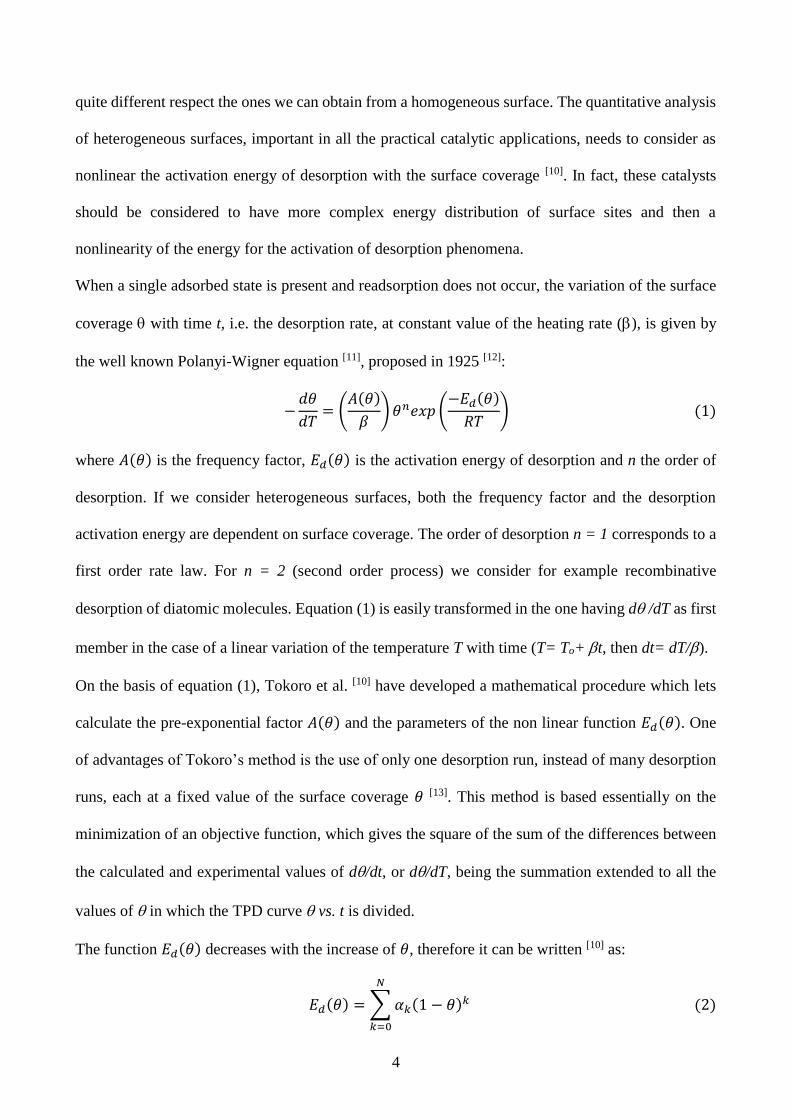
quite different respect the ones we can obtain from a homogeneous surface. The quantitative analysis
of heterogeneous surfaces, important in all the practical catalytic applications, needs to consider as
nonlinear the activation energy of desorption with the surface coverage [10]. In fact, these catalysts
should be considered to have more complex energy distribution of surface sites and then a
nonlinearity of the energy for the activation of desorption phenomena.
When a single adsorbed state is present and readsorption does not occur, the variation of the surface
coverage with time t, i.e. the desorption rate, at constant value of the heating rate (), is given by
the well known Polanyi-Wigner equation [11], proposed in 1925 [12]:
−𝑑𝜃
𝑑𝑇= (
𝐴(𝜃)
𝛽) 𝜃𝑛𝑒𝑥𝑝 (
−𝐸𝑑(𝜃)
𝑅𝑇) (1)
where 𝐴(𝜃) is the frequency factor, 𝐸𝑑(𝜃) is the activation energy of desorption and n the order of
desorption. If we consider heterogeneous surfaces, both the frequency factor and the desorption
activation energy are dependent on surface coverage. The order of desorption n = 1 corresponds to a
first order rate law. For n = 2 (second order process) we consider for example recombinative
desorption of diatomic molecules. Equation (1) is easily transformed in the one having d /dT as first
member in the case of a linear variation of the temperature T with time (T= To+ t, then dt= dT/).
On the basis of equation (1), Tokoro et al. [10] have developed a mathematical procedure which lets
calculate the pre-exponential factor 𝐴(𝜃) and the parameters of the non linear function 𝐸𝑑(𝜃). One
of advantages of Tokoro’s method is the use of only one desorption run, instead of many desorption
runs, each at a fixed value of the surface coverage 𝜃 [13]. This method is based essentially on the
minimization of an objective function, which gives the square of the sum of the differences between
the calculated and experimental values of d/dt, or d/dT, being the summation extended to all the
values of in which the TPD curve vs. t is divided.
The function 𝐸𝑑(𝜃) decreases with the increase of 𝜃, therefore it can be written [10] as:
𝐸𝑑(𝜃) = ∑ 𝛼𝑘(1 − 𝜃)𝑘
𝑁
𝑘=0
(2)
Page 5
5
where 𝛼𝑘 values have the dimension of energy, for example kJ/mol, 𝑘 is an integer number and N is
an integer able to optimize the 𝐸𝑑(𝜃) function. The best value of N is really one of the key points of
Tokoro’s method. In fact, it is indicated [10] that “a large N is deliverable, but if N is too large it could
give meaningless results”, but no criteria have been indicated to avoid uncertainty in the results.
The novelty of the present paper is the discussion and analysis of a very particular case-study of
regression based calculation, i.e. the right evaluation of desorption energy for heterogeneous surfaces,
starting from experimental TPD data. The Polanyi-Wigner is an equation largely used but the robust
regression of his parameters is not reported. The comparison of the results obtained by a robust or not
robust regression procedure can be useful to quantify the advantage of an improved calculation
procedure to obtain univocal parameters.
In another paper [14], equation (1) was considered to evaluate the desorption energy distribution, using
a complex numerical algorithm containing a key parameter () which, as N, must not be very low or
very high; again such indication produces uncertainty in the results.
Falconer and Schwarz, discussing in their review [13] the desorption and readsorption effects in the
TPD experiments, derived the equation:
−𝑑𝜃
𝑑𝑇=
𝐹
𝛽(
𝑘𝑑(𝜃)𝜃𝑛
𝐹 + 𝑉𝐶𝑉𝑚𝑘𝑎(1 − 𝜃)𝑃) (3)
where F is the volumetric flow rate of the carrier gas, Vc is the total solid volume, ka and kd the
adsorption and desorption kinetic parameters, n and p the order of the desorption and adsorption, Vm
the number of surface sites per unit solid volume. Equation (3) reduces to equation (1) if 𝐹 ≫
𝑉𝐶𝑉𝑚𝑘𝑎(1 − 𝜃)𝑃, i.e. if the readsorption is small. In this case the term −𝑑𝜃
𝑑𝑇 does not depend from the
flow rate of the carrier gas. We have experimentally verified that for our experimental TPD
measurements this is the case. In fact, changing F from 10 to 30 ml min-1 both the shape and the
temperature peak (𝜃 vs. time or 𝜃 vs. temperature) do not change significantly. Moreover, we have
verified that internal diffusion of the desorbing gas is not rate limiting. This experiment has been
made by using the catalyst having particles diameter in the range 105-149 µm (100- 140 mesh) and
Page 6
6
60-68 µm (220-240 mesh). The results show that no difference appears in the shape and temperature
peak of TPD curve. Therefore we conclude that equation (1) is suitable to interpret our results.
As discussed in detail by Luna et al. [15], different approaches are reported in literature to obtain 𝐸𝑑(𝜃)
by the Polanyi-Wigner equation. The easiest method considers this parameter as linear respect the
coverage degree [16] and the 𝐸𝑑(𝜃) can be calculated from the slope of ln(𝑟𝑑𝑒𝑠) versus 1/T; this
simplification, as already discussed, is not suitable for heterogeneous surfaces. More complex
methods consider the desorption energy as non linear, and they can be obtained by fitting procedure
with the experimental data of the TPD curve, using 𝐸𝑑(𝜃) as a fitting parameter. In this case, a value
for the frequency factor 𝐴(𝜃) must be previously estimated [17] or inserted in the regression procedure
as second fitting parameter [18].
The a priori estimation of 𝐴(𝜃) can be very difficult due to the great numerical differences possible
for this parameter. On the other hand, numerical regression procedures can be very dependent by the
numbers that we insert as initial values. In fact, an iterative procedure requires starting values that
must be inserted in the first numerical cycle. Several methods and programs are reported in the
literature for models analysis, which implements robust methods for parameter estimation of
nonlinear models, able to detect outliers [19]. The influence of the initial values can be very critical for
the final results, in particular in the applications where several minima of the error function can be
found [20]. This is the case of the Polanyi-Wigner equation from TPD curves, as it will be discussed
in the present paper. In fact, the aim of the work is to propose a new and easy calculation procedure
in order to avoid the uncertainties in the determination of 𝐸𝑑(𝜃) and 𝐴(𝜃) values. The systematic
study of the initial values for iterative calculation procedure is a well known topic in scientific
literature, but it was not previously discussed for the correct and univocal determination of kinetic
parameters of heterogeneous surface starting from TPD analysis.
Three different Pt or Co based metallic catalysts, suitable for hydrogenation reactions, have been
considered as case studies for the application of the proposed numerical method. The first sample was
a mixture Pt/Al2O3 where Pt is present in a 3% in weight (named “Pt3-S”), as described and used in
Page 7
7
R. Giannantonio et al. [21]. The second sample is a mixture Co/SiO2 where Co is present in a 10% in
weight (named “Co10-1S”) and the third was with the same composition but with a different kind of
silica, discussed in the experimental section, and named “Co10-2S”.
The first catalyst Pt3-S is useful to compare the values of 𝐸𝑑(𝜃) and 𝐴(𝜃) of the original work [21]
respect to the ones obtained in the present paper. The Co-based catalysts have been analysed using
different TPD procedures and a comparison between weakly and strongly adsorbed hydrogen species
peaks is proposed.
2. Material and methods
2.1 Experimental
Catalyst Pt3-S (BET surface = 77±2 m2g-1) was prepared, characterized and analysed by TPD
as described in R. Giannantonio et al. [21]. Briefly, thermal desorption analyses were performed in a
high vacuum (base pressure = 10-6 torr) stainless steel apparatus provided with a particular system for
gas introduction and equipped with a Thermo Fischer QTMD quadrupole mass spectrometer. More
precisely we have considered curve D of figure 6 of such reference, referred to the sample of Pt3-S.
Such data are referred to irreversible chemisorbed hydrogen. The adsorption temperature, i.e. the
temperature at which hydrogen was adsorbed by this sample, was 305 K.
Co 10%wt was prepared using two completely different kinds of silica. For Co10-1S sample an
Aldrich Product silica (BET surface = 504±2 m2g-1, pore volume 0.75 cm3g-1) has been used, while
the second sample Co10-2S was supported on a particular aerogel silica (BET surface: 498±2 m2g-1,
pore volume 3.19 cm3g-1). Both samples were prepared by impregnation using an aqueous solution
of cobalt nitrate; before the impregnation the support was heated overnight at about 373 K. The
impregnation was performed in a Rotavapor apparatus at 313 K, for 24 h. After the impregnation,
water was eliminated at 333 K in the same apparatus under moderate vacuum (base pressure = 200
torr). The catalyst was then dried at 393 K in air and calcinated at 773 K for 4 h (heating rates = 30
K min-1).
Page 8
8
Co10-1S sample has been analysed using a commercial apparatus (Thermoquest Mod.
TPR/D/O 1100 instrument) equipped with a TCD detector. The prepared catalyst, after the calcination
procedure was dried at 393 K, then weighed and placed in a quartz reactor where it was fluxed with
hydrogen (30 ml min-1), while the temperature was raised to 673 K at 10 K min-1 and then maintained
at this temperature for sixteen hours, then it was fluxed with argon (30 ml min-1) at 673 K for 2 hours
(heating rates = 30 K min-1). The sample was cooled at 398 K (adsorption temperature) and then
treated with 15 hydrogen pulses (0.3 cm3 of H2 for each pulse) to perform hydrogen chemisorption,
each pulse has been injected in a stream of helium as carrier gas. Finally, TPD analysis was performed
in Ar flow (20 ml min-1) heating the sample from 398 to 673 K (30 K min-1); after reaching the last
temperature the samples were cooled in the same gas to room temperature. Co10-2S sample has been
analysed according Bartholomew procedure [22] using the same instrument. The sample was
previously reduced in a quartz reactor in hydrogen at 673 K for 16 h and then loaded in the TPD
reactor. The sample was cooled to the adsorption temperature of 193 K (dry ice/acetone) and the gas
flow was switched from pure H2 to pure He. After calibrating the analyser with several 50 l pulses
of H2, the temperature was raised to 623 K in flowing He (heating rates = 15 K min-1).
2.2 Calculation procedure
The function to be minimized in order to calculate 𝐸𝑑(𝜃) and 𝐴(𝜃) parameters of equation (1) is:
Φ = ∑(𝐶𝑒𝑥𝑝,𝑖 − 𝐶𝑐𝑎𝑙𝑐,𝑖)2
𝑚
𝑖=1
(4)
where 𝐶𝑒𝑥𝑝,𝑖 =𝑑𝜃𝑖
𝑑𝑡𝑖 [10] and 𝐶𝑐𝑎𝑙𝑐,𝑖 is calculated for discrete value of N from equations (1) and (2). The
minimization has been performed using a MATLAB program (Version 6.0.0.88 Release 12).
Being Φ a function of N+2 parameters [i.e. 𝑎𝑘 (𝐾 = 0 → 𝑁) and 𝐴(𝜃), see equations (1) and (2)], to
find the absolute minima is not a trivial question. Some conditions must be used to initialize the
calculations. In fact, the starting values of the N+2 parameters strongly influence the achievement of
Page 9
9
a “relative” minimum which may not be the “absolute” one. We have verified that the value of 𝐴(𝜃)
influences strongly the minimum of function. This implies that different initial values of 𝐴(𝜃) must
be given to the program in order to find the relative minima. The range 100 < 𝐴(𝜃) < 1018, proposed
in the following calculations, should be considered as sufficient to explore all the possible numerical
solutions with a chemico-physical meaning. To our best knowledge, numerical values greater than
the ones considered in this paper have never been reported for sample similar to the ones here
discussed for desorption order equal to 1 or 2 [15]. Then the optimization procedure has been
performed, for each constant 𝐴(𝜃) parameter, by optimizing the coefficient 𝛼𝑘 of the polynomial
equation (2), i.e. 𝑎0 + 𝑎1(1 − 𝜃𝑚) + ⋯ + 𝑎𝑘(1 − 𝜃𝑚)𝑘 where 1 < k < 7. The absolute minimum was
therefore chosen among the “relative” ones. Being N an integer, the best procedure is to fix N (hence
N+1 unknowns deriving from equation 2) and also a discrete, but wide series of A values. For each
N and A the minimum of can be found using a minimization procedure.
3. Results and discussion
The physico-chemical characteristics of these catalysts, in particular dispersions, particle size and
reduction degree influence the adsorption-desorption curves. The main characterization results of Pt3-
S are reported in in R. Giannantonio et al. [21], while the characterization study for the CO10-1S
sample is reported in V. Ragaini et al. [23] and C. Pirola et al. [24]. Finally, the main characteristics of
the sample Co10-2S are discussed by Bianchi et al. [25]. In particular, the metal dispersions for Pt3-S,
Co10-1S and Co10-2S are 15.91%, 1.83% and 3.9% respectively. The reduction of the metals on the
different catalyst was performed by flowing hydrogen at 613 K for 16 h for the Pt based sample [21]
and at 673K for 16 h for both the Co based catalysts. Using these conditions, the reduction degrees
for all the catalysts are in the range 80-90%.
The desorption peaks (chemisorbed hydrogen) for Pt3-S and Co10-1S samples are reported in figure
1a while the desorption peaks (physisorbed hydrogen and chemisorbed hydrogen) for Co10-2S
sample are reported in figure 1b.
Page 10
10
Figure 1: a) Hydrogen Thermal Desorption curves for the samples Pt3-S and Co10-1S; heating rate
and adsorption temperature: Pt3-S: 5 K min-1, Tads= 305 K; Co10-1S: 30 K min-1, Tads= 398 K.
b) Hydrogen Thermal Desorption curves for the sample Co10-2S; heating rate and adsorption
temperature: 30 K min-1, Tads= 193 K.
The presence of two different TPD peaks in figure 1B is due to the experimental procedure [22], applied
to discriminate between weakly and strongly adsorbed hydrogen species. The higher temperature of
the second peak respect the single peak of figure 1a can be dependent both on the different TPD
procedures and on the different support-cobalt interactions present in Co-1S and Co-2S catalysts. In
fact, the energy involved in the hydrogen reversibility is strongly dependent from several physical
parameter (kind of support, dispersion, reduction degree)[22] that are different in Co-1S[24] and Co-
2S[25] samples.
The numerical regression procedure previously described has been applied on these TPD data. The
results for sample Pt3-S and for sample Co10-1S are shown in figure 2a and 2b respectively, with N
varied from 2 to 7 and 𝐴(𝜃) from 1 to 1014. In these figures, the error function given by the equation
(4) is reported vs. the different values of the frequency factor (𝐴(𝜃) in equation (1)) used to develop
the regression procedure. The different curves corresponds to different degrees of the polynomial
Page 11
11
equation (2) used for the different regressions. It is possible to observe the presence of several
mathematical minima of the function error, but only the right combination of initial value of
frequency factor and polynomial degree gives the univocal solution with chemical-physical meaning.
Figure 2: function (equation 4) for the optimization procedure using different 𝐴(𝜃) values for the
start of calculations and different N degree (from 2 to 7) of equation (2) for Pt3-S sample (a) and
Co10-1S sample (b). Logarithmic scale.
The couple of parameters N= 2 and 𝐴(𝜃)= 9.6 x 10⁷ s-1 give the absolute minimum of for the
platinum based sample while for the cobalt based one the best result is obtained with N= 2 and 𝐴(𝜃)=
9.0 x 10¹² s-1. Besides, where N 4 the curves of have more than one minima, each at different
value of 𝐴(𝜃). The corresponding polynomial equations 𝐸𝑑(𝜃) as function of 𝜃, for each N value, are
shown graphically in figure 3. For the best value of N (N= 2) the polynomial is: for Pt3-S sample
𝐸𝑑(𝜃) = 16.36 + 5.96(1 − 𝜃) − 3.02(1 − 𝜃)2 and for Co10-1S sample 𝐸𝑑(𝜃) = 25.05 +
2.29(1 − 𝜃) − 0.55(1 − 𝜃)2. These results are summarized in table 1.
Page 12
12
Figure 3: 𝐸𝑑(𝜃) calculated using the best-optimized parameters (i.e. the parameters by which the
lowest function has been calculated) for each different degree N of polynomial of equation (2) for
Pt3-S sample (a) and Co10-1S sample (b). Dashed line represents temperature (K).
Table 1: Calculated values of Desorption energy 𝐸𝑑(𝜃), kJ mol-1, pre exponential factor 𝐴(𝜃) (s-1)
and optimized N parameter for equation (2).
Sample 𝐸𝑑(𝜃~0) 𝐸𝑑(𝜃 = 1) 𝐴(𝜃) N
Pt3-S 80.4 68.2 9.02 x 10¹² 2
Co10-1S (n= 2) 112.2 80.4 9.6 x 10⁷ 2
Co10-2S
(TPD peak P1, n= 1)
24.8 35.4 1 x 10⁶ 4
Co10-2S
(TPD peak P1, n= 2)
65 75 1 x 10¹⁴ 3
Co10-2S
(TPD peak P2, n= 2)
216.8 175.7 1 x 10¹⁸ 3
For each different value of N, the energy of desorption 𝐸𝑑(𝜃) has been calculated from equation (2).
The results of both catalysts are reported in figure 3 where for N= 2 (which leads to absolute minima
Page 13
13
of ) the 𝐸𝑑(𝜃) values are between 80.4 kJ mol-1 (= 0) and 68.2 kJ mol-1 (= 1) for Pt based catalyst
and between 112.2 kJ mol-1 (= 0) and 104.7 kJ mol-1 (= 1) for Co based catalyst. From these results,
it is possible to conclude that there are interactions between adjacent molecules on sites, which
confirms that the surface energies depend on the sites and influences the adsorption energy.
Such results for Pt-based catalyst are close to those obtained experimentally by Procop and Volter
and by Lisowsky who studied the adsorption-desorption of hydrogen on platinum foils, obtaining an
average value of𝐸𝑑(𝜃) of 69.5 kJ mol-1 [26] and from 51.5 to 103.4 kJ mol-1 [27]. For what concerns
the pre-exponential factor 𝐴(𝜃), in the literature such value is given frequently in the unit 𝑣𝑚2 ∙
(𝐻2 𝑚𝑜𝑙𝑒𝑐𝑢𝑙𝑒𝑠 ∙ 𝑠)−1 [28]. To convert such unit in s-1, as used in our calculations, it is necessary to
multiply such unit by the factor 𝐻2 𝑎𝑑𝑠𝑜𝑟𝑏𝑒𝑑 𝑚𝑜𝑙𝑒𝑐𝑢𝑙𝑒𝑠 ∙ (𝑐𝑚 𝑜𝑓 𝑎𝑑𝑠𝑜𝑟𝑏𝑖𝑛𝑔 𝑠𝑢𝑟𝑓𝑎𝑐𝑒)−2. Such
value ranges from 1 x 10¹⁴, 6x10¹⁴ [29], <2.5 x 10¹⁴ [26] considering polycrystalline Pt and a
stoichiometry 1 H2 / 2 Pt. Assuming an average value of 3 x 10¹⁴ it derives that the values of 𝐴(𝜃)
reported in literature are (in s-1): 1.6x10⁶, 4.5x10⁷, 3.4x10⁶ [28] and 4.0x10⁷ [26]. Such values are close
to the one above calculated (9.6x10⁷ s-1) taking also into account both the different situations of Pt
surface and the adsorption techniques among references.
The desorption energy and the pre-exponential factor for the Pt3-S catalyst were calculated in a
previous paper [21], by a similar fitting procedure based on the Polanyi-Wigner equation. Nevertheless,
in this paper the range of 𝐴(𝜃) values was limited between 1012 and 1014 s-1. Moreover, a polynomial
of fifth degree was used for the description of the desorption energy function, i.e. inserting N=5 in
equation (2). In this work, the optimum value of 𝐴(𝜃) of 1-5 x 10¹³ s-1 and values of 𝐸𝑑(𝜃) from 92.1
to 150.7 kJ mol-1 were found. However, the minimum of function using such parameters (see figure
2) is not an absolute one, corresponding instead, as previously reported, to 𝐴(𝜃)= 9.6 x 10⁷ s-1, N= 2
giving 68.2 < 𝐸𝑑(𝜃) < 80.4 kJ mol-1.
Concerning the cobalt based catalyst, a comparison can be made considering the average value of
desorption energy of 168 kJ mol-1 reported by in J. Zowtiak [30] using the method of elaboration of
Page 14
14
TPD proposed in J. L. Falconer and J. A. Schwarz [13]. Zowtiak’s results show that 𝐸𝑑(𝜃) changes
both with the percentage of cobalt and with the type of support (i.e. for Co10%wt/Al2O3, 𝐸𝑑(𝜃)= 144
kJ mol-1). Our silica support is different from that used in J. Zowtiak [30], therefore 𝐸𝑑(𝜃) results in
table 1 for Co10-1S are only qualitatively comparable with the average value above reported.
The values so found of 𝐴(𝜃) and 𝐸𝑑(𝜃) functions are very useful to calculate through equation (2)
the time necessary for a change in the coverage Δ. The results for Pt3-S and Co10-1S samples are
shown in figure 4, using the optimized results above reported. According to such results the
desorption of hydrogen from cobalt based catalyst is much more rapid than that from Pt catalyst as
expected from the large difference with calculated valued of the desorption constants.
Figure 4: Surface coverage (𝜃) vs. time calculated using the optimized value of 𝐸𝑑(𝜃) at three
different temperatures (T= 305, 365 and 425 K) for the samples: a) Pt3-S and b) Co10-1S.
A more complex analysis is necessary for sample Co10-S2 where, due to Bartholomew’s method [22],
it has been possible to record both the desorption of the two hydrogen species peaks (P1 and P2
respectively, see figure 1): one (P1) more weakly adsorbed, the other (P2) more strongly. Ernst et al
[31] have shown that on cobalt single crystal (1010) surface two types of hydrogen are chemisorbed
(α and ); also Dus and Lisowski [32] have detected below 300 K two desorption states for hydrogen.
Page 15
15
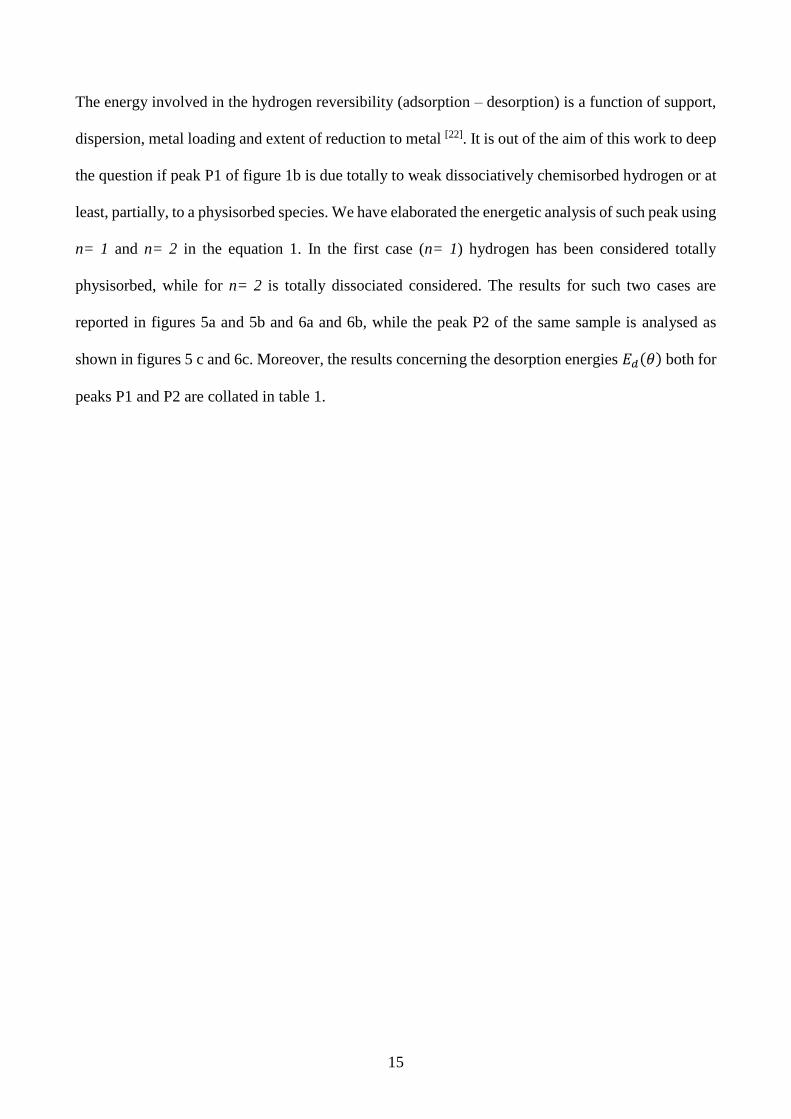
The energy involved in the hydrogen reversibility (adsorption – desorption) is a function of support,
dispersion, metal loading and extent of reduction to metal [22]. It is out of the aim of this work to deep
the question if peak P1 of figure 1b is due totally to weak dissociatively chemisorbed hydrogen or at
least, partially, to a physisorbed species. We have elaborated the energetic analysis of such peak using
n= 1 and n= 2 in the equation 1. In the first case (n= 1) hydrogen has been considered totally
physisorbed, while for n= 2 is totally dissociated considered. The results for such two cases are
reported in figures 5a and 5b and 6a and 6b, while the peak P2 of the same sample is analysed as
shown in figures 5 c and 6c. Moreover, the results concerning the desorption energies 𝐸𝑑(𝜃) both for
peaks P1 and P2 are collated in table 1.
Page 16
16
Figure 5: function (equation 3) after the optimization procedure using different 𝐴(𝜃) values for
the start of calculations and different N degree (from 2 to 7) of equation (2) for Co10-S2 sample (a)
TPD peak A (n= 1); (b) TPD peak A (n= 2); (c) TPD peak B (chemisorbed hydrogen). Logarithmic
scale.
Page 17
17
Figure 6: 𝐸𝑑(𝜃) calculated using the best optimized parameters (i.e. the parameters by which the
lowest function has been calculated) for each different degree N of polynomial of equation (2) for
Co10-S2 sample (a) TPD peak A (n= 1); (b) TPD peak A (n= 2); (c) TPD peak B (chemisorbed
hydrogen). Broken line on the secondary axis: temperature (K).
Page 18
18
The values of 𝐸𝑑(𝜃) for sample Co10-S2, having a SiO2 very similar to the one used by Zowtiak [30]
ranges (see table 1, sample Co10-2S, peak P2) from 175.7 to 216.8 kJ mol-1, which are in good
agreement with the average Zowtiak’s value of 168 kJ mol-1.
As for the peak P1 of the same sample it is very reasonable that both 𝐸𝑑(𝜃) values, calculate at =
1and = 2, are much lower than the previous reported data for P2 peak (see table 1). For systems
where adsorbates are completely physisorbed (i.e. argon and nitrogen on hydroxylated and
dehydroxylated silica) the isosteric heat of adsorption (at = 0.5) ranges from 8.8 to 13.4 kJ mol-1,
roughly equal to activation energy of desorption [33]. The values of desorption energies obtained for
hydrogen on sample Co10-2S when n= 1 and n= 2 for P1 peak (i.e. from 24.8 to 75 kJ mol-1, table
1), may indicate that the desorption energy can be attributed to a weakly chemisorption state of this
adsorbate.
4. Conclusions
A new mathematical procedure is proposed in order to analyze TPD data to determine both
the frequency factor and the distribution with the coverage of the activation energy of desorption
based on the Polanyi-Wigner equation. In order to obtain meaningful parameters, it is suggested to
explore large range of initial values for the frequency factor and different degrees (k) for the
polynomial equation that correlate the desorption activation energy with the surface coverage (𝜃).
Three different Pt and Co based catalysts have been considered as case studies. The results obtained
by applying the mathematical elaboration are coherent with pre-exponential factor and desorption
activation energies reported in literature for similar catalysts.
Acknowledgments
The work was partially financed by the call “Azione A, Piano sostegno alla ricerca – anno 2018” by
Dipartimento di Chimica, Università degli Studi di Milano.
Page 19
19
References
[1] J. M. Kanervo, S. Kouva, K. J. Kanervo, R. Kolvenbach, A. Jentys, J. A. Lercher, Chem.
Eng. Sci. 2015, 137, 807.
[2] C. Pirola, F. Galli, G. S. Patience, Can. J. Chem. Eng. 2018, 96, 2317.
[3] M. Niwa, N. Katada, Chem. Rec. 2013, 13, 432.
[4] J. Kanervo, T. Keskitalo, R. Slioor, A. Krause, J. Catal. 2006, 238, 382.
[5] K. C. Waugh, Chem. Eng. Res. Des. 2000, 78, 954.
[6] M. Schmal, D. V. Cesar, M. M. V. M. Souza, C. E. Guarido, Can. J. Chem. Eng. 2011, 89,
1166.
[7] S. Kouva, J. Kanervo, F. Schüβler, R. Olindo, J. A. Lercher, O. Krause, Chem. Eng. Sci.
2013, 89, 40.
[8] W. Mao, J. Su, Z. Zhang, X.-C. Xu, W. Dai, D. Fu, J. Xu, X. Zhou, Y.-F. Han, Chem. Eng.
Sci. 2015, 135, 312.
[9] M. A. Salam, B. Abdullah, M. A. Islam, Chem. Eng. Res. Des. 2017, 118, 103.
[10] Y. Tokoro, J. Catal. 1979, 56, 110.
[11] A. K. Galwey, M. E. Brown, Thermochim. Acta 2002, 386, 91.
[12] M. Polanyi, E. Wigner, Zeitschrift f�r Phys. 1925, 33, 429.
[13] J. L. Falconer, J. A. Schwarz, Catal. Rev. 1983, 25, 141.
[14] V. P. Bogillo, V. I.; Shkilev, J. Therm. Anal. Calorim. 1999, 55, 483.
[15] R. Luna, C. Millán, M. Domingo, C. Santonja, M. Á. Satorre, Vacuum 2015, 122, 154.
[16] R. Luna, M. Á. Satorre, C. Santonja, M. Domingo, Astron. Astrophys. 2014, 566, A27.
[17] A. Chakradhar, Y. Liu, J. Schmidt, E. Kadossov, U. Burghaus, Surf. Sci. 2011, 605, 1537.
[18] G. M. Muñoz Caro, A. Jiménez-Escobar, J. Á. Martín-Gago, C. Rogero, C. Atienza, S.
Puertas, J. M. Sobrado, J. Torres-Redondo, Astron. Astrophys. 2010, 522, A108.
[19] G. Buzzi-Ferraris, F. Manenti, Chem. Eng. Sci. 2009, 64, 1061.
Page 20
20
[20] H. J. Motulsky, L. A. Ransnas, FASEB J. 1987, 1, 365.
[21] R. Giannantonio, V. Ragaini, P. Magni, J. Catal. 1994, 146, 103.
[22] R. D. Jones, C. H. Bartholomew, Appl. Catal. 1988, 39, 77.
[23] V. Ragaini, C. Pirola, S. Vitali, G. Bonura, C. Cannilla, F. Frusteri, Catal. Letters 2012, 142,
1452.
[24] C. Pirola, M. Scavini, F. Galli, S. Vitali, A. Comazzi, F. Manenti, P. Ghigna, Fuel 2014, 132,
62.
[25] P. Bianchi, C.L.M.; Martini, F.; Moggi, Catal. Letters 2001, 1, 65.
[26] M. Procop, J. Völter, Surf. Sci. 1972, 33, 69.
[27] W. Lisowski, Appl. Surf. Sci. 1988, 31, 451.
[28] R. J. Madix, G. Ertl, K. Christmann, Chem. Phys. Lett. 1979, 62, 38.
[29] J. J. Stephan, V. Ponec, W. M. H. Sachtler, Surf. Sci. 1975, 47, 403.
[30] J. Zowtiak, J. Catal. 1983, 83, 107.
[31] K. ‐H. Ernst, E. Schwarz, K. Christmann, J. Chem. Phys. 1994, 101, 5388.
[32] R. Duś, W. Lisowski, Surf. Sci. 1976, 61, 635.
[33] F. Faglioni, W. A. Goddard, J. Chem. Phys. 2005, 122, 014704.