Page 1
ORIGINAL PAPER
Nonlinear modeling of equilibrium sorption of selectedanionic adsorbates from aqueous solutions on cellulosicsubstrates. Part 1: model development
Changhai Xu • Renzo Shamey
Received: 30 July 2011 / Accepted: 15 February 2012 / Published online: 2 March 2012
� Springer Science+Business Media B.V. 2012
Abstract A new nonlinear isothermal sorption
model, incorporating Donnan equilibrium and electri-
cal neutrality in the classical sorption model of direct
dyes onto cellulosic substrates, as model adsorbates, is
proposed. The nonlinear isothermal model was used to
simulate equilibrium sorption of adsorbates containing
ionic charges (z) of -2 to -4 on cellulose adsorbents
at various temperature (T) and sodium chloride
concentrations ([NaCl]). A detailed analysis of simu-
lation results demonstrates that results based on the
nonlinear sorption model highly agree with those
based on the log-linear sorption model when the
deviation in the concentration of sodium ions in the
aqueous solution ([Na?]S) relative to [NaCl] used in
the sorption system is restricted to\5.0%. Compared
to the log-linear model, the nonlinear model avoids
using graphical techniques that are relatively insensi-
tive for determining important sorption parameters
such as the internal accessible volume (V) and the
standard affinity associated with sorption (-Dl�). The
nonlinear sorption model was used to examine the
correlation of fit for previously reported sorption data.
The model parameters V and -Dl� based on curve fits
were used to estimate V for cellulose as well as -Dl�.
The values were found to match those based on the
conventional log-linear model when deviations of
[Na?]S relative to ½Naþ�S were below 5%. The
nonlinear model therefore provides a convenient and
accurate technique to interpret the sorption of a range
of anionic adsorbates on cellulosic substrates.
Keywords Nonlinear modeling and analysis �Equilibrium sorption � Sorption isotherm � Anionic
adsorbate � Cellulose � Internal accessible volume
Introduction
Sorption of adsorbates from aqueous solutions on
substrates is a complex process which is generally
controlled by adsorbate–substrate interactions involv-
ing various types of intermolecular forces, such as
electrostatic (ionic) (Sumner 1986; McGregor and
Iijima 1992), van der Waals (London) (Bird et al.
2006), polar (hydrogen bonding) (Yamaki et al. 2005),
and hydrophobic (cooperative binding) interactions
(Nemethy and Scheraga 1962; Maruthamuthu and
Sobhana 1979; Yang 1993). The interaction forces
involved in a sorption system depend on the physical
and chemical properties of adsorbates and adsorbents.
Anionic dyes can be considered a model class of
anionic adsorbates applied to cellulosic substrates.
Direct dyes were among the first classes whose
sorption properties on cellulosic substrates were
examined (Vickerstaff 1954). They are anionic mol-
ecules with linear and coplanar structures and possess
C. Xu � R. Shamey (&)
Fiber and Polymer Science Program, North Carolina State
University, Raleigh, NC 27695-8301, USA
e-mail: [email protected]
123
Cellulose (2012) 19:615–625
DOI 10.1007/s10570-012-9675-7
Page 2
inherent substantivity to cellulosic substrates. In an
aqueous solution, cellulose acquires negative charges
on its surface which repels the direct dye anions.
Electrolytes are usually added into the dyebath in
part to provide sodium counter-ions to minimize
the effect of the negative charge on the surface of
cellulose. This facilitates the adsorption of dye anions
by the substrate. A fundamental examination of the
sorption of direct dye on cellulose can elucidate a
better understanding of the sorption behavior of
anionic adsorbates on cellulosic substrates.
In this paper, a nonlinear sorption model is
developed that utilizes the classical sorption isotherm
of direct dyes from an aqueous solution on cellulosic
substrates. The nonlinear sorption model was used to
simulate equilibrium sorption of adsorbates with ionic
charge of -2 to -4 on cellulose adsorbents under
various conditions. In addition, the nonlinear sorption
model was fitted to isothermal sorption data previ-
ously reported (Hanson et al. 1935; Willis et al. 1945;
Marshall and Peters 1947; Peters and Vickerstaff
1948) and the performance of the nonlinear sorption
model was evaluated by comparing to the log-linear
sorption model.
Classical sorption isothermal models
The sorption behavior of direct dyes on cellulose
substrates is classically described by a two-phase
sorption model developed in the first half of the
twentieth century (Hanson et al. 1935; Willis et al.
1945; Marshall and Peters 1947; Peters and Vicker-
staff 1948). This sorption model assumes two phases,
the internal cellulose phase (F) and the external
aqueous solution phase (S), and that any adsorbed ion
on cellulose substrate is dissolved in the internal
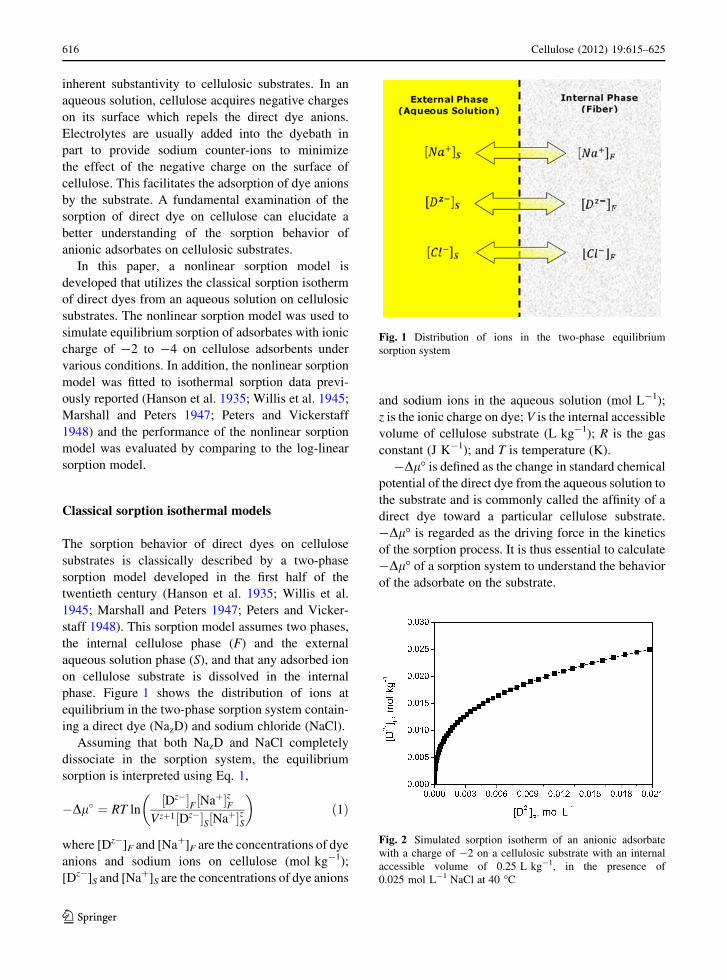
phase. Figure 1 shows the distribution of ions at
equilibrium in the two-phase sorption system contain-
ing a direct dye (NazD) and sodium chloride (NaCl).
Assuming that both NazD and NaCl completely
dissociate in the sorption system, the equilibrium
sorption is interpreted using Eq. 1,
�Dl� ¼ RT ln½Dz��F½Naþ�zF
Vzþ1½Dz��S½Naþ�zS
� �ð1Þ
where [Dz-]F and [Na?]F are the concentrations of dye
anions and sodium ions on cellulose (mol kg-1);
[Dz-]S and [Na?]S are the concentrations of dye anions
and sodium ions in the aqueous solution (mol L-1);
z is the ionic charge on dye; V is the internal accessible
volume of cellulose substrate (L kg-1); R is the gas
constant (J K-1); and T is temperature (K).
-Dl� is defined as the change in standard chemical
potential of the direct dye from the aqueous solution to
the substrate and is commonly called the affinity of a
direct dye toward a particular cellulose substrate.
-Dl� is regarded as the driving force in the kinetics
of the sorption process. It is thus essential to calculate
-Dl� of a sorption system to understand the behavior
of the adsorbate on the substrate.
Fig. 1 Distribution of ions in the two-phase equilibrium
sorption system
Fig. 2 Simulated sorption isotherm of an anionic adsorbate
with a charge of -2 on a cellulosic substrate with an internal
accessible volume of 0.25 L kg-1, in the presence of
0.025 mol L-1 NaCl at 40 �C
616 Cellulose (2012) 19:615–625
123
Page 3
In Eq. 1, with the exception of V, all the model
parameters can be directly measured or indirectly
calculated. [Dz-]S is commonly measured in the
residual dyebath via spectrophotometric or colorimet-
ric methods and [Dz-]F can be determined either from
the calculation of the depletion of dye in the aqueous
solution or by extraction of dye from the substrate.
[Na?]S is considered to be equivalent to the sum of all
counter ions in the dyebath including the dye and
chloride anions, as shown in Eq. 2, providing the
volume of the dyebath is in a large excess of the
internal accessible volume of cellulose substrate.
½Naþ�S ¼ z½Dz��S þ ½Cl��S ð2Þ
[Na?]F is generally calculated from Eq. 3 which is
derived from the Donnan equilibrium between fiber
and aqueous solution (Eq. 4) and the electrical neu-
trality condition of the cellulose substrate (Eq. 5).
-21 -20 -19 -18 -17 -16 -15 -14 -13 -12 -11 -10 -9 -8-19
-18
-17
-16
-15
-14
-13
-12
-11
-10
-9
-8
r = 0.9917Slope = 0.7894
Simulated sorption data Linear fit
ln([
D2-] F
[Na+
]2 F)
ln([D2-]S[Na+]2
S)
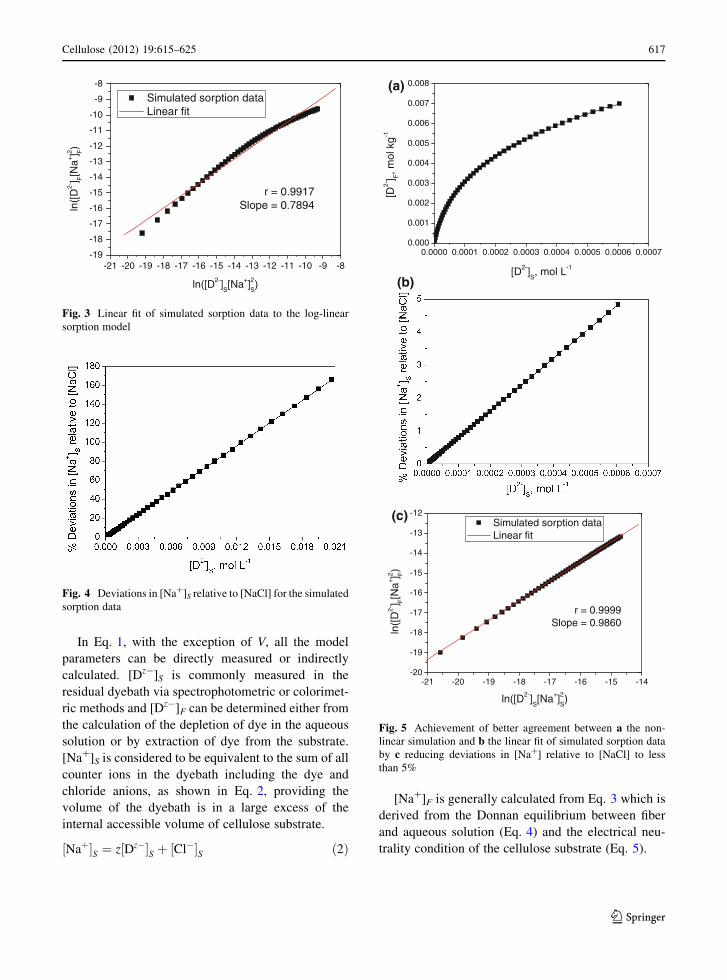
Fig. 3 Linear fit of simulated sorption data to the log-linear
sorption model
Fig. 4 Deviations in [Na?]S relative to [NaCl] for the simulated
sorption data
0.0000 0.0001 0.0002 0.0003 0.0004 0.0005 0.0006 0.00070.000
0.001
0.002
0.003
0.004
0.005
0.006
0.007
0.008
[D2-] F
, mol
kg-1
[D2-]S, mol L-1
(a)
(b)
(c)
-21 -20 -19 -18 -17 -16 -15 -14-20
-19
-18
-17
-16
-15
-14
-13
-12
r = 0.9999Slope = 0.9860
Simulated sorption data Linear fit
ln([
D2-] F
[Na+
]2 F)
ln([D2-]S[Na+]2
S)
Fig. 5 Achievement of better agreement between a the non-
linear simulation and b the linear fit of simulated sorption data
by c reducing deviations in [Na?] relative to [NaCl] to less
than 5%
Cellulose (2012) 19:615–625 617
123
Page 4
½Naþ�F ¼
0:5 z½Dz��F þ z2½Dz��2F þ 4V2½Naþ�S½Cl��S� �0:5
� �
ð3Þ
½Naþ�F½Cl��FV2
¼ ½Naþ�S½Cl��S ð4Þ
½Naþ�F ¼ z½Dz��F þ ½Cl��F ð5Þ
The model parameter V is believed to be a
function of the physical structure of the cellulosic
substrate and may vary from one type of cellulosic
substrate to the other. V is commonly used to
compare and contrast the difference in physical
structures of cellulosic substrates (Standing 1954;
Holmes 1958; Carrillo et al. 2002; Ibbett et al. 2006,
2007). As implied in Eq. 1, V can greatly influence
-Dl� and must therefore be assigned a precise
value, especially when comparing sorption behaviors
of the same adsorbate on a variety of cellulosic
substrates. In order to determine the parameter V,
Eq. 1 is usually expanded in a log-linear model as
given in Eq. 6.
ln ½Dz��F½Naþ�zF�
¼ ln ½Dz��S½Naþ�zS� þ ðzþ 1Þ lnðVÞ þ �Dl�
RTð6Þ
By adjusting the V value a linear relationship
between ln([Dz-]F[Na?]Fz ) and ln([Dz-]S[Na?]S
z) can
be obtained. However, care should be exercised to
ensure that not only the best-fit straight line has a
slope of unity but also �Dl� calculated from Eq. 1
remains constant for all sorption data. The best fit of
Eq. 6 to sorption data is routinely obtained by
assigning an arbitrary value to V by the trial-and-error
method, and often involves tedious mathematical
calculations. The log–log plot of sorption data,
however, is not very sensitive to changes in the value
assigned to V. This can be improved by the use of a
nonlinear modeling approach which is described in the
following section.
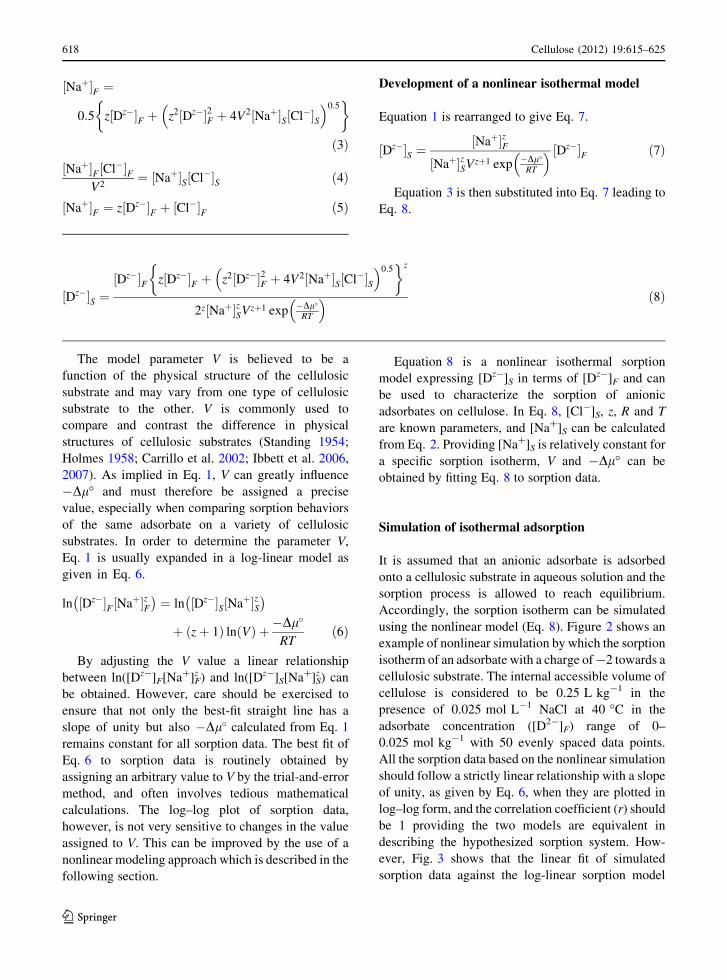
Development of a nonlinear isothermal model
Equation 1 is rearranged to give Eq. 7.
½Dz��S ¼½Naþ�zF
½Naþ�zSVzþ1 exp �Dl�
RT
� � ½Dz��F ð7Þ
Equation 3 is then substituted into Eq. 7 leading to
Eq. 8.
Equation 8 is a nonlinear isothermal sorption
model expressing [Dz-]S in terms of [Dz-]F and can
be used to characterize the sorption of anionic
adsorbates on cellulose. In Eq. 8, [Cl-]S, z, R and T
are known parameters, and [Na?]S can be calculated
from Eq. 2. Providing [Na?]S is relatively constant for
a specific sorption isotherm, V and -Dl� can be
obtained by fitting Eq. 8 to sorption data.
Simulation of isothermal adsorption
It is assumed that an anionic adsorbate is adsorbed
onto a cellulosic substrate in aqueous solution and the
sorption process is allowed to reach equilibrium.
Accordingly, the sorption isotherm can be simulated
using the nonlinear model (Eq. 8). Figure 2 shows an
example of nonlinear simulation by which the sorption
isotherm of an adsorbate with a charge of -2 towards a
cellulosic substrate. The internal accessible volume of
cellulose is considered to be 0.25 L kg-1 in the
presence of 0.025 mol L-1 NaCl at 40 �C in the
adsorbate concentration ([D2-]F) range of 0–
0.025 mol kg-1 with 50 evenly spaced data points.
All the sorption data based on the nonlinear simulation
should follow a strictly linear relationship with a slope
of unity, as given by Eq. 6, when they are plotted in
log–log form, and the correlation coefficient (r) should
be 1 providing the two models are equivalent in
describing the hypothesized sorption system. How-
ever, Fig. 3 shows that the linear fit of simulated
sorption data against the log-linear sorption model
½Dz��S ¼½Dz��F z½Dz��F þ z2½Dz��2F þ 4V2½Naþ�S½Cl��S
� �0:5� �z
2z½Naþ�zSVzþ1 exp �Dl�
RT
� � ð8Þ
618 Cellulose (2012) 19:615–625
123
Page 5
produces a straight line with a slope deviating from
unity in spite of the relatively high correlation
coefficient obtained. This disagreement is most likely
caused by the parameter [Na?]S that is assumed to be
constant in the nonlinear simulation (here approxi-
mated by 0.025 mol L-1 NaCl). However, [Na?]S is a
function of [D2-]S according to Eq. 2. Figure 4 shows
the % deviations associated with [Na?]S relative to
[NaCl] (Eq. 9) based on simulated concentration of
adsorbate anions in the solution ([D2-]S). [D2-]S
values used in Fig. 4 were in turn derived from the
concentration of adsorbate anions in the fiber on a
range of 0–0.025 mol kg-1 using Eq. 8. Results show
that an increase in [D2-]S results in an increased
deviation in [Na?]S. For the nonlinear simulations in
the [D2-]F range of 0–0.007 mol kg-1 (Fig. 5a),
errors of [Na?]S relative to [NaCl] for all 50 data
points are below 5% (Fig. 5b). Here the linear fit of
simulated sorption data produces a straight line with a
slope closely approximating unity and a high corre-
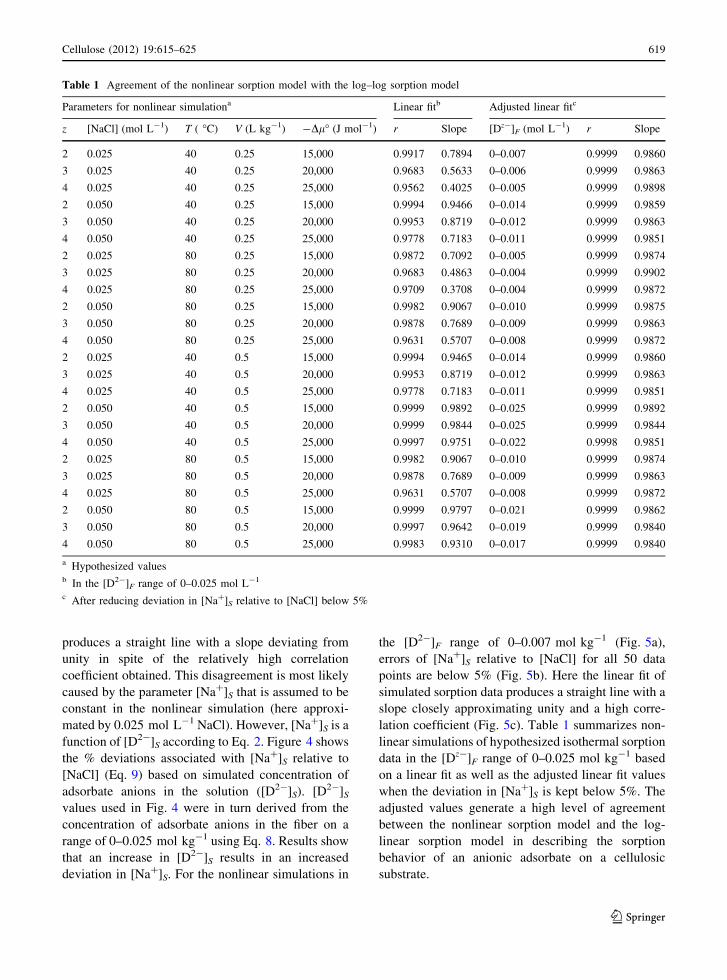
lation coefficient (Fig. 5c). Table 1 summarizes non-
linear simulations of hypothesized isothermal sorption
data in the [Dz-]F range of 0–0.025 mol kg-1 based
on a linear fit as well as the adjusted linear fit values
when the deviation in [Na?]S is kept below 5%. The
adjusted values generate a high level of agreement
between the nonlinear sorption model and the log-
linear sorption model in describing the sorption
behavior of an anionic adsorbate on a cellulosic
substrate.
Table 1 Agreement of the nonlinear sorption model with the log–log sorption model
Parameters for nonlinear simulationa Linear fitb Adjusted linear fitc
z [NaCl] (mol L-1) T ( �C) V (L kg-1) -Dl� (J mol-1) r Slope [Dz-]F (mol L-1) r Slope
2 0.025 40 0.25 15,000 0.9917 0.7894 0–0.007 0.9999 0.9860
3 0.025 40 0.25 20,000 0.9683 0.5633 0–0.006 0.9999 0.9863
4 0.025 40 0.25 25,000 0.9562 0.4025 0–0.005 0.9999 0.9898
2 0.050 40 0.25 15,000 0.9994 0.9466 0–0.014 0.9999 0.9859
3 0.050 40 0.25 20,000 0.9953 0.8719 0–0.012 0.9999 0.9863
4 0.050 40 0.25 25,000 0.9778 0.7183 0–0.011 0.9999 0.9851
2 0.025 80 0.25 15,000 0.9872 0.7092 0–0.005 0.9999 0.9874
3 0.025 80 0.25 20,000 0.9683 0.4863 0–0.004 0.9999 0.9902
4 0.025 80 0.25 25,000 0.9709 0.3708 0–0.004 0.9999 0.9872
2 0.050 80 0.25 15,000 0.9982 0.9067 0–0.010 0.9999 0.9875
3 0.050 80 0.25 20,000 0.9878 0.7689 0–0.009 0.9999 0.9863
4 0.050 80 0.25 25,000 0.9631 0.5707 0–0.008 0.9999 0.9872
2 0.025 40 0.5 15,000 0.9994 0.9465 0–0.014 0.9999 0.9860
3 0.025 40 0.5 20,000 0.9953 0.8719 0–0.012 0.9999 0.9863
4 0.025 40 0.5 25,000 0.9778 0.7183 0–0.011 0.9999 0.9851
2 0.050 40 0.5 15,000 0.9999 0.9892 0–0.025 0.9999 0.9892
3 0.050 40 0.5 20,000 0.9999 0.9844 0–0.025 0.9999 0.9844
4 0.050 40 0.5 25,000 0.9997 0.9751 0–0.022 0.9998 0.9851
2 0.025 80 0.5 15,000 0.9982 0.9067 0–0.010 0.9999 0.9874
3 0.025 80 0.5 20,000 0.9878 0.7689 0–0.009 0.9999 0.9863
4 0.025 80 0.5 25,000 0.9631 0.5707 0–0.008 0.9999 0.9872
2 0.050 80 0.5 15,000 0.9999 0.9797 0–0.021 0.9999 0.9862
3 0.050 80 0.5 20,000 0.9997 0.9642 0–0.019 0.9999 0.9840
4 0.050 80 0.5 25,000 0.9983 0.9310 0–0.017 0.9999 0.9840
a Hypothesized valuesb In the [D2-]F range of 0–0.025 mol L-1
c After reducing deviation in [Na?]S relative to [NaCl] below 5%
Cellulose (2012) 19:615–625 619
123
Page 6
% Deviation in ½Naþ�s relative to [NaCl]
¼ z½Dz��½NaCl� � 100 ð9Þ
Model validation
Previously published experimental sorption data of
direct dyes from aqueous solution on cellulosic
substrates (Hanson et al. 1935; Willis et al. 1945;
Marshall and Peters 1947; Peters and Vickerstaff
1948) were employed to evaluate the performance
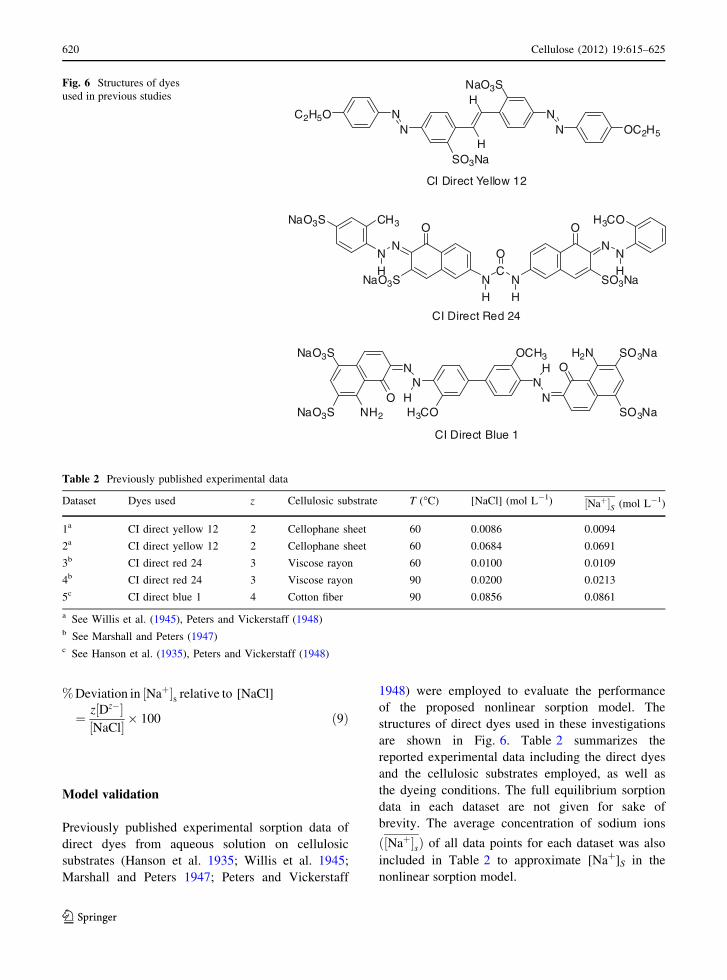
of the proposed nonlinear sorption model. The
structures of direct dyes used in these investigations
are shown in Fig. 6. Table 2 summarizes the
reported experimental data including the direct dyes
and the cellulosic substrates employed, as well as
the dyeing conditions. The full equilibrium sorption
data in each dataset are not given for sake of
brevity. The average concentration of sodium ions
ð½Naþ�sÞ of all data points for each dataset was also
included in Table 2 to approximate [Na?]S in the
nonlinear sorption model.
H
H
NaO3S
SO3Na
NN N OC2H5
NC2H5O
CI Direct Yellow 12
C
O
NN
O
H H
CI Direct Red 24
CI Direct Blue 1
O
N
SO3Na
N
NaO3S
NN
H H
H3CONaO3S CH3
NN
OCH3
H3CO
H
NH
N O
O
H2N
NH2
NaO3S
NaO3S
SO3Na
SO3Na
Fig. 6 Structures of dyes
used in previous studies
Table 2 Previously published experimental data
Dataset Dyes used z Cellulosic substrate T (�C) [NaCl] (mol L-1) ½Naþ�S (mol L-1)
1a CI direct yellow 12 2 Cellophane sheet 60 0.0086 0.0094
2a CI direct yellow 12 2 Cellophane sheet 60 0.0684 0.0691
3b CI direct red 24 3 Viscose rayon 60 0.0100 0.0109
4b CI direct red 24 3 Viscose rayon 90 0.0200 0.0213
5c CI direct blue 1 4 Cotton fiber 90 0.0856 0.0861
a See Willis et al. (1945), Peters and Vickerstaff (1948)b See Marshall and Peters (1947)c See Hanson et al. (1935), Peters and Vickerstaff (1948)
620 Cellulose (2012) 19:615–625
123
Page 7
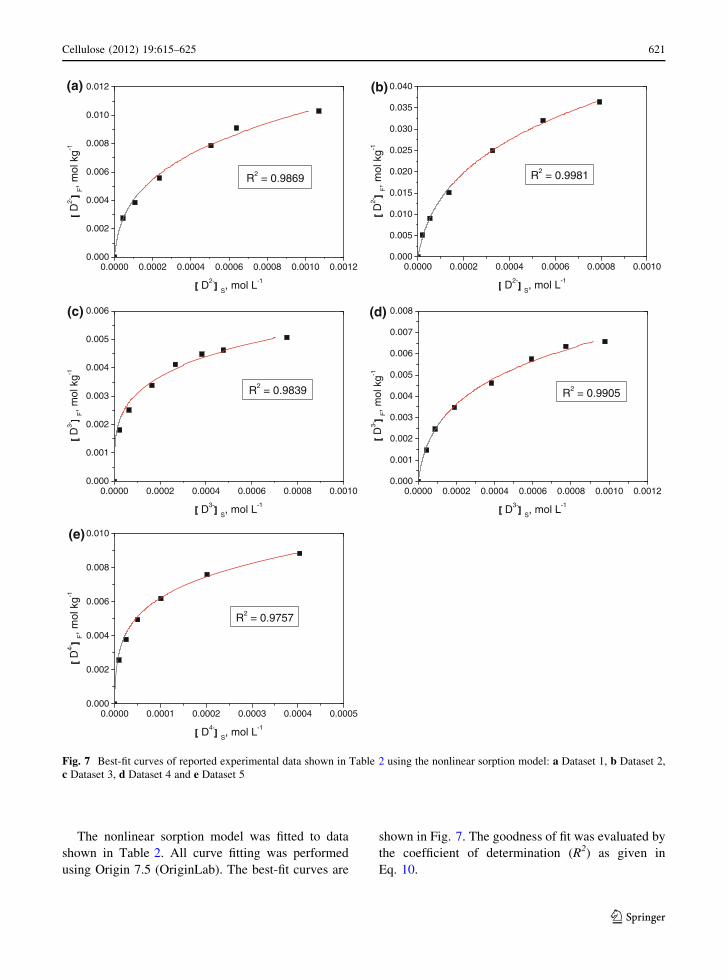
The nonlinear sorption model was fitted to data
shown in Table 2. All curve fitting was performed
using Origin 7.5 (OriginLab). The best-fit curves are
shown in Fig. 7. The goodness of fit was evaluated by
the coefficient of determination (R2) as given in
Eq. 10.
0.000
0.002
0.004
0.006
0.008
0.010
0.012
0.0000 0.0002 0.0004 0.0006 0.0008 0.0010 0.0012
(a)
R2 = 0.9869
D2-
S, mol L-1
D2-
F, m
ol k
g-1
0.000
0.005
0.010
0.015
0.020
0.025
0.030
0.035
0.040
0.0000 0.0002 0.0004 0.0006 0.0008 0.0010
R2 = 0.9981
D2-
S, mol L-1
D2-
F, m
ol k
g-1
(b)
0.000
0.001
0.002
0.003
0.004
0.005
0.006
0.0000 0.0002 0.0004 0.0006 0.0008 0.0010
R2 = 0.9839
D3-
S, mol L-1
D3-
F, m
ol k
g-1
(c)
0.000
0.001
0.002
0.003
0.004
0.005
0.006
0.007
0.008
0.0000 0.0002 0.0004 0.0006 0.0008 0.0010 0.0012
R2 = 0.9905
D3-
S, mol L-1
D3-
F, m
ol k
g-1
(d)
0.000
0.002
0.004
0.006
0.008
0.010
0.0000 0.0001 0.0002 0.0003 0.0004 0.0005
R2 = 0.9757
D4-
S, mol L-1
D4-
F, m
ol k
g-1
(e)
Fig. 7 Best-fit curves of reported experimental data shown in Table 2 using the nonlinear sorption model: a Dataset 1, b Dataset 2,
c Dataset 3, d Dataset 4 and e Dataset 5
Cellulose (2012) 19:615–625 621
123
Page 8
R2 ¼ 1�P½Dz��S � ½Dz��Fit
S
� 2
P½Dz��S � ½Dz��S� �2
ð10Þ
where [Dz-]SFit is the value obtained from the nonlinear
curve fitting corresponding to the observed value of
[Dz-]S, and ½Dz��S is the mean of all [Dz-]S values. The
best-fit values of parameters V and -Dl� as well as
their reported values are summarized in Table 3.
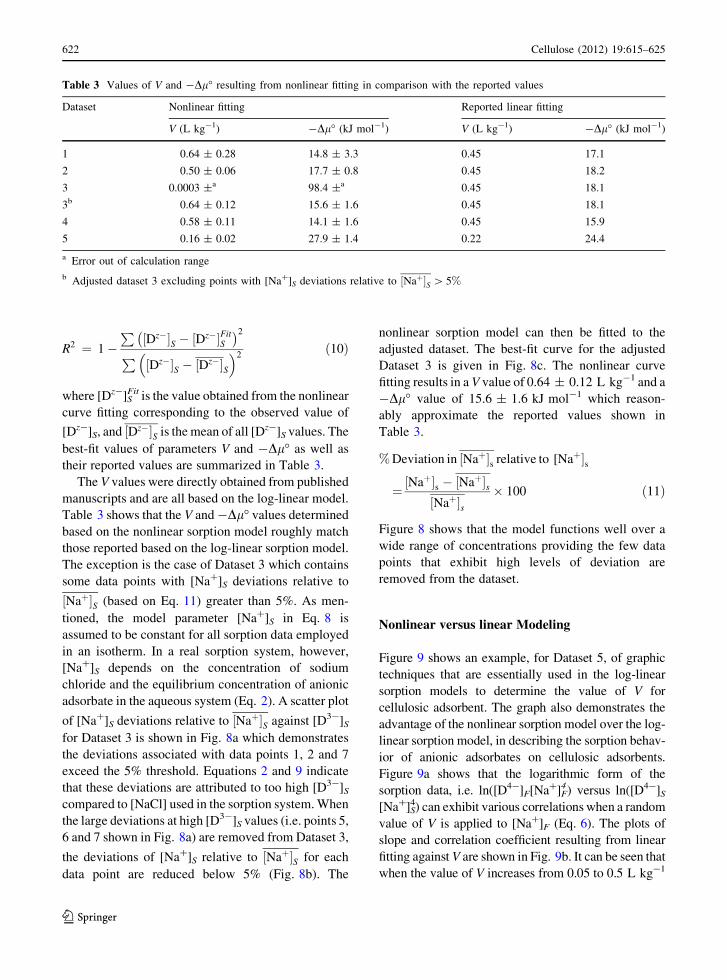
The V values were directly obtained from published
manuscripts and are all based on the log-linear model.
Table 3 shows that the V and -Dl� values determined
based on the nonlinear sorption model roughly match
those reported based on the log-linear sorption model.
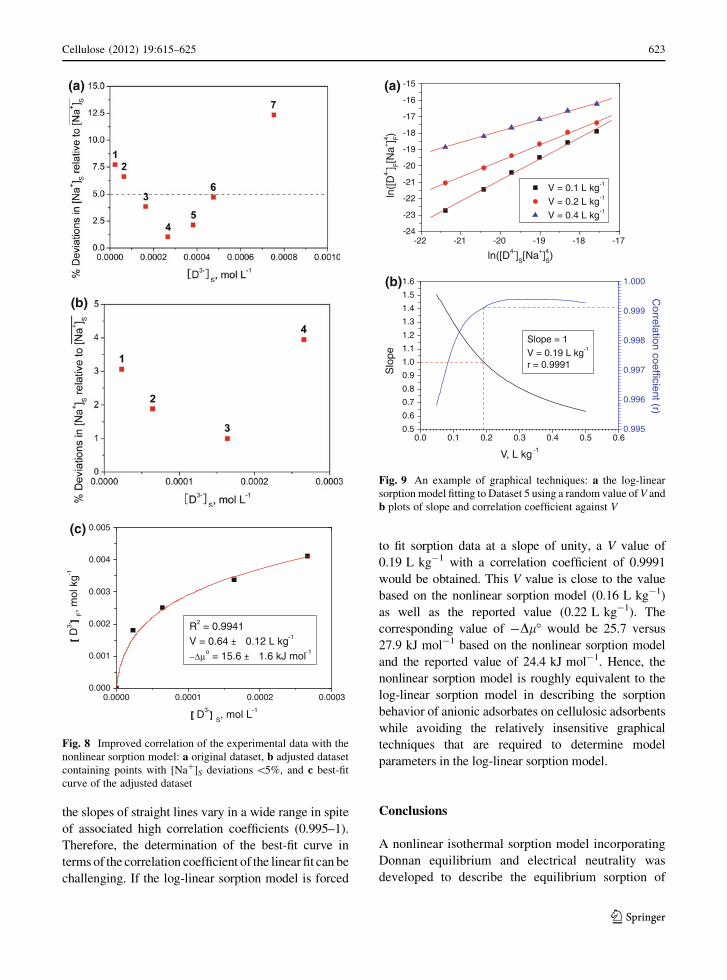
The exception is the case of Dataset 3 which contains
some data points with [Na?]S deviations relative to
½Naþ�S (based on Eq. 11) greater than 5%. As men-
tioned, the model parameter [Na?]S in Eq. 8 is
assumed to be constant for all sorption data employed
in an isotherm. In a real sorption system, however,
[Na?]S depends on the concentration of sodium
chloride and the equilibrium concentration of anionic
adsorbate in the aqueous system (Eq. 2). A scatter plot
of [Na?]S deviations relative to ½Naþ�S against [D3-]S
for Dataset 3 is shown in Fig. 8a which demonstrates
the deviations associated with data points 1, 2 and 7
exceed the 5% threshold. Equations 2 and 9 indicate
that these deviations are attributed to too high [D3-]S
compared to [NaCl] used in the sorption system. When
the large deviations at high [D3-]S values (i.e. points 5,
6 and 7 shown in Fig. 8a) are removed from Dataset 3,
the deviations of [Na?]S relative to ½Naþ�S for each
data point are reduced below 5% (Fig. 8b). The
nonlinear sorption model can then be fitted to the
adjusted dataset. The best-fit curve for the adjusted
Dataset 3 is given in Fig. 8c. The nonlinear curve
fitting results in a V value of 0.64 ± 0.12 L kg-1 and a
-Dl� value of 15.6 ± 1.6 kJ mol-1 which reason-
ably approximate the reported values shown in
Table 3.
% Deviation in ½Naþ�s relative to [Naþ�s
¼ ½Naþ�s � ½Naþ�s½Naþ�s
� 100 ð11Þ
Figure 8 shows that the model functions well over a
wide range of concentrations providing the few data
points that exhibit high levels of deviation are
removed from the dataset.
Nonlinear versus linear Modeling
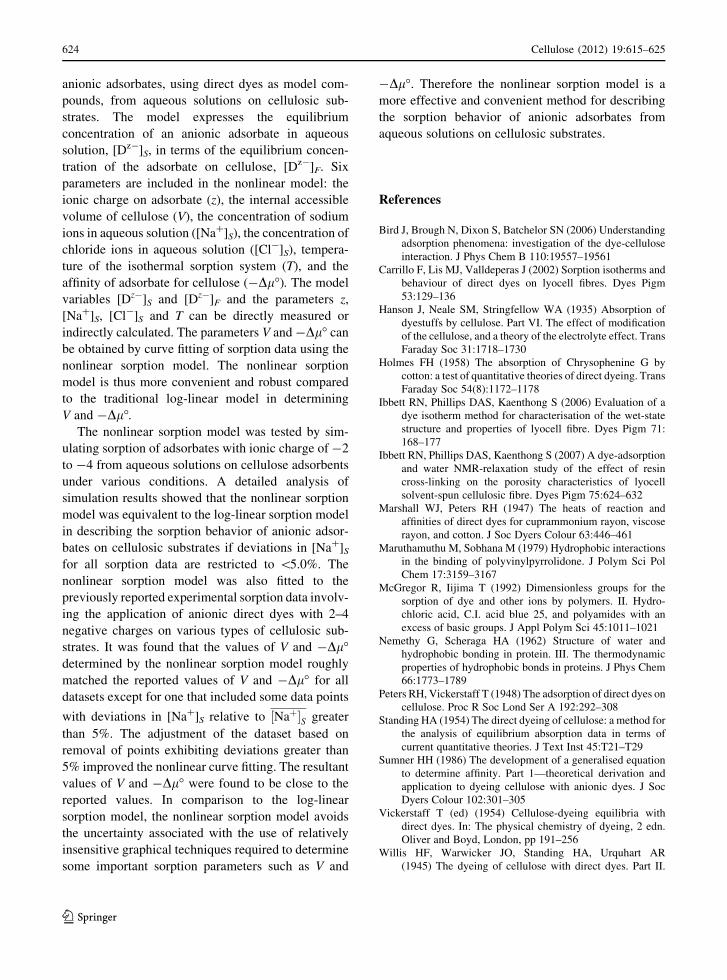
Figure 9 shows an example, for Dataset 5, of graphic
techniques that are essentially used in the log-linear
sorption models to determine the value of V for
cellulosic adsorbent. The graph also demonstrates the
advantage of the nonlinear sorption model over the log-
linear sorption model, in describing the sorption behav-
ior of anionic adsorbates on cellulosic adsorbents.
Figure 9a shows that the logarithmic form of the
sorption data, i.e. ln([D4-]F[Na?]F4) versus ln([D4-]S
[Na?]S4) can exhibit various correlations when a random
value of V is applied to [Na?]F (Eq. 6). The plots of
slope and correlation coefficient resulting from linear
fitting against V are shown in Fig. 9b. It can be seen that
when the value of V increases from 0.05 to 0.5 L kg-1
Table 3 Values of V and -Dl� resulting from nonlinear fitting in comparison with the reported values
Dataset Nonlinear fitting Reported linear fitting
V (L kg-1) -Dl� (kJ mol-1) V (L kg-1) -Dl� (kJ mol-1)
1 0.64 ± 0.28 14.8 ± 3.3 0.45 17.1
2 0.50 ± 0.06 17.7 ± 0.8 0.45 18.2
3 0.0003 ±a 98.4 ±a 0.45 18.1
3b 0.64 ± 0.12 15.6 ± 1.6 0.45 18.1
4 0.58 ± 0.11 14.1 ± 1.6 0.45 15.9
5 0.16 ± 0.02 27.9 ± 1.4 0.22 24.4
a Error out of calculation range
b Adjusted dataset 3 excluding points with [Na?]S deviations relative to ½Naþ�S [ 5%
622 Cellulose (2012) 19:615–625
123
Page 9
the slopes of straight lines vary in a wide range in spite
of associated high correlation coefficients (0.995–1).
Therefore, the determination of the best-fit curve in
terms of the correlation coefficient of the linear fit can be
challenging. If the log-linear sorption model is forced
to fit sorption data at a slope of unity, a V value of
0.19 L kg-1 with a correlation coefficient of 0.9991
would be obtained. This V value is close to the value
based on the nonlinear sorption model (0.16 L kg-1)
as well as the reported value (0.22 L kg-1). The
corresponding value of -Dl� would be 25.7 versus
27.9 kJ mol-1 based on the nonlinear sorption model
and the reported value of 24.4 kJ mol-1. Hence, the
nonlinear sorption model is roughly equivalent to the
log-linear sorption model in describing the sorption
behavior of anionic adsorbates on cellulosic adsorbents
while avoiding the relatively insensitive graphical
techniques that are required to determine model
parameters in the log-linear sorption model.
Conclusions
A nonlinear isothermal sorption model incorporating
Donnan equilibrium and electrical neutrality was
developed to describe the equilibrium sorption of
0.000
0.001
0.002
0.003
0.004
0.005
0.0000 0.0001 0.0002 0.0003
R2 = 0.9941V = 0.64 0.12 L kg-1
−Δμo = 15.6 1.6 kJ mol-1
D3-
S, mol L-1
D3-
F, m
ol k
g-1
(c)
(b)
(a)
Fig. 8 Improved correlation of the experimental data with the
nonlinear sorption model: a original dataset, b adjusted dataset
containing points with [Na?]S deviations \5%, and c best-fit
curve of the adjusted dataset
-22 -21 -20 -19 -18 -17-24
-23
-22
-21
-20
-19
-18
-17
-16
-15
V = 0.1 L kg-1
V = 0.2 L kg-1
V = 0.4 L kg-1
ln([
D4-] F
[Na+
]4 F)
ln([D4-]S[Na+]4
S)
(a)
0.0 0.1 0.2 0.3 0.4 0.5 0.60.5
0.6
0.7
0.8
0.9
1.0
1.1
1.2
1.3
1.4
1.5
1.6(b)
V, L kg -1
Slo
pe
Slope = 1V = 0.19 L kg-1
r = 0.9991
0.995
0.996
0.997
0.998
0.999
1.000
Correlation coefficient (r)
Fig. 9 An example of graphical techniques: a the log-linear
sorption model fitting to Dataset 5 using a random value of V and
b plots of slope and correlation coefficient against V
Cellulose (2012) 19:615–625 623
123
Page 10
anionic adsorbates, using direct dyes as model com-
pounds, from aqueous solutions on cellulosic sub-
strates. The model expresses the equilibrium
concentration of an anionic adsorbate in aqueous
solution, [Dz-]S, in terms of the equilibrium concen-
tration of the adsorbate on cellulose, [Dz-]F. Six
parameters are included in the nonlinear model: the
ionic charge on adsorbate (z), the internal accessible
volume of cellulose (V), the concentration of sodium
ions in aqueous solution ([Na?]S), the concentration of
chloride ions in aqueous solution ([Cl-]S), tempera-
ture of the isothermal sorption system (T), and the
affinity of adsorbate for cellulose (-Dl�). The model
variables [Dz-]S and [Dz-]F and the parameters z,
[Na?]S, [Cl-]S and T can be directly measured or
indirectly calculated. The parameters V and -Dl� can
be obtained by curve fitting of sorption data using the
nonlinear sorption model. The nonlinear sorption
model is thus more convenient and robust compared
to the traditional log-linear model in determining
V and -Dl�.
The nonlinear sorption model was tested by sim-
ulating sorption of adsorbates with ionic charge of -2
to -4 from aqueous solutions on cellulose adsorbents
under various conditions. A detailed analysis of
simulation results showed that the nonlinear sorption
model was equivalent to the log-linear sorption model
in describing the sorption behavior of anionic adsor-
bates on cellulosic substrates if deviations in [Na?]S
for all sorption data are restricted to \5.0%. The
nonlinear sorption model was also fitted to the
previously reported experimental sorption data involv-
ing the application of anionic direct dyes with 2–4
negative charges on various types of cellulosic sub-
strates. It was found that the values of V and -Dl�determined by the nonlinear sorption model roughly
matched the reported values of V and -Dl� for all
datasets except for one that included some data points
with deviations in [Na?]S relative to ½Naþ�S greater
than 5%. The adjustment of the dataset based on
removal of points exhibiting deviations greater than
5% improved the nonlinear curve fitting. The resultant
values of V and -Dl� were found to be close to the
reported values. In comparison to the log-linear
sorption model, the nonlinear sorption model avoids
the uncertainty associated with the use of relatively
insensitive graphical techniques required to determine
some important sorption parameters such as V and
-Dl�. Therefore the nonlinear sorption model is a
more effective and convenient method for describing
the sorption behavior of anionic adsorbates from
aqueous solutions on cellulosic substrates.
References
Bird J, Brough N, Dixon S, Batchelor SN (2006) Understanding
adsorption phenomena: investigation of the dye-cellulose
interaction. J Phys Chem B 110:19557–19561
Carrillo F, Lis MJ, Valldeperas J (2002) Sorption isotherms and
behaviour of direct dyes on lyocell fibres. Dyes Pigm
53:129–136
Hanson J, Neale SM, Stringfellow WA (1935) Absorption of
dyestuffs by cellulose. Part VI. The effect of modification
of the cellulose, and a theory of the electrolyte effect. Trans
Faraday Soc 31:1718–1730
Holmes FH (1958) The absorption of Chrysophenine G by
cotton: a test of quantitative theories of direct dyeing. Trans
Faraday Soc 54(8):1172–1178
Ibbett RN, Phillips DAS, Kaenthong S (2006) Evaluation of a
dye isotherm method for characterisation of the wet-state
structure and properties of lyocell fibre. Dyes Pigm 71:
168–177
Ibbett RN, Phillips DAS, Kaenthong S (2007) A dye-adsorption
and water NMR-relaxation study of the effect of resin
cross-linking on the porosity characteristics of lyocell
solvent-spun cellulosic fibre. Dyes Pigm 75:624–632
Marshall WJ, Peters RH (1947) The heats of reaction and
affinities of direct dyes for cuprammonium rayon, viscose
rayon, and cotton. J Soc Dyers Colour 63:446–461
Maruthamuthu M, Sobhana M (1979) Hydrophobic interactions
in the binding of polyvinylpyrrolidone. J Polym Sci Pol
Chem 17:3159–3167
McGregor R, Iijima T (1992) Dimensionless groups for the
sorption of dye and other ions by polymers. II. Hydro-
chloric acid, C.I. acid blue 25, and polyamides with an
excess of basic groups. J Appl Polym Sci 45:1011–1021
Nemethy G, Scheraga HA (1962) Structure of water and
hydrophobic bonding in protein. III. The thermodynamic
properties of hydrophobic bonds in proteins. J Phys Chem
66:1773–1789
Peters RH, Vickerstaff T (1948) The adsorption of direct dyes on
cellulose. Proc R Soc Lond Ser A 192:292–308
Standing HA (1954) The direct dyeing of cellulose: a method for
the analysis of equilibrium absorption data in terms of
current quantitative theories. J Text Inst 45:T21–T29
Sumner HH (1986) The development of a generalised equation
to determine affinity. Part 1—theoretical derivation and
application to dyeing cellulose with anionic dyes. J Soc
Dyers Colour 102:301–305
Vickerstaff T (ed) (1954) Cellulose-dyeing equilibria with
direct dyes. In: The physical chemistry of dyeing, 2 edn.
Oliver and Boyd, London, pp 191–256
Willis HF, Warwicker JO, Standing HA, Urquhart AR
(1945) The dyeing of cellulose with direct dyes. Part II.
624 Cellulose (2012) 19:615–625
123
Page 11
The absorption of chrysophenine by cellulose sheet. Trans
Faraday Soc 41:506–541
Yamaki SB, Barros DS, Garcia CM, Socoloski P, Oliveira ON,
Atvars TDZ (2005) Spectroscopic studies of the
intermolecular interactions of Congo Red and tinopal CBS
with modified cellulose fibers. Langmuir 21:5414–5420
Yang Y (1993) Hydrophobic interaction and its effect on cat-
ionic dyeing of acrylic fabric. Text Res J 63:283–289
Cellulose (2012) 19:615–625 625
123