Nonlinear Optics in Ultra-high-Q Whispering-Gallery Optical Microcavities Thesis by Tobias Jan August Kippenberg In Partial Fulfillment of the Requirements for the Degree of Doctor of Philosophy California Institute of Technology Pasadena, California 2004 (Defended July 19, 2004)
Transcript
Nonlinear Optics in Ultra-high-QWhispering-Gallery Optical Microcavities
Thesis by
Tobias Jan August Kippenberg
In Partial Fulfillment of the Requirements
for the Degree of
Doctor of Philosophy
California Institute of Technology
Pasadena, California
2004
(Defended July 19, 2004)
ii
c° 2004
Tobias Jan August Kippenberg
All Rights Reserved
iii
To my parents,
Hans and Karola,
iv
Acknowledgements
First and foremost I would like to thank my academic advisor, professor Kerry Vahala,
for the support and guidance he has provided me throughout my dissertation, but
also for the freedom he has given me to choose my research topics. He created a space
in which ideas could be explored without financial constraints. His scientific intuition
and insights have always been very helpful. Despite his at times busy schedule, he has
always made time for discussion. In addition to the scientific side, he has also provided
me with invaluable help in carefully planning and managing research projects. I have
always appreciated his calm, precise and carefully evaluating manner. I have truly
learned a lot during my thesis, which go beyond science itself, and thank professor
Vahala for this. Also, he had always had patience for the many, sometimes quiet
extended, trips to Europe I took during my dissertation.
Caltech is a truly special place, and I have deeply enjoyed having the privilege
to do my graduate work at such a unique institution, which hosts so many great
minds. I have enjoyed taking classes here, and it was my pleasure in particular to
take classes from great teachers, in particular Kerry Vahala, Hideo Mabuchi, Jeff
Kimble and Amnon Yariv. In the initial stages of my graduate work, I have greatly
profited from the experimental skills that my colleagues Dr. Per Olof Hedekvist, Dr.
Oskar Painter, Ashish Bhardwaj and Ming Cai have taught me. During my thesis
work, I have enjoyed interacting with other students and post-docs of my group, Dr.
Mark Brongersma, Bumki Min, Deniz Armani, Lan Yang and Hossein Rokhsari. In
particular I have enjoyed working with Sean Spillane, and we have been a team from
the first day I joined the group. I have shared an office and experimental setup with
him during my entire thesis, and our healthy competitive nature has always benefited
v
us both. We have equally shared the successes as well as the failures, and working
together has always been a source of motivation for me. It was a pleasure to work
with Sean, and I thank him for the many interesting and stimulating discussions
throughout the years.
In addition I have enjoyed working together with Professor Albert Polman from
the AMOLF institute during his sabbatical year in the group of professor Atwater in
2003. It was my pleasure to collaborate with him, and he provided me great insights
into a different area -material science-. I truly enjoyed our many stimulating and
interesting discussions, and I am glad to have had the opportunity to meet him.
Outside of Caltech, I would like to thank my friends, Will Green and Andy West-
head, for their friendship over the past 5 years. They have helped me many times. I
also thank Will Green for teaching and helping me with micro fabrication techniques.
In addition I have had great pleasure to join a team of highly motivated and talented
group of triathletes. Thanks to them, I always was well equilibrated and explored
Southern California. In particular I would like to thank Richard Byrd, John Moss,
Matt Connery and Peter Meinhold for taking me along on countless rides to the Seal
Beach, Malibu Creek canyon and to Mount Wilson. During the few thousands miles
we have cycled together I have enjoyed their friendship. The sometimes quiet intense
training not only showed me the limits of my endurance, but it also helped me to
achieve my goals outside of athletics.
Special thanks goes also to Carl Hansen, for his patience waiting for me on our
early-morning bike-rides (often more than the academic five minutes), which have
become a regular habit in the last three years. I will certainly miss the obligatory
Peet’s coffee and the interesting and stimulating discussions with him!
Last but not least, I wish to thank a special group of people. I am fortunate to
have met Anna Fontcuberta-i-Morral who has enriched my life in every aspect in the
last two years. I thank her for all the love and support. In addition, I wish to thank
my parents, my mother Karola and my father Hans and my brother Colin, for their
support, love and patience during my entire time at Caltech. Their support and help,
went far beyond the true fortune they have spend on transatlantic flights for me! In
vi
particular my father Hans, who I deeply admire, has provided me with invaluable
advice and help during my entire thesis, and helped me maneuver many challenging
situations. He was a constant source of inspiration and motivation for me. It is to
them, I wish to dedicate this thesis.
Pasadena, May 4th 2004
vii
List of Publications
[1] T. J. Kippenberg, S. M. Spillane, and K. J. Vahala. Modal coupling in traveling-
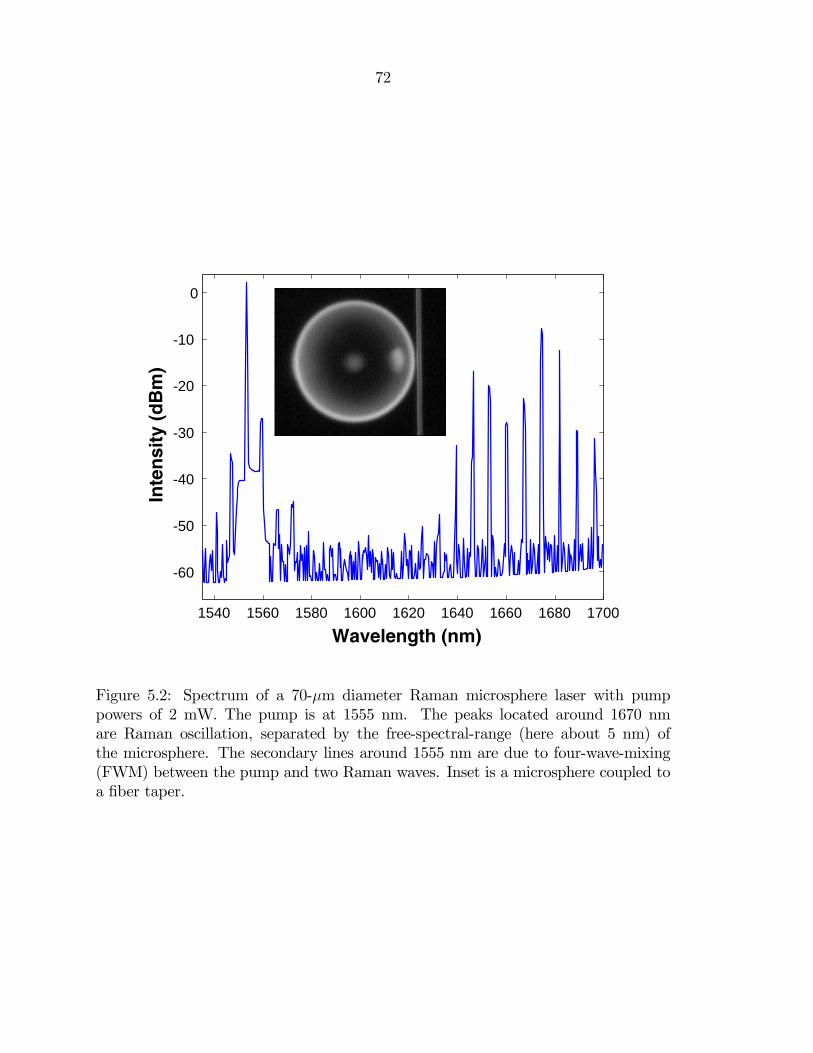
3Work in this chapter has been published in: "Fiber-coupled cascaded Raman laser", OpticsLetters, 2003 and "Theoretical and Experimental Analysis of Stimulated Raman scattering in ultra-high-Q optical microcavities", submitted (JSTQE).
4Section 1.1-1.3 have appeared in: "Ultra-high-Q toroid microcavity on a chip", Nature, 421, No.6926 (2003). Remaining sections are in preparation (2004).
A.1 Nonlinear optical effects associated with the third-order susceptibility . 161
xxi
Glossary of Acronyms
WGM Whispering-gallery mode
XPM Cross-phase modulation
FWM Four-wave mixing
UHQ Ultra-high Q
SPM Self-phase modulation
SEM Scanning electron microscope
SRS Stimulated Raman scattering
SBS Stimulated Brillouin scattering
STIM Surface-tension-induced microcavity
LL Light-in light-out
FSR Free-spectral-range
OSA Optical spectrum analyzer
1
2
Chapter 1
Introduction
Optical microcavities are used to confine light both spatially and temporally. The
spatial confinement is typically described by the mode volume (V), whereas the tem-
poral confinement is described by the quality factor (Q), which is the photon storage
time, normalized with respect to the frequency of oscillation. Surface-tension-induced-
microcavities, such as micro droplets or microspheres, are dielectric cavities which are
created by surface tension and which exhibit a near atomic scale surface finish. Light
within the sphere is confined by continuous total internal reflection near the cavity
perimeter, and the modes have therefore been called "whispering-gallery" modes. Of
all geometries studied for confining light, surface-tension induced silica microspheres
have attained the highest optical quality-factors (Q) to date of nearly 10 billion [1],
and are of interest for a variety of studies ranging from fundamental physics such as
cavity Quantum Electrodynamics [2][3][4] to more applied areas such as low thresh-
old and narrow line-width lasers [5][6][7], as well as high-sensitivity transducers for
biochemical sensing[8]. The small mode volume and long photon storage time can
also be used for nonlinear optical studies, as strong resonant buildup of energy in
micro-scale volumes significantly reduces the threshold for nonlinear optical effects
to occur. This was recognized in the pioneering work of Chang [9][10] and Campillo
[11][12][13]who observed and studied a variety of nonlinear optical effects in ultra-
high-Q liquid micro-droplets. Their work used free-space illumination to optically
pump the micro-droplets and thereby induce Raman oscillation [10][11][13], cascaded
Raman scattering [10] and Brillouin scattering[14]. However, due to their transient
3
nature, liquid micro-droplets have remained a mere laboratory tool, and the pump
threshold for nonlinear effects have remained high, despite ultra-high Q, due to the
low efficiency of free-space excitation. Furthermore, despite a wealth of reported
nonlinear optical microcavity effects, parametric oscillation has not been observed so
far.
Silica microspheres provide a far more stable and robust microcavity in compar-
ison with liquid micro-droplets. However, despite numerous studies on these devices
over the past decade [15][16][17][18][19][20][21] [22][23]the observation of nonlinear
phenomena (beyond thermal effects) in these devices, had been limited to one report
on Kerr-induced wavelength shifts at low temperatures [18].
1.1 Thesis outline
In this thesis the stimulated and parametric nonlinear optical processes in ultra-high-
Q silica microcavities are investigated and analyzed for the first time. To pump the
optical whispering-gallery modes of the silica microcavities efficiently, tapered optical
fibers were used[24][25]. It is demonstrated that the excitation using tapered opti-
cal fibers can be highly efficient [26], and can allow to couple to silica microcavities
with negligible parasitic (junction induced) loss. Ultra-high-Q microcavities naturally
transit into a regime, where surface scattering centers can render the degenerate clock-
wise and counterclockwise mode strongly coupled, giving rise to the regime of strong
modal coupling[27]. It is shown that in this regime the tapered-optical fiber coupling
properties are significantly altered. The whispering-gallery modes appear significantly
split, and behave as a frequency selective mirror. It is shown, that even in the pres-
ence of modal coupling, high circulating power within the cavity can be achieved.
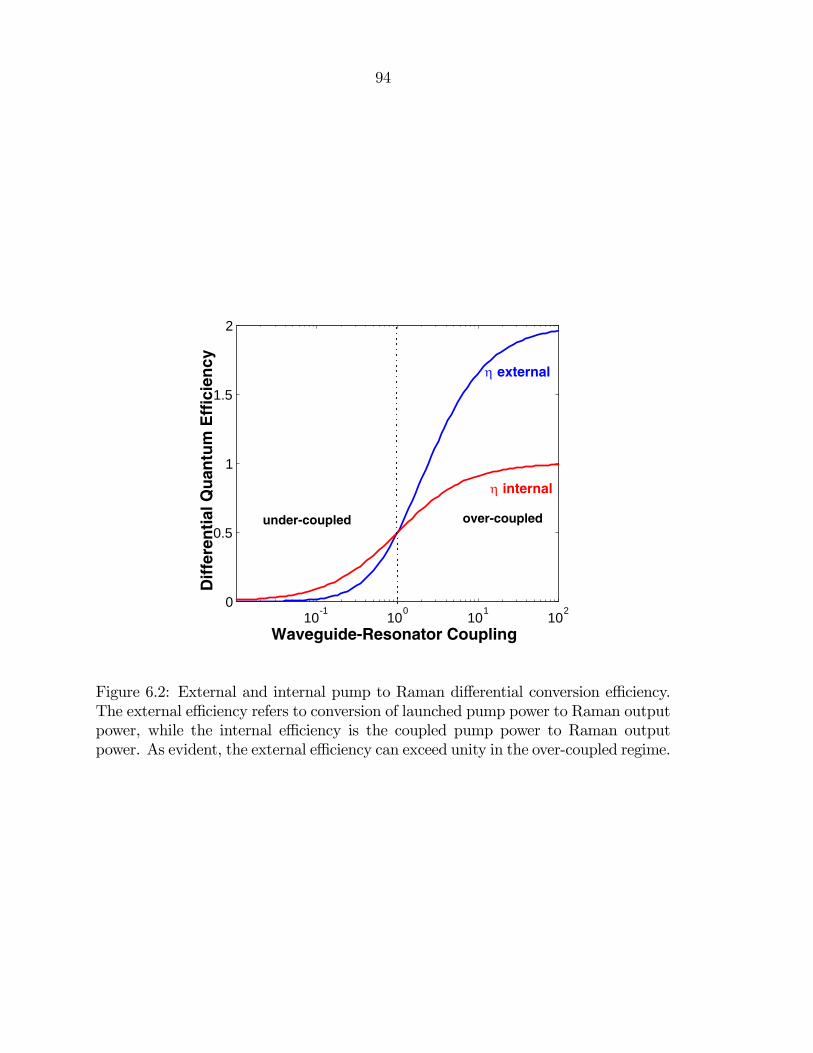
and allowing to exceed the threshold for all common nonlinear optical effects of silica.
Stimulated Raman scattering, the interaction of light with optical phonons of silica,
is observed in fiber-coupled silica microspheres and the measured threshold for non-
linear oscillation are lower than for any other nonlinear optical oscillator reported to
4
date. In particular, a silica micro-sphere Raman lasers with ultra-low threshold levels
of only 62 µ-Watts [28] is demonstrated in this thesis. Compared to micro-droplets
these devices allow stable and long term observation of nonlinear optical effects in
microcavities. Cascaded Raman lasing in these devices of up to 5 orders has also been
observed [29][5] and the lasing properties analyzed theoretically and experimentally.
The tapered optical fiber in these experiments functions to both pump WGMs as
well as to extract the nonlinear Raman fields. In addition, the tapered-fiber coupling
junction is highly ideal[26], making it possible to strongly over-couple ultra-high-Q
cavities with negligible junction loss. This feature allows for the observation of very
high internal differential photon conversion efficiencies approaching unity[5].
Whereas microspheres are both compact and efficient nonlinear oscillators, their
fabrication properties lack the control and parallelism typical of micro-fabrication
techniques. In this thesis the optical properties of toroid microcavities on-a-chip
[30] are analyzed, and ultra-high-Q modes (UHQ) demonstrated. The measured Q-
factors in this thesis constitute an improvement in Q-factor of nearly 4 orders of
magnitude compared to other chip-based microcavities. UHQ toroids have several
advantages over spheres including being wafer-scale devices that can be fabricated
in parallel as dense arrays or integrated with electronics or complementary optical
functionality. The use of toroid microcavities as nonlinear oscillators is investigated,
and the first Raman oscillator on a chip is demonstrated[8]. The reduced mode volume
of toroid microcavities, allow to observe stimulated Raman scattering at effectively
lower threshold than in microspheres. In addition the strongly reduced azimuthal
degree of freedom, allowed to obtain single mode Raman lasing, over a large range of
pump powers. This constitutes a significant advantage over micro-spheres and micro-
droplets. Furthermore, the effect of the toroid geometry on the nonlinear optical
effects is studied and is found to profoundly alter the nonlinear optical processes in the
microcavity. Specifically, a reduction of the toroid cross sectional diameter, allowed to
induce a shift from stimulated Raman to Parametric oscillation regime. This allowed
to observe Kerr nonlinearity optical parametric oscillation in a microcavity for the
first time. Optical parametric is observed at ultra-low threshold and high efficiency,
5
and the generated signal-idler "twin beam" show near unity signal-to-idler ratio[9].
1.2 Chapter overview and collaborative work
The results of the author presented in this thesis were to a large extent performed in
collaborative work with his colleagues. In what follows the results of the individual
chapters are given and the relative contributions indicated.
Chapter 2 is a self contained introduction to spherical dielectric resonators (silica
microspheres). The resonant characteristics of microspheres, such as their field dis-
tribution, mode volume and radiation loss are discussed and serve as an introduction
to the terminology which is used throughout this thesis.
Chapter 3 describes the experimental infrastructure the author has implemented
jointly with his colleague Sean Spillane to continue work on microspheres resonators,
that had initially be been started by graduate student Ming Cai. The experimental
setup for fabrication of tapered optical fibers, as well as measurements the author
performed on silica microspheres are described. The up-conversion pictures in chapter
1 were obtained from microspheres which were implanted with erbium ions, a task
Jeroen Kalkman from the group of Albert Polman at AMOLF accomplished.
Chapter 4 investigates the influence of strong mode splitting (which is commonly
observed, due to the sensitive nature of the ultra-high-Q microcavities to surface
defects) on the coupling properties of tapered optical fiber. In particular, the author
has observed and described the coupling properties in the regime of strong modal
coupling, in which the resonator mimics a frequency selective reflector. This chapter
has appeared in Optics Letters [27]. In addition these measurements were carried
out in the presence of negligible parasitic loss, a property which has been further
investigated by his colleague Sean Spillane and which has appeared in Physical Review
Letters[31].
Chapter 5 describes the observation of ultra-low threshold stimulated Raman
lasing in taper-fiber coupled silica microspheres, which the author studied and ex-
6
plored in collaboration with his colleague Sean Spillane. Threshold values which are
more than 3 orders of magnitude lower than in previous work have been obtained.
This chapter has been published in Nature[31].
Chapter 6 presents a theoretical and experimental analysis of stimulated and cas-
caded Raman scattering in taper coupled micro-spheres resonators, and complements
the results of chapter 4. The author investigated the properties of cascaded Raman
scattering theoretically, which Bumki Min verified experimentally. This chapter has
been published in Optics Letters [32] and IEEE Journal of Quantum Electronics [5].
Chapter 7, describes the optical properties of the whispering-gallery type modes
of toroid microcavities. The author describes a cavity ring-down measurement setup
he implemented to obtain measurements of Q-factor. The method allowed to ac-
curately measure photon lifetimes, at high circulating cavity intensity. Using this
technique, the author spend one summer continuing measurement his colleague Sean
Spillane and Deniz Armani had started, in trying to observe ultra high-Q factors in
toroidal microcavities on a chip. The author was finally was successful in the sum-
mer of 2002, in demonstrating ultra-high-Q modes in a toroid microcavity on a chip.
The samples for these measurements have been made by the author’s colleague Deniz
Armani. The measurements in this chapter have been published in Nature[33]. In
addition the author investigated the extend to which the micro-torpid geometry could
be reduced, and demonstrated a Q/V ratio of more than 106 (λ/n)−3 .
In Chapter 8 the author investigates the optical modes of disk microcavities.
Disks and toroid microcavities can be excited efficiently using tapered optical fibers.
Surprisingly, disk microcavities allow to observed Q-factors as high as 107 which is
already nearly 3 orders of magnitude higher than in any other reported chip-based
whispering-gallery devices (but lower than in toroid microcavities). The effect is
attributed due to the wedge shaped cavity boundary which causes modal isolation.
This chapter appeared in Applied Physics Letters[34].
Chapter 9 demonstrates the first Raman oscillator on a chip using toroid mi-
crocavities. Raman oscillation in toroid microcavities is compared to micro-sphere
resonators, and found to exhibit intrinsically more favorable properties, such as single
7
mode emission and lower effective pump threshold. The work heavily relied on micro-
cavities with ultra-high-Q optical modes, which the author fabricated and obtained
with very high reproducibility. This work has been published in Optics Letters[8].
Chapter 10 presents the first observation the author made of Kerr nonlinearity
induced parametric oscillation in a microcavity. The cavity in this regime paramet-
rically converts a pair of pump photons into a frequency down-shifted signal and
frequency up-shifted idler photons, and near unity signal-idler ratio is observed. As
parametric interaction does not involve coupling to a dissipative reservoir, and the
parametric process creates simultaneously signal-idler photon pairs, the emitted light
should exhibit non-classical correlations. The numerical simulations in this chapter
have been carried out by the author’s colleague Sean Spillane. The author submitted
this work to Physical Review Letters[9].
InAppendix A the coupled wave equations for third order nonlinear phenomena
are derived. Starting from the coupled wave equations for plane waves, the equations
are reformulated for the whispering-gallery modes of a microcavity. The modified
coupling coefficients are given, and the definition of the effective mode volume is
discussed.
In Appendix B the Helmholtz equation is derived for the case of a whispering
gallery mode resonator. The optical modes were numerically modeled using a finite
element PDE eigenmode and eigenfrequency solver and the numerical results are
compared to analytical solutions and good agreement was found. The method in this
chapter has been used for the numerical simulations presented in chapter 7,8,9.
In Appendix C the fabrication of toroid and disk microcavities is described. The
fabrication sequence was originally started by Deniz Armani and Sean Spillane. The
author has made the fabrication process more reproducible (in terms of obtaining
ultra-high Q factors). A variation of the fabrication technique investigated by the
author is also presented, which allows to obtain more geometric control over the
toroid geometry parameters.
8
Chapter 2
Optical modes of dielectric spheres(Microsphere Resonators)
2.1 Introduction
The modes of a spherical dielectric particle were first investigated by Mie at the
beginning of the 19th century, in the context of light scattering from spherical parti-
cles. The scattering spectrum exhibited sharp features, which can be attributed to
resonant circulation of optical energy within the sphere. These optical modes are
confined by continuous total internal reflection at the dielectric air interface and are
often referred to as ’whispering-gallery modes’. This description originated from the
"problem of the whispering-gallery" which Lord Rayleigh published in 1912[35], de-
scribing the phenomenon of acoustical waves he had observed propagating around the
interior gallery of the Saint Paul’s Cathedral1. In the following sections, the resonant
characteristics of spherical dielectric particles (silica microspheres), such as their field
distribution, mode volume, radiation loss etc. are discussed and serve as an introduc-
tion to the terminology which is used throughout this thesis. Approximate formulas
for the free-spectral range and whispering-gallery loss for the experimentally relevant
wavelength and size range are given.
1Some author have also referred to these modes as "morphology dependent resonances" ( MDRs),however this terminology has not been widely adopted.
9
2.2 Optical modes of a dielectric sphere
The optical modes of a spherical dielectric particle can be calculated by solving
Helmholtz equation in spherical coordinates2, which has been treated by several au-
thors (in particular see reference [36] for a comprehensive overview). A significant sim-
plification occurs if the sphere consists of a homogeneous dielectric, and if the optical
modes reflect with grazing incidence upon the dielectric-air boundary, such that the
polarization can be assumed to be constant along the optical trajectories. Under this
assumption the optical modes can be solved by the scalar wave equation approxima-
tion and solutions fall into two classes, and are either electric in character (TM-case)
or magnetic in character (TE-case). The field components can be expressed in terms
of a single field components (Eφ for the TM-case or Hφ for the TE-case) and solutions
are found by solving the scalar wave equation for either the Eφ or Hφ alone by the
separation of variables approach, i.e. Eφor Hφ = ψ(φ, θ, r) = ψφ(φ)ψθ(θ)ψr(r). TE
modes possess an electric field is parallel to the surface of the sphere (i.e. Eφ = Er = 0,
i.e. E||−→θ ),whereas the TM modes possess a magnetic field which is parallel to the
surface of the sphere, i.e. (i.e. Hφ = Hr = 0, i.e.H||−→θ ). As a result, the electric
field distribution of TM modes is predominantly radial in character. The introduced
eigenfunctions for the radial, azimuthal and polar fields can be associated with the
radial mode number (n), the polar mode number ( ) and the azimuthal mode number
(m) as well as the polarization (p). The azimuthal eigenfunctions are given by3:
ψφ =1√2πexp(±imφ) (2.1)
By introducing the polar mode number , the equation for ψθ is given by:
1
cos(θ)
d
dθ
µcos(θ)
d
dθψθ
¶− m2
cos(θ)2ψθ + ( + 1)ψθ = 0 (2.2)
2Helmholtz equation¡∇2 − k2n2
¢ψ = 0 in spherical coordinates is given by: 1
r2∂2
∂r2 (rψ) +1
r sin(θ)∂∂r
¡sin(θ) ∂∂θψ
¢+ 1
r2 sin2(θ)∂2
∂φ2ψ − n2k2ψ = 0
3The separation of variables approach leads to the introduction of the azimuthal and angularmode number, 1
ψφ
d2
dφ2ψφ = const ≡ −m2 and r
ψr
d2
dr2 (rψr) = const ≡ ( + 1).
10
And finally the radial field ψr has to obey:
d2
dr2ψr +
2
r
d
drψr +
µk2n(r)2 − ( + 1)
r2
¶ψr = 0 (2.3)
The last two equations possess analytical solutions in terms of the generalized Legen-
dre Polynomials Pm(cos θ) (which are commonly re-expressed as the spherical Har-
monics Ym(θ)) and the Bessel functions j (kr). For each polar mode number , the
allowed azimuthal mode numbers are in the range of − < m < , leading to a 2 +1
degeneracy of the azimuthal modes.
2.3 Intensity distribution for a microsphere WGM
The field distribution and the resonance locations are determined by matching the
solutions interior and exterior to the sphere at the dielectric-air boundary[37], leading
to a characteristic equation. For a microsphere this requires matching the Bessel
function jl(ka) and the outgoing Hankel functions hl(ka) at the dielectric boundary.
The characteristic equation for this case is given by:
x · j0l(ka)
jl(ka)=
h0l(ka)
hl(ka)where x =
∙ 1mfor TM
m for TE
¸(2.4)
The latter equation depends only on the angular mode number (reflecting the
aforementioned 2 + 1 degeneracy, with respect to the azimuthal mode number m).
Figure 2.1 shows the solution to the radial equation for the first three radial mode
numbers. The radial mode number gives the number of field maxima. Outside
the microsphere the fields decays exponentially (where the decay length increases
as a function of the radial mode number n). The complete intensity profile of the
Eφ−component (i.e. TM polarization) in the (r, θ) plane is given in figure 2.2 for
a microsphere of 25-µm-diameter, and was obtained by numerical modeling using a
finite element PDE-eigenmode solver package (see Appendix B). The field outside the
microsphere is evanescent and exhibits exponential decay which is slower for higher
11
order radial mode numbers.
2.4 Asymptotic solutions
A very useful formula is given in reference [38] where the approximate resonance lo-
cations are derived by asymptotic expansion of the characteristics equation in powers
of −1/3. The first 4 terms in the expansion are given by:
ωnm p =c
naR
"+ 1
2
m− t0n
m
µ+ 1
2
2
¶1/3+
−p√m2 − 1
+
µ+ 1
2
2
¶−1/3(t0n)
2
20m+O
µ+ 1
2
2
¶−2/3#(2.5)
In this equation m is the relative index of refraction m = na/ns (na index of the
medium outside the sphere), is the angular mode number, t0n is the nth zero of the
Airy function Ai(−t0n) = 0 (and corresponds to the nth-order Radial mode) and p is
a coefficient related to the polarization given by:
p =
½1 TE1/m2 TM
¾
The expansion can be used to relate the polar mode number to the experimentally
measured free-spectral range of the cavity. The latter is defined as the distance
between successive azimuthal mode numbers and is given by the expression:
∆ωFSR ≡ |ωnm − ωnm +1| ≈À1c
naR
µ1
m− t0n
−2/3
3
¶(2.6)
For the microspheres considered in this thesis, the resonance wavelength is located in
the 1550-nm telecommunication band and the corresponding free-spectral-range as a
function of mode number is shown in 2.3 for a fundamental WGM (n = 1, = m).
12
6 7 8 9 10 11 120
2
4
6
8
10
12
14x 1015
No
rmal
ized
Rad
ial I
nte
nsi
ty
6 7 8 9 10 11 120
2
4
6
8
10
12
14x 1015
No
rmal
ized
Rad
ial I
nte
nsi
ty
6 7 8 9 10 11 120
2
4
6
8
10
12
14x 1015
Radius (µm)
No
rmal
ized
Rad
ial I
nte
nsi
ty
n=1l=51R=10µmTM
n=2l=51R=10µmTM
n=3l=51R=10µmTM
Figure 2.1: Calculated intensity distribution |Eφ|2 in the radial direction for a mi-crosphere with principal radius 10 µm and angular mode number = 51 (λ ≈ 1550nm) for the first three radial mode numbers (n = 1, 2, 3). The evanescent field iscolor coded in red, and exhibits a slower decay for higher order radial numbers (n).
13
Figure 2.2: Numerical modeling of the intensity profile ( |Eφ|2) of the whispering-gallery modes of a 25-µm−diameter microsphere, with polarization TM. In a perfectsphere modes with different azimuthal, but same radial and polar mode number, arefrequency degenerate.
14
5 10 15 20 25 30 35
20
40
60
80
100
120
140
Free-Spectral range ( ∆λFSR
in nm)
Mic
rosp
her
e R
adiu
s (µm
) n=1m=lλ≈1550nm
Figure 2.3: Free-spectral range ∆λFSR = |λnm − λnm +1| for a fundamental mi-crosphere mode (n = 1,m = l) with an polar mode number consistent witha resonance in the 1550 nm band. The dependence is accurately described byR[µm] = a · 1/∆λFSR[nm] + b, where a = 264, b = −0.51.
15
2.5 Eccentricity splitting
In an ideal sphere the optical modes possess a 2 + 1 degeneracy with respect to the
azimuthal mode number m. This can be understood by using classical ray optical
interpretation, in which the optical modes with same , but different m, orbit around
the equatorial plane by reflecting alternatingly from the lower to the upper hemisphere
(and vice-versa), thereby taking different excursions away from the equator. The wave-
vector associated with this trajectory is:
|βl| =( + 1)
R0
and the projection onto the equatorial plane (i.e. the propagation constant) is given
by:
|βm| =m
R0
The modes with low m take paths closer to the poles, and their longer path is com-
pensated by a reduced number of reflections at the dielectric-air interface to complete
one revolution. The so called fundamental modes, m = correspond to motion close
to the equatorial plane (with an angle θ ∝ 1√ ). Due to the invariable presence of im-
perfection, a microsphere will deviate from exact spherical shape, which will remove
the degeneracy in path-length. If the shape deformation is weak, the new resonance
frequencies can be calculated using perturbation theory. This has been treated in
reference [39]. Elegant analytical results can be obtained, by treating a sphere with
shape imperfections as a ellipsoid with radius r(θ) = r0(1 + 3(3 cos2 θ− 1)). Here the
eccentricity is related to the polar rp and equatorial radii re by = rp−reR0. This
leads to analytically exact formulas[39] in the case of an axially symmetric shape
distortion4, as given by:∆ωecc
ωnml= −
6
Ã1− 3 |m|
2
2
!(2.7)
4It is interesting to note, that in the case of shape distortions which are not axially symmetric,the mode number m is not a "good quantum number", i.e. it will leads to eigenstates which are alinear superpositions of states with different m.
16
Hence the splitting between modes with successive azimuthal mode number is given
by:
∆ωecc ≡ |ωnml − ωn,m+1,l| ≈ ωnml ·|m|+ 1/2
2(2.8)
2.6 Loss mechanisms in a microsphere
Due to the presence of loss mechanisms such as material absorption, scattering losses
or tunnel losses, the optical modes of a resonator are dissipative in character ("leaky")
and are referred to as "quasi-modes". Quasi-modes are distinct to their loss-less
counterparts (modes), and an excellent treatment on the properties of quasi-modes
can be found in chapter 1 of ref. [40]. The extent to which dissipation is present in
a resonant system is commonly expressed by the Quality-factor or Q-factor of the
mode, which is defined by the energy storage time normalized with respect to the
period of oscillation.
Q0 ≡ ωEstored
Pdiss= ωτ (2.9)
In this equation ω is the resonance frequency, Estored is the energy contained in the
resonant system, and Pdiss is the dissipated power. The above definition extends
beyond the domain of electromagnetism, and is also used to characterize mechanical
or electrical oscillators. Equivalently, in the case of optical microcavities the optical
Q-factor describes the photon lifetime of a mode. In the case of a microsphere, the
total Q-factor is comprised of several loss contributions: intrinsic material absorption,
scattering losses (both intrinsic, as well as inherent to the surface of the cavity),
surface absorption losses (e.g. due to the presence of adsorbed water), whispering-
gallery loss (or tunnel loss) and external coupling losses to a "useful" external mode
In the following sections the limits imposed by the different mechanisms are briefly
reviewed and analyzed, for the case of silica microspheres involved in this work.
17
2.6.1 Intrinsic material loss
Silica has a large transparency window and exhibits low absorption losses. The
minimum loss occurs at 1.55 µm, for which it has become the operating wavelength
for fiber-optic telecommunications. The loss at 1.55 µm is 0.2dB/km and is equally
comprised of absorption loss and loss due to Rayleigh scattering, which translates
into an absorption limited Q of:
Qabs0 =
2πneffλα
≈ 2.92× 10¹⁰ (2.11)
Absorption limited Q-factors have indeed be observed in large diameter (>200 µm)
microspheres[41]. However for most of the work presented in this thesis absorption
due to water, as well as surface scattering centers (as will be discussed in chapter 3)
have presented a natural limitation of Q, with the highest Q-factor measured being
˜2× 10⁹ in the 1550 nm band.
2.6.2 Whispering gallery loss
The optical modes within a microsphere are confined by continuous total internal
reflection at the dielectric cavity-air interface. However, it is a general property that
total internal reflection at a curved interface is incomplete, and leads to a transmitted
wave, which for the case of a resonator causes loss of optical energy5. This loss
mechanism is called whispering-gallery loss, and is due to tunneling of the photons
out of their bound states. This tunneling process, can be understood by drawing an
analog to the quantum mechanical treatment of a 1-D particle in a central potential.
Similarly to the latter can be achieved by formally rewriting the radial equation as an
eigenvalue problem using the transformation u(r) = ψr/r and introducing the energy
5A good intuitive explanation of this effect has been given in reference [42] by considering thephase velocities in a ray optical picture. For total internal reflection at a planar interface theexponentially decaying field components have a constant phase velocity u0 < c in the evanescentregion. For a curved surface however, the phase velocity increase with increasing separation fromthe boundary i.e u(r) = u0
rR0
. At the point where the phase velocity exceeds the phase velocity inair (u(r) > c) the evanescent field becomes propagating, leading to tunnel losses.
18
term E = k20n(r)2 :
∂2
∂2ru+
( + 1)
r2u− k20
¡1− n(r)2
¢u = k20n(r)
2u = Eu (2.12)
The effective potential Ueff (r) of the particle is thus identified as:
Ueff(r) =( + 1)
r2− k20(1− n(r)2) (2.13)
Figure 2.4 shows a plot of the effective potential (normalized to k20). The effective
potential is discontinuous at the cavity-air interface, giving rise to a potential well.
Furthermore the characteristic radii Ra and Rb are given by:
Ra =
p( + 1)
nk0
Rb = Ran
In the well region Ra < r < Rb discrete bound states exist which correspond to the
whispering-gallery modes. The region r < Ra as well as R0 < r < Rb corresponds
to a potential barrier, in which the optical modes are exponentially decaying (i.e.
evanescent). The region Rb > r supports a continuum of modes, which are unbound.
Due to the finite height and finite width of the potential barrier in the region R0 <
r < Rb, the optical modes can tunnel from their bound well states into the continuum,
giving rise to a tunnel-loss. The height and width of the potential barrier decreases
as a function of the polar mode number , causing an increase in tunnel loss.
An approximate analytic formula for the whispering-gallery loss of a spherical, ho-
mogeneous dielectric resonator has first been derived by Weinstein [42], by expanding
the characteristic equation and allowing the wave-vector to be complex. The result of
this approach (extended here to include one more term in the perturbation expansion)
is only valid in the limit À 1.
QWGM =1
2
µ+1
2− βt0q −
m1−2k√m2 − 1
¶m−(1−2k)(m2 − 1)1/2e2Tn (2.14)
19
3.5 4 4.5 5 5.5 6 6.5 7 7.5-0.5
0
0.5
1
1.5
2
Radius (µm)
No
rmal
ized
Rad
ial P
ote
nti
al
k02
Ueff
bound
evanescent
evanes-cent
R0 R
a R
b
unbound (propagating
Figure 2.4: The effective radial potential for a microsphere with (R = 10 µm, l = 24).The optical modes are bound in the region Ra < r < R0, and evanescent in theregion R0 < r < Ra and Rb < r < R0. The tunneling from the evanescent regionR0 < r < Ra into the region where the optical modes are unbound (i.e. r > Rb) leadsto a tunnel loss, which is also referred to as "whispering gallery loss" and causes afinite Q (or line-width) of the modes.
20
4 6 8 10 12-0.2
0
0.2
0.4
0.6
0.8
1
1.2
1.4
1.6
Radius (µm)
No
rmal
ized
Fie
ld In
ten
sity
|Eφ2|
WG-mode numbers:l = 30n =1TMR
0= 5 µm
Figure 2.5: Radial intensity distribution (|Eφ|2) for a fundamental (n = 1, = m)mode of a 5 -µm−radius microsphere with angular mode number = 30, and TMpolarization. The solution was obtained by solving the transcendental equation nu-merically for the imaginary part of ω. The dotted line denotes the effective radialpotential, which is discontinuous at the dielectric cavity boundary.
21
Where m is the relative index of refraction, t0n the Airy function zero and:
Tn ≡ ( +1
2) ·Ãcosh−1(n)−
r1− 1
m2
!+ β t0n
r1− 1
m2(2.15)
β ≡µ+ 1
2
2
¶1/3The expression reveals however the important result of the exponential dependence of
Quality factor on polar mode number QWGM ∝ e2 . Therefore the Q-factor exhibits
a strong dependence on sphere diameter. For small polar mode numbers , the above
expression is not precise and higher accuracy can be obtained by solving the char-
acteristic equation numerically (iteratively). Figure 2.5 shows the "leaky" solution
to the radial equation for a low-Q mode ( = 30) obtained by numerically solving
eqs. 2.10. The oscillatory behavior of the field outside the sphere gives rise to tunnel
loss. The Q-factor obtained by this method is plotted in figure 2.6 as a function of
polar mode number , and in figure 2.7 as a function of microsphere radius for the
experimentally relevant wavelength range λ ≈ 1550 nm. As can be seen, a Q-value
of >108 is maintained in the case of R > 12µm.
2.7 Mode volume of microspheres
In many applications, not only temporal confinement of light (i.e. the Q-factor), but
also the extend to which the light is spatially confined is an important performance
parameter. Several definitions of mode volume can be encountered in literature, and
are discussed in this section. The most common definition of mode volume, is related
to the definition of the energy density of the optical mode.
we(r) + wm(r) =1
2EE+
1
2µBB
It is defined as the equivalent volume, the mode occupies if the energy density was
distributed homogeneously throughout the mode volume, at the peak value:
22
40 50 60 70104
106
108
1010
Angular mode number l
Qu
alit
y-fa
cto
r TETM
WGM-mode numbersn=1 l=m
Figure 2.6: The whispering-gallery-loss limited Q for a fundamental microsphere mode(i.e. n = 1, = m) as a function of the angular mode number ( ). The whisperinggallery loss was obtained by solving the characteristic equation numerically, and allow-ing for complex eigenfrequencies ω = ω0 + i∆ω/2. (The Q-factor is correspondinglygiven by Q = ω0/∆ω).
23
6 7 8 9 10 11 12 13 14103
104
105
106
107
108
109
1010
1011
Radius (µm)
Qu
alit
y-fa
cto
r
TETM
Mode numbers:λ≈ 1550nmn=1l=m
Figure 2.7: Whispering gallery loss versus microsphere radius for a polar mode numberconsistent with a resonance wavelength near 1550 nm, for a fundamental WGM.
The TE-modes have intrinsically higher Q-factor than the TM-modes. For R > 12µm Q>108 can be maintained.
24
VMode =
R(we(r) + wm(r)) dV
max(we(r) + wm(r))=
R(r)|E(r)|2d3r
max( (r)|E(r)|2)(2.16)
The integral is evaluated over all space, and also includes the regions where the field
is evanescent6. Two comments are in place. First, it will be shown in chapter 5 and
6, that this definition of mode volume, differs from the definition of mode volume
which will be encountered when studying nonlinear optical processes (which is called
throughout this thesis effective mode volume, to emphasize the distinction).
Secondarily, the precise definition of mode volume is strictly speaking not rig-
orous. It depends on the physical problem studied (preceding comment), and as
such different definitions can be found in literature. For instance, a more intuitive
definition (that has been adopted by some authors) is to approximate the mode
functions of a spherical WGM by an ellipse, and to evaluate the full-width-at-half-
max of the radial a and azimuthal b intensity distribution yielding the mode volume
Vmode = R0πab4. Comparison of this definition to 2.16 shows that the mode volume
is ca. 1/3 lower in case the FWHM of the intensity distribution is evaluated. After
these words of caution, definition 2.16 is used for the calculations shown in graph
2.8. It should be noted however, that independent of the mode volume definition, the
numerical modeling allows comparison among different geometry parameters, and as
6It is noteworthy, that if one allows also for propagating components outside the dielectric cavity(i.e. finite Q) the mode volume diverges. This divergence is due the normalization problem, en-countered in open systems. Due to the presence of propagating fields outside a whispering-gallerymicrocavity (whispering-gallery-loss, which occurs for any finite microcavity radius) the optical modevolume depends on the quantization volume chosen. This is easily seen by considering the propa-gating field component outside the microcavity. The electromagnetic field outside the resonator adistance R from the origin is proportional to:
E(R, t) ∝ eik(R−ct)
R
In case of finite Q (as is the case for any whispering-gallery resonator, even in the absence ofintrinsic losses due to the incomplete total internal reflection) the wave vector contains both a realand negative imaginary part (i.e. k = k0 − ik00, k00 > 0). Therefore, the field increases outside themicrocavity, as the exponential increase dominates over the slow 1/R dependence.
E(R, t) ∝ ek00(R−ct)
R
As a result, the mode volume, as defined in equation 2.16, diverges.
25
10 20 30 40 50 600
500
1000
1500
2000
2500
3000
3500
4000
Microsphere Radius ( µm)
Mo
de
Vo
lum
e V
m (µm
3 )
10 20 30 40 50
2
4
6
8
Sphere Radius ( µm)
Mo
de
Are
a ( µ
m2 )
Am∝ R
Vm∝ R2
Figure 2.8: Numerically calculated mode volume Vm (using definition 2.16) for amicrosphere as a function of radius. The polar mode number was adjusted suchthat the resonance wavelength location was close to 1550 nm. Inset: Plot of the modearea (Am) vs. radius.
26
such allows comparison of the three types of cavity geometries studied in this thesis,
i.e. microspheres (chapter 5,6), microtoroids (chapter 7,9,10) and microdisk cavities
(chapter 8). Furthermore, figure 2.8 reveals that the mode volume of a sphere follows
to a very good approximation a quadratic dependence on mode volume (Vm ∝ R11/12),
whereas the effective mode area (shown in the inset) exhibits a linear dependence of
sphere radius.
27
Chapter 3
Tapered optical fiber coupling
3.1 Introduction
In this chapter the tapered-optical fiber coupling technique is described. Tapered
optical fibers were fabricated with waist diameters of typically less than 2 micron,
and low loss (typically less than 5%). The tapered optical fibers allowed efficient
and controlled excitation of ultra-high-Q whispering gallery modes, with negligible
parasitic loss. This achievement is the prerequisite for the experiments which are
described in the subsequent thesis chapters.
3.2 Evanescent coupling to microspheres using ta-
pered optical fibers
Free-space excitation of microsphere whispering-gallery modes is extremely inefficient
due different phase velocities in air and silica. Efficient excitation can be achieved
using the evanescent coupling technique, which uses tunneling of evanescent field
components with phase matched wave-vectors to achieve efficient coupling. A well
known implementation of this method is using a total internally reflected beam within
a prism. Prism coupling is well known since the 1960’s and has been used to efficiently
excite surface plasmon-polariton. Prism coupling has also been used to excite WGM
of microspheres. Alternative methods have included eroded or side polished fibers
28
(D-shaped). By the bringing evanescent field region in close proximity to a silica
microsphere, evanescent coupling can be achieved. A particularly suitable method
has been proposed by [43][44], in which a fiber is drawn into a thin filament, and
the evanescent field of the fiber is brought to overlap with the sphere. The particular
advantage of this method is threefold. First, tapered optical fibers can be made with
with negligible parasitically induced losses (such as scattering). In addition they
allow not only excitation but also extraction of cavity fields through the same taper.
Thirdly, the tapered optical fibers have small transverse dimensions, making them
unique tools to excite WG-microcavities, with small dimensions (as will be shown in
chapter 7,8).
In this section, the tapered optical fiber method is used to controllably couple
light into a microsphere under phase matched condition, and allows to achieve high
ideality. In addition the tapered optical fibers are ideal coupling elements to chip-
based cavities, which will be investigated in chapter 7 of this thesis.
3.3 Fabrication of tapered-optical fibers
Tapered-optical fibers were fabricated by heating a SMF-28 optical fiber with a hydro-
gen torch. To control the flame a flow-controller (solenoid-valve with a flow meter)
was used. In order to facilitate the experiments, a portable taper holder was de-
signed, allowing taper-fabrication to be separate from the coupling setup. Figure 3.1
shows an image of the tapered fiber stage mounted onto the two motorized stages.
The motorized stage is connected to the blocks (with two fiber clamps, Thorlabs)
by two cylindrical posts. Crucial in the design of the stage is very low play in the
movement of the optical blocks, which was achieved in the design by two cylindrical
rails. Setscrews on the bottom of the blocks allowed fixing the posts, and a microm-
eter allowed post-tensioning of the fiber. During the pulling process, the motors we
actuated simultaneously (Oriel motorized stages) and the fiber (with the cladding
removed) was heated using a hydrogen torch. During fiber pulling the transmission
29
was monitored continuously and the taper imaged with a camera from the side (using
a ×20 objective). The approximate size of the taper could be inferred from measure-
ment of the transmission, total pulling distance or by monitoring the tapered fiber
using a microscope. Figure 3.2 shows a optical image tapered optical fiber. The fiber
waist is clearly visible as the region exhibiting optical interference patterns (where
the smallest diameter corresponds to the violet colored part on the left).
Figure 3.1: Tapered fiber pulling setup. The tapered optical fibers are held with fiber
clamps which are located on a sliding block, with two rails. The whole structure is
portable, and set-screws prevent movement of the blocks after pulling. The sliding
blocks are attached via two posts to two motors, pulling the fiber symmetrically apart.
A micrometer on the fiber pulling stage allows post-tensioning of the fiber.
In standard telecommunication fibers, light is confined by total internal reflection
at the weak index contrast between the germanium doped core and the silica cladding.
In a tapered optical fiber, the transverse extension of the fiber is reduced continuously,
such that the optical energy residing outside the taper increases. Figure 3.3 shows
the effective propagation constant of the fundamental taper mode as a function of
30
Figure 3.2: Optical micrograph of the waist region of a tapered optical fiber. Thetapered fiber, which exhibits a diameter of less than 1 micron, appears colored due tointerference effects. The waist diameter is decreasing from the right to the left sideof the image.
taper waist diameter, and the optical energy residing outside the taper is shown in
the inset.
3.3.1 Optical properties of tapered optical fibers
The optical modes of a tapered optical fiber, can be approximated by the modes of
a dielectric cylinder. Particularly important in the context of taper fiber coupling is
the fraction of energy which is outside the tapered fiber. It is the evanescent part
of the field that can tunnel into a whispering-gallery mode cavity. Figure 3.3 shows
propagation constant βf of the fundamental tapered fiber mode, as a function of
taper diameter in the experimentally relevant 1550-nm wavelength band. The results
were obtained by finite element modeling using a full vectorial model. The evanescent
taper field is given by the expression[37]:
αf = xK1(xβf )
K0(xβf ), x =
qβ2f − k0n20
WhereK1andK0 are the Hankel functions of the first and second kind. It is important
to note that by varying the taper thickness (which simply can be achieved by scanning
along the fiber-taper) the propagation constant can be varied in a continuous fashion.
31
1 1.5 2 2.5 3 3.5 41.05
1.1
1.15
1.2
1.25
1.3
1.35
1.4
Taper diameter ( µm)
Eff
ecti
ve In
dex
nef
f=β/
k 0
1 2 3 40
10
20
30
40
Taper diameter ( µm)
Per
cen
t
Fraction of opticalenergy in air
λ=1550 nm
HE11
Figure 3.3: Main figure: Numerically calculated effective index neff of the fundamen-tal HE11 taper mode as a function of the taper diameter (in the simulation n = 1.44).The fraction of electromagnetic energy that resides outside the dielectric taper regionis shown in the inset.
32
Figure 3.4: Schematic of a waveguide-coupled resonator.
This allows phase matching of the whispering- gallery modes of the cavity.
3.3.2 Mathematical description of the waveguide-resonator
coupling junction
If the evanescent field of the fiber is brought in the proximity of a microcavity -
such as a microsphere, microdisk or microtoroid cavity-, the fundamental optical
mode will exhibit overlap of the whispering-gallery type modes of the microcavity.
If the coupling is weak, and the perturbation of resonator and waveguide mode is
small, the coupling can be described by the coupling-of-modes formalism[37] and
in the slowly varying amplitude approximation. In case the coupling is strong, the
behavior will ultimately differ and is then correctly described by a matrix model of
the coupling amplitudes[45]. The two models will yield identical results as long as the
slowly varying envelope approximation is valid, i.e. if the cavity field Ec(t) satisfies
Ec(t + T ) − Ec(t) ≈ T ddtEc, where T is the cavity round trip time. The coupling
from a resonator to a waveguide is fundamentally described by three parameters, the
resonant frequency ωo, the decay rate 1/τ 0 of the mode due to internal cavity losses,
and the cavity decay rate 1/τ ex due to coupling to the waveguide mode.
Following the coupling of modes approach given by H. Haus, the optical mode
coupled to a whispering-gallery mode resonator can be described by the following
equation[46]:
33
d
dtU = iωoU −
µ1
2τ 0+
1
2τ ex
¶U + κs (3.1)
Here the resonator excitation is designated as U and the waveguide mode is designated
as s1.The intrinsic lifetime as denoted by τ 0 describes the total losses inherent to
the optical resonator, and the coupling into the waveguide is given by τ ex. In the
absence of coupling to a waveguide the optical energy E = |U |2 in the resonator decay
exponentially with time,
d
dt|U |2 = U
d
dtU∗ + U∗
d
dtU = − 1
τ 0|U |2 (3.2)
And the quality factor is given by Q0 = ωτ 0. In the presence of a waveguide such as a
taper the optical energy is dissipated both within the cavity as well as due to coupling
to the waveguide. In case of a loss-less resonator, and in the presence of a waveguide,
the decay is entirely due to the waveguide coupling, designated by ddt|U |2 = − 1
τex|U |2
(τ ex external lifetime). The coupling coefficient κ can related to τ ex by time reversal
symmetry, yielding:
|κ| =r
1
τ ex(3.3)
Furthermore the transmission past the resonator is of interest. The transmission is
linear in the cavity and input fields, such that the coefficients of the relation t =
c1s+ c2U have to be found. The coefficient c2 can be found by considering the cavity
mode in the absence of waveguide excitation (c1 = 0), yielding c1 =q
1τex
. To find
the relation for c2 , power conservation can be used. i.e. the net power transfer into
the cavity, must be equal to the rate of growth of the cavity field added to the rate
of intrinsic dissipation.
|s|2 − |t|2 = d
dt|U |2 +
µ1
τ 0
¶|U |2 (3.4)
1Particular attention has to be paid to the two different normalizations used in this formalism:|s|2 = normalized to Power|U |2 =normalized to Energy
34
Furthermore from the equation of motion the power dissipated in the resonator is
given by:
d
dt|U |2 = −
µ1
τ ex+1
τ 0
¶|U |2 +
r1
τ ex(Us∗ + U∗s) (3.5)
Substituting U =√τ ex (t− c1s) into the last two equations yields:
|s|2 − |t|2 = − 1
τ ex|U |2 +
r1
τ ex(Us∗ + U∗s) =
= − 1
τ ex|√τ ext− c1s|2 + (t− c1s) s
∗ + (t− c1s)∗ s
Comparing the equations yields c1 = −1 :
t = −s+r1
τ exU (3.6)
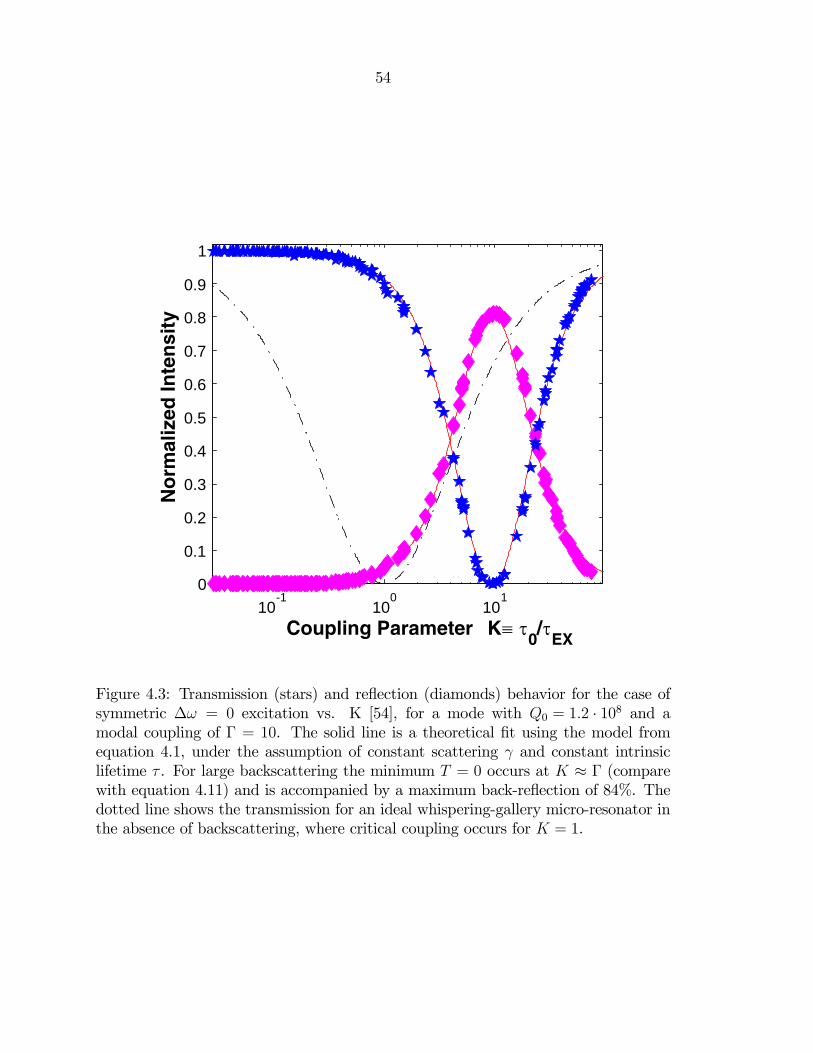
The transmission past the resonator is correspondingly given by ∆ω = ω0 − ω.
T =
µτ ex − τ 0 − i∆ω
τ ex + τ 0 + i∆ω
¶2(3.7)
The transmission properties are commonly characterized by over-coupled, critically
coupled and under-coupled.
• Undercoupling: Under-coupling refers to the case where the waveguide cou-
pling is weak and the cavity decay rate τ−10 exceeds the cavity coupling rate
τ−1ex . In this case the amplitude of the cavity leakage field U/ (2τ 0) is much
smaller the amplitude of the transmitted waveguide field. The cavity leakage
field exhibits a phase shift of π > φ > 0.
• Over-coupling: In the over-coupled regime the rate of cavity coupling exceeds
the cavity decay rate¡τ−1ex > τ−10
¢. The amplitude of the cavity decay field in
this case is larger than transmitted pump field, and reaches a value of twice the
waveguide amplitude in the case of strong over-coupling.
35
• Critical coupling: Critical coupling occurs when the external lifetime is
matched to the intrinsic cavity decay rate¡τ−1ex = τ−10
¢. In this case the trans-
mission past the resonator vanishes, and complete power transfer of the optical
power carried by the wave to the cavity mode occurs. The transmission vanishes
due to the interference of the cavity leakage field and transmitted pump field,
which exhibit equal magnitude but a relative phase shift π.
3.3.3 Cavity-buildup factor
At the critical coupling point the optical energy in the cavity reaches it’s maximum,
and the circulating power is given by the cavity-buildup factor, where ∆λFSR is the
free-spectral range of the cavity:
µPcav
Pin
¶=
c∆λFSR
λ21
τ ex
µ1
2τ 0+
1
2τ ex
¶−2=
λ
π2RneffQex
µ1 +
Qex
Q0
¶−2(3.8)
This shows that within in microcavity, the circulating power is significantly enhanced,
and can be exploited to significantly reduce the threshold for nonlinear optical phe-
nomena, which is presented in this thesis.
3.3.4 Experimental observation of controlled evanescent taper-
fiber coupling to microsphere resonators
The different coupling regimes as discussed in the previous section could indeed be
observed, by accurately controlling the taper microsphere distance. Figure 3.5 shows a
microsphere coupled to a tapered-optical fiber. The coupling amplitude is determined
by the spatial overlap of the whispering gallery mode with the mode of the tapered
optical fiber. Efficient coupling is achieved when the propagation constant of the
taper is matched to the propagation constant of the whispering gallery mode2, and the
2The propagation constant of a whispering gallery mode is simply given by the relation β =m/R0. To evaluate the coupling from the tapered optical waveguide to the whispering gallery moderesonator, the directional dependence of β has to be taken into account.
36
Figure 3.5: Right panel: Microsphere coupled to a tapered optical fiber. Left panel:Microsphere visible with fiber stem.
coupling strength has been theoretically analyzed in reference [37]. The propagation
constant of the fiber taper can be continuously varied by scanning the taper along
the waist diameter (compare figure 3.3).
The coupling properties analyzed in the last section, assumed the case of a single
mode waveguide, coupled to a mode of a resonator. However, the coupling will also
induce a non-resonant loss (e.g. due to scattering at the junction). In addition the
tapered fibers are not single-mode (unless the diameter < 1.2 µm) such that the
resonator can couple in principle into the fundamental and higher order taper modes.
These effects will become pronounced in the over-coupled regime, causing a deviation
from complete recovery of the transmission. Observing the postulated transmission
behavior will therefore require that the coupling into the fundamental taper mode
dominates over higher order mode coupling, while the coupling amplitude κ remains
small. In addition, the off-resonant loss (e.g. junction induced scattering) has to be
small, which was indeed observed (compare chapter 3). The extent to which the
system behaves as predicted is given by the "Ideality" which has been extensively
investigated in reference [26], and will not be treated in the author’s thesis. 3. It is
3A detailed analysis of the effect of higher order mode coupling has been carried out by SeanSpillane and is contained in reference [26] and his thesis.
37
merely noted that a more complete description of the junction includes the effect of
coupling to both higher order taper and radiation modes. The extent to which higher
order mode coupling is present can be expressed in terms of the junction-ideality I.
d
dtU = iωoU −
Ã1
2τ 0+
1
2τ 0ex+Xi>0
1
τ iex
!U +
r1
τ exs (3.9)
I ≡ 1/τ 0ex1/τ 0ex +
Pi>1
1τ iex
(3.10)
The experimentally predicted coupling regimes under ideal assumption as in eqs. 3.7
could indeed routinely be observed. As the evanescent taper and microsphere fields
decay exponentially, the external coupling κ is expected to vary exponentially i.e.
τ−1ex = τ−1ex (0) exp(−x/γ), where τ−1ex (0) is the external coupling rate with the taper
in contact with the resonator. The characteristic coupling length is determined by
the overlap of sphere and taper mode, and therefore determined by the taper and
microsphere evanescent field decay. The evanescent field decay of a sphere is given
by[37]:
αs =qβ2l − k0n20 and βl =
( + 1)
R0
whereas in the case of a silica tapered optical fiber[37]:
αf = xK1(xβf )
K0(xβf ), x =
qβ2f − k0n20
The overlap of the two fields determines the coupling coefficient, which therefore
varies approximately as γ ' (αf + αs) .The fiber propagation constant is found by
matching the boundary condition for the fiber fields. In figure 3.3 the propagation
constant for a fundamental fiber mode βf = neff ·k0, has been numerically calculated
for the fundamental taper mode HE11 using a finite element solver.
Figure 3.11 shows the observation of different coupling regimes by variation of
the taper-microsphere coupling gap. In this measurement the transmission through
the taper was normalized with respect to the power transmitted in the far under-
38
Figure 3.6: Photograph of the fiber-taper coupling setup. The fiber-taper stage isattached to a closed loop piezoelectric positioning system, which gives lateral motionin two directions (with 20 nm resolution). Visible in the front is the positioning arm,to which microspheres or planar cavities can be attached. The arm itself is attachedto the third axis of the piezo-electric stage.
39
-2 -1.5 -1 -0.5 00
0.1
0.2
0.3
0.4
0.5
0.6
0.7
0.8
0.9
1
Taper-Resonator gap ( µm)-1.5 -1 -0.5 00
0.1
0.2
0.3
0.4
0.5
0.6
0.7
0.8
0.9
1
Taper-Resonator gap ( µm)
No
rmal
ized
Tra
nsm
issi
on
1- ∆T
under-coupled
over-coupled
under-coupled
over-coupled
Figure 3.7: Coupling regimes for a tapered-optical-fiber resonator system. The exper-iments show the recorder transmission on resonance versus the coupling gap distancefor two whispering-gallery resonators. The zero point corresponds to the taper beingin contact with the resonator. The transmission in this experiment is normalized withrespect to the taper removed from the resonator. The left panel shows the couplingcurve with high ideality, whereas the left curve exhibits low ideality, as witnessed bythe reduced transmission in the over-coupled regime, due to junction scattering.
coupled region. The different coupling regimes are clearly identified, and at the
critical coupling extinction is large than 99%. Upon decreasing the coupling gap
further, recovery of the transmitted signal is found as predicted by equation 3.7. In
the right panel of figure 3.11, recovery exceeds 99%, whereas for the panel in the left
the off-resonant loss has increased by 10%.
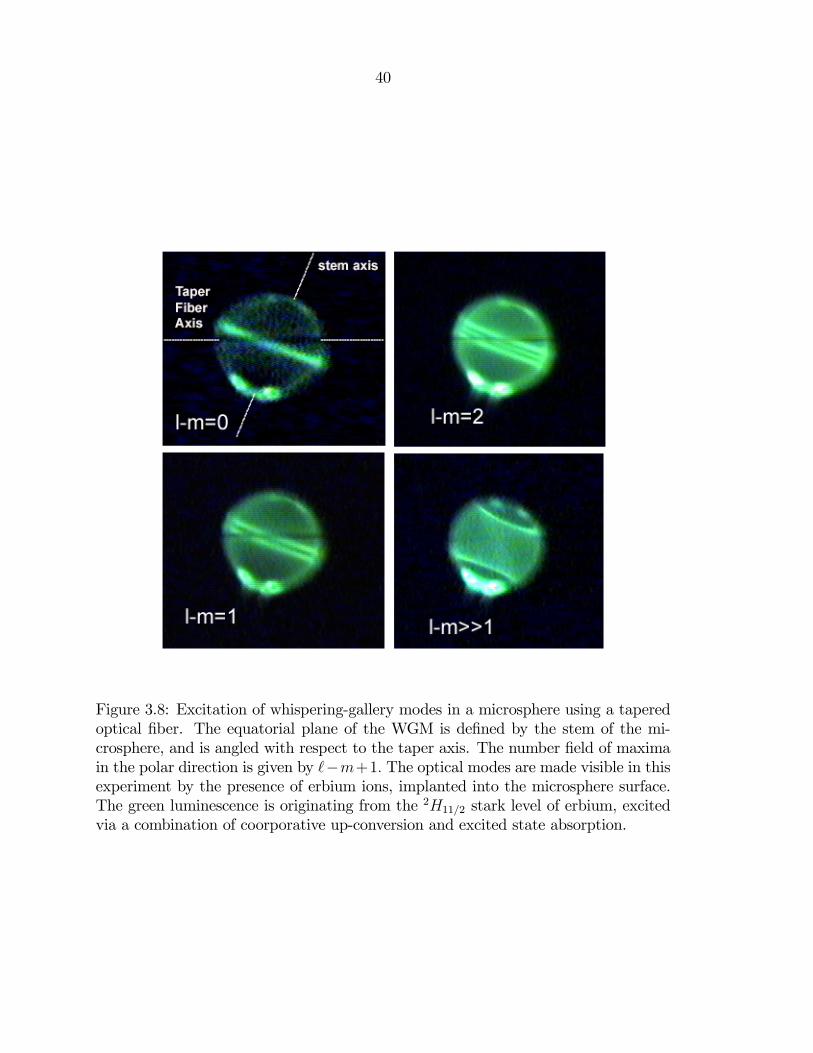
The taper coupling mechanism is in general mode selective, but as shown here
also allows to excite higher azimuthal (|m| < l) modes. Figure 3.8 shows a tapered
optical fiber coupled to a microsphere. The microsphere contained erbium (by using
ion implantation), which functioned as a probe for the intensity profile of the excited
whispering-gallery modes. As can be seen in the figure, the tapered optical fiber can
efficiently excite fundamental and higher order azimuthal modes. It is interesting to
note that the equatorial plane of the WGM is determined by the fiber stem, and
40
Figure 3.8: Excitation of whispering-gallery modes in a microsphere using a taperedoptical fiber. The equatorial plane of the WGM is defined by the stem of the mi-crosphere, and is angled with respect to the taper axis. The number field of maximain the polar direction is given by −m+1. The optical modes are made visible in thisexperiment by the presence of erbium ions, implanted into the microsphere surface.The green luminescence is originating from the 2H11/2 stark level of erbium, excitedvia a combination of coorporative up-conversion and excited state absorption.
41
1546 1548 1550 1552 1554 1556 1558 1560 15620
0.2
0.4
0.6
0.8
1
Wavelength (nm)
Tap
er T
ran
smis
sio
n
eccentricity splitting
n=1
n=2n=2
∆λFSR = 11.6nm
Figure 3.9: Broadband transmission spectrum of a microsphere with radius of ca. 22µm. The eccentricity splitting of the azimuthal modes is clearly visible, which is 0.2nm. This corresponds to an eccentricity of ≈ 1% . The strongly coupled modesare identified as fundamental radial modes (n = 1), and the weakly coupled modesare identified as n = 2. Note that only ca. 20 azimuthal modes are excited with thetapered optical fiber, of the total 2 +1 eccentricity split modes ( ≈ 130). The latteris due to the mode selectivity and reduced phase matching for high m-values.
42
is angled with respect to the taper fiber axis. This plane orientation corresponds
to smallest perturbation of the optical modes due to the stem. The excitation of
higher order azimuthal modes, split due to eccentricity, is also seen in the broadband
transmission spectrum as seen in figure 3.9. As evident, also higher order radial modes
can also be excited, based on the resonance locations inferred from equation 2.5.
3.4 Linewidth measurements and thermal effects
Since the optical Q-factor determines the threshold for nonlinear optical effects, meth-
ods to accurately quantify the Q are necessary. The optical quality factor of the
whispering-gallery modes was measured in this thesis both in the time and frequency
domain. For a resonator mode the energy decay is given by:
U(t) = U(0)e(iω0−12τ)t → U(ω) = U(0)
1
i(ω0 − ω)− 12τ
(3.11)
In the latter, the linewidth of the resonance can be simply related to Q viaQ = ω∆ω
. In
the case of high-Q resonance, the transmission T (∆ω) only re-produces the transfer
function |U(ω0 − ω)|2, if the cavity field has reached steady state, which occurs for
times larger than the cavity storage time τ . The transfer function can therefore be
conveniently measured by scanning the laser through a resonance, provided the laser
is scanned with a speed£nms
¤that satisfies the relation:
v[nm
s] <<
∆λ
τ109 =
2πc
Q2109 (3.12)
For a typical scan range of 60 GHz for the laser used in this work (New Focus external
cavity laser), and a Q-factor of 2 × 10⁸ this limits the scan speed of the laser to
approximately 100 Hz. The resolution of the linewidth measurements is limited by
the coherence time of the pump laser, which limits the Q-factor measurement to
approximately 1.5× 10⁸(short term linewidth of 300 kHz, long term 1 MHz).
However, due to the small volume occupied by the WGMmode, and poor thermal
conductivity of silica microspheres, strong thermal effects occur even at low pump
43
power, which are due to the temperature dependent resonance locations:
d
dTλ(n,R) = λ
dn
dT+ λ
dR
dT
The resonance shift is primarily due to the temperature dependence of the refractive
index dndT= 1.28×10⁻⁵K−1, while the thermal expansion of the silica αT = 5.5×10⁻⁷
induces a much smaller shift for the cavities considered in this work R ≈ 20−100µm.
For the 1550 nm wavelength range this translates into a thermal tuning coefficient
of dνdT= 2.5 GHz/K. The thermal effects have to be taken into account carefully
when measuring Q-factor. In particular heating of the cavity will lead to bistability
behavior with respect to the scanning direction of the laser beam (induced by cavity
heating when scanning the laser in the same direction as the wavelength shift). The
thermally induced wavelength shift also leads to the appearance of oscillations in the
transmission spectrum, upon scanning past a thermally broadened resonance. These
oscillations are due to interference of the pump laser, with the cavity leakage field
(that is frequency red-shifted due to cooling of the cavity). Therefore quality factor
measurements are only a reliable measure in the case of very weak excitation, where
the latter effects are not present.
3.5 Cavity ring-down measurements
The thermal broadening effects, as well as the transient effects associated with scan-
ning over a cavity resonance constitute a systematic error in the measurement of the
cavity Q-factor. In addition the linewidth measurement is coherence-limited to a Q-
value of approximately 1.5× 10⁸. To overcome this limitation, and also the intrinsic
uncertainty in the linewidth measurement, a cavity ring-down measurement setup
was implemented. Cavity ring-down allows to directly record the photon lifetime in
time domain. In contrast to linewidth measurement, cavity ring-down is principally
insensitive to the thermal broadening and allows determination of the loaded Q-factor
even at high pump power. In addition, the laser linewidth is not a limitation of this
44
Figure 3.10: Schematic of the cavity ring-down setup to measure photon lifetimes.
method.
Important for the measurement of the cavity lifetime, is to ensure a fast gating-off
of the pump laser, as well as timing the gating once the mode was fully charged at
the critical point. Indispensable for these measurements and their proper timing was
a 1GHz oscilloscope with external trigger capability (Tektronixs TDS 5104). The
experimental setup is shows in figure 3.10. The laser was gated off using a high-speed
LiNbO3 Mach Zehnder modulator (UTP), which was driven by an arbitrary function
generator (Agilent), which limited the gating time to approximately 8 ns. Ring-
down measurements at the critical coupling point were achieved by scanning the laser
simultaneously until the transmission vanished at the critical point. To ensure gating-
off at the critical point the reflected signal was used for the trigger, and the trigger
level set to a value close to the peak reflection. A typical ring-down measurement
is shown in figure 3.11. To increase the temporal window for the trigger, ringdown
measurements were performed on the thermally broadened side of the resonance. For
times t < 0, the cavity mode has reached steady state and is following the laser due
45
to thermal shifting of the wavelength. At time t = 0, the trigger is activated, and the
laser gated off with a delay ∆t of 8 ns. Therefore the critical decay signal is given by:
|sRD(t)|2 =µ
2τ exτ 0 + τ ex
¶2|s(t = 0)|2 e−(t+∆t)
³1
τcrit
´
Figure 3.11 shows a typical decay trace obtained using the described experimental
setup. The quality factor can be inferred by fitting the cavity decay field, as well by
measuring the recovery of the transmission. Note that at t = 0 in the strongly over-
coupled regime the cavity decay signal reaches values up to 4 times the input signal.
The ringdown measurement have been carried out at the critical coupling point,
where the taper transmission vanishes. Operation of this point was motivated twofold.
First, the critical coupling point, can be accurately identified experimentally by
recording the taper transmission (T = 0), and is relatively stable with respect to
taper fluctuations (since dTdx= 0). Secondarily, while under-coupled ringdown mea-
surements allow direct measurement of intrinsic Q, the cavity decay amplitude is
larger at the critical point allowing for better signal-to-noise ratio upon signal detec-
tion. In addition, the ultra-high-Q modes are in nearly all cases observed as doublets,
due to modal coupling. Therefore ringdown in the undercoupled regime, requires
locking to one of the doublet eigenmodes, whereas at the critical point, the splitting
of the two eigenmodes is masked.
46
-50 0 50 100 150 2000
0.1
0.2
0.3
0.4
0.5
0.6
Time (ns)
No
rmal
ized
Tra
nsm
issi
on
Time
Ttra
nsm
issi
on
τdelay
≈ 8 ns
Cavity decay field (forward direction)
∆T
Figure 3.11: Cavity ringdown measurement trace. Main figure: The transmissionpast the microcavity as a function of time. For t = 0 the pump field is gated off,which occurs with a delay of approximately 8 ns. For t > 8 ns the recorded trans-mission is entirely due to the cavity leakage field. The inset shows the recovery of thetransmission, upon gating-off the laser.
The splitting of degenerate levels (which transforms energy level crossings into anti-
crossings) in the presence of coupling is a very general principle in physics; the for-
mation of energy bands in semiconductors (level repulsion) can be attributed to this
principle, as well as the splitting of atomic levels in the presence of (LS) coupling. In
this thesis chapter an optical analog of this effect is studied, that was encountered in
whispering-gallery type resonator such as microspheres, microdisks and microtoroids,
as considered in this thesis. Each mode in a whispering-gallery type resonator pos-
sesses a natural 2-fold degeneracy, in addition to degeneracies with respect to other
"quantum numbers" (such as the azimuthal mode number in microspheres) resulting
from the two possible directions of propagation (clockwise CW and counterclockwise
CCW) [47]. Lifting of the degeneracy and coupling of the two modes can occur when
a fraction of the mode energy is scattered into the oppositely oriented mode. The de-
generacy can also be lifted by rotating the whispering gallery-type resonator around
its symmetry axis, which causes the CCW mode and CW mode to exhibit different
round trip times, and correspondingly removing the degeneracy in their resonance
1This chapter has appeared in "Modal Coupling in traveling-wave resonators" OpticsLetters, 27 (19) 1669-1671, 2002.
48
frequency. 2
The consequences of degeneracy lifting by distributed scattering has been first
theoretically investigated by [48]. In this chapter we experimentally confirm these
predictions using high-Q (> 108) micro-sphere resonators coupled to fiber-optic taper
waveguides. The long photon lifetimes of high-Q micro-sphere resonators make pos-
sible a counter-intuitive effect in which minute scattering gives rise to the regime of
strong modal coupling. In this regime scattering into the oppositely oriented mode
is the dominant scattering process. Resonances are significantly split and severe de-
viations of the critical coupling point occur. We show and observe that in certain
regimes the whispering-gallery resonator can acts as a narrow bandwidth reflector,
causing a strongly reflected signal and vanishing waveguide transmission. The altered
coupling properties are of importance in high-Q micro-resonator based cavity QED
and nonlinear optical experiments [49, 40].
4.2 Modal coupling in whispering-gallery-type res-
onators
In a traveling wave resonator such as a microsphere, Rayleigh scattering from surface
inhomogeneities or density fluctuations will transfer power from the initially excited
mode to all the confined and radiative modes of the resonator. The scattering to
all modes other than the CW and CCW mode is included in the overall effective
loss, given through the intrinsic lifetime τ 0. The cross coupling of modes can be
described using coupled-mode theory and using the slowly varying envelope approxi-
2This effect is referred to as Sagnac effect, and can be used to create rotation sensors (Gyroscopes).The presence of modal coupling in these systems leads to the formation of a photonic band structure.
49
Figure 4.1: Schematic of a traveling-wave resonator coupled to a waveguide. Theinput power launched through the waveguide is denoted as P = |s|2. The twoeigenmodes of the resonator couple back into the waveguide giving rise to reflection(R = |r|2) and transmission (T = |t|2).
mation(equivalent to that presented in reference [48]).
d
dtacw = i∆ω · acw −
µ1
2τ 0+
1
2τ ex
¶· acw +
1
2γ12· accw + κ · s (4.1)
d
dtaccw = i∆ω · accw −
µ1
2τ 0+
1
2τ ex
¶· accw +
1
2γ21· acw
Here acw, accw is the amplitude of the CCW and CW modes of the resonator and s
denotes the input wave. The excitation frequency is de-tuned by ∆ω with respect to
the resonance frequency ω0 of the initially degenerate modes, τ is the total lifetime
of photons in the resonator, which is related to the quality factor by Q = ω · τ . The
coupling coefficient κ denotes the coupling of the input wave to the CW mode of
the resonator. The relation κ =p1/τ ex associates the coupling coefficient with a
corresponding lifetime, where the total lifetime is given by 1/τ = 1/τ ex + 1/τ 0. The
mutual coupling of the CCW and CW mode is described by a (scattering) lifetime
γ. Since the cross-coupling is only to redistribute energy between the CW and CCW
modes, the scattering coefficients must obey the relation:
d
dt
¡|acw|2 + |accw|2
¢+¡|acw|2 + |accw|2
¢µ 1
2τ 0+
1
2τ ex
¶= 0
1
2γ12accwa
∗cw +
1
2γ∗12a∗ccwacw +
1
2γ∗21a∗cwaccw +
1
2γ21acwa
∗ccw = 0 (4.2)
50
This is satisfied if the cross-coupling coefficients obey:
γ12 + γ∗21 = 0 (4.3)
Which requires that γ12 and γ21 must be imaginary i.e. setting γ12 = −iγ. Further
details about the model and its validity can be found in [46].3 The coupling of the
resonator modes to the waveguide gives rise to a transmitted (t) and reflected (r)
field:
t = −s+r
1
τ ex· acw; r =
r1
τ ex· accw (4.4)
The state-state solution for the clockwise and counterclockwise excitation of the res-
onator modes are given by the expressions:
acw = κsi∆ω + (τ−10 + τ−1ex )
−∆ω2 − γ2 + (τ−10 + τ−1ex )2 + i∆ω(τ−10 + τ−1ex )
(4.5)
accw = κs−2iγ
−∆ω2 − γ2 + (τ−10 + τ−1ex )2 + i∆ω(τ−10 + τ−1ex )
The new eigenmodes are now symmetric and anti-symmetric superpositions4 of the
degenerate CW (n, , p,m) and CCW (n, , p,−m) modes centered around new eigen-
frequencies ω = ω0± 12γ(having a linewidth of 1/τ).
uS =1√2(acw + accw) (4.6)
uAS =1√2(acw − accw)
It is noteworthy that in the presence of modal coupling the eigenmodes lose their
purely traveling wave character, as given by the azimuthal dependence Ψcw,ccwφ ∝
exp(±imφ). If the two amplitude of the clockwise and counterclockwise excitation
3It should be noted that in this expression the quantity |s|2is normalized to the power carried bythe waveguide , in contrast to the resonator amplitude excitation a which is normalized such that|a|2 corresponds to the Energy in the resonator mode.
4The new eigenmodes are spatially symmetric and anti-symmetric with respect to the symmetryplane of the waveguide-resonator system.
51
are equal, the eigenmodes of the system correspond to (two orthogonal) standing
waves, i.e. cos(mφ), sin (mφ).
Modifications to the resonator coupling physics (transmission, reflection and circu-
lating power) can be described in terms of the normalized modal coupling parameter:
Modal Coupling Parameter Γ ≡ τ 0/γ. (4.7)
The normalized coupling parameter describes the extent of splitting with respect to
the intrinsic cavity lifetime, and as such is a natural measure of how observable the
mode splitting in the undercoupled regime is (compare figure ??). In addition we
introduce the normalized coupling coefficient to facilitate the discussion:
Normalized Coupling Parameter K ≡ τ 0/τ ex (4.8)
Using this definition, critical coupling corresponds to K = 1,over-coupling corre-
sponds to K < 1 and under-coupling corresponds to K > 1. The Transmission
(T = |t|2) as a function of the previously introduced parameters and the normalized
frequency detuning ∆ω ≡ ∆ω · τ 0 is:
T (∆ω,Γ, K) =
¯Γ2 + (1−K)(1 +K)−∆ω2 + 2i∆ω
Γ2 + (1 +K)2 + 2i∆ω
¯2(4.9)
The corresponding reflection (R = |r|2) coefficient is given by:
R(∆ω,Γ,K) =
¯2ΓK
Γ2 + (1 +K)2 + 2i∆ω
¯2(4.10)
The doublet resonance locations for the reflection and transmission (i.e. dRd∆ω
=
0, d2Rd∆ω2
< 1 and dTd∆ω
= 0, d2Td∆ω2
> 1) are located at: ∆ω = ± 2pΓ2 − (1 +K)2 and
for the transmission at ∆ω = ± 2√Γ2 + 1−K2.
52
0
0.2
0.4
0.6
0.8
1
No
rmal
ized
Inte
nsi
ty
Frequency a.u.
2/γ
2/τ
ω0
Figure 4.2: Spectral transmission and reflection properties of a 70 µm sphere withQ0 = 1.2 · 108 [50] in the regime of strong modal coupling with Γ = 10. The solidline represent a fit using the presented model from equation 1. The inset shows amicrosphere coupled to a tapered fiber.
53
4.3 Experimental observation of the regime of strong
modal coupling
We experimentally observed the frequency splitting of whispering-gallery modes in a
fiber-coupled [51] micro-sphere resonator. Due to the high-Q (typically exceeding 108)
resonances frequently occur as doublets, since only minute scattering is required to
cause easily observable mode splitting of the clockwise (|n, l,mi) and counterclockwise
(|n, l,−mi) whispering gallery modes[52]. The waveguide-resonator interface [53], the
resonator surface, and thermodynamic inhomogeneities [48] in the resonator itself can
all induce scattering. However, the use of small (typically in the range of D ≈ 50µm),
high-Q resonators has the advantage that efficient power transfer from the waveguide
to the mode can occur with the waveguide several microns removed from the resonator
surface. In this way, the presence of the waveguide has a negligible contribution to
the overall scattering and distributed scattering centers intrinsic to the resonator or
its surface can dominate. As evidence of this, we found the splitting frequency to
increase only slightly (less than 5%) while decreasing the taper-sphere gap.
The inset of figure 4.2 shows a photograph of a micro-sphere (diameter ca. 70 µm)
coupled to a tapered fiber. The taper is attached to a 20 nm resolution positioning
stage to adjust the taper-sphere gap, which allows accurate control of the external
lifetime τ ex (and correspondingly K). A 1.55 µm tunable laser source is used to
excite a Whispering Gallery Mode (WGM) of the resonator. The laser is scanned
repeatedly through a scan range of 60 GHz, containing the resonance doublet. In the
experiments the forward and backward transmission through the tapered fiber was
recorded as a function of taper-sphere gap. The recorded transmission and reflection
spectra were simultaneously fitted to the coupled mode model of equation ??, and
the model parameters inferred. Figure ?? shows a resonance doublet for a 70 µm
sphere (Q0 = 1.2 · 108) with a resonance splitting of approximately Γ = 10.
An ideal whispering-gallery-type resonator (characterized by Γ = 0) allows electro-
magnetic energy carried by a waveguide to be completely transferred to the resonant
54
10-1
100
101
0
0.1
0.2
0.3
0.4
0.5
0.6
0.7
0.8
0.9
1
No
rmal
ized
Inte
nsi
ty
Coupling Parameter K≡ τ0/τ
EX
Figure 4.3: Transmission (stars) and reflection (diamonds) behavior for the case ofsymmetric ∆ω = 0 excitation vs. K [54], for a mode with Q0 = 1.2 · 108 and amodal coupling of Γ = 10. The solid line is a theoretical fit using the model fromequation 4.1, under the assumption of constant scattering γ and constant intrinsiclifetime τ . For large backscattering the minimum T = 0 occurs at K ≈ Γ (comparewith equation 4.11) and is accompanied by a maximum back-reflection of 84%. Thedotted line shows the transmission for an ideal whispering-gallery micro-resonator inthe absence of backscattering, where critical coupling occurs for K = 1.
55
mode - a property which in the optical and microwave domain is termed ’Critical
Coupling’ [55]. Figure 4.3 shows the power transmission and reflection as a function
of external coupling for symmetric excitation (∆ω = 0) of a resonator mode. In the
absence of scattering (Γ = 0, corresponding to the dashed curve in figure 4.3) the crit-
ical point - the point where the waveguide transmission vanishes - occurs at K = 1.
The fact that the critical coupling point coincides with the point of maximum circu-
lating power is due to the uni-directionality of an ideal traveling-wave-resonator. The
forward input mode of the waveguide is coupled to only one (CCW or CW) mode of
the resonator. In the presence of backscattering uni-directionality is lost, drastically
altering the coupling properties. The modifications are particularly interesting in the
regime of strong modal coupling (ΓÀ1). Even in this regime the condition of critical
coupling - vanishing waveguide (taper fiber) transmission (T = 0) - can be achieved.
However, only for the case ∆ω = 0, as can be seen in figure 4.3. The doublet structure
in the transmission at this point vanishes, as the two resonances in transmission are
located at:
Furthermore the presence of two eigenmodes changes the transfer-function of the
waveguide resonator system to a second order (i.e. causes the presence of two poles).
In the transmission this can be observed in particular at the critical point, as a flat-
tened frequency response5. In addition, the point of zero transmission is accompanied
by a maximum reflected signal. This feature can be understood as an interference
effect; the excited CCW and CW modes couple back into the two taper directions.
The CW mode interferes destructively with the incoming wave (with the clockwise
cavity decay field exhibiting a π-phase shift, resulting in zero (forward) transmission,
while the CCW mode leaks back into the opposite direction, causing (back-) reflec-
tion. Analyzing the equations it is important to realize that the condition of vanishing
waveguide transmission (T=0) has changed and occurs for:
Kcrit ≡µτ 0γ
¶=√1 + Γ2 (4.11)
5The filter reponse in the presence of modal coupling is 2nd order, and is equal to the configurationof two uni-directional resonators, coupled with a rate equal to the scattering rate γ−1.
56
This expression shows a significant shift of the critical point is possible and causes
renewed attention of the definition of critical coupling. The critical coupling point
is therefore strongly dependent on the modal coupling and occurs in what would, in
the absence of modal coupling, be considered the over-coupled regime, since van-
ishing transmission occurs for τ ex < τ 0. The amount of over-coupling required for
zero transmission increases monotonically versus modal coupling. (As an aside, we
note that the condition K = 1 has the special property of causing a transmission and
reflection of equal magnitude irrespective of inter-mode coupling strength.). It should
further be noted that in the case of strong modal coupling, the linewidth (or corre-
sponding photon lifetime) at critical coupling is entirely dominated by the splitting
frequency, i.e.
τ crit =
sµ1
γ
¶2+
µ1
τ 0
¶2−1≈
τ0Àγγ. (4.12)
The experimental data presented in figure 4.3 was obtained for a mode exhibiting a
modal coupling of Γ = 10 and Q0 = 1.2 · 108. The observed maximum back-reflection
was 84%. This agrees very well with the theoretically predicted maximum of 82%
(see figure 4.4). In addition the point of maximum back-reflection and zero forward
transmission occurs where theoretically predicted. For reference, the dotted line in
the figure gives the case of an ideal WG-resonator characterized by no modal coupling
(Γ = 0). As can be seen the critical coupling point is significantly shifted to smaller
separations from the microsphere.
The solid line in Figure 4.4 is a fit obtained using a constant splitting frequency
and constant intrinsic lifetime. The theoretical fit shows excellent agreement with
the experimental data, despite the fact that the splitting frequency was found to vary
slightly as a function of resonator loading.
The maximum reflection is observed at the critical point and is given by:
Rcrit =
µΓ
1 +√1 + Γ2
¶2(4.13)
The reflection asymptotically approaches unity in the limit of large Γ with all incom-
57
0 5 10 15 20 25 300
0.1
0.2
0.3
0.4
0.5
0.6
0.7
0.8
0.9
1
Normalized Splitting Γ
No
rmal
ized
Inte
nsi
ty
0
0.2
0.4
0.6
0.8
1
Frequency a.u.
No
rmal
ized
Sig
nal
40 MHz
Figure 4.4: Experimentally observed and theoretically determined reflection at thecritical point as a function of modal coupling Γ. For large Γ the reflection asymptot-ically approaches unity. The inset of the figure shows the transmission and reflectionat the T = 0 point, for a mode having Γ = 31. In this case 94% of the optical poweris reflected. Note that the doublet structure is masked, since the lifetime of the modeis of the same order as the lifetime of the modal coupling process. The presence ofmodal coupling causes a flattened frequency response at criticality.
58
ing power coupled back into the direction of the source. We experimentally verified
this functional dependence as is shown in figure 4.4. The inset of figure 4.4 illustrates
that in the strong modal coupling regime the whispering-gallery-type resonator (in
this case a microsphere) behaves like a ’frequency selective reflector’. The highest
intermode coupling of Γ = 31 was observed in a sphere with a diameter of 30 µm.
This large modal coupling implies that the probability for scattering a photon into the
oppositely oriented mode was 31 times higher than the probability of a photon being
lost (absorbed or scattered into nonresonant modes). This surprisingly efficient cou-
pling process can be understood qualitatively by considering the spatial distribution
of the mode in the microsphere. Only light which is scattered into an angular segment
exceeding the mode’s cut-off angle is lost [48], all the remaining light is channeled
back into the clockwise and counterclockwise propagating mode, thereby inducing
modal coupling. Since the ratio of modal volume (approximately quadratic in radius)
and sphere volume increases for smaller spheres, the modal coupling is expected to
increase as well. This is in agreement with our experimental findings, since the largest
intermode coupling of Γ ≈ 30 was generally only observed in spheres with a diameter
of less than approximately 40 µm.
It is important to note that the critical coupling point in the presence of scattering
does not correspond to the point of maximum circulating power. In fact, maximum
circulating power occurs with finite transmission. We theoretically investigated the
shift of the point of maximum power transfer and determined that the largest shift
occurs for a modal coupling of Γ = 1.5 at which it shifts to K = 1.52. Interestingly,
in the case of large modal coupling (ΓÀ 1), the maximum power transfer condition
approaches the condition K = 1, as was the case for weak or no modal coupling
(Γ = 0). The condition K = 1 has the special property of causing a transmission and
reflection of equal magnitude. In addition the circulating power is reduced in the
presence of modal coupling.
Defining a power reduction factor C for the total circulating power, and assuming
59
10-4 10-2 100 102 1040
0.1
0.2
0.3
0.4
0.5
0.6
0.7
Coupling K ≡τ0/τ
ex
no
rmal
ized
cir
cula
tin
g P
ow
er ∆ω=0
Γ = 1
|acw
|2
|accw|2
|acw|2+|accw|2
Figure 4.5: Calculation of the resonant circulating power in the microcavity withinthe microcavity for the case of weak splitting (Γ = 1) and symmetric excitation∆ω = 0 as a function of waveguide-resonator coupling (as defined by equation 4.8).The circulating power in the clockwise (|acw|2) and counter-clockwise (|accw|2) mode isshown, and normalized with respect to the circulating power in the absence of modalcoupling (Γ = 0 case).
60
that one of the new eigenfrequencies ω = ω0 ± 1γis excited, C can be written as:
C(Γ) ≡|acw|2γ + |accw|
2γ
|acw|2ideal=(2Γ2 + (1 +K)2)2 + (1 +K)2 Γ2
(4Γ2 + (1 +K)2)2+
Γ2
4Γ2 + (1 +K)2
(4.14)
The first term on the right hand side is the power contributed by the CW mode
and the second term is the power in the CCW direction. In the limit of no scattering
(Γ = 0) one obtains the ’ideal’ circulating power, while in the case of large scattering
the amount is reduced by a factor of 2. Figure 4.6 shows the fraction of circulat-
ing power in the original clockwise and counterclockwise cavity mode as a function of
coupling . As evident from the figure, in the undercoupled regime clockwise and coun-
terclockwise mode are excited equally, provided the scattering rate exceeds intrinsic
loss rate (γ−1 > τ−10 ) . As the coupling is increased, a point is reached where the cav-
ity losses (either intrinsic or coupling related) dominate (τ−10 > γ−1). For this case
the amplitude of the counter-propagating wave decreases, since the counter-clockwise
propagating does not have sufficient time to be build up. In the limit of strong over-
coupling, the resonator therefore again approaches the behavior of an ideal traveling
wave resonator. The presence of modal coupling and reflection has additionally the
important property of reducing the maximum energy storage of the cavity. Figure
4.6 shows the reduction of cavity energy (with respect to the ideal case, i.e. Γ = 0).
In this calculation maximum circulating power was calculated, and compared to the
ideal case. In the limit of strong modal coupling the circulating power is reduced by
a factor of two. This property will be particularly important in the second part of
this thesis, where nonlinear optical effects in microcavities are considered.
4.4 Physical mechanism giving rise to strong modal
coupling in micro-sphere resonators
We studied the origin of the scattering amplitudes causing strong modal coupling by
analyzing the sphere’s surface around the equatorial plane using SEM imaging. It was
61
10-1 100 1011
1.2
1.4
1.6
1.8
2
Intermode Coupling parameter ( Γ)
Cir
cula
tin
g P
ow
er C
orr
ecti
on
fac
tor
Frequency a.u.
Tran
smis
sion
1/γ
1/τ0
Γ≡ τ0/γ
Figure 4.6: Power correction factor as a function of modal coupling parameter Γ. Inthe case of strong modal coupling (ΓÀ 1) the maximum Energy stored in the cavityis reduced by a factor of 2. Inset: Doublet structure is evidenced in the transmission.
62
0.8
0.85
0.9
0.95
1
Frequency a.u.
Tra
nsm
issi
on
Figure 4.7: Observation of a-symmetric mode splitting. The doublet structure ex-hibits an a-symmetry in terms of the linewidth and transmission (T). Inset: Scanningelectron microscopy of the surface of a microsphere resonator exhibiting strong modalcoupling. Surface defect centers with dimensions below the excitation wavelength arevisible which can give rise to strong modal coupling. The defects centers are due toevaporation and subsequent redeposition of silica on the sphere surface.
found that for spheres with large intermode coupling, small, localized and randomly
distributed surface defects, which had sub-wavelength dimensions (typically hundreds
of nanometers as shown in the inset of figure 4.7) were present, while in spheres
exhibiting negligible mode splitting these defects were absent. It can be concluded
that for the spheres under consideration, the modal coupling was caused by scattering
of surface defects. The surface centers are likely due to re-deposition of silica during
the CO2 laser annealing step. As pointed out in Appendix C the laser heating is
routinely observed to cause evaporation of silica from the cavity surface.
The sub-wavelength nature of the surface scattering centers can also be a possible
explanation for the observation of asymmetric mode splitting. Figure 4.7 shows the
observed effect, as evidenced from a transmission spectrum. As the proper eigen-
63
modes in the presence of (strong) modal coupling are standing waves (with the
angular variation |u|2 ∝ cos2(mφ), sin2(mφ) ) the eigenmodes are orthogonal and
sense different parts of the resonator surface and its imperfections. Correspondingly,
this can lead to a different loss rate for the two orthogonal pair of standing waves
(and correspondingly lead to the asymmetric mode splitting).
4.5 Summary
In conclusion, we have experimentally observed the regime of strong modal coupling,
where scattering rate among the degenerate CW and CCW propagating whispering
gallery mode is the dominant scattering mechanism and exceeds both intrinsic loss
rate as well as the waveguide-coupling rate. We have analyzed the modified coupling
properties in the presence of large modal coupling. We observe a shift in the critical
coupling point, and a strongly reflected signal. The extent to which the resonator
properties are altered can be described by the normalized modal coupling parameter
Γ. In the regime of strong modal coupling, back-reflection as large as 94% was
observed, and demonstrate that the whispering-gallery mode resonator does not store
appreciable optical energy but functions as a ’narrow-band reflector’. The arising
modifications of criticality and circulating power are important in cavity QED and
nonlinear optical experiments, [49, 40]. The discussed properties are not resonator-
type specific and can be found in other resonant geometries, e.g. fiber-rings, planar
The long photon lifetimes and small mode volume of ultra-high-Q microcavities, al-
low to significantly reduce the threshold for nonlinear phenomena. Early work[56][57]
recognized these attributes through Raman excitation in microdroplets, and have ob-
served and investigated many stimulated nonlinear phenomena, such as stimulated
Brillouin[58], stimulated Raman[59] scattering and cascaded Raman scattering[60] in
liquids formed from Raman active media such as Carbondisulfid (CS2). However,
due to the inefficient nature of free space laser excitation used in these experiments,
as well as due to the transient nature of the microdroplets, microdroplets required
high threshold pump powers and did not allow stable and long term study of nonlin-
ear optical effects. In contrast, silica microspheres (which have first been studied by
Ilchenko and Gorodetsky[61]) are good candidates for stimulated Raman sources, and
have the highest Q-factors of any optical resonator (>109). Silica microspheres allow
both stable and long term study of nonlinear effects, and can be efficiently excited
with tapered optical fibers as studied chapter 3. Despite these favorable properties,
however, nonlinear optical phenomena in silica microspheres have remained nearly
entirely unexplored, with the with the exception of the Kerr-effect, which was ob-1Work presented in this chapter has been published in: "Ultra-low threshold Raman
laser using a spherical microcavity", Nature, 415, 621-623 (2002).
65
served in low-temperature experiments as an intensity dependent shift of the reso-
nance wavelength[62]. In this thesis chapter a micrometer-scale, nonlinear Raman
source using a taper-fiber coupled microsphere is demonstrated[63] that has a highly
efficient pump-signal conversion (higher than 35%) and pump thresholds nearly 1000
times lower than shown before. This reduction of necessary pump power is due the
efficient and optimum coupling to ultra-high-Q optical modes. This allows to observe
stimulated Raman scattering at threshold levels as low as 65 µWatt, which is usu-
ally considered the regime of linear optics. In contrast, silica-fiber Raman sources
used to-date in telecommunication require high power pump lasers (typically with
several Watts), and are macro-scale devices. As such, the result presented in this
chapter present a route to compact, ultra-low threshold sources for numerous wave-
length bands that are usually difficult to access. While ultra-high-Q microsphere
enables a large reduction in the necessary threshold pump power, the fiber-coupling
notably improves overall efficiency and provides a convenient method of optical field
transport.
5.2 Nonlinear optics in fiber
If one wished to study nonlinear optical effects, one would intuitively not choose silica
at first sight. Due to the inversion symmetry of the material it does not have a second
order nonlinearity χ(2). The third order nonlinearity χ(3) of silica is, compared to most
other materials, nearly 2-orders of magnitude smaller. However, the low nonlinearity
of silica is compensated by the fact that silica possesses low absorption (0.2 dB/km at
1550 nm) yielding a very high nonlinearity-to-loss ratio. This has been recognized by
many researchers and makes optical fiber based nonlinear optics a highly attractive
and fruitful field of research (A comprehensive overview of quantum and nonlinear
optics in fiber is given in ref. [64][65]). On an applied side, optical fiber is the medium
of choice for optical field transport and as such bears practical potential.
The nonlinear optical response is in general described by expanding the polariza-
66
tion in powers of the electric field.
Pi = ε0χ(1)ij Ej + ε0χ
(3)ijklEjEkEl
The lowest order nonlinearity in silica is third order2. The an-harmonic terms in
this expansion of the susceptibility gives rise to a variety of nonlinear optical phe-
nomena, which are explained in Appendix A. The different nonlinear optical effects
which can be observed in silica, are associated with different products of the field op-
erators EjEkEl and the respective susceptibility function. In general the third order
nonlinearity exhibits both a real and imaginary part:
χ(3) = χ(3)Re + i · χ(3)Im
The third order nonlinearity in silica fiber exhibits both an instantaneous and time
delayed response. The instantaneous nonlinear response of silica is determined mainly
(81%) by the far-off resonant electronic response from the medium which occurs at
a time-scale of τ = 5 fs. In addition as small part of this instantaneous response
(19%) is due to vibrational states (phonons)[64].
5.2.1 Kerr nonlinearity
The instantaneous response of silica gives rise to a change of the refractive index with
intensity n(I) = n0 + n2I, where n2 = 3 × 10⁻¹⁶cm2/W , and is commonly referred
to as the optical Kerr effect. As shown in appendix A, it is related to the nonlinear
susceptibility by:
n2 =3
8nc 0χ(3)
2To describe the nonlinear optical response of a medium, the polarization is expanded in a powerseries of the electric field, i.e.
Pi = ε0χ(1)ij Ej + ε0χijk
(2)EjEk + ε0χ(3)ijklEjEkEl
Due to inversion symmetry of the material (silica), the polarization must transform from Pi → −Piand the electric field as Ei → −Ei under spatial inversion. This is only the case if the even termsvanish (χijk
(2) ≡ 0).
67
As a result a light beam experiences an intensity dependent refractive index, which
can be used in a variety of fundamental and applied studies and gives rise to squeez-
ing, solitons, wavelength conversion, pulse compression, optical switching etc. (see
references [64][65] for an overview). It should be noted that the imaginary part of
n2, describes two-photon absorption and in the case for silica can be neglected, since
resonant processes occur at photon energies of ca. 9 eV.
5.2.2 Raman scattering
In addition to the instantaneous response, there is also a time-delayed response of
the medium (which can be modeled as a time-delayed susceptibility function). This
non-instantaneous silica response due to vibrations (phonons) gives rise to stimulated
Raman scattering. Raman scattering is an inelastic light scattering process which
was first observed in 1904 by Raman and Shrinivan. The theory of stimulated Ra-
man scattering was later developed by Bloembergen, and reference [66] contains an
excellent treatment on the physics of stimulated Raman scattering. Stokes scattering
describes the process where a photon is red-shifted and a phonon created, whereas
the reverse process, the absorption of a phonon and the creation of a blue-shifted
wave is referred to as anti-Stokes scattering.
In silica stimulated Raman scattering is due to the interaction with optical phonons.
Due to the rapid decay of the optical phonons (τ ≈ 100 fs), the treatment of stim-
ulated Raman scattering simplifies considerably, leading to de-coupled Stokes and
anti-Stokes fields [66], and leads to Stokes amplification, whereas the anti-Stokes field
is attenuated. Stimulated Raman scattering was first observed in optical fibers by
Stolen and Ippen at Bell labs (see reference [67][68]). It is important to note, that
Raman scattering leads to both forward and backward a scattered Stokes fields. Mo-
mentum conversation in this process is intrinsically satisfied, since the dispersion
relation ω(¯k¯) of optical phonons is essentially flat, and an optical phonon carrying
the difference in wave-vector ∆k = kp − kR can be found for both forward and back-
ward scattered light. Therefore Raman oscillation in a microcavity will excite both
68
Silica nonlinearity Frequency Linewidth Gain-factor (g)
Table 5.1: Nonlinear optical processes of silica and their associated modal gain.
CW and CCW whispering-gallery modes.
5.2.3 Brillouin scattering
In addition the light field can also couple to acoustical phonons which is referred to as
Brillouin scattering. This effect has been reported for optical fiber in reference [69].
In contrast to optical phonons, acoustical phonons in silica exhibit a linear dispersion
relation ω(k) = v ·¯k¯. Therefore a light wave can only couple efficiently via an
acoustical phonon to selected wave-vectors, and gives rise only to backwards light
scattering. In addition, the linear dispersion curve leads to a frequency shift much
smaller than for optical phonons. Table 5.1 summarizes the characteristic parameters
of Brillouin, Raman and Kerr nonlinear optical processes in silica, along with their
respective modal gain. It is important to note that the Kerr-effect has a maximum
gain which exceed that of Raman by a factor of 2 (This will give rise to parametric
oscillation, which is the topic of chapter 10).
5.3 Stimulated Raman scattering in microcavities
In silica, stimulated Raman scattering occurs due to the coupling of a photon to the
optical phonons of amorphous silica, and can be described by the third-order nonlin-
earity, as is described in Appendix A. Figure 5.1 shows the Raman gain spectrum as
a function of phonon frequency for silica glass.
In a microcavity stimulated Raman scattering can occur when both energy and
momentum conservation among the pump photon, scattered photon and phonon are
69
0 10 20 30 400
0.1
0.2
0.3
0.4
0.5
0.6
0.7
0.8
0.9
1
Frequency Shift (THz)
Ram
an g
ain
10
-11
cm
W-1
Figure 5.1: Raman gain spectrum of SiO2. The peak gain occurs at 14.3 THz and13.9 THz. The broad nature of the Raman gain spectra is due to the rapid de-phasingof the phonons, which occurs on the order of 10 ps. The inset shows the schematicof the light-phonon interaction which gives rise to a red-shifted photon, where thedifference in energy is carried by the phonon field.
70
obeyed. Momentum conservation is intrinsically satisfied, due to the essentially flat
dispersion relation of optical phonons. Due to the broad nature of the Raman gain
spectrum, the resonance condition (i.e. energy conservation) for a Raman mode is
strongly relaxed, as for the microcavities considered in this thesis, the number of
modes under the Raman gain curve is typicallyÀ1 (i.e. since the free-spectral-range
is much less than 30 THz), and accidental overlap is in all experimental scenarios
guaranteed. In addition the Stokes amplification is a phase insensitive amplifica-
tion scheme, and therefore phase-matching of pump and Raman mode intrinsically
satisfied.
The lasing threshold occurs when cavity round-trip gain equals round-trip loss.
For an intensity-dependent gain coefficient (such as for a stimulated Raman scatter-
ing), and taking into account the power build-up factor in a resonator, the following
equation for threshold pump power can be derived;
Pthreshold =π2n2Veff
λPλRC(Γ)gBRQP
e
µ1
QPT
¶21
QRT
(5.1)
Here Pthreshold denotes the incident power necessary in the fiber (not the power
coupled into the resonator), n is the index of refraction, Veff is the effective pump
mode volume (i.e. which will be explained in detail in the next chapter), λP and λR are
the pump and Raman wavelengths, gbR is the nonlinear bulk Raman gain coefficient,
C(Γ) is a correction factor of the circulating power due to internal backscattering
(between 1 and 2), and QpT is the total quality factor for the pump mode, made up of
an intrinsic contribution Qpo and a coupling contribution Q
pe (and similarly for the Ra-
man mode). Equation (1) has the important feature that the threshold pump power
scales inversely with the factor V/Q2, which is the same as quality factor multiplied
by the cavity Purcell factor (∝ Q/V ). Thus quality factor plays a dominant role in
device performance. This is a classical conclusion, neglecting the possible additional
benefit due to enhancement of the gain coefficient by cavity quantum electrodynam-
ics (QED)[70]. As a result the ultra-high-Q modes of microspheres, should enable
significant reduction in the necessary pump power required for stimulated Raman
Table 5.2: Comparison of the Raman properties for the substances used in cavitynonlinear optical experiments using microdroplets and microspheres.
scattering, which is indeed experimentally observed as will be described in the next
section.
5.4 Observation of stimulated Raman scattering in
microspheres
Silica microspheres were fabricated as described in chapter 2 of this thesis by melting
the tip of a standard telecommunication (SMF-28) fiber with a CO2 laser, and coupled
using tapered optical fiber. In these measurements, values of Q were in the low 108
range, believed to be limited by surface scattering and OH absorption[71]. Surface
scattering also induces backscattering of power and couples the initially degenerate
clockwise (CW) and counter-clockwise (CCW) circulating modes, causing a splitting
of the resonance wavelength, which has been observed earlier in microspheres[72]. In
addition, as discussed in chapter 4, there is an associated reduction of the circulating
power due, compared to the case of no backscattering (up to a factor of two). The
taper position is controlled relative to the microsphere by a three-axis stage with a
resolution of 20 nm. A tunable 1550-nm external-cavity diode laser with 300 kHz
linewidth is used as a pump. The laser is scanned repeatedly through a frequency
range of approximately 60 GHz around a single whispering gallery mode (WGM).
Figure 5.2 shows the emission spectrum for a Raman microsphere laser (intrinsic
pump quality factor of Qo = 108) excited far above the threshold for stimulated Ra-
man scattering. There are a multitude of nonlinearly generated wavelengths, from
72
1540 1560 1580 1600 1620 1640 1660 1680 1700
-60
-50
-40
-30
-20
-10
0
Wavelength (nm)
Inte
nsi
ty (
dB
m)
Figure 5.2: Spectrum of a 70-µm diameter Raman microsphere laser with pumppowers of 2 mW. The pump is at 1555 nm. The peaks located around 1670 nmare Raman oscillation, separated by the free-spectral-range (here about 5 nm) ofthe microsphere. The secondary lines around 1555 nm are due to four-wave-mixing(FWM) between the pump and two Raman waves. Inset is a microsphere coupled toa fiber taper.
73
stimulated Raman peaks centered around 1670 nm to Raman-assisted four-wave mix-
ing (FWM) peaks located symmetrically about the 1550-nm pump. Stimulated Ra-
man scattering has a very high threshold (nonlinear gain coefficient of 10−11 cm/W ),
requiring significant circulating pump powers. This suggests that other nonlinear
processes having lower thresholds such as stimulated Brillouin scattering (SBS) could
also be present in the systems tested. SBS, for example, should have a threshold
roughly 500 times lower than stimulated Raman scattering (nonlinear gain coefficient
is 500 times larger). To determine the presence of SBS, an optical spectrum analyzer
was used to measure backward propagating optical power coupled from the micro-
resonator into the fiber taper. The gain spectrum for SBS is very narrow (< 10MHz)
with a roughly 10 GHz frequency downshift in silica. The micro-resonators tested
here have free spectral ranges on the order of teraHertz (the angular mode number was
in the range of 50 . . 200), with an eccentricity splitting of the azimuthal modeson the gigahertz scale (i.e. |∆νecc| = ν · |m|+ 1
22 ,corresponding to an eccentricity of
the order of . 1% . In general this splitting is dependent upon fabrication-induced
irregularities, thus overlap with the SBS spectrum is unlikely. Accidental overlap with
the Brillouin gain spectrum has been observed in experiments on liquid droplets[58],
but has not been observed in the microspheres used in this study. In addition, it is
worth noting that Brillouin scattering in silica fiber leads to the deviation from the
Brillouin theory, since the acoustical wave depart from their plane wave nature (un-
derlying the conventional Brillouin scattering treatment) as they are eigenmodes of
the cylindrical fiber structure. This leads to the case of forward acoustic wave scat-
tering (guided acoustic wave Brillouin scattering)[73][74], which is due to acoustical
modes which have zero wave-vector parallel to the axis of propagation, but non-zero
frequency3. However, the backward spectral monitor did show the expected strong
Raman oscillation. Cascaded Raman peaks, if present, were not observable due to the
wavelength range of the optical spectrum analyzer (and are analyzed in a different
experiment using a 1450 nm pump as described in the next thesis chapter). Note that
3Frequency components (typically 2×∆v,∆v ) which might indeed be attributed to forward-waveacoustic Brillouin scattering have been observed in certain cases (for frequency shifts ∆v ≈ 5 MHz,which were smaller than the cavity linewidth).
74
1550 1600 1650 1700-70
-60
-50
-40
-30
-20
-10
Wavelength (nm)
Inte
nsi
ty (
dB
m)
0 10 20 30 400
0.2
0.4
0.6
0.8
1
Raman Shift in THz
Rel
ativ
e R
aman
Gai
n
Figure 5.3: Single longitudinal mode Raman lasing. Raman spectrum for a 40-µmdiameter microsphere, exhibiting a uni-directional conversion efficiency of 16% (pumpis at 1555 nm).
four-wave-mixing associated with the Kerr effect was also observed. However, such
processes in micro-cavities are governed by strict conditions imposed by the combined
effect of the phase-matching requirement with the WGM spectral structure. This will
be investigated in future work, and the results of this study are presented in the last
chapter of this thesis.
Stimulated Raman oscillation was observed by pumping a single WGM and mon-
itoring the transmission using an optical spectrum analyzer. Once the threshold for
SRS was exceeded, lasing modes in the 1650-nm band could be observed, in cor-
respondence with the peak Raman gain which occurs down-shifted in frequency by
approximately 14 THz relative to the pump frequency (wavelength shift of approxi-
mately 110 nm). Figure 5.3 shows Raman emission for an ultra-high-Q microsphere.
The Raman emission with respect to the gain peak is provided in the inset of figure
75
1670 1670.1 1670.2 1670.3 1670.4 1670.5 1670.60
0.5
1
1.5
2
2.5
3
3.5
4
Wavelength (nm)
Ram
an E
mis
sio
n (
nW
)
νecc
Figure 5.4: High resolution scan of the Raman output emission slightly above thresh-old from the previous figure, exhibiting 5 oscillating azimuthal modes (identified as= m, ..., = m − 4) where ≈ 150 . The modes are split due to eccentricity by
|∆νecc| ≈ 7.5 GHz which corresponds to an eccentricity of ≈ |∆νecc|ν
≈ 0.06%.
76
5.3 . Since the fundamental whispering gallery modes (n = 1, = m, p = TM) are
most tightly confined (i.e., smallest mode volume), Raman lasing is expected to occur
first for these modes. The presence of nearly degenerate azimuthal modes in a spher-
ical microcavity (i.e., weak eccentricity splitting), causes simultaneous oscillation on
several azimuthal modes. Figure 5.4 shows a higher resolution spectral scan of the
spectrum in figure 5.4. Several azimuthal modes can be observed to be oscillating
simultaneously (to the temporal resolution of the optical spectrum analyzer). The
splitting of the modes is for fundamental WGM (n = 1, ≈ m) is given by (compare
chapter 1):
|∆λecc| ≈ λ · 1 (5.2)
And corresponds to an eccentricity of ≈ 0.06%. The efficiency of the Raman
oscillator was investigated by decreasing the pump power until a single emission
wavelength was observed on the optical spectrum analyzer (inset of figure 5.5). The
measured threshold is 86 µW for this 40-µm sphere. This value is nearly 1000× lower
than the corresponding values measured in previous work using microdroplets (45 mW
for a 30-µm CS2 droplet; ref. [57]), despite the fact that silica has a 1000 times lower
Raman gain coefficient (compare table5.2). This improvement of nearly 106 times
lower threshold results from efficient single WGM excitation and controlled coupling,
whereas free space beams (used previously) lack high spatial mode selectivity and
efficient power transfer. The measured unidirectional absolute conversion efficiency
was 16%, with a differential quantum efficiency (CW and CCW oscillation) of 36%.
In other microspheres tested Raman output powers as large as 200 µW have been
obtained.
5.4.1 Coupling dependence of stimulated Raman threshold
The threshold formula predicts a strong dependence of the threshold on the coupling
dependence. To investigate the dependence on quality factor, the threshold was
measured while varying the coupling between the taper and microsphere by changing
the air gap (compare figure 5.5). The data follow a near parabolic shape with a
77
measured minimum value of 62 µW. This value is, to the author’s best knowledge, the
lowest directly measured (not inferred) Raman threshold for any nonlinear substance
to date. A theoretical fit, based on exponential dependence of the coupling Q, shows
excellent agreement.
As a further verification of the threshold formula the theoretical minimum thresh-
old value was compared with the observed value. The quality factor and the mode
splitting of the whispering-gallery mode were measured by performing a linewidth
sweep in the undercoupled regime, where the backscattering-induced doublet struc-
ture is most pronounced. These measurements yielded Q0 = 1 × 10⁸ and Γ = 2 .
The size of the microsphere was inferred from the free spectral range, ∆λ = 10.5
nm i.e. 50 µm diameter, where the free-spectral range denotes here modes with
successive angular mode number . The mode volume was calculated using an-
alytic expressions based on estimated mode numbers for the fundamental WGM
(n = 1, p = TM,m = , ≈ 139). Numerical Calculations yield a modal volume of
ca. 1300 µm3. Using these values, the theoretically expected minimum threshold is
given by 50 µWatts which is in good agreement with the experimentally measured
value of 62 µWatts.
Figure 5.6 shows the measured pump threshold plotted versus the transmission
for the data of figure 5.5. Note that the graph is not single-valued as the transmission
in over and under-coupled regime take identical values. As evident from the measure-
ment, the Raman threshold is always lower in the undercoupled regime, due to the
1/Q2-dependence of the Raman threshold. The minimum threshold (marked by the
arrow) does not lie at the critical coupling point[75], where circulating pump power
(and correspondingly Raman gain) is largest. It in fact occurs for the system in a
slightly undercoupled state (weaker cavity coupling rate than at the critical point),
corresponding to an observed pump transmission of 12%. This shift results from
the interplay between Raman gain and loss, resulting from the coupling of both the
pump and Raman wave to the fiber waveguide, and will be explained in more detail
in the next thesis chapter. In the simplified case where the quality factors of pump
and oscillating modes are equal the theoretical minimum occurs for a pump power
78
-0.6 -0.4 -0.2 0 0.2 0
100
200
300
400
Position (µm)
Th
resh
old
(µW
)
0 100 200 3000
20
40
60
80
incident power
Ram
an E
mis
sio
n (µ W
)
Figure 5.5: Coupling gap and size dependence of the Raman threshold. Main fig-ure, Raman oscillation threshold vs. taper-sphere gap for a 40-µm-diameter sphere(Q0=108). Position is measured from the critical coupling point, where negative val-ues correspond to the undercoupled regime. The minimum threshold occurs with themicrosphere about 0.15 µm undercoupled, and corresponds to a transmission of 12%.Solid line, a theoretical fit to the threshold equation. Inset shows Raman power out-put (sum of forward and backward emission) vs. incident pump power. Differentialquantum efficiency is 36%.
79
0 0.2 0.4 0.6 0.8
100
150
200
250
300
Microsphere Transmission
Ram
an T
hre
sho
ld (µW
)
overcoupled
undercoupled
Figure 5.6: Stimulated Raman scattering threshold versus transmission past the mi-crosphere, for the measurement presented in figure 5.5. Since the cavity transmissionis a symmetric function with respect to the critical coupling point, the threshold dataplotted is not single-valued, and under- and over-coupled regime are indicated in thefigure. The arrow denoted the minimum Raman threshold, which occured undercou-pled with a finite pump transmission of ca. 12% in agreement with the prediction ofthe threshold equation (under equal pump and Raman Q).
80
transmission of T = 1/9 = 11%, and is in good agreement with the measurement.
5.4.2 Mode volume dependence of the Raman threshold
From equation 5.1, the threshold is expected to scale linearly with the mode volume.
The inset of figure 5.7shows numerically calculated mode volume for a fundamen-
tal mode of a microsphere at 1550 nm. For a microsphere, the mode volume scales
approximately as radius squared. Therefore the Raman threshold is expected to ex-
hibit approximately an R2 behavior on Raman threshold. To investigate this, the
minimum threshold for various sphere diameters ranging from 28 to 110 µm was
measured. In this experiment, the minimum Raman threshold Pmint , the microsphere
size (as inferred from the free-spectral-range), the intrinsic Q in the pump band (Q0)
and the intermode coupling parameter (Γ) were measured. To extract the volumet-
ric dependence of the Raman threshold using data from cavities having different
resonant characteristics, the threshold data were normalized to the set of parame-
ters (Q0 = 108,Γ = 0, gR = gmaxR ). The result of this procedure is shown in the main
figure 5.7. The data indeed show a quadratic dependence on R (the actual fitted
exponential from a double logarithmic plot is 1.95 and is in good agreement with the
expected value of 1.83) and confirm the linear relationship of the Raman threshold
on the mode volume as predicted by equation 5.1. It should be noted that for smaller
spheres the mode volume deviates from this R2−behavior and ultimately, since for
very small diameters, the mode volume increases due to weakening of the whispering
gallery confinement. The minimum mode volume occurs for a radius of 6.9µm (for
= m = 34)[76] for 1550 nm wavelength and the mode volume is Vmin = 173.1µm3.
However, this size is not optimum for stimulated Raman scattering as the additional
benefit of reduced mode volume is more than offset by the significant decrease in Q
factor to ~105 due to whispering-gallery loss (Threshold power ∝ V/Q2). In previous
work on microdroplets, it was found that for droplets with diameters of less than 30
µm there is an additional threshold reduction due to cavity QED effects[70]. In the
present work we could not accurately determine threshold in this size range. Smaller
81
0 20 40 60 80 100 1200
100
200
300
400
500
600
700
Sphere Diameter ( µm) Q0=1
08 N
orm
aliz
ed T
hre
sho
ld (µW
)
20 40 60 80 100 1200
2000
4000
6000
8000
Sphere Diameter
Mo
de
Vo
lum
e ( µ
m3 )
Vsphere
Figure 5.7: The Raman oscillation pump threshold of a microsphere as a functionmicrosphere diameter. To compare microspheres with different resonance character-istics, the Raman threshold was Q-normalized to Q = 1.0× 10⁸ and modal couplingnormalized to Γ = 0. A double logarithmic plot of the data with a linear fit obtainsa dependence of Pthresh ∝ R1.95 which is in close agreement with the theoreticallyexpected dependence of Veff ∝ R1.83. The inset shows the calculated mode volumeof a microsphere as a function of diameter using a finite-element solver.
82
spheres experienced very large temperature effects, causing the WGM’s to experience
instabilities as well as thermal shifting of the spectrum, complicating pumping of
the resonant mode. With sufficient thermal control it may be possible to quantify
precisely the reduction of threshold in this smaller size regime.
5.5 Conclusion
There are several ways to improve the performance of this system. Quality factors
of 109 have been achieved previously in fused-silica microspheres[71], which should
lead to sub-microwatt Raman thresholds. The use of small spheres (provided tem-
perature issues can be resolved) should improve Raman conversion efficiencies under
increased pump power due to the increase in free spectral range, which decreases the
efficiency of secondary Raman lines and Raman-assisted four-wave-mixing. Planar
microcavities, such as disks should allow true single-mode emission, and in fact were
also demonstrated in this thesis, using toroid microcavities (see chapter 9).
Concerning the outlook for future work and the implications of this work beyond
an ultra-efficient and compact Raman source: As noted earlier, Raman and four-wave-
mixing in these systems have been observed. These non-linearities can be accessed in
a compact volume through a nearly ideal field transport channel (optical fiber) and
field coupling junction (the tapered optical fiber). As such, this system can be viewed
more broadly as a building block for study of a host of nonlinearity within a high-Q sil-
ica resonator and potentially for generation of non-classical photon states[77][64] and
their efficient transport. Indeed, the compact nature of the system combined with the
potential of fiber field transport could afford relatively straightforward access to reso-
nant systems in normally challenging environments such as ultra-low-T chambers[62].
The ability to load or suitably modify spheres using dopants or quantum dots could
also be useful in such studies.
83
Chapter 6
Theoretical and experimentalanalysis of cascaded Ramanscattering in ultra-high-Qmicrocavities
6.1 Introduction1
In the previous chapter stimulated Raman lasing was observed in fiber coupled mi-
crosphere resonators at ultra-low threshold and high efficiency. Due to the high con-
version efficiency the internal Raman fields can reach power levels which are sufficient
to generate higher order Raman fields. This process, which is referred to as cascaded
Raman scattering, is described in this chapter and analyzed both theoretically and ex-
perimentally. Cascaded Raman scattering in liquid microdroplets has been observed
up to 14th order, but in these studies the characteristics of the pump-to-Raman conver-
sion could not be studied. In this chapter cascaded Raman scattering in microspheres
is observed and the pump-to-Raman characteristics measured. Theoretical analysis
shows that the generated higher order Raman fields exhibit distinct characteristics
on their order. Even order Raman fields exhibit a linear pump-to-Raman conversion,
while odd order exhibit a square-root pump to Raman conversion efficiency. Further-
1Work in this chapter has been published in: "Fiber-coupled cascaded Raman laser",Optics Letters, 2003 and "Theoretical and Experimental Analysis of Stimulated Ramanscattering in ultra-high-Q optical microcavities", submitted (JSTQE).
84
more scaling-laws underlying the cascaded Raman process are derived. The threshold
for N th−order cascaded Raman modes is shown to follow a N3−dependence, whereas
the efficiency decreases with Stokes order as 1/N2. The theoretical findings are in
good agreement with measurements up to second order Raman modes, and have also
been confirmed beyond second order Raman scattering by Bumki Min [29], who ver-
ified the pump threshold and efficiency relation up to 5 orders in microspheres[29],
using a 980-nm-wavelength pump laser. Furthermore, the first section will present
the coupled-wave equations for Raman lasing in a waveguide-coupled whispering-
gallery-mode resonator, and complements the experimental results discussed in the
previous chapter. The nonlinear processes can be conveniently described using the
coupling-of-modes formalism of chapter 2, by properly defining the (intra-cavity) Ra-
man gain coefficient. Using this set of equations, the expression for the threshold and
the efficiency of stimulated Raman scattering is derived and the optimum coupling
(minimum Raman threshold) analyzed. The analysis is then extended to the case
of cascaded Raman oscillation in which Raman signals serve to pump and generate
higher-order Raman waves.
6.2 Theoretical analysis of stimulated Raman scat-
tering in microcavities
6.2.1 Coupled-mode equations for 1st order Raman scatter-
ing in microcavities
The classical coupled-wave-equations for stimulated Raman scattering have been
given by several authors. In the conventional treatments, the pump and Raman
waves are assumed to be plane waves, with only one spatially varying variable, sim-
plifying considerably the coupled wave-equations. In the case of a microcavity, the
fields involved are the whispering-gallery modes. By reformulating the wave-equation
one arrives at a similar set of equations as in the case of plane waves, however with
85
modified coupling coefficients, which take into account the coupling among different
WG-modes. This treatment leads to the definition of overlap factors (or alternatively
stated to the definition of the effective mode area, or effective mode volume). The
plane wave interaction is described by:
d
dzIp = −
µωp
ωR
¶gRIRIp
d
dzIR = gP IpIR
In these equations2 the bulk Raman gain coefficient is given by gR and is well known
for silica fibers. The equations can also be formulated in terms of the electric field
which is related to the field strength by: I = 12n oc |E|2.
d
dz
−→E p = −1
2
µωp
ωR
¶µc
neff
¶gR
¯−→E R
¯2−→E p
d
dz
−→ER =
1
2gR
µc
neff
¶ ¯−→E p
¯2−→ER
To connect these equations with the previously introducedmodel of aWGMmicrocavity-
waveguide system, the slowly varying amplitude (cavity excitation) Ai(t) is intro-
duced. Furthermore, to facilitate the discussion, the amplitude is normalized to yield
the electromagnetic energy of the whispering gallery mode, |Ai|2 = UWGM .
Ei(r, z, φ, t) =1√Ni
Ai(t) ·E(r, z)eiωit−imiφ
where
Ni ≡Z ¯
Ei
¯2dV = 2π
Z ¯Ei
¯2dA
2The factor³ωpωR
´reflects conservation of photon number in the Raman process, i.e. d
dz (Ip~ωp −
IR~ωR ) = 0. (termed Manley-Rowe relations).
86
Inserting these solutions into the coupled mode equation (and reformulated in the
temporal domain) leads to:
µc
neff
¶−1dAp
dtEp = −
ωp
ωRgR(ωp,ωR)
µc
neff
¶ ¯ER
¯2Ep · |AR|2Ap
1
NRµc
neff
¶−1dAR
dtER = gcR(ωp, ωR)
µc
neff
¶ ¯Ep
¯2ER · |AP |2AR
1
Np
(6.1)
Next, in order to eliminate the explicitly appearing field dependence Ei, and
to arrive at an equation which describes the evolution of the energy of the pump
(|Ap|2) and Raman modes(|AR|2), the equation is multiplied by the operatorRE∗R,pdV
from the left. This reduces the explicit field dependence as entered through Ep,R =
Ep,R(r, z, φ) to an overlap factor, which is the effective mode are of the nonlinear
process.
dAp
dt= − ωp
ωRgR(ωp,ωR)
µc
neff
¶2Veff · |AR|2Ap
dAR
dt= gcR(ωp, ωR)
µc
neff
¶2Veff · |AP |2AR
V −1eff =
R|Ep|2 |ER|2 dVR
|Ep|2 dVR|ER|2 dV
(6.2)
Since the reformulated equations are now compatible with the coupling-of-modes
formalism (for the treatment of the whispering-gallery coupling junction), one can
proceed and add waveguide coupling and intrinsic loss terms, as has been done in
chapter 2:
dAp
dt= −
µ1
2τ ex+
1
2τ 0
¶p
Ap −µωp
ωR
¶gR(ωp,ωR)
c2
2n2effVeff · |AR|2Ap +
r1
τ exs
dAR
dt= −
µ1
2τ ex+
1
2τ 0
¶R
AR + gcR(ωp, ωR)c2
2n2effVeff · |AP |2AR
V −1eff ≡RVcav
|Ep|2 |ER|2 dVRdV |ER|2 ·
R|Ep|2 dV
(6.3)
87
Three comments are in place. First, it should be noted that the Raman gain
will excite both CW and CCW Raman modes of the resonator. For simplicity of
discussion the two modes are here described by only one amplitude, such that |AR|2 =
|AccwR |2 + |Acw
R |2 . Therefore, equal amplitude emission occurs along both waveguide
directions given by |sr|2 = |AR|22τex
. Secondarily, modal coupling is generally present in
the UHQ WG-resonators, exciting both CW and CCW pump modes, as described by
a coupled set of equations as in chapter 4. The treatment of modal coupling in the
case of stimulated Raman scattering can however be simplified, by treating the total
pump field |Ap|2 =¯Accwp
¯2+¯Acwp
¯2. The reduction in total circulating power due to
modal coupling C(Γ), can be taken into account power by redefining an equivalently
reduced Raman gain (i.e. by a factor of 1/C(Γ)). Thirdly, other nonlinear effects
such as Four-wave-mixing or Brillouin scattering are not considered in this analysis
as the microcavity poses stringent frequency matching constraints on these processes
making their observation difficult. In the case of Stimulated Brillouin Scattering,
the narrow gain bandwidth in the range of 100 MHZ makes overlap of cavity modes
with the Brillouin gain spectrum unlikely. In the case of four-wave-mixing, stringent
phase matching conditions are present (and will be discussed in chapter 10). For
simplification, we assume that the pump wavelength and the Raman wave are on
resonance and use the slowly varying envelope approximation.
dAp
dt= −
µ1
2τ ex+
1
2τ 0
¶p
Ap −ωp
ωRgcR · |AR|2Ap +
r1
τ exs
dAR
dt= −
µ1
2τ ex+
1
2τ 0
¶R
AR + gcR · |AP |2AR
(6.4)
Here A signifies the slowly-varying amplitude of the pump and Raman WGM
modes of the cavity and s denotes the input wave. The excitation frequency of the
pump mode and resonant Raman mode is given by ωR and ωpand τ is the total life-
time of photons in the resonator, which is related to the quality factor by Q = ω · τ .
The coupling coefficient κ =q
1τex
denotes the coupling of the input pump wave s
to the cavity whispering-gallery-mode Ep[46]. The Raman intra-cavity gain coeffi-
88
cient is denoted as gcR, which is related to the more commonly used gain coefficient
gR(measured in units of m/Watt) by,
gcR ≡c2
C(Γ)2n21
VeffgR(ωR, ωp) and Veff =
R|EP |2 dV
R|ER|2 dVR
|EP |2 |ER|2 dV(6.5)
where Veff is the effective modal volume, and−→E is electric field of the WGM. This
definition of effective mode volume deviates from the previously introduced energy-
density related definition, because it takes into account the spatial overlap of the
pump and Raman modes, and the intensity dependent gain.
6.2.2 Effective mode volume and modal coupling
It is interesting to note that the presence of standing waves (as described by the
intermode coupling parameter Γ, see chapter 3) does not effect Veff , and for differ-
ent combinations of standing-wave and traveling-wave character pump and Raman
mode leads to the same value (provided pump and Raman mode are fundamental
whispering-gallery modes). This is the case, since mode volume is smallest for the
fundamental modes, and overlap of the fundamental with higher order azimuthal
modes is low). This can be seen explicitly inserting the φ−dependence pump and
Raman WGM into the definition of Veff (containing the proper normalization as in
chapter 3), and allowing for different excitation strength of the CW and CCW ampli-
tude (a, b). Here mp = p,mR = R designate the azimuthal mode number of pump
and Raman mode.
ER(r, z, φ) = ER(r, z)1q
|aR|2 + |bR|2¯aRe
imRφ ± bRe−imRφ
¯2Ep(r, zφ) = ER(r, z)
1q|ap|2 + |bp|2
¯ape
impφ ± bpe−impφ
¯2As can be seen there are four possible cases of Raman and pump mode overlap,
designated by (++) , (−+) , (+−) , (−−). Carrying out the φ−integration (and ne-
89
glecting the r, z integration over the transverse mode profile) yields for the (++)
case:
V −1eff(++) ∝Z
dφ ·¯aRe
imRφ + bRe−imRφ
¯2 ¯ape
impφ + bpe−impφ
¯2(|ap|2 + |bp|2)(|aR|2 + |bR|2)
= 2π +2π
(|ap|2 + |bp|2)(|aR|2 + |bR|2)
Zdφ ·
¡2apb
∗pe
imRφ(|aR|2 + |bR|2) + ...¢.| z
=0
= 2π
Equivalently all the other combinations overlap factors ++,−+,+−,−− also lead
to this result, and as such the effective mode volume, is for different values of inter-
mode coupling (as given by Γ) of pump and Raman mode equivalent. This result is
due to the fact, that the polar mode numbers of pump and Raman mode are distinct,
causing no contribution from the cross terms in the integration. Hence the effective
mode volume is given for all four cases by:
Veff = 2π
R|Ep(r, z)|2 |ER(r, z)|2 rdrdzR
|Ep(r, z)|2 rdrdzR|ER(r, z)|2 rdrdz
≈ 2πR0Aeff
Where in the last line the highly localized nature of the WGMmodes near the perime-
ter has been used (i.e. r ≈ R0).
6.2.3 Stimulated Raman scattering threshold and conversion
efficiency
Steady state analysis of the coupled mode equations, results in a clamped, cavity
pump field above threshold. This clamping alters the coupling of pump power to the
resonator, and, in turn, the pump power dependence of Raman laser power such that
the following square root dependence results.
PR =ωr
ωp
µ1
τ ex
¶2µ1
2τ 0+
1
2τ ex
¶−2· Pt
ÃrP
Pt− 1!
(6.6)
90
The physical origin of this square root dependence of the pump-to-Raman conversion
can be viewed as a “pumping inefficiency” i.e. the coupled pump power does not in-
crease linearly with launched fiber power. The nonlinear dependence of coupled pump
power can be illustrated by considering a pump wave that is initially critically coupled
to the resonator. As noted above, critical coupling features complete transfer and dis-
sipation of power from the resonator (i.e., zero transmission). In terms of the fields
involved in coupling both to and from the resonator, critical coupling results from
the destructive interference of the cavity leakage field with the transmitted, pump
field (i.e., the portion that does not couple to the resonator from the waveguide).
Once the onset of Raman lasing is reached, the cavity pump field is clamped at the
threshold value resulting in a fixed cavity pump leakage field. Subsequent increase in
launched pump power will imbalance the leakage and the transmitted pump fields,
giving rise to finite transmission and a shift away from the critical point. The pump
coupling to the resonator is thereby less and less efficient as the pump field is in-
creased. The expression for the Raman threshold pump power can be factorized into
terms involving modal volume, waveguide-cavity coupling strength and cavity life-
time (or Quality factor). To facilitate separation of the coupling and intrinsic lifetime
dependence, the in chapter 4 introduced dimensionless normalized coupling parame-
ter Kp =³
τ0τex
´pis used. In the ideal case of a single-mode waveguide coupled to a
whispering-gallery-mode the waveguide transmission as a function of coupling is given
by T =¡1−K1+K
¢2and K typically varies exponentially with the waveguide-microcavity
"coupling gap" distance [46].
Pt =π2n2
C(Γ)gRλpλRVeff ·
µ1
Q0
¶R
µ1
Q0
¶P
· (1 +KR) (1 +Kp)2
Kp(6.7)
Here C(Γ) is a correction factor to account for intermode coupling of the degenerate
clockwise and counterclockwise propagating whispering-gallery modes, and which has
been introduced and plotted in chapter 4 of this thesis. Briefly restated, the leakage of
the cavity field into the backwards waveguide direction causes a reduction of the cavity
buildup factor with respect to the ideal case in the absence of intermode coupling.
91
In the limit of strong modal coupling, the cavity buildup factor is reduced by a
factor of 2, which subsequently causes a twofold increase in the threshold necessary
to achieve Raman lasing. In the presence of modal coupling the waveguide coupling
condition for minimum threshold experiences a slight shift towards over-coupling with
the maximum shift occurring at Γ ≈ 1.5. In the regime of very strong modal coupling
the condition of minimum Raman threshold approaches again the original condition
K = 1/2.
The threshold expression follows an inverse square dependence on the quality
factor. This reflects the fact that an increase in Q will cause a twofold benefit in
terms of both reducing cavity round trip losses that must be overcome for threshold
as well as increasing the Raman gain, due to the intensity dependence of the Raman
gain coefficient on the pump field (∝ gRIp). In addition, the equation shows that the
threshold scales linearly with the effective modal volume. The volume dependence of
the Raman threshold was examined experimentally in previous chapter, and confirmed
experimentally.
The threshold equations also exhibits a strong loading dependence, and figure 6.1
shows a plot of the threshold equation for typical microcavity parameters, for the
experiments in the previous chapter. A good approximation in the experiments, is to
assume equal coupling strength to both pump and Raman mode i.e. Qpex = QR
ex.This
assumption is based on the assumption of equal evanescent field decay for pump and
Raman mode, which is the case for p, R À 1 (see chapter 1). When analyzing the
coupling dependence under this assumption (Qpex = QR
ex) but allowing for different
intrinsic RamanQR0 and pumpQ-factorsQ
p0, the minimum threshold can be calculated
and occurs for:
Qminex =
Qp0
2+
sµQp0
2
¶2+ 2QR
0Qp0 (6.8)
Furthermore from eqs. 6.8 it is evident that for QR0 < Qp
0 minimum threshold occurs
for Qminex < 2 ·Q0, whereas for QR
0 > Qp0 minimum threshold occurs for Q
minex > 2 ·Q0.
When analyzing the coupling dependence under the assumption of equal Raman and
pump quality factors and coupling factors Kp = KR ≡ K and τR = τ p, the minimum
92
10-1 1000
50
100
150
200
250
300
350
400
450
Coupling K ≡ τ0/τ
ex
Th
resh
old
in µ
W
Model parameters Q
0 =1 x10⁸
R0 = 26.5 µm
Aeff
= 8µm2 λ
p= 1550 nm
λR= 1660 nm
Γ=0 P
MIN =118 µWatts
Figure 6.1: Theoretical calculation of the stimulated Raman threshold as a functionof coupling, for a Q=108, 53-µm−diameter microsphere. Minimum threshold occursundercoupled.
93
threshold occurs when Qminex = 2 ·Q0 or Kmin= 1
2, i.e. in the undercoupled regime
with finite waveguide transmission of Tmin= 19(˜11%), which was indeed observed
experimentally (as noted in the last chapter).
Pt =π2n2
C(Γ)gRλpλRVeff ·
µ1
Q0
¶2· (1 +K)3
K(6.9)
Pmint =
cπ2n2
C(Γ)gRλpλRVeff ·
µ1
Q0
¶2· 274
(6.10)
It is worth noting that at this coupling condition, the circulating pump-power in the
resonator is not maximum. This can be understood since minimum threshold repre-
sents an optimal balance of both pump coupling and Raman mode coupling loss. The
conversion of pump power to Raman power above threshold can be characterized by
the differential slope efficiency. The bidirectional external differential slope efficiency
ηex is derived by linearizing the expression for PR near the threshold condition and is
given by,
ηex ≡dPRaman
dPlaunched= 2 · ωr
ωp
µ1 +
1
K
¶−2(6.11)
Figure 3 shows the differential slope efficiency as a function of coupling strength. It
is noteworthy that it approaches the value of 2ωrωpin the limit of strong over-coupling
( τ0τex=∞). Surprisingly, this value exceeds unity, indicating that every waveguide
pump photon added above threshold, is converted on average to more than one Ra-
man photon. This result can be understood by again considering the nonlinear de-
pendence of coupled pump power, except this time in the over-coupled regime. In
particular, the differential increase in coupled pump power grows more quickly in the
over-coupled (more slowly in the undercoupled regime) than the differential increase
in launched pump power. This leads to the interesting effect that the differential
photon conversion efficiency can exceed unity. Taking into account the nonlinear de-
pendence of coupled pump power by defining the internal differential efficiency ηint
as the coupled (as distinct from the launched) pump-to-Raman power, the efficiency
94
10-1 100 101 1020
0.5
1
1.5
2
Waveguide-Resonator Coupling
Dif
fere
nti
al Q
uan
tum
Eff
icie
ncy
over-coupled under-coupled
η internal
η external
Figure 6.2: External and internal pump to Raman differential conversion efficiency.The external efficiency refers to conversion of launched pump power to Raman outputpower, while the internal efficiency is the coupled pump power to Raman outputpower. As evident, the external efficiency can exceed unity in the over-coupled regime.
95
approaches, as expected , the value ωrωpin the limit of strong over-coupling.
ηint ≡dPRaman
dPcoupled=
ωr
ωp
K
(K + 1)(6.12)
Figure 6.2 shows both the internal and external differential Raman conversion effi-
ciencies as a function of coupling strength.
6.2.4 Analysis of cascaded Raman scattering in high-Q mi-
crocavities
The first Raman field can itself act as a secondary pump field and generate further
Raman modes. This process of cascaded Raman scattering can be described by
including higher order coupling terms into the coupled mode equations of pump and
Raman fields as shown below[29].
dEp
dt=
∙−µ1
2τ t
¶P
− gcR1
µωP
ωR
¶|ER1|2
¸Ep +
r1
τ exs (6.13)
dER1
dt=
"−µ1
2τ t
¶R1
+ gcR1|Ep|2 − gc
R2
µωR1
ωR2
¶|ER1|2
#E
R1
dER2
dt=
"−µ1
2τ t
¶R2
+ gcR2|ER1|2 − gc
R3
µωR2
ωR3
¶|ER3|2
#E
R2
.......
dERN
dt=
"−µ1
2τ t
¶RN
+ gcRN
¯ER(N−1)
¯2#E
RN
whereN is the Raman order. To find the corresponding thresholds and output powers
for these higher order processes, the set of equations can be solved iteratively in steady
state. To facilitate the discussion, the dimensionless coefficients ci is introduced.
ci ≡ωi
ωi+1· g
ci+1
gci+2=
ωi
ωi+1· Veff(λi+2)Veff (λi)
(6.14)
The general solutions for the threshold of the even and odd order N th Raman modes
are given by the following expressions. As in the previous section, we have assumed
96
equal coupling strengths and intrinsic Q factors for the pump and Raman modes.
PN=2mt =
1
C(Γ)
1
gcR
τ ex
(τ t)3
ÃmXi=0
(ci)i
!2Ãm−1Xi=0
(ci)i
!
PN=2m+1t =
1
C(Γ)
1
gcR
τ ex
(τ t)3
ÃmXi=0
(ci)i
!3(6.15)
As evident from these expressions even and odd order Stokes fields exhibit different
threshold powers as a function stokes order. When considering Raman scattering
in silica at optical frequencies, one can approximate the above expressions by taking
ci ≈ 1 since the Raman shift is small compared to the optical frequency. In addition it
is assumed that the mode volume is wavelength-independent. Under this assumption,
the threshold expressions reduce to:
PN=2m+1t =
1
C(Γ)
π2n2
gRλpλRVeff
1
Q20
(1 +K)3
K· (N + 1)3
8(6.16)
PN=2mt =
1
C(Γ)
π2n2
gRλpλRVeff
1
Q20
(1 +K)3
K· N
2(N + 2)2
8
It follows that the threshold for cascaded Raman oscillation exhibits a cubic depen-
dence on Raman order N (compare figure 6.3). The emission power varies depending
upon whether the highest order wave is even or odd. For the odd order case, all odd
orders increase as the square root of the pump power and even orders are clamped.
For the even order case, all even order lines increase linearly with pump power while
odd orders are clamped. Figure 6.3 illustrates this behavior showing the Raman
output for several Stokes orders as a function of input pump power. The analytic
expressions for the Raman output power in these cases are given by:
PN=2m+1 = ηNex · 2µq
PNt P − PN
t
¶(6.17)
PN=2m = ηNex ·¡P − PN
t
¢The differential power conversion efficiencies can be obtained by linearizing the above
97
1 2 3 4 5 6 70
10
20
30
40
50
60
70
Cascaded Raman Mode (N)
No
rmal
ized
Ram
an T
hre
sho
ld
x 23
x 33
Figure 6.3: Microcavity stimulated Raman threshold as a function of cascaded Ramanorder (N) as given in equation 6.16. The threshold is normalized to the threshold ofthe first order. The cascaded Raman threshold exhibits a N3−scaling law on Stokesorder N .
98
expressions near the threshold condition. The external and internal differential effi-
ciencies decrease steadily as a function of stokes order. For optical frequencies that
are much larger than the Raman shift, the external differential conversion efficiency
reduces to:
ηN=2mex =λpλRN
µ1 +
1
K
¶−2· 16
(N + 2)2(6.18)
ηN=2m+1ex =λpλRN
µ1 +
1
K
¶−2· 8
(N + 1)2
For high order (N) Raman fields, the external differential conversion efficiency thus
follows a 1/N2-dependence.
6.3 Observation of cascaded Raman scattering in
ultra-high-Q microspheres
The presence of Raman scattering in microspheres leads to the possibility of generat-
ing higher order Raman modes by cascade. By using a shorter pump laser (located at
around 1450 nm) cascaded Raman scattering was indeed observed. Figure 6.4 shows
a typical cascaded Raman spectrum, with a second order Raman mode appearing in
the 1650-nm band, two phonon frequencies shifted from the pump. The pump-to-
Raman conversion characteristics for first order Raman scattering and the 2nd order
Raman mode are shown in the inset. It can be seen that the first order mode does
indeed exhibit a square-root dependence on the launched pump power. The solid line
is a fit using equation 6.17. The 2nd order Raman mode, in contrast, exhibits the
expected linear increase with pump power.
To study cascaded Raman scattering beyond 2nd order, experiments using a 980
nm wavelength pump [29] were employed. The shorter wavelength pump allowed the
observation of up-to 5th-order cascades (from 980-1300 nm) owing to the reduced
mode volume at shorter wavelengths, and the higher Raman gain coefficient (gR ∝
1/λ). With less than 900 µ-Watts of launched fiber power up to fifth order Stimulated
99
1450 1500 1550 1600 1650 1700
-70
-60
-50
-40
-30
-20
-10
0
Wavelength (nm)
Inte
nsi
tiy
(dB
m)
700 800 900pump (µW)
1st
Ord
er E
mis
sio
n
6 8Pump (mW)
2nd
Ord
er E
mis
sio
n λ
p λ
R1
λ
R2
Figure 6.4: Cascaded Raman scattering in a 58-µm−diameter microcavity. The pumpWGM is located at 1450 nm. The insets show the pump-to-Raman conversion forfirst (left inset) and second order (right inset) Raman modes (measured on differentmicrocavities). The 1st order Raman mode exhibits a square-root, and the 2nd orderRaman mode a linear pump-to-Raman conversion characteristic, in agreement withthe theoretical prediction. Solid lines: A theoretical fit using equations 6.17.
100
Raman Scattering was observed [29].
6.4 Summary
In summary cascaded Raman scattering in microspheres is experimentally observed
and theoretically analyzed in waveguide-coupled microcavities, which apply to the
results obtained in taper-fiber coupled microspheres or toroid microcavities. A the-
oretical analysis was presented using the coupled mode equations for the pump and
Raman WGMs. Using these equations, the threshold condition for stimulated Raman
scattering was derived and the relative importance of waveguide coupling strength,
mode volume and intrinsic resonator Q were described. Furthermore the analysis
was extended to the case of cascaded Raman oscillation and threshold and efficiency
expressions were derived for higher-order Raman fields. This analysis revealed that
odd and even order Raman lines exhibit different pump-to-Raman emission charac-
teristics. Even order Stokes fields are found to exhibit a linear increase in generated
Raman power as a function of pump power, whereas odd-order Stokes fields exhibit
a square root dependence. In addition the underlying scaling laws for threshold and
efficiency were derived.
101
Chapter 7
Ultra-high-Q toroid microcavitieson a chip
7.1 Introduction1
Wafer-scale processing techniques allow precise dimensional at the nano-scale level,
and are the foundation of modern microelectronics. The potential of these techniques
in the domain of optics, and in particular optical microcavities, has been extensively
investigated in the early 1990, and have led to the demonstration of a variety of chip
based optical microcavities concepts. Microdisk cavities were among the first chip-
based microcavities demonstrated[78]. Since then, a variety of other confinement
geometries, such as vertical micro-posts or photonic crystal defect cavities have been
demonstrated. The small mode volume and high-Q factor of these structures, can
be used in a variety of fundamental and applied studies. In addition the wafer-
scale nature allow possible integration with complementary optical, mechanical or
electrical functionality. Reported Q-factor results have ranged from 13,000[79] in
InGaAs microdisks, to 130,000 in polymer rings[80], to a record value of more than 3
million in a silica microdisk [34] and described in thesis chapter 8.
However, these Q-factors are several orders of magnitude lower than those found
in surface-tension-induced micro-cavities, since the nanometer-scale surface finish re-
quired for ultra-high-Q has not been attainable using wafer-scale processing. In this1Section 1.1-1.3 have appeared in: "Ultra-high-Q toroid microcavity on a chip",
Nature, 421, No. 6926 (2003). Remaining sections are in preparation (2004).
102
chapter, we present and explore the properties of a chip-based (planar) STIM de-
vices in the form of a micro-toroid which combine for the first time the advantages
of wafer-scale processing and ultra-high-Q [81]. These cavities are made by combin-
ing conventional micro-fabrication techniques with a laser-assisted re-flow process to
achieve the atomic-scale surface finish characteristic of STIMs, and the fabrication
is described in appendix A of this thesis. In this chapter, the optical properties of
toroid microcavities are analyzed, and Quality factors demonstrated in excess of 100
million. This value constitutes an improvement in terms of Q-factor of nearly 4 or-
ders of magnitude. The mode structure of these micro-cavities is shown to exhibit a
strongly-reduced mode density compared to a micro-sphere of the same size. Besides
Q-factor, the mode volume is of interest. Using a finite element solver, the optical
modes of toroid microcavities are solved and the corresponding mode volume calcu-
lated. Numerical simulation reveals that a strong reduction of mode volume compared
to spherical microcavities is possible, and experimental results for high Q-factor small
mode volume cavities are presented. The highest value of Q/V was ca. 106 (λ/n)−3 .
7.2 Taper coupling to toroid microcavities
The optical modes of a toroid are whispering-gallery type and circulate at the periph-
ery of the toroidally-shaped silica cavity. Efficient coupling to the toroid microcavities
can therefore be achieved using tapered optical fibers in the same experimental setup,
which has been described in chapter 2 of this thesis. In particular, as the material of
the cavity is silica, the effective index neff is close to the index of refraction of op-
tical fiber, and therefore tapered fibers are also expected to achieve phase—matching
of the toroidal WGM. Whereas in the case of microspheres, also D-shaped fibers or
prisms have been used to efficiently excite the whispering-gallery type optical modes,
the latter is not suitable for coupling to toroid microcavities on a chip, due to the
proximity of the toroid to the planar silicon substrate (typically only several microns
of separation). Tapered optical fibers in contrast, provide an ideal coupling technique
103
Figure 7.1: A toroid microcavity fabricated from a 1 µm−thickness thermal oxide.The toroidal cross section is apparent and exhibits a diameter of approximately 4micron.
Figure 7.2: SEM image of a microdisk which underwent the CO2 reflow process. Theprofile clearly reveals the toroidal shape and exhibited in this sample an eccentricityof 2%.
104
Figure 7.3: Array of toroid microcavities.
due to the small transverse extend of the tapered optical fibers, which can be used to
locally excite the toroidal WGM at the cavity periphery. Figure 7.4 shows a tapered
optical fiber coupled to a microtoroid in this fashion.
7.3 Cavity ringdown Q-factor measurements of toroid
microcavities
Figure 7.5 shows the transmission spectra through a taper in close proximity (on the
order of hundreds of nanometers) to a toroidal micro-resonator. The observed free
spectral range corresponds to the angular mode number ( -index, which in this case
is >130). Inspection of the data (inset of Fig. 7.5) shows that the resonator supports
two azimuthal (m-index or transverse) modes, tentatively identified as (m = and
m = − 1) and that coupling to the fundamental radial mode (n = 1) dominates the
measurement. This is in contrast to spheres, which support (2 +1) azimuthal modes.
In the case of ultra-high-Q modes, the spectra also exhibited a reflected signal due to
modal coupling, due to the sensitive nature of these modes to scattering centers, as
105
Figure 7.4: Optical micrograph of a tapered optical fiber coupled to a toroid micro-cavity on a silicon chip. The bright reflection from the central region is due to thereflection from the silicon pillar.
evident in figure 7.6. The significant reduction of azimuthal modes in this case, can
be inferred from comparison with the mode spectrum of a microsphere of equivalent
principal diameter, as given in figure 2.9.
The quality factor or Q of the resonators was measured in two ways, as outlined
in chapter 3. First, the full-width half-maximum of the Lorentzian-shaped resonance
in the under-coupled regime was directly measured by scanning a single-mode laser
(short-term line-width about 300 kHz) through a resonance. Low input power levels
(typically less than 5 micro-Watts) were used to avoid thermally-induced distortion
of the line shape due to resonant-field buildup within the cavity. Repeated measure-
ments on samples fabricated with various radii (80-120 µm) and tori thickness (5-10
µm) yielded Q values in excess of 100 million (108). This is a record value for a
planar device, and constitutes an improvement by nearly 4 orders of magnitude over
all previous planar micro-resonators fabricated by wafer-scale processing2.
2It is interesting to note that the optical modes of disk microcavities made from silica deposited byelectron-cyclotron-resonance plasma-enhanced chemical vapor deposition (ECR-PECVD), exhibitedQ-factors typically 1-2 orders of magnitude below those of thermally grown oxide. The laser assistedreflow did improve the quality factor, but to a level typically 1-2 orders of magnitude lower than forthermal oxide.
106
1545 1550 1555 15600
0.2
0.4
0.6
0.8
1
wavelength in nm
No
rmal
ized
Tra
nsm
issi
on
1542.5 1542.55
∆ν≈12 GHz
∆λFSR
=5.65 nm
Figure 7.5: Typical transmission spectrum of a toroidal resonator. The free spectralrange (defined as the wavelength spacing between modes with successive angularmode number ) is 5.65 nm, which corresponds to a 94-µm-diameter torus. The insetshows the splitting of the different azimuthal modes, which is ~12 GHz (0.1 nm).
107
Figure 7.6: Transmission and reflection spectrum of an ultra-high-Q toroid micro-cavity on a chip. The designated fundamental toroid modes are separated by thefree spectral range (∆λ = 10 nm). Due to the presence of modal coupling the opti-cal modes appear as doublets, giving rise to reflection (magenta). The fundamentalmodes couple most strongly to the taper mode and higher order modes are moreweakly coupled.
108
As an independent and more precise measurement of quality factor, the photon
lifetime was directly measured by cavity ringdown (The experimental setup has been
described in Chapter 2). In particular, ringdown measurements are immune to the
thermal effects described above. This was done by repeatedly scanning the laser into
resonance with a mode that was critically coupled (i.e. T = 0) to the taper. As the
laser scanned into resonance, power transfer increased until maximal “charging” of
the resonant mode was attained. At this moment, the laser input was gated “off”
by use of a high-speed, external modulator and cavity ringdown is observed as the
resonant power discharges. Because the resonator is by necessity loaded during this
measurement, the observed ringdown time yields the loaded Q-factor at the critical
point (not the intrinsic Q). Data from a typical ringdown measurement is shown in
Fig. 7.7. At time t = 0 in the figure, the laser is fully gated off and the detected power
is due entirely to the cavity discharge field. The solid line represents an exponential
fit as expected for decay of a single cavity mode. The inset shows a logarithmic plot
to infer the cavity lifetime. Nearly two orders of magnitude decay could be observed
before reaching the instrumental noise level. The loaded lifetime in this structure was
43 ns. As a further check on this time constant, after fully gating-off the pump laser
the waveguide power has dropped to 80% of its predicted maximal value. This value
is in agreement with the gating delay of the ringdown setup (approximately 8 ns). In
particular, using the observed mode-lifetime of τ = 43 ns yields,
T0 = e∆t/τcrit ≈ 0.83
As noted before, to infer the intrinsic cavity Q it is necessary to correct for loading
by the taper waveguide. In addition it is necessary to take into account excitation
of the counter-propagating mode due to scattering centers intrinsic to the resonator
(described by a dimensionless inter-mode coupling parameter Γ [82] as has been intro-
duced in chapter 4). For the mode of figure 7.7 the inter-mode coupling was measured
to be approximately Γ ≈ 1, giving rise to a weak counter-propagating wave excitation
(17% of the cavity buildup field is stored in the counter-propagating mode at critical
109
0 25 50 75 100 125 1500
0.1
0.2
0.3
0.4
0.5
0.6
0.7
0.8
0.9
Time (ns)
Tra
nsm
issi
on
0 10010-2
10-1
100
Time (ns)
Tra
nsm
issi
on
-10 0 100.4
0.6
0.8
1 τ = 43 ns
Γ=0.92
Figure 7.7: Cavity ringdown measurement of a toroid microcavity at the criticalcoupling point. The solid line is a fit using an exponential decay of the recordedcavity leakage field. Right Inset: logarithmic plot to infer the cavity decay time. Leftinset: Under-coupled line-width scan to obtain the splitting frequency and modalcoupling parameter. When taking into account the waveguide loading and modalcoupling, the measured lifetime of τ crit = 43 ns and corresponds to an intrinsicquality factor of Q = 1.25×10⁸.
110
0 50 100 150 2000
0.1
0.2
0.3
0.4
0.5
0.6
0.7
0.8
Time (ns)
Tra
nsm
issi
on
0 50 100 150 20010-2
10-1
100
Time (ns)Tr
ansm
issi
on
τcrit
=75 ns
Intrinsic Q Q
0 = 3.7 x 10 8
Figure 7.8: Cavity ringdown measurement of a toroid microcavity with a free spec-tral range ∆λFSR = 7.3 nm. The main figure shows the cavity decay signal atthe critical coupling point, exhibiting a critical decay time of 75 ns (which corre-sponds to 0.98×10⁸). When correcting for waveguide loading (Γ ≈ 3) the intrinsicQ-factor yields 3.7×10⁸. The corresponding finesse of the cavity is F = ∆λFSR/∆λ =1.74× 10⁶.
coupling). As has been discussed in chapter 4, the presence of inter-mode modifies
the relation between intrinsic (unloaded) and critically coupled Q:
Q ≡ ω0τ 0 = ω0τ crit
³1 +√1 + Γ2
´(7.1)
This yields an intrinsic cavity Q of 1.25 × 10⁸ inferred from cavity ringdown. This
value agrees with the measurements of the frequency line shape described above. The
highest optical Q-factor presently observed in toroid microcavities is shown in figure
7.8, yielding a intrinsic Q factor of 4× 10⁸, which has been observed in a microtoroid
with a ca. 70 µm principal diameter.
111
Finally, there is an alternate method for determining the intrinsic Q factor in
cases where thermal broadening does not allow to accurately determine the intermode
coupling parameter. This approach does not require knowledge of Γ, but rather only
the doublet splitting frequency (γ−1). As before, the ring-down lifetime at the critical
coupling condition is measured. However, now the following expression is used to
relate both this information and the measured splitting frequency to the intrinsic Q
factor.
Q0 = ωτ 0 =2
τ crit
µ1
τ 2crit− 1
γ2
¶−1(7.2)
This method is less sensitive to thermal effects since the splitting frequency is nearly
immune to thermal shifts (since for symmetric mode splitting, each mode is affected
equally by the excitation wave and thermally shifted by equal amounts).
7.4 Modeling of toroidal whispering-gallery modes
Besides the Q-factor, an understanding of the optical modes of toroid microcavities is
of significant interest. In this section the intensity distribution and mode volume of
toroid microcavities are calculated, within the scalar wave equation approximation.
The details of the modeling are given in appendix C. Figure 7.9 shows the mode
volume for a fundamental toroid mode (TM-polarization) as a function of minor di-
ameter (d). In this simulation the angular mode number ( = 138) was kept constant,
as well as the toroid principal diameter (D = 50µm). The case of equal minor and
principal diameter (d = D) corresponds to a microsphere. As evident from the cal-
culation, and intuitively expected, the mode volume decreases as a function of the
toroid minor diameter. Two regimes of mode volume reduction can be identified.
7.4.1 Weak modal compression regime
112
0 10 20 30 40 500
1
2
3
4
5
6
7
8
9
10
Minor toroid diameter ( µm)
Mo
de
Are
a ( µ
m2 )
0 10 20 30 40 501350
1400
1450
1500
1550
Minor toroid diameter ( µm)
wav
elen
gth
(n
m)
D=50µml=138TM
Figure 7.9: Numerically calculated mode volume of the fundamental (TM-polarization) toroid mode as a function of minor toroid diameter (d). In this cal-culation the principal toroid diameter (D) was kept constant at a value of 50 µm.The angular mode number was = 138 and was kept constant in this simulation.Theinset shows the resonance wavelength as a function of minor toroid diameter (d).
113
0 10 20 30 40 500
1
2
3
4
5
6
7
8
9
10
Minor Toroid diameter (d)
Mo
de
Are
a ( µ
m2 )
2 4 6 8 10
115
120
125
130
135
d (µm)
An
gu
lar
Mo
de
nu
mb
er
λ = const (1550 nm) D= 50 µm TE
Figure 7.10: The mode area of a fundamental toroid mode with principal diameterof 50 µm as a function of minor toroid diameter (d). In the numerical modelingthe angular mode number was adjusted to correct for the wavelength shift, due tothe decreased effective index. Inset: Angular mode number as a function of toroiddiameter.
114
Figure 7.11: Intensity plot |Eφ|2 for a fundamental TM-mode with an angular modenumber = 66 for a silica microsphere (left panel) and for a silica toroid (right panel).The principal diameter is constant (25µm).
In the initial transition from a spherical (d = D) to a toroidal (d < D) geometry,
the mode volume is reduced slowly (obeying a Vm ∝ d1/4 scaling law). The resonance
wavelength of the mode (shown in the inset of figure 7.9) is perturbed slightly and
shifted to shorter wavelengths. The wavelength shift exhibits a much slower depen-
dence on the toroidal cross section than the mode volume (obeying a λ ∝ dx,with
x = 0.04 ). Since in this "weakly perturbative" regime the resonance frequency
remains nearly unchanged and the mode volume is slowly decreasing, it can be in-
ferred that the dominant effect of the toroidal geometry are changes of the azimuthal
eigenfunctions (spherical harmonics in case of a sphere).
Indeed, numerical modeling confirms (figure 7.12) that the radial field depen-
dence (which in a sphere determines the resonance locations), remains only weakly
perturbed in this regime, whereas the azimuthal eigenfunctions are perturbed signif-
icantly leading to narrowed field distribution in the azimuthal direction.
7.4.2 Strong mode volume compression
115
-4 -3 -2 -1 0 1 2 3 4 0
0.1
0.2
0.3
0.4
0.5
0.6
0.7
0.8
0.9
1
z-Coordinate
No
rmal
ized
Inte
nsi
ty |E
z|2
Radius
In
ten
sity
|Ez|2
d=25µmd=6µmd=4µm
R=12.5µm
Figure 7.12: Radial (inset) and polar (main figure) intensity distribution for a mi-crosphere (D = d = 25µm) and toroid microcavities (d = 6µm, d = 4µm). The polarscan is taken at a radial position corresponding to the maximum intensity.
116
Upon reducing the toroid cross section beyond the weak model compression regime, a
transition to a rapidly decaying mode area can be observed in the simulation. In this
strong compression regime, not only the azimuthal eigenfunctions are significantly
changed, but also the radial eigenfunctions. The latter is evident from the fact that
the resonance locations are strongly shifted to higher frequencies, as seen in the inset
of figure 7.9. This is expected as the strongly reduced azimuthal degree of freedom of
the toroid leads to an increase in field intensity outside the dielectric cavity, leading
to a lower effective index neff (and as a result a shorter effective round-trip path-
length). This also implies that in order to calculate the mode volume for constant
resonance frequency (which reflects the experimental situation where the excitation
wavelength is kept constant), the angular mode number has to be adjusted to lower
values in order to compensate the decreased effective index neff = βm/k0. Taking
this into account the mode volume is seen to decrease earlier than in the simulation
for constant , making the mode volume compression even more severe in this regime.
Figure 7.10 shows the result of the adjustment of the angular mode number for
a 50 µm-diameter toroid microcavity as a function of minor toroid diameter (TE-
polarization). The inset of figure 7.10 shows the changes in the angular mode number,
which shifts from its original value ( = 138 for d = D) to a value of = 113 for d = 1
µm. It is significant to note that due to the reduction in angular mode number, also
the whispering-gallery loss is expected to increase (as discussed for a microsphere in
chapter 2).
7.5 Fabrication of small mode volume toroid mi-
crocavities
In many microcavity applications the figure of merit is determined by a combination
of Q-factor and mode volume. Table 7.1, shows a list of representative areas and
their respective microcavity requirements. The preceding section has shown, that the
mode volume of toroid microcavities is reduced with respect to the mode volume of
117
2 3 4 5 6 7 8 9 10
0.5
1
1.5
2
2.5
3
3.5
Minor toroid diameter ( µm)
Mo
de
Are
a ( µ
m2 )
D=25µm
D=50µm
D=75µm
Figure 7.13: Mode volume of toroid microcavities as a function of minor toroid di-ameter (d), for various principal toroid diameter (25, 50, 75µm).
118
Area of Study Figure of Merit Q-V DependenceWeak coupling Purcell-factor Fp ∝
¡QV
¢Strong coupling Crit. atom/photon number N0 ∝ V
Q, n0 ∝ 1
V
Photonics Laser threshold, optical loss Pthresh ∝ 1Q
Table 7.1: Microcavity application areas and their respective figure of merit, expressedin mode volume (V), and Quality factor (Q).
a spherical microcavity of identical principal diameter.
In this section the experimentally possible reduction of mode volume is inves-
tigated experimentally for toroid microcavities with varying principal diameter (d).
Toroid microcavities used for this study were fabricated from 1 micron thermal oxide
wafers, and exhibited a toroidal cross section of less than d < 4 µm. As in the case
of microspheres, small principal diameter toroid microcavities (D < 40 µm) were
observed to exhibit strong modal coupling (Γ > 10). Figure 7.14 shows the Q-factor
(measured at 1550 nm) as a function of principal toroid diameter, for approximately
constant minor toroid diameter (d). Ultra—high Q in excess of 108 could be maintained
for principal diameters of more than 28 µm. Subsequent decrease of principal diam-
eter resulted in a strong reduction of Q. The solid line is the whispering-gallery-loss
limit for a microsphere calculated by numerically solving the characteristic equation
(for TE and TM polarization), as has been discussed in chapter 2. The toroid mi-
crocavities exhibited a Q-factor nearly an order of magnitude below the spherical
radiation limit, indicating that other Q-limiting processes, such as surface scatter-
ing, significantly determine the experimentally observed Q-factor. The inset of figure
shows the ratio of Q-factor to mode-volume, by measuring the geometry parameters
using a SEM. The highest Q/V achieved in the present study was 8.9 × 10⁵(λ/n)−3
which is nearly an order of magnitude larger than recent measurements in photonic
crystals defect cavities. It is worth noting that the finesse of this structure F of nearly
119
10 15 20 25 30104
105
106
107
108
109
Toroid principal radius ( µm)
Qu
alit
y-fa
cto
r
10 20 30 40 50 6010
2
104
106
Radius (µm)
Q/V
-rat
io
d≈4µm
Figure 7.14: Main figure: The optical Q-factor measured as a function of toroidprincipal diameter (D) for approximately constant toroidal cross-sectional diameter(d ≈ 4µm). The numerically calculated whispering-gallery-loss Q-factor is given bythe solid line (blue:TE-case, red: TM-case). Inset: The ratio of quality factor tomode volume (in µm3) for the devices tested.
4.6× 10⁶ constitutes a record value for an optical microcavity.
7.6 Summary
Thus ultra-high-Q planar cavities on a chip were demonstrated for the first time.
Toroid-shaped microcavities were formed using a combination of lithography, dry
etching and a selective re-flow process, as described in the appendix A. Self-limited
collapse of a molten silica disk enables the dimensional control typical of wafer-scale
processing while providing the surface finish (and hence cavity Q) typical of a spher-
ical resonator. Q values obtained by this process are typically four orders of magni-
Table 7.2: Characteristic parameters of an ultra-high-Q small mode volume toroidmicrocavity.
tude higher than previous wafer-based resonators. In some applications mode volume
is also an important factor, and certain chip-based micro-resonators[83] [84] feature
smaller mode volumes than the present structures. As a gauge to the lower bound on
size, radiation leakage becomes a significant factor in determining Q for diameters less
than 28 micron. The highest Q-factor to mode-volume ration obtained was 890,000
(λ/n)−3. The planar nature of the toroid microcavity and the large transparency
window of silica suggest that these devices will find a wide range of applications in
photonics as well as in fundamental studies. As an indication of the possibilities
for these structures, in the course of this work nonlinear optical effects have been
observed with characteristics comparable to recent studies on spherical ultra-high-Q
cavities, and which will be investigated in the next chapters. As standard processing
techniques are used, the addition of optical functionality by techniques such as im-
plantation or coating is possible. Likewise, electrical functionality can be introduced
to integrate control functions with the ultra-high-Q microcavities. More generally,
this work provides a new functional element that is synergistic with recent demon-
strations of basic experimental physics on a chip. For example, by combining the
present results with techniques recently demonstrated to integrate atomic traps on
a chip[85] it would be possible to achieve chip-scale integration of cavity quantum
electrodynamics experiments and related devices. Finally, there is great interest in
improving the sensitivity of biological and chemical sensors. Proposals based upon
optical resonators[86] will benefit from the ability to attain ultra-high Q on a chip.
121
Chapter 8
Optical properties of microdiskresonators
8.1 Introduction1
Using a combination of lithography and etching, semiconductor whispering-gallery mi-
crocavities have obtained Q values in the range of 104 [84] while polymer whispering-
gallery cavities have recently obtained a Q value of 105. Q values are typically limited
by scattering at the all-important resonator perimeter. As a way to overcome this
problem, we have recently reported a technique to fabricate ultra-high-Q (exceeding
108) toroid microcavities on a chip [30]. In that work a laser-assisted re-flow step is
used to achieve the atomically-smooth resonator surface finish characteristic of ultra-
high-Q surface-tension-induced-microcavities. In this chapter it is demonstrated that
- surprisingly - planar silica disk resonators can exhibit whispering-gallery-type modes
with high-Q values in excess of 1 million and up to 5 × 10⁷, without any additional
chemical or laser processing. The observed Q-factors are due to modal isolation, due
to the wedge shaped perimeter of the microdisk cavities. The proposed mechanism
is in agreement with experiments and numerical modeling of the microdisk modes.
The spectral properties of these resonators are very regular and reproducible, and
are readily modeled. Additionally, highly efficient coupling to a planar resonator is
demonstrated by efficient coupling to these resonators through a tapered optical fiber.
1This chapter has been published in "Fabrication and coupling of high-Q silica diskmicrocavities", Applied Physics Letters, 83(4), p.797-799 (2003).
122
Figure 8.1: Scanning electron micrograph of a silica disk resonator. Inset: A silicamicro-disk coupled to a tapered optical fiber.
8.2 Taper coupling to microdisk resonators
To analyze the quality factor of these modes as well as the mode spectrum, tapered
optical fibers [55] were used to couple to the disk resonator. The tapered fiber was
attached to a piezoelectric stage which allows precise positioning of the taper with
respect to a silicon wafer containing multiple microdisks. An optical micrograph of a
taper coupled to a disk is shown in the inset of figure 8.1.
When brought in the proximity of the microdisk, the taper mode can evanescently
excite a whispering-gallery mode. The efficiency of this process depends on the ratio
of parasitic loss (e.g. undesired coupling from either the fundamental taper mode or
the target resonator mode to higher order taper modes or radiation modes) to the
intended taper-junction coupling. The efficiency of this junction in the context of
123
coupling to high-Q micro-resonators has been studied in reference [55]. Figure 8.2
shows the absolute transmission and reflection properties at resonance as a function
of the taper-disk gap of a microdisk resonator side-coupled via a tapered fiber. As
the taper is progressively moved closer to the resonator (step-size being 20 nm),
the transmission transits different coupling regimes, from undercoupled to critically-
coupled to over-coupled [46]. Nearly complete extinction is reached at the critical
point (> 99%). When further reducing the gap distance the over-coupled transmission
approaches unity (the actual measured value is > 93%). In addition, bringing the
taper close to the microdisk caused negligible scattering as observed by the small
increase in off-resonant loss of < 5%. The fact that strong over-coupling can be
achieved, with negligible off-resonant loss, demonstrates the high efficiency of the
tapered-fiber-coupling junction, which is > 93% in this case [55].
The quality factor of whispering-gallery resonances was inferred by line-width
measurements, using a 300 kHz external-cavity diode laser to excite the resonances in
the 1550-nm band. Q-factors above 1 million were consistently observed, the highest
observed value to date being 3.2× 10⁶. We attribute the high quality factor, despite
the lithographic roughness (which can be observed at the cavity perimeter with an
optical microscope), to the fact that the cavity disk perimeter exhibits angled side-
walls, due to the use of an isotropic etch. The wedge is believed to induce modal
isolation from the disk edge, where etch blemishes are most pronounced. The fact,
the highest optical Q-factor observed in devices exhibiting the strongest wedge angle
(ca. 8 degree) also supports this hypotheses.
Due to a combination of perimeter roughness and intrinsic thermal-oxide in-
homogeneities, a fraction of the circulating power is back-scattered into the mode
that counter-propagates with respect to the mode excited by the taper. As discussed
in chapter 4 this mode couples out of the resonator in the reverse direction along the
fiber, equivalent to a reflection [82]. The transmission (T) and reflection (R) through
the resonator-waveguide system in the presence of backscattering are given by (at
124
line-center ∆ω = 0):
T =
∙Γ+ (1−K)(1 +K)
Γ+ (1 +K)2
¸2R =
∙2ΓK
Γ+ (1 +K)2
¸2(8.1)
Here Γ accounts for the excitation of the counter-propagating waveguide mode, andK
is the coupling strength, defined as K ≡ τ0τex(i.e. the ratio of intrinsic lifetime to the
coupling lifetime). The K−parameter typically varies exponentially with waveguide-
resonator separation. The Γ-parameter was readily be measured in the undercoupled
regime by observing the associated resonant splitting [82] and was approximately 1.5
for the device measured in figure 8.2. The observed reflection of approximately 28%
is consistent with this Γ value using theory. We have observed the regime of strong
modal coupling with inter-mode coupling parameters up to Γ ≈ 10 for structures
of similar dimensions. The solid lines in Figure 8.2 represent a theoretical fit using
equation 8.1.
8.3 Microdisk mode Structure
We also investigated the mode-structure of the samples. Figure 8.4 shows the mea-
sured cavity mode spectrum for a 114-µm-diameter resonator (2-µm-oxide thickness).
The dimensions were measured by scanning-electron-microscope studies. The spec-
trum was taken for both polarizations (TE/TM) supported by the microdisk res-
onator. The free spectral range (modes with successive angular mode numbers) was
measured to be ∆λFSR = 4.80 nm. We inferred the approximate center of the radial
field distribution from the free spectral range ∆λFSR ≈ λ2
2π·R·n using the refractive in-
dex of thermally-grown oxide n = 1.445 (the actual effective index is expected to be
lower than the bulk value). The resulting diameter of 109 µm lies between the mea-
sured inner wedge edge (100 µm) and outer (114 µm) diameter of the disk, suggesting
that the modes are confined to within inner and outer radii of the wedge. A further
indication is that the maximum coupling strength of these modes was achieved with
the tapered fiber located tangentially near the center between inner and outer radii.
125
0 0.5 1 1.5 20
0.1
0.2
0.3
0.4
0.5
0.6
0.7
0.8
0.9
Position (µm)
Tra
nsm
issi
on
-20 0 200.9
0.95
1
Γ =9.6Q0 =6.3x10 7
Figure 8.2: Transmission (normalized with respect to the launched fiber power, withthe tapered fiber far away from the resonator) and reflection properties versus taper-disk gap-distance. The inset shows the transmission versus frequency near the criticalpoint. The off-resonant loss was less than 5%. Inset: Undercoupled line-width scanof the device with the highest Q-factor of 6×10⁶ exhibiting strong modal coupling (Γ = 9.6).
126
These findings are consistent with the conjecture concerning the origin of the high
modal Q.
To confirm the hypothesis of modal isolation, the optical modes were numerically
modeled using a finite element solver PDE solver. Figure 8.3 shows the calculated
intensity distribution of a fundamental mode of a disk microcavity for three different
wedge angles. In this simulation, the resonant wavelength was λ = 1550 nm, and a
principal diameter of 50 µm was used. The simulation reveals the increased modal
isolation from the scattering-contributing edge perimeter, as the wedge angle (or the
corresponding wedge parameter w,which is related to the inner diameter D − w) is
decreased. In addition, modeling the geometry which was measured above yielded
a mode center located at 105.2 µm . This value is smaller than the approximate
value of calculated above (109 µm), due to the expected reduced effective index (i.e.
neff < n).
As the WGM’s of this structure cannot be solved analytically, approximate solu-
tions were obtained using a simplified disk model. Identifications using this model
are given in figure 8.4 with first and second order radial modes denoted using circles
and diamonds. The TE/TM spectra exhibit slightly different splitting of the radial
modes (0.6 and 0.8 nm). In addition, the influence of vertical confinement on mode
spectra was studied. In experiments two samples having layer thicknesses of 1 and 2
microns were measured. The resulting spectra exhibit qualitatively the same struc-
ture as shown in figure 8.4. However, as the oxide thickness was reduced from 2 to 1
micron, the splitting of the two dominant radial modes increases significantly for one
polarization, while remaining practically unchanged for the other.
8.4 Application of disk microcavities for add-drop
devices
The high-Q devices demonstrated here can be important for low insertion loss devices
such as add-drop filters, which typically require large bandwidth and correspondingly
127
Figure 8.3: Modal isolation in microdisk cavities. The graph shows the numer-ically calculated intensity distribution |Eφ|2 for a fundamental disk mode (TM-polarization). In the simulation the principal disk diameter was 50 µm and theinner diameter is given by (D − 2w). The simulation shows the decrease in the ef-fective radius for the mode (as evidenced from a shift of the center of the intensitydistribution), as a function of the wedge parameter (w).
128
1550 1555 1560 1565 1570 1575 15800
0.2
0.4
0.6
0.8
1
Tra
nsm
issi
on
1550 1555 1560 1565 1570 1575 15800
0.2
0.4
0.6
0.8
1
Wavelength (nm)
Tra
nsm
issi
on
λFSR
= 4.80 nm
Figure 8.4: Mode spectrum of a 114-µm diameter resonator for TE and TM polar-izations.
129
low total Q. In a symmetric add/drop device, efficient channel dropping requires that
the total Q factor of the resonator is primarily induced by loading. If this is not
the case, then parasitic cavity loss will induce an excessive loss penalty upon channel
drop as well as an extinction-ratio penalty. For example, consider the ratio of power
dropped versus incoming waveguide power, in a device consisting of two identical
waveguides symmetrically coupled to a resonator. A simple analysis gives,
Pdropped
Pin= 1− 4 ·Q0/Qex
(1 + 2 ·Q0/Qex)2 −
1
(1 + 2 ·Q0/Qex)2 (8.2)
Here, the first term constitutes a loss incurred because the resonator has a finite Q0,
and the second term is a loss resulting from residual transmission. As is evident from
the expression, a high intrinsic-to-external Q ratio, will minimize insertion loss of
the dropped signal by first reducing the impact of intrinsic resonator loss and second
by biasing the input waveguide towards the optimal critical-coupling point, thereby
coupling more power into the resonator. For asymmetrically-coupled waveguides, the
finite channel transmission can be remedied by critically coupling the input waveguide
to the resonator. The insertion loss of the dropped channel in this case is composed
only of intrinsic resonator loss, which can be minimized using a large intrinsic Q.
Pdropped
Pin= 1− 1
(1 +Q0/Qex)2 (8.3)
Using the highest Q values observed in this work and assuming a loaded Q of 2 · 104
(corresponding to a dropped bandwidth of 10 GHz) yields a channel extinction of 50
dB and a drop loss of 0.03 dB for a symmetrically configured add/drop filter. For
comparison, an intrinsic Q factor of 2 · 104 yields an extinction of 9.5 dB and a drop
loss of 3.5 dB.
8.5 Summary
130
In summary, high-Q silica resonators on a chip were fabricated. A combined wet
etch and isotropic gas etch leaves undercut silica disks with a silicon support pillar.
Without any further surface processing, quality factors in excess of 107 were measured.
These high-Q values are attributed to modal isolation away from the disk edge that
is induced by a wedge-shaped disk profile. High Q values can be used to create
very low loss and high extinction add-drop filters, even in devices which operate at
a substantially lower loaded Q value. In addition we have shown that tapered fibers
enable efficient excitation of the disk modes as well as strong over-coupling with low,
off-resonant insertion loss. Additional optical functionality in these structures can be
added by means of implantation to obtain low threshold lasers.
131
Chapter 9
Ultra-low-threshold microcavityRaman laser on a chip
9.1 Abstract1
The ultra-high-Q optical modes in toroid microcavities, as well as the observed
strongly reduced azimuthal mode spectrum, make toroid microcavities a promising
candidate for nonlinear optical oscillators. In contrast to spheres, toroid microcavities
are wafer-scale, and as such allow possible integration with other functionality. In
this chapter the particular suitability of toroid microcavities as nonlinear Raman
oscillators is shown, and the first Raman laser on a chip demonstrated. As in the
case of microspheres, the long photon storage times in conjunction with the high
ideality of a tapered optical fiber coupling junction[31], allows stimulated Raman
lasing to be observed at ultra-low threshold (as low as 74 µW of fiber-launched power
at 1550 nm). High efficiency (up to 45% at the critical coupling point) is obtained and
in good agreement with theoretical modeling. In addition the emission is observed
to be single mode over a large range of pump powers, which was not attainable in
microspheres, due to the presence of nearly degenerate azimuthal modes. In addition,
numerical modeling shows that the optical modes of toroid microcavities, possess a
lower effective mode volume compared to microspheres. While the mode volume is
readily calculated using numerical tools, it is experimentally difficult to access. In1Work in this chapter has appeared in "Ultra-low threshold microcavity Raman
Laser on a microelectronic Chip", Optics Letters, Vol. 29, No. 11 (2004).
132
this chapter a technique is presented, which uses the minimum stimulated Raman
threshold as a means to infer the mode volume. Using this method the mode volume
of toroid microcavities with small cross sectional areas is retrieved, and the observed
threshold reduction is in qualitative agreement with numerical modeling.
9.2 Stimulated Raman scattering in toroid micro-
cavities
In chapter 5, the long photon storage times and small mode volume of ultra-high-
Q spherical microcavities were shown to allow significant reduction of the necessary
threshold for stimulated Raman scattering[63]. However, microsphere properties such
as their size and shape are not easily controlled during fabrication, nor are they
readily integrable with other optical devices or electronics. In addition the microsphere
Raman lasers were observed to emit inherently multi-mode, due to the presence of
nearly degenerate azimuthal modes.
In this chapter the first demonstration of a chip-based (monolithic) single-mode
micro-cavity Raman laser is presented, using ultra-high-Q toroid microcavities[33].
Toroid microcavities are excellent candidates for nonlinear oscillation based on Raman
gain, as they exhibit microwatt-level stimulated Raman thresholds and high-pump-
to-Raman conversion efficiencies (up to 45% observed). In comparison to Raman
oscillation in microspheres[63], these devices, oscillate single mode over a wide range
of pump powers, due to their reduced azimuthal degree of freedom. The latter also
leads to a reduced mode volume, of the WGM modes taking part in the nonlinear
process, and lead to an lower effective Raman oscillation thresholds compared to a
spherical microcavity.
The fabrication of wafer-based toroid microcavities is described in appendix C,
and uses a combination of conventional silicon micro-fabrication techniques and a
CO2 laser assisted re-flow process, and is described in detail in reference [33]. The
re-flow process creates an exceptionally smooth dielectric interface and enables ultra-
133
Figure 9.1: SEM side profile of a toroid microcavity showing the principal (D) andminor(d) toroid diameters.
high Q factors in excess of 100 million, as has been demonstrated in chapter 7. Figure
9.1 shows a scanning electron micrograph of a toroid microcavity and it’s geometry
parameters.
Figure 9.2 shows a typical Raman emission spectrum for a critically coupled mi-
crotoroid WGM pumped above Raman threshold. The pump wavelength is located
at 1550 nm and the Raman emission is present in the 1650-nm band, down-shifted by
approximately 12.5 THz relative to the pump mode, cavity-detuned from the peak
Raman gain in silica, which occurs at 14 THz [87]. It is significant to note that the
emission was observed to be single mode. Single mode operation was generally ob-
served over a large range of pump powers and, in contrast to microspheres, is a result
of the strongly reduced azimuthal degrees of freedom within the toroidal cavity, as has
been investigated in chapter 7. This single mode behavior constitutes a significant
improvement with respect to prior work on micro-spheres[63] or micro-droplets[56],
which exhibit multi-mode oscillation spectra due to the presence of numerous nearly-
degenerate azimuthal modes (as has been discussed in chapter 5 in the context of
134
1540 1560 1580 1600 1620 1640 1660-70
-60
-50
-40
-30
-20
-10
0
Wavelength (nm)
Po
wer
(d
Bm
)
100 200 300 400 5000
50
100
150
Pump (µW)
Ram
an e
mis
sion
(µ w
)λ
P
λR
η
ex ≈ 45%
Figure 9.2: Raman emission spectrum of a toroid microcavity showing single modeoscillation. The pump is located at 1550 nm and the Raman emission is 12.5 THzshifted into the 1650 nm band. Inset: Bidirectional Raman emission as a function ofpump power for a 58-µm-diameter toroid microcavity (Q0=0.6×10⁸) at the criticalpoint. The threshold is ca. 250 µ-Watts and the bidirectional conversion efficiency isca. 45%.
135
Raman lasing in microspheres).
The dependence of the Raman emission as a function of pump power for a critically-
coupled microtoroid is given in the inset of figure 9.2 and displays a clear threshold
behavior. The maximum Raman output power for this micro-toroid was more than
150 µW (bidirectional) and the measured pump-to-Raman differential conversion effi-
ciency was 45 %. This number is close to the theoretically expected launched-pump-
to-Raman differential conversion efficiency in the absence of any parasitic losses, which
is ~47% at the critical point, as given by:
ηex ≡dPRaman
dPp= 2
λpλR
µ1 +
1
K
¶−2As experimentally and theoretically shown in chapters 5 and 6, the pump threshold for
stimulated Raman scattering depends linearly on the effective mode volume Veff . Due
to the different cavity geometry of toroid microcavities, and the reduced azimuthal
confinement, a lower threshold operation in a toroidal geometry is expected. In this
chapter the extent of mode volume reduction is quantified using numerical modeling.
These results are then compared to experimentally measured mode volume, which
has been achieved by means of using the stimulated Raman threshold as a probe of
mode volume.
9.3 Numerical modeling of the effective mode vol-
ume
To calculate the effective mode area (or volume) of toroid microcavities, the toroidal
WGM were solved using the scalar wave equation approximation (In appendix B the
details of the numerical modeling are given). In the case of a third order nonlinear
process such as stimulated Raman scattering, the gain coefficient is linearly dependent
upon the intensity of the pump field (gNL ∝ Ip), and the gain will only occur in a
region close to the peak intensity. This fact is taken into account in the threshold
equation by the effective mode volume[88][65]:
136
Veff =
ÃRV|Ep|2 dV
RV|ER|2 dVR
V c|Ep|2 |ER|2 dV
!≈¡R
V|Ep|2 dV
¢2RV c|Ep|4 dV
(9.1)
The integral in the denominator is taken only over the extent of the dielectric cavity
volume (which contributes to the nonlinear gain), whereas the integral in the numer-
ator is taken over the entire volume. The effective mode volume, as will be seen in
this section Veff , differs in definition and value from the previously introduced en-
ergy related definition Vm =Rε(r)|E|2dV
max(ε(r)|E|2) , which assumes a rectangular profile at peak
intensity. Figure 10.2 shows the mode volume as well as the effective mode volume
for a fundamental TM-mode of a 25−µm−diameter toroid microcavity with varying
minor diameter. The numerical modeling shows that the effective mode volume for
high aspect ratio D/d is approximately a factor of two larger than the (energy related
definition) of mode volume Vm (eqs. 2.16). This is due to the fact that the defin-
ition Vm overestimates the gain for an intensity dependent process such as Raman
scattering or parametric oscillation, as only regions of high field intensity contribute
significantly to the Raman gain (and consequently lead to a lower effective intensity
and correspondingly higher effective mode volume).
A reduction of the toroidal cross section causes the effective mode area to de-
crease as a function of toroid minor diameter (d). A comparison of the mode area
(mode-volume) and effective mode area (volume) is shown in the inset. In the weak
compression regime the toroidal cross section does equally reduce mode volume and
effective mode volume, and the ratio remains unchanged (ca. Veff = 2× Vm). In the
case of strong modal compression, the effective mode volume reduces faster than the
mode volume, which decreases the Raman oscillation threshold. Figure 9.5 shows
the effective mode volume as a function of toroid cross sectional diameter (from 1-10
µm) for three different principal diameters(D = 25, 50, 75 µm). It is furthermore
interesting to note, that the mode volume of higher order azimuthal modes are also
significantly reduced. In fact, the difference of fundamental to higher order mode
(which in a microsphere is ca. 30%) reduces, as the toroid minor diameter is de-
creased. This behavior is shown in figure 9.6.
137
0 5 10 15 20 250.5
1
1.5
2
2.5
3
3.5
4
4.5
5
Minor Toroid diameter ( µm)
Eff
ecti
ve N
L-M
od
e A
rea
(µm
2 )
0 10 20 301400
1450
1500
1550
1600
D= 25µml=66 TM
Figure 9.3: The effective mode area of for a TM-WGM of a toroid microcavity asa function of toroid diameter (d). The inset shows the resonance wavelength as afunction of minor diameter.
138
0 5 10 15 20 25
0.5
1
1.5
2
2.5
Minor toroid diameter ( µm)
Mo
de
Are
a ( µ
m2 )
0 5 10 15 20 251400
1450
1500
1550
1600
Toroid diameter
Wav
elen
gth
(n
m)
D= 25µml=66 TM
Figure 9.4: The mode areaAm of a toroid microcavity as a function of toroid diameter.Comparison with figure 9.3 shows that the effective mode volume (Veff ) is twice aslarge as the volume (Vm) .
139
2 3 4 5 6 7 8 9 10
1
2
3
4
5
6
7
Minor Toroid diameter (µm)
Eff
ecti
ve-N
L-M
od
e A
rea
(µ m
2 )
D=25µm
D=50µm
D=75µm
Figure 9.5: Effective mode area Aeff for a toroid microcavity as a function of mi-nor toroid diameter (d), for three different principal diameters (25, 50, 75µm).Theresonance wavelength in this simulation was adjusted to the 1550 nm band.
140
5 10 15 20 250
1
2
3
4
5
6
7
Minor Toroid diameter ( µm)
Eff
ecti
ve N
L-M
od
e A
rea
(µm
2 )
l-m=1
l-m=0
D= 25 µml=66 TM
Figure 9.6: Effective mode volume of a | | = |m| and |m| = | − 1| toroidal whisperinggallery mode. As evident from the simulation, the difference in mode volume betweenhigher order azimuthal modes decreases as the toroidal cross sectional diameter isreduced.
141
9.4 Measurement of effective mode volume via Ra-
man scattering
Since the mode volume of the toroidal WGMs is expected to be reduced as the minor
diameter is reduced for D fixed (see figures 9.5 and 9.3), lower threshold operation
is expected in a microtoroid when compared to the case of a micro-sphere having
diameter D and comparable Q. Conversely, measurement of the Raman threshold
allows the mode volume to be inferred via inversion eqs. 6.7:
Veff =4
27(Q0)
2 gRλpλRC(Γ)π2n2
Pmint (9.2)
This method is used below to both infer the toroid mode volume with varying mi-
nor diameter as well as to compare the mode volume of toroids and spheres having
equivalent principal diameters. For this study, toroid micro-cavities were fabricated
with an approximately constant principal diameter (D) of 55 µm and varying minor
diameters (d) from 3.7 to ~10 µm. The quality factors were measured by cavity ring-
down, as used in ref. [63], and had values in the range of 100 million (ca.,~80 ns)
for all the samples used in the Raman study. The observed Raman thresholds varied
in the range of 74 µW to 250 µW. To compare the threshold among different cavity
geometries, the threshold formula was normalized to take into account the different
resonator characteristics, leaving only the modal volume dependence. The experimen-
tal protocol proceeded by determining the loaded Q factor and the modal coupling
parameter Γ. To correct for variation of the Raman gain coefficient g(λR,λp), both
the pump λp and Raman emission wavelength λR were also measured. Subsequently,
scanning electron microscopy was used to record the side profile of the micro-cavities
to determine the effective toroid minor diameter (d). Mode volume was then retrieved
from the minimum Raman threshold measurement by eqs. 9.2.
Figure 9.7 presents the experimental results of this procedure and plots the mode
volume of the toroid inferred from the measurement process. For comparison, the
solid (dashed) line is the theoretically expected volume dependence based on a calcu-
142
10 20 30 40 50
200
400
600
800
1000
1200
1400
1600
1800
2000
Minor Toroid Diameter ( µm)
Mo
de
Vo
lum
e ( µm
)3
D = 50 µm
Figure 9.7: Main figure: Experimental and theoretical mode volume (in cubic-microns) of toroid microcavities as a function of the toroid minor diameter (d) for fixedprincipal diameter D (D= 50 microns). The case d=D (unity aspect ratio)correspondsto a microsphere, and the data shown for this case is taken from ref [89] for compar-ison. The solid and dotted lines refer to the mode volume of a fundamental toroidalWGM (TM and TE case respectively) obtained by numerical modeling. Inset: An op-tical micrograph of a ca. 80-micron-diameter toroid microcavity coupled to a taperedoptical fiber.
143
lation of the TM (TE) fundamental mode volume for a 50-µm-diameter microtoroid.
Despite experimental uncertainty due to the inability to measure ring-down in the
1600 nm band, the measured volume dependence is in qualitative agreement with
the calculation. The lowest observed threshold in this measurement occurred for the
smallest toroidal minor diameter (D = 61 µm, d = 3.7 µm,Γ = 1.3, Q0 = 1.0 × 10⁸
with P=74 µW) in agreement with the Raman threshold formula). Also, for com-
parison purposes, data obtained from a previous study[89] using silica microspheres
having a comparable diameter (case of d = D) are included in the plot.
9.5 Summary
In summary the first Raman laser on a chip is demonstrated. Compared to mi-
crospheres, these microcavity oscillators allow integration with other optical and elec-
trical functionality. In addition to their practical advantages, the emission properties
are highly advantageous, and single mode emission was observed over a large range of
pump powers, owing to the strongly reduced azimuthal mode spectrum. The strong
azimuthal confinement also leads to a reduced mode volume and effective mode vol-
ume of toroid vs. spherical microcavities. To compare and infer the mode volume,
a measurement of effective mode volume is presented using the minimum Raman
threshold as a probe. The results indeed confirm the reduced mode volume of toroid
microcavities, and are in qualitative agreement with the numerical modeling.
144
Chapter 10
Kerr-nonlinearity opticalparametric oscillation in anultra-high-Q toroid microcavity
10.1 Abstract1
Kerr-nonlinearity induced optical parametric oscillation in a microcavity is reported
for the first time. Geometrical control of recently developed toroid micro-cavities
enables a transition from stimulated to optical parametric oscillation regimes. Optical
parametric oscillation is observed at record low threshold levels (174 micro-Watts of
launched power) more than two orders of magnitude lower than for optical-fiber-
based OPOs. In addition to their microscopic size (typically tens of microns), these
oscillators are wafer-based, exhibit high conversion efficiency (36%) and are operating
in a highly ideal "two photon" emission regime, with near-unity (0.97±0.03) idler-to-
signal ratio.
10.2 Introduction
Optical parametric oscillators (OPOs) rely on energy and momentum conserving op-
tical processes to generate light at new “signal” and “idler” frequencies. In contrast
to oscillation based on stimulated gain, optical parametric oscillation does not involve
1This chapter has been submitted to Physical Review Letters (2004)
145
coupling to a dissipative reservoir. The lack of such dissipation makes them uniquely
suited for fundamental studies, such as the generation of non-classical states[90][91]
for quantum information research[92]2 as well as in numerous applied areas (e.g. pho-
tonics, spectroscopy, sensing). However, oscillation based on optical parametric gain
requires stringent phase matching of the involved optical fields[93]. This combined
with the necessity of high field intensity or long interaction length poses severe chal-
lenges to attaining micro-cavity optical parametric oscillators. In fact, whereas micro-
cavity stimulated nonlinear oscillators have been demonstrated[60, 70, 56, 94, 63, 95],
optical parametric equivalents have not been demonstrated so far.
Here we report Kerr-nonlinearity induced optical parametric oscillation in a toroidal
microcavity. Toroid micro-cavities are silica-based whispering-gallery-type resonators
possessing ultra-high Q-factors[33]. Efficient coupling, with high ideality[63] is a
achieved using tapered optical fibers as coupling elements. While ultra-high-Q en-
sures high circulating field intensities within the resonator[61], causing a variety of
nonlinear optical effects[70, 62, 94, 56, 60], it is not a sufficient condition to ensure
parametric oscillation. Due to inversion symmetry, the lowest order nonlinearity in
silica is the third order nonlinearity so that the elemental parametric interaction con-
verts two pump photons (ωp) into signal (ωS) and idler (ωI) photons[93, 91]. In order
for parametric oscillations to efficiently occur, both energy and momentum must be
conserved in this process[88, 93]. In whispering-gallery-type resonators, such as mi-
crotoroids, momentum is intrinsically conserved when signal and idler angular mode
numbers are symmetrically located with respect to the pump mode (i.e. lS,I = lp±N
2Due to parametric conversion process, the signal and idler photons are generated in pairs atthe same instant in time. The simultaneous generation of photon pairs, leads to two beams whichare highly correlated. In particular, the individually generated beams exhibit noise above the shot-noise-limit (SNL). However if the noise produced by both beams is subtracted it can fall belowthe shot-noise limit, a situation which is commonly referred to as two-mode squeezing. Part of thecorrelations is however lost due the presence of the cavity, which randomizes the photon escapetimes. The correlations will thus only persist for correlation times exceeding the cavity lifetime. Asimple model leads to the noise spectrum at frequency Ω :
S(Ω) = SSNL(Ω) ·µ1−
1 + Ω2(τ−10 + τ−1ex )−2
¶Here is the probability that the photon is detected, and τ is the cavity lifetime. In the presentcase, the cavity lifetime is given by τ−10 + τ−1ex .
146
)3.
2βm = βm+N + βm−N
2m
R0=
m−N
R0+
m+N
R0
Energy conservation (2~ωp = ~ωS+~ωI), on the other hand, is not expected to be
satisfied a priori, since the resonant frequencies are, in general, irregularly spaced due
to both cavity and material dispersion. As a result, the parametric gain is a function
of the frequency detuning,
∆ω = 2ωp − ωS − ωI
which effectively gives the degree to which the interaction violates strict energy con-
servation. In the case of silica, the material dispersion of silica in the 1500 nm
band¡dndλ
< 0¢leads to a positive detuning frequency. It can be shown that the ex-
istence of parametric gain requires that this detuning be less than the parametric
gain bandwidth[88] Ω = 4 cnγP (γ = ω
cn2
Aeff) where n2 ≈ 2.2 × 10⁻²⁰m
2
Wis the Kerr
nonlinearity for silica [93] and P is the circulating power within the micro-cavity.
The effective nonlinearity γ depends on inversely on the effective cross section of
the mode4. By equating parametric gain and micro-cavity loss (as determined by
loaded Q factor), the threshold pump power necessary in the waveguide is obtained
for parametric oscillation.
PKerrt =
ω20Q−20 (1 +K)2 + (∆ω/2)2
2γ∆ω (c/neff )· π
2RneffC(Γ)λ0
(K + 1)2
Q0K
Here K ≡ Qex/Q0 characterizes the coupling of the resonator to a waveguide used for
3The propagation constanst is given by β = mR , where R is the cavity radius.
4As shown in the appendix, the effective cross section for a third order nonlinear process, is given
by: A−1eff =R(Ei)
∗(Ej )
∗EkEldA³R |Ei |2dA R |Ej |2dA R |Ek |2dA R |El |2dA´1/2 , where E is the electric field distribution of the
respective mode. As the angular mode numbers for signal, idler and pump are closely spaced, a
good approximation is: A−1eff ≈R|Ep |4dAR |Ep |2dA R |Ep |2dA .
147
both pumping of the resonator as well as collection of oscillator power. This coupling
is characterized as over-coupled (K > 1), critical (K = 1) and under-coupled (K < 1)
using the standard definitions[96]. Q0 and Qex are the intrinsic and the external
(coupling related) quality factors, respectively. R is the principal cavity radius, neff
is the effective index and C(Γ) is a correction factor in the range of [1..2] taking into
account the reduction of circulating power in the presence of modal coupling of the
degenerate clockwise and counterclockwise "whispering gallery modes" (WGMs) [27].
Figure 1 shows both parametric and Raman oscillation regimes as a function of the
detuning frequency ∆ω and the coupling parameter K. The threshold pump power
for parametric oscillation is color-coded as indicated.
As stimulated Raman scattering does not depend on the detuning frequency (i.e.
it is intrinsically phase-matched), it is the dominant nonlinear mechanism by which
light is generated for large detuning values. With decreasing ∆ω, a transition from
stimulated to parametric regimes occurs when the threshold for parametric oscillation
falls below that for Raman (The peak parametric gain is larger than the peak Raman
gain, gmaxKerr ≈ 2 ·gmaxR [93] ). Also note that for increased waveguide loading (and hence
correspondingly higher threshold pump powers) the transition can be made to occur
for detuning values that are progressively larger.
To bring about the condition 0 < ∆ω < Ω a reduction of the toroidal cross-
sectional area reduces the modal effective area Aeff and produces a two-fold benefit.
First, it increases the parametric bandwidth Ω through its dependence on γ [88] and
second, it reduces ∆ω. The latter occurs because of increased modal overlap with
the surrounding dielectric medium (air) and hence flattening of the modal dispersion.
Finally, numerical finite-element-modeling was used to calculate the dependence of
Aeff on the toroid principal (D) and minor diameter (d). Figure 2 shows the he
calculated modal area for a fundamental toroidal WGM as the dotted and solid lines
(TE and TM polarization). Note that the case (d = D)corresponds to a spherical
microcavity. Thus, the desired transition can be induced with toroidal geometries
of high principal-to-minor toroid diameter (high aspect ratio), where the principal
diameter (D) denotes the outer cavity diameter and the minor diameter (d) refers to
148
Figure 10.1: Nonlinear processes in a micro-cavity with D = 50µm, d = 4µm andQ0 = 10
8. The vertical axis denotes coupling strength K of the waveguide-resonatorsystem while the horizontal axis denotes frequency detuning. The dotted line cor-responds to the critical coupling point (defined by vanishing waveguide transmission[96, 75]). The dark blue colored part of the spectrum denotes areas where Ramanoscillation occurs. The color-coded region corresponds to the parametric oscillationregime (where the parametric threshold is indicated by color in micro-Watts).
149
the smaller, toroid cross-sectional diameter.
In order to confirm this prediction, toroid micro-cavities with an approximately
constant principal diameter (D) and varying minor diameter (d) in the range of 3.8-
10 µm were fabricated. Due to the ultra-high-Q of the toroidal whispering-gallery
modes (WGMs), ultra-low-threshold, stimulated Raman scattering was consistently
observed for toroids having an aspect ratio of ca. D/d < 15[97].
For micro-toroids having an aspect ratio (D/d) in excess of ca. 15 a transition (and
a subsequent quenching of Raman[66, 98]) to parametric oscillation was observed.
Figure 3 shows a parametric oscillation emission spectra for a micro-toroid with d=3.9
µm, D=67 µm and Q0 = 0.5× 10⁸. In this measurement a single fundamental WGM
of a micro-toroid is pumped in the telecommunication window near 1550-nm using
tapered optical fiber waveguides[99, 75]. Phase-matching of taper mode and WGM
was achieved by varying the taper waist in the coupling region. In this way high
ideality of the coupling junction was achieved[31]. The parametric interaction in
the micro-cavity causes emission of co-propagating signal and idler modes, which are
coupled into the forward direction of the tapered fiber. Some residual signal and
idler reflection was detected in the backward direction due to the presence of modal
coupling[27], induced by backscattering5. The generated signal and idler modes had
identical oscillation threshold, within the experimental resolution set primarily by
taper coupling variations (ca.± 5%).
Figure 4 shows the parametric oscillation threshold as a function of taper-toroid
coupling gap for the toroid micro-cavity of figure 3. Analysis of the threshold equation
shows that the coupling point of minimum threshold is a function of the detuning
frequency. At the optimum frequency detuning (i.e. maximum parametric gain, for
∆ωopt = 3 · ωQ0), the minimum threshold occurs under-coupled for Kmin = 0.5 with
5The presence of modal coupling randomizes the escape direction of the generated signal andidler photons. If the reflected radiation is not measured, and the remaining part of the detectionscheme is ideal, the detection probability is given by:
= (1−R(Γs))(1−R(Γi))
Therefore the presence of modal coupling decreases the possible noise reduction, unless the reflectionis included into the measurement scheme.
150
10 20 30 40 500
2
4
6
8
10
12
Minor Toroid Diameter in µm
Eff
ecti
ve M
od
e A
rea
(µm
2 ) D = 50 µm
Figure 10.2: Calculated WGM mode area as a function of minor toroid diameter(for a fixed principal diameter D = 50µm). The solid and dotted lines are themode area obtained from finite-element modeling of the fundamental toroidal WGM(dotted line: TE polarization, solid line: TM polarization) at a wavelength of 1550nm. For comparison the inset shows modeled field intensity plots of a fundamentalmicro-sphere WGM (right panel) and a toroid WGM of equal principal diameterand d = 2µm (left panel). Upper inset: Scanning-electron-micrograph of a toroidmicrocavity with the geometry parameters indicated.
151
1550 1560 1570 1580 1590 1600
-60
-50
-40
-30
-20
-10
0
Wavelength
Em
issi
on
(d
Bm
)
0 10 20 30 40 500
10
20
30
40
50
Signal ( µW)
Idle
r (µ
W)
Pump
Idler Signal
∆λFSR
I' S'
Figure 10.3: Parametric-oscillation spectrum measured for a 67-µm-diameter toroidalmicro-cavity. The pump is located at 1565 nm and power levels are far above thresh-old. The signal and idler are modes with successive angular mode numbers and arespaced by twice the free spectral range (2×7.6 nm). The subsidiary peaks (denotedI’,S’) only appeared at high pump powers and are due to a combination of nonlineareffects, such as parametric oscillation (of signal and idler) as well as four-wave-mixinginvolving the idler, pump and signal. Inset: idler emission power plotted versus thesignal emission power, recorded for different pump powers. The idler-to-signal powerratio is 0.97± 0.03. For higher pump powers deviation is observed due to appearanceof secondary oscillation peaks (I’,S’) (compare main figure).
152
finite pump transmission (Tmin = 1/9), whereas for larger detuning the minimum
threshold point shifts towards being over-coupled (compare figure 1). The measured
minimum threshold in the present case was 339 micro Watts and occurred for the
taper displaced by 0.04 microns into the under-coupled regime. The corresponding
pump transmission was T ≈ 4% (K ≈ 0.7), indicating that the frequency detuning
is close to being optimum. Above threshold the signal and idler fields increase ap-
proximately linearly with pump power (for high pump power P, the emission scales
PS,I ∝q
PPt− 1). The inset of figure 3 shows a pump-to-idler conversion characteristic
at the point of minimum threshold.
The corresponding differential conversion efficiency was 17% pump-to-idler (The
total differential conversion efficiency of pump to both signal and idler fields was 34%).
Comparison of the differential conversion efficiency to theory η = 2 · (1 +K−1)−2 is
consistent with the minimum threshold occurring under-coupled, as the inferred cou-
pling point is K = 0.7 (corresponding to T = 4% in agreement with the above
measured value). Using the minimum threshold data and the cavity ringdown mea-
surements a detuning frequency of ∆ω/2π ≈ 24 MHz is inferred from the threshold
equation, compared with ∆ωopt/2π = 11.6 MHz for optimum detuning frequency
at the measured Q value. The lowest measured parametric oscillation threshold for
the micro-toroids in this study was 170 micro-Watts of launched power in the fiber
(for a micro-cavity with D/d = 16, d = 4µm, Q0 = 1.25 × 10⁸ and ∆ω/2π ≈ 18
MHz) and is a factor of 200 lower than for fiber OPOs[100] that utilize the dis-
persion control provided by photonic crystal fiber [101]. As a further confirmation
that parametric oscillation is present, both signal and idler emission were recorded
for varying pump power. From theory a signal-to-idler photon creation ratio of unity
is expected for parametric oscillation[93]. The inset of figure 4 shows the measured
idler emission power plotted versus signal emission power through the optical fiber
taper. The recorded data was corrected for modal coupling[27] by measuring the
reflected power for all three resonances at the critical point. After correcting for
modal coupling the ratio of idler conversion to signal conversion was 0.97±0.03. The
observation of near-unity idler-signal emission-power ratio, along with the identical
153
-0.3 -0.2 -0.1 0 0.1 0.2 0.3300
350
400
450
500
550
600
650
700
750
Taper-Microtoroid gap distance (micron)
Par
amet
ric
Osc
illat
ion
Th
resh
old
(µW
)
200 400 6000
10
20
30
40
50
Pump (µW)
Idle
r E
mis
sio
n (µW
)
Figure 10.4: The coupling-gap-dependence of the parametric threshold with respectto the critical coupling point measured using a 67-µm-diameter toroid microcavity.The minimum threshold occurs with the tapered optical fiber 0.04 µm under-coupled(with finite transmission of ca. 4%). The solid line is a theoretical fit using the thresh-old equation. Inset: Idler emission versus pump power. The differential conversionefficiency from pump-to-idler was 17%(and correspondingly 34% for pump to signaland idler).
154
threshold for signal and idler wave emission, demonstrates that the observed emission
bands can solely be attributed to Kerr-induced micro-cavity parametric oscillation.
Finally, stimulated Brillouin scattering (SBS), which involves coupling to a acoustic
phonon, was not present, despite having a nearly 3 order of magnitude larger gain
in comparison to the parametric gain. As noted previously, SBS is unlikely to occur
in microcavities[63]. In particular as micro-toroids exhibit strongly reduced mode
spectrum due to azimuthal confinement[33, 97], overlap with the gain bandwidth is
SBS is unlikely.
10.3 Summary
We have thus observed for the first time (to the authors’ knowledge) Kerr-nonlinearity
induced optical parametric oscillation in a micro-cavity. Parametric interactions pro-
vide a distinct and important class of nonlinearity in both applied and fundamental
areas, and as such this result should extend the range of micro-cavity applications
into new fields. In addition to the highly advantageous practical aspects of on-chip
micro-cavity nonlinear oscillators, (such as wafer-scale integration and control), these
oscillators exhibit important properties due to the nature of the underlying nonlinear
process within the micro-cavity. Specifically, a phase-sensitive amplification process
that can exclude competing Brillouin or Raman processes, as demonstrated here, with
a highly ideal coupling junction can provide an excellent candidate system for the gen-
eration of non-classical states of light[102, 103, 91, 90, 64, 104, 105, 106] in a micro-
cavity. Whereas the work presented here has used the third order nonlinearity of silica
itself, it should also be possible to induce second-order nonlinear interaction (such as
parametric down-conversion), by using ultraviolet[107] or thermal-electric[108] glass
poling techniques. This would be important in quantum information[92] and quan-
tum optical studies[91, 109, 110, 111] as well as for novel bio-imaging schemes based
on entanglement[112]. Moreover, the toroid micro-cavities exhibit high modal purity
(single mode emission). This property and their nearly lossless coupling junction[31],
155
are important prerequisites for both applied and quantum optical studies.
156
Appendix A
Theoretical analysis ofKerr-nonlinearity parametricoscillation in a whispering-gallerymicrocavity
A.1 Introduction
This section complements the discussion of the Kerr nonlinearity parametric oscilla-
tion in a microcavity as presented in chapter 10. Starting from the classical equations
of four-wave-interaction for plane waves, the equations for parametric interaction in
a microcavity are derived. The treatment in the case for optical modes of a resonator
will lead to identical coupled-wave-equations, however with modified coupling coef-
ficients. These coupling coefficients are determined by the pump, signal and idler
overlap factors.
A.2 Third order nonlinear polarization
The nonlinear Polarization can be introduced phenomenologically by expanding the
polarization in terms of the electric field. In the case of Kerr-nonlinear interaction,
the 2nd order nonlinearity is not present due to inversion symmetry, such that the
157
first nonlinear contribution is third order:
Pi = χEi + χ(3)ijklEiEjEk + ...
The physical process underlying the third order nonlinearity is a four-photon interac-
tion. For the present treatment, it is assumed that the two pump fields are frequency
degenerate. Inserting four fields and their amplitudes Ep ,(Ep), Es, Ei into the above
equation (i.e. Ep(t) =12Epe
iωpt + c.c.) for the nonlinear polarization, and neglecting
anti-resonant terms such as EpEpEp ∝ e−3iωpt (i.e. using the rotating wave approxi-
mation) several nonlinear optical terms can be identified, which lead to the generation
of new frequency components, as well as phase shifts.
The phase insensitive terms ∝ |Ei|2Ej give rise to a change in the index of re-
fraction n the field experiences and are referred to as self-phase modulation(SPM),
and cross-phase modulation (XPM). The change of index is related to then nonlinear
index of refraction by: n = n0+I ·n21. As the name implies SPM refers to the change
in index induced by the field itself, whereas XPM refers to the situation where the
index of refraction is modified by the presence of a different field.
The phase sensitive polarization terms, such as EiEiE∗j (where i 6= j), give rise
to parametric frequency conversion. In a classical picture this process can be viewed
as being due to the temporal modulation of the refractive index n(t) = n0 +∆n2(t)
due the beat-frequency caused by two fields at different frequencies. Whereas the
spatial modulation of the refractive index, gives rise to Bragg reflection, the temporal
modulation of the refractive index gives rise to a frequency shift. The governing
equations of motion are particularly simple for plane waves, assuming:
E(r, t) =1
2E(z) exp(i(ωt− kz)) + c.c
P (r, t) =1
2P (z) exp(i(ωt− kz)) + c.c
1Some authors also define the nonlinear index of refraction as: n = n0 + n2
Table A.1: Nonlinear optical effects associated with the third-order susceptibility
the governing equations for four-wave mixing are given by [91][93]:
∂Ep
∂z=
µiωp
c
¶3
8χ(3)Re
¡E2pE
∗p + 2EpEiE
∗i + 2EpEsE
∗s + 4EsEpE
∗p + 2EpEpE
∗i
¢∂Es
∂z=
µiωs
c
¶3
8χ(3)Re
¡E2sE
∗s + 2EsEiE
∗i + 4EsEpE
∗p + 2EpEpE
∗i
¢∂Ei
∂z=
µ−iωi
c
¶3
8χ(3)Re
⎛⎜⎝ 2
fEi |Ei|| z SPM
+ 2fEi |Es|2| z XPM (Idler)
+ 4fEi |Ep|2| z XPM(Pump)
+ 2fEpEpE∗s| z
FWM-Term
⎞⎟⎠If one assumes that the pump field is not depleted, and that the signal and idler fields
are weak, the coupled mode equations simplify considerably:
∂Ep
∂z=
µiωp
c
¶3
8χ(3)Re
¡E2pE
∗p + 4EsEpE
∗p + 4EpEpE
∗i
¢∂Es
∂z=
µiωs
c 0
¶3
8χ(3)Re
¡4fEs |Ep|2 + 2fEpEpE
∗i
¢∂Ei
∂z=
µ−iωi
c 0
¶3
8χ(3)Re
¡4fEi |Ep|2 + 2fEpEpE
∗s
¢
A.3 Coupled mode equations for Kerr-parametric
interactions in a whispering-gallery-microcavity
To formulate the coupled mode equations for Kerr oscillations in a cavity, the gov-
erning equations are first formulated in the temporal domain, and cavity losses and
159
pumping via a waveguide are introduced using the previously introduced formalism.
Starting point for the derivation of the coupled mode equations is the wave-equation:
µ−∇2 + n2
c2∂2
∂t2
¶−→E = µ0
∂2
∂t2−→P NL
To derive an equation for the coupled amplitudes of the whispering-gallery waves,
the Helmholtz equation is first solved for the case of a whispering gallery mode of
the system (i.e. the homogeneous solution, without the nonlinear polarization term).
The general form of a whispering gallery mode, expressed in cylindrical coordinates
for the case of a TM mode is:
Eiz(r, z, φ, t) =
1
2Eiz(r, z)e
i iφ+iωt + c.c.
Here is the angular mode number of the whispering gallery mode. Due to the
presence of the nonlinear polarization the whispering gallery modes will exhibit an
additional time dependence, expressing the fact that fields might be created, or ab-
sorbed. To describe the growth of the WGM the amplitude is introduced, which only
depends on the time,
Eiz(r, z, φ, t) =
1
2Ai(t) ·Ei
z(r, z)ei iφ+iωt + c.c
The effect of the nonlinear polarization can now be investigated, by deriving a coupled
mode equation for the field amplitude Ai(t):
µ−∇2 + n2
c2∂2
∂t2
¶Ai(t) ·Ei
z(r, z)ei iφ+iωt = µ0
∂2
∂t2−→P NL
Ai(t)·µ−∇2 + n2
c2∂2
∂t2
¶Eiz(r, z)e
i iφ+iωit| z =0
+
µn2
c2∂2Ai(t)
∂t2+ 2iω
n2
c2∂Ai(t)
∂t
¶Eiz(r, z)e
i iφ+iωit = µ0∂2
∂t2−→P N
160
The first term on the right hand side is zero, since E is assumed to be a mode i.e.
a solution of the homogenous problem. To arrive at a coupled wave equation, the
slowly varying amplitude approximation can be made, i.e. assuming:
¯∂2Ai(t)
∂t2
¯¿¯2iωi
∂Ai(t)
∂t
¯leading to: µ
2iωin2
c2∂Ai(t)
∂t
¶Eiz(r, z)e
i iφ+iωit = µ0∂2
∂t2−→P NL
This is a good approximation, since the conversion due to nonlinear optical processes
is slow compared to the time-scale of the optical cycle ω. Next, the polarization term
has to be re-casted:∂2
∂t2−→P NL =
∂2
∂t2¡χijkEjEkEl
¢The nonlinear susceptibility has been treated in the last section. The product of the
three whispering-gallery mode fields on the l.h.s. contains a rapidly varying term
(due to the phase of the whispering-gallery modes ∝ eiωit), and a slowly varying part
(given by the amplitude A(t)). In taking their derivative with respect to time, the
slow time dependence of the fields can be neglected. Assuming that the total three
fields vary as EiEjEk ∝ ei(ωi+ωj+ωk)t ≡ eiω0t
µ0∂2
∂t2−→P NL = µ0ω
02 ¡χijklEjEkEl
¢In addition each of the field contains a azimuthal dependence due to the eigenfunctions
exp(±i φ). Therefore the polarization also contains a term:
EiEjEk ∝ ei(li+lj+lk)φ
Inserting the phasor and angular dependence into the polarization leads to:
161
µ2iωi
n2
c2∂Ai(t)
∂t
¶ eEiz(r, z)e
i iφ+iωit = µ0ω02i
µ3
8χijk eEj
eEkeElAjAkAl
¶ei(ωj+ωk+ωl)tei( j+ k+ l)φµ
∂Ai(t)
∂t
¶ eEiz = − iω02i
2 on2ωi
µ3
8χijk eEj
eEkeElAjAkAl
¶ei(ωj+ωk+ωl−ωi)tei( j+ k+ l−
The latter equation is cumbersome to evaluate, since the explicit fields eEi = eEi(r, z)
enter in the equation. It is desirable to arrive at an equation which describes only
the energy or amplitude of the mode i.e. A(z). This can be achieved by integrating
over the transverse extend of the WG mode and by multiplying the conjugate fieldeEiz(r, z)
∗ from the left.
µ∂Ai(t)
∂t
¶Zr,z
¯ eEiz
¯dA = −3
8
iω02i2 on2ωi
³χijk eEi
eEjeEkAiAjAk
´ei(ωj+ωk+ωl−ωi)tei( j+ k+ l− i)φ
µ∂Ai(t)
∂t
¶= −3
8
iω02i2 on2ωi
χijkAiAjAk ·
⎛⎝Zr,z
eEieEjeE∗k eEi
z∗ dA| z
⎞⎠ ei(ωj+ωk+ωl−ωi)tei( j+ k+ l
≡A−1eff
In the last expression, the fact that the mode function are normalized has been used,
i.e.Rr,z|Ei|2 dA = 1. The last term is the effective mode area and has units of inverse
area, which as in the case of Raman scattering deviates from the mode area, as defined
by the energy density definition. In the case E is describes the electric field and is not
normalized, the effective area is given by:
A−1eff ≡ fijkl =
RAcav
E∗iE∗jEkEldA
Πi
¡RA|Ei|2 dA
¢1/2Since in a microcavity the susceptibility vanishes outside the cavity (i.e. in air) the
integral in the denominator is carried out only over the dielectric cavity area). As in
the case of stimulated Raman scattering, the effective mode area can actually differ
from the actual mode area (and for microspheres and microtoroids is approximately
×2 larger). The above definition of effective mode area describes all third order
nonlinear optical phenomena, and as such also yields again the Raman gain coefficient
162
(i.e. which is proportional to P ∝ E∗iE∗iEk i.e. yielding A−1eff = Appss.). Hence the
coupled mode equations are given by:
µ∂Ai(t)
∂t
¶= − iω02i
2 on2ωfijkl ·
3
8χ(3)ijk ·AjAkAle
i(ωj+ωk+ωl−ωi)tei( j+ k+ l− i)φ
Furthermore it is common to introduce the nonlinear coefficient:
γi ≡n2ωi
cfijkl ≈
n2ωi
cAeff
Where the third order nonlinear susceptibility is related to the nonlinear index of
refraction n2 by, and Aeff is assumed to identical for all coupling processes.
n2 =3
8nχ(3)
The fields entering the expression of the nonlinear polarization can only couple to the
l.h.s. of the Helmholtz equation, if the time dependence is the same as on the left, i.e.
if P ∝ eiωit. The remaining terms are anti-resonant (and in a full quantummechanical
treatment are seen to violate energy conservation with respect to the photon energy).
Therefore only terms, in which ωi ≈ ω0 will induce an efficient coupling by means of
the nonlinear susceptibility. In addition the angular dependence eilφ on both sides
of the equation needs to be identical, to achieve coupling of modes. The latter two
conditions, can be shown to be equivalent to the requirement of energy and angular
momentum conservation. To arrive at a set of coupled mode equations for parametric
oscillation, which parametrically converts two pump photons into signal and idler,
only resonant terms have to be kept in the treatment. For i, j, k, l equal to two pump
fields, as well as signal and idler, this leads to the coupled mode equations for signal
163
and idler.
∂Ap
∂t= i
³ cn
´ n2ωp
2cAeff
¡Ap |Ap|2 + 4ApApA
∗∗si e
i∆ωtei∆lφ + 4ApApA∗i e
i∆ωtei∆lφ¢
∂As
∂t= i
³ cn
´ n2ωs
2cAeff
¡4As |Ap|2 + 2ApApA
∗i e−i∆ωte−i∆lφ
¢∂Ai
∂t= i
³ cn
´ n2ωi
2cAeff
¡4Ai |Ap|2 + 2ApApA
∗se−i∆ωte−i∆lφ
¢In this set of equations, the pump has been assumed strong |Ap| À |Ai| , |As| , and
for the idler and signal only the XPM and FWM term included, whereas the pump
field experiences only SPM and FWM to signal and idler frequencies. In addition the
angular momentum and frequency detuning parameters have been introduced:
∆ω ≡ 2ωp − ωI − ωS
∆ = 2 p − i − S
(Angular) Momentum conservation for WGM
It is important to note, that if the signal and idler mode numbers are chosen
symmetrically around the pump field, the (angular) momentum matching condition
is satisfied intrinsically (since β =R0):
β + β + β +N + β −N = 0
Energy conservation
On the other hand, energy conservation is not a priori assumed to be satisfied, due
to the presence of waveguide and material dispersion. The detuning ∆ω effectively
describes the extent to which strict energy conservation is violated and is given by:
∆ω ≡ 2ωp − ωI − ωS
It is interesting to note, in the case of a cavity, the role of frequency and momentum
in the context of parametric gain are reversed. In the waveguide case, a continuum of
164
Figure A.1: Schematic of the effect of cavity detuning on the occurrence of parametricoscillation. For ∆ω > 0, parametric oscillation can only occur if the detuning ∆ω =2ωp − ωs − ωi is less than the parametric band-width (given by 0 < ∆ω < Ω).Notethat the parametric band-width exists only for positive detuning, due to the shift ofresonant frequency caused by XPM and SPM.
165
frequencies ω exists, such that energy conservation is a priori satisfied, whereas the
momentum distribution is discrete−→ki (ω). In contrast, for a whispering-gallery micro-
cavity, momentum is satisfied intrinsically, whereas only a discrete set of frequencies
exist ωn mp, which are required to satisfy energy conservation. Using the frequency
detuning, the coupled-mode-equations are:
∂As
∂t= − 1
2τ sAs + iκ1As + iκA∗i e
i∆ωt
∂Ai
∂t= − 1
2τ iAi − iκ1Ai − iκA∗se
i∆ωt
Where:
κ1 ≡³ωp
c
´ 38χ(3)4f |Ap|2 = 4 |Ap|2 γ
κ ≡³ωp
c
´ 38χ(3)2fApAp = 2ApApγ
In the case of a whispering-gallery microcavity, the governing equation for the pump
whispering gallery mode is given by the equation:
∂ eAp
∂t= − 1
2τ pAp + iκspAp + κkpA
∗pe−i∆ωt +
r1
τ exs
κkp ≡3
8χ(3)f · 2AsAi
κsp ≡3
8χ(3)f · |Ap|2
This set of equations of coupled equations for signal and idler fields can be formally
solved. By the transforming into a rotating frame i.e. As = Ase−i∆ωt/2 , AI =
AIe−i∆ωt/2 and eliminating the time dependence yields the linear system of coupled
equations:
∂As
∂te−i
∆ω2t − i
∆ω
2Ase
−i∆ω2t = − 1
2τ sAse
−i∆ω2t + iκ1Ae
−i∆ω2t + iκA∗i e
+i∆ωt/2
∂Ai
∂te−i
∆ωt2 − i
∆ω
2AIe
−i∆ωt2 = − 1
2τ iAie
−i∆ω2t − iκ1Aie
−i∆ω2t − iκA∗se
+i∆ωt/2
166
If the idler equation is conjugated a linear differential equation system is obtained:
∂
∂t
µAs
A∗i
¶=
⎛⎝ − 12τ+ iκ1 + i∆ω
2iκ
−iκ∗ − 12τ− i∆ω
2− iκ1
⎞⎠µAs
A∗i
¶(A.1)
The eigenvalues are given by: λ1,2 =
½±µ
12τ−q|κ|2 − κ21 −∆ωκ1 − ∆ω2
4
¶¾and
the parametric gain be identified correspondingly as:
gParam(∆ω) =
s¡γ |Ep|2
¢2 −µγ |Ep|2 +∆ω
2
¶2(A.2)
=
r2γ |Ep|2∆ω − ∆ω2
4
The parametric gain is non-zero only for 0 < ∆ω < Ωp where Ωp is the parametric
gain bandwidth:
Ωp ≡ 4γ |Ep|2 (A.3)
The maximum parametric occurs shifted away from ideal energy conservation, at
non-zero detuning:
∆ωmax ≡ 2γ |Ep|2 (A.4)
This shift is due to the effect of cross phase modulation of the signal and idler due to
the pump.
A.4 Parametric oscillation threshold
The parametric oscillation threshold is reached when the gain exceeds the cavity losses
i.e. in steady state for λ1,2 = 0.Thus:
s2γ |Ep|2∆ω −
µ∆ω
2
¶2=
µ1
2τ 0+
1
2τ ex
¶=
1
2τ 0(1 +K) (A.5)
167
From this equation the necessary circulating pump power in the cavity can be derived:
|Ep|2 =
³12τ0(1 +K)
´2+¡∆ω2
¢22γ∆ω
(A.6)
Taking into account the cavity buildup factor, the threshold for parametric oscillation
as a function of coupling and detuning is obtained:
PKerrt =
ω20Q−20 (1 +K)2 + (∆ω/2)2
2γ∆ω · cneff
µπ2RneffC(Γ)λ0
(K + 1)2
Q0K
¶(A.7)
γ ≡ n2ωi
cAeff(A.8)
A.5 Material and cavity mode dispersion
The optical modes within a cavity are in general not regularly spaced due to the
presence of material and cavity dispersion. First, material dispersion is considered.
The detuning frequency can be related to n0 = dndωby noting that ωi = λi/2πRneff
and in a simple model neff ≈ n(ω).
∆ω =c
R
µ2 p
n(ωp)− s
n(ωs)− I
n(ωI)
¶=
c
R
µ2 p
n(ωp)− p −N
n(ωp)− n0∆ω− p +N
n(ωp) + n0∆ω
¶, n0 ≡ dn(ω)
dω|ωp
=c
R
µ2 p
n(ωp)− p
n(ωp)− n0∆ω− p
n(ωp) + n0∆ω+
N
n(ωp)− n0∆ω− N
n(ωp) + n0∆ω
=c
R
⎛⎜⎜⎝ p
n(ωp)
∙2− 1 + n0
n(ωp)∆ω − 1− n0
n(ωp)∆ω
¸| z
=0
+N
n(ωp)
∙1 +
n0∆ω
n(ωp)− 1− n0∆ω
n(ωp)
¸⎞⎟⎟⎠=
c
R2N
n0
n(ωp)2∆ω
168
In the case of silica in the 1550 nm banddndω
> 0. Therefore the parametric detuning
frequency due to material dispersion is always positive, as is required in order for
parametric oscillation to occur. Secondarily, the free-spectral range is naturally not
constant. In the case of a microsphere, the analysis of chapter 1 yielded:
∆ωFSR ≡ |ωnm − ωnm +1| ≈À1c
naR
µ1
m− t0n
−2/3
3
¶(A.9)
Therefore the detuning frequency contribution from the WGM dispersion is always
positive, since the FSR (∆ωFSR) increases for increasing angular mode number .
∆ω = 2ωp − ωi − ωS = ∆ωp−iFSR −∆ωp−s
FSR
As a result both material dispersion and cavity mode dispersion, cause the parametric
detuning frequency to be ∆ω > 0.
169
Appendix B
Modelling of whispering-gallerymicrocavity modes
B.1 Wave equation for whispering-gallery resonators
with rotational symmetry
Whereas the optical quality factor (Q) is dependent upon many external factors (such
as cavity surface roughness, water adsorption, defects in the oxide layer etc.), and
can vary significantly across micro-spheres and micro-cavities with nearly-identical
geometry parameters, the mode volume of the optical modes is entirely dependent
upon the cavity geometry. However, while Q-factor can be measured directly and is
experimentally accessible, the same is not true for the optical mode volume, which
can only be probed indirectly, such as by near field optical probes or as be presented
in chapter 7, using the oscillation threshold of stimulated Raman scattering. In
this section the optical mode-volumes as well as the effective nonlinear optical mode
volumes are calculated for toroid and disk microcavities using numerical modelling
using a PDE finite-element solver. To accomplish this task the Helmholtz equation
for the whipering-gallery resonator case is derived and transformed in the required
standard PDE form.
The whispering gallery resonators studied in this thesis (i.e. spheres, disks and
toroids) all exhibit (if the presence of eccentricity is neglected, and only treated
170
Figure B.1: Direction of the field components of the whispering-gallery modes ofmagnetic type (i.e.TE-case) for a toroid. TE (TM) modes posses a E-field (H-field)which is perpendicular to the equatorial plane of the torus.
as a weak pertubation) a rotational symmetry. Therefore the choice of cylindrical
coordinates for the modelling is a natural choice. The optical modes of a whispering
gallery type resonator are described in their most general form by a total of six
field components, (Hr, Hφ,Hz, Er, Eφ,Ez). The boundary condition couples the electric
and magnetic field components. A significant simplification occurs, if the index of
refraction n(r) is homogeneous throughout the dielectric cavity, and the polarization
is constant. In this case the scalar-wave equation approximation can be used. The
solutions of the scalar wave equation fall into two classes; the optical modes are
either electric in character (referred to as transverse-magnetic TM case) or magnetic
in character (referred to as transverse electric TE case). In the case of TM-modes
in a WGM resonator (with the symmetry axis along the z-axis) , the magnetic field
is transverse to the direction of propagation (which occurs along −→e φ) implying that
Hφ = 0, whereas for the TE-case Eφ = 0. All the remaining field components can
be expressed in terms by only one field component (Hφ for TE-modes and Eφ TM-
171
modes) , reducing the problem to a scalar Helmholtz equation for one field component.
An additional simplification of the Helmholtz equation occurs due to the rotational
symmetry in case of a perfect whipering-gallery resonator. Due to the periodicity
condition (exp(−βl2π) = 1) the TE and TM-mode can be expressed as:
⎧⎨⎩ Eφ(r, z, φ)
Hφ(r, z, φ)
⎫⎬⎭ =
⎧⎨⎩ Eφ(r, z)
Hφ(r, z)
⎫⎬⎭ · exp(i([±βφ− ωt])andβl = l (B.1)
Where l is the angular mode number. The Helmholtz in cylindrical coordinates is
given by (considering in what follows only the TM case):
(∇2 + ω2
c2n2)Eφ =
∙µd2
dr2+1
r
d
dr
¶+1
r2d2
dφ2+
d2
dz2+
ω2
c2n2¸Eφ = 0 (B.2)
Using the separation of variables approach for the angular direction (and introducing
the angular mode l number correspondingly):
Eφ(r, z, φ) = Eφ(r, z) · exp(±ilφ) (B.3)
this yields the equation:
∙µd2
dr2+1
r
d
dr
¶− 1
r2l2 +
d2
dz2+
ω2
c2n2¸Eφ = 0 (B.4)
multiply by r· from the left and rearranging:
∙µrd2
dr2+
d
dr
¶+ r
d2
dz2− 1
rl2 + r
ω2
c2n2¸Eφ = 0
d
dr
µrd
drEφ
¶+
d2
dz2(rEφ)−
µ1
r2l2−ω
2
c2n2¶rEφ = 0
Rearranging and the expression thus produces the Helmholtz equation in the required
Figure B.2: Comparisson of the analytical and numerically calculated intensity dis-tribution of the |Eφ|2 component plotted in the radial direction, for a microsphere of10 µm radius.The numerical and analytical models show excellent agreement.
∇r,z·(r∇r,zEφ)+
µω2
c2n2 − l2
r2
¶rEφ = 0 (B.5)
−∇r,z·(r∇r,zEφ)+β2
rEφ =
ω2
c2n2rEφ
To test the accuracy of the numerical modelling, the calculated resonance locations
for a microsphere were compared to the resonance locations obtained by an asymptotic
expansion (see chapter 1). The deviations were less than 2.5e-004 for both TE and
TM polarization, and assure the accuracy of the simulation results. Furthermore, in
figure B.2 the numerical and theoretical results of the radial equation are plotted,
showing excellent agreement.
173
Bibliography
[1] D. W. Vernooy, V. S. Ilchenko, H. Mabuchi, E. W. Streed, and H. J. Kimble.
High-q measurements of fused-silica microspheres in the near infrared. Optics
Letters, 23(4):247—249, 1998.
[2] D. W. Vernooy, A. Furusawa, N. P. Georgiades, V. S. Ilchenko, and H. J.
Kimble. Cavity qed with high-q whispering gallery modes. Physical Review A,
57(4):R2293—R2296, 1998.
[3] H. J. Kimble. Strong interactions of single atoms and photons in cavity qed.
Physica Scripta, T76:127—137, 1998.
[4] S. Haroche and D. Kleppner. Cavity quantum electrodynamics. Physics Today,
42(1):24—30, 1989.
[5] V. Sandoghdar, F. Treussart, J. Hare, V. LefevreSeguin, J. M. Raimond, and
S. Haroche. Very low threshold whispering-gallery-mode microsphere laser.
Physical Review A, 54(3):R1777—R1780, 1996.
[6] M. Cai, O. Painter, K. J. Vahala, and P. C. Sercel. Fiber-coupled microsphere
laser. Optics Letters, 25(19):1430—1432, 2000.
[7] Y. Yang, D. K. Armani, and K. J. Vahala. Fiber-coupled erbium microlasers
on a chip. Appl. Phys. Lett., 83:825, 2003.
[8] F. Vollmer, D. Braun, A. Libchaber, M. Khoshsima, I. Teraoka, and S. Arnold.
Protein detection by optical shift of a resonant microcavity. Applied Physics
Letters, 80(21):4057—4059, 2002.
174
[9] S. X. Qian, J. B. Snow, H. M. Tzeng, and R. K. Chang. Lasing droplets -
highlighting the liquid-air interface by laser-emission. Science, 231(4737):486—
488, 1986.
[10] J. Z. Zhang and R. K. Chang. Generation and suppression of stimulated
brillouin-scattering in single liquid droplets. Journal of the Optical Society of
America B-Optical Physics, 6(2):151—153, 1989.
[11] H. B. Lin and A. J. Campillo. Cw nonlinear optics in droplet microcavities