Nonlinear quantile regression to describe the dry matter accumulation of garlic plants Regressão quantílica não linear para descrever o acúmulo de matéria seca de alho Guilherme Alves Puiatti 1* Paulo Roberto Cecon 1 Moysés Nascimento 1 Ana Carolina Campana Nascimento 1 Antônio Policarpo Souza Carneiro 1 Fabyano Fonseca e Silva 2 Mário Puiatti 3 Cosme Damião Cruz 4 ISSNe 1678-4596 Ciência Rural, Santa Maria, v.50:1, e20180385, 2020 Received 05.07.18 Approved 11.06.19 Returned by the author 12.03.19 CR-2018-0385.R2 http://dx.doi.org/10.1590/0103-8478cr20180385 INTRODUCTION Studies regarding the growth trajectory of plants are very important to accomplish their appropriate handling. Information regarding several methods of care, such as manure handling, can be identified with the study of curves of dry matter accumulation of the vegetable. The growth rate of the plant varies along its development, demanding different amounts of nutrients in each stage (SOUZA & MACÊDO, 2009). Nonlinear regression models are based on theoretical considerations inherent in the phenomenon to be modeled, and are appropriate to describe growth curves (MAZUCHELI & ACHCAR, 2002). Therefore, it is possible to describe the relationship between the dry matter accumulation of plants and the number of days 1 Departamento de Estatística, Universidade Federal de Viçosa (UFV), 36570-900, Viçosa, MG, Brasil. E-mail: [email protected]. * Corresponding author. 2 Departamento de Zootecnia, Universidade Federal de Viçosa (UFV), Viçosa, MG, Brasil. 3 Departamento de Fitotecnia, Universidade Federal de Viçosa (UFV), Viçosa, MG, Brasil. 4 Departamento de Biologia Geral, Universidade Federal de Viçosa (UFV), Viçosa, MG, Brasil. ABSTRACT: The objective of this study was to adjust nonlinear quantile regression models for the study of dry matter accumulation in garlic plants over time, and to compare them to models fitted by the ordinary least squares method. The total dry matter of nine garlic accessions belonging to the Vegetable Germplasm Bank of Universidade Federal de Viçosa (BGH/UFV) was measured in four stages (60, 90, 120 and 150 days after planting), and those values were used for the nonlinear regression models fitting. For each accession, there was an adjustment of one model of quantile regression (τ=0.5) and one based on the least squares method. The nonlinear regression model fitted was the Logistic. The Akaike Information Criterion was used to evaluate the goodness of fit of the models. Accessions were grouped using the UPGMA algorithm, with the estimates of the parameters with biological interpretation as variables. The nonlinear quantile regression is efficient for the adjustment of models for dry matter accumulation in garlic plants over time. The estimated parameters are more uniform and robust in the presence of asymmetry in the distribution of the data, heterogeneous variances, and outliers. Key words: quantile regression, nonlinear regression, Allium sativum L., growth rate, cluster analysis. RESUMO: Este trabalho teve como objetivo ajustar modelos de regressão quantílica não linear para o estudo do acúmulo de matéria seca total em plantas de alho ao longo do tempo, e compará-los com modelos ajustados pelo método dos mínimos quadrados. A matéria seca total de nove acessos de alho pertencentes ao Banco de Germoplasma de Hortaliças da Universidade Federal de Viçosa (BGH/UFV) foi avaliada em quatro períodos (60, 90, 120 e 150 dias após plantio), e estes valores foram utilizados para o ajuste de modelos de regressão – não linear – logística. Para cada acesso, foram ajustados um modelo de regressão quantílica (τ=0,5) e um modelo pela metodologia dos mínimos quadrados. Para avaliar a qualidade de ajuste dos modelos foi utilizado o Critério de Informação de Akaike. Os acessos foram agrupados pelo algoritmo UPGMA, utilizando as estimativas dos parâmetros com interpretação biológica como variáveis. A regressão quantílica não linear foi eficiente no ajuste de modelos para descrição do acúmulo de matéria seca ao longo do tempo. As estimativas de parâmetros foram mais uniformes e robustas na presença de dados assimétricos, variâncias heterogêneas e de valores discrepantes. Palavras-chave: regressão quantílica, regressão não linear, Allium sativum L., taxa de crescimento, análise de agrupamento. CROP PRODUCTION
Transcript
Nonlinear quantile regression to describe the dry matter accumulation of garlic plants.
Ciência Rural, v.50, n.1, 2020.
1
Nonlinear quantile regression to describe the dry matter accumulation of garlic plants
Regressão quantílica não linear para descrever o acúmulo de matéria seca de alho
Guilherme Alves Puiatti1* Paulo Roberto Cecon1 Moysés Nascimento1
Ana Carolina Campana Nascimento1 Antônio Policarpo Souza Carneiro1
Fabyano Fonseca e Silva2 Mário Puiatti3 Cosme Damião Cruz4
ISSNe 1678-4596Ciência Rural, Santa Maria, v.50:1, e20180385, 2020
Received 05.07.18 Approved 11.06.19 Returned by the author 12.03.19CR-2018-0385.R2
http://dx.doi.org/10.1590/0103-8478cr20180385
INTRODUCTION
Studies regarding the growth trajectory of plants are very important to accomplish their appropriate handling. Information regarding several methods of care, such as manure handling, can be identified with the study of curves of dry matter accumulation of the vegetable. The growth rate of the plant varies along its development, demanding
different amounts of nutrients in each stage (SOUZA & MACÊDO, 2009).
Nonlinear regression models are based on theoretical considerations inherent in the phenomenon to be modeled, and are appropriate to describe growth curves (MAZUCHELI & ACHCAR, 2002). Therefore, it is possible to describe the relationship between the dry matter accumulation of plants and the number of days
1Departamento de Estatística, Universidade Federal de Viçosa (UFV), 36570-900, Viçosa, MG, Brasil. E-mail: [email protected]. *Corresponding author.2Departamento de Zootecnia, Universidade Federal de Viçosa (UFV), Viçosa, MG, Brasil.3Departamento de Fitotecnia, Universidade Federal de Viçosa (UFV), Viçosa, MG, Brasil.4Departamento de Biologia Geral, Universidade Federal de Viçosa (UFV), Viçosa, MG, Brasil.
ABSTRACT: The objective of this study was to adjust nonlinear quantile regression models for the study of dry matter accumulation in garlic plants over time, and to compare them to models fitted by the ordinary least squares method. The total dry matter of nine garlic accessions belonging to the Vegetable Germplasm Bank of Universidade Federal de Viçosa (BGH/UFV) was measured in four stages (60, 90, 120 and 150 days after planting), and those values were used for the nonlinear regression models fitting. For each accession, there was an adjustment of one model of quantile regression (τ=0.5) and one based on the least squares method. The nonlinear regression model fitted was the Logistic. The Akaike Information Criterion was used to evaluate the goodness of fit of the models. Accessions were grouped using the UPGMA algorithm, with the estimates of the parameters with biological interpretation as variables. The nonlinear quantile regression is efficient for the adjustment of models for dry matter accumulation in garlic plants over time. The estimated parameters are more uniform and robust in the presence of asymmetry in the distribution of the data, heterogeneous variances, and outliers.Key words: quantile regression, nonlinear regression, Allium sativum L., growth rate, cluster analysis.
RESUMO: Este trabalho teve como objetivo ajustar modelos de regressão quantílica não linear para o estudo do acúmulo de matéria seca total em plantas de alho ao longo do tempo, e compará-los com modelos ajustados pelo método dos mínimos quadrados. A matéria seca total de nove acessos de alho pertencentes ao Banco de Germoplasma de Hortaliças da Universidade Federal de Viçosa (BGH/UFV) foi avaliada em quatro períodos (60, 90, 120 e 150 dias após plantio), e estes valores foram utilizados para o ajuste de modelos de regressão – não linear – logística. Para cada acesso, foram ajustados um modelo de regressão quantílica (τ=0,5) e um modelo pela metodologia dos mínimos quadrados. Para avaliar a qualidade de ajuste dos modelos foi utilizado o Critério de Informação de Akaike. Os acessos foram agrupados pelo algoritmo UPGMA, utilizando as estimativas dos parâmetros com interpretação biológica como variáveis. A regressão quantílica não linear foi eficiente no ajuste de modelos para descrição do acúmulo de matéria seca ao longo do tempo. As estimativas de parâmetros foram mais uniformes e robustas na presença de dados assimétricos, variâncias heterogêneas e de valores discrepantes.Palavras-chave: regressão quantílica, regressão não linear, Allium sativum L., taxa de crescimento, análise de agrupamento.
after planting with the parameters of interest, such as asymptotic weight, which represents the final weight of the plant at maturity, and growth rate, which indicates the time that the plant takes to reach maturity. Nonlinear regression models have been used in several growth curve studies in cultures of plants, such as banana trees (MAIA et al., 2009), cassava (SILVA et al., 2014) and coffee (SOUSA et al., 2014). According to REIS et al. (2014) and MACEDO et al. (2017) the Logistic model is the most suitable for the description of dry matter accumulation in garlic plants.
Curves of plant growth usually present heteroscedasticity between observations in different periods, asymmetry in the data set, and even outliers. Nonlinear quantile regression presents an alternative, also applicable to functions that are not linear in the parameters. The quantile regression allows an estimate of conditional quantiles (Q[Y|X]), adjusting the relationship between the time and percentiles of the dependent variable. This is different from the ordinary least squares method which uses conditional means (E[Y|X]) to obtain the functional relationship between the variables. As a result it is possible to obtain more robust models even in the presence of outliers, asymmetry and heteroscedasticity (KOENKER, 2005; HAO & NAIMAN, 2007).
Nonlinear quantile regression models were considered in the study of growth curves of plants, such as SORRELL et al. (2012) and MUGGEO et al. (2013). PUIATTI et al. (2018) used different quantiles of a nonlinear quantile regression model to classify garlic accessions according to their growth rate and asymptotic weight.
In studies related to genetic diversity, it is also useful to compare parameters of the growth curves and identify those with similar performances. With cluster analyses it is possible to separate individuals among groups, maximizing the homogeneity inside each group, and the heterogeneity among different groups (SILVEIRA et al., 2011; AZEVEDO et al., 2012; FARIA et al., 2012). Therefore, it is possible to identify accessions with closer estimates of parameters, and it is expected that these will have similar dry matter accumulation curves.
The objective of this research was to adjust nonlinear quantile regression models for the study of dry matter accumulation in different genotypes of garlic (Allium sativum L.) over the planting period, and to compare them to models fitted by the ordinary least squares method.
MATERIALS AND METHODS
Nine Allium sativum L. (Table 1) accessions were evaluated. The experiment was carried out in the period from March to November, in an experimental area belonging to the Plant Science Department of the Universidade Federal de Viçosa (UFV). The location was in the Zona da Mata region of Minas Gerais, Brazil, geographical coordinates: 20º45’S and 42º51’W, at an altitude of 650 m. A completely randomized experimental design with four replicates was used.
The experimental units were composed by four longitudinal rows of 1 m length, with planting space of 0.25 x 0.10 m, with the plants of the two central rows considered as useful. The total dry matter of the plant (TDMP), expressed in grams by
Table 1 - Identification of the nine garlic accessions (Allium sativum L.) registered in the Vegetable Germplasm Bank of the Universidade Federal de Viçosa (BGH/UFV), and mean of the total dry matter of the plant (TDMP in g) of each accession in the four periods of evaluation (DAP).
N Accession Name ---------------------------------Mean of the TDMP in the period-------------------------------
Nonlinear quantile regression to describe the dry matter accumulation of garlic plants.
Ciência Rural, v.50, n.1, 2020.
3
plant, was evaluated in four periods: 60, 90, 120, and 150 days after planting (DAP). Descriptive statistics of the data are presented in table 1. The TDMP was obtained by the sum of the dry matter content of leaves, pseudostems, bulbs and roots.
The Logistic regression model was used to describe the total dry matter accumulation of the plant over the planting period. Models were adjusted for each one of the accessions, using all of the observations of the accession. The method of estimation for the parameters of the models was the ordinary least squares (O. L. S.), using Gauss-Newton’s iterative method. The Logistic model was defined as, where: yi = observation of the response variable, the total dry matter of the plant (TDMP) expressed in grams; xi = predictor variable, represented by the periods of evaluation of the dry matter of the plant (days after planting, DAP); β1 = parameter that represents the asymptotic weight of the accession; β2 = location parameter without biological interpretation; β3 = growth rate of the accession; and εi is the random error, with .
A nonlinear quantile regression model (Q. R.) was also adjusted for each accession, using the quantile τ = 0.5. This model was adjusted by an Interior Point Algorithm proposed by KOENKER & PARK (1996). The model is specified as,
where τ refers to the assumed quantile, with τ ∈ [0,1].
The Akaike Information Criterion (AKAIKE, 1974) was calculated to compare the
goodness of fit of the models of both approaches. Smaller values of the Akaike Information Criterion indicated better adjustment of the model to the data.
For each one of the approaches, the accessions were grouped using the parameters with biological interpretation (β1 and β3) as variables. This analysis makes it possible to obtain the most similar accessions, according to the adjusted models. The dissimilarity measure adopted was the standard squared Euclidean distance. The accessions were grouped using the Unweighted Pair Group Method with Arithmetic Mean, UPGMA (CRUZ et al., 2011). The MOJENA (1977) procedure was used to determinate the optimum number of groups, with the stopping rule k = 1.25. After the clustering of the accessions, a curve of O. L. S. and another of Q. R. were fitted for each group of accessions.
The computational analysis was performed using the R software, version 3.2.1 (R DEVELOPMENT CORE TEAM, 2018).
RESULTS AND DISCUSSION
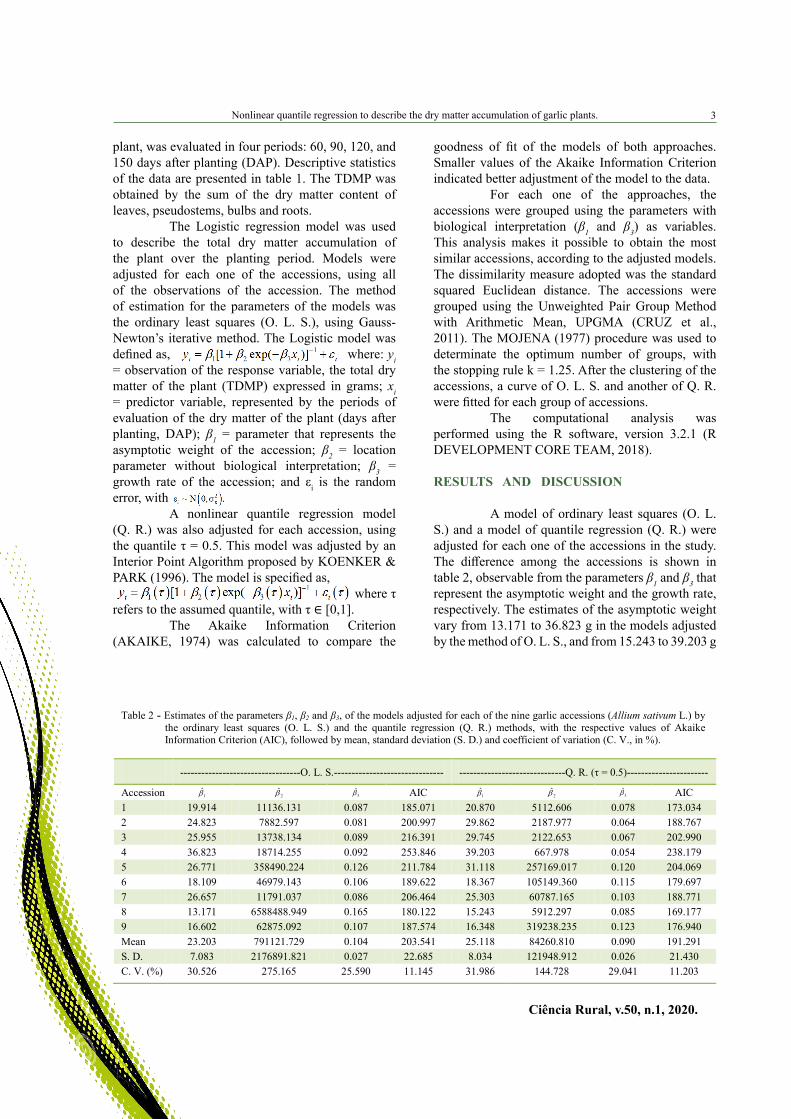
A model of ordinary least squares (O. L. S.) and a model of quantile regression (Q. R.) were adjusted for each one of the accessions in the study. The difference among the accessions is shown in table 2, observable from the parameters β1 and β3 that represent the asymptotic weight and the growth rate, respectively. The estimates of the asymptotic weight vary from 13.171 to 36.823 g in the models adjusted by the method of O. L. S., and from 15.243 to 39.203 g
Table 2 - Estimates of the parameters β1, β2 and β3, of the models adjusted for each of the nine garlic accessions (Allium sativum L.) by the ordinary least squares (O. L. S.) and the quantile regression (Q. R.) methods, with the respective values of Akaike Information Criterion (AIC), followed by mean, standard deviation (S. D.) and coefficient of variation (C. V., in %).
----------------------------------O. L. S.------------------------------- ------------------------------Q. R. (τ = 0.5)-----------------------
in the Q. R. (τ = 0.5) models. The estimates showed a smaller coefficient of variation when compared to the estimates and, with values varying from 0.081 to 0.165 (O. L. S.) and of 0.054 to 0.123 (Q. R.). The estimates of the parameter β2 presented the largest variation, and were bigger in the O. L. S. models.
Of the accessions analyzed by the O. L. S. models, the accession Patos de Minas (BGH 4505) presented the largest asymptotic weight and a growth rate above the average. The unidentified (2) (BGH 4899) is the accession that reached maturity faster, even though possessing smaller asymptotic weight. The accessions 2, 3, 6, 7 and 9 possess some outliers in their observations of total dry matter of the plant (TDMP), which is reflected in the parameters estimated for their models. The curves of these models distanced themselves from the other points because the average is easily affected by these extreme values (CECON et al., 2012). Many authors opt to remove extreme values to avoid inconveniences these bring out, but that sacrifices information in the data because the outlier is part of the phenomenon in study (LY et al., 2013; BARROSO et al., 2015).
In addition to the existence of possible outliers, there is still the issue of the heteroscedasticity: the variances are not same for all of the observations. As the plant grows, the values of TDMP visibly distance themselves, resulting in a greater variance in the last periods than in the initial periods. This didn’t represent a problem for nonlinear regression when the sample is big enough, because the inference in this case is based in the asymptotic theory (GUJARATI, 2011). Some accessions also present asymmetry in their observations, which makes the curve generated by the O. L. S. distance itself from the central position of the distribution due to the displacement of the mean (ARAÚJO JÚNIOR et al., 2016).
The mean of the estimated parameter β1 was 25.118 for the Q. R. (τ = 0.5) models. The estimates of the parameter growth rate β3 presented the smallest variation, and average of 0.090. For these models, the accession Patos de Minas (BGH 4505) was also the one that presented the largest asymptotic weight, but it possessed the smallest growth rate if compared to the other estimates. It is followed by the accessions Cateto Roxo (BGH 4567) and Branco de Dourados (BGH 4491). Branco de Dourados showed a growth rate closer to the one of Patos de Minas, while the Cateto Roxo showed one of the highest growth rates. The accession Amarante Novo Cruzeiro (BGH 5940) possesses the highest growth rate and the second lowest asymptotic
weight. The accession unidentified (2) (BGH 4899) presented the lowest asymptotic weight, and a medium growth rate.
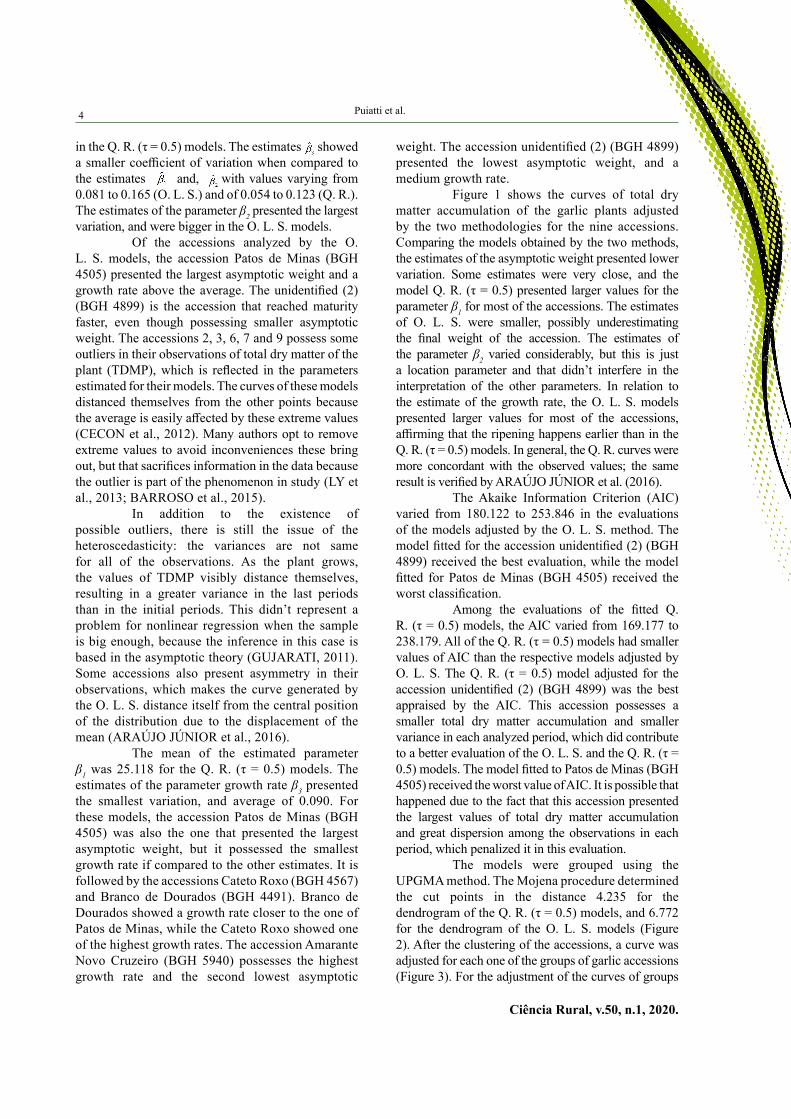
Figure 1 shows the curves of total dry matter accumulation of the garlic plants adjusted by the two methodologies for the nine accessions. Comparing the models obtained by the two methods, the estimates of the asymptotic weight presented lower variation. Some estimates were very close, and the model Q. R. (τ = 0.5) presented larger values for the parameter β1 for most of the accessions. The estimates of O. L. S. were smaller, possibly underestimating the final weight of the accession. The estimates of the parameter β2 varied considerably, but this is just a location parameter and that didn’t interfere in the interpretation of the other parameters. In relation to the estimate of the growth rate, the O. L. S. models presented larger values for most of the accessions, affirming that the ripening happens earlier than in the Q. R. (τ = 0.5) models. In general, the Q. R. curves were more concordant with the observed values; the same result is verified by ARAÚJO JÚNIOR et al. (2016).
The Akaike Information Criterion (AIC) varied from 180.122 to 253.846 in the evaluations of the models adjusted by the O. L. S. method. The model fitted for the accession unidentified (2) (BGH 4899) received the best evaluation, while the model fitted for Patos de Minas (BGH 4505) received the worst classification.
Among the evaluations of the fitted Q. R. (τ = 0.5) models, the AIC varied from 169.177 to 238.179. All of the Q. R. (τ = 0.5) models had smaller values of AIC than the respective models adjusted by O. L. S. The Q. R. (τ = 0.5) model adjusted for the accession unidentified (2) (BGH 4899) was the best appraised by the AIC. This accession possesses a smaller total dry matter accumulation and smaller variance in each analyzed period, which did contribute to a better evaluation of the O. L. S. and the Q. R. (τ = 0.5) models. The model fitted to Patos de Minas (BGH 4505) received the worst value of AIC. It is possible that happened due to the fact that this accession presented the largest values of total dry matter accumulation and great dispersion among the observations in each period, which penalized it in this evaluation.
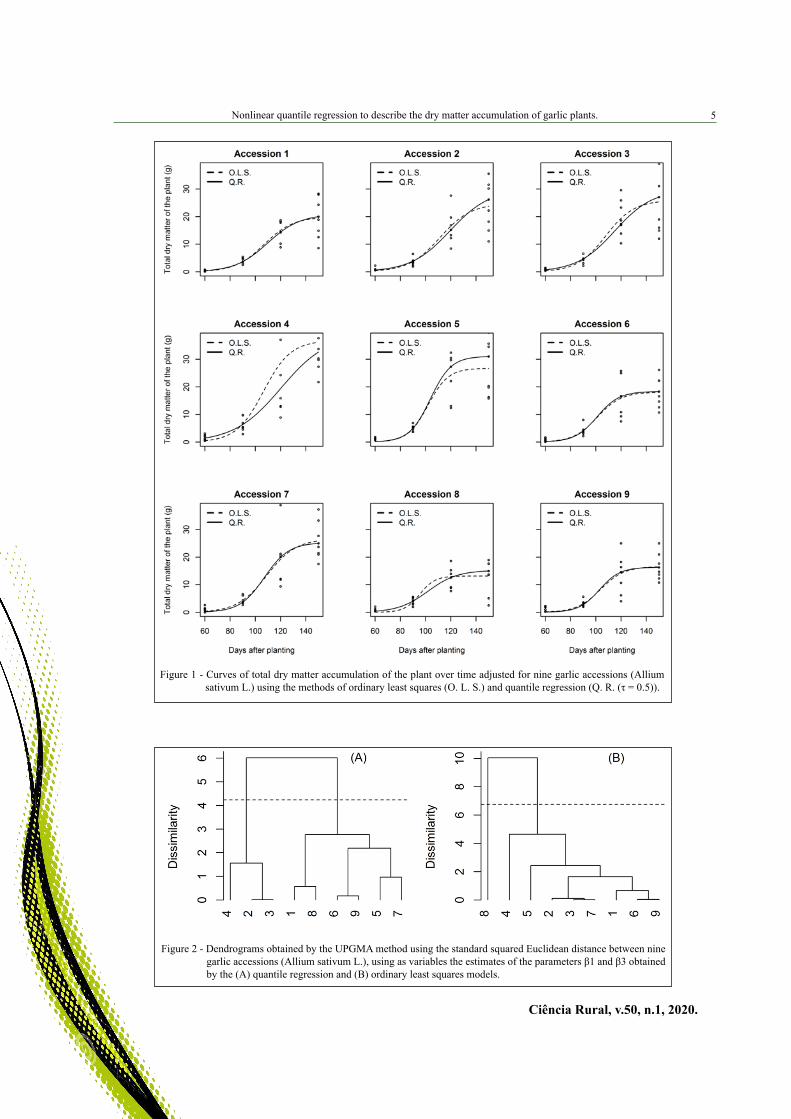
The models were grouped using the UPGMA method. The Mojena procedure determined the cut points in the distance 4.235 for the dendrogram of the Q. R. (τ = 0.5) models, and 6.772 for the dendrogram of the O. L. S. models (Figure 2). After the clustering of the accessions, a curve was adjusted for each one of the groups of garlic accessions (Figure 3). For the adjustment of the curves of groups
Nonlinear quantile regression to describe the dry matter accumulation of garlic plants.
Ciência Rural, v.50, n.1, 2020.
5
Figure 1 - Curves of total dry matter accumulation of the plant over time adjusted for nine garlic accessions (Allium sativum L.) using the methods of ordinary least squares (O. L. S.) and quantile regression (Q. R. (τ = 0.5)).
Figure 2 - Dendrograms obtained by the UPGMA method using the standard squared Euclidean distance between nine garlic accessions (Allium sativum L.), using as variables the estimates of the parameters β1 and β3 obtained by the (A) quantile regression and (B) ordinary least squares models.
6
Ciência Rural, v.50, n.1, 2020.
Puiatti et al.
formed by the O. L. S. models, the O. L. S. method was used. For the curves of groups formed by Q. R. (τ = 0.5) models, Q. R. (τ = 0.5) models were adjusted. The estimates of the parameters β1, β2 and β3, and the AIC value for the adjusted models are shown in table 3. The clustering of the Q. R. (τ = 0.5) models formed two groups, one with six accessions and the other with three. The group I includes accessions with larger growth rates and smaller asymptotic weights. Among them, the accession Cateto Roxo (BGH 4567) presents the second largest maturity rate and second largest asymptotic weight. The group II presents accessions with larger estimates of final weight, but smaller growth rates.
The clustering of the O. L. S. models also formed two groups, one with eight accessions and other with just one accession. The accession unidentified (2), which was isolated in a group, stood out for smaller asymptotic weight and larger growth rate according to the estimate of the O. L. S. model. Accessions with larger growth rates present smaller
final weight. Also, those with larger asymptotic weights take longer to reach that final weight, which is in accordance with the results of REIS et al. (2014), MACEDO et al. (2017) and PUIATTI et al. (2018). This group formation showed that the Q. R. models have more balanced estimates, and that they were less affected for heterogeneous variances and outliers.
In practical terms, the accessions of the group II are suitable when accessions with larger final weight are preferred. The total dry matter accumulated reflects the productive potential of the plant and accessions with larger weight at the end of the crop are more promising economically (DIRIBA-SHIFERAW, 2016). Accessions of the group I are recommended when the harvest happens before 120 DAP.
CONCLUSION
The nonlinear quantile regression is efficient for the adjustment of models for dry matter accumulation in garlic plants over time when
Figure 3 - Curves of total dry matter accumulation of the plant over time (days after planting) adjusted for the groups of garlic accessions (Allium sativum L.) using the methods of (A) quantile regression and (B) ordinary least squares.
Table 3 - Number of accessions (N), estimates of the parameters β1, β2 and β3, and Akaike Information Criterion (AIC) for the models adjusted using the groups of garlic accessions (Allium sativum L.) formed by the UPGMA clustering, according to the quantile regression (Q. R.) and ordinary least squares (O. L. S.) models.
Model Group N 1β̂
2β̂
3β̂ AIC
Q. R. I 6 19.127 64008.840 0.107 1130.835 II 3 34.680 1692.266 0.062 637.170
O. L. S. I 1 13.171 6588488.949 0.165 180.122 II 8 24.373 20810.294 0.094 1746.130
Nonlinear quantile regression to describe the dry matter accumulation of garlic plants.
Ciência Rural, v.50, n.1, 2020.
7
compared to the ordinary least squares regression. These models received better classification by the Akaike Information Criterion, and the estimated parameters were more uniform and robust in the presence of asymmetry in the distribution of the data, heterogeneous variances and outliers.
ACKNOWLEDGMENTS
We thank Fundação de Amparo à Pesquisa do Estado de Minas Gerais (FAPEMIG), Coordenação de Aperfeiçoamento de Pessoal de Nível Superior (CAPES) and Conselho Nacional de Desenvolvimento Científico e Tecnológico (CNPq) for the financial support for this research.
DECLARATION OF CONFLICT OF INTERESTS
The authors declare no conflict of interest. The founding sponsors had no role in the design of the study; in the collection, analyses, or interpretation of data; in the writing of the manuscript, and in the decision to publish the results.
AUTHORS’ CONTRIBUTIONS
All authors contributed equally for the conception and writing of the manuscript. All authors critically revised the manuscript and approved of the final version.
REFERENCES
AKAIKE, H. A. New Look at the Statistical Model Identification. IEEE Transactions on automatic control, Minato-ku, Tokyo, Japan. v.19, n.6, p.716- 723, Dec. 1974.
ARAÚJO JÚNIOR, C. A. et al. Site index curves in eucalyptus plantation obtained by quantile regression. Pesq. agropec. bras., Brasília, v.51, n.6, p.720-727. 2016. Available from: <http://dx.doi.org/10.1590/S0100-204X2016000600003>. Accessed: Apr. 24, 2018. doi: 10.1590/S0100-204X2016000600003.
AZEVEDO, C. F. et al. Multivariate classification of the progress curves of tomato late blight among accessions from the UFV germoplasma vegetable bank. Ciência Rural, v.42, p.414-417, 2012. Available from: <http://dx.doi.org/10.1590/S0103-84782012000300005>. Accessed: Apr. 24, 2018. doi: 10.1590/S0103-84782012000300005.
BARROSO, L. M. A. et al. Methodology for analysis of adaptability and stability using quantile regression. Pesq. agropec. bras., Brasília, v.50, n.4, p.290-297. 2015. Available from: <http://dx.doi.org/10.1590/S0100-204X2015000400004>. Accessed: Apr. 24, 2018. doi: 10.1590/S0100-204X2015000400004.
CECON, P. R. et al. Métodos Estatísticos. 1. ed., Viçosa: UFV, 2012. 229p.
CRUZ, C. D. et al. Biometria aplicada ao estudo da diversidade genética. Visconde do Rio Branco: Suprema. 2011. 620p.
DIRIBA-SHIFERAW, G. Review of Management Strategies of Constraints in Garlic (Allium sativum L.) Production. Journal of
FARIA P. N. et al. Clustering methods in a study of genetic diversity of peppers. Horticultura Brasileira. v.30, p.428-432, 2012. Available from: <http://dx.doi.org/10.1590/S0102-05362012000300012>. Accessed: Apr. 24, 2018. doi: 10.1590/S0102-05362012000300012.
GUJARATI, D. N. Econometria Básica. 4. ed. São Paulo: Pearson Makron Books, 2011. 920p.
KOENKER, R. Quantile Regression. 1.ed. Cambridge University Press, v.1., 2005. 349p.
KOENKER, R.; PARK, B. J. An interior point algorithm for nonlinear quantile regression. Journal of Econometrics, 71, 265-283. 1996. doi: 10.1016/0304-4076(96)84507-6.
LY, D. et al. Relatedness and Genotype x Environment Interaction Affect Prediction Accuracies in Genomic Selection: A Study in Cassava. Crop Science. v.53, p.1312-1325, 2013. Available from: <http://dx.doi.org/10.2135/cropsci2012.11.0653>. Accessed: Apr. 24, 2018. doi: 10.2135/cropsci2012.11.0653.
MACEDO, L. R. de. et al. Bayesian inference for the fitting of dry matter accumulation curves in garlic plants. Pesq. agropec. bras., Brasília, v.52, n.8, p.572-581, ago. 2017. Available from: <http://dx.doi.org/10.1590/S0100-204X2017000800002>. Accessed: Apr. 24, 2018. doi: 10.1590/S0100-204X2017000800002.
MAIA, E. et al. Method of comparison of models non-linear regression in bananas trees. Ciência Rural, v.39, n.5, p.1380-1386, 2009. Available from: <http://dx.doi.org/10.1590/S0103-84782009000500012>. Accessed: Apr. 24, 2018. doi: 10.1590/S0103-84782009000500012.
MAZUCHELI, J.; ACHCAR, J. A. Considerations about nonlinear regression. Acta Scientiarum, Maringá, v.24, n.6, p.1761-1770, 2002. doi: 10.4025/actascitechnol.v24i0.2551.
MOJENA, R. Hierarchical grouping methods and stopping rules: an evaluation. Computer Journal, v.20, p.359-363, 1977. Available from: <http://dx.doi.org/10.1093/comjnl/20.4.359>. Accessed: Apr. 24, 2018. doi: 10.1093/comjnl/20.4.359.
MUGGEO, V. M. R. et al. Estimating growth charts via nonparametric quantile regression: a practical framework with application in ecology. Environmental and Ecological Statistics, v.20, n.4, p.519-531. 2013. Available from: <http://dx.doi.org/10.1007/s10651-012-0232-1>. Accessed: Apr. 24, 2018. doi: 10.1007/s10651-012-0232-1.
PUIATTI, G. A. et al. Quantile regression of nonlinear models to describe different levels of dry matter accumulation in garlic plants. Ciência Rural, v.48, n.1, e20170322, 2018. Available from: <http://dx.doi.org/10.1590/0103-8478cr20170322>. Accessed: Apr. 24, 2018. doi: 10.1590/0103-8478cr20170322.
R. DEVELOPMENT CORE TEAM. R: A language and environment for statistical computing. R Foundation for Statistical Computing, Vienna, Austria. ISBN 3-900051-07-0.
8
Ciência Rural, v.50, n.1, 2020.
Puiatti et al.
2018. Available from: <http://www.R-project.org>. Accessed: Apr. 24, 2018.
REIS, R. M. et al. Nonlinear regression models applied to clusters of garlic accessions. Hortic. Bras., Vitoria da Conquista, v.32, n.2, p.178-183, 2014. Available from: <http://dx.doi.org/10.1590/S0102-05362014000200010>. Accessed: Apr. 24, 2018. doi: 10.1590/S0102-05362014000200010.
SILVA, H. R. F. et al. Dry matter and micronutrients accumulation in cassava intercropped with banana tree. Pesq. Agropec. Trop., Goiânia, v.44, n.1, p.15-23. 2014. Available from: <http://dx.doi.org/10.1590/S1983-40632014000100008>. Accessed: Apr. 24, 2018. doi: 10.1590/S1983-40632014000100008.
SILVEIRA, F. G. da. et al. Cluster analysis applied to nonlinear regression models selection to growth curves of crossed lambs.
SORRELL, B. K. et al. Regression analysis of growth responses to water depth in three wetland plant species. AoB PLANTS 2012: pls043. 2012. Available from: <http://dx.doi.org/10.1093/aobpla/pls043>. Accessed: Apr. 24, 2018. doi: 10.1093/aobpla/pls043.
SOUSA, I. F. et al. Fitting nonlinear autoregressive models to describe coffee seed germination. Ciência Rural, Santa Maria, v.44, n.11, 2014. Available from: <http://dx.doi.org/10.1590/0103-8478cr20131341>. Accessed: Apr. 24, 2018. doi: 10.1590/0103-8478cr20131341.
SOUZA, R. J. de; MACÊDO, F.S. Cultura do alho: tecnologias modernas de produção. Lavras: Editora UFLA, 2009. 181p.