Nonlinear Redundancy Analysis of Multi-Cell Pre-stressed Concrete Box-Girder Bridge Analysis Report Bala Sivakumar PE O. Murat Hamutcuoglu Ph.D. HNTB Corporation Dr. Michel Ghosn Ph.D. The City College of New York / CUNY JUNE 2013
Transcript
Nonlinear Redundancy Analysis of Multi-Cell Pre-stressed
Concrete Box-Girder Bridge Analysis Report
Bala Sivakumar PE O. Murat Hamutcuoglu Ph.D.
HNTB Corporation
Dr. Michel Ghosn Ph.D. The City College of New York / CUNY
JUNE 2013
NON-LINEAR PUSH-OVER ANALYSES OF PRE-STRESSED CONCRETE BOX-GIRDERS JULY 2013
B.3-1
NON-LINEAR ANALYSIS OF PRE-STRESSED CONCRETE BOX-GIRDER BRIDGE
This document describes the model and covers the details of the analysis setup for a multi-cell pre-
stressed concrete box- girder bridge example. The original bridge model was set up by CALTRANS to
perform a pushover analysis for the seismic design of the bridge using SAP2000 commercial software.
The original model represents the pre-stressed concrete multi- cell box-girder superstructure using elastic
shell elements as illustrated in Figure 1. The column and the integral cap beam at the piers are modeled
using beam- column type finite elements. The original model is well detailed to represent the inelastic
pier behavior directly for pushover analysis under the effect of a lateral load. However, the superstructure
model with elastic shell elements is not sufficient to represent the inelastic interaction between the
concrete, reinforcing steel, and pre-stressing tendons and it cannot be used for a “pushdown” analysis that
studies the nonlinear behavior of the structure under increasing vertical loads. For this reason, a second
model is created where the inelastic section behavior of the box girders is incorporated. The analysis
setup is prepared in SAP2000 v15 Advanced providing complex analysis features including non-linear
pushover and pushdown analyses. In this Report, the original model with an integral connection between
the cap beam and the columns will be identified as Model 1. A modified model where the columns are
assumed to be connected to the cap beam by bearings will be identified as Model 2. A more advanced
space frame model that considers the nonlinear behavior of the superstructure will be identified as Model
3. The details of the setup and the models are given below.
Figure 1- Original Model of Sample Bridge
NON-LINEAR PUSH-OVER ANALYSES OF PRE-STRESSED CONCRETE BOX-GIRDERS JULY 2013
B.3-2
1. Bridge Description
A 3-D finite element model is used to analyze the behavior of sub- and super- structure of multi
cell box-girder bridge. As given in Figure 1, four cell box girder deck has the top slab width of
58’ 10”. The three- span continuous bridge is 412 ft long and the span lengths are 126 ft, 168 ft
and 118 ft. The thicknesses of the top and bottom slabs are 9 1/8” and 8 1/4”, respectively. The
depth of the box-girder is 6’ 9”. The connection between the super- and the sub- structures are
through the integral cap beams with the same depth of the girders and 8 ft width. The original
bridge superstructure is connected to two 6 ft diameter round columns through the moment
resisting rigid connections. In the further analyses, the influence of the moment-free bearing
configuration is also investigated as well. Note that the pile caps are not included in the model
and the bottom ends of the columns are restrained as fixed in all six degree-of-freedoms.
The unconfined concrete strength is assumed to be 4000psi and the reinforcing steel is taken as
Grade 60 with the ultimate stress capacity is 90 ksi. The prestressing tendons have the peak stress
of 270ksi and their yield stress is 230ksi. The area of tendons in each section is 9in2 and the initial
prestressing force is set as 1824kips without the losses. The total loss in the prestressing force is
assumed 20 ksi including the elastic shortening, creep, shrinkage and the steel relaxation stresses.
The tendons are considered in parabolic geometry along the girders and all section moment-
curvature calculations include the exact location of the tendons in the sections analyses. The
reinforcing steel detail in the box-girders is given in Figure 2 where the transverse bars are also
included in the moment-curvature analysis of the transverse sections.
Figure 1- Typical Bridge Section and the Pier Columns with the Cap Beam
NON-LINEAR PUSH-OVER ANALYSES OF PRE-STRESSED CONCRETE BOX-GIRDERS JULY 2013
B.3-3
Figure 2- Reinforcing Steel Details of the Girders and the Top and Bottom Slabs
2. Analysis for Lateral Load: Model 1 with Rigid Cap-Column Connections
The lateral push-over analysis of the original model is straightforward using SAP2000. The plastic hinge
definitions are applied at the bottom and top of the columns to capture the non-linear axial-flexure
interaction. The plastic hinge definition is applied at the bottom surface of the integral cap beam as
illustrated in Figure 3. The nonlinear pushover analysis tracks the plastic deformations at these locations.
The lateral pushover analysis is initiated with a nonlinear dead load, tendon jacking and live load analysis
that provide the initial stresses in the elements. The dead load is calculated through the self-weight feature
of SAP2000 and then the pre-stressing tendon jacking forces are applied to provide the initial condition of
the bridge prior to an extreme event case. Note that the bridge is loaded by 20% of the HL93 load along
two lanes to represent the regular traffic that may be on the bridge during an earthquake.
Figure 3- Model 1 Cross Sections with integral connection between cap beam and column
Plastic Hinge Locations
NON-LINEAR PUSH-OVER ANALYSES OF PRE-STRESSED CONCRETE BOX-GIRDERS JULY 2013
B.3-4
Figure 4- Model 1: Original Model Horizontal Pushover Curve
The plastic deformations are initialized at a total base shear of 437 kips. In Figure 4, the global response
indicates a hardening behavior after plastic deformations has started at this 437 kip load level. At the last
load step, where the total base shear on the pier is 720kips, the concrete compressive strain exceeds the
ultimate limit and the section is crushed at bottom of the columns. Note that the transverse base shear
capacity of the pier is also evaluated using a linear elastic analysis to compare with the non-linear
analyses results. The bottom section of the pier reaches its ultimate flexure capacity at 501 kips. The
linear analysis does not incorporate the load re-distribution during the plastic behavior of the sections and
underestimates the entire capacity of the pier. The deformed shape at this final load step is illustrated in
Figure 5. The sectional moment curvature response of the column is illustrated in Figure 6 where the
extreme concrete fibers fail due to the strain exceeding the limit spalling strains and then the compression
fibers in the confined concrete region reach the ultimate compressive strain limits.
Figure 5- Model 1: (a) The first step where column top and bottom sections exceed elastic limits, (b)
Failure due to concrete compressive strains exceeding crushing limit.
0
100
200
300
400
500
600
700
800
0 0.2 0.4 0.6 0.8 1
Pie
r To
tal B
ase
Sh
ear
(ki
ps)
Pier Top Displacement (ft)
Model 1 Pier Transverse Pushover
Model 1: Rigid
Model 1: RigidLinear Analysis
Hinge at Elastic Limit
Hinge at Plastic Limit
NON-LINEAR PUSH-OVER ANALYSES OF PRE-STRESSED CONCRETE BOX-GIRDERS JULY 2013
B.3-5
Figure 6- Column Section Behavior Showing Compressed Concrete Region in Dark Blue and Moment
Curvature under the DL and 20% LL axial force.
3. Analysis for Lateral Load: Model 2 with Released Connections (Bearings)
.
Figure 7- Model 2 Cross Sections with elastic links (pinned bearings) at the Pier
Model 1 is modified assuming that the cap beam is connected to the columns through bearings applied
between the top of the column and the cap beam as illustrated in Figure 7. Elastic links are used to model
the pads that serve to release the rotations at the top of the columns with the rotational stiffnesses of these
bearings being set at zero. For the transverse and longitudinal translation, the elastic stiffness of the link is
Plastic Hinges
Elastic Links for Pinned Bearings
NON-LINEAR PUSH-OVER ANALYSES OF PRE-STRESSED CONCRETE BOX-GIRDERS JULY 2013
B.3-6
infinitely large assuring the compatibility of the longitudinal and transverse displacements between the
columns and the cap beam at the location of the bearings.
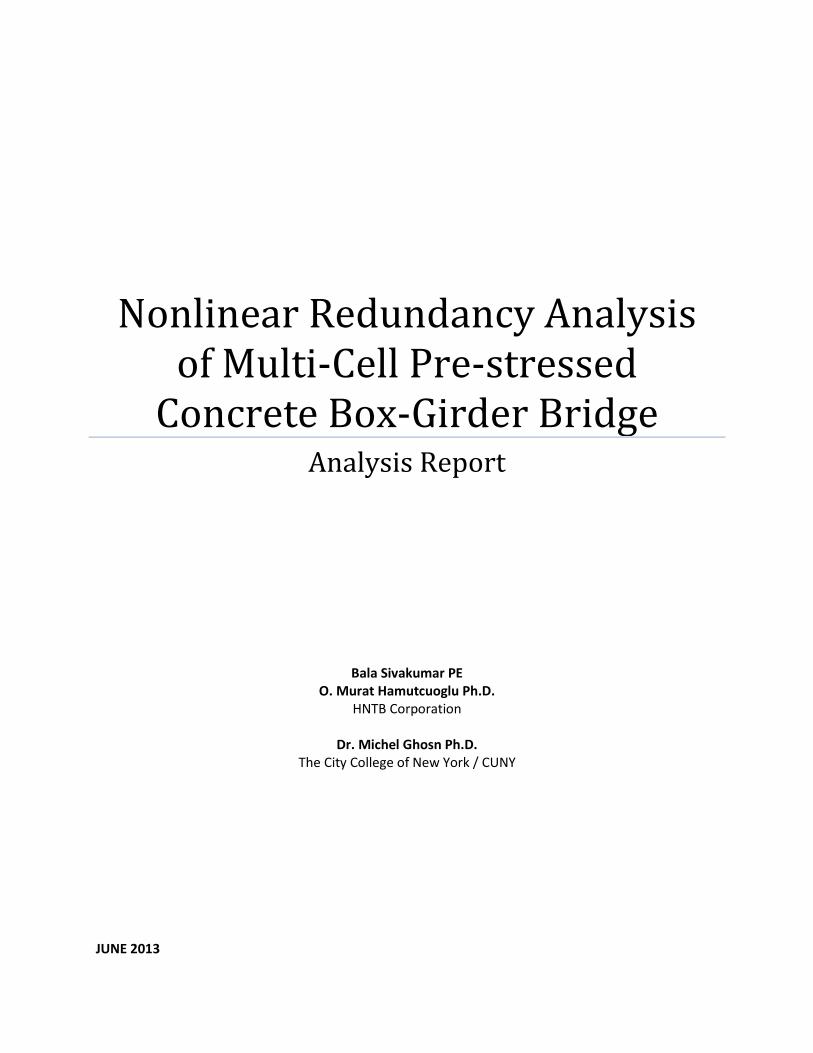
Figure 8- Transverse Pushover Analysis of the Pier with Bearings
Figure 8 compares the results of the push over analysis performed for Model 1 and Model 2. At the elastic
limit, the total base shear capacity of the pier for Model 2 with a bearing connection is equal to 252 kips,
which is significantly lower than the results of Model 1 with the rigid connection. The bearings provide a
released flexure connection between the column and the cap beam and consequently, the bottom sections
of the columns are subjected to significantly increased flexure demand when compared to the rigidly
connected Model 1. Note that for the case with moment-released bearings, the level of indeterminacy is
lower, thus linear analysis provides more accurate solutions than Model 1.
Figure 9 illustrates the fact that the released column top sections and the cap beam of the bridge with
bearings do not contribute to structural resistance. At the final step, the bridge will fail when the load
reaches 345 kips. At that load, the concrete section failure occurs when the concrete fibers in
compression exceed the crushing limit while the reinforcing steel is in strain-hardening.
It is observed that the ultimate capacity for the Model 1 with the integral connection at 720 kips is slightly
higher (by less than 5%) than two times the ultimate capacity of Model 2 with the bearing connections at
345 kips.
0
100
200
300
400
500
600
700
800
0 0.2 0.4 0.6 0.8 1
Pie
r To
tal B
ase
She
ar (
kip
s)
Pier Top Displacement (ft)
Model 1 & 2 Pier Transverse Pushover
Model 1: Rigid
Model 2: Bearing
Model 1: Rigid LinearAnalysis
Model 2: Bearing-Linear Analysis
NON-LINEAR PUSH-OVER ANALYSES OF PRE-STRESSED CONCRETE BOX-GIRDERS JULY 2013
B.3-7
Figure 9- Model 2: (a) The first step where column bottom sections exceed their elastic limits, (b) Failure
due to concrete compressive strains exceeding crushing limit.
4. Pushdown Analysis under Vertical Loads: Model 3 with Grillage
The nonlinear pushdown analysis under the effect of vertical load is not as straightforward as the lateral
pushover analyses performed for Model 1 and Model 2. The shell element definitions for the reinforced
concrete superstructure are not capable of representing the nonlinear behavior and interaction between the
concrete and reinforcing steel fibers. Also, the pre-stressing tendons cannot be incorporated explicitly in
the model. Instead, the original model represented the prestressing effects in terms of forces. Thus, the
tendons physically do not exist in the model. However, with or without the physical tendon elements, the
combined inelastic moment- curvature behavior cannot be represented using the original model.
Another commonly used option for representing the superstructure is the spline model which can simulate
the inelastic behavior of this type of multi-cell prestressed concrete box girder superstructures. However,
using a single beam element- type spline model will not be capable of capturing out-of-plane torsional
effects whereas one of the goals in the model is to investigate the capacity of the superstructure in the
presence of eccentric vertical loadings shifted to the curb which is further detailed.
Therefore, a new model is required where longitudinal/transverse flexure and torsional effects are
represented accurately and the plastic hinge theory is applicable to capture inelastic behavior. The
nonlinear behavior of the box-girder can be simulated by plastic hinge theory if the multi- cell box girder
is modeled using a grillage where the transverse and longitudinal stiffnesses of the elements can be
approximated. The flexural and torsional stiffnesses of the grillage elements are calculated through
existing methodologies proven to capture box-girder behavior accurately [1, 2]. The grillage model for
the superstructure can be connected to the beam column element representing the substructure such the
entire bridge system is modeled as a space frame.
Hinge at Elastic Limit
Hinge at Plastic Limit (Failure)
NON-LINEAR PUSH-OVER ANALYSES OF PRE-STRESSED CONCRETE BOX-GIRDERS JULY 2013
B.3-8
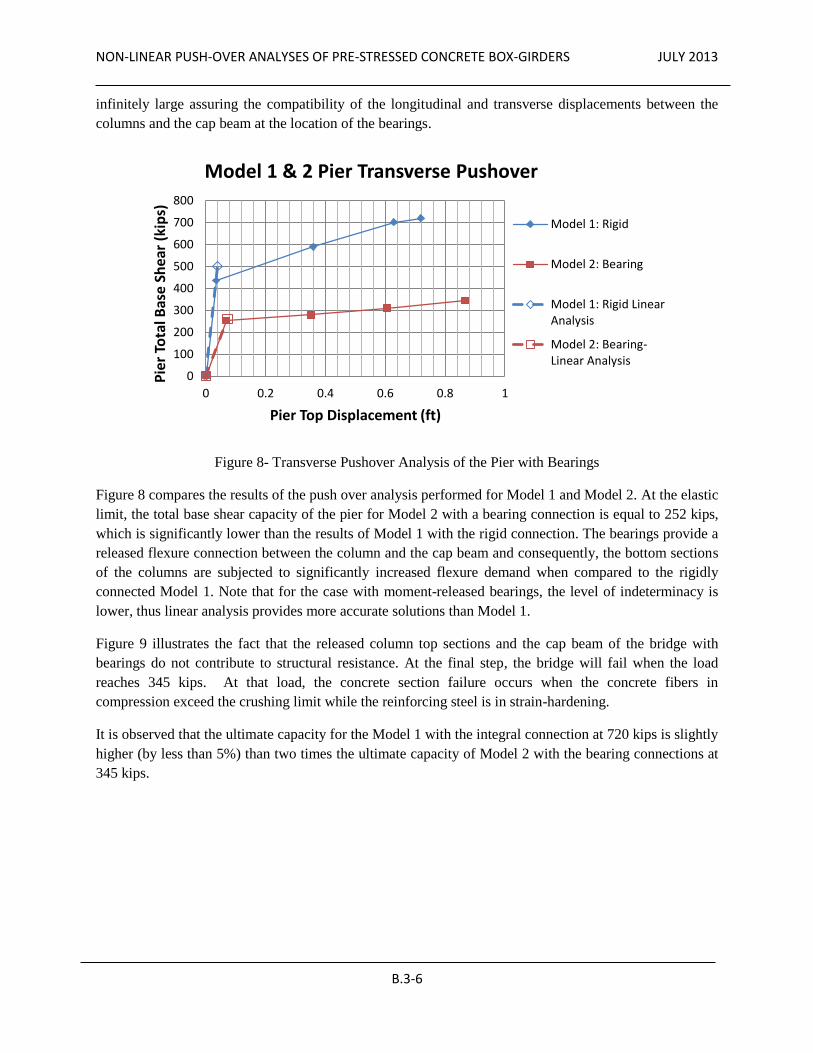
Figure 10- Model 3 Grillage/Space Frame Model with the HS20 Vehicle Loading
The longitudinal grillage elements represent the longitudinal stiffness of superstructure portions where
each element carries the stiffness of the pre-stressed concrete web and the corresponding top/bottom
slabs. For five webs, the model includes five longitudinal elements and the longitudinal stiffness IL, is
calculated from the geometry of each web portion and the proportional slab area.
The effective shear area of the transverse beams that distributes the loads in transverse and represents the
cross section distortion (Figure 11) is evaluated by the closed form equation for an accurate
approximation [1].
(
)
[
(
)]
(Eq. 1)
top slab thickness, tt ; bottom slab thickness, tb ; web thickness, tw; depth between centerlines of the top
and bottom slabs, d ; Spacing between adjacent webs of the cell, S.
Figure 11- Cross Section Distortion Represented by It Stiffness
The transverse bending inertia has the closed form equation per unit length and the quantity is applied
regarding the number of the transverse element of the grillage [1, 2].
(Eq.2)
Two formulations are available for the torsional stiffness of the longitudinal elements. The first
formulation divides the total torsional constant J1 to be equally shared among the grillage longitudinal
girders. The second formulation J2 is the other option which is calculated per unit length of the width.
However, J1 is approximately twice the J2 stiffness. The non-linear analysis of the grillage is carried out
only with the inelastic flexural effects wile torsional effect is assumed as elastic before the plastic hinge
occurs. Initially, J2 stiffness is applied to the grillage girders so that the eccentric vertical forces are
NON-LINEAR PUSH-OVER ANALYSES OF PRE-STRESSED CONCRETE BOX-GIRDERS JULY 2013
B.3-9
carried by the flexure stiffness of the beams. This way, J2 is expected to provide more conservative
flexural plastic capacity.
∑ ⁄
(Eq.3)
The plastic hinge definition for the grillage elements is based on the moment-curvature relationship of
each web and corresponding slab portion. The pre-stressing strands and the conventional reinforcing steel
are included in the section definitions. The SAP2000 program cannot incorporate the tendon pre-stressing
effects in sections other than Caltrans’ sections. However, the program allows the analyst to apply user-
defined moment-curvature relationships at the plastic hinge definitions. Thus, the pre-stressed girders are
evaluated outside the program and then their moment-curvature definition is assigned as user-defined.
Xtract Software was used to obtain the moment-curvature relationships of the pre-stressed sections at
each girder element along the bridge. Then, the plastic hinges are described in SAP2000 using the
idealized bilinear moment-curvatures due to the SAP2000 program which only allows linear
hardening/softening behavior within plastic region. Note that the Xtract bi-linearization technique is not
always as accurate as the one given in Figure 12. Thus, a segmental regression analysis was carried out
using available open-source codes [3] that provide the mathematically consistent idealized curves
represented by one line for elastic and one line for the plastic region. Note that the average strength
increase is 1.3 times the moment in elastic limit and provides significant capacity through hardening in
the plastic region of the moment- curvature curves.
Figure 12- Negative Moment Curvature Section 126 where Failure is due to Rupture of the Tendons
As illustrated in Figure 13, two HS20 trucks with 4 ft distance are applied at the mid-span. The model is
beam- type grillage where the transverse element locations are adjusted to make truck point loads
coincide with the nodes. Note that the dead load is not incremented during the vertical push-down
analysis.
NON-LINEAR PUSH-OVER ANALYSES OF PRE-STRESSED CONCRETE BOX-GIRDERS JULY 2013
B.3-10
Figure 13- 2-Lane HS20 Truck Loading Locations Coinciding with the Grillage Mesh
The plastic hinge definitions of the program are applied at the critical location where the plastic
deformations are expected at the connection regions and the point load locations as illustrated in Figure
14. The plastic hinge defintions provide the analyst the ability to track the elastic and plastic deformation
levels. Note that for each end of the transverse elements, corresponding non-linear moment curvature
curves of the section are assigned as well to represent the influence of top and bottom slabs of the box
girders on the transverse stiffness.
Figure 14- Plastic Hinge Locations at Pier Centerlines and the vehicle loads.
6’ 4’ 6’
Pier CL Pier CL
Locations where Plastic Hinge are defined to track hinge occurrence
NON-LINEAR PUSH-OVER ANALYSES OF PRE-STRESSED CONCRETE BOX-GIRDERS JULY 2013
B.3-11
The vertical pushdown analysis results are presented in terms of the total vehicle axle load and the
recorded displacement in the exterior girder at the midspan.The pushdown analysis is started after the
dead load (DL) and the pre-stress (PS) loading are applied in a nonlinear analysis. Therefore, at the end of
the initial DL+PS analysis, the pushdown curve starts at a vertical displacement equal to 0.12 ft at Step 0.
The toal vertical force applied on the structure is then normalized by the total weight of two trucks, 144
kips and the load level is simply reported as a function of the Normalized Vertical Load (NVL) as given
in Figure 15. The plastic strains are initiated at NVL=12.9 on the exterior girder support due to negative
flexure and in both the interior and exterior girders due to positive flexure at midspan. Due to the
eccentric vertical loads, the distortion behavior along the bridge section is well-simulated with appropriate
shear stiffness calculated by the refered formulations. Note that the plastic hinges also occur in the
transverse elements as the load steps are further increased. Figure 15 also includes the linear analysis
solution for the vertical live load capacity of the superstructure where the midspan positive moment
capacity is at NVL=18.0, and negative moment capacity occurs at NVL=18.6. Thus, the linear analysis
results underestimates the load re-distribution among the girders once the plastic deformations occurs.
Maximum load capacity is at NVL= 24.1 when the total maximum vertical displacement of the midspan
is 1.84 ft. Note that the recorded section failure is due to the extended pre-stress tendon fibers exceeding
the ultimate strain limit of 0.035 in/in at the negative moment section as indicated in Figure 16 (b). A
detailed deformed shape of half of the middle span is given in Figure 17 where the distortion in the
bridge section is illustrated including the locations of plastic hinges occured at the peak load level.
Figure 15- Vertical Pushover Analysis of the Original Model with No Deficiency.
0
5
10
15
20
25
30
0 1 2 3 4
No
rmal
ized
Ver
tica
l Lo
ad (
k/k)
Mid-Span Vertical Displacement (ft)
Model 3: Vertical Pushover
Model 3: Original Case Model 3 Linear
NON-LINEAR PUSH-OVER ANALYSES OF PRE-STRESSED CONCRETE BOX-GIRDERS JULY 2013
B.3-12
Figure 16- Model 3 (a) The first step where pre-stressed girder sections exceed elastic limits, (b) Failure
due to the tendon stress reaching the ultimate strain.
Figure 17- Model 3 Distortion at the Mid-span Due to the Eccentric Vehicle Loading.
5. Vertical Load Analysis with Damage Scenario I: Model 4 Column Removal
The push-down analysis is repeated in Model 4 where one of the piers is removed from the system to
study the capacity of the system to carry some load following major damage to one of the columns. This
first damage scenario as illustrated in Figure 18 could represent a situation where one of the column is hit
by a truck, ship or debris carried by a flood or when one column foundation is damaged to a major scour
or if one of the columns has been exposed to major deterioration or construction errors. Note that the
initial plastic hinge definitions given in Figure 18 can be increased near the undamaged pier and, again,
around the vehicle axle loads. Within the scope of the damage bridge scenarios undertaken in this study,
the dynamic impact of the element loss is not included in the static pushdown analyses. The objective is
to study the ability of a system that has sustained some major damage to continue to carry load and not
the response of the bridge to the dynamic impact.
Pier CL
Mid-Span CL
NON-LINEAR PUSH-OVER ANALYSES OF PRE-STRESSED CONCRETE BOX-GIRDERS JULY 2013
B.3-13
Figure 18- Damage Scenario I with the Removed Pier Column
The analyses of Model 4 is carried out in two scenarios. The first scenario followed is given in Model 4-a
where the columns sections are assumed to behave within linear elastic limits. Due to the loss of one pier
column, the amount of flexure demand on the undamaged column of the same pier is expected to be
extreme, so that the failure modes are probable in this column section. In the first scenario, the focus is
directly on the load distribution on the superstructure, thus the column sections are assumed to behave in
elastic manner to investigate the effects of load distribution only in the superstructure. Figure 19
illustrates the failed girder section plastic hinges due to excessive negative moment demand at the
undamaged pier location. Note that the plastic hinges also occur on the cap beam; however, these
sections, which are already yielded, do not reach their failure limits before the girder sections in this
analysis.
The second scenario, Model 4-b, is a more realistic approach that represents the nonlinear material
behavior in both super- and sub- structures. In this case, the plastic hinges are also defined in the column
sections to monitor the plastic behavior of the sub-structure as well. Note that the behavior of Model 4-b
with the column loss is expected to be governed by the plastic deformations and probable failure modes in
the column and/or the cantilevered cap beam sections. Figure 20(a) illustrates the deformed shape of the
bridge at the initial step where the plastic hinges are already initialized in the cap beam and the column
when the structure with the column loss is subjected to the dead load and pretressing force effects
(DL+PS). Figure 20(b) illustrates the plastic hinge propagation when the column section is failed due to
the excessive compressive strains in the conrete. Then, the section loses its entire flexure stiffness, starts
unloading and behaves as a flexure hinge after this point. The pushdown analysis is continued after the
load redistribution due the the column flexural failure and the vertical vehicle loads are increased until the
critical girder section failure at the midspan of Span 2 as given in Figure 20 (c).
The numerical results of the vertical pushdown analyses on the Models 4-a and 4-b are compared to the
original case (Model 3) in Figure 21. Regarding the results from Model 4-a where the sub-structure
columns is in elastic manner, the prestressed girders are significantly redundant when one of the piers in
the structure is subjected to a column loss. Model 4-a experienced the girder failure at the negative
moment section of the exterior girder at the peak level of the normalized vertical load, NVL = 23.8.
Recall that this value is slightly smaller than the original case, Model 3 with NVL=24.1.
The column plastic hinge reached its ultimate plastic deformations capacity at NVL=11.Note that the
plastic hinge is already initiated due to the re-distribution of dead and prestressing loads. The vertical
pushdown is resumed while the failed column section is unloaded until the critical girder section at the
NON-LINEAR PUSH-OVER ANALYSES OF PRE-STRESSED CONCRETE BOX-GIRDERS JULY 2013
B.3-14
midspan is failed due to the excessive plastic strains in the pre-stress tendon in the exterior girder
(NVL=19.0).
Figure 19- Model 4-a (a) The first step where the cap beam sections exceed elastic limits, (b) Failure due
to the tendon stress reaching the ultimate strain at the negative moment section along the centerline of
undamaged pier.
Figure 20- Model 4-b (a) The first step where the column sections exceed elastic limits, (b) Failure in the
top column sections, the section immediately starts unloading after this point. (c) First failed pre-stressed
girder failure
NON-LINEAR PUSH-OVER ANALYSES OF PRE-STRESSED CONCRETE BOX-GIRDERS JULY 2013
B.3-15
Figure 21- The Effects of Column Removal on the Vertical Pushdown Analyses of Pre-stressed Girders.
The linear analysis solution for Model 4 cases are also included in Figure 21. The linear analysis in Model
4-a can not provide a sufficient represetation of the load re-distribution once the initial plastic hinges
occur and underestimates the live load capacity at NVL=16.5. In the presence of plasticity in the columns,
the linear analysis is performed on the system where the column top seciton is released for both moment
directions. The linear solution indicates that the positive moment capacity at the midspan and the negative
moment capacity at the support are reached at NVL=16.4 and NVL=16.8, respectively.The linear analysis
solution for Model 4-c provides more accurate results when the column failure is also modeled.
Once the influence of the plasticity on the un-dameged colums is detected as significant, an additional
model case (Model 4-c) is introduced as an alternative case to check to evaluate the effect of the truck
location on the failure mode. In Model 4-c, the two HL93 trucks are located over the damaged pier. As
illustrated in Figure 22, the vertical load capacity of the system slightly different than each other.
However the cricial member locations are not the same. The failure occurs on the girder plastic hinge
near the support location due to the positive moment causing excessive compressive stress in the concrete.
This failure mode is not similar to the ductile tendon failure at the midspan where the vehicles are
loacated in Model 4-b.
0
5
10
15
20
25
30
0 1 2 3 4
No
rmal
ized
Ver
tica
l Lo
ad (
k/k)
Mid-Span Vertical Displacement (ft)
Model 4: Vertical Pushover with Column Losses - Load Location -Midspan Span 2
Model 3: Original Case Model 4-a: Column Loss
Model 4-b: Column Loss with Column Hinge Model 4 Linear
Model 4: Linear- Column Hinge Model 3 Linear
Column Hinge initiated at NVL = 0. Plastic Deformation Limit is NVL=11. Column top is unloaded
Girder Hinge Failure (NVL=19)
NON-LINEAR PUSH-OVER ANALYSES OF PRE-STRESSED CONCRETE BOX-GIRDERS JULY 2013
B.3-16
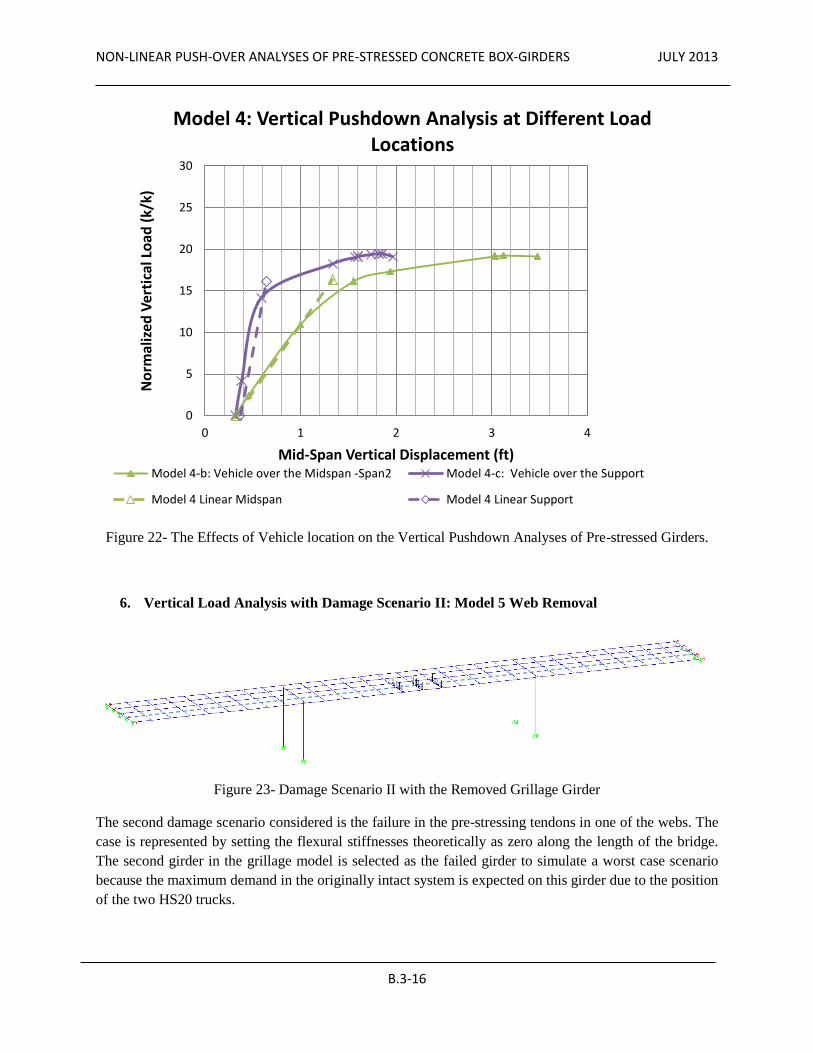
Figure 22- The Effects of Vehicle location on the Vertical Pushdown Analyses of Pre-stressed Girders.
6. Vertical Load Analysis with Damage Scenario II: Model 5 Web Removal
Figure 23- Damage Scenario II with the Removed Grillage Girder
The second damage scenario considered is the failure in the pre-stressing tendons in one of the webs. The
case is represented by setting the flexural stiffnesses theoretically as zero along the length of the bridge.
The second girder in the grillage model is selected as the failed girder to simulate a worst case scenario
because the maximum demand in the originally intact system is expected on this girder due to the position
of the two HS20 trucks.
0
5
10
15
20
25
30
0 1 2 3 4
No
rmal
ized
Ver
tica
l Lo
ad (
k/k)
Mid-Span Vertical Displacement (ft)
Model 4: Vertical Pushdown Analysis at Different Load Locations
Model 4-b: Vehicle over the Midspan -Span2 Model 4-c: Vehicle over the Support
Model 4 Linear Midspan Model 4 Linear Support
NON-LINEAR PUSH-OVER ANALYSES OF PRE-STRESSED CONCRETE BOX-GIRDERS JULY 2013
B.3-17
Note that a significant load demand is expected on the transverse elements where multiple axle wheel
loads are applied. When the damaged girder is removed, the transverse elements are expected to fail and
both flexure hinge mechanisms are expected to occur on these elements. To model such effect accurately,
additional releases are provided at the transverse member element ends.
Figure 24- Plastic Hinge Locations at Pier Centerlines and the vehicle loads.
Figure 25- Vertical Pushdown Analysis of the Bridge with the Damage Scenario II, Girder Loss.
Due to the interior girder loss, the exterior girder becomes the most critical component when the structure
is subjected to the eccentric vehicle load. The initial plastic hinges occurred at the pier and the midspan
sections of the the exterior girder at the vertical load level, NVL = 10.2. As the vertical loads are
increased, the flexure hinges are also observed at the mid points of the transverse elements where the
points loads are applied. Finally, the pier section of the exterior girder reaches the flexure capacity as the
0
5
10
15
20
25
30
0 1 2 3 4
No
rmal
ized
Ver
tica
l Lo
ad (
k/k)
Mid-Span Vertical Displacement (ft)
Model 5: Vertical Pushover with Girder Losses
Model 3: Original Case Model 5: Int. Girder Loss Model 5: Linear
Pier CL Pier CL
Locations where Plastic Hinge are defined to track hinge occurrence
NON-LINEAR PUSH-OVER ANALYSES OF PRE-STRESSED CONCRETE BOX-GIRDERS JULY 2013
B.3-18
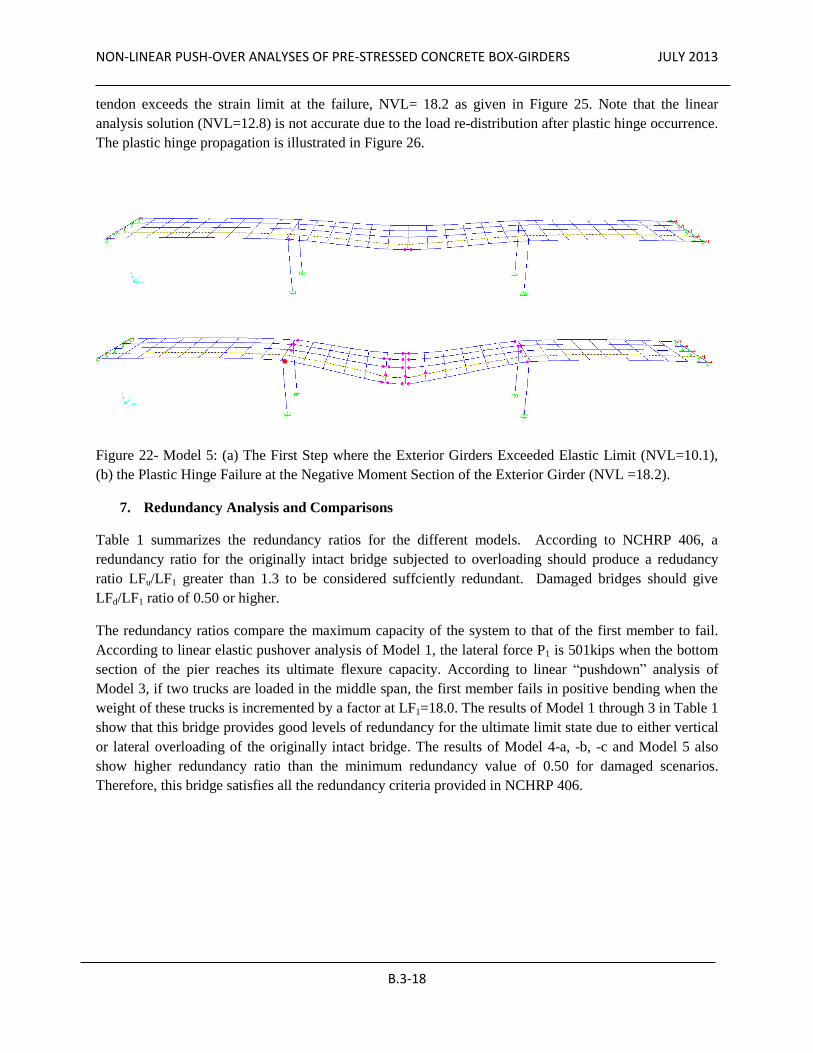
tendon exceeds the strain limit at the failure, NVL= 18.2 as given in Figure 25. Note that the linear
analysis solution (NVL=12.8) is not accurate due to the load re-distribution after plastic hinge occurrence.
The plastic hinge propagation is illustrated in Figure 26.
Figure 22- Model 5: (a) The First Step where the Exterior Girders Exceeded Elastic Limit (NVL=10.1),
(b) the Plastic Hinge Failure at the Negative Moment Section of the Exterior Girder (NVL =18.2).
7. Redundancy Analysis and Comparisons
Table 1 summarizes the redundancy ratios for the different models. According to NCHRP 406, a
redundancy ratio for the originally intact bridge subjected to overloading should produce a redudancy
ratio LFu/LF1 greater than 1.3 to be considered suffciently redundant. Damaged bridges should give
LFd/LF1 ratio of 0.50 or higher.
The redundancy ratios compare the maximum capacity of the system to that of the first member to fail.
According to linear elastic pushover analysis of Model 1, the lateral force P1 is 501kips when the bottom
section of the pier reaches its ultimate flexure capacity. According to linear “pushdown” analysis of
Model 3, if two trucks are loaded in the middle span, the first member fails in positive bending when the
weight of these trucks is incremented by a factor at LF1=18.0. The results of Model 1 through 3 in Table 1
show that this bridge provides good levels of redundancy for the ultimate limit state due to either vertical
or lateral overloading of the originally intact bridge. The results of Model 4-a, -b, -c and Model 5 also
show higher redundancy ratio than the minimum redundancy value of 0.50 for damaged scenarios.
Therefore, this bridge satisfies all the redundancy criteria provided in NCHRP 406.
NON-LINEAR PUSH-OVER ANALYSES OF PRE-STRESSED CONCRETE BOX-GIRDERS JULY 2013
B.3-19
Table 1 Summary table for the redundancy ratio of the prestressed box-girder bridge
Analysis Case Model Pu/P1 LFu/LF1 LFd/LF1
Model 1 1.44 --- ---
Model 2 1.37 --- ---
Model 3 --- 1.34 ---
Model 4-a --- --- 1.32
Model 4-b --- --- 1.06
Model 4-c --- --- 1.06
Model 5 --- --- 1.01
CONCLUSIONS
The system redundancy of a sample multicell prestrssed concrete box-girder bridge was evaluated
through a set of non-linear static analyses accounting for the nonlinear behavior of the pier columns and
the pre-stressed girder sections. The system behavior of the system under the effect of lateral load was
evaluated for two cases: (1) Model 1 with the box-girder superstructure connected to the substructure
through rigid integral connections between the capbeams and the columns; (2) Model 2 with the box-
girder superstructure supported on bearings where the theoretical flexural stiffness was zero. The
horizontal pushover analyses indicated that the horizontal load capacity of the system with pinned piers is
reduced by 53% when compared to the performance of the system with integral column –cap beam
connection. This reduction is consistent with currently used simplified plastic analysis models that
consider the pier as a frame with either fixed-fixed columns simulating the behavior of the system with
integral connection as compared to fixed-pinned columns which simulate the behavior of the system with
bearings.
The pre-stressed multicell box girder bridge system redundancy was evaluated by analyzing the effects of
two damage scenarios. In the first damage scenario the structure is assuemd to have experienced the loss
of a pier column while the second scenario simulated the loss of a pre-stressed girder. The vertical
pushdown analysis indicated that the eccentrically loaded bridge in its original undamaged condition had
a total capacity capable of carrying up to 23.9 times the weight of two HS-20 vehicles located side-by-
side between the exterior and the second interior girders on top of the dead load and the pre-stressing
force effects. For the damaged scenario simulating the loss of one column, the remaining un-damaged
column is subjected to significant flexure demand at the top section. The undamged column’s flexure
capacity rstarted its plastification at when the vertial load reached 11 times the weight of two HS-20
design vehicles applied at the midspan. However, due to girder load distribution the ultimate capcity was
NON-LINEAR PUSH-OVER ANALYSES OF PRE-STRESSED CONCRETE BOX-GIRDERS JULY 2013
B.3-20
not affected as severly as the column and the ultimate capacity of the system took place when the load
reached 21 times the total vehicle loads.
The linear analysis solutions for the superstructure through five models are generally not sufficient to
represent the load re-distribution among the prestressed girders. The linear solution underestimates the
vertical and horizontal load capacity of super- and sub-structures due to the higher level of indeterminacy.
The damage scenario simulating the loss of a girder demonstrated that there was significant amount of
redundancy in the system and large additional load distribution. The loss of a prestressed girder, reduces
the capacity of the system by 76% compared to the original intact case. Due to the loads’s eccentric
location, the exterior girder away from the load and the first interior girder on the other side did not
contribute significantly to the original load capacity of the intact system; therefore they are able to help
carry additional load when the girder below the load is removed.
REFERENCES
[1] Zokaie T, Osterkamp TA, Imbsen RA. (1991) Distribution of Wheel loads on Highway Bridges. Final
Report, NCHRP project 12-26; Transportation Research Board, The National Academies, 1991.