39
Nonprofits 2006 One Fabric, Different Threads
| Date post: | 25-Jul-2016 |
| Category: |
Documents |
| Upload: | hawaii-community-foundation |
| View: | 220 times |
| Download: | 0 times |

Nonprofits 2006One Fabric, Different Threads
2
Study Objectives
Raise awareness of the industry and its place in Hawaii’s economy
Create a “landscape map” So organizations can “see where they fit and
who their neighbors are”
Initiate discussions with different stakeholders
Refine the capacity building efforts of HCF

3
Sources of Information
2006 & 2001 Hawaii Community Foundation State of the Industry surveys
GuideStar/National Center for Charitable Statistics
Focus groups & interviews with Executive Directors
Secondary sources
State of the Nonprofit Industry
5
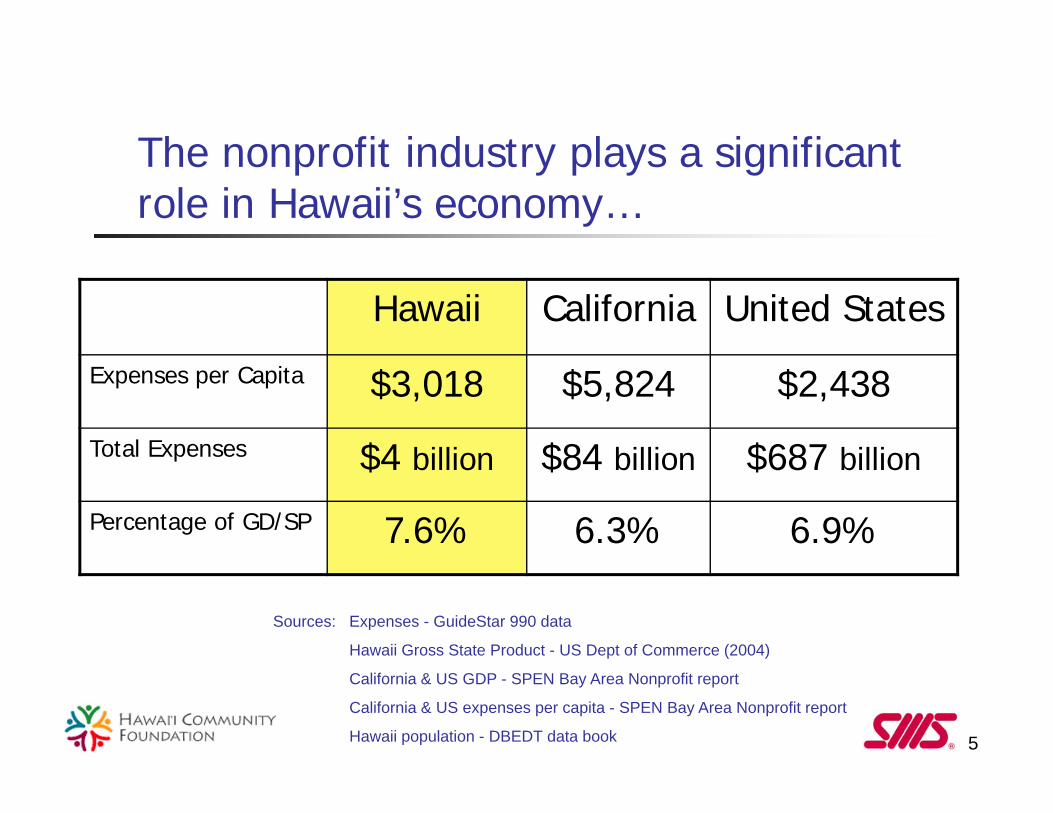
The nonprofit industry plays a significant role in Hawaii’s economy…
Hawaii California United States
Expenses per Capita $3,018 $5,824 $2,438
Total Expenses $4 billion $84 billion $687 billion
Percentage of GD/SP 7.6% 6.3% 6.9%
Sources: Expenses - GuideStar 990 data
Hawaii Gross State Product - US Dept of Commerce (2004)
California & US GDP - SPEN Bay Area Nonprofit report
California & US expenses per capita - SPEN Bay Area Nonprofit report
Hawaii population - DBEDT data book
6
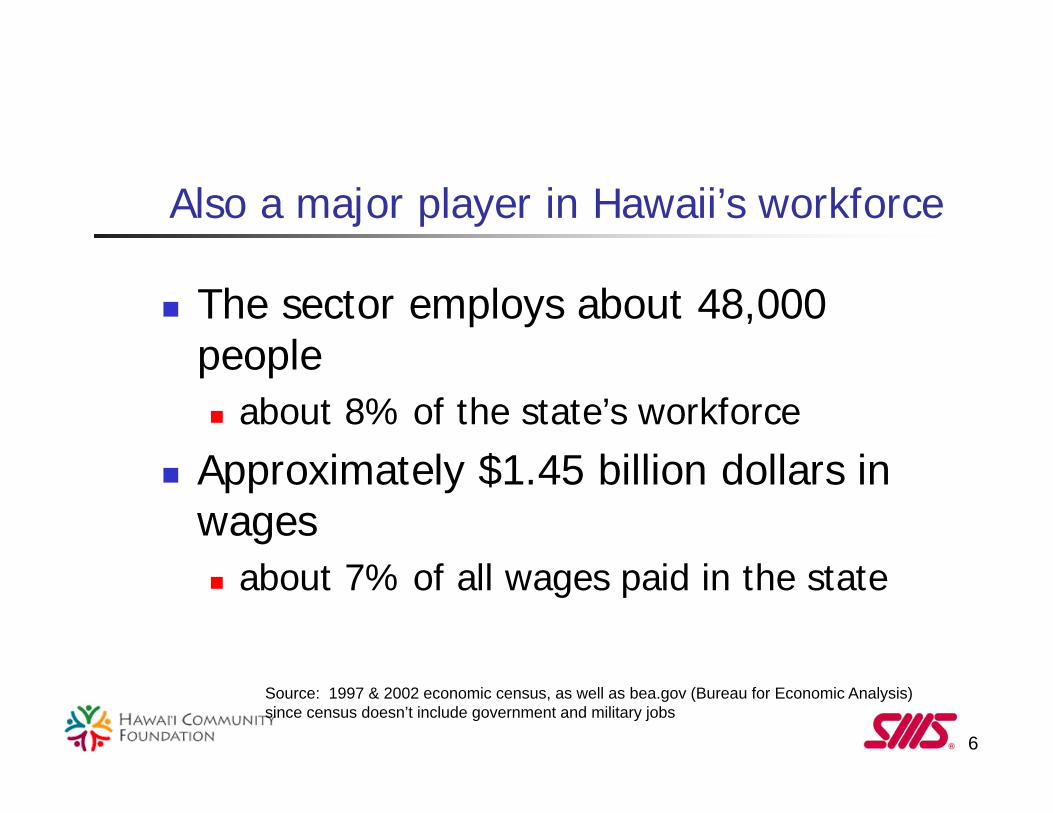
Also a major player in Hawaii’s workforce
The sector employs about 48,000 people about 8% of the state’s workforce
Approximately $1.45 billion dollars in wages about 7% of all wages paid in the state
Source: 1997 & 2002 economic census, as well as bea.gov (Bureau for Economic Analysis) since census doesn’t include government and military jobs
7
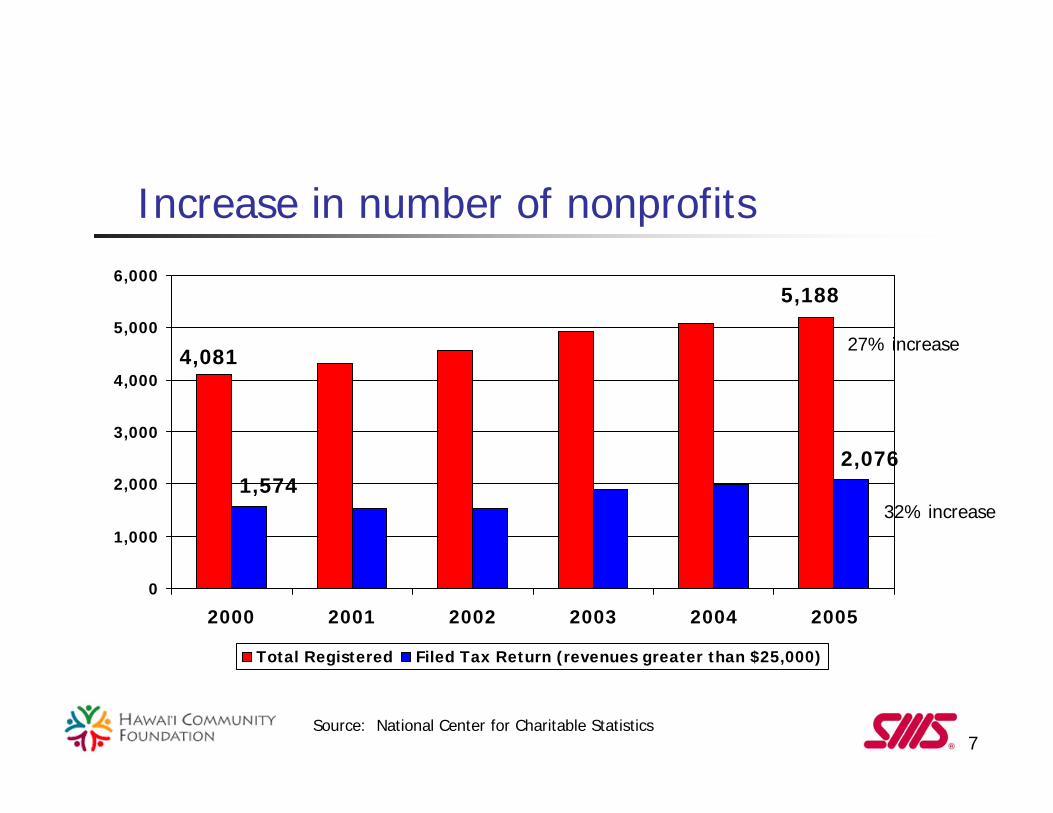
Increase in number of nonprofits
4,081
5,188
1,5742,076
0
1,000
2,000
3,000
4,000
5,000
6,000
2000 2001 2002 2003 2004 2005
Total Registered Filed Tax Return (revenues greater than $25,000)
Source: National Center for Charitable Statistics
27% increase
32% increase
8
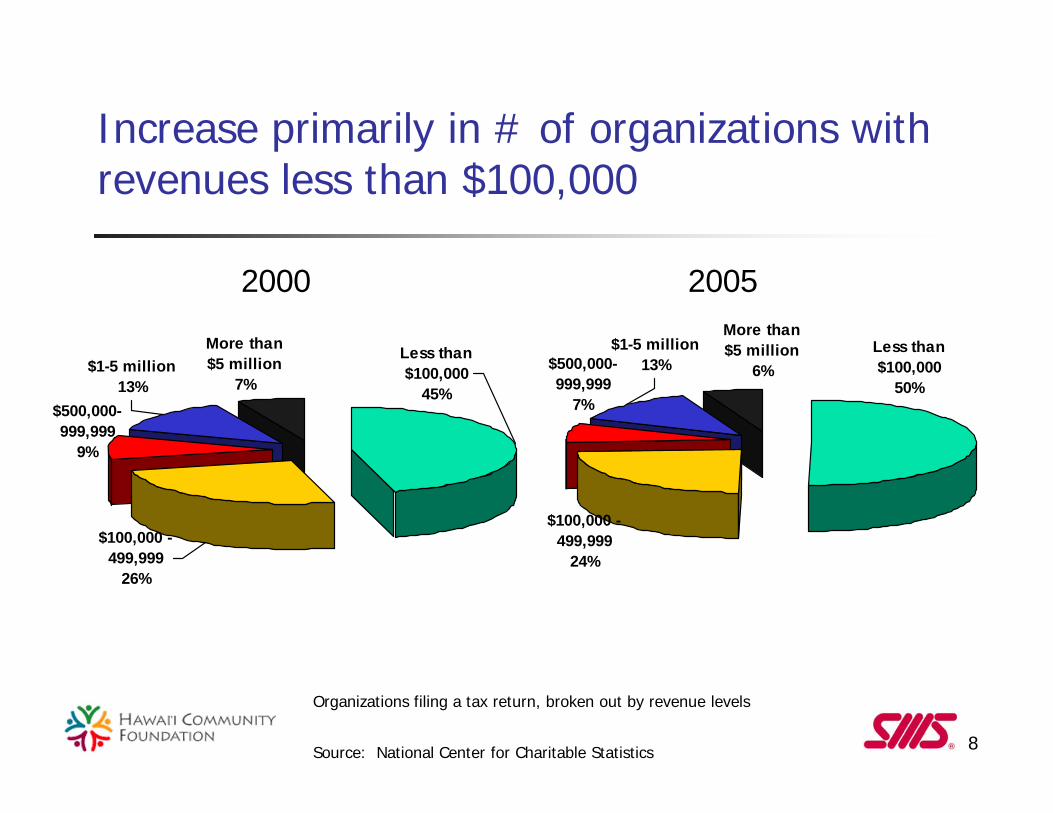
Increase primarily in # of organizations with revenues less than $100,000
More than $5 million
7%
$100,000 - 499,999
26%
$500,000-999,999
9%
$1-5 million13%
Less than $100,000
45%
Source: National Center for Charitable Statistics
Less than $100,000
50%$500,000-999,999
7%
$1-5 million13%
More than $5 million
6%
$100,000 - 499,999
24%
2000 2005
Organizations filing a tax return, broken out by revenue levels
9
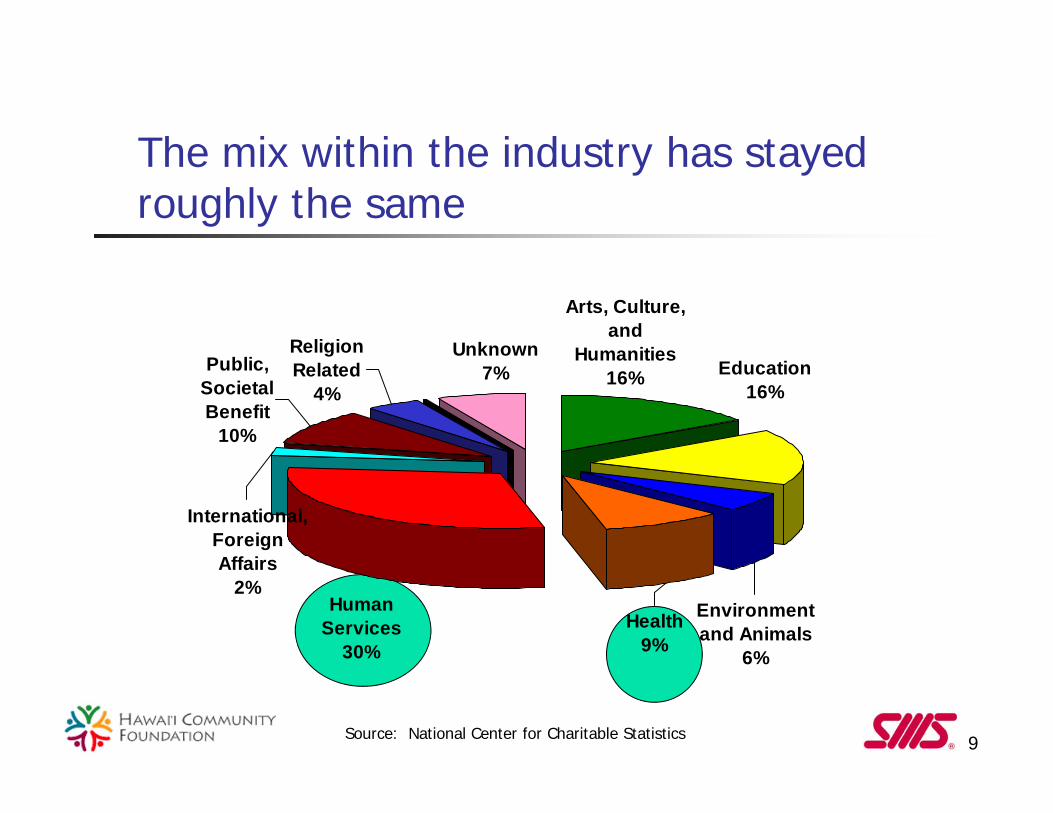
The mix within the industry has stayed roughly the same
Arts, Culture, and
Humanities16% Education
16%
Health9%
Environment and Animals
6%
Human Services
30%
International, Foreign Affairs
2%
Unknown7%Public,
Societal Benefit
10%
Religion Related
4%
Source: National Center for Charitable Statistics
10
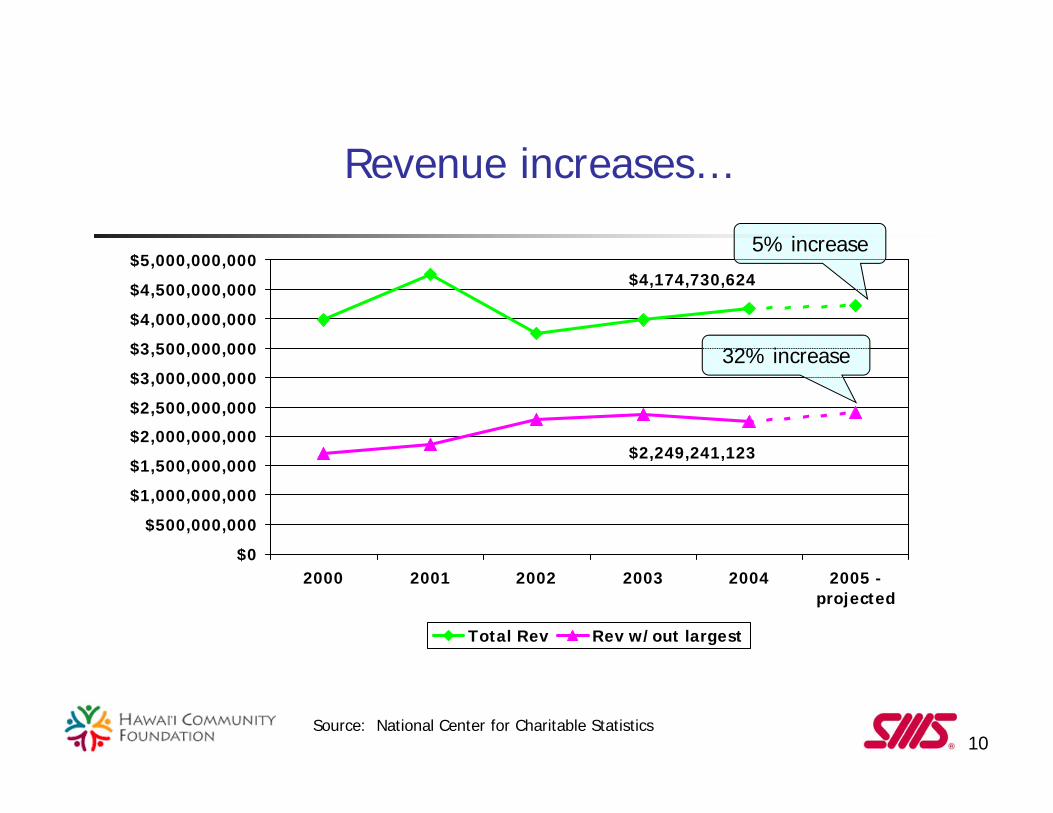
Revenue increases…
$4,174,730,624
$2,249,241,123
$0
$500,000,000
$1,000,000,000
$1,500,000,000
$2,000,000,000
$2,500,000,000
$3,000,000,000
$3,500,000,000
$4,000,000,000
$4,500,000,000
$5,000,000,000
2000 2001 2002 2003 2004 2005 -projected
Total Rev Rev w/out largest
Source: National Center for Charitable Statistics
5% increase
32% increase
11
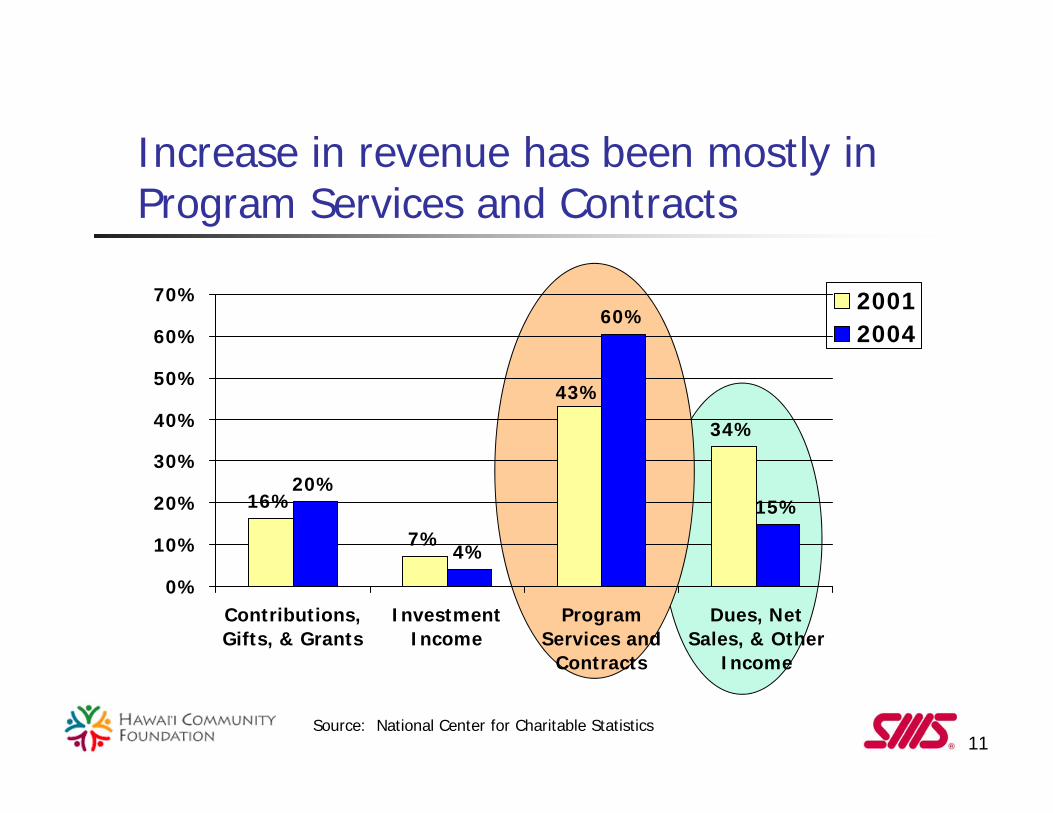
Increase in revenue has been mostly in Program Services and Contracts
16%
7%
34%
20%
4%
60%
15%
43%
0%
10%
20%
30%
40%
50%
60%
70%
Contributions,Gifts, & Grants
InvestmentIncome
ProgramServices and
Contracts
Dues, NetSales, & Other
Income
20012004
Source: National Center for Charitable Statistics
12
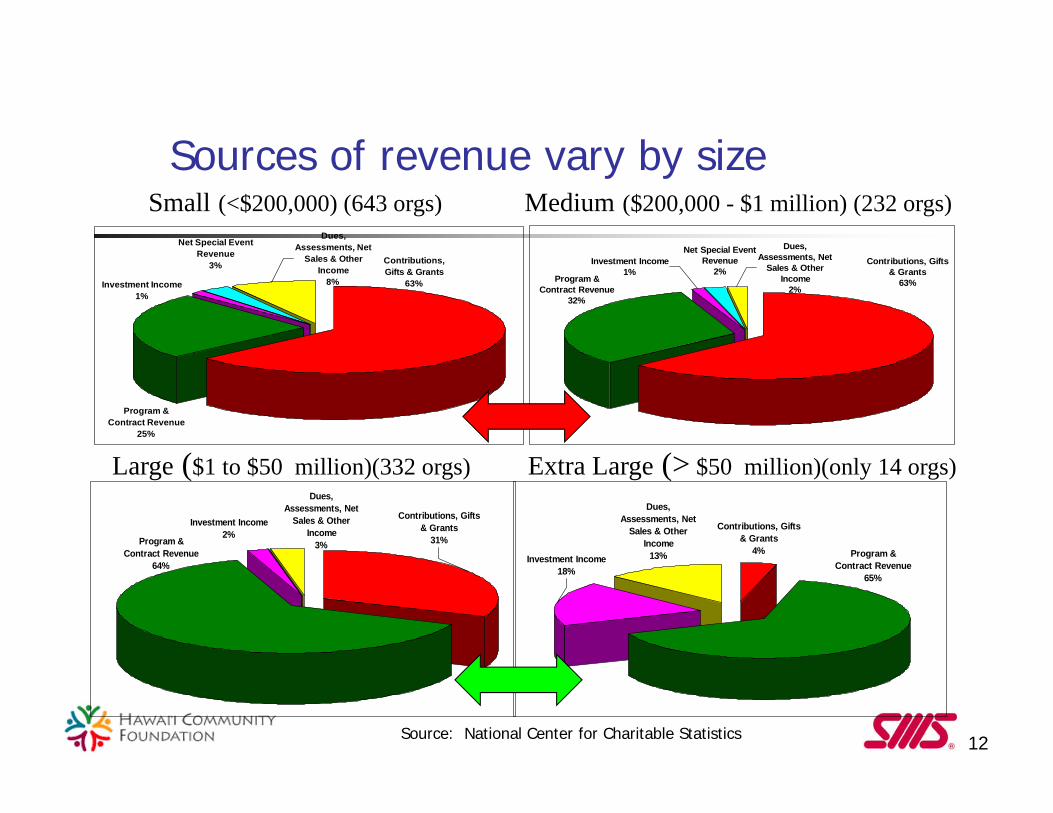
Sources of revenue vary by size
Program & Contract Revenue
25%
Dues, Assessments, Net
Sales & Other Income
8%
Contributions, Gifts & Grants
63%Investment Income1%
Net Special Event Revenue
3%
Contributions, Gifts & Grants
4%Investment Income
18%
Dues, Assessments, Net
Sales & Other Income
13% Program & Contract Revenue
65%
Net Special Event Revenue
2%Investment Income
1%Program &
Contract Revenue32%
Contributions, Gifts & Grants
63%
Dues, Assessments, Net
Sales & Other Income
2%
Program & Contract Revenue
64%
Dues, Assessments, Net
Sales & Other Income
3%
Investment Income2%
Contributions, Gifts & Grants
31%
Small (<$200,000) (643 orgs) Medium ($200,000 - $1 million) (232 orgs)
Large ($1 to $50 million)(332 orgs) Extra Large (> $50 million)(only 14 orgs)
Source: National Center for Charitable Statistics

13
Sources of revenue continues to vary significantly by sector
Dues, Net Sales, & Other Income *
16%
Program Services and Contracts
28%Investment Income
2%Net Special Events
Income2%
Contributions, Gifts, & Grants
52%
Dues, Net Sales, & Other Income *
6%
Net Special Events Income
1%
Investment Income1%
Contributions, Gifts, & Grants
47%Program Services
and Contracts45%
Program Services and Contracts
30%
Investment Income12%
Contributions, Gifts, & Grants
17%
Dues, Net Sales, & Other Income *
41%
Program Services and Contracts
85%
Investment Income1%
Dues, Net Sales, & Other Income *
6%
Contributions, Gifts, & Grants
8%
Arts & Humanities (284 orgs) Education (274 orgs)
Health (223 orgs) Human Services (428 orgs)
Source: National Center for Charitable Statistics
14
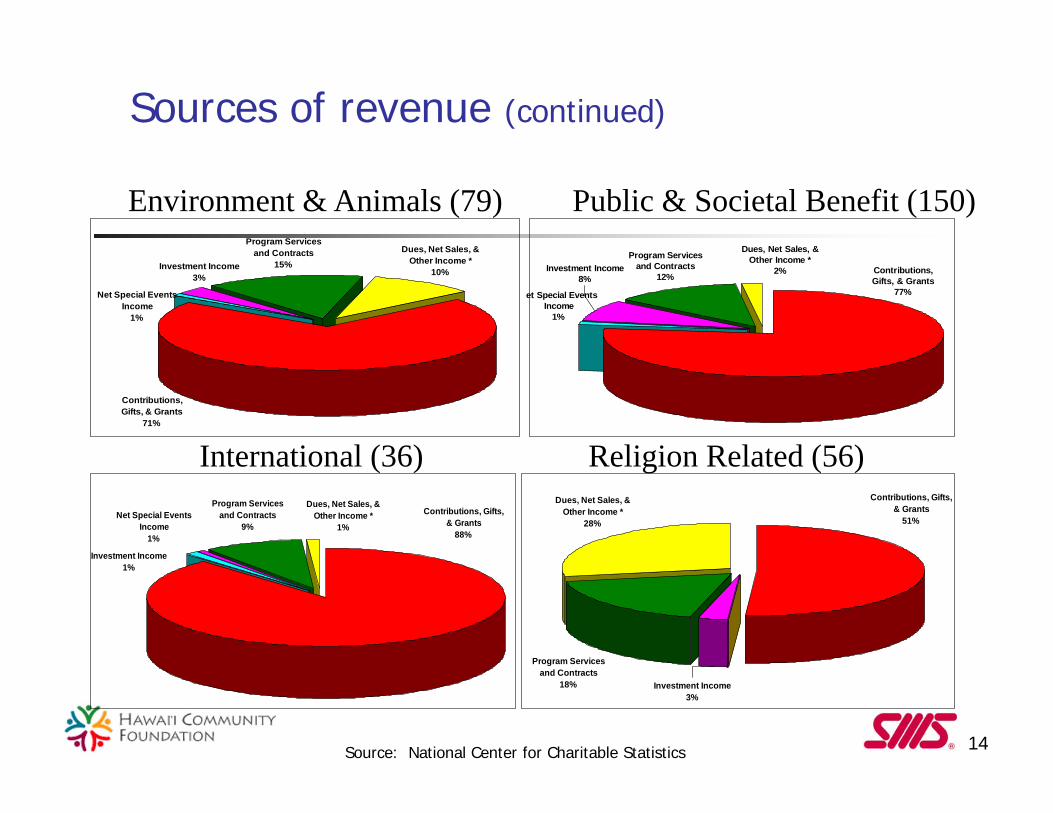
Sources of revenue (continued)
Dues, Net Sales, & Other Income *
10%
Contributions, Gifts, & Grants
71%
Net Special Events Income
1%
Investment Income3%
Program Services and Contracts
15%
Program Services and Contracts
18% Investment Income3%
Contributions, Gifts, & Grants
51%
Dues, Net Sales, & Other Income *
28%
et Special Events Income
1%
Investment Income8%
Program Services and Contracts
12%
Dues, Net Sales, & Other Income *
2% Contributions, Gifts, & Grants
77%
Dues, Net Sales, & Other Income *
1%
Program Services and Contracts
9%Net Special Events
Income1%
Investment Income1%
Contributions, Gifts, & Grants
88%
Environment & Animals (79) Public & Societal Benefit (150)
International (36) Religion Related (56)
Source: National Center for Charitable Statistics
15
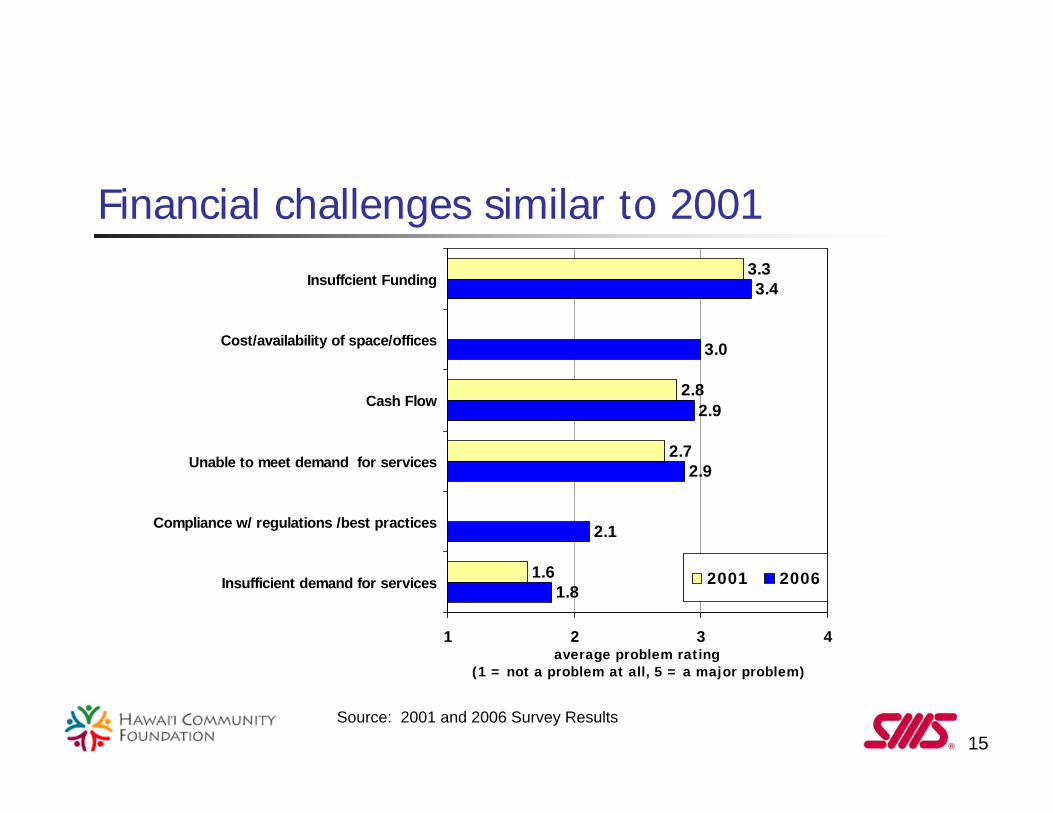
Financial challenges similar to 20013.3
2.8
2.7
1.6
3.4
3.0
2.9
2.9
2.1
1.8
1 2 3 4
Insuffcient Funding
Cost/availability of space/offices
Cash Flow
Unable to meet demand for services
Compliance w/ regulations /best practices
Insufficient demand for services
average problem rating (1 = not a problem at all, 5 = a major problem)
2001 2006
Source: 2001 and 2006 Survey Results
16
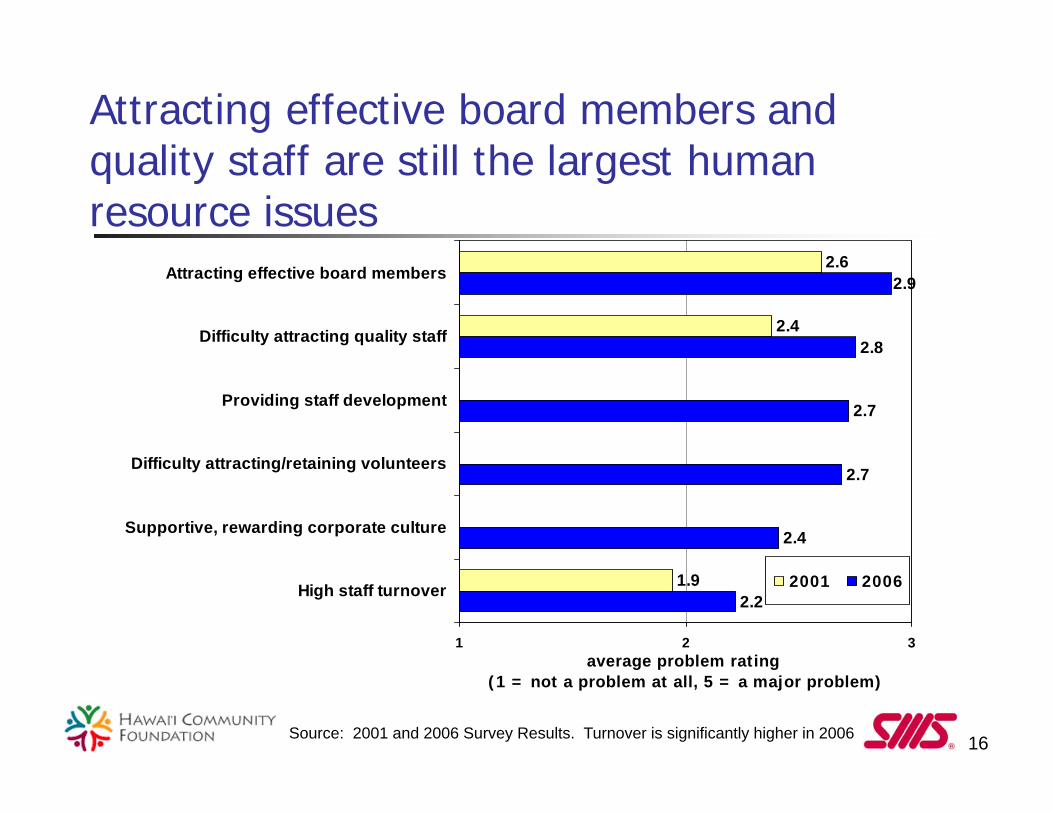
Attracting effective board members and quality staff are still the largest human resource issues
2.6
2.4
1.9
2.9
2.8
2.7
2.7
2.4
2.2
1 2 3
Attracting effective board members
Difficulty attracting quality staff
Providing staff development
Difficulty attracting/retaining volunteers
Supportive, rewarding corporate culture
High staff turnover
average problem rating (1 = not a problem at all, 5 = a major problem)
2001 2006
Source: 2001 and 2006 Survey Results. Turnover is significantly higher in 2006

17
Use of technology has increased significantly in the past five years
Source: 2001 and 2006 Survey Results. Significant increase in use of all technology
72%
54%
38%
33%
31%
12%
96%
83%
77%
60%
60%
23%
21%
0% 25% 50% 75% 100%
Easy access to the Internet
Computerized accounting system
Operational Web site
Computerized database ofcontributors
Database systems
Offer online giving
MIS/Computer technician 2001 2006
18
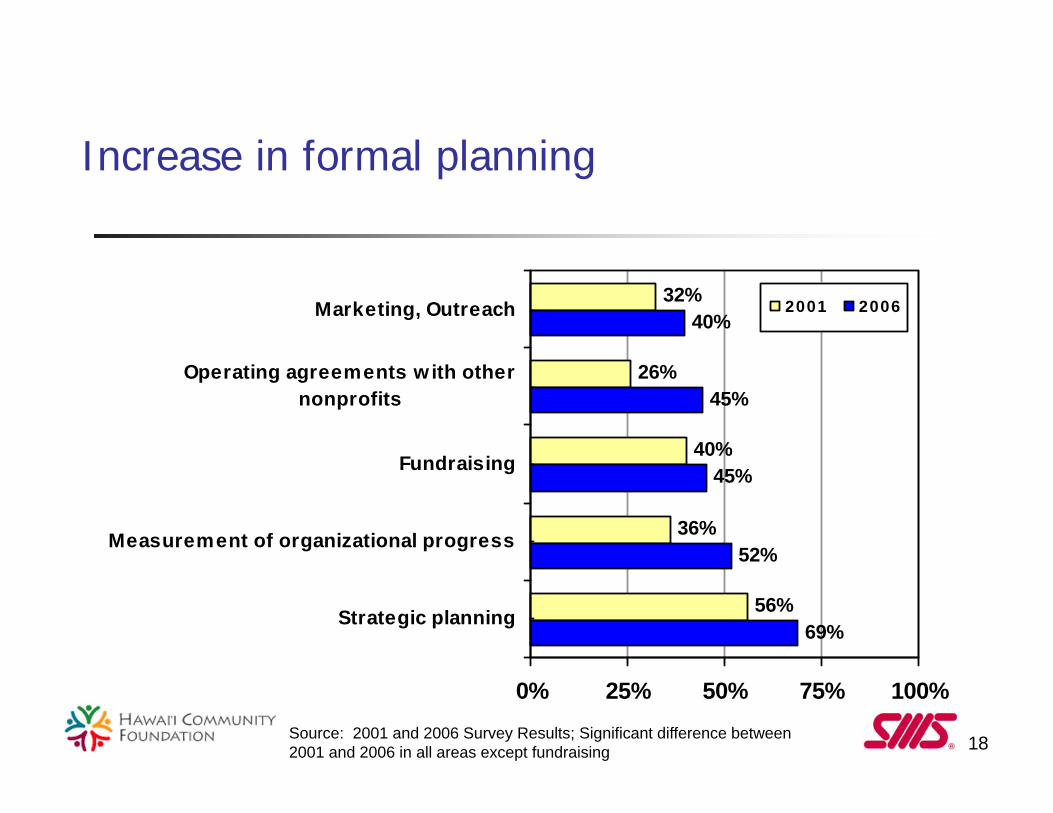
Increase in formal planning
Source: 2001 and 2006 Survey Results; Significant difference between 2001 and 2006 in all areas except fundraising
32%
26%
40%
36%
56%
40%
45%
45%
52%
69%
0% 25% 50% 75% 100%
Marketing, Outreach
Operating agreements w ith othernonprofits
Fundraising
Measurement of organizational progress
Strategic planning
2001 2006
19
Three emerging themes for consideration
Diverse revenue mix of sectors create different challenges and pressures
Depending on who you are, growth may not be the answer
The competition for talent is heating up
20
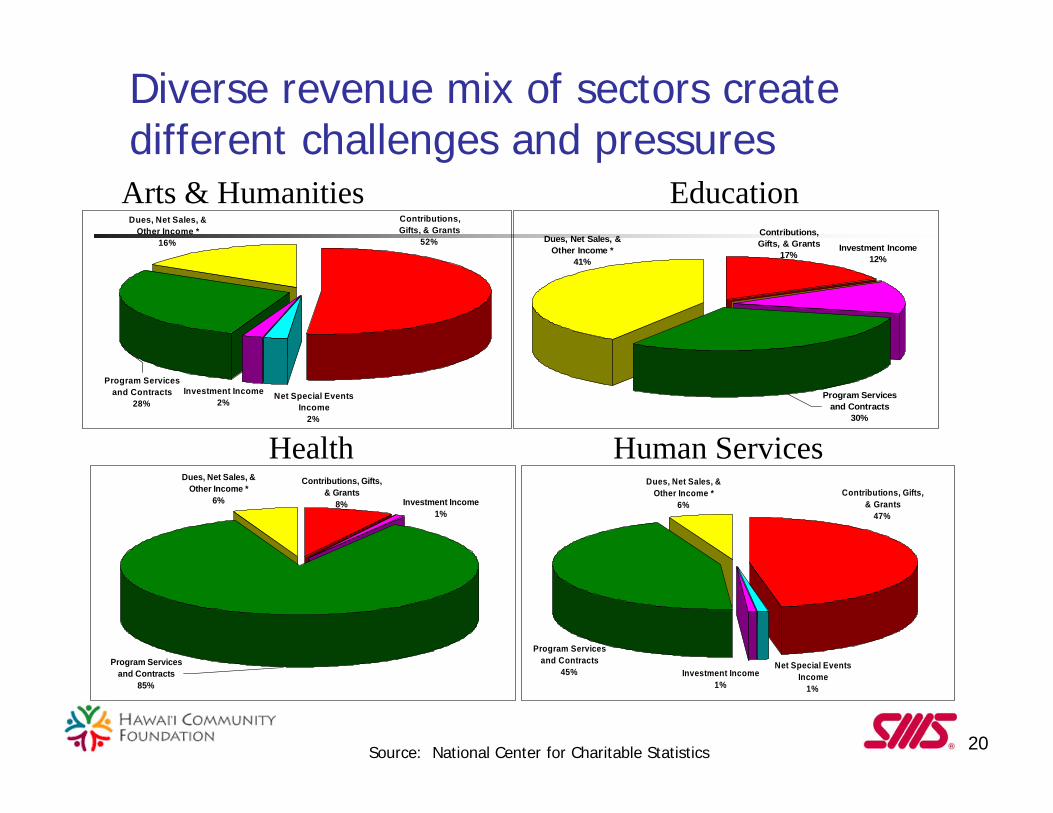
Diverse revenue mix of sectors create different challenges and pressures
Dues, Net Sales, & Other Income *
16%
Program Services and Contracts
28%Investment Income
2%Net Special Events
Income2%
Contributions, Gifts, & Grants
52%
Dues, Net Sales, & Other Income *
6%
Net Special Events Income
1%
Investment Income1%
Contributions, Gifts, & Grants
47%
Program Services and Contracts
45%
Program Services and Contracts
30%
Investment Income12%
Contributions, Gifts, & Grants
17%
Dues, Net Sales, & Other Income *
41%
Program Services and Contracts
85%
Investment Income1%
Dues, Net Sales, & Other Income *
6%
Contributions, Gifts, & Grants
8%
Arts & Humanities Education
Health Human Services
Source: National Center for Charitable Statistics

21
Revenue mix (continued)
Dues, Net Sales, & Other Income *
10%
Contributions, Gifts, & Grants
71%
Net Special Events Income
1%
Investment Income3%
Program Services and Contracts
15%
Program Services and Contracts
18% Investment Income3%
Contributions, Gifts, & Grants
51%
Dues, Net Sales, & Other Income *
28%
Net Special Events Income
1%
Investment Income8%
Program Services and Contracts
12%
Dues, Net Sales, & Other Income *
2% Contributions, Gifts, & Grants
77%
Dues, Net Sales, & Other Income *
1%
Program Services and Contracts
9%Net Special Events
Income1%
Investment Income1%
Contributions, Gifts, & Grants
88%
Environment & Animals Public & Societal Benefit
International Religion Related
Source: National Center for Charitable Statistics

22
Sources of revenue
16%
7%
34%
20%
4%
60%
15%
43%
0%
10%
20%
30%
40%
50%
60%
70%
Contributions,Gifts, & Grants
InvestmentIncome
ProgramServices and
Contracts
Dues, NetSales, & Other
Income
20012004
Source: National Center for Charitable Statistics
23
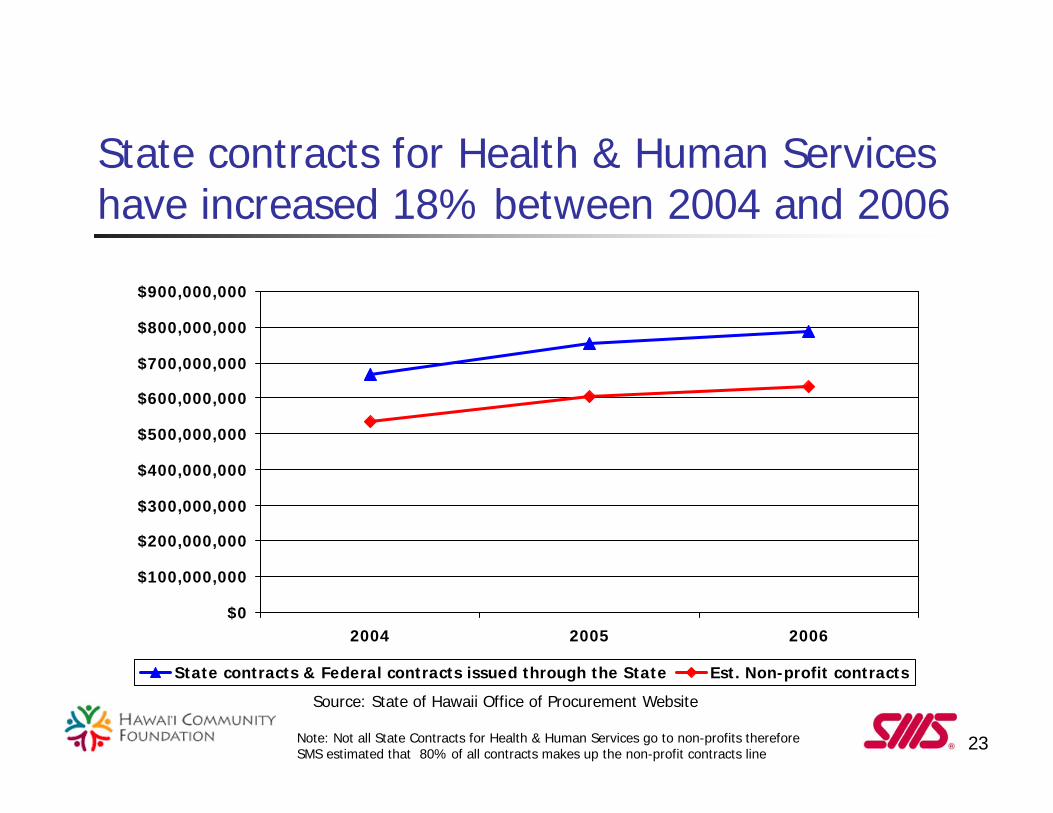
State contracts for Health & Human Services have increased 18% between 2004 and 2006
$0
$100,000,000
$200,000,000
$300,000,000
$400,000,000
$500,000,000
$600,000,000
$700,000,000
$800,000,000
$900,000,000
2004 2005 2006
State contracts & Federal contracts issued through the State Est. Non-profit contracts
Source: State of Hawaii Office of Procurement Website
Note: Not all State Contracts for Health & Human Services go to non-profits therefore SMS estimated that 80% of all contracts makes up the non-profit contracts line
24
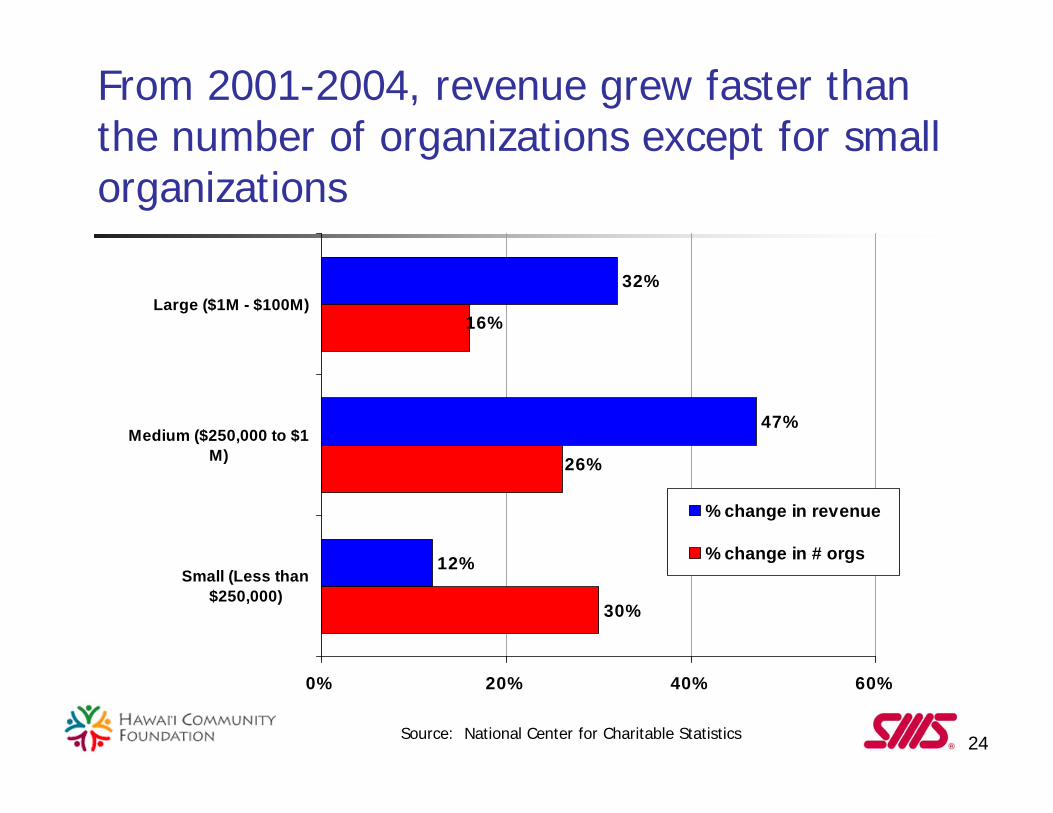
From 2001-2004, revenue grew faster than the number of organizations except for small organizations
32%
47%
12%
30%
16%
26%
0% 20% 40% 60%
Large ($1M - $100M)
Medium ($250,000 to $1M)
Small (Less than$250,000)
% change in revenue
% change in # orgs
Source: National Center for Charitable Statistics

25
Revenue challenges and opportunities
The numbers game Many more nonprofits, largely small Growth in contributions not keeping pace Affect certain sectors more than others
Implications Increase/diversify revenue segments Find creative means to contain expenses Are we reaching a carrying capacity issue?
26
Revenue challenges and opportunities
Revenue growth fueled by government Program services and contracts and grants Mostly affecting the H/HS sectors
Implications Efficiency/economies of scale important Changing mandates and short contracts make
focused mission more difficult Infrastructure investment required
27
Depending on who you are, growth may not be the answer
Many organizations feel compelled to grow—Why? Increase services and programs Strengthen financial condition Increase capacity by hiring staff Growth is an indicator of success

28
Different Organizational Characteristics
Small Organizations Narrow mission ED – hands on Few or no paid
employees Revenues more
reliant on donations Outcomes easy to
measure, but no funding to support
Large Organizations Broader mission, some
drift EDs more managerial Paid ED/Staff Revenues more reliant
on program services & contracts
Outcomes more difficult to measure, but required for funding
29
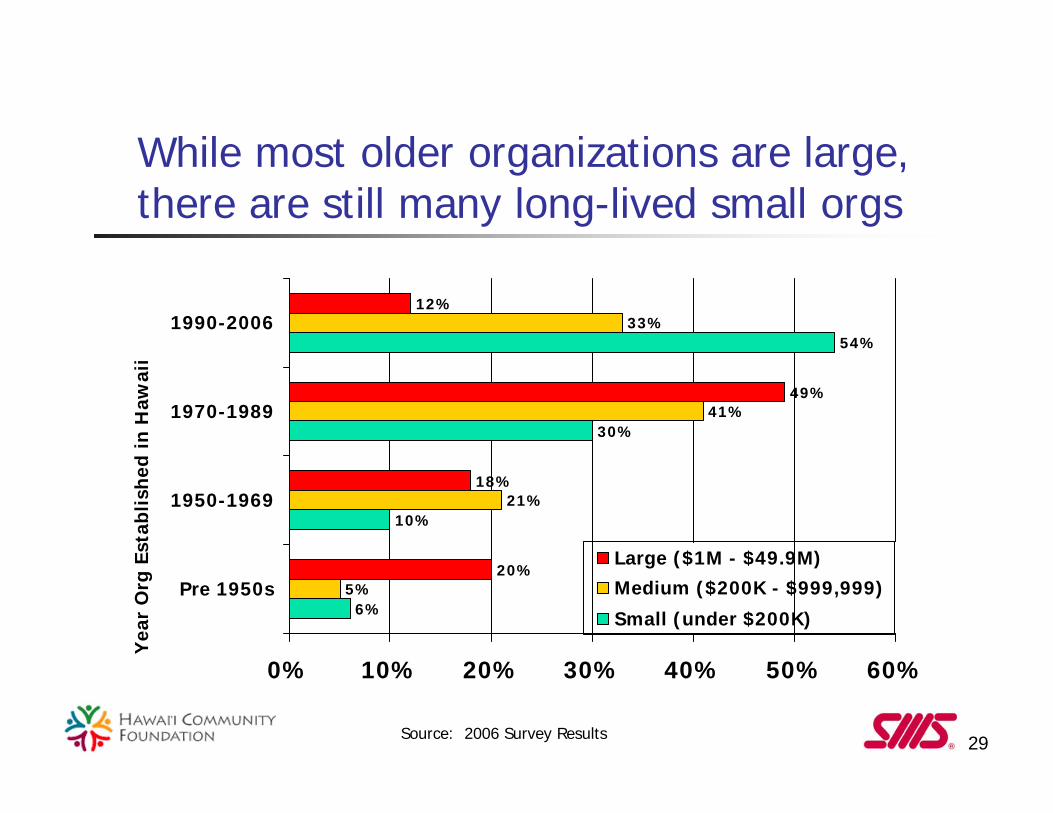
While most older organizations are large, there are still many long-lived small orgs
6%
10%
30%
54%
5%
21%
41%
33%
20%
18%
49%
12%
0% 10% 20% 30% 40% 50% 60%
Pre 1950s
1950-1969
1970-1989
1990-2006
Yea
r O
rg E
stab
lishe
d in
Haw
aii
Large ($1M - $49.9M)Medium ($200K - $999,999)
Small (under $200K)
Source: 2006 Survey Results

30
Small orgs have better indicators of financial wellness than medium size orgs
0% 10% 20% 30% 40% 50% 60%
Low
Medium
High
Fina
ncia
l Wel
lnes
s Le
vel
Large ($1M - $50M)
Medium ($200K-$1M)
Small (under $200K)
Source: GuideStar and 2006 Survey results. Significant difference (p=0.000)
31
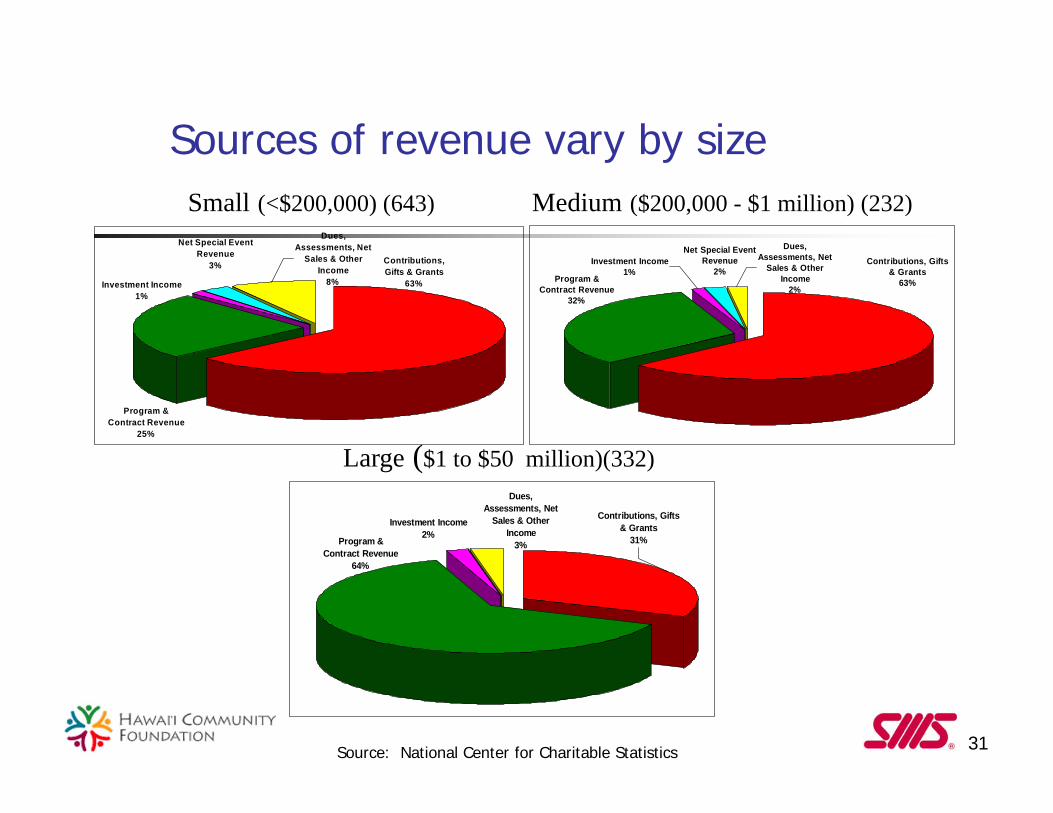
Sources of revenue vary by size
Program & Contract Revenue
25%
Dues, Assessments, Net
Sales & Other Income
8%
Contributions, Gifts & Grants
63%Investment Income1%
Net Special Event Revenue
3%
Net Special Event Revenue
2%Investment Income
1%Program &
Contract Revenue32%
Contributions, Gifts & Grants
63%
Dues, Assessments, Net
Sales & Other Income
2%
Program & Contract Revenue
64%
Dues, Assessments, Net
Sales & Other Income
3%
Investment Income2%
Contributions, Gifts & Grants
31%
Small (<$200,000) (643) Medium ($200,000 - $1 million) (232)
Large ($1 to $50 million)(332)
Source: National Center for Charitable Statistics

32
Challenges of growth
Depending on the revenue source to fuel growth, it can stress organizational capacity, mission, systems, financial health, culture
Implications Be clear about benefits/outcomes Clear plan for investments and changes Think before you grow
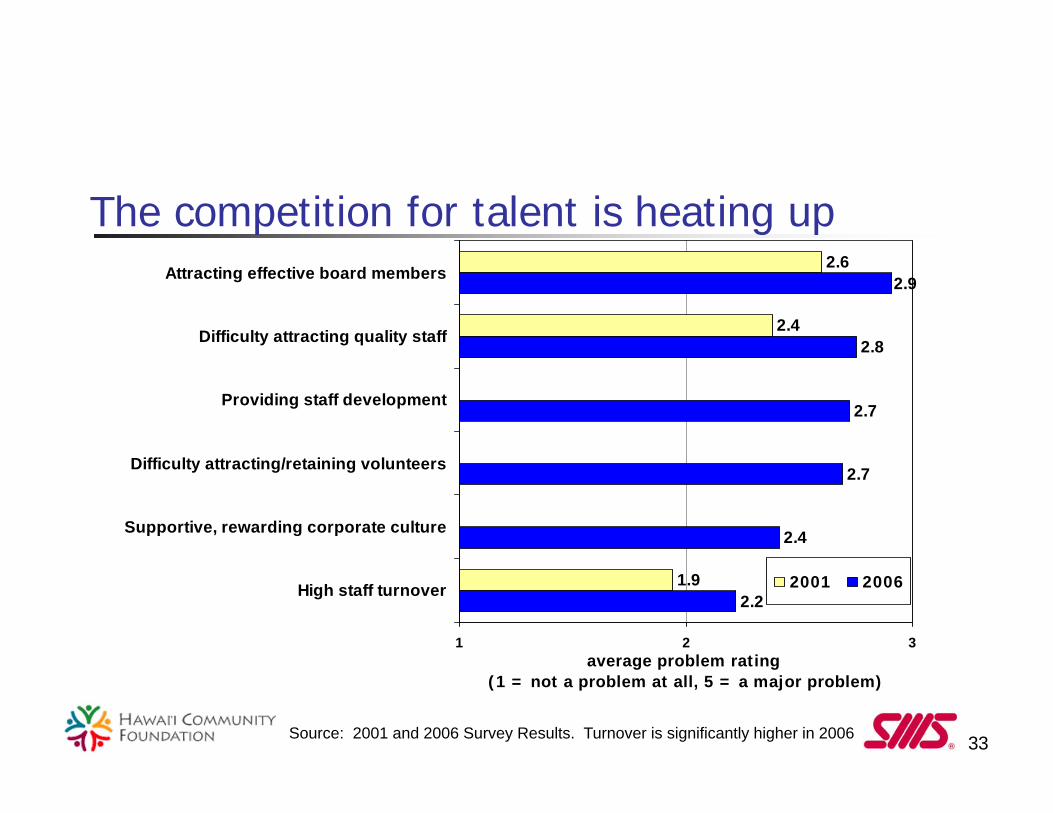
33
The competition for talent is heating up 2.6
2.4
1.9
2.9
2.8
2.7
2.7
2.4
2.2
1 2 3
Attracting effective board members
Difficulty attracting quality staff
Providing staff development
Difficulty attracting/retaining volunteers
Supportive, rewarding corporate culture
High staff turnover
average problem rating (1 = not a problem at all, 5 = a major problem)
2001 2006
Source: 2001 and 2006 Survey Results. Turnover is significantly higher in 2006

34
Half of all nonprofit EDs are 55 years or older
0%
1%
13%
36%
38%
12%
0% 10% 20% 30% 40%
18-24
25-34
35-44
45-54
55-64
65 or older
Source: 2006 Survey Results
35
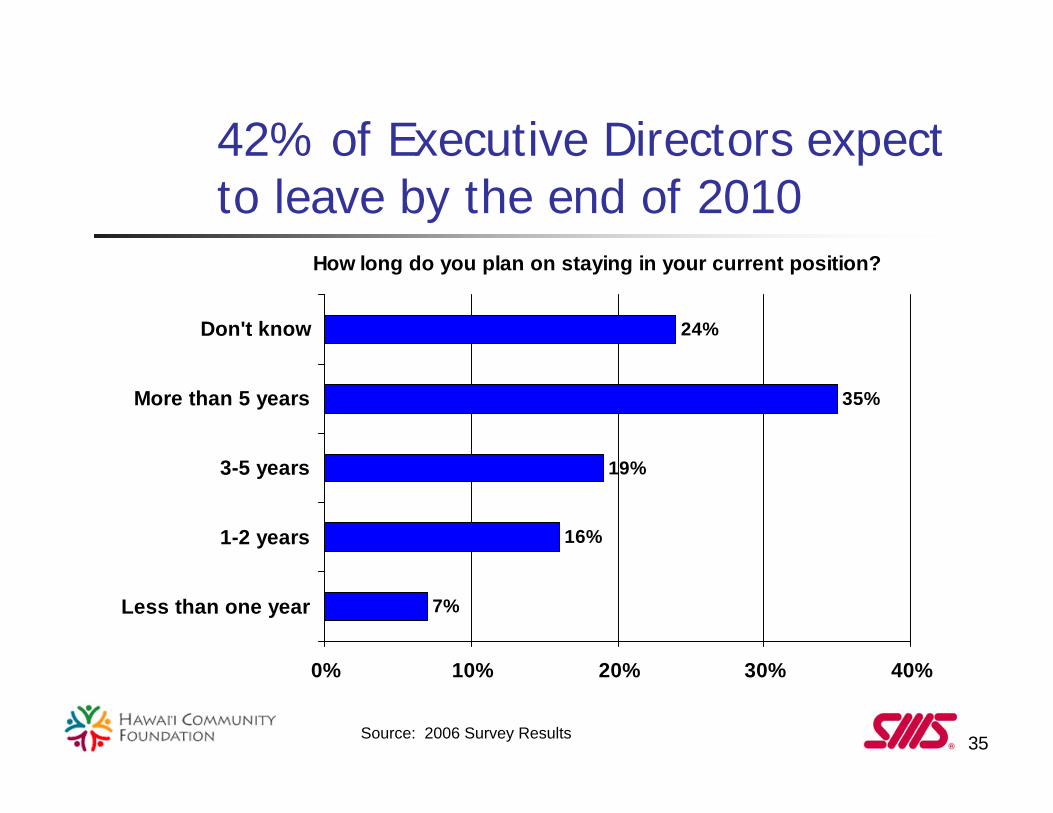
42% of Executive Directors expect to leave by the end of 2010
How long do you plan on staying in your current position?
7%
16%
19%
35%
24%
0% 10% 20% 30% 40%
Less than one year
1-2 years
3-5 years
More than 5 years
Don't know
Source: 2006 Survey Results
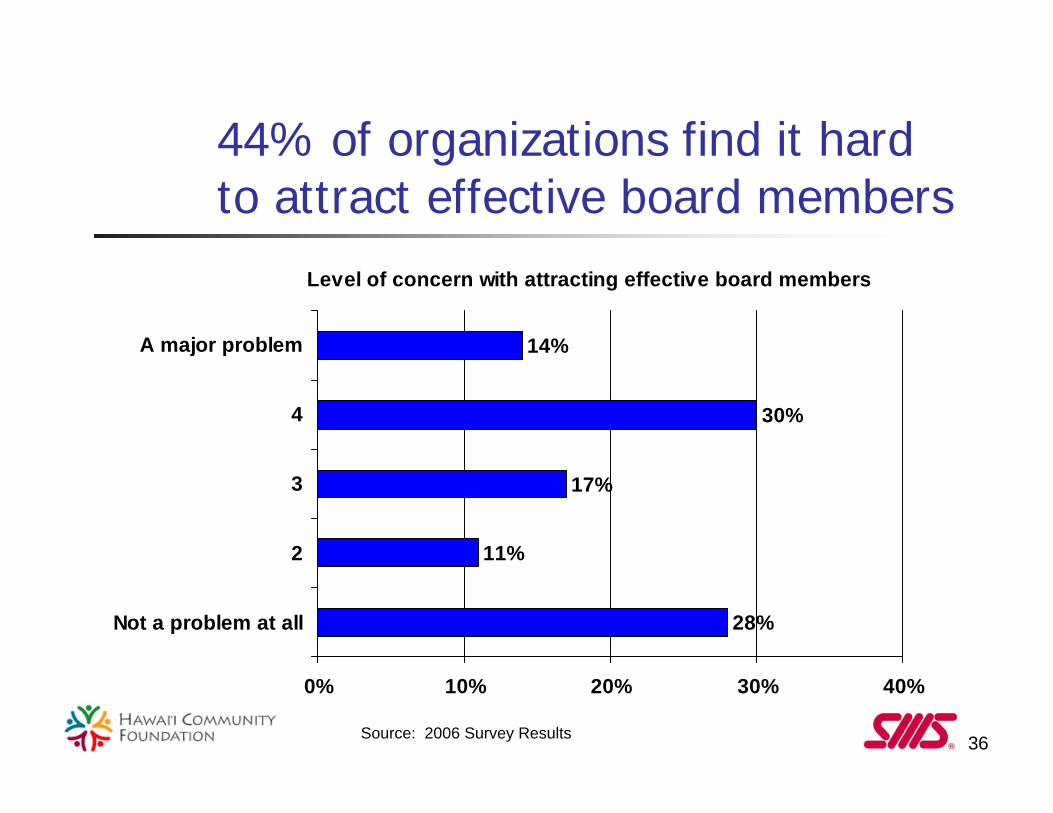
36
44% of organizations find it hard to attract effective board members
Level of concern with attracting effective board members
28%
11%
17%
30%
14%
0% 10% 20% 30% 40%
Not a problem at all
2
3
4
A major problem
Source: 2006 Survey Results

37
Number of board members: 13 Number of vacancies: 2-3 About half have term limits Length of term limits: 3-4 yrs Most current board members have
served for 3-6 years
Source: 2006 Survey Results
The law of averages for boards
38
Implications in the competition for talent
Retention as important as recruitment Finding ways to increase tenure of
leadership (staff and board)
New leadership will come from two sources Younger, civic-minded individuals Baby boomers
Mahalo!
Presentation available at: www.hawaiicommunityfoundation.org


