Page 1
THE IMPACT OF THE DOWNWARD ADJUSTMENT OF FLUORIDE
CONCENTRATION IN THE MALAYSIAN PUBLIC WATER SUPPLY
ON DENTAL FLUOROSIS AND CARIES
Nor Azlida Mohd Nor
Submitted in partial fulfillment of the requirements
for the degree of Doctor of Philosophy
AUGUST 2017
CARDIFF UNIVERSITY
Page 2
i
DECLARATION
This work has not been submitted in substance for any other degree or award at this or any
other university or place of learning, nor is being submitted concurrently in candidature for any
degree or other award.
Signed ………………………………………… (candidate) Date………………………
STATEMENT 1
This thesis is being submitted in partial fulfilment of the requirements for the degree of PhD.
Signed ………………………………………… (candidate) Date ………………………
STATEMENT 2
This thesis is the result of my own independent work/investigation, except where otherwise
stated, and the thesis has not been edited by a third party beyond what is permitted by Cardiff
University’s Policy on the Use of Third Party Editors by Research Degree Students. Other
sources are acknowledged by explicit references. The views expressed are my own.
Signed ………………………………………… (candidate) Date ………………………
STATEMENT 3
I hereby give consent for my thesis, if accepted, to be available online in the University’s Open
Access repository and for inter-library loan, and for the title and summary to be made available
to outside organisations.
Signed ………………………………………… (candidate) Date ……………………
STATEMENT 4
I hereby give consent for my thesis, if accepted, to be available online in the University’s Open
Access repository and for inter-library loans after expiry of a bar on access previously
approved by the Academic Standards & Quality Committee.
Signed ………………………………………… (candidate) Date ………………………
1/8/2017
1/8/2017
1/8/2017
1/8/2017
1/8/2017
Page 3
ii
ACKNOWLEDGEMENT
First and foremost, I thanked God for the opportunity given to pursue my PhD at Cardiff
University. Thank you to my sponsors, the University of Malaya and the Ministry of
Higher Education, Malaysia for the financial support.
I would like to express my deepest gratitude to my supervisor, Prof Ivor Chestnutt and
Prof Barbara Chadwick for their thorough feedback, valuable support, encouragement,
and constant guidance towards the completion of this thesis. I also would like to thank
Dr Damian Farnell for his statistical advice and support.
A very special thank you to Rhianon Jones, Maria Morgan and Jess Brewster for a special
friendship that we developed throughout my stay in Cardiff. Also thank you to the current
and previous members of the department Applied Clinical Research and Public Health
for making this PhD journey so enjoyable and meaningful.
I wish to extend my appreciation to my colleagues and member of staff in the University
of Malaya and the Ministry of Health for their cooperation and support throughout my
PhD journey.
I would like to acknowledge the parents and children that took part in this study. Also to
the school teachers that involved in questionnaire distribution and school visits during
clinical examinations. A big thank you to my assistants during my fieldwork. Their
contribution is invaluable.
Finally, special thanks to the most important people in my life, family and friends. To
my husband thank you for your patience and encouragement throughout this process. To
my parents, Mak and Ayah, thank you for being amazing parents and I couldn’t make it
this far without you! To my daughter, Ariana you are the greatest motivation in the final
months of this project! And to my siblings, close family and friends thank you for your
endless love and support.
Thank you again to those who have made contribution towards the successful completion
of this study.
Page 4
iii
SUMMARY
In Malaysia, the public water supply has been artificially fluoridated since 1972 at an
optimum level of 0.7 ppm fluoride as a public health measure to control dental caries.
However, concerns arose that a fluoride concentration of 0.7 ppm was too high given
increasing exposure to other sources of fluoride. That prompted a downward adjustment
of the fluoride concentration from 0.7 to 0.5 ppm in 2005. In addition to Malaysia, there
has recently been a movement towards the downward adjustment of fluoride
concentration in the water in the United States, Hong Kong, Singapore and Ireland.
However, little is known about the impact of such adjustments on oral health.
This thesis aimed to evaluate the outcome of the downward adjustment of fluoride
concentration in the Malaysian public water supply from 0.7 to 0.5 ppm in relation to
dental fluorosis and dental caries.
Two projects were conducted. The first project comprised a systematic review to
critically appraise the literature on stopping the addition of fluoride or reducing the level
of fluoride in public water supply on dental caries and fluorosis. This review highlighted
the gaps in knowledge and several methodological issues such as lack of examiner
blinding and control of confounders.
The second project was a cross sectional survey involving life-long residents aged 9 and
12 year-olds in fluoridated and non-fluoridated areas in Malaysia (n=1155). In the
fluoridated area, children aged 12 years and 9 years were exposed to 0.7 and 0.5 ppmF
respectively at the times when maxillary central incisors enamel developed. Fluoride
exposures were assessed by questionnaire. Standardized photographs of maxillary central
incisors were blind scored for fluorosis using Dean’s Index. Caries prevalence was
examined using ICDAS-II criteria. The key findings indicated that the change in fluoride
Page 5
iv
level from 0.7 to 0.5 ppm has reduced fluorosis and maintains caries preventive effect.
The change in fluoridation concentration has also had a significant impact on caries
prevalence at different thresholds of severity.
The findings support the policy initiative of a lower fluoride concentration in the
Malaysian public water supply. It also highlights the need for modification of oral health
advice with regards to fluoride exposure in maximising caries prevention while
minimising fluorosis.
Page 6
v
Table of Contents 1 Introduction and literature review ............................................................................ 1
Introduction to the thesis .................................................................................. 1
Literature review .............................................................................................. 2
1.2.1 Fluoride and oral health ................................................................................ 2
1.2.2 Dental Fluorosis ......................................................................................... 13
1.2.3 Dental Caries .............................................................................................. 36
1.2.4 Overview of fluoride exposure and caries prevention approach in Malaysia
44
2 The impact of stopping the addition or reducing the level of fluoride in public
water supply: a systematic review .................................................................................. 48
Introduction .................................................................................................... 48
Aims ............................................................................................................... 51
Review Questions ........................................................................................... 51
Materials and Methods ................................................................................... 52
2.4.1 Water fluoridation cessation and dental caries and fluorosis ..................... 52
2.4.2 Type of interventions ................................................................................. 52
2.4.3 Reduction of fluoride in the water on dental caries and dental fluorosis ... 53
Search Methods for Identification of Studies ................................................. 55
2.5.1 Electronic searches ..................................................................................... 55
2.5.2 Data collection and analysis ....................................................................... 56
Selection of studies ................................................................................. 56
2.5.3 Data synthesis and outcome measurement ................................................. 59
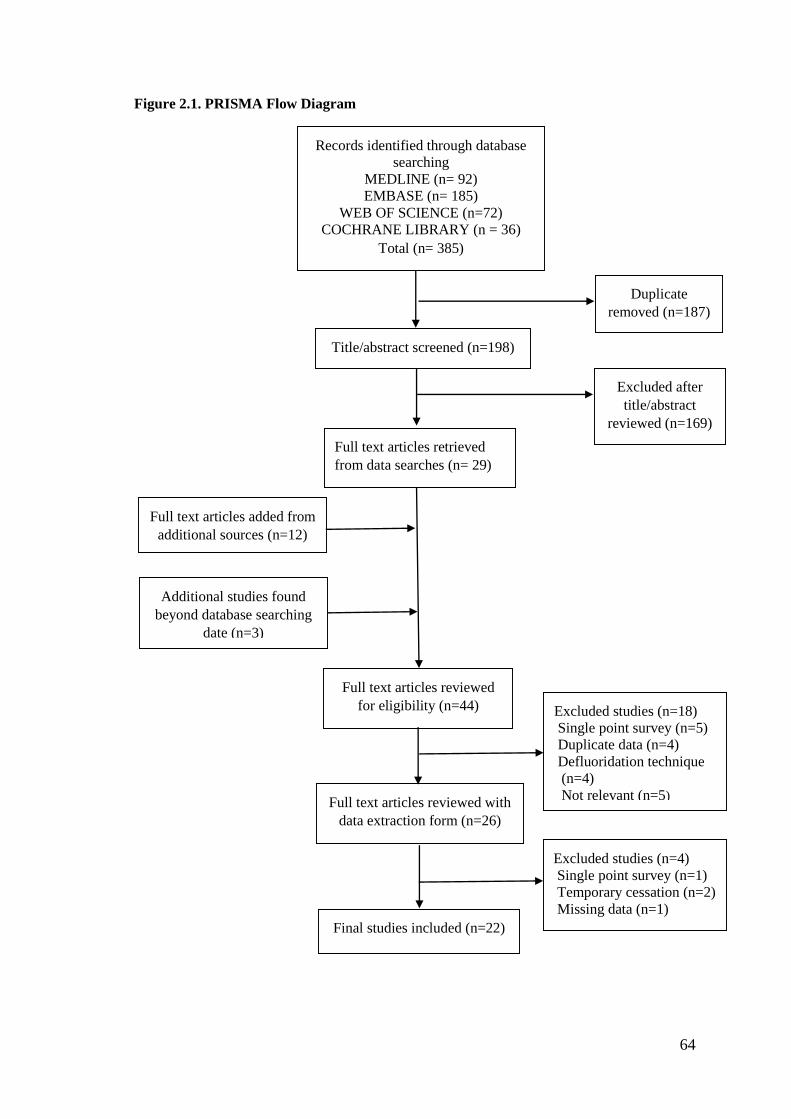
Results ............................................................................................................ 63
2.6.1 Results of the search ................................................................................... 63
2.6.2 Included studies .......................................................................................... 65
2.6.3 Excluded studies ......................................................................................... 69
2.6.4 Date and reasons for change in fluoride level ............................................ 71
2.6.5 Results synthesis ........................................................................................ 71
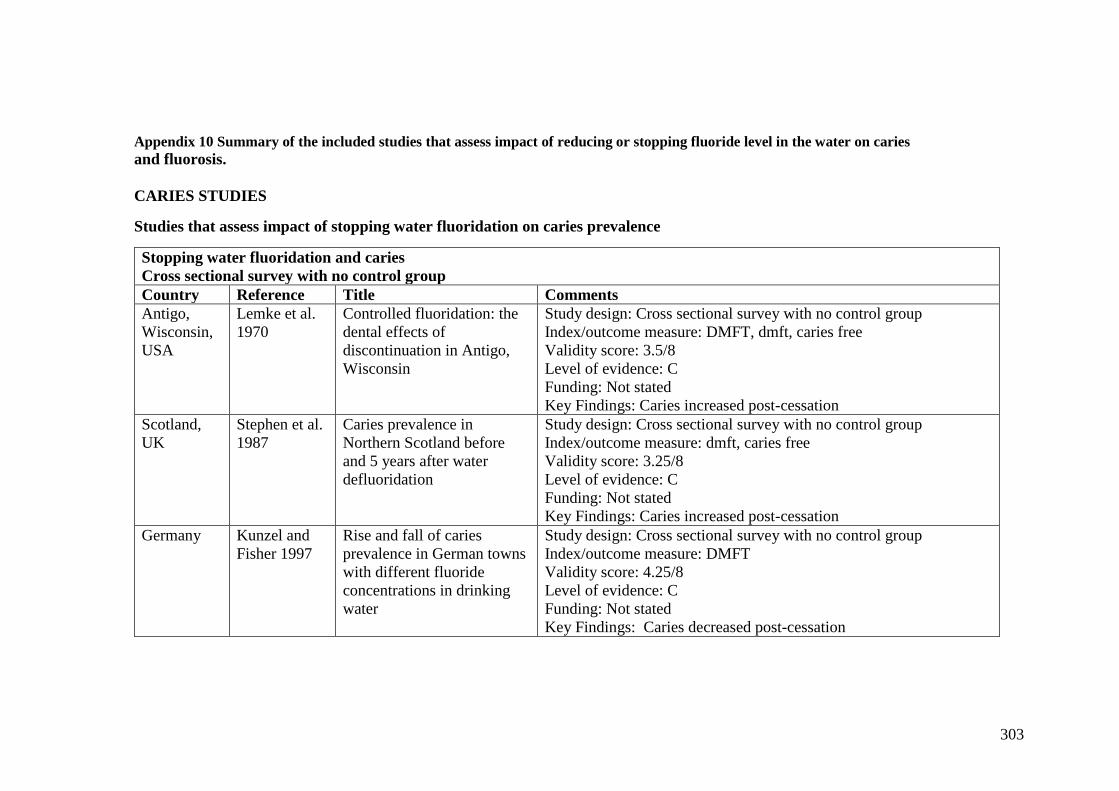
2.6.6 Studies reporting the impact of changes in fluoride level on dental caries 72
2.6.7 The impact of reducing fluoride content of the water supply on caries
prevalence ............................................................................................................... 88
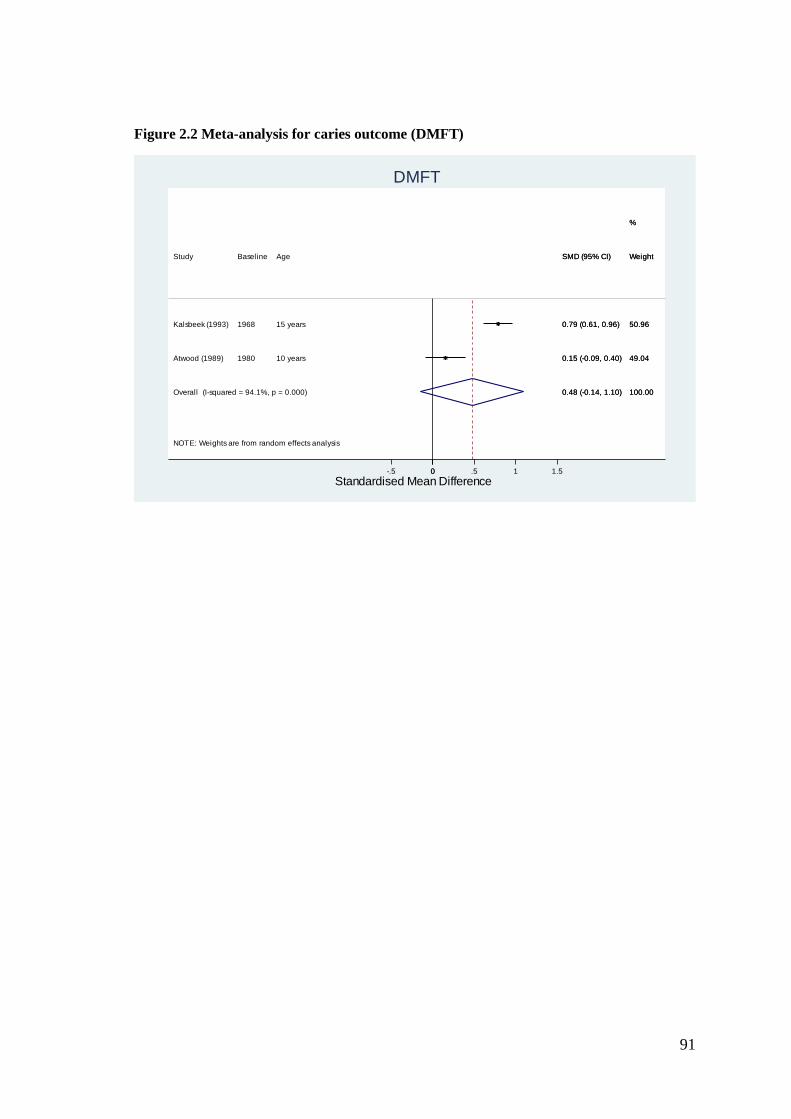
2.6.8 A meta-analysis to examine the relationship between change in fluoride
level and caries ....................................................................................................... 90
2.6.9 Studies reporting the impact on change in fluoridation status on the
prevalence of fluorosis ........................................................................................... 93
Page 7
vi
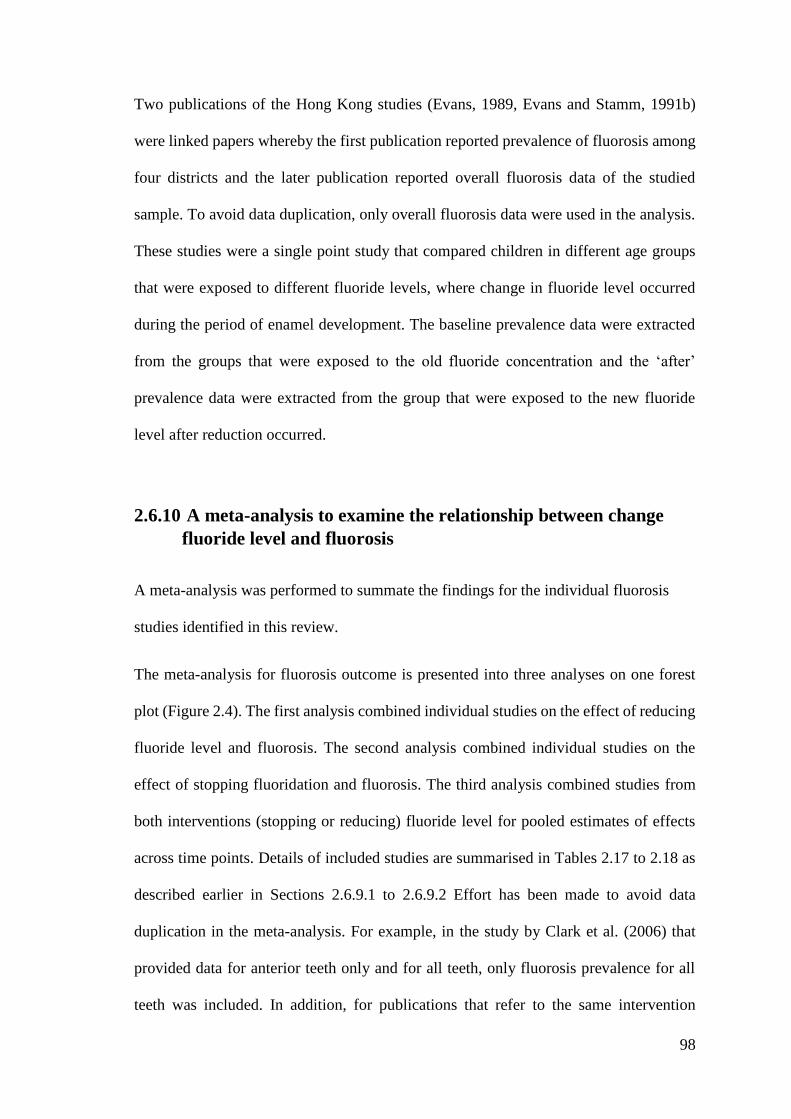
2.6.10 A meta-analysis to examine the relationship between change fluoride
level and fluorosis .................................................................................................. 98
Discussion .................................................................................................... 100
2.7.1 Quality of evidence .................................................................................. 100
2.7.2 Agreements and disagreements with other reviews and published work . 101
2.7.3 Implications for future research and recommendations ........................... 106
2.7.4 Strengths and limitations .......................................................................... 108
Conclusions .................................................................................................. 109
Chapter summary ......................................................................................... 110
3 Study rationale, research questions, aims and objectives ..................................... 111
Introduction .................................................................................................. 111
Study rationale .............................................................................................. 111
Research questions ....................................................................................... 113
Aims ............................................................................................................. 114
Objectives ..................................................................................................... 114
4 Materials and methods ......................................................................................... 115
Study design ................................................................................................. 115
Study population .......................................................................................... 115
Research site ................................................................................................. 115
Sample population, sample size and method of sample selection ................ 117
4.4.1 Sample population .................................................................................... 117
4.4.2 Sample size estimation ............................................................................. 121
4.4.3 Method of sample recruitment ................................................................. 122
Conduct of study .......................................................................................... 125
Data collection instrument and methods of execution ................................. 127
4.6.1 Child identification code .......................................................................... 127
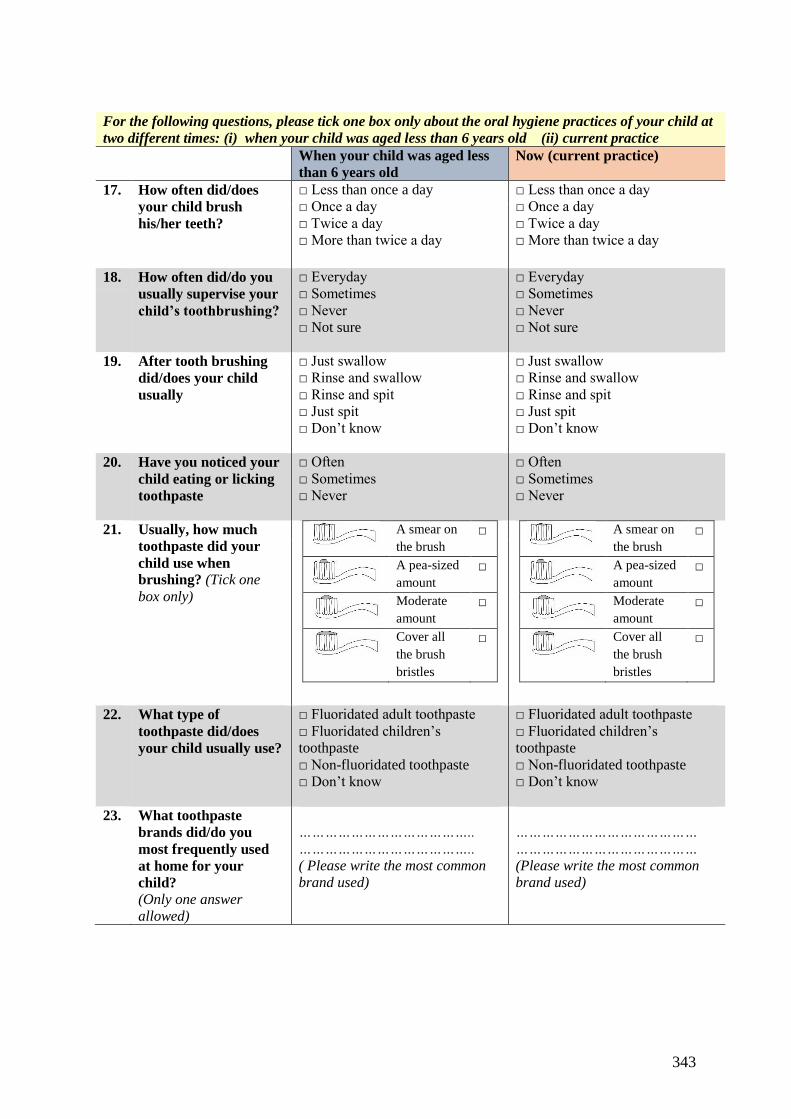
4.6.2 Final questionnaire ................................................................................... 127
4.6.3 Questionnaire distribution ........................................................................ 127
4.6.4 Consent ..................................................................................................... 128
4.6.5 Assessment of subject eligibility .............................................................. 129
4.6.6 Clinical examination ................................................................................ 129
4.6.7 Photographic examination ........................................................................ 133
Data management and statistical analysis .................................................... 135
4.7.1 Data management ..................................................................................... 135
4.7.2 Statistical analysis .................................................................................... 138
Page 8
vii
Pilot study ..................................................................................................... 146
4.8.1 Questionnaire ........................................................................................... 146
Results of the pilot study .............................................................................. 149
4.9.1 Internal reliability of the questionnaire .................................................... 149
4.9.2 Examiner reliability for caries assessment ............................................... 149
4.9.3 Examiner reliability for fluorosis assessment .......................................... 150
Ethical considerations .................................................................................. 152
4.10.1 Data confidentially and security ........................................................... 152
4.10.2 Token of appreciation for participant ................................................... 153
5 Results .................................................................................................................. 154
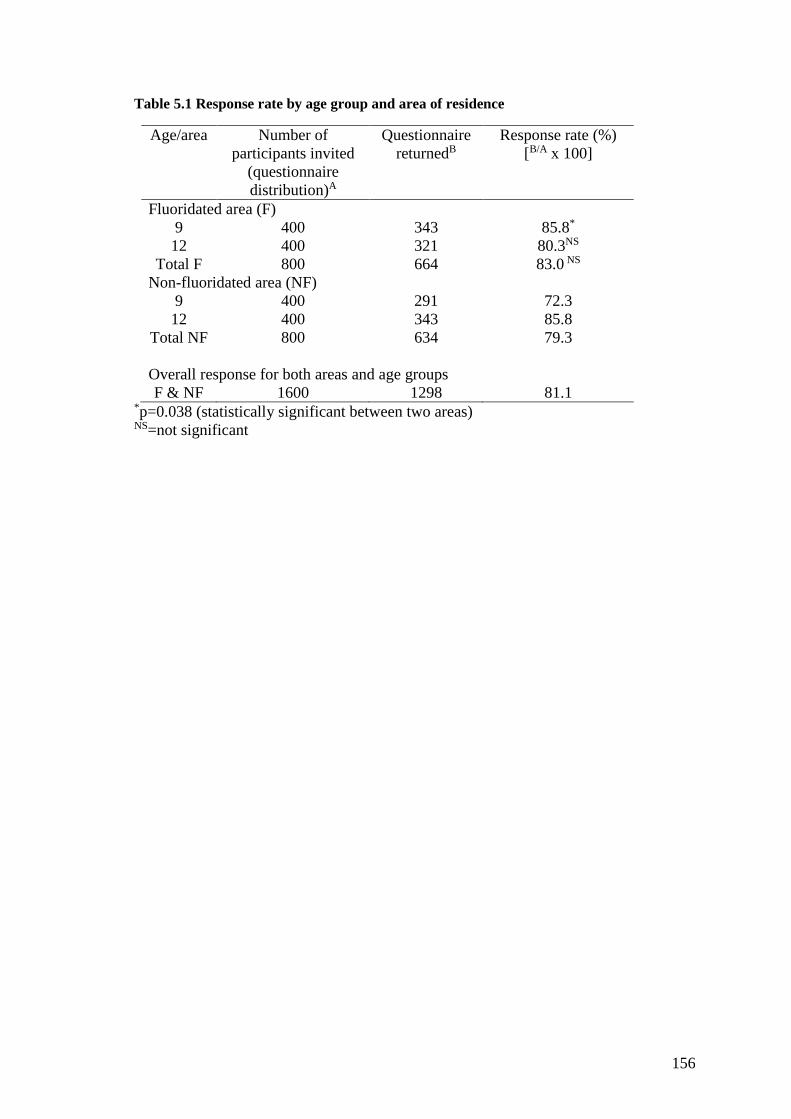
Response rate and description of study participants .................................... 155
5.1.1 Response rate ............................................................................................ 155
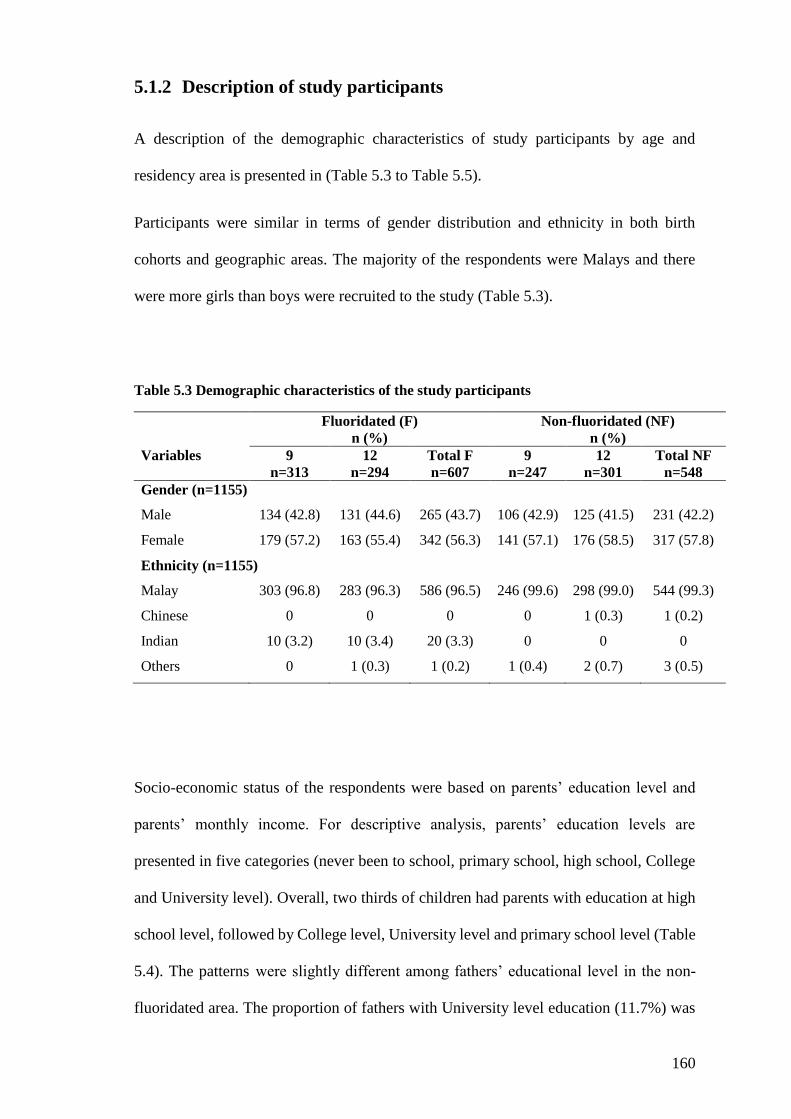
5.1.2 Description of study participants .............................................................. 160
Descriptive analysis on fluoride exposure from water, infant feeding
practices, oral hygiene habits and fluoride varnish/gel in study participants ........... 163
5.2.1 Exposure to fluoride from water .............................................................. 163
5.2.2 Sources of drinking water and use of water filters at home ..................... 165
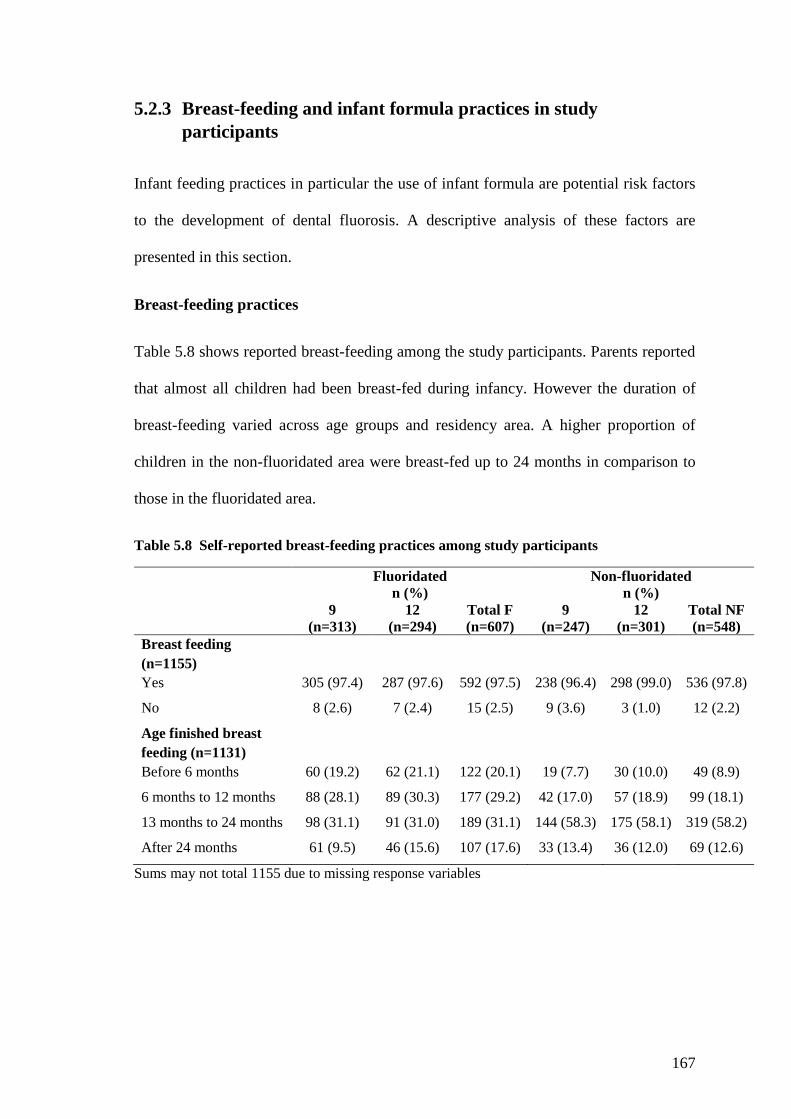
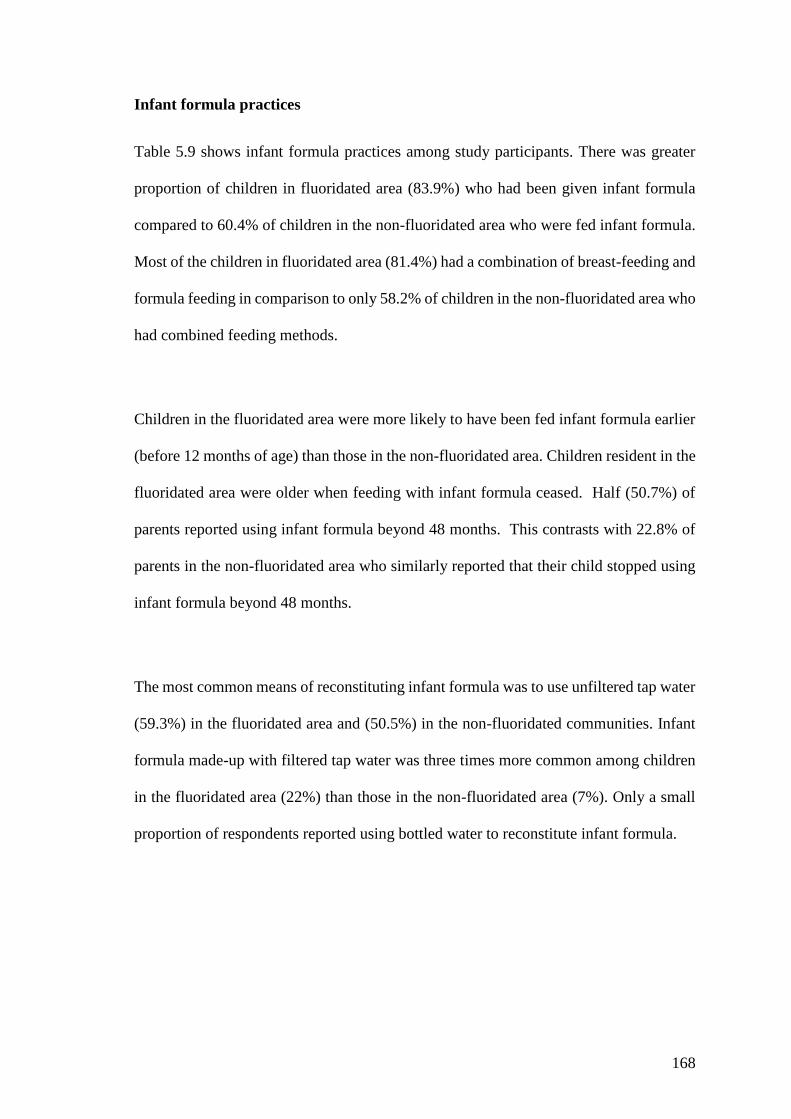
5.2.3 Breast-feeding and infant formula practices in study participants ........... 167
5.2.4 Age started toothbrushing and age exposed to fluoridated toothpaste in the
study participants .................................................................................................. 170
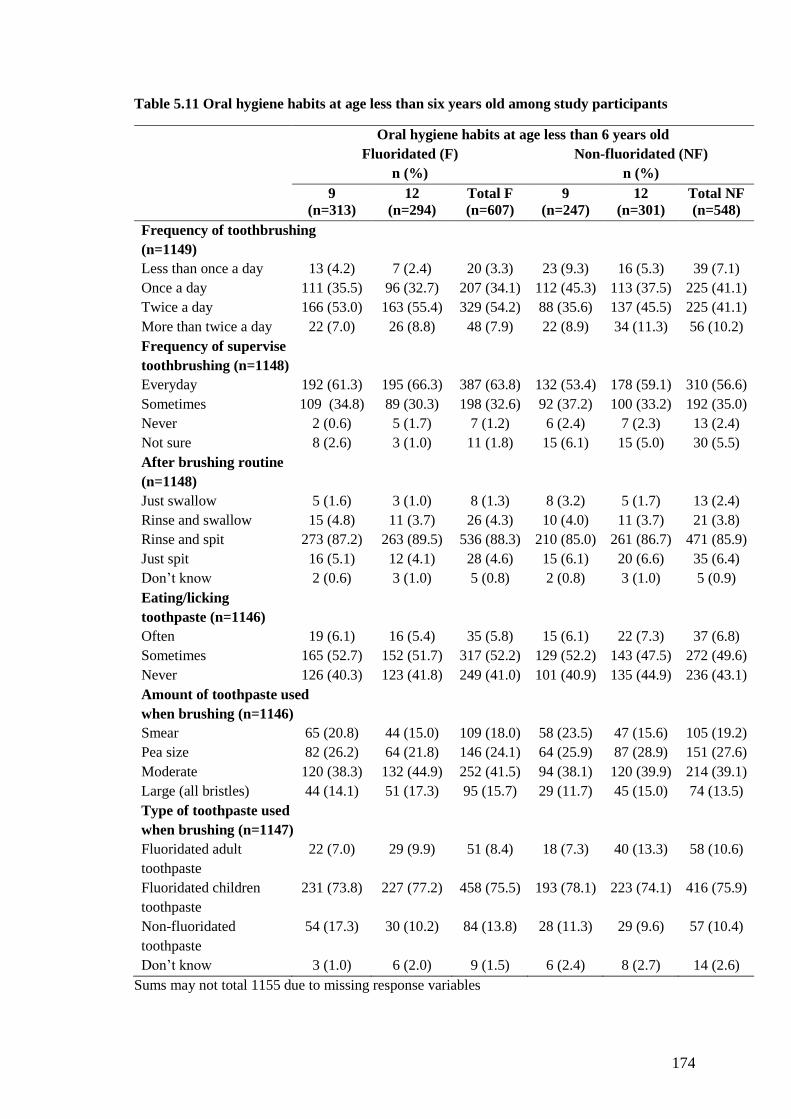
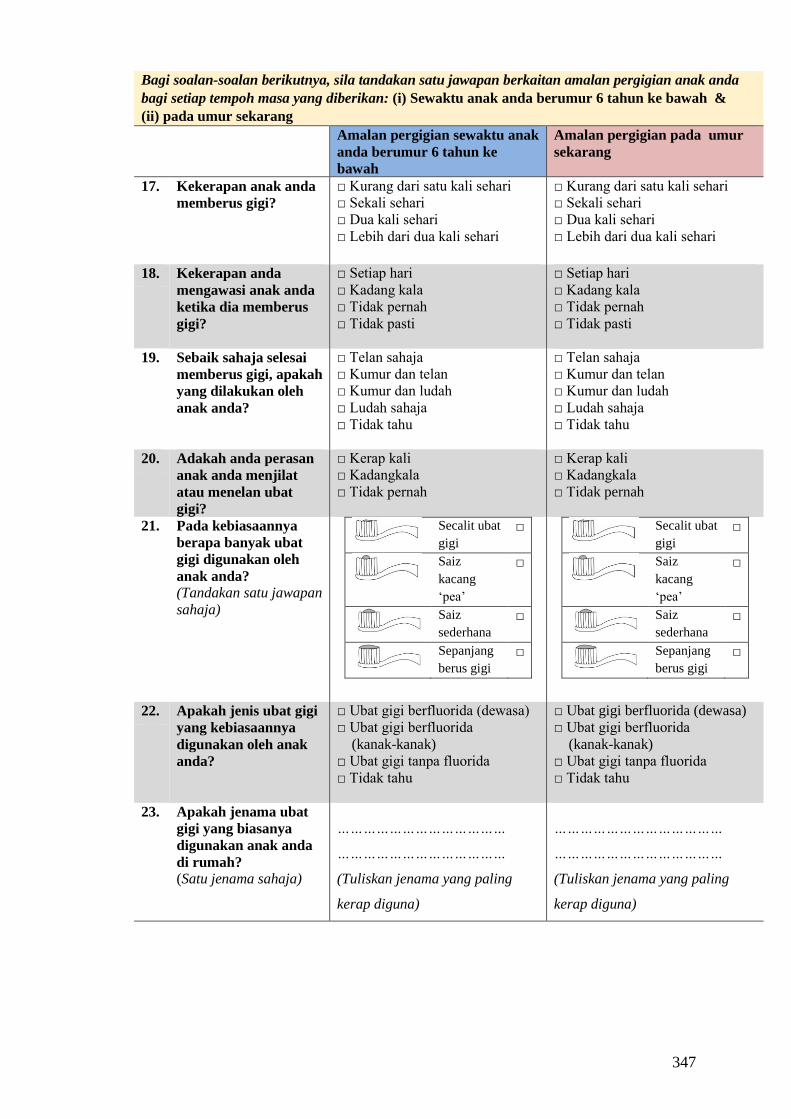
5.2.5 Oral hygiene habits when were aged less than six years-old ................... 172
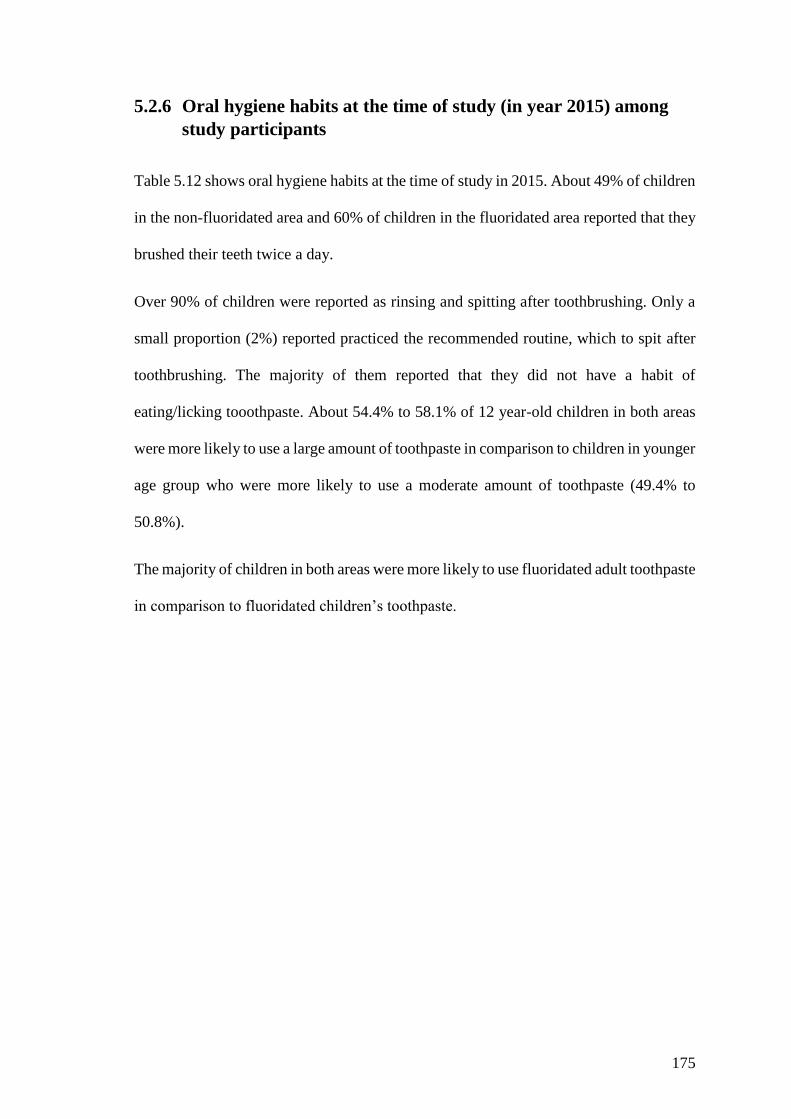
5.2.6 Oral hygiene habits at the time of study (in year 2015) among study
participants ........................................................................................................... 175
5.2.7 Exposure to fluoride varnish/gel .............................................................. 177
Dental fluorosis ............................................................................................ 178
5.3.1 The prevalence and severity of dental fluorosis among study participants
178
5.3.2 The relationship between risk factors and dental fluorosis ...................... 182
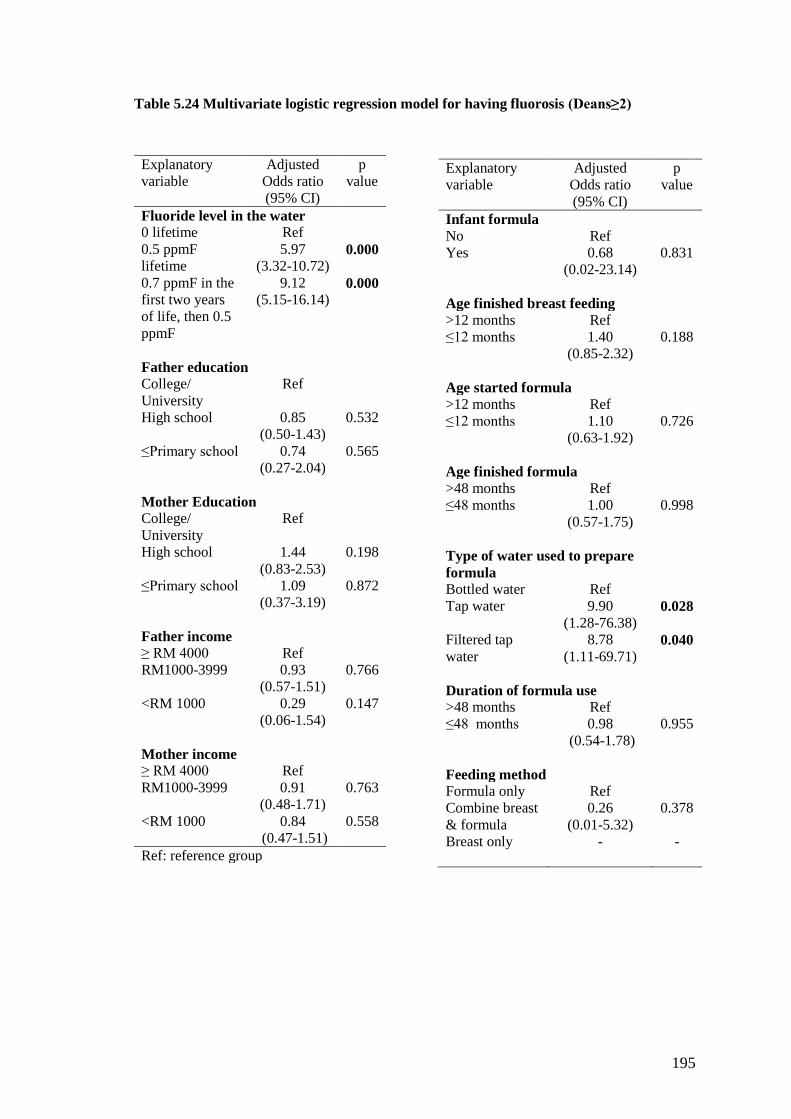
5.3.3 Multivariate logistic regression models for having fluorosis (Deans≥2) . 194
Dental Caries ................................................................................................ 196
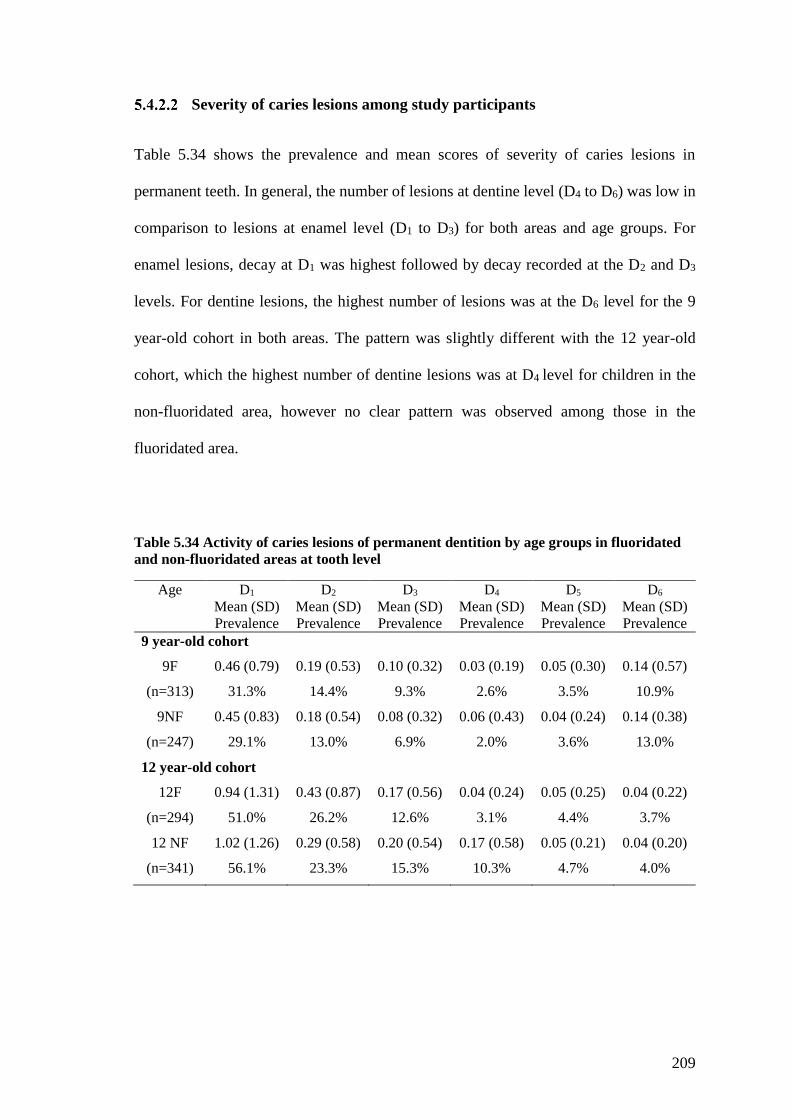
5.4.1 Prevalence and severity of dental caries in study participants ................. 196
5.4.2 Mean caries experience in the primary dentition of study participants .... 203
5.4.3 The relationship between risk factors and dental caries ........................... 211
5.4.4 Logistic regression models for having dental caries ................................ 228
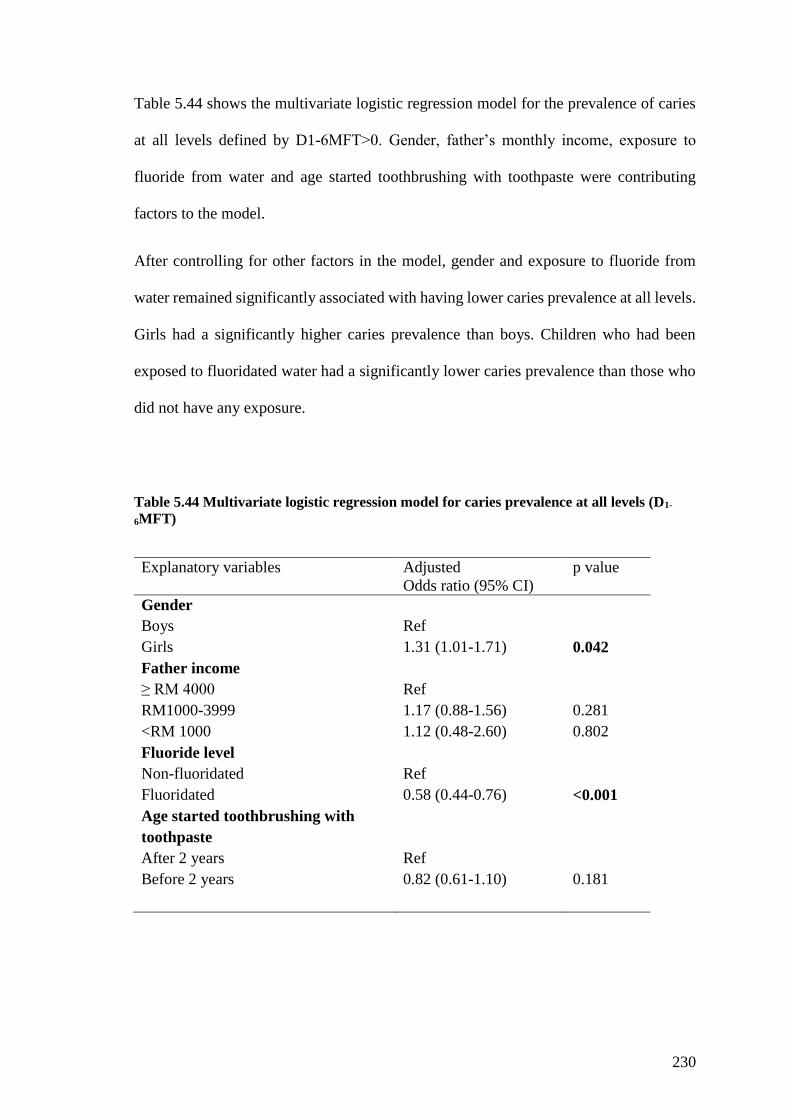
5.5 Summary of key findings ................................................................................... 231
6 Discussion ............................................................................................................ 233
Page 9
viii
Key findings ................................................................................................. 233
Systematic review ........................................................................................ 233
Main study .................................................................................................... 234
6.3.1 The prevalence and severity of dental fluorosis following reduction of
fluoride level in the public water supply .............................................................. 234
6.3.2 Risk factors associated with fluorosis ...................................................... 238
6.3.3 The prevalence and severity of dental caries following reduction of
fluoride level in the water ..................................................................................... 241
6.3.4 Risk factors associated with dental caries ................................................ 245
6.3.5 Other factors ............................................................................................. 248
Methodological considerations, study strengths and limitations ................. 249
6.4.1 Methodological considerations ................................................................ 249
6.4.2 Study strengths and limitations ................................................................ 252
Chapter summary ......................................................................................... 262
7 Conclusions and study implications ..................................................................... 263
Conclusions .................................................................................................. 263
Study implications ........................................................................................ 267
7.2.1 Implications for policy and practice ......................................................... 267
7.2.2 Implications for future research ............................................................... 270
7.2.3 Recommendations .................................................................................... 272
References .................................................................................................................... 273
Appendices ................................................................................................................... 295
Page 10
ix
List of abbreviations
BLC Prof Barbara L. Chadwick (supervisor)
CAST Caries Assessment Spectrum and Treatment
CFI Community Fluorosis Index
CS Cross sectional survey
DDE Developmental defect of enamel
DFF Dr Damian F. Farnell (statistician)
DI Dean’s Index
DMFS/dmfs Decayed, missing, filling surfaces
DMFT/dmft Decayed, missing, filling teeth
F Fluoridated
FDI World Dental Federation
ICDAS International Caries Detection Assessment System
IGC Prof Ivor G. Chestnutt (supervisor)
MYR Malaysian Ringgit
NAMN Nor Azlida Mohd Nor (candidate)
n.d No date
NF Non-fluoridated
NHNES National Health and Nutrition Examination Survey
NSFEO National Survey of Fluoride Enamel Opacities
NIDR National Institute of Dental Research
NOHSS National Oral Health Survey of School Children
ppm Parts per million
ppmF Parts per million fluoride
PRISMA Preferred Reporting Items for Systematic Reviews and Meta-
Analyses
PUFA Pulp-Ulcer-Fistula-Abscess Index
Ref Reference group
SD Standard Deviation
SDS School dental service
SPSS Statistical Package for the Social Sciences
Page 11
x
STPM ‘Sijil Tinggi Pelajaran Malaysia’, Malaysian education
qualification which is equivalent to Pre-University certificate
TF Thylstrup-Fejerskov Index
TSIF Tooth surface index of fluorosis
UK United Kingdom
USA United States of America
USD United States Dollars
WHO World Health Organization
Page 12
xi
List of figures
Figure 2.1. PRISMA Flow Diagram .............................................................................. 64
Figure 2.2 Meta-analysis for caries outcome (DMFT)................................................... 91
Figure 2.3 Meta-analysis for caries outcome (DMFS) ................................................... 92
Figure 2.4 Meta-analysis for fluorosis outcome ............................................................. 99
Figure 4.1 Map of Malaysia ......................................................................................... 116
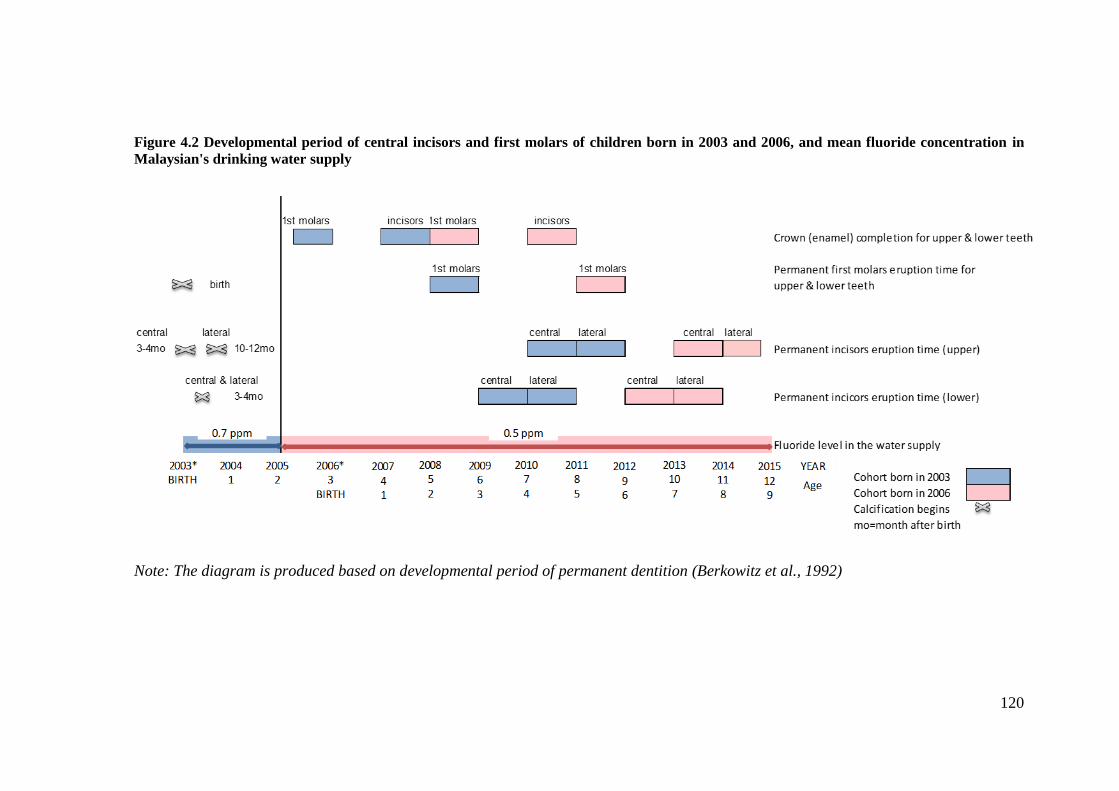
Figure 4.2 Developmental period of central incisors and first molars of children born in
2003 and 2006, and mean fluoride concentration in Malaysian's drinking water supply
...................................................................................................................................... 120
Figure 4.3 An overview of the overall conduct of study ............................................. 126
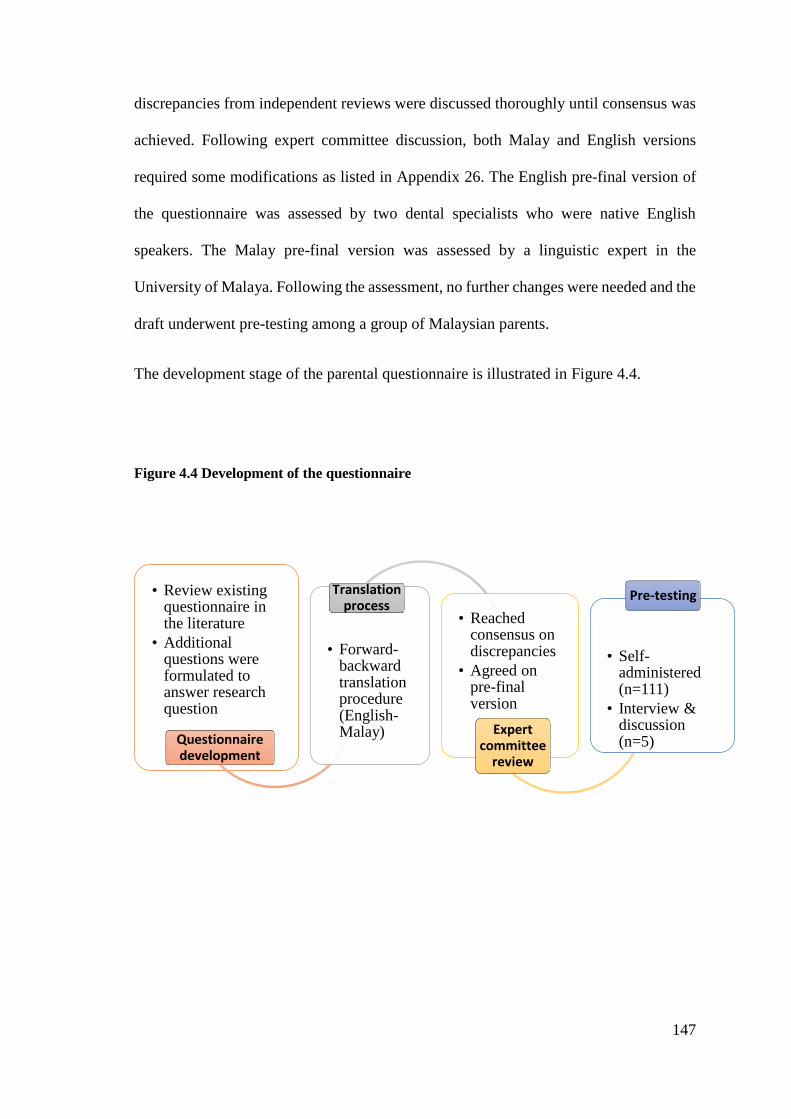
Figure 4.4 Development of the questionnaire .............................................................. 147
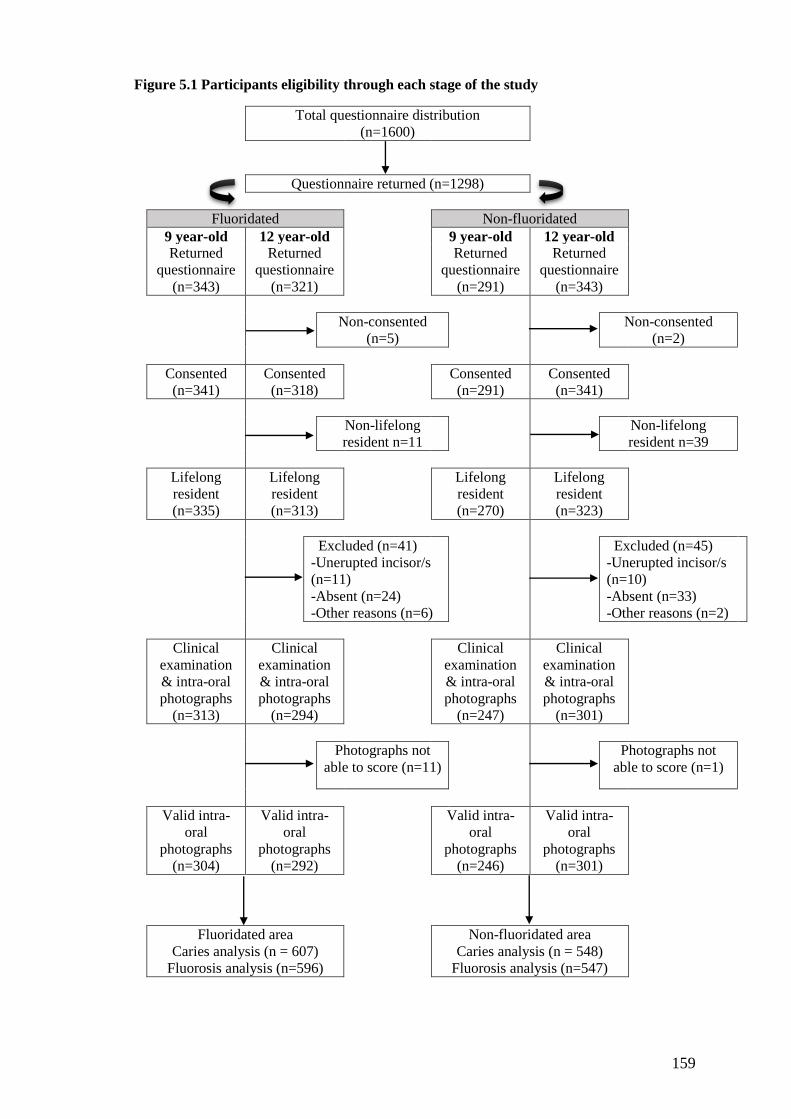
Figure 5.1 Participants eligibility through each stage of the study .............................. 159
Page 13
xii
List of tables
Table 1.1 Chronology of permanent teeth calcification and eruption .............................. 9
Table 1.2 Chronology of primary teeth calcification and eruption ................................ 10
Table 1.3 Window of a maximum susceptibility to the development of dental fluorosis
in the permanent maxillary central incisors ................................................................... 12
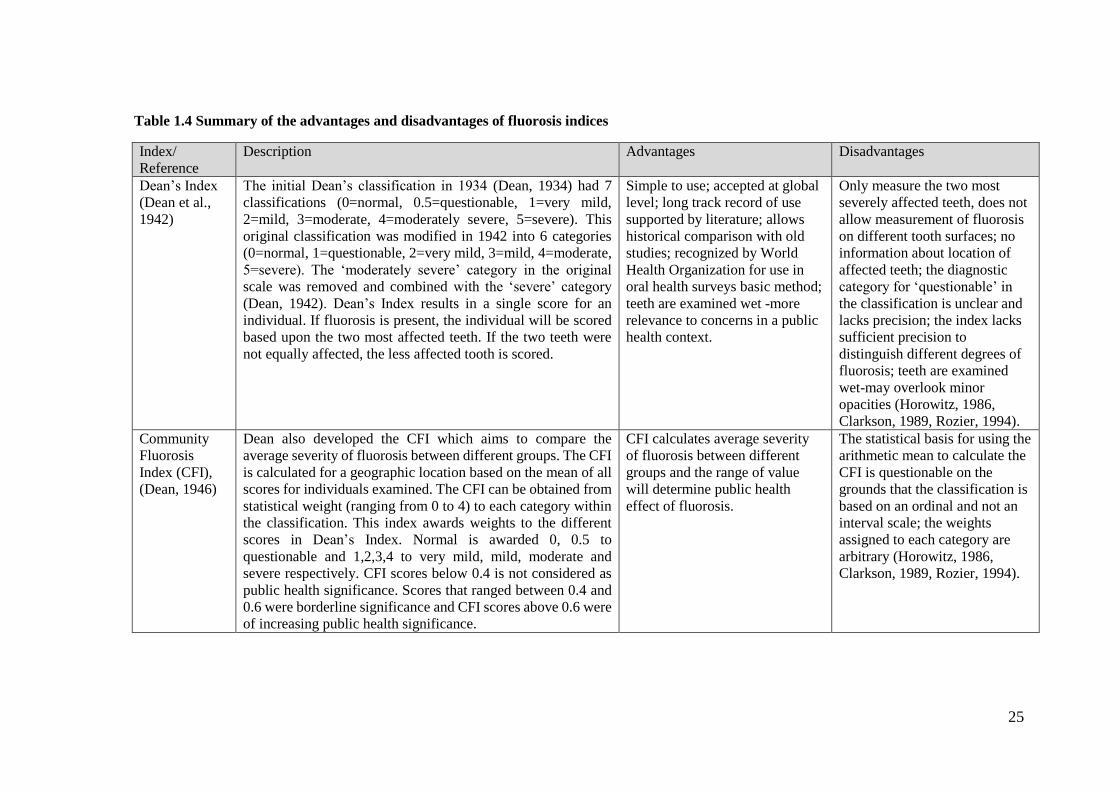
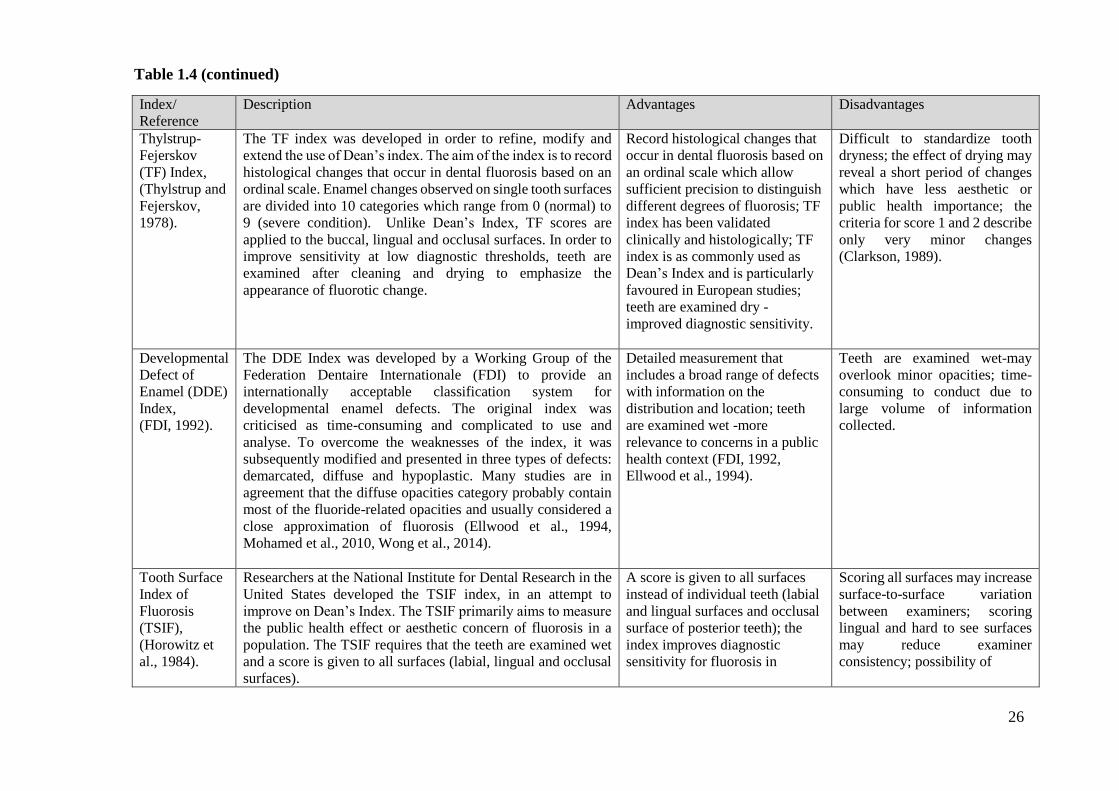
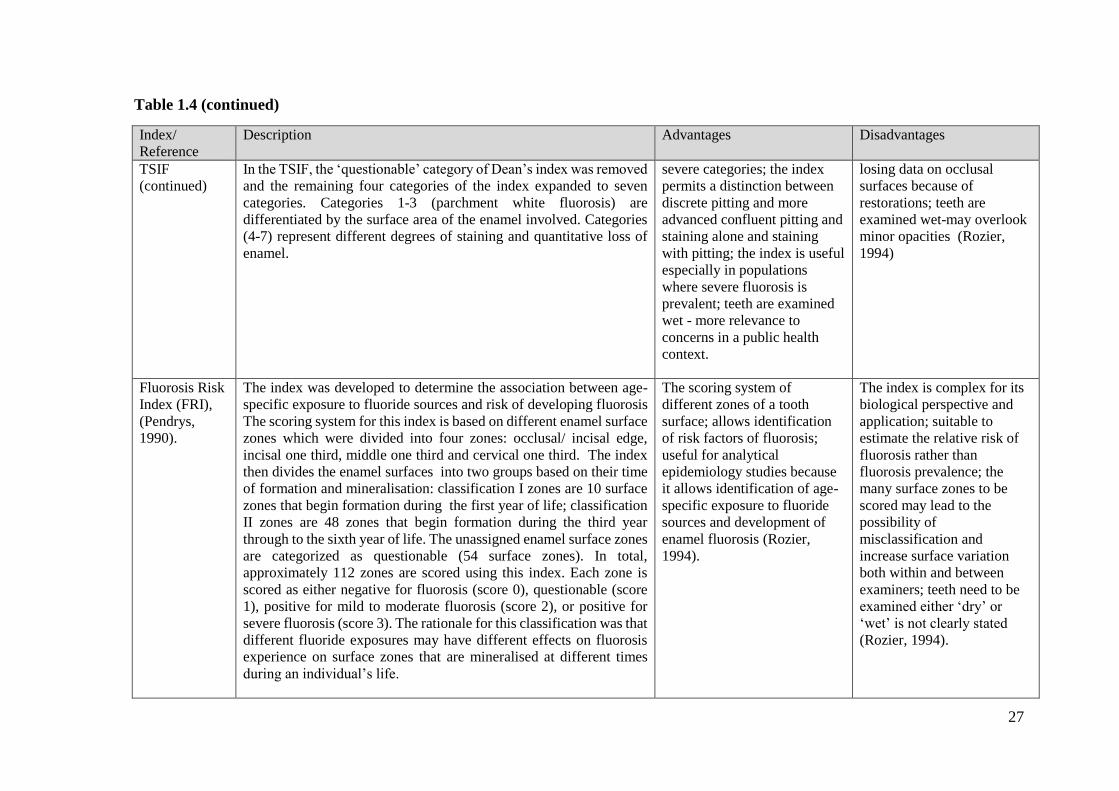
Table 1.4 Summary of the advantages and disadvantages of fluorosis indices ............. 25
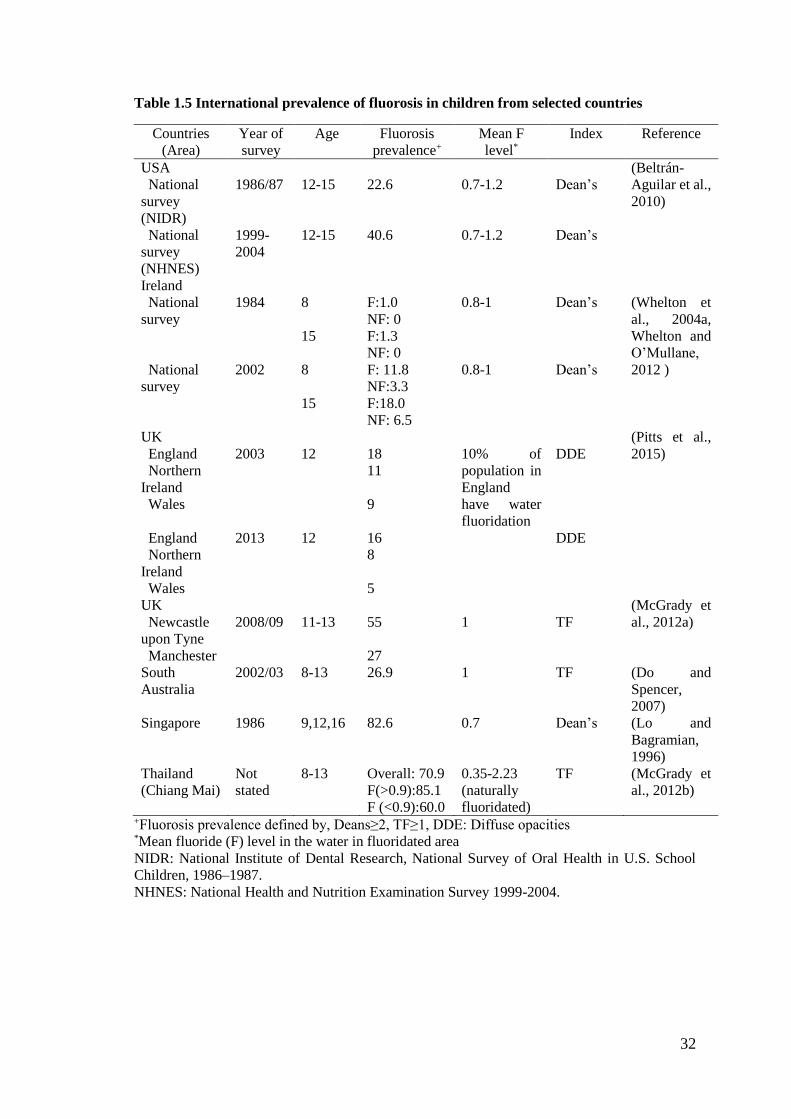
Table 1.5 International prevalence of fluorosis in children from selected countries ..... 32
Table 1.6 Studies on prevalence of fluorosis in Malaysia .............................................. 34
Table 1.7 Studies on the prevalence of enamel defects in Malaysia using the modified
Developmental Defects of Enamel (DDE) Index ........................................................... 35
Table 1.8 International prevalence of caries in children from selected countries .......... 41
Table 1.9 Caries prevalence among 12 year-old children in Malaysia by state ............. 43
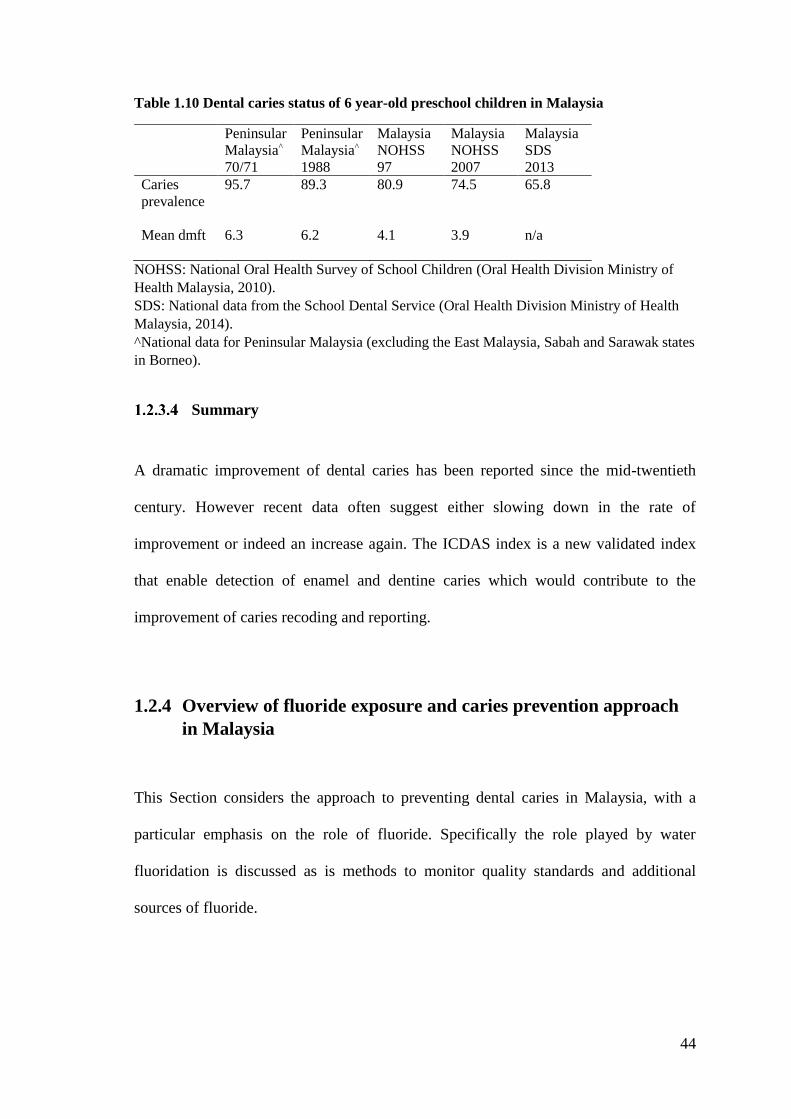
Table 1.10 Dental caries status of 6 year-old preschool children in Malaysia ............... 44
Table 2.1 Key information extracted from each study .................................................. 57
Table 2.2 Level of evidence score, adapted from the York Review (McDonagh et al.,
2000) ............................................................................................................................... 58
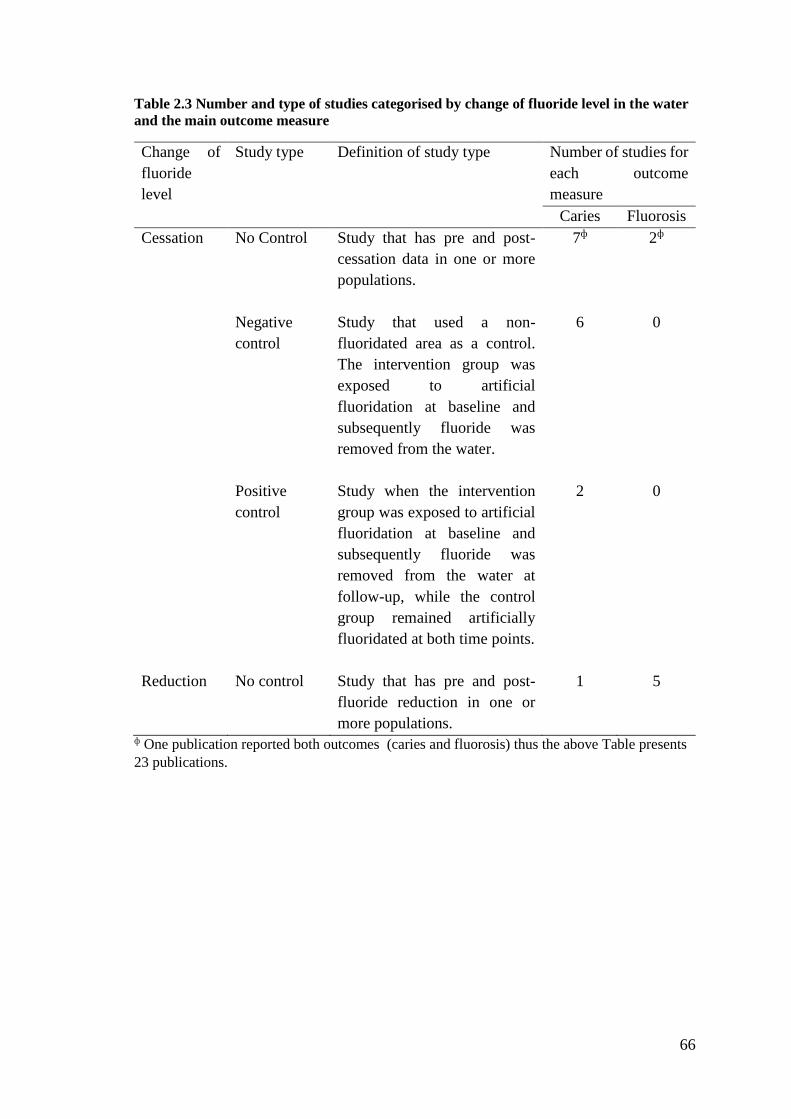
Table 2.3 Number and type of studies categorised by change of fluoride level in the
water and the main outcome measure ............................................................................ 66
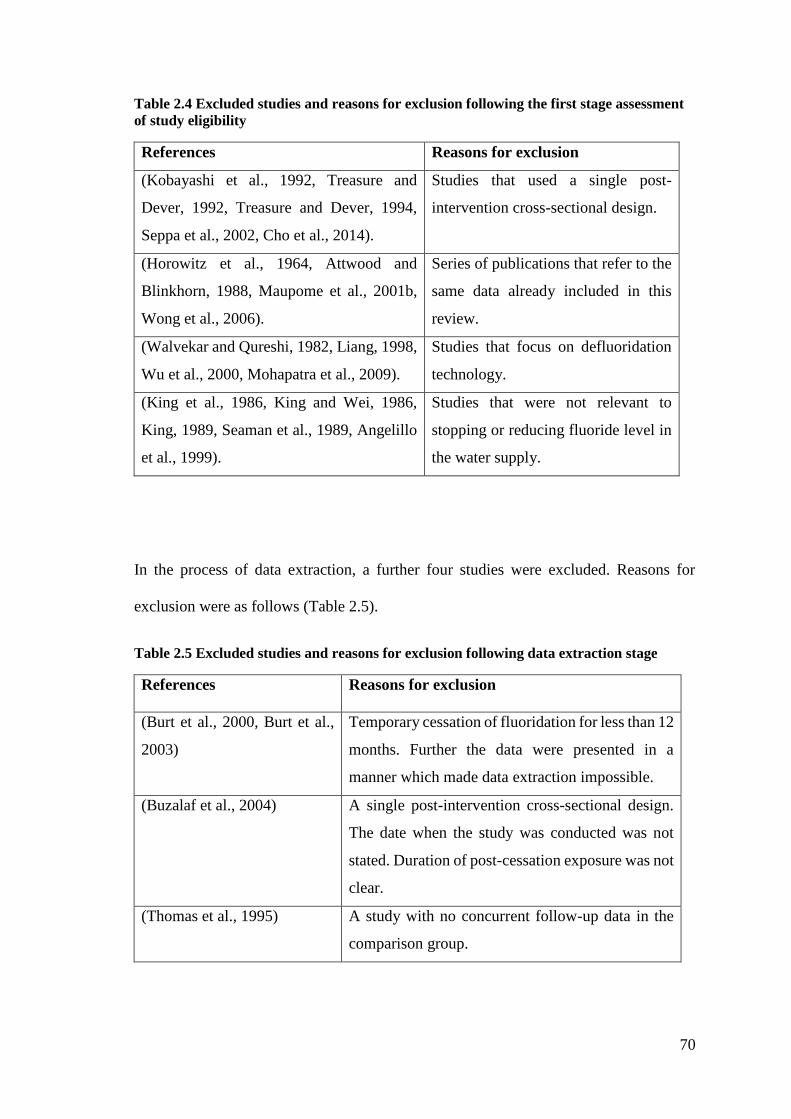
Table 2.4 Excluded studies and reasons for exclusion following the first stage
assessment of study eligibility ........................................................................................ 70
Table 2.5 Excluded studies and reasons for exclusion following data extraction stage 70
Table 2.6 Summary of studies with no control group on caries outcome (permanent
dentition) when fluoridation was discontinued .............................................................. 74
Table 2.7 Summary of studies with a no control group on caries outcome (primary
dentition) when fluoridation was discontinued .............................................................. 75
Table 2.8 Summaries of studies with no control group on percentage caries free
(permanent dentition) when water fluoridation was discontinued ................................. 76
Table 2.9 Summaries of studies with no control group on percentage caries free
(primary dentition) when water fluoridation discontinued............................................. 77
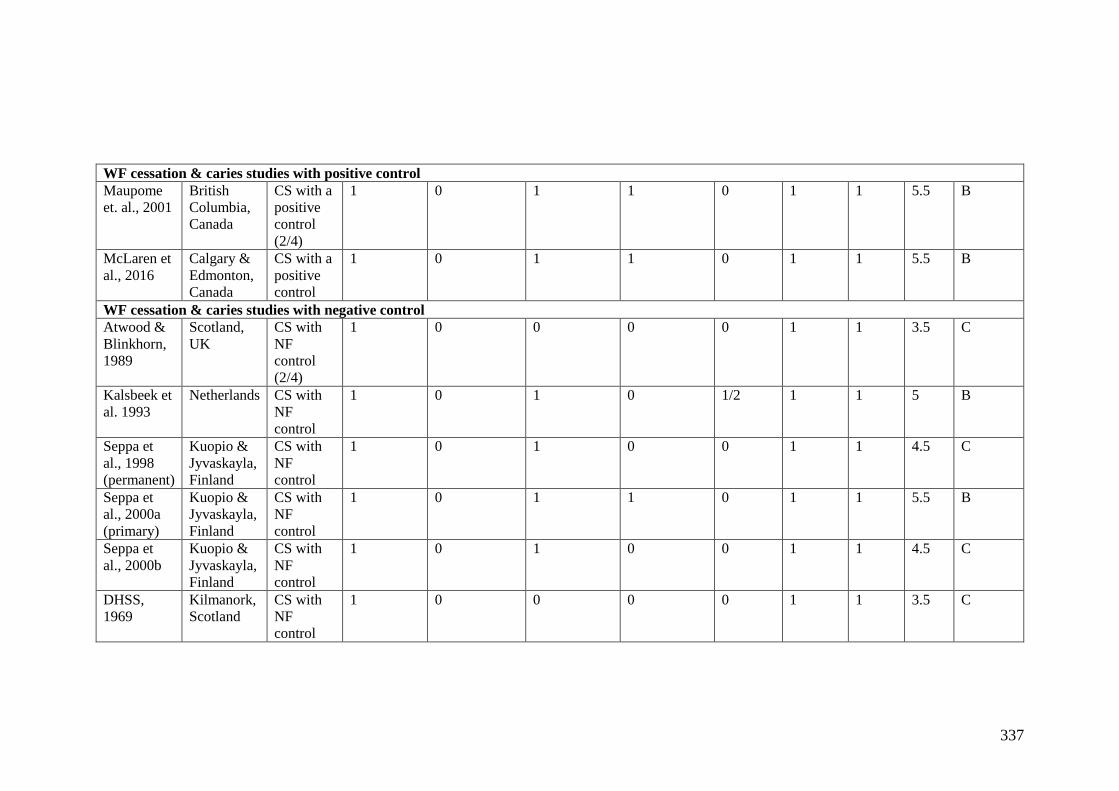
Table 2.10 Summary of studies with a negative control group on caries outcome
(permanent dentition) when fluoridation was discontinued ........................................... 79
Table 2.11 Summary of studies with a negative control group on caries outcome
(primary dentition) when fluoridation was discontinued ............................................... 81
Page 14
xiii
Table 2.12 Summary of studies with a negative control group on percentage caries-free
(permanent dentition) when fluoridation was discontinued ........................................... 82
Table 2.13 Summary of studies with a negative control group on percentage caries-free
(primary dentition) when fluoridation was discontinued ............................................... 84
Table 2.14 Summary of studies with a positive control group on caries outcome
(permanent dentition) when fluoridation was discontinued ........................................... 86
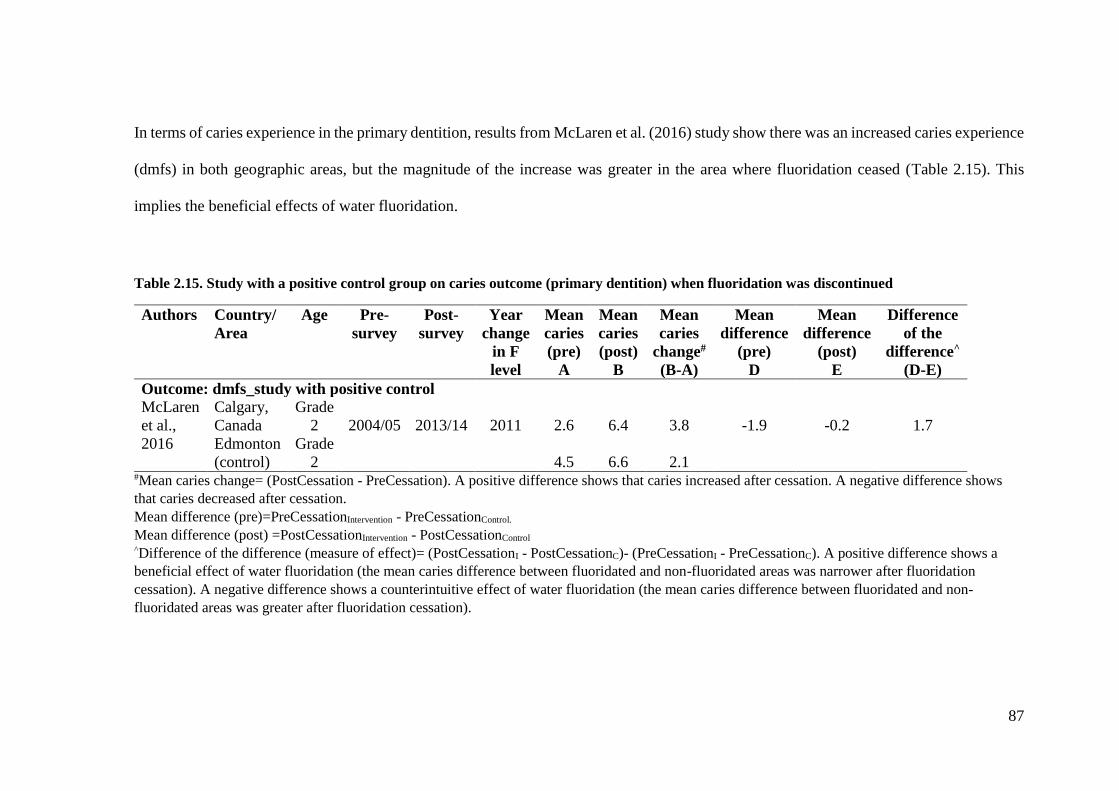
Table 2.15. Study with a positive control group on caries outcome (primary dentition)
when fluoridation was discontinued ............................................................................... 87
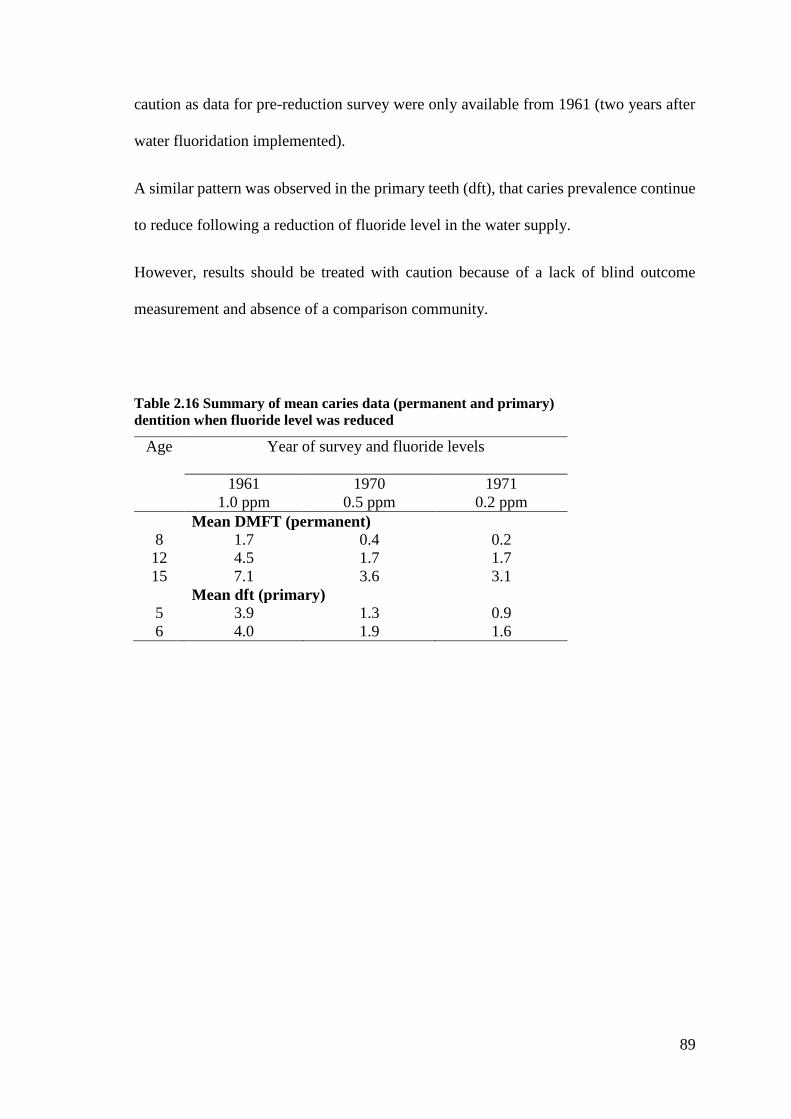
Table 2.16 Summary of mean caries data (permanent and primary) ............................. 89
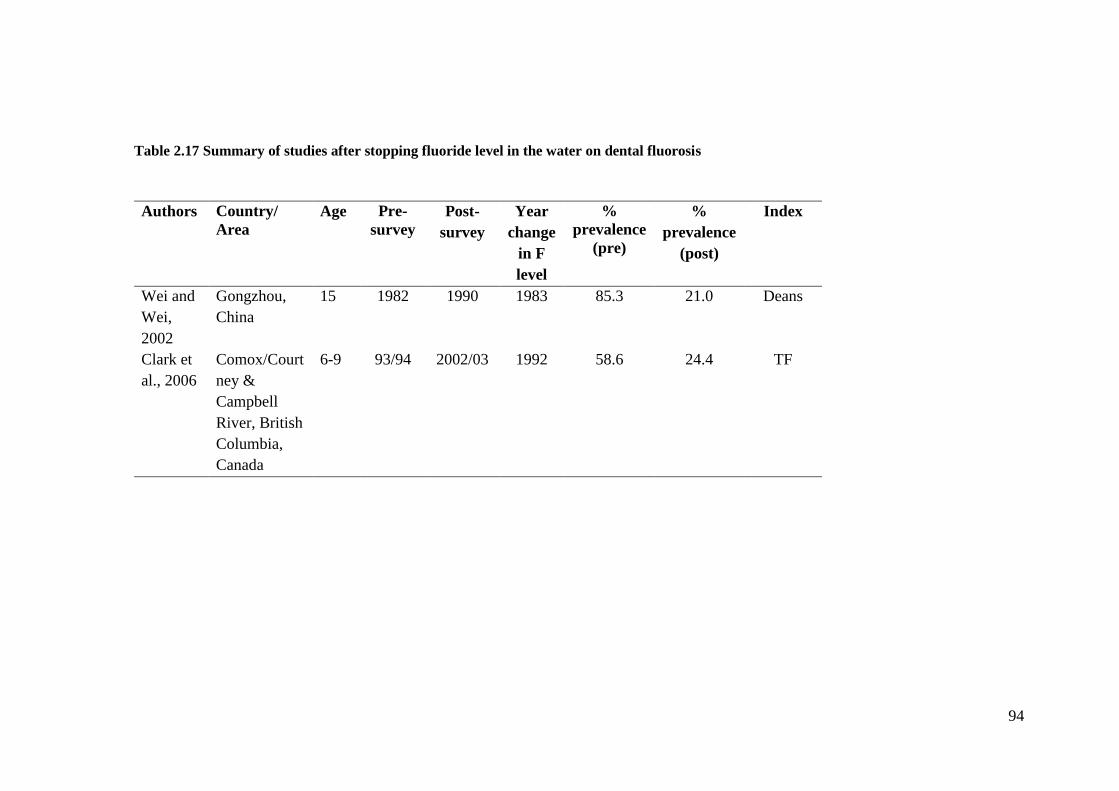
Table 2.17 Summary of studies after stopping fluoride level in the water on dental
fluorosis .......................................................................................................................... 94
Table 2.18 Summary of studies after reducing fluoride level in the water on dental
fluorosis .......................................................................................................................... 97
Table 4.1 Syntax coding for ICDAS ............................................................................ 137
Table 4.2 Syntax coding for DMFT calculation .......................................................... 138
Table 4.3 Inter-examiner agreement of dental fluorosis by clinical and photographic
examination .................................................................................................................. 150
Table 4.4 Inter-examiner agreement of dental fluorosis between individual
photographic score and consensus photographic score ................................................ 151
Table 5.1 Response rate by age group and area of residence ....................................... 156
Table 5.2 Reasons of exclusion by age group and residency area ............................... 157
Table 5.3 Demographic characteristics of the study participants ................................. 160
Table 5.4 Parents’ education level by age group and residency area ........................... 161
Table 5.5 Parents’ monthly income by age group and area of residence ..................... 162
Table 5.6 Frequency table of exposure to fluoride from water among study participants
...................................................................................................................................... 164
Table 5.7 Sources of drinking water and use of a water filter at home among study
participants ................................................................................................................... 166
Table 5.8 Self-reported breast-feeding practices among study participants ............... 167
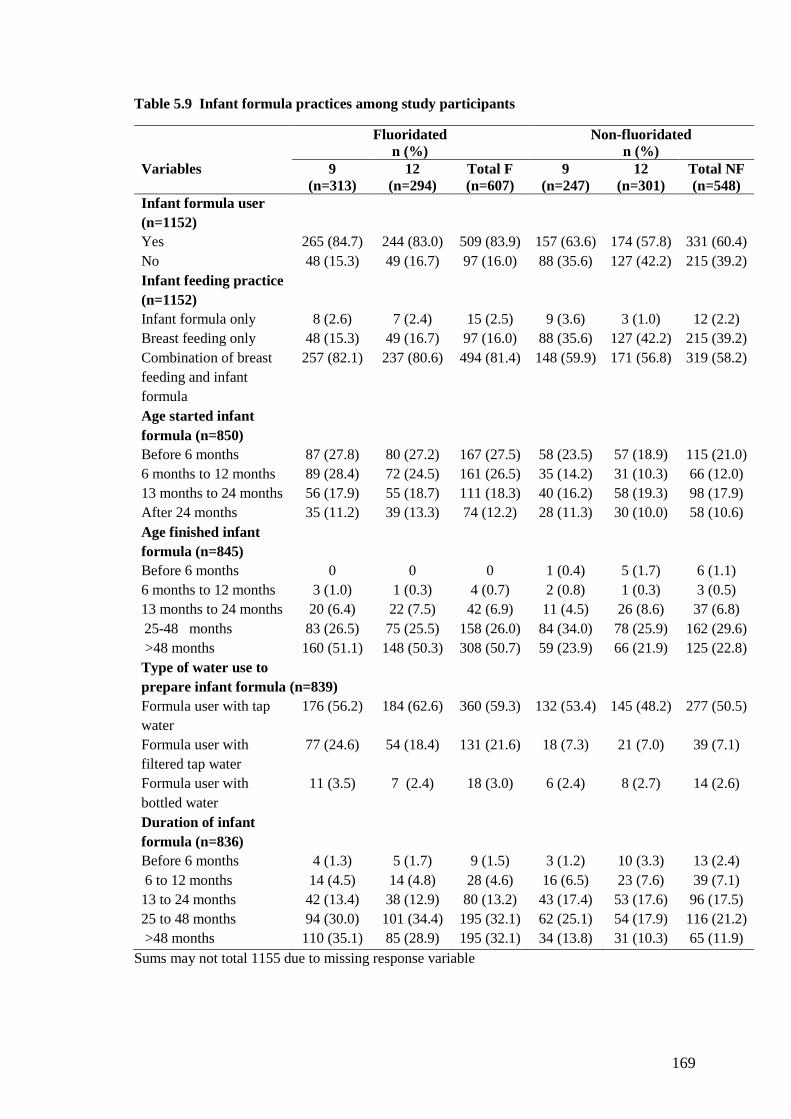
Table 5.9 Infant formula practices among study participants ..................................... 169
Table 5.10 Age started toothbrushing and age exposed to fluoridated toothpaste among
study participants .......................................................................................................... 171
Table 5.11 Oral hygiene habits at age less than six years old among study participants
...................................................................................................................................... 174
Page 15
xiv
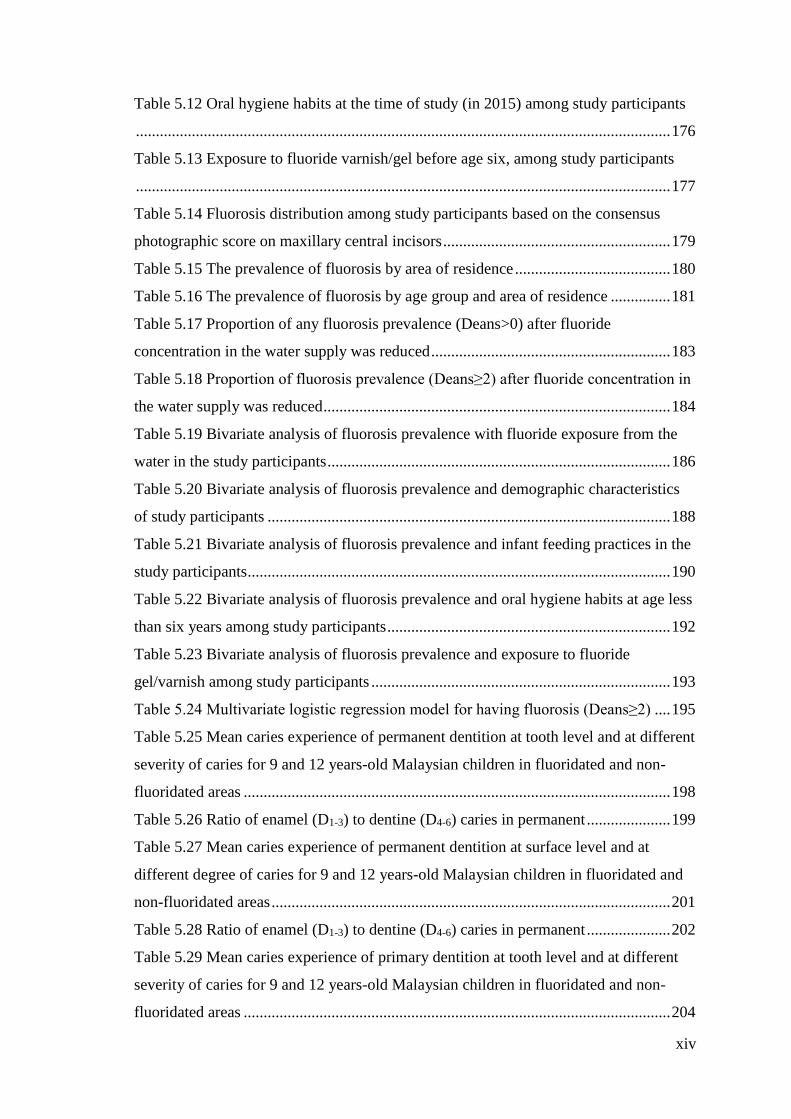
Table 5.12 Oral hygiene habits at the time of study (in 2015) among study participants
...................................................................................................................................... 176
Table 5.13 Exposure to fluoride varnish/gel before age six, among study participants
...................................................................................................................................... 177
Table 5.14 Fluorosis distribution among study participants based on the consensus
photographic score on maxillary central incisors ......................................................... 179
Table 5.15 The prevalence of fluorosis by area of residence ....................................... 180
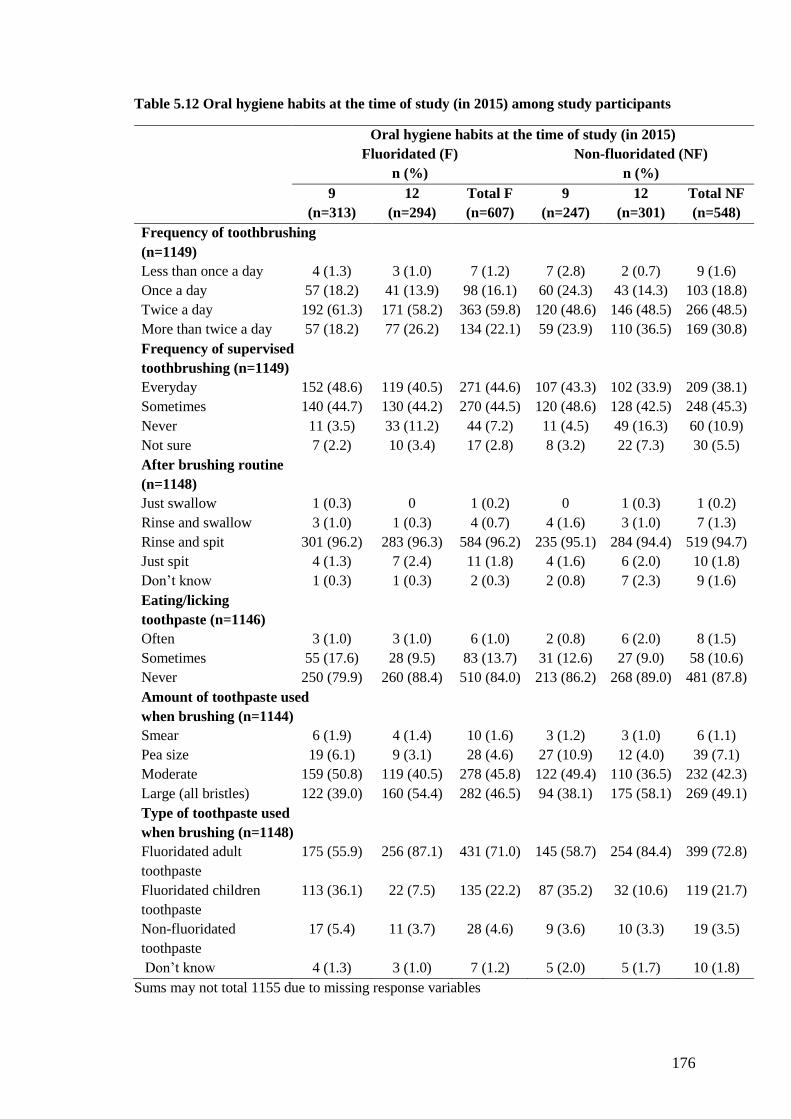
Table 5.16 The prevalence of fluorosis by age group and area of residence ............... 181
Table 5.17 Proportion of any fluorosis prevalence (Deans>0) after fluoride
concentration in the water supply was reduced ............................................................ 183
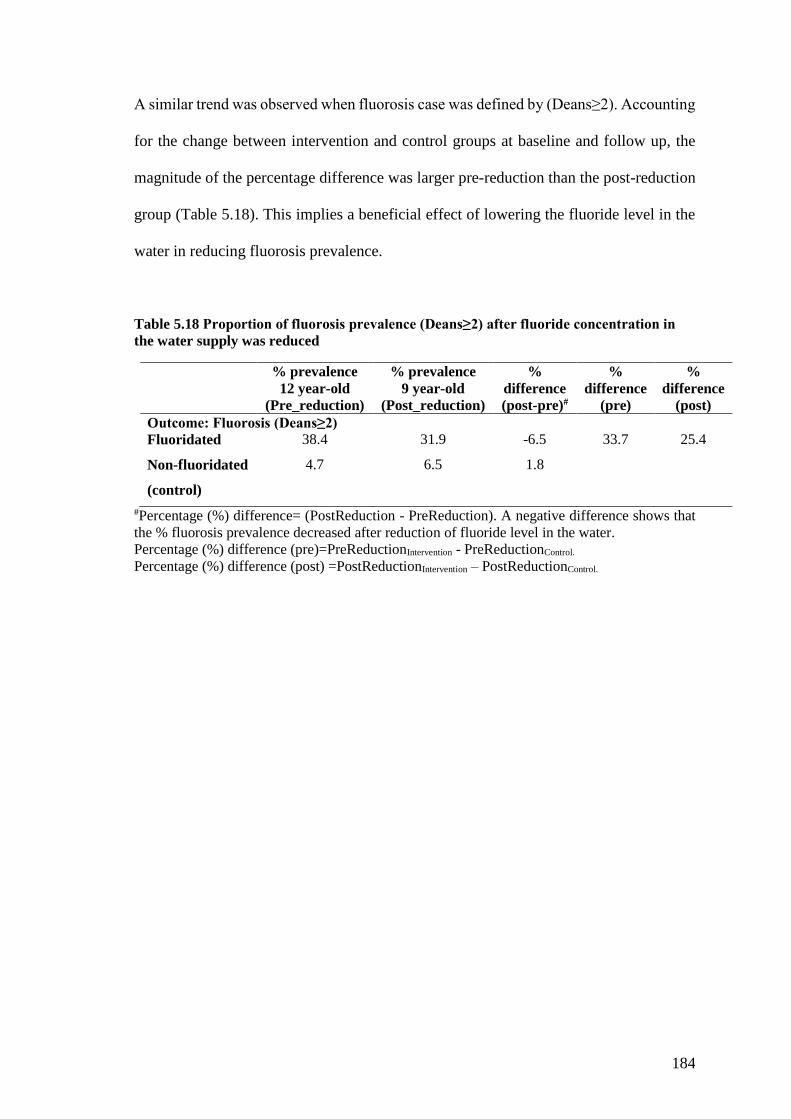
Table 5.18 Proportion of fluorosis prevalence (Deans≥2) after fluoride concentration in
the water supply was reduced ....................................................................................... 184
Table 5.19 Bivariate analysis of fluorosis prevalence with fluoride exposure from the
water in the study participants ...................................................................................... 186
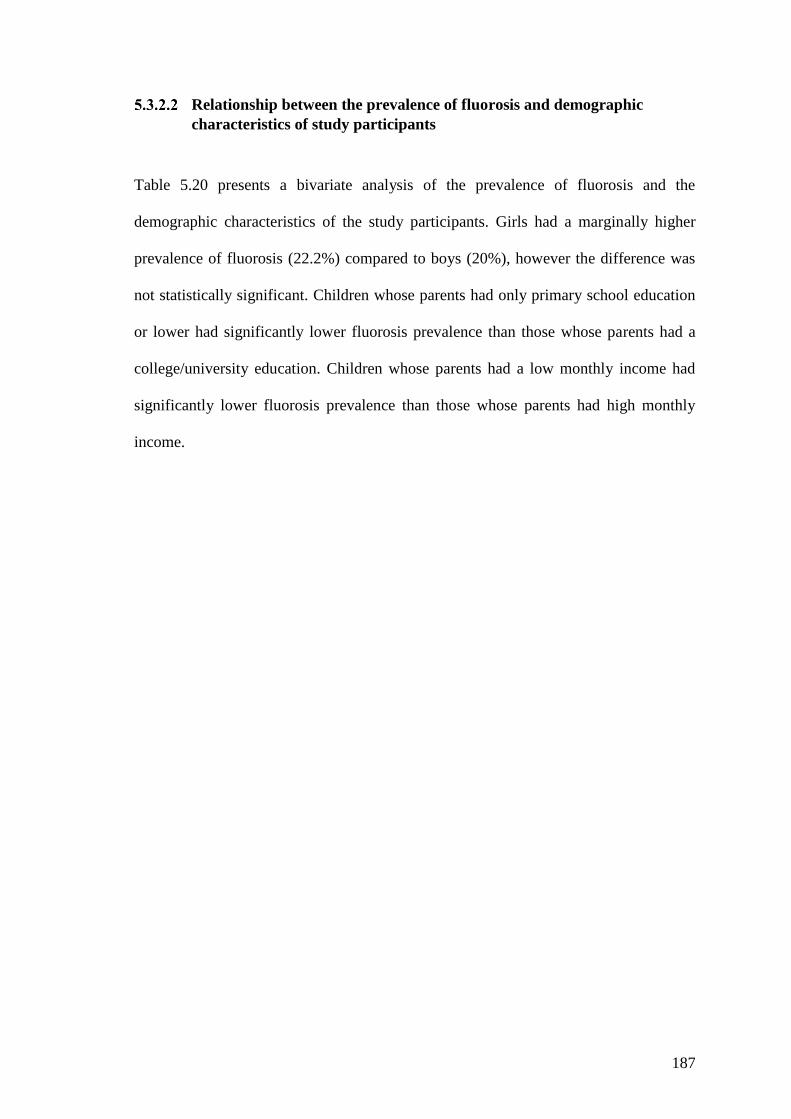
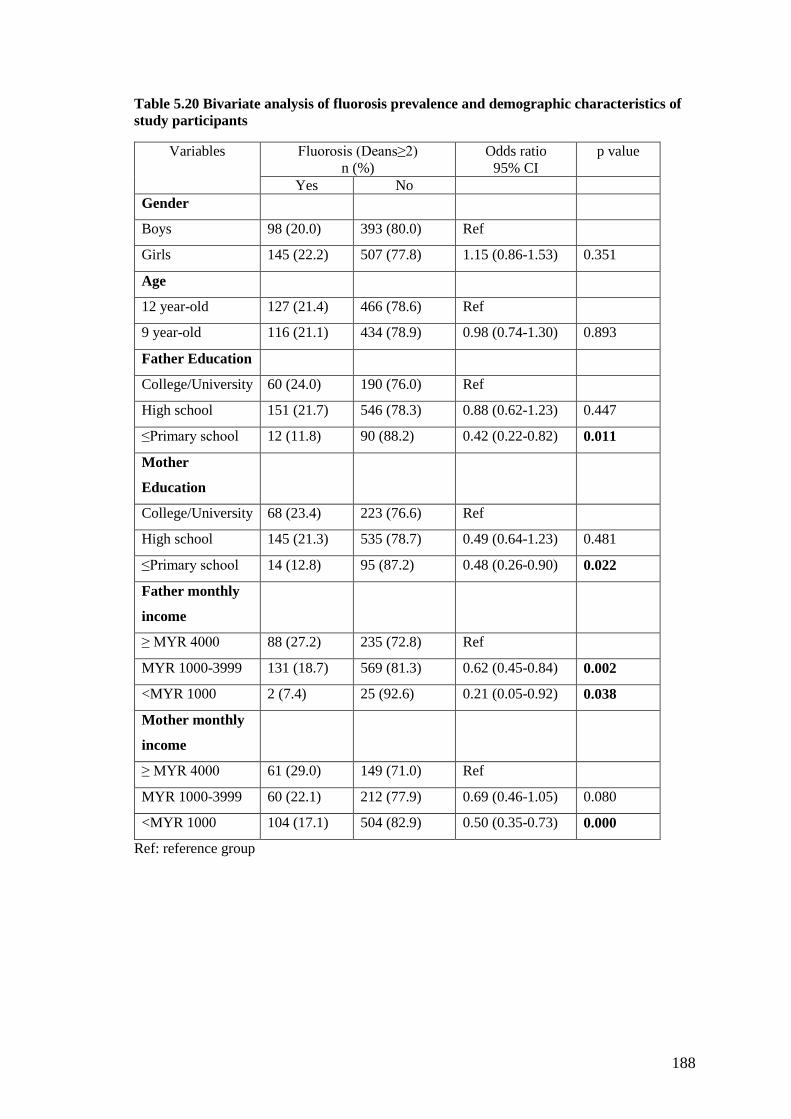
Table 5.20 Bivariate analysis of fluorosis prevalence and demographic characteristics
of study participants ..................................................................................................... 188
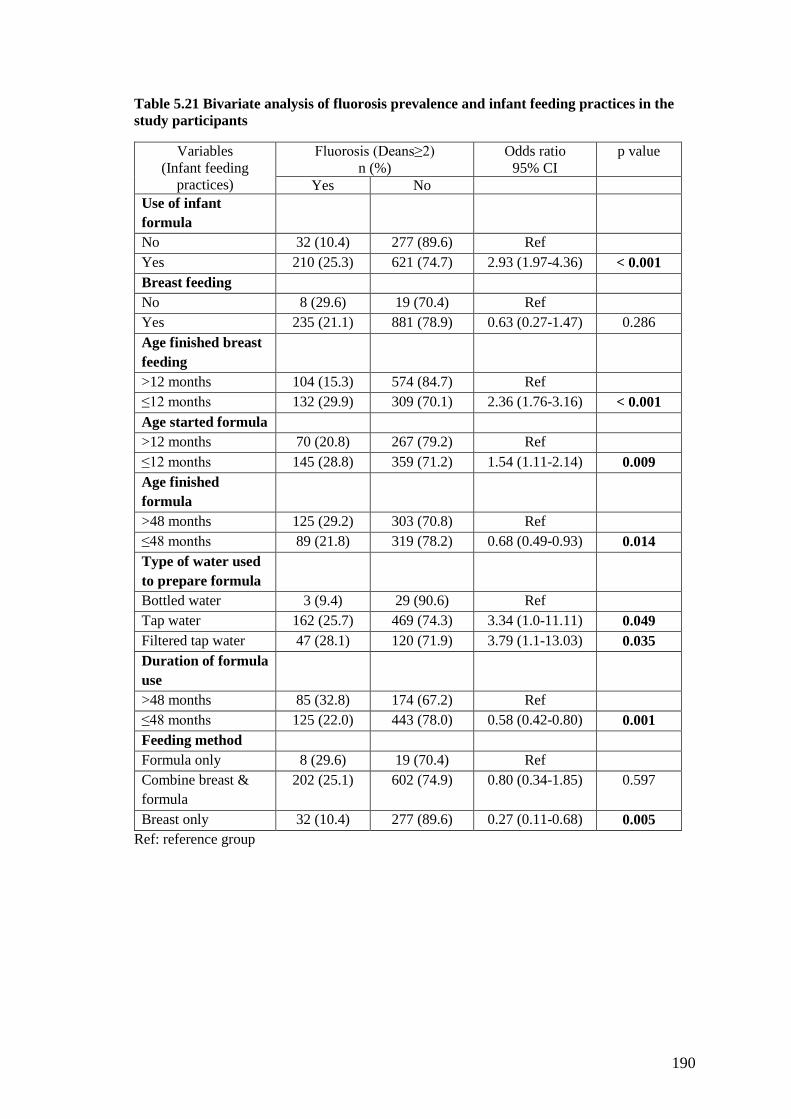
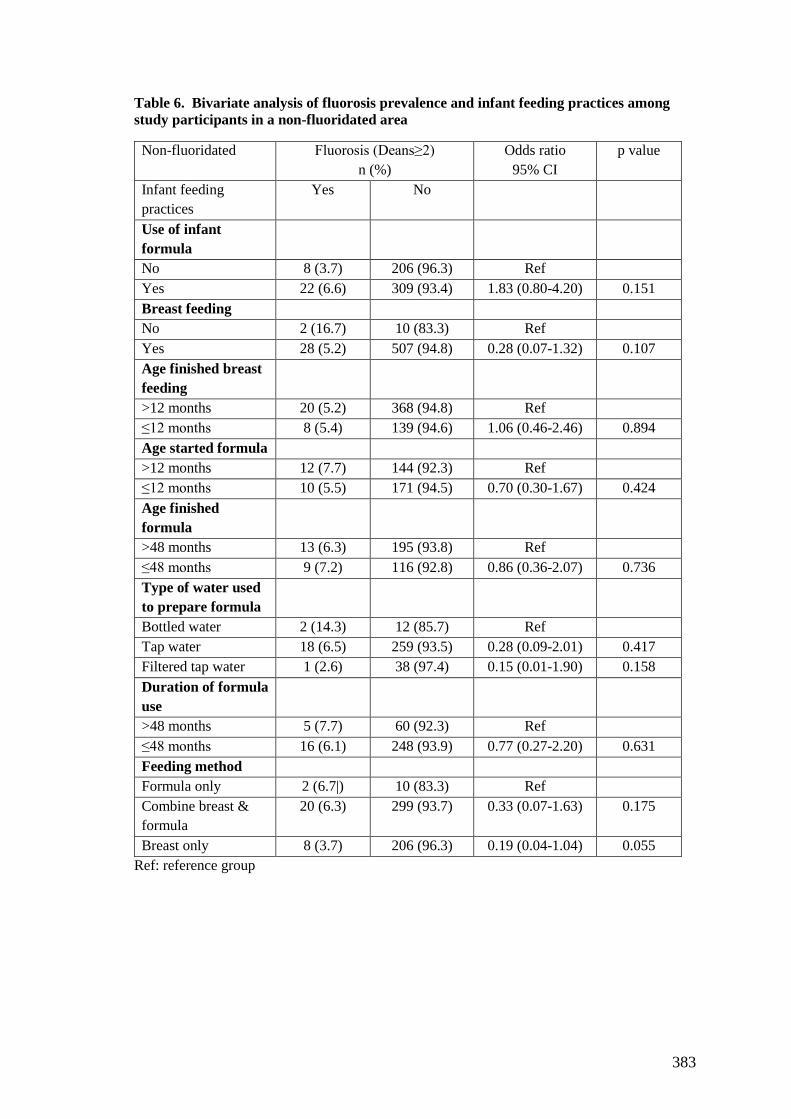
Table 5.21 Bivariate analysis of fluorosis prevalence and infant feeding practices in the
study participants .......................................................................................................... 190
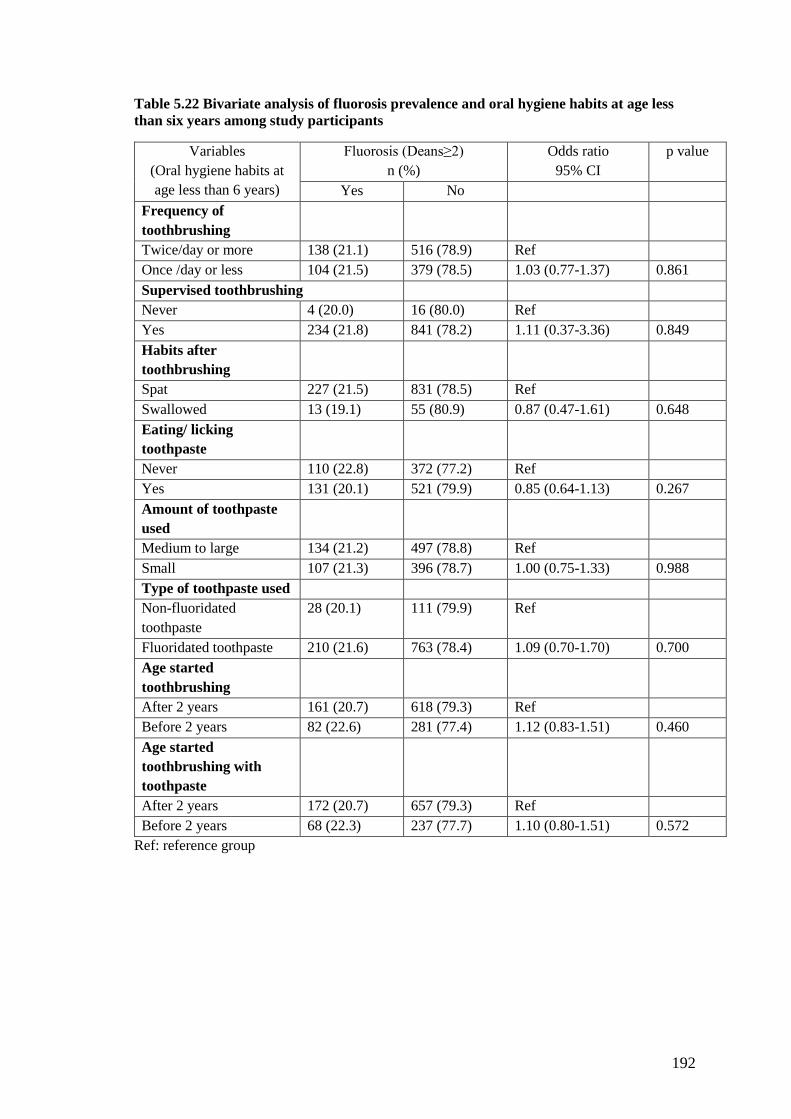
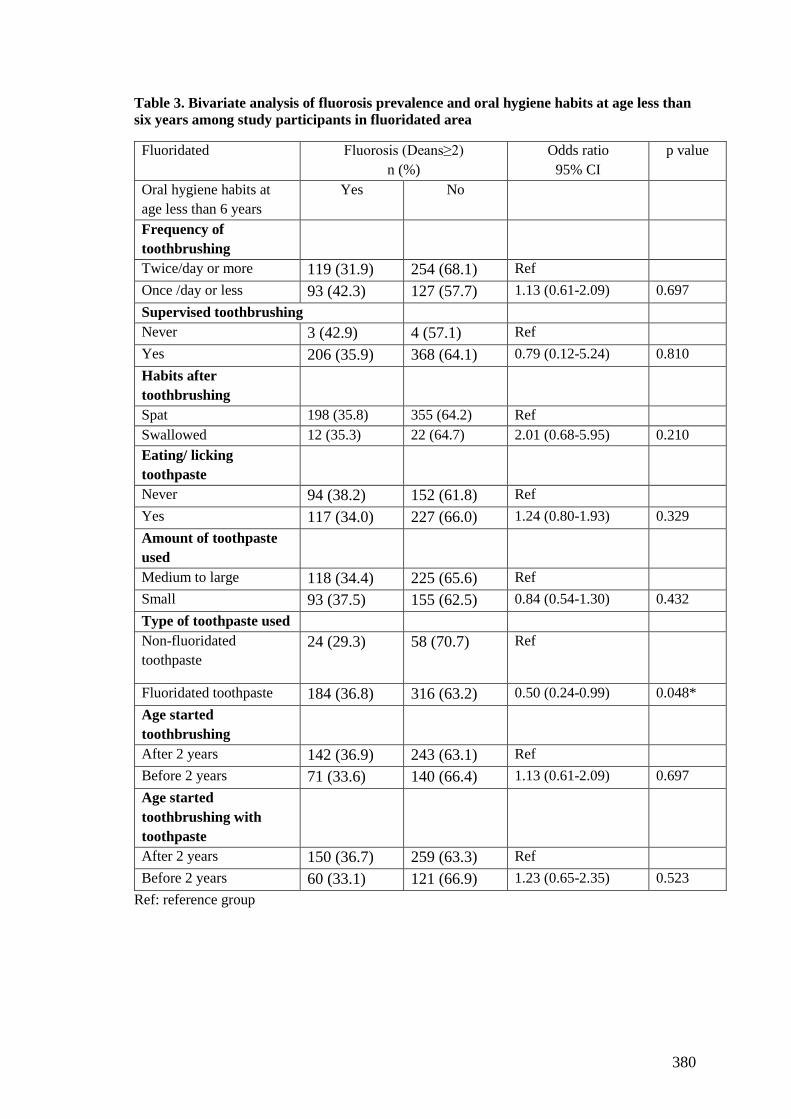
Table 5.22 Bivariate analysis of fluorosis prevalence and oral hygiene habits at age less
than six years among study participants ....................................................................... 192
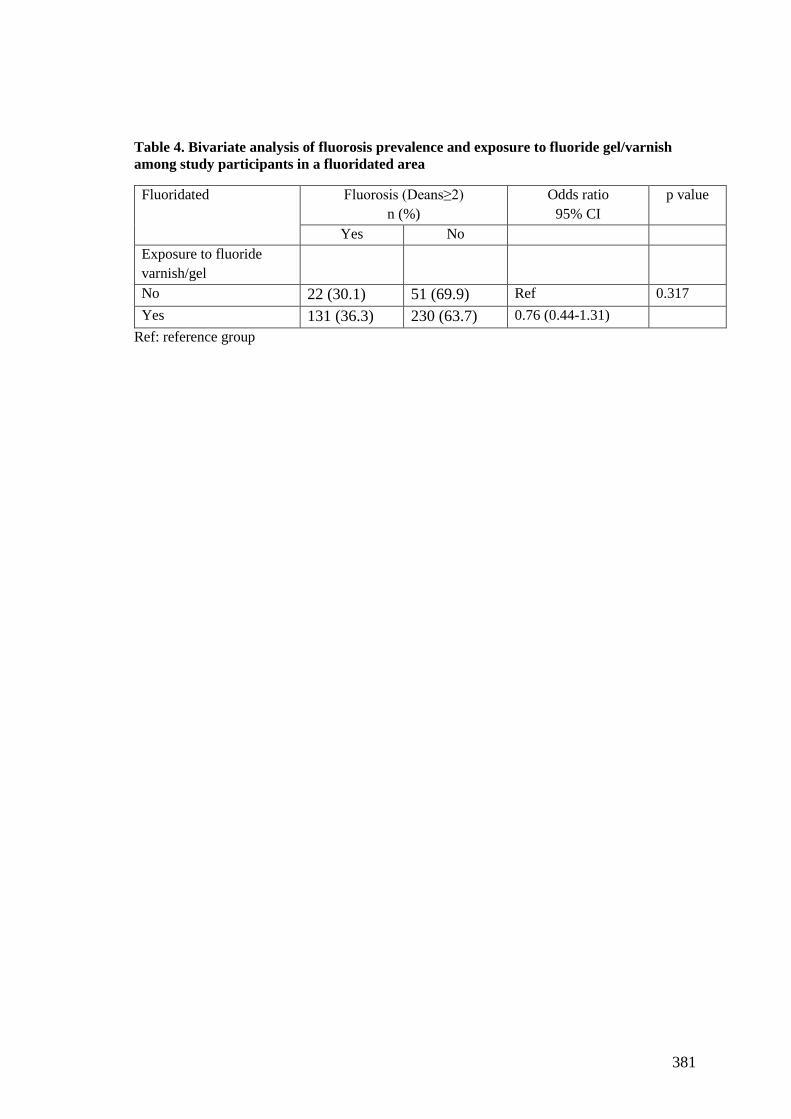
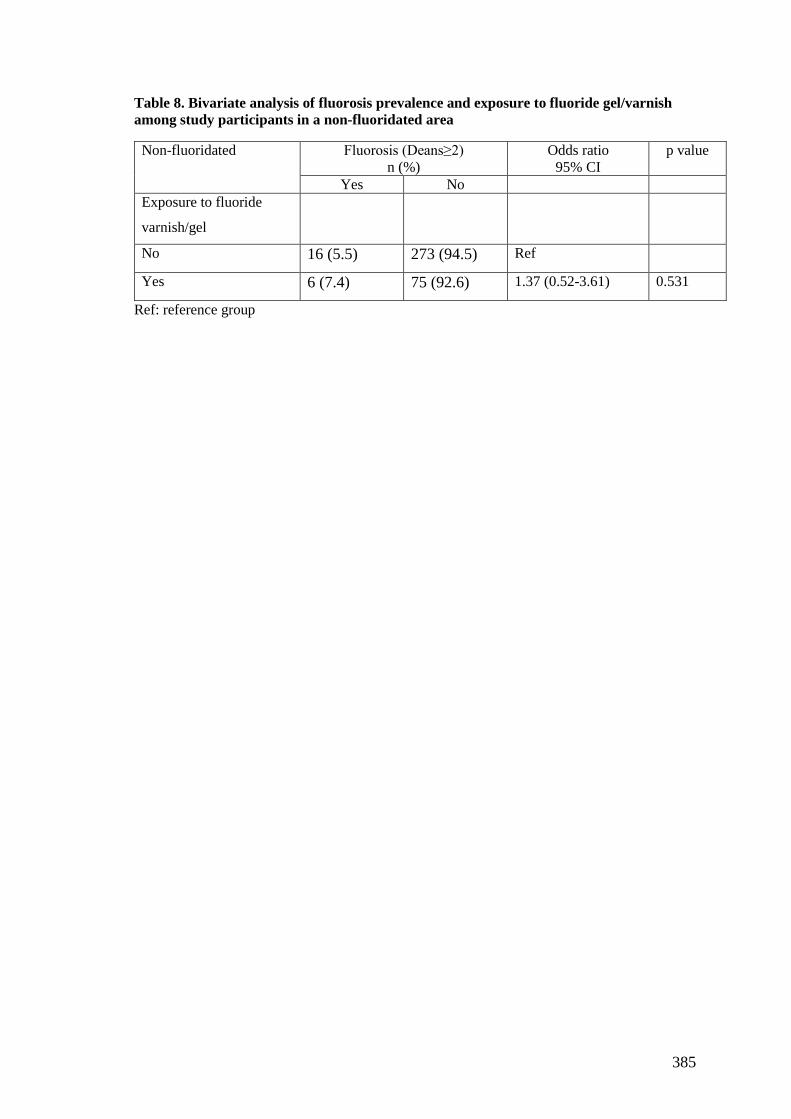
Table 5.23 Bivariate analysis of fluorosis prevalence and exposure to fluoride
gel/varnish among study participants ........................................................................... 193
Table 5.24 Multivariate logistic regression model for having fluorosis (Deans≥2) .... 195
Table 5.25 Mean caries experience of permanent dentition at tooth level and at different
severity of caries for 9 and 12 years-old Malaysian children in fluoridated and non-
fluoridated areas ........................................................................................................... 198
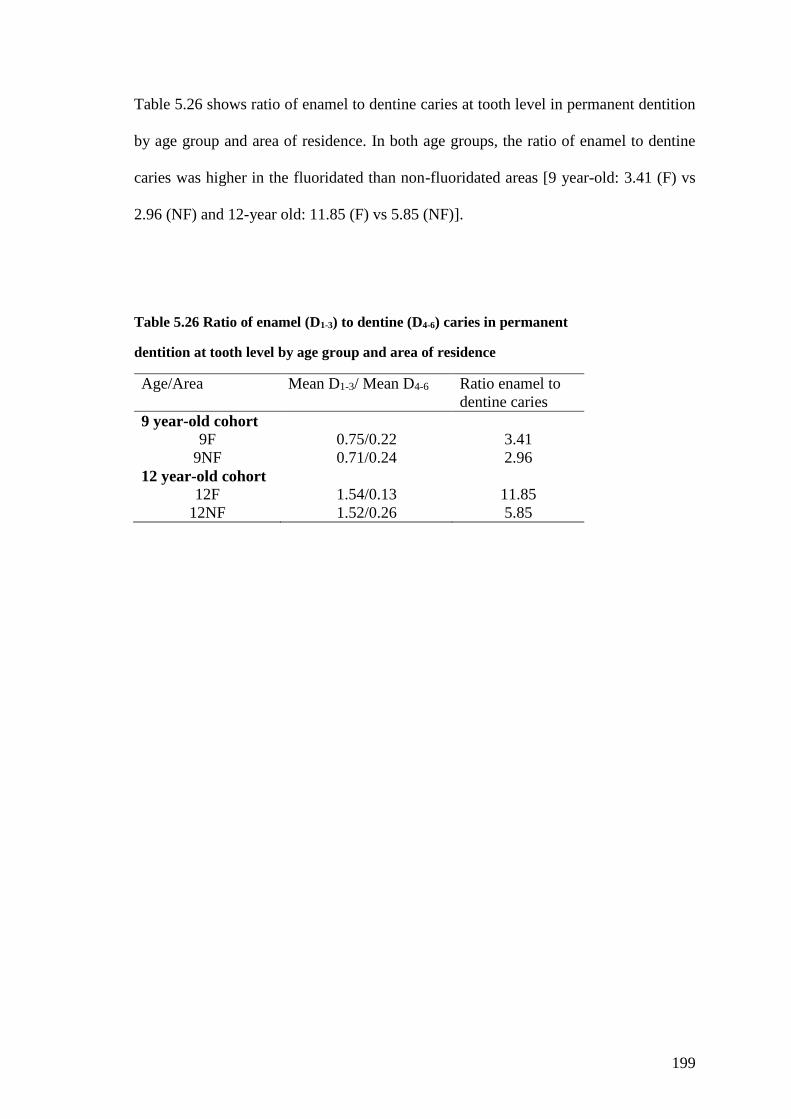
Table 5.26 Ratio of enamel (D1-3) to dentine (D4-6) caries in permanent ..................... 199
Table 5.27 Mean caries experience of permanent dentition at surface level and at
different degree of caries for 9 and 12 years-old Malaysian children in fluoridated and
non-fluoridated areas .................................................................................................... 201
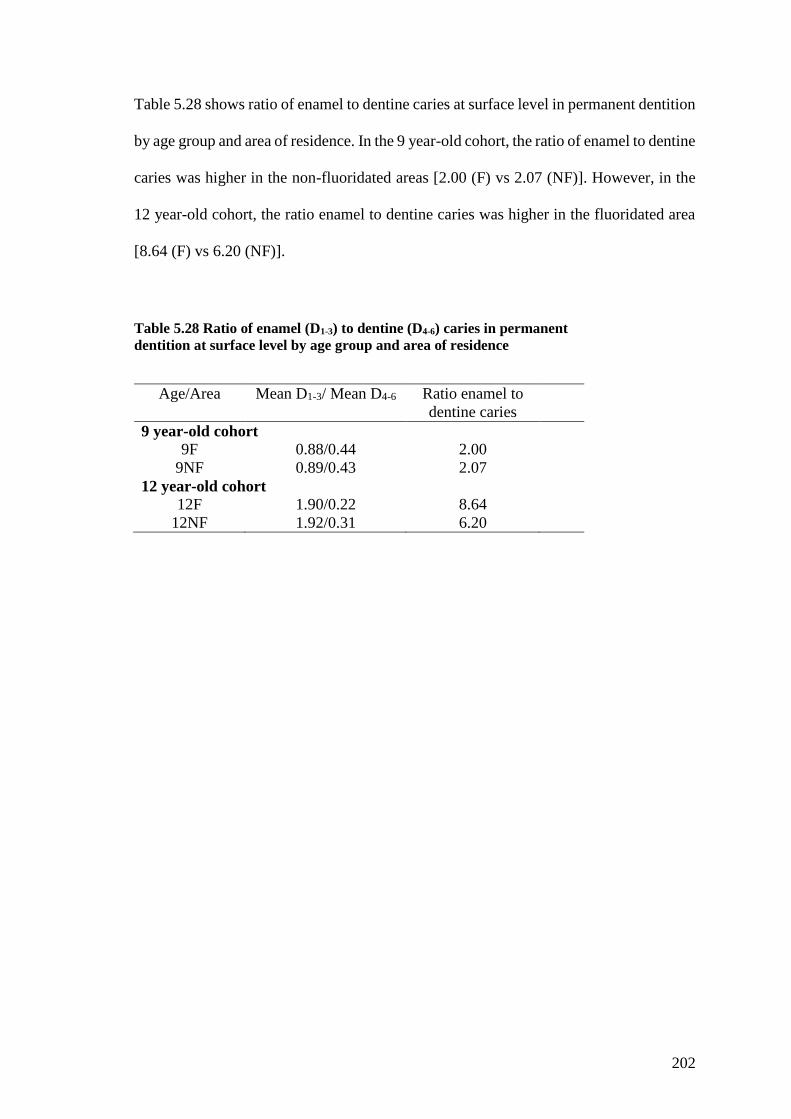
Table 5.28 Ratio of enamel (D1-3) to dentine (D4-6) caries in permanent ..................... 202
Table 5.29 Mean caries experience of primary dentition at tooth level and at different
severity of caries for 9 and 12 years-old Malaysian children in fluoridated and non-
fluoridated areas ........................................................................................................... 204
Page 16
xv
Table 5.30 Ratio of enamel (d1-3) to dentine (d4-6) caries in primary ........................... 205
Table 5.31 Mean caries experience of primary dentition at surface level and at different
degree of severity caries for 9 and 12 years-old Malaysian children in fluoridated and
non-fluoridated areas .................................................................................................... 206
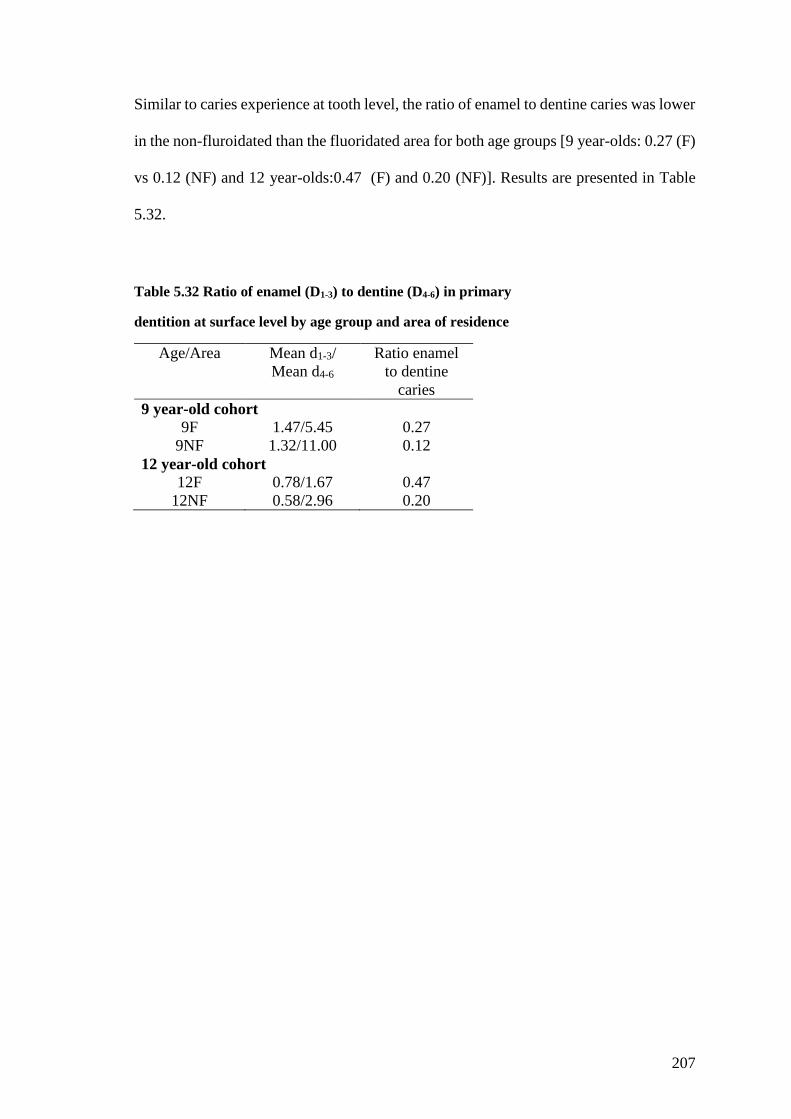
Table 5.32 Ratio of enamel (D1-3) to dentine (D4-6) in primary ................................... 207
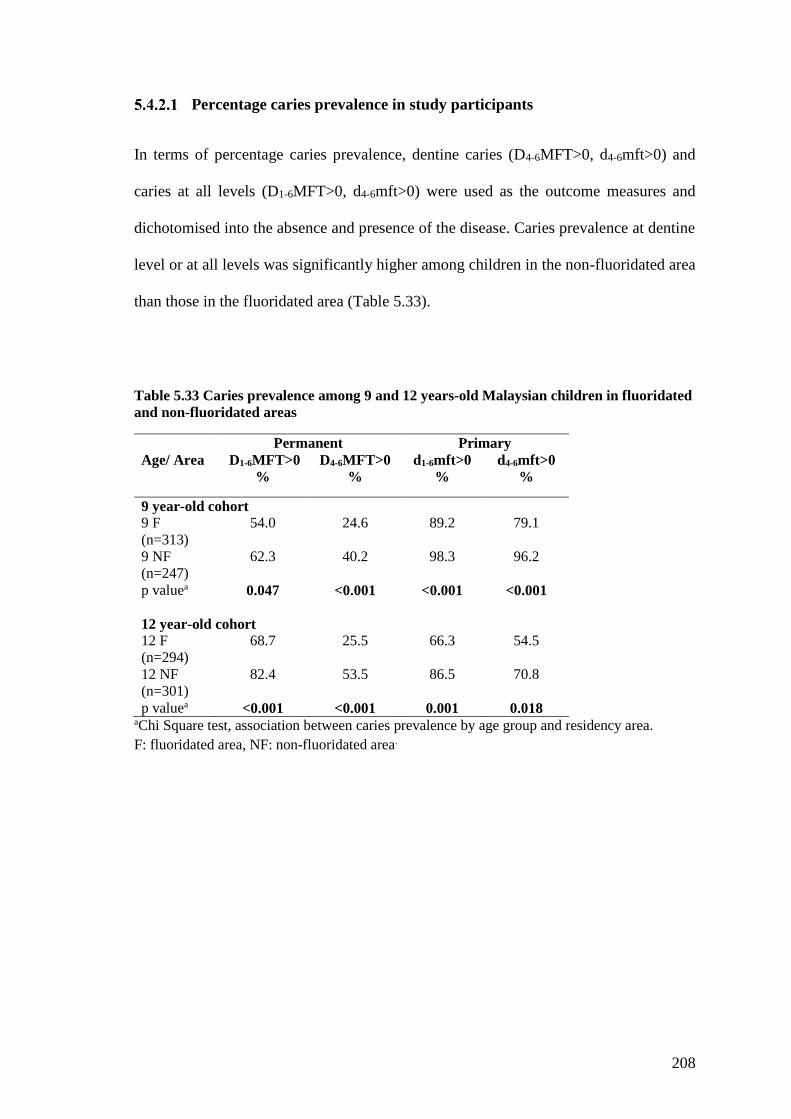
Table 5.33 Caries prevalence among 9 and 12 years-old Malaysian children in
fluoridated and non-fluoridated areas .......................................................................... 208
Table 5.34 Activity of caries lesions of permanent dentition by age groups in
fluoridated and non-fluoridated areas at tooth level ..................................................... 209
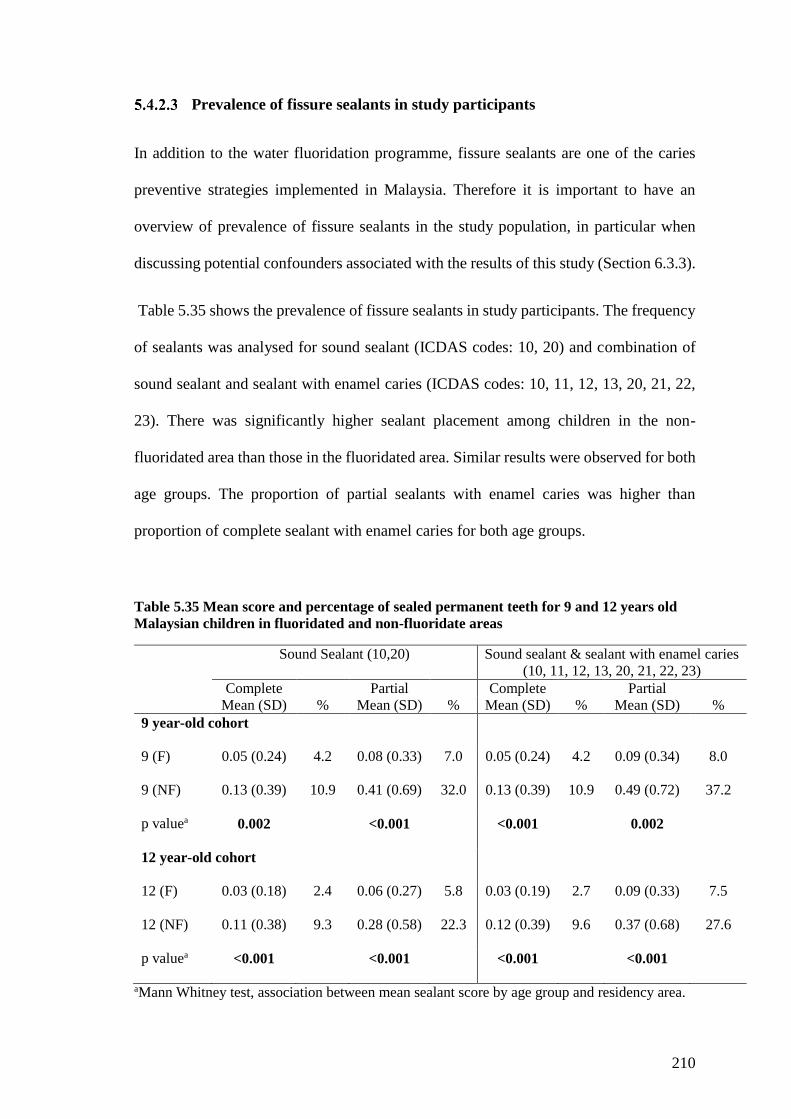
Table 5.35 Mean score and percentage of sealed permanent teeth for 9 and 12 years old
Malaysian children in fluoridated and non-fluoridate areas ......................................... 210
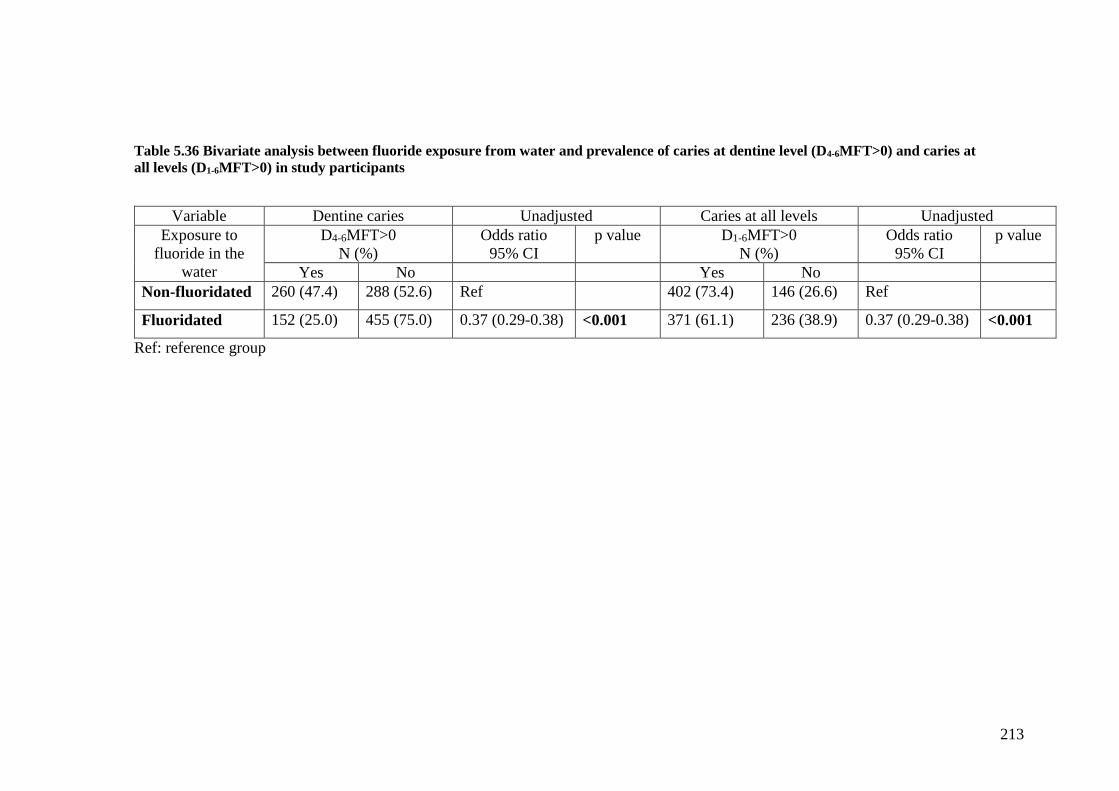
Table 5.36 Bivariate analysis between fluoride exposure from water and prevalence of
caries at dentine level (D4-6MFT>0) and caries at ........................................................ 213
Table 5.37 Multivariate regression models for mean caries experience and caries
prevalence following reduction of fluoride level in the water ..................................... 215
Table 5.38 Bivariate analysis between demographic characteristics and prevalence of
caries at dentine level (D4-6MFT>0) and caries at ........................................................ 217
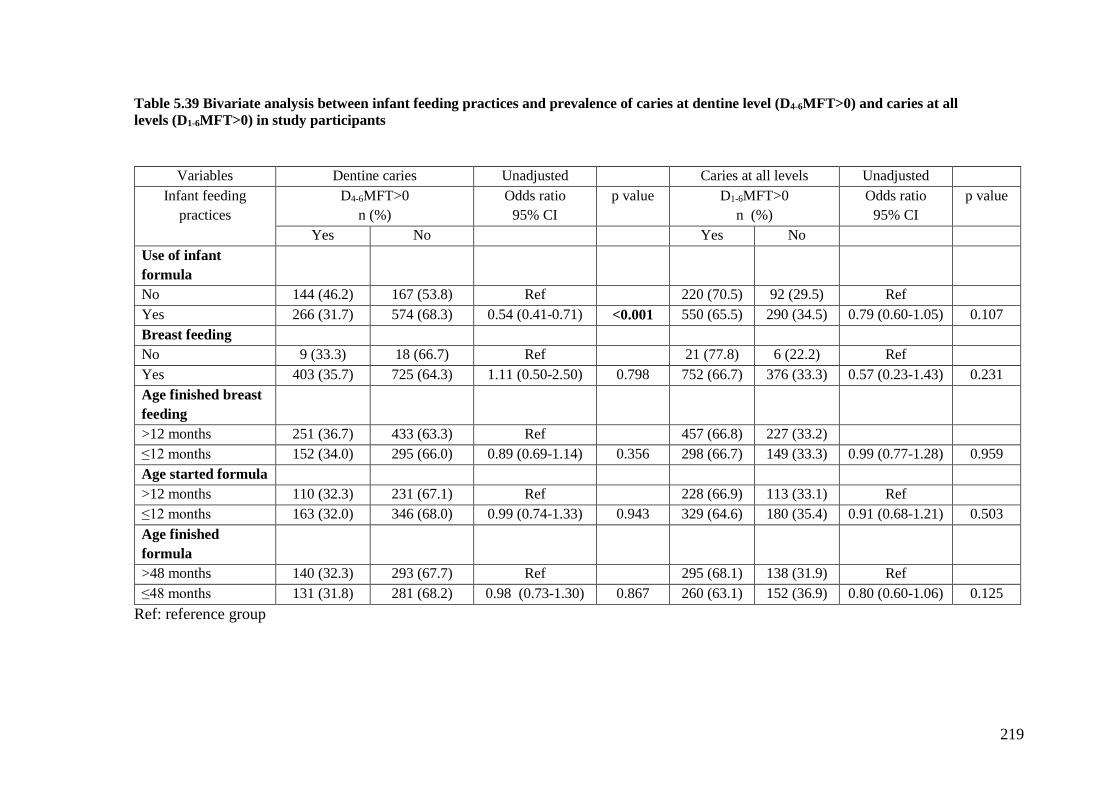
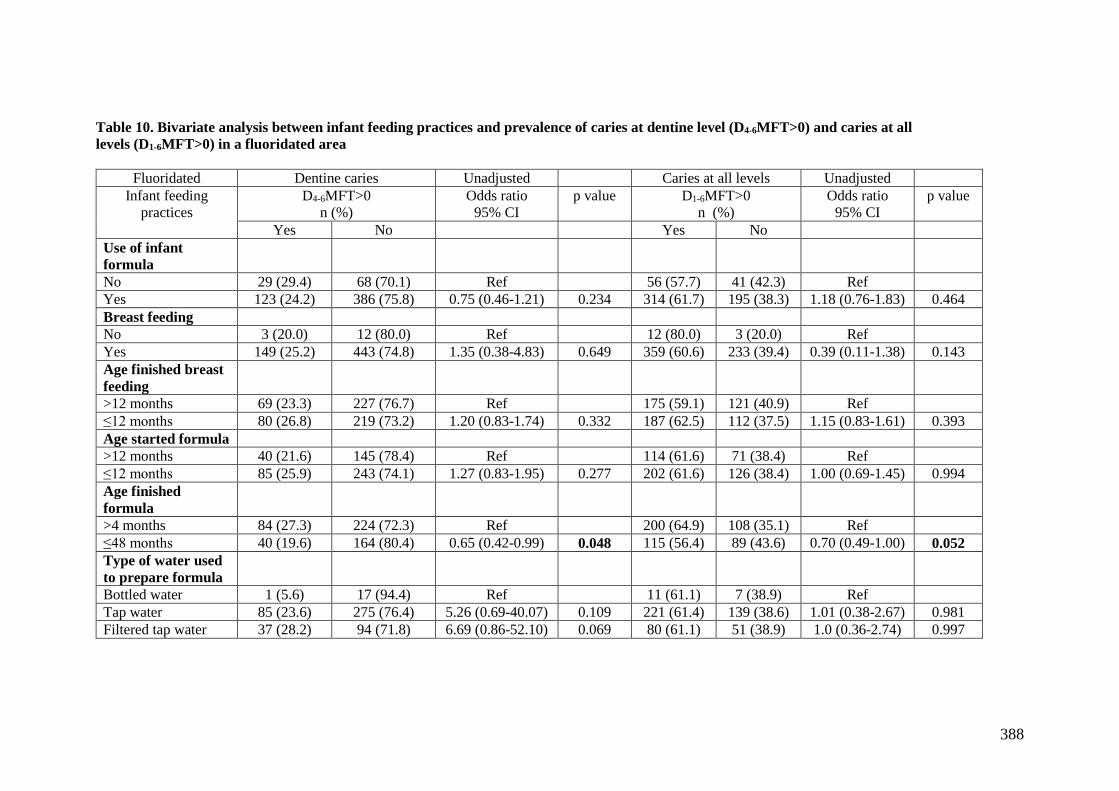
Table 5.39 Bivariate analysis between infant feeding practices and prevalence of caries
at dentine level (D4-6MFT>0) and caries at all ............................................................. 219
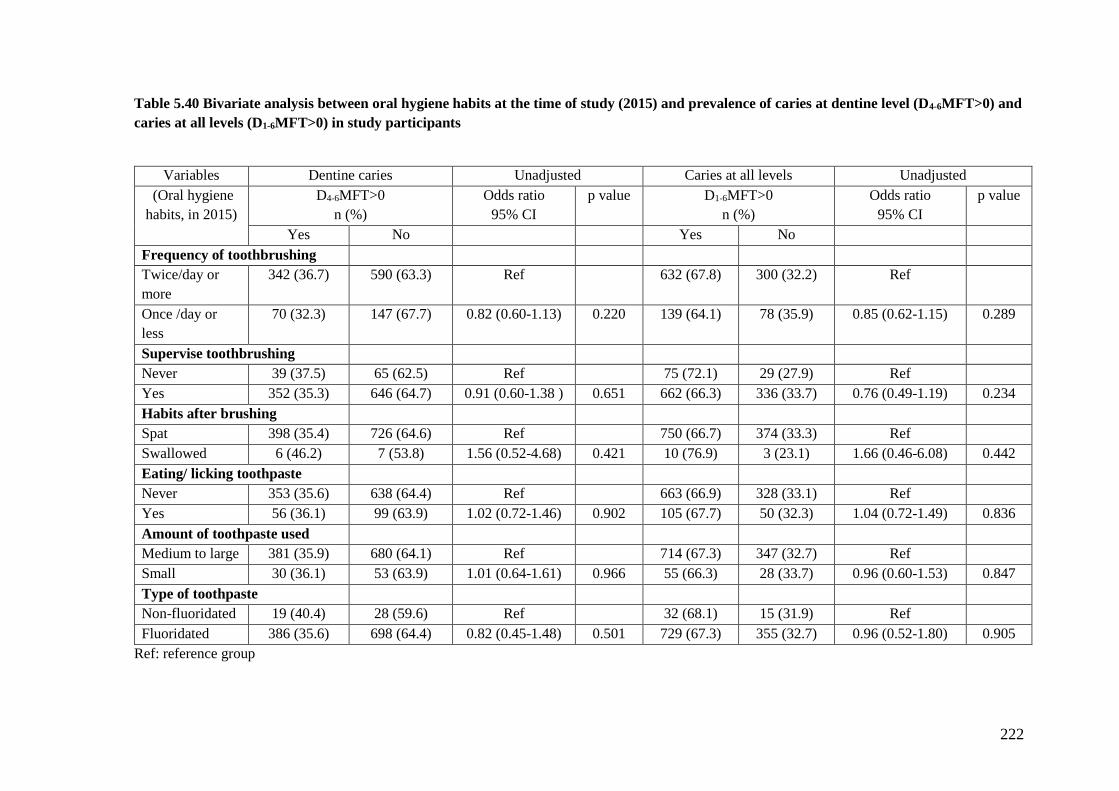
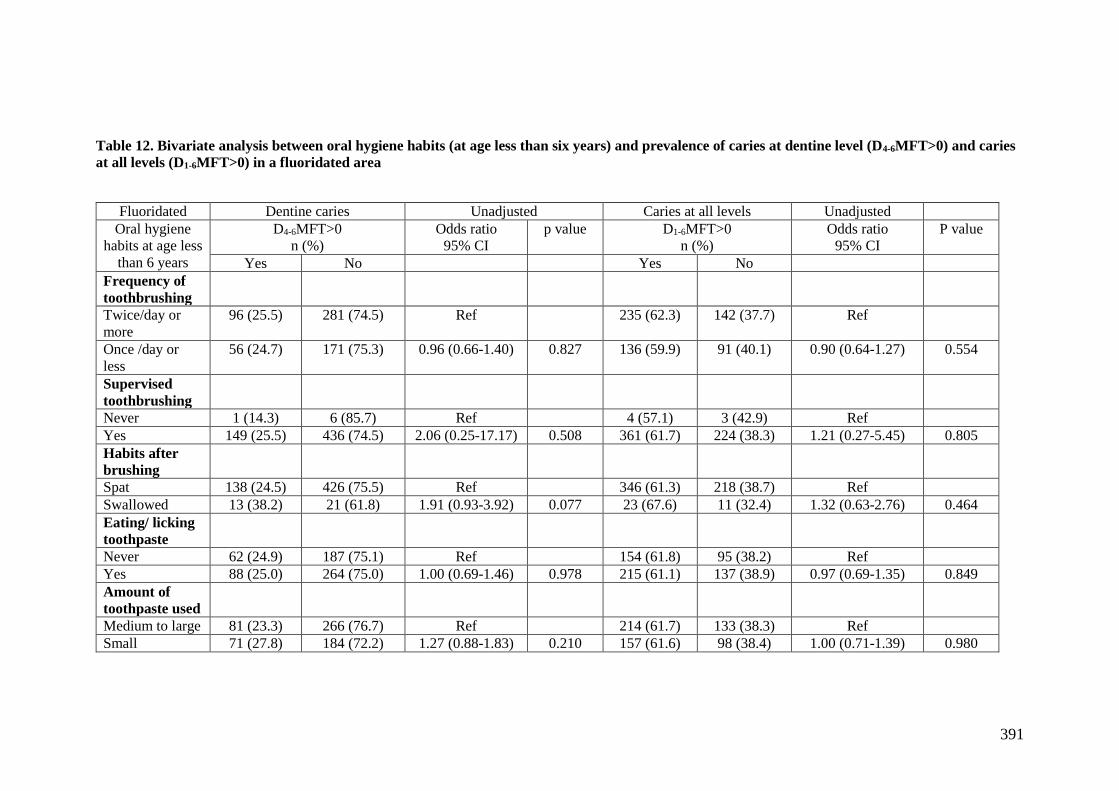
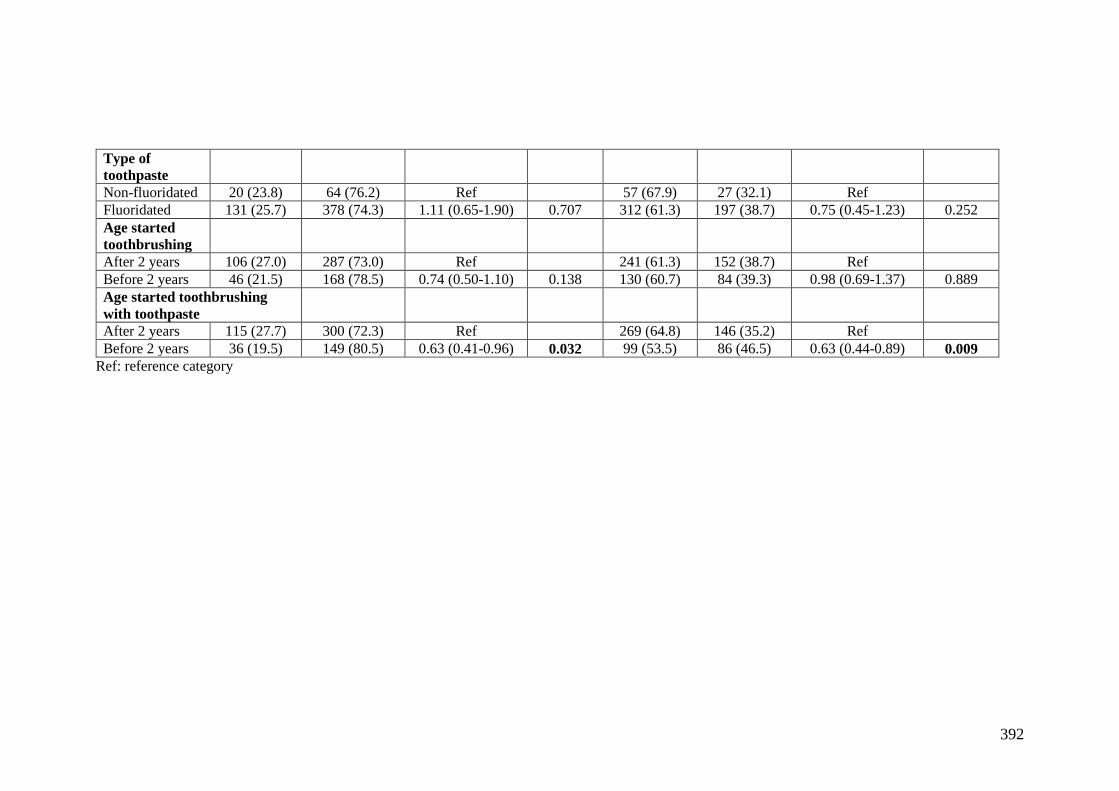
Table 5.40 Bivariate analysis between oral hygiene habits at the time of study (2015)
and prevalence of caries at dentine level (D4-6MFT>0) and caries at all levels (D1-
6MFT>0) in study participants ..................................................................................... 222
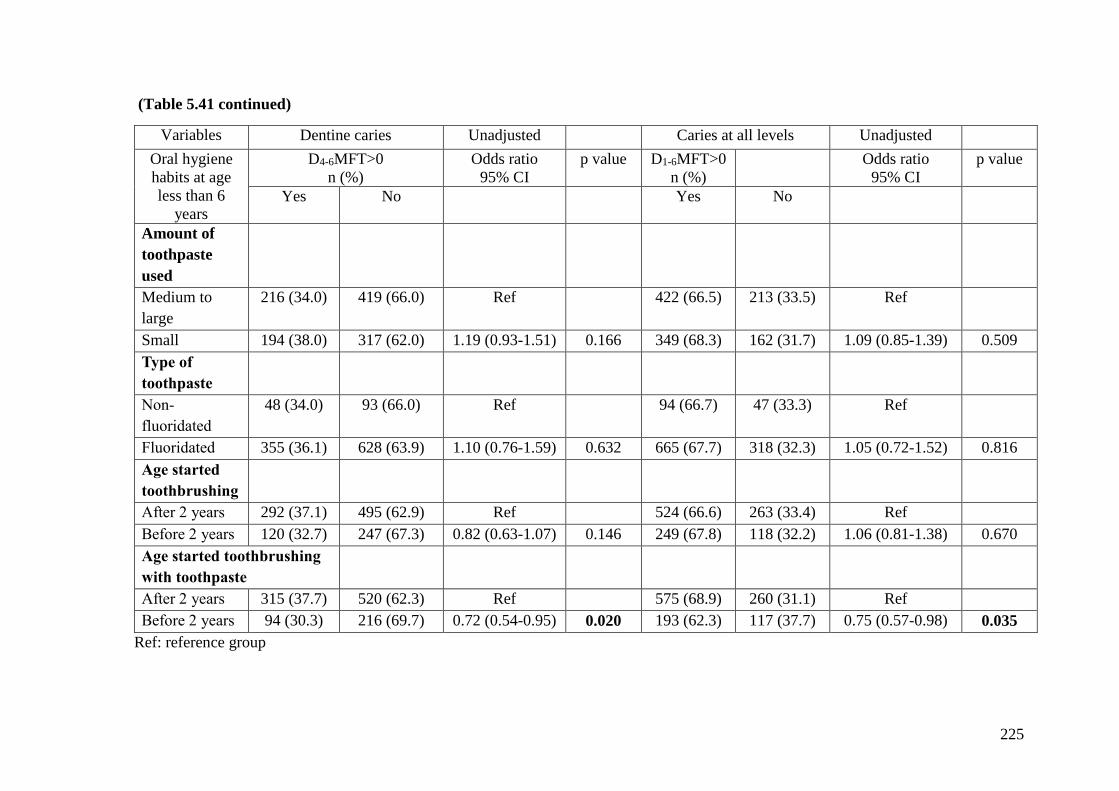
Table 5.41 Bivariate analysis between oral hygiene habits (at age less than six years)
and prevalence of caries at dentine level (D4-6MFT>0) and caries at all levels (D1-
6MFT>0) in study participants ..................................................................................... 224
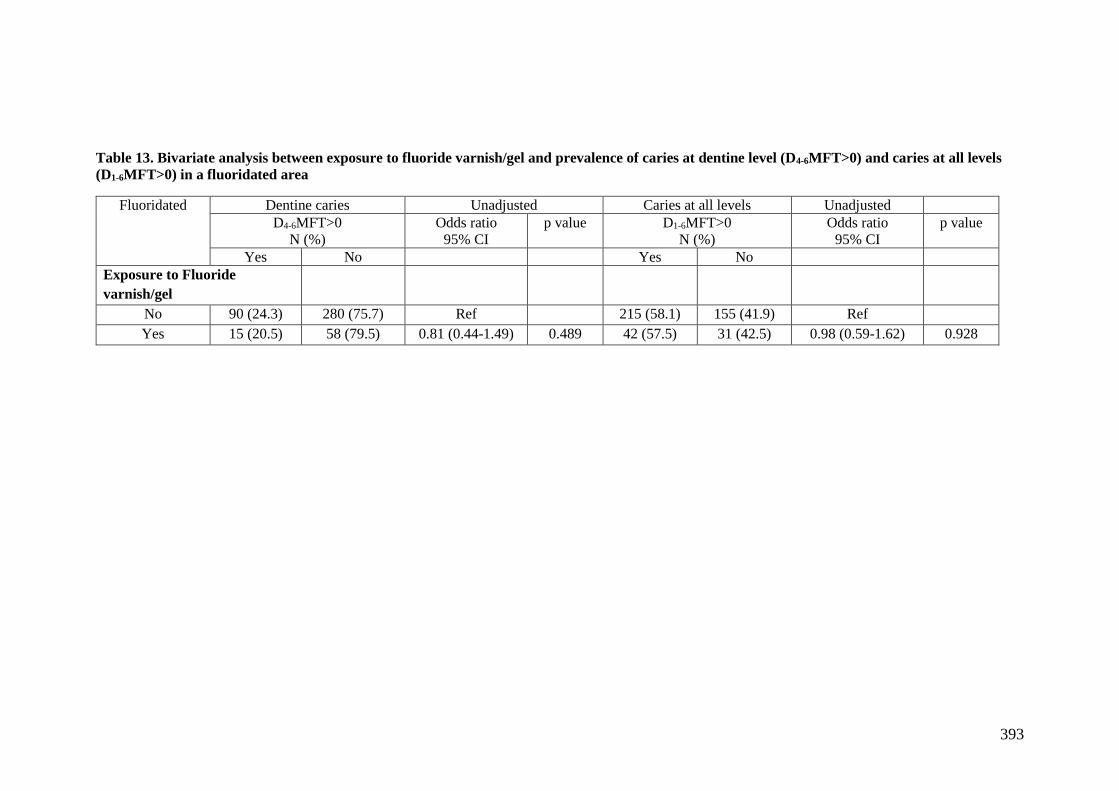
Table 5.42 Bivariate analysis between exposure to fluoride varnish/gel and prevalence
of caries at dentine level (D4-6MFT>0) and caries at all levels (D1-6MFT>0) in study
participants ................................................................................................................... 227
Table 5.43 Multivariate logistic regression model for caries prevalence at dentine level
(D4-6MFT>0) ................................................................................................................ 229
Table 5.44 Multivariate logistic regression model for caries prevalence at all levels (D1-
6MFT) ........................................................................................................................... 230
Page 17
xvi
List of appendices
Appendix 1 ICDAS II Criteria ..................................................................................... 295
Appendix 2 Nomenclature for recording dental caries in the present study ................ 296
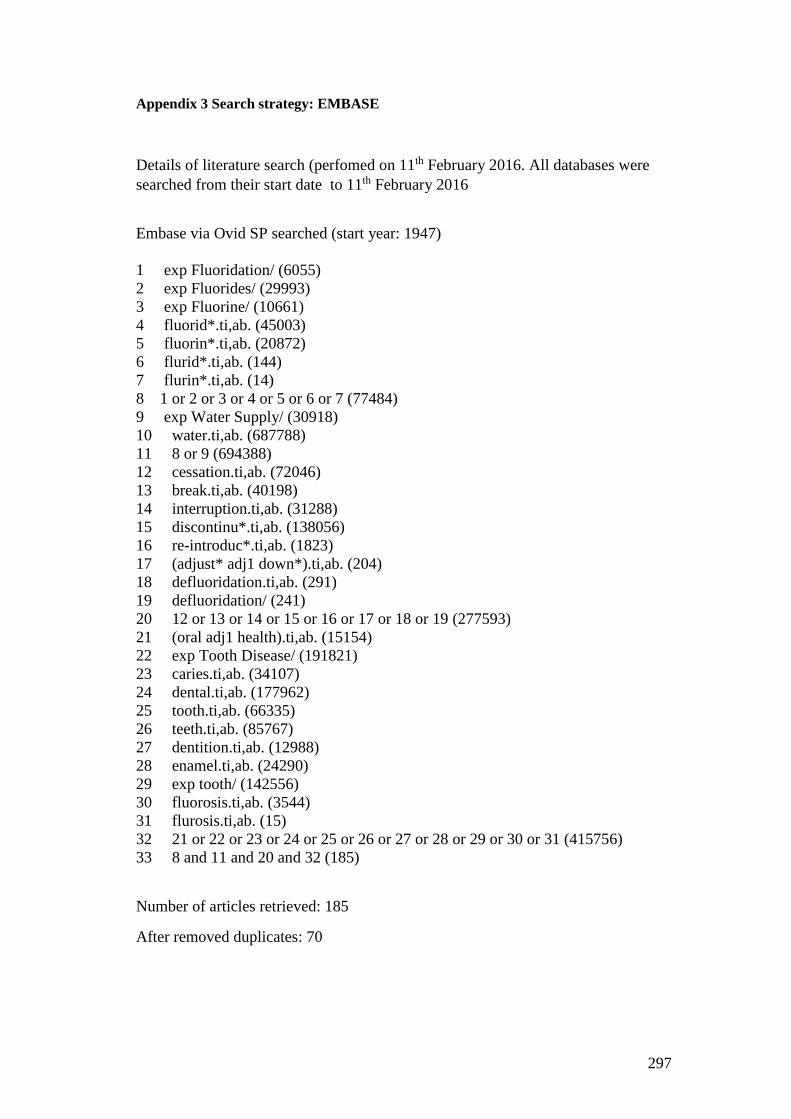
Appendix 3 Search strategy: EMBASE ....................................................................... 297
Appendix 4 Search strategy: Medline .......................................................................... 298
Appendix 5 Search strategy: The Cochrane central register of controlled trials ......... 299
Appendix 6 Search strategy: The web of science......................................................... 299
Appendix 7 Search strategy: unpublished papers ........................................................ 299
Appendix 8 Data extraction form ................................................................................. 300
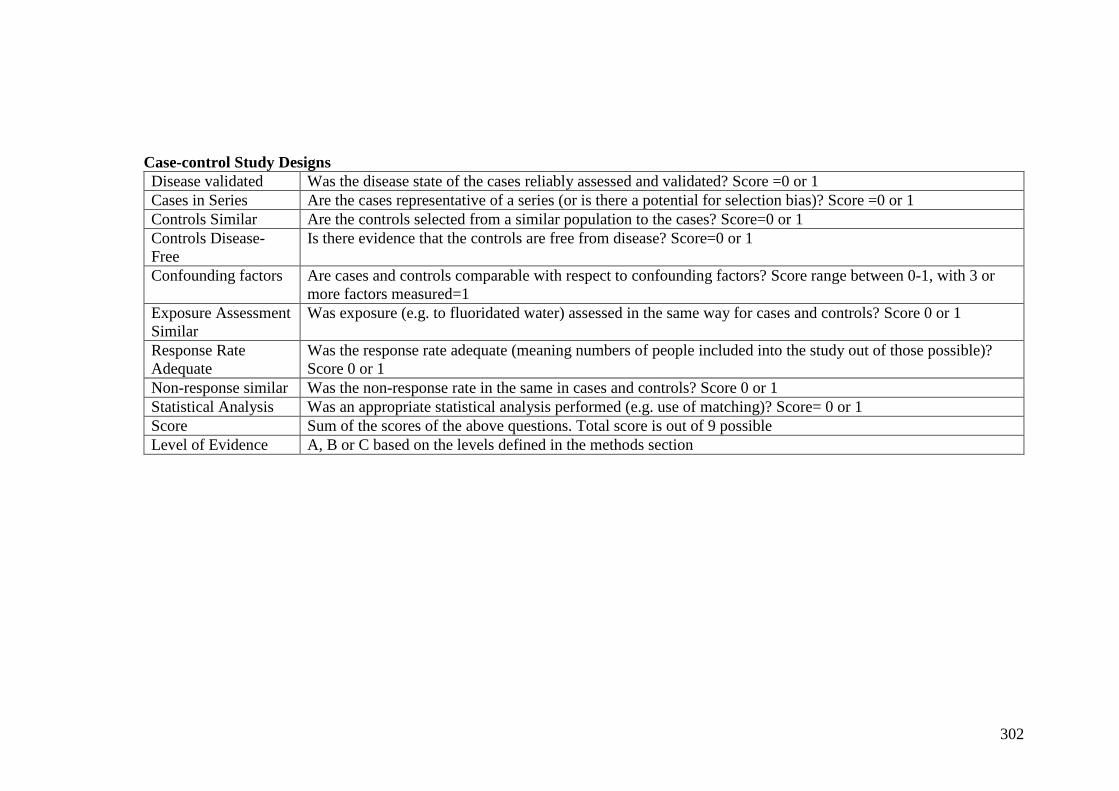
Appendix 9 Validity assessment scoring and definition of terms in the tables (adapted
from NHS Center for Reviews and Dissemiantion, 1996 in York Review, 2000) ...... 301
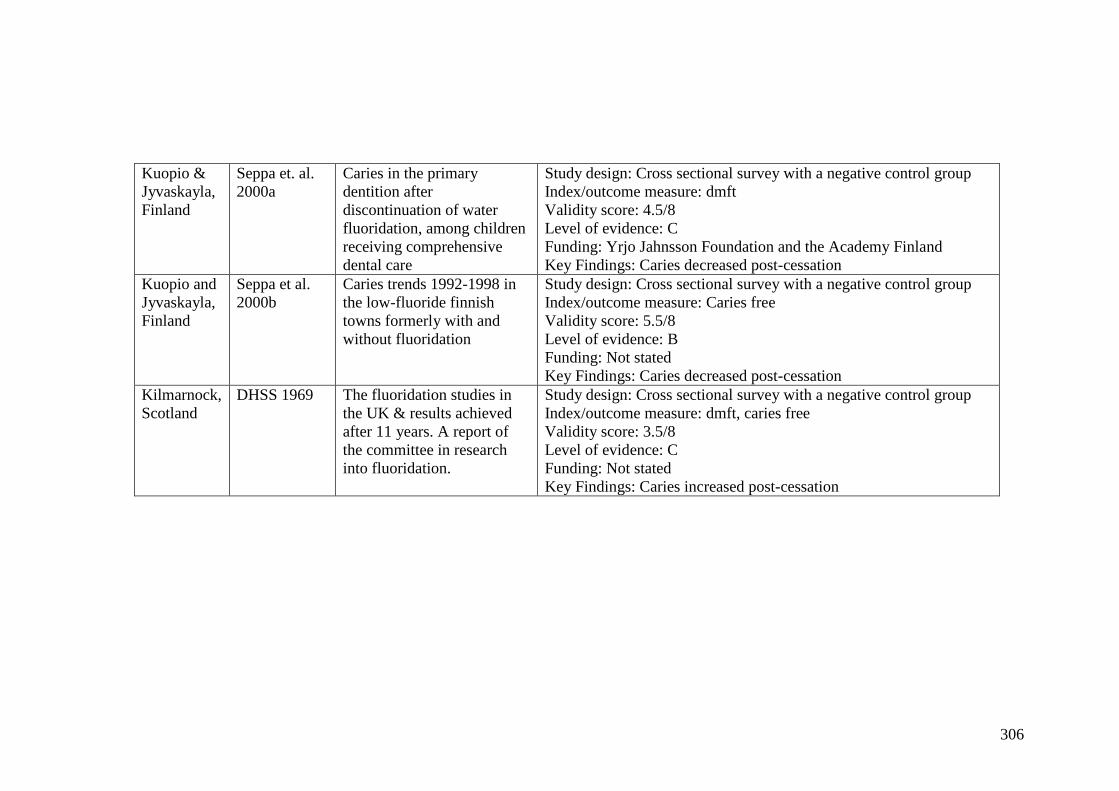
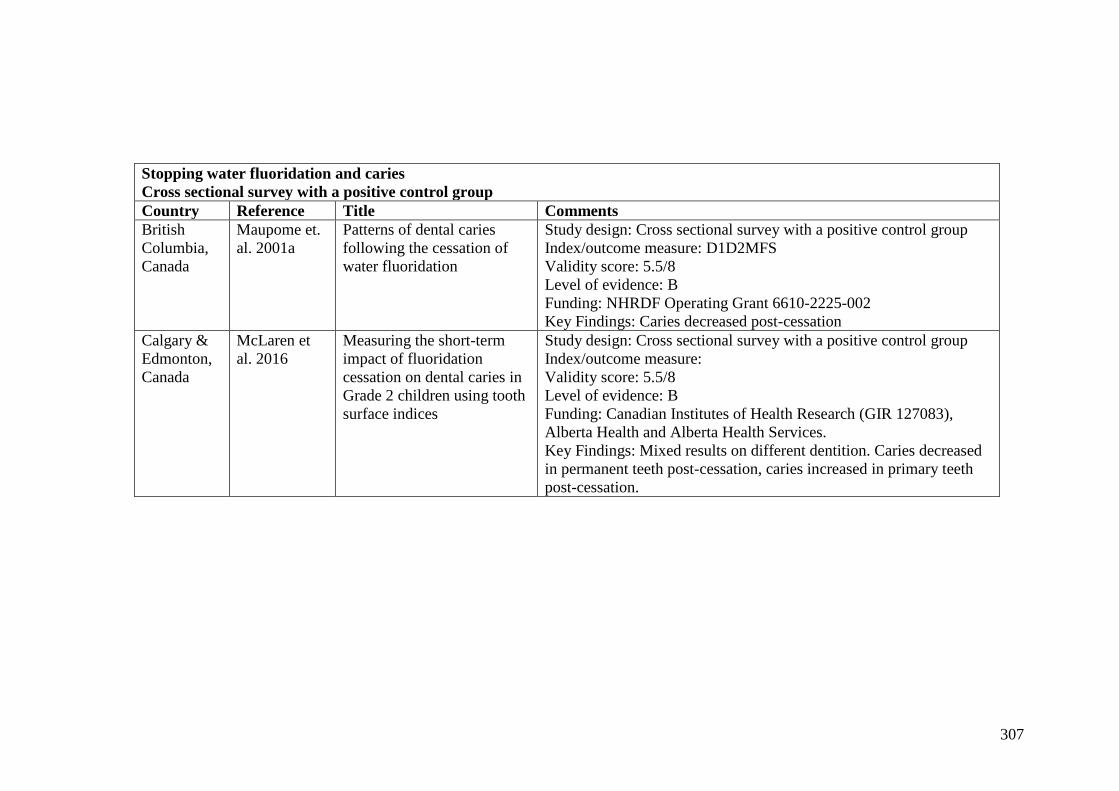
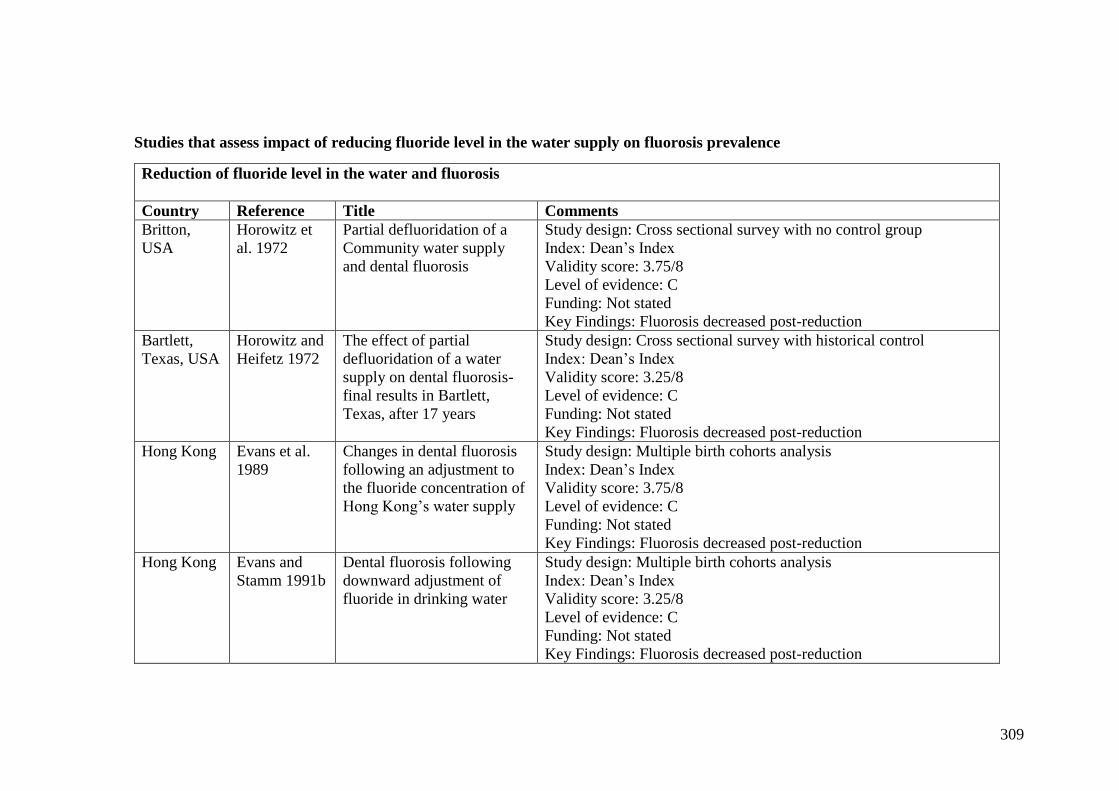
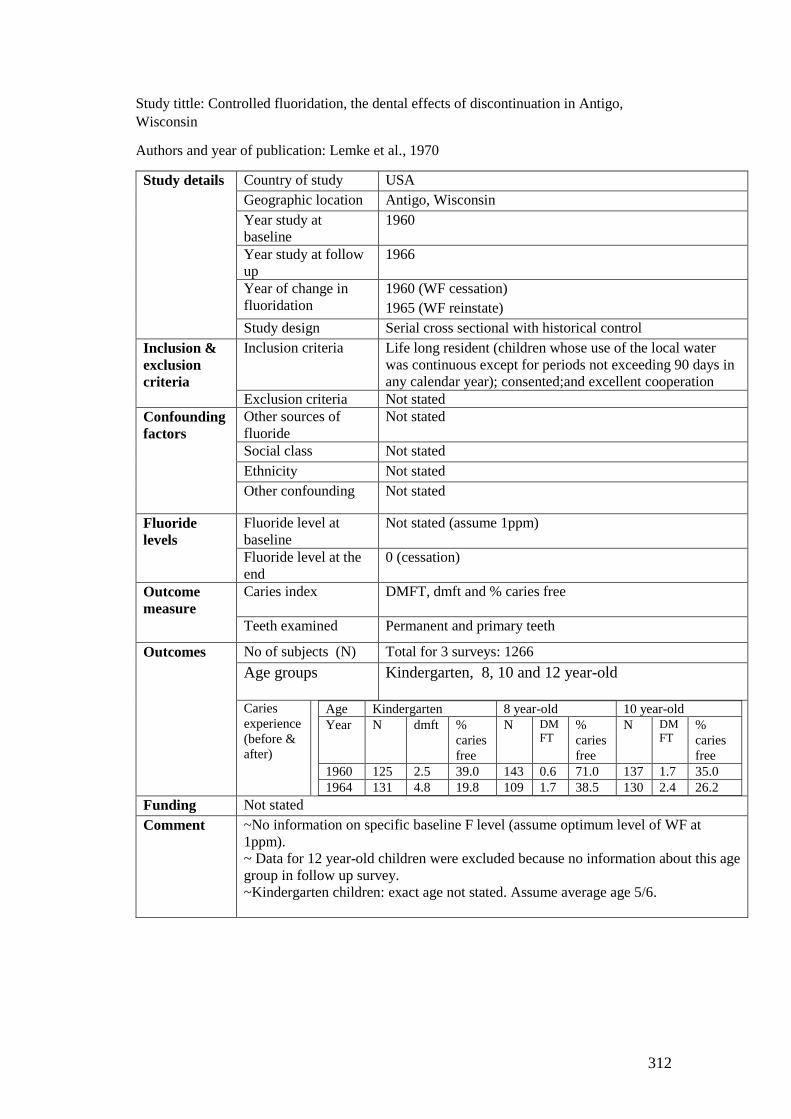
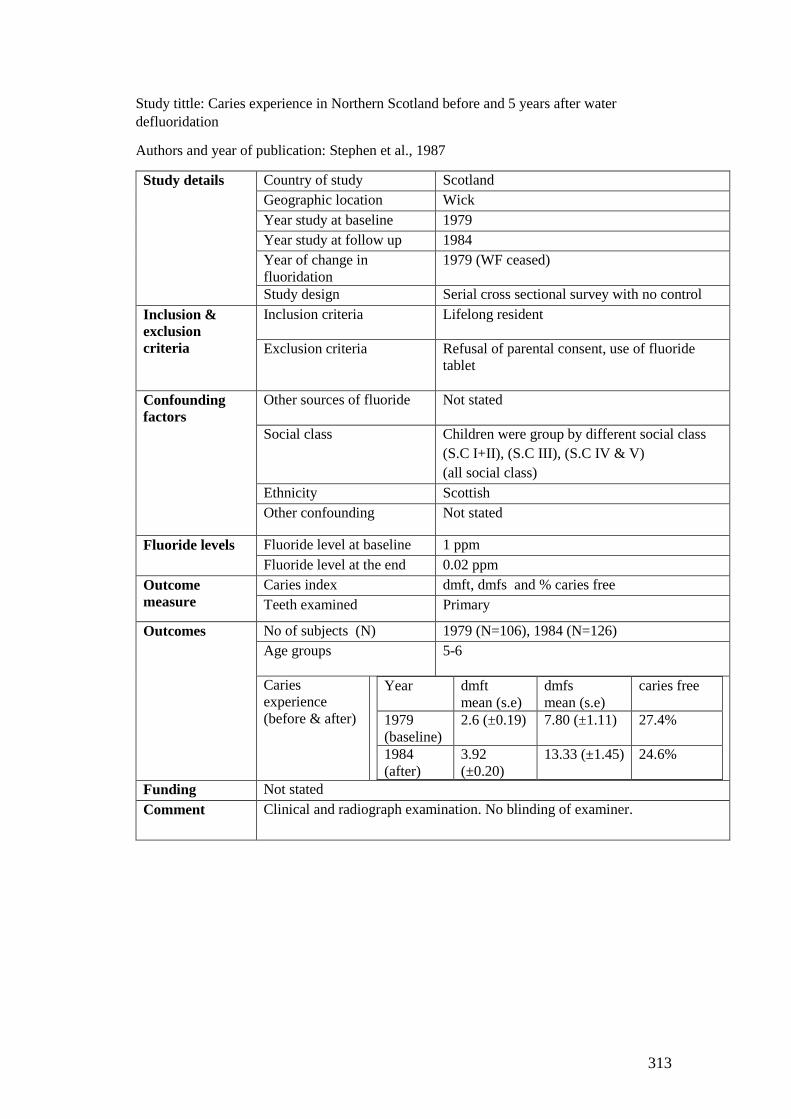
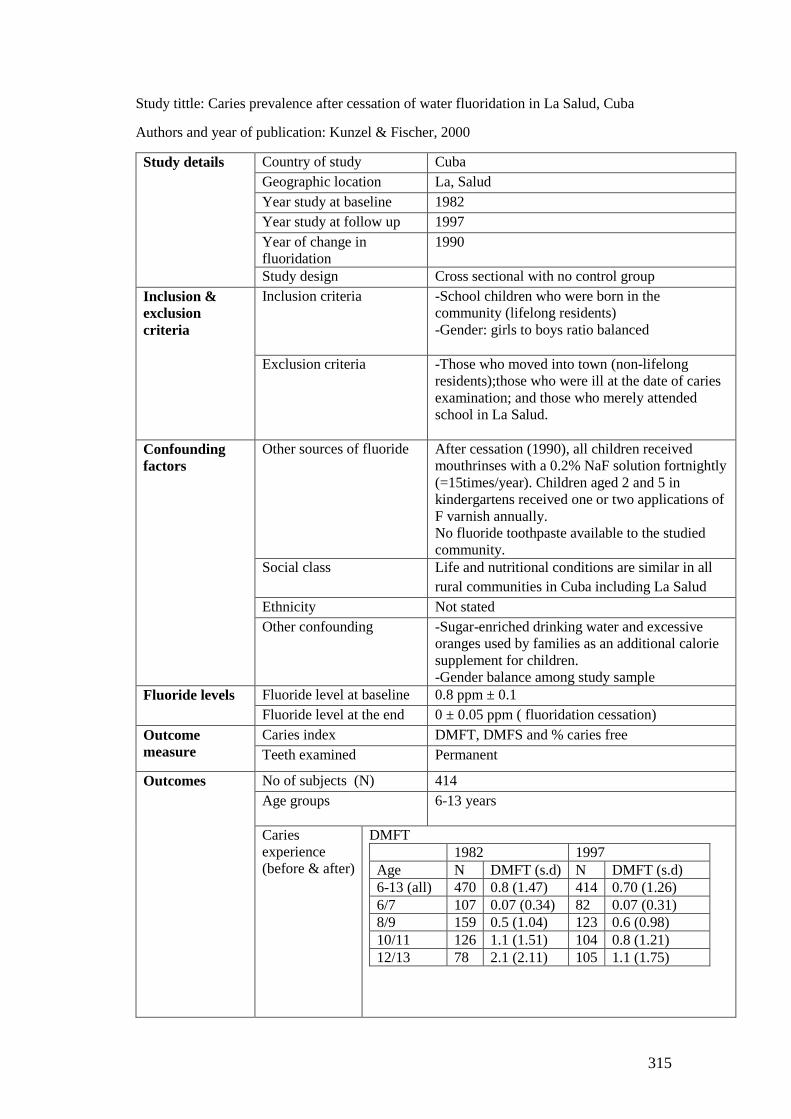
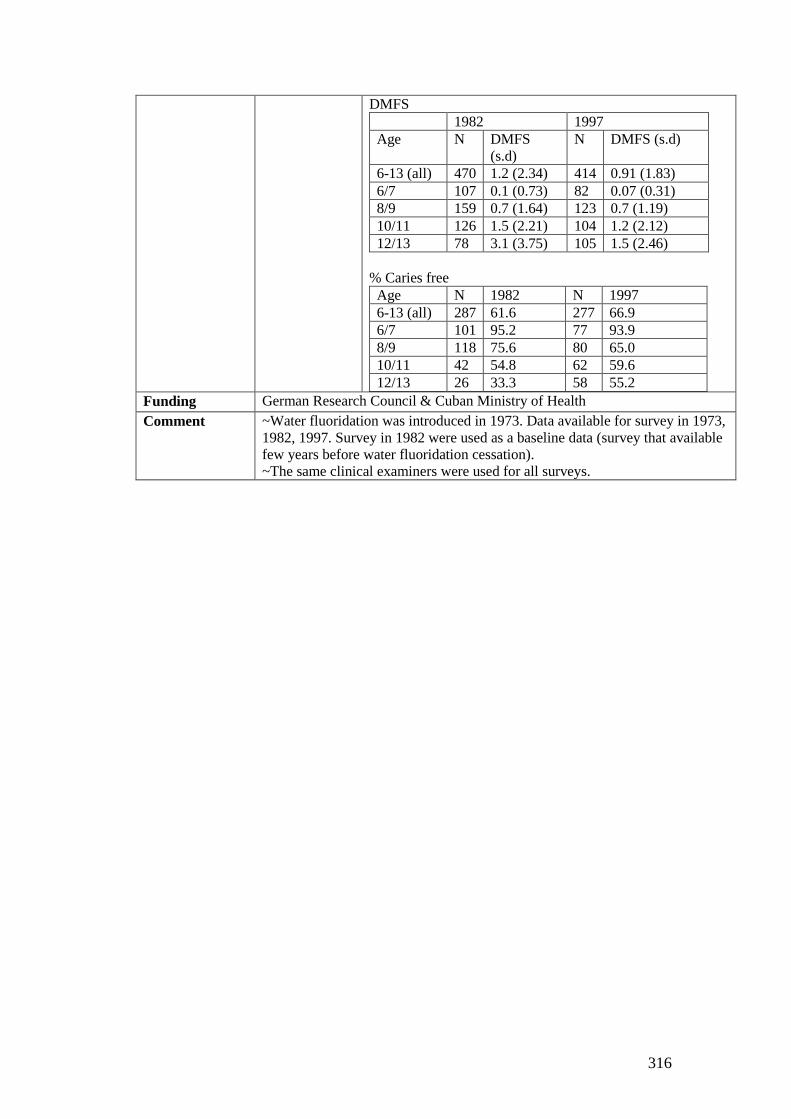
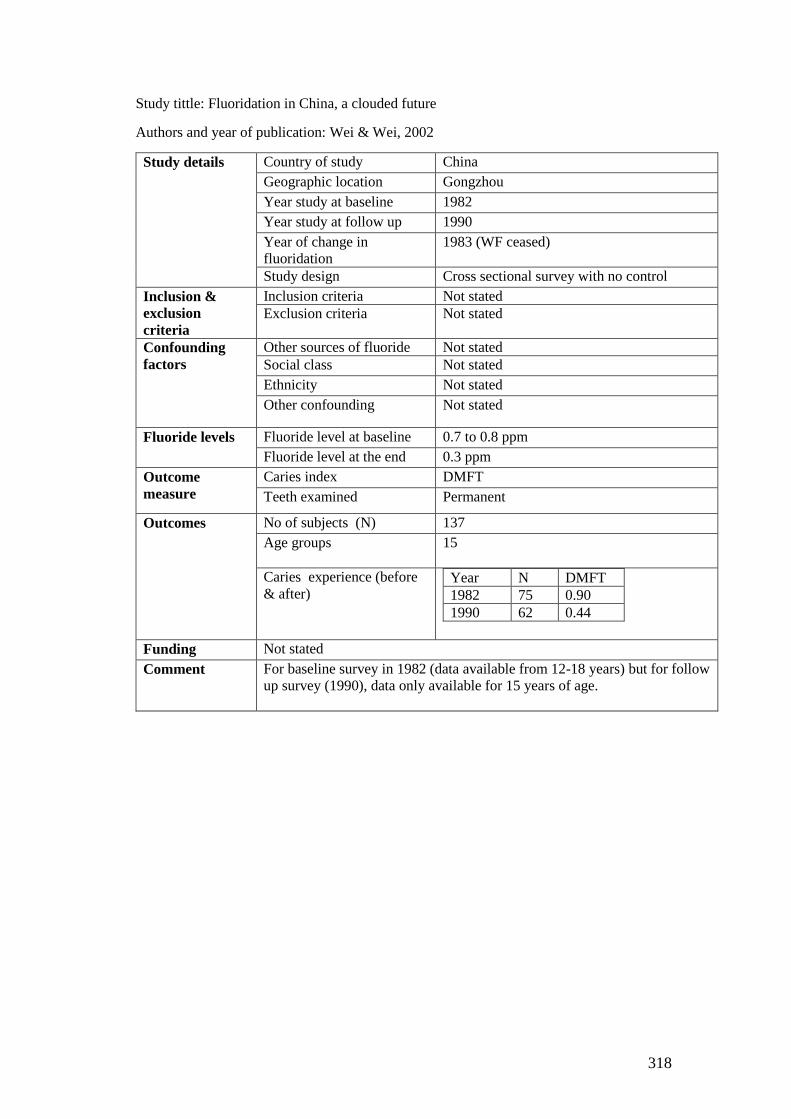
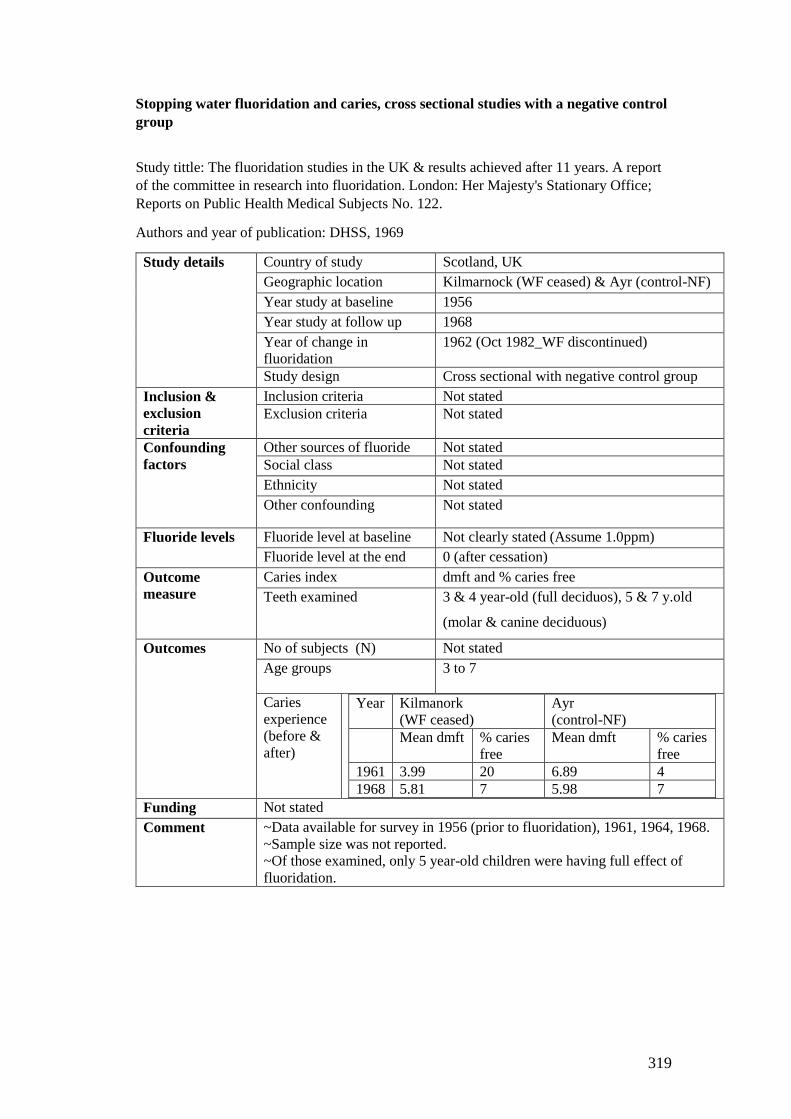
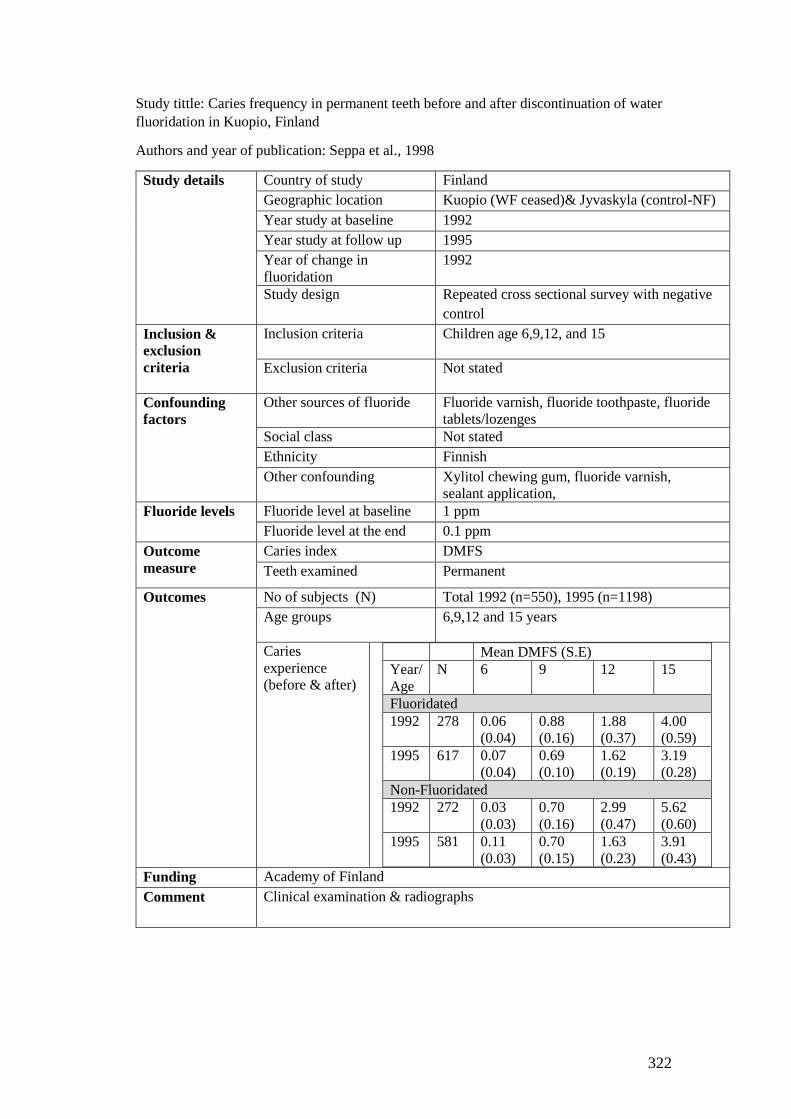
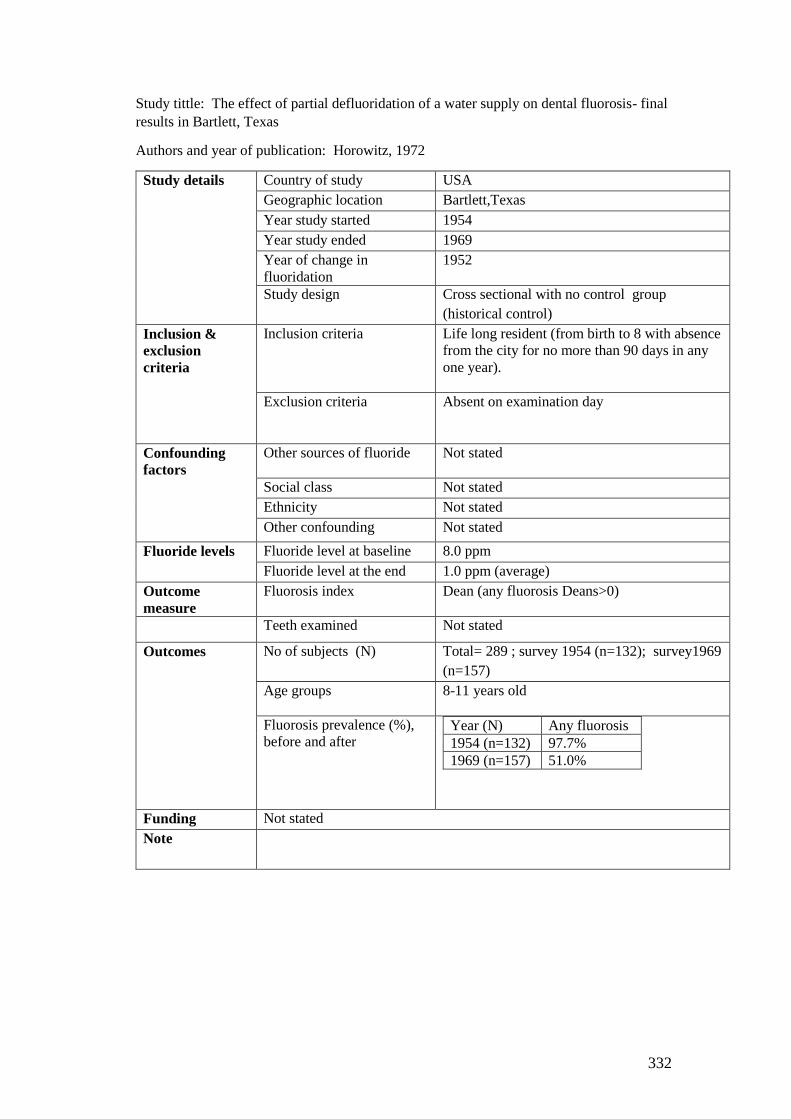
Appendix 10 Summary of the included studies that assess impact of reducing or
stopping fluoride level in the water on caries............................................................... 303
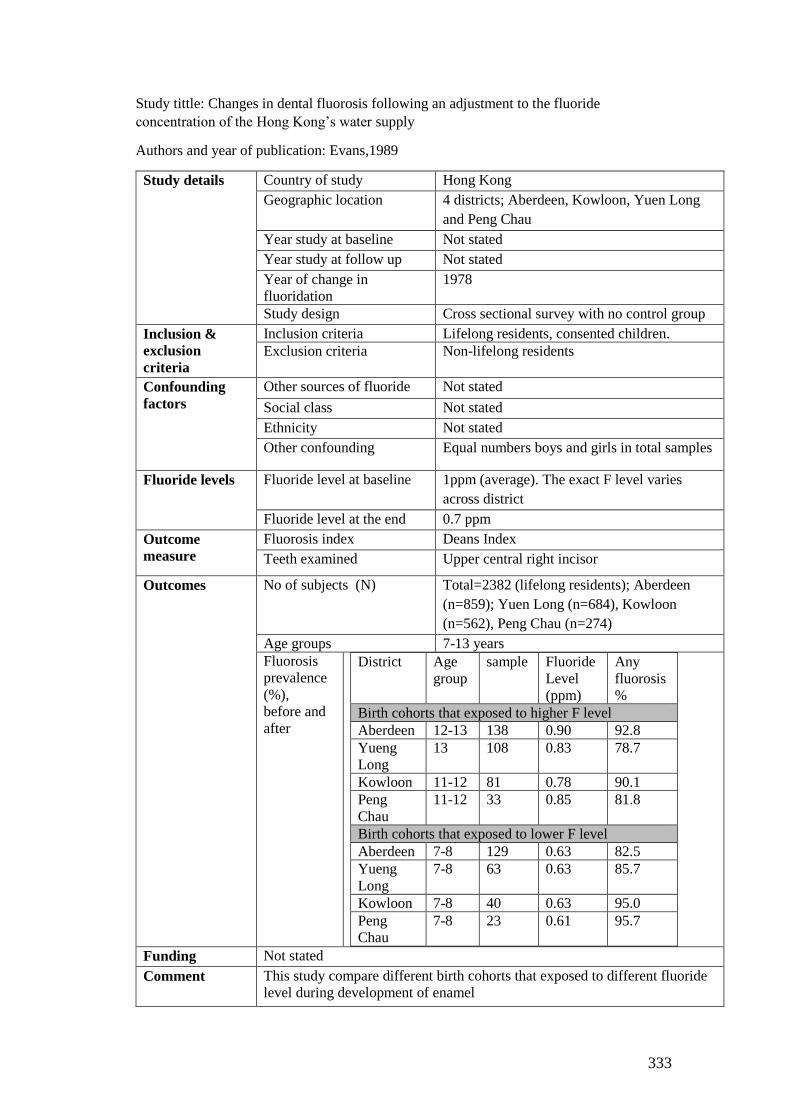
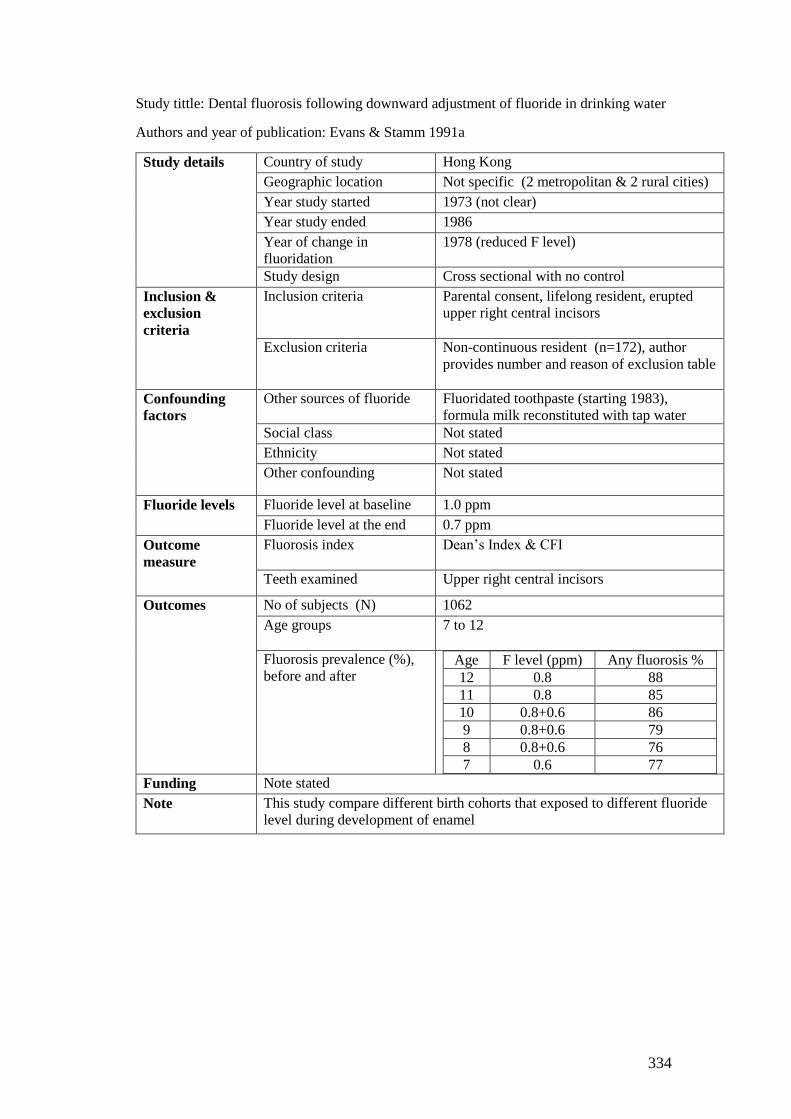
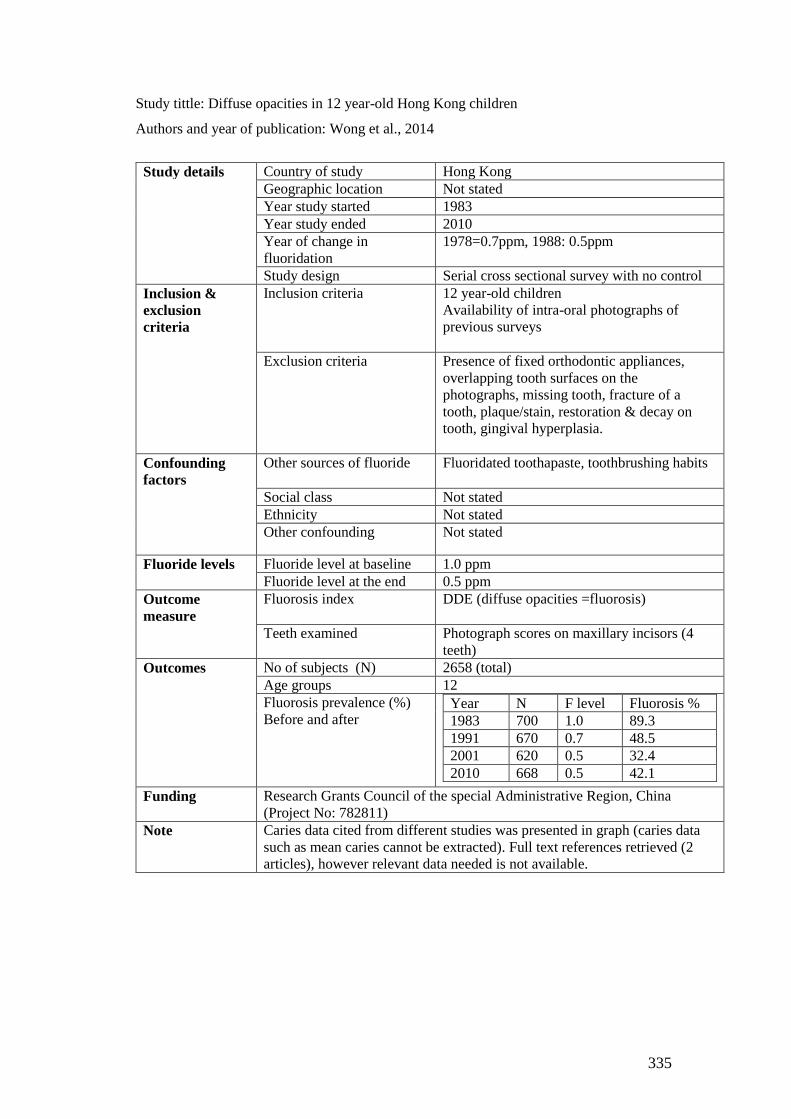
Appendix 11. Characteristics of included studies ........................................................ 311
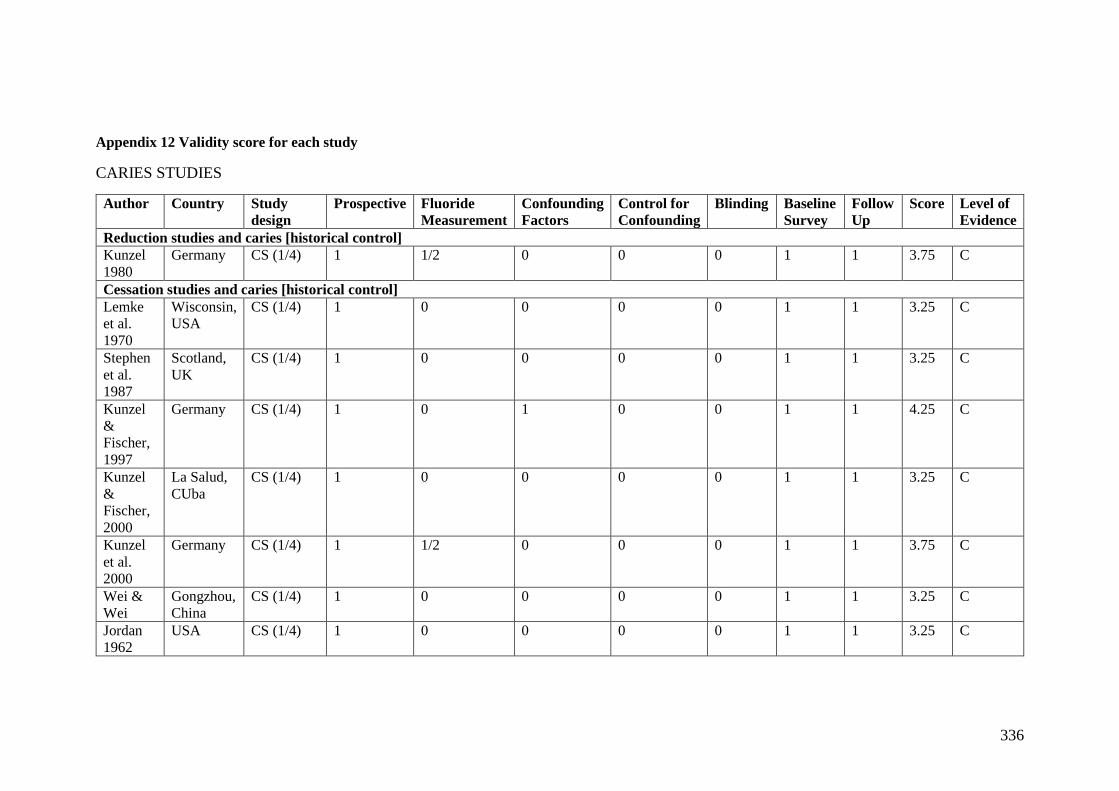
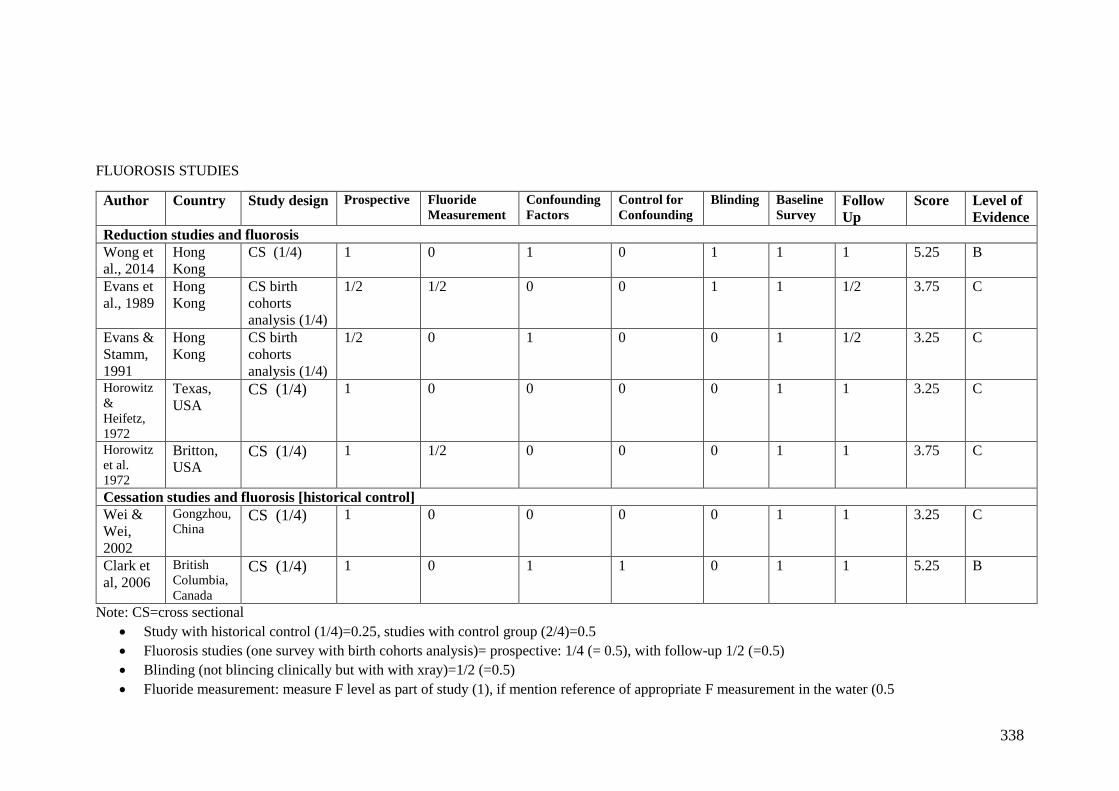
Appendix 12 Validity score for each study .................................................................. 336
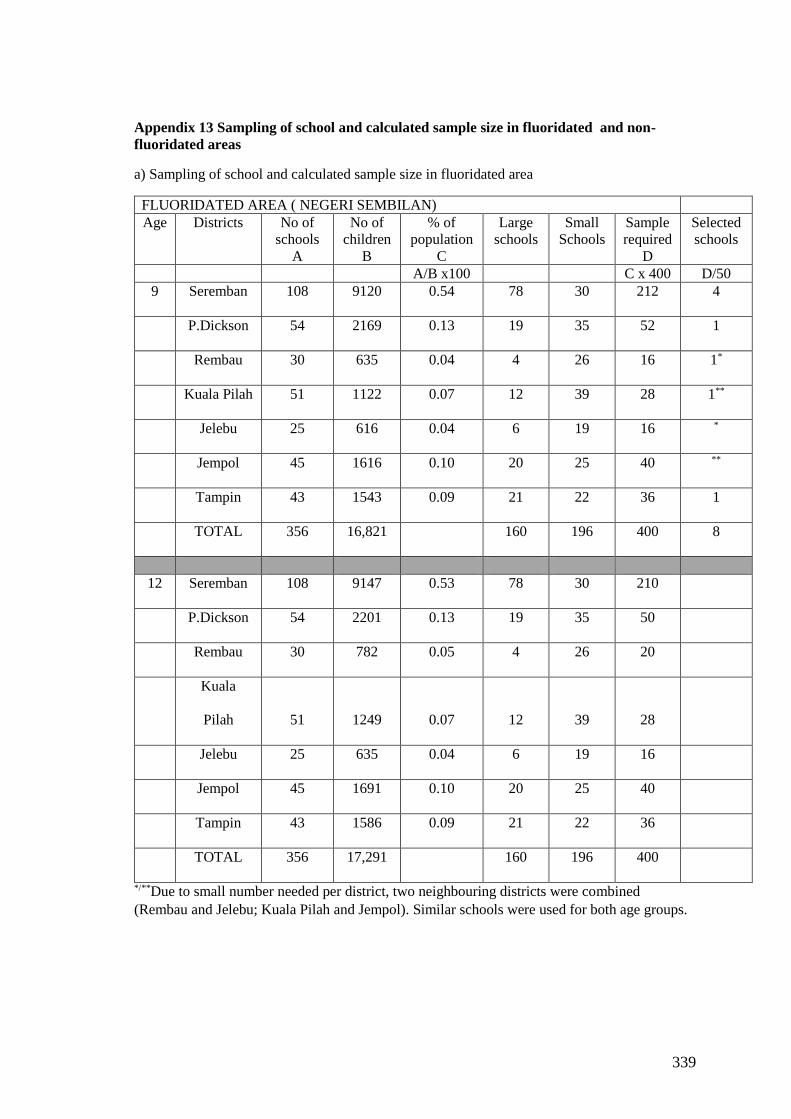
Appendix 13 Sampling of school and calculated sample size in fluoridated and non-
fluoridated areas ........................................................................................................... 339
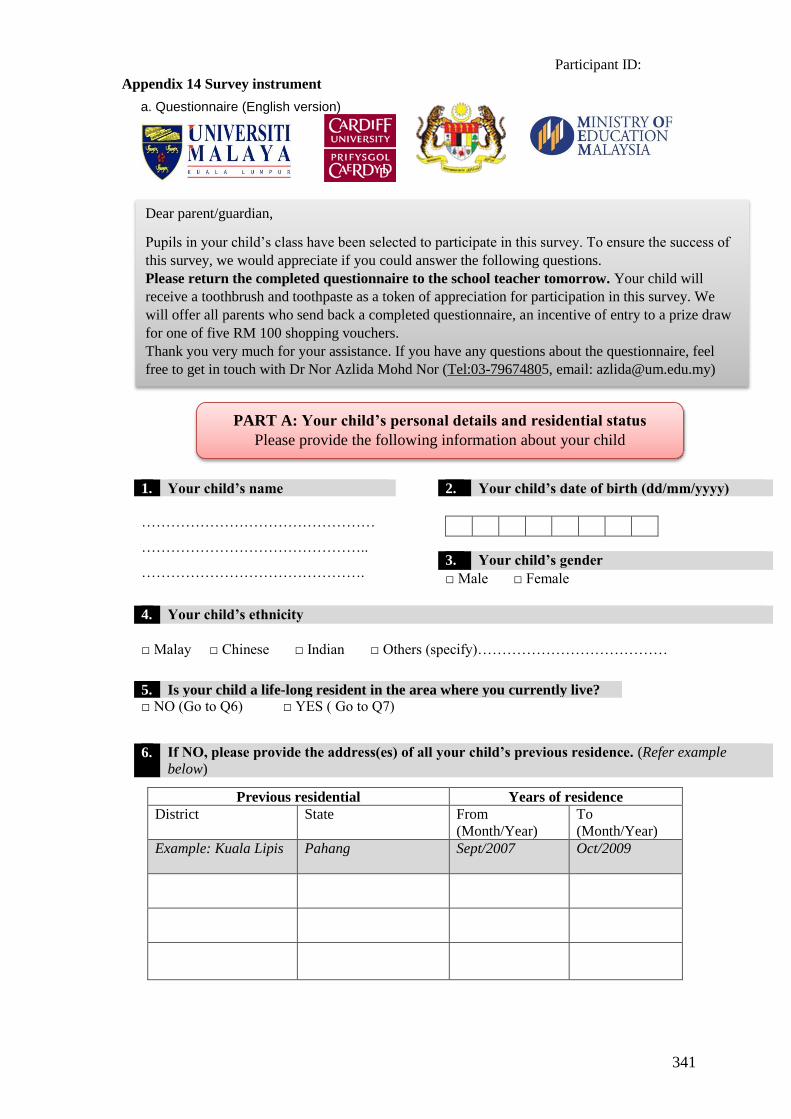
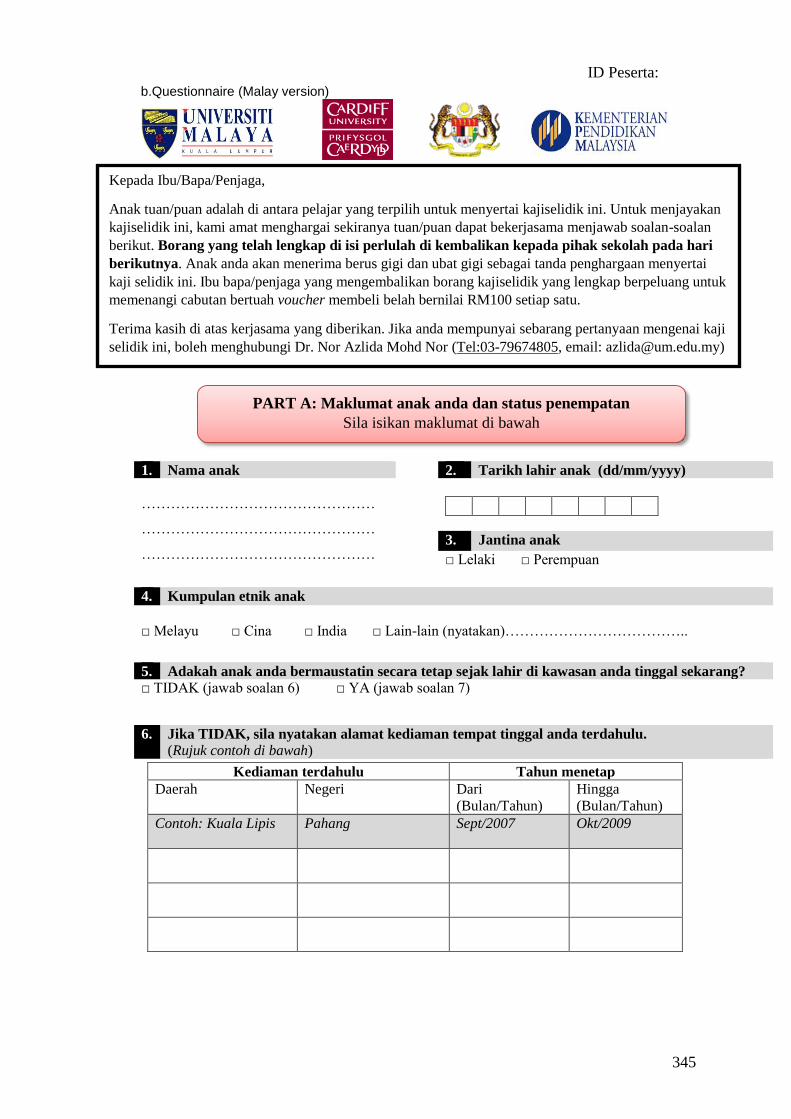
Appendix 14 Survey instrument ................................................................................... 341
Appendix 15 Guidelines of questionnaire distribution ................................................ 349
Appendix 16 Participant information Sheet (English Version) ................................... 351
Appendix 17 Consent form (English version) .............................................................. 353
Appendix 18 Patient Information Sheet (Malay version) ............................................ 354
Appendix 19 Consent form (Malay Version) ............................................................... 356
Appendix 20 Example of signed consent form ............................................................ 357
Appendix 21 Clinical examination room and procedure.............................................. 358
Appendix 22 Clinical examination form ...................................................................... 359
Appendix 23 Criteria for Dean’s fluorosis index ......................................................... 361
Appendix 24 Example of the intra-oral photographs of fluorosis ................................ 362
Appendix 25 Visual basic interface for ICDAS caries data ......................................... 363
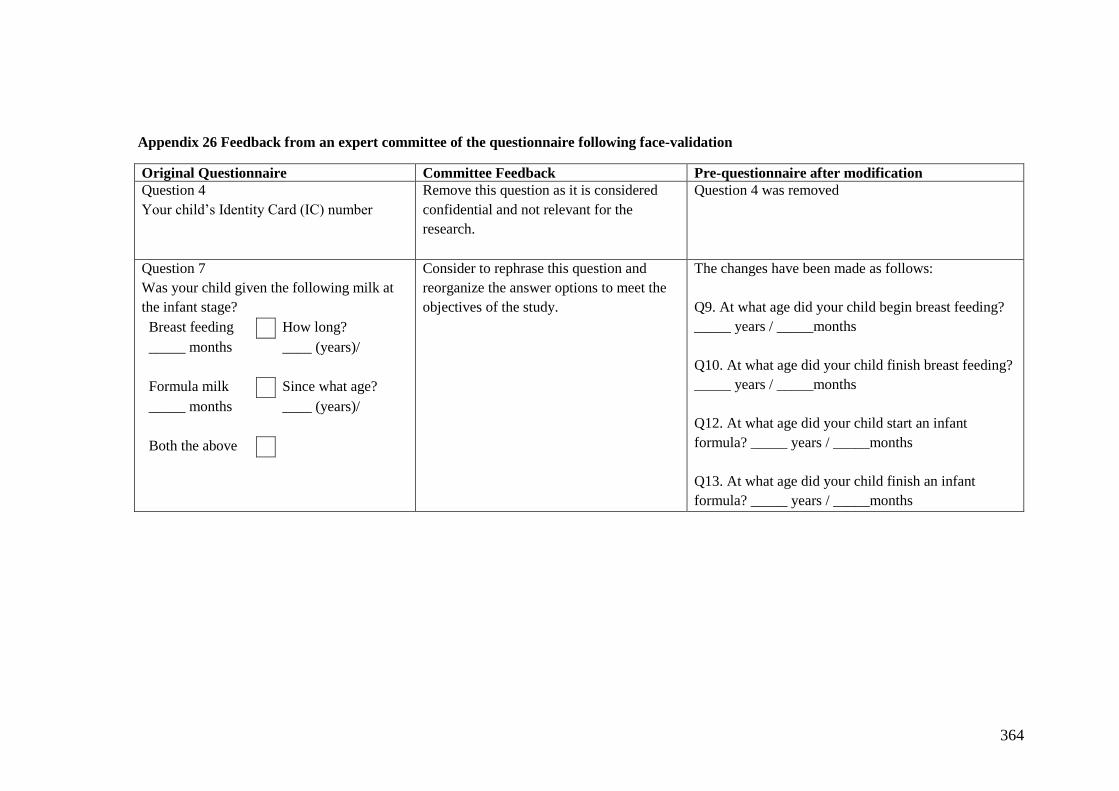
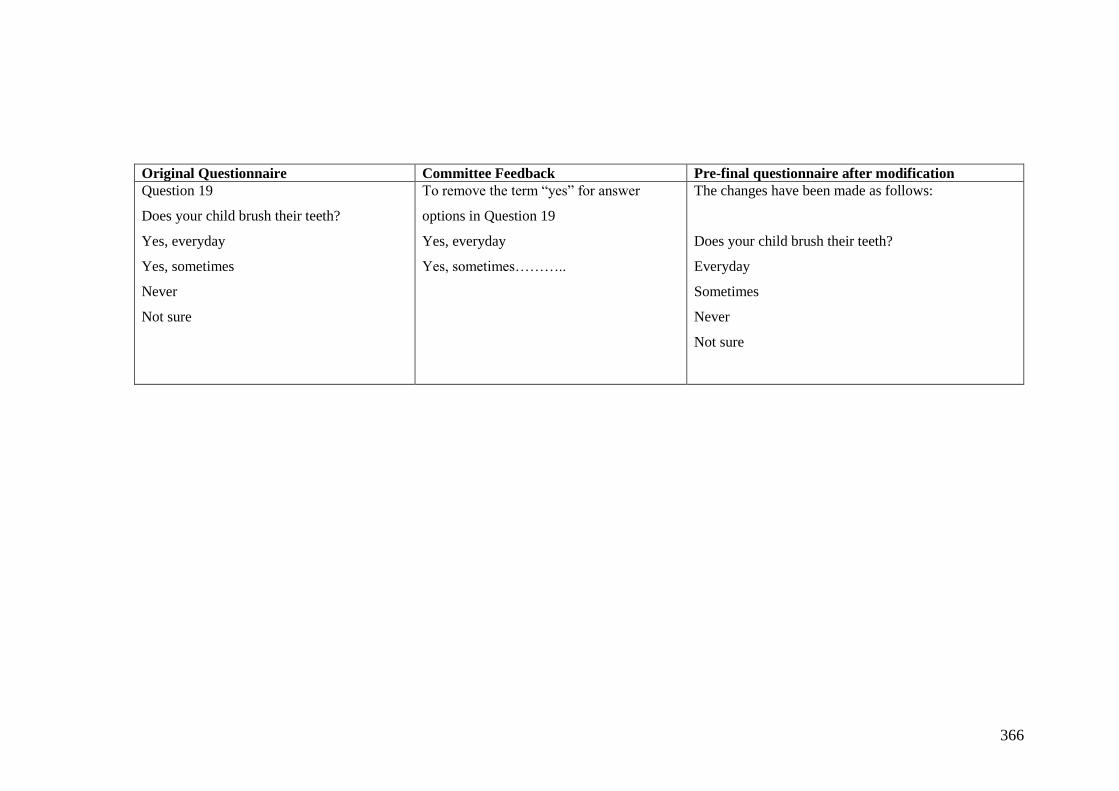
Appendix 26 Feedback from an expert committee of the questionnaire following face-
validation ...................................................................................................................... 364
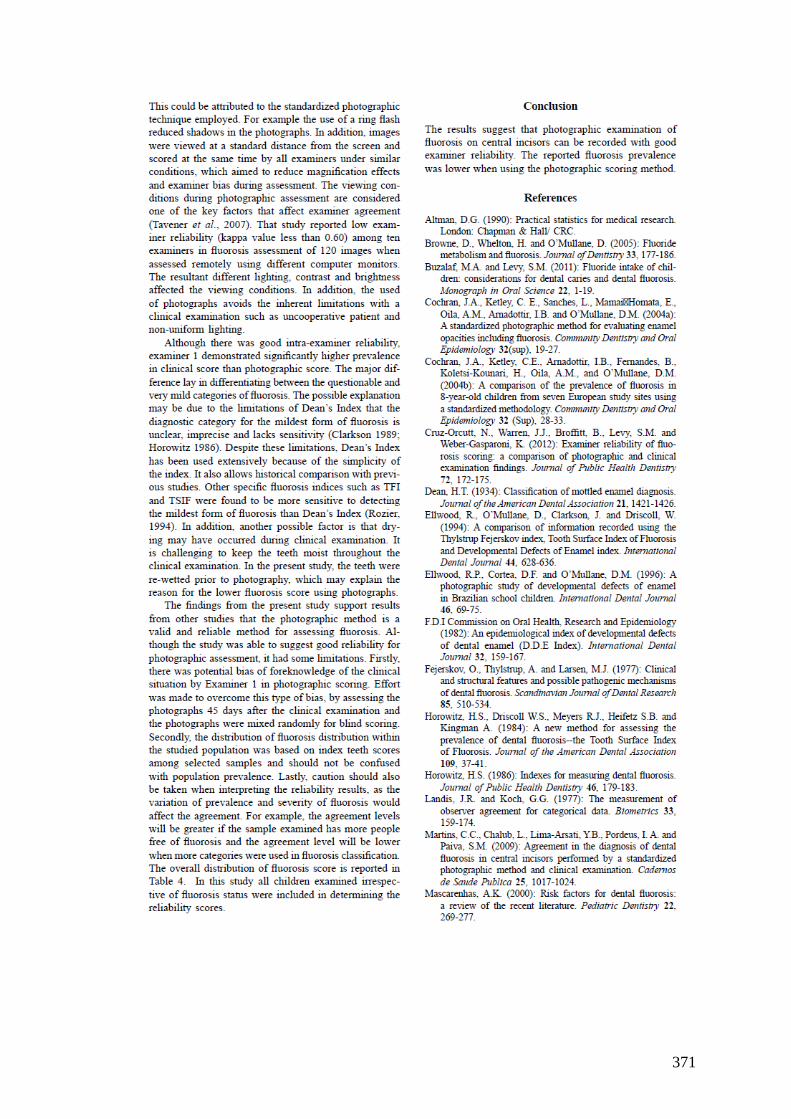
Appendix 27 Article in the Community Dental Health Journal ................................... 367
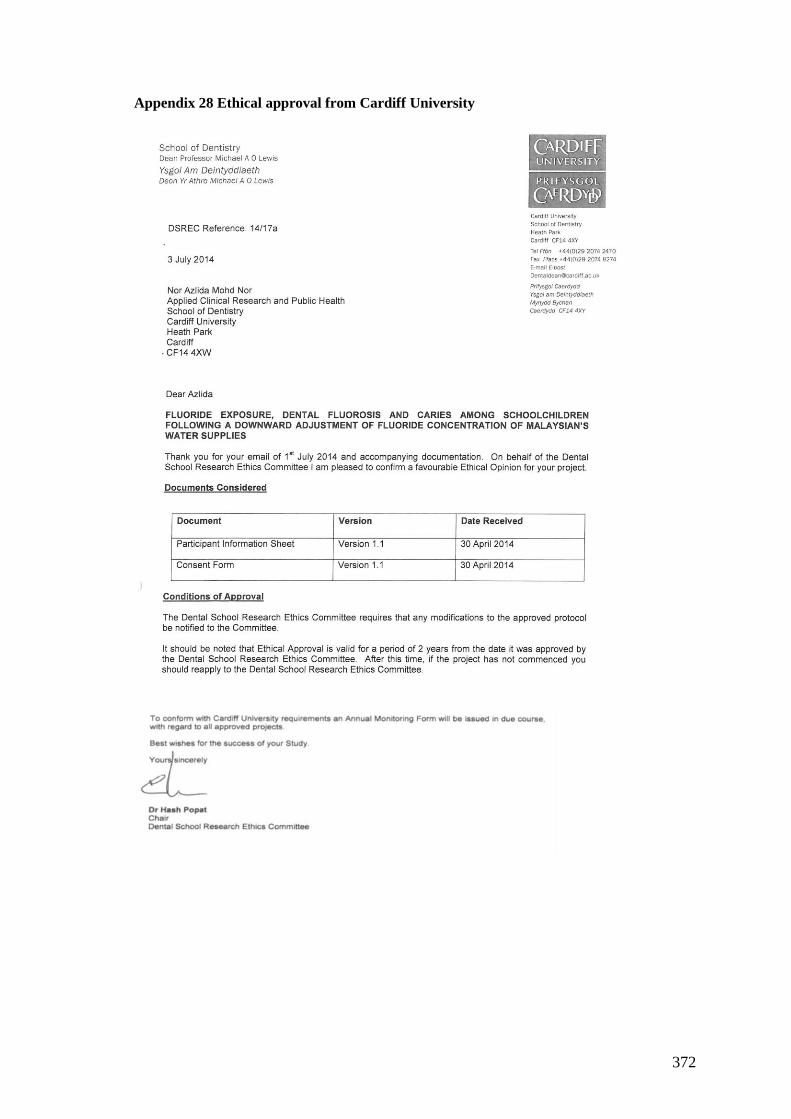
Appendix 28 Ethical approval from Cardiff University ............................................... 372
Page 18
xvii
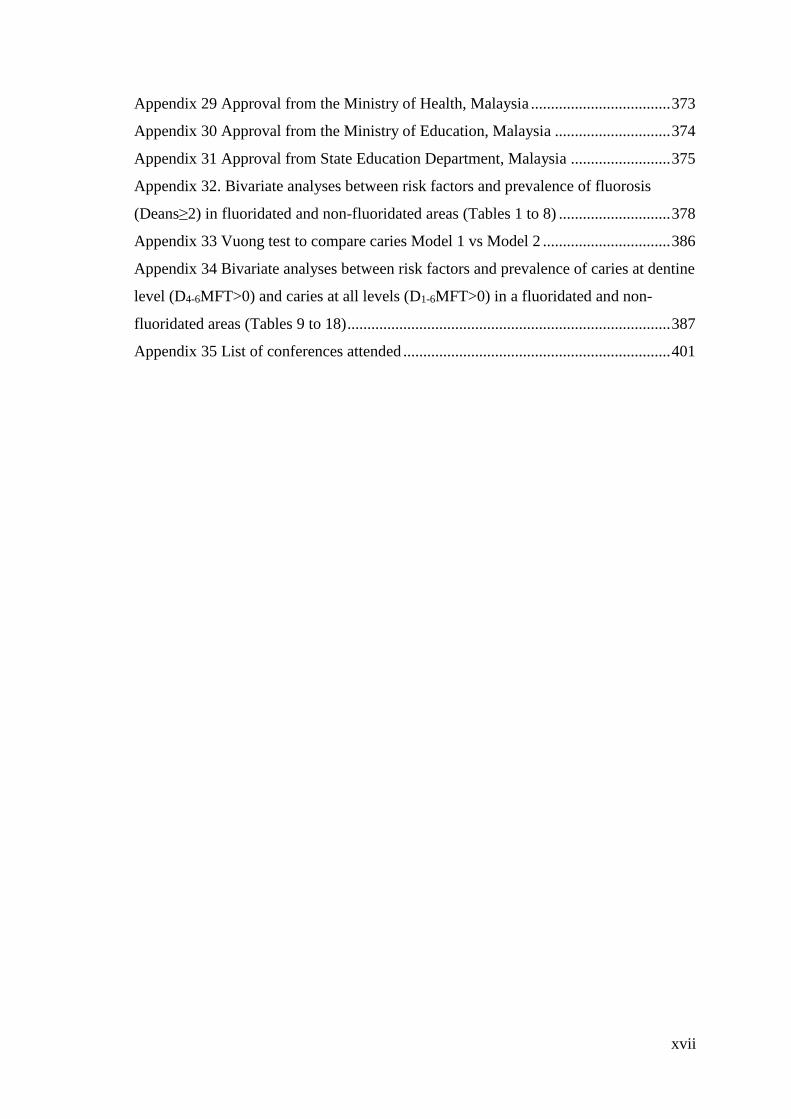
Appendix 29 Approval from the Ministry of Health, Malaysia ................................... 373
Appendix 30 Approval from the Ministry of Education, Malaysia ............................. 374
Appendix 31 Approval from State Education Department, Malaysia ......................... 375
Appendix 32. Bivariate analyses between risk factors and prevalence of fluorosis
(Deans≥2) in fluoridated and non-fluoridated areas (Tables 1 to 8) ............................ 378
Appendix 33 Vuong test to compare caries Model 1 vs Model 2 ................................ 386
Appendix 34 Bivariate analyses between risk factors and prevalence of caries at dentine
level (D4-6MFT>0) and caries at all levels (D1-6MFT>0) in a fluoridated and non-
fluoridated areas (Tables 9 to 18) ................................................................................. 387
Appendix 35 List of conferences attended ................................................................... 401
Page 19
1
1 Introduction and literature review
Introduction to the thesis
This thesis consists of two main projects. The first project is a systematic review looking
at the impact of stopping and reducing fluoride level in the water supply on caries and
fluorosis. This is reported in Chapter 2. The second project is the main study, which
evaluated the effect of a downward adjustment of fluoride level from 0.7 ppm to 0.5 ppm
in the Malaysian water supply on caries and fluorosis. This comprised the main body of
the thesis.
The thesis consists of seven chapters and is structured as follows:
Chapter 1 is an introduction to the thesis and a literature review that focuses on key
evidence with regards to fluoride and its relation to dental caries and fluorosis. Chapter
2 describes the systematic review of the literature on the impact of stopping or reducing
fluoride level in the water on dental caries and fluorosis. A discussion related to the key
findings of the systematic review is also included. Chapter 3 presents the rationale for
the main study followed by the research questions and aims and objectives. Chapter 4
describes the material and methods employed to address the study objectives. Chapter 5
reports the results of the main study. Chapter 6 presents a general discussion that draws
together overall findings from the main study, how it is linked to the findings from the
systematic review and the implications to the PhD project as a whole. Chapter 7
concludes the overall projects and provides the implications on practice and direction for
future research.
Page 20
2
Literature review
The literature review in this chapter is divided into four main sections. The first section
gives an overview of fluoride in our environment and how it is related to oral health. The
following sections review the key literature on dental fluorosis and dental caries. The last
section presents an overview of fluoride exposure in Malaysia.
1.2.1 Fluoride and oral health
Availability, absorption, excretion and metabolism of fluoride
Fluoride is the ionic form of fluorine, a member of the halogen group. Fluorine is the
most reactive and the most electronegative of the elements in the periodic table.
However, fluorine is not found as its element form, it is found as the fluoride ion in soils,
rocks and water in different concentrations (Smith and Ekstrand, 1988, Whitford, 1999,
Dhar and Bhatnagar, 2009, Buzalaf and Whitford, 2011).
Following ingestion, fluoride is absorbed systemically from the gastrointestinal tract.
Fluoride is taken-up in higher proportions from liquids than solids, approximately 85-
97% from water and 80-90% from food (Trautner and Einwag, 1989, Whitford, 1999,
Buzalaf and Whitford, 2011). The amount of fluoride absorbed is influenced by the
concentration of cations such as calcium, magnesium and aluminium. High levels of
cations bind with the fluoride ion and form insoluble substances which are less likely to
be absorbed (Whitford, 1996). The rate of the absorption is also inversely related to the
acidity of the gastric contents. The higher the acidity of the gastric content, the faster the
fluoride absorption from the stomach (Messer and Ophaug, 1993). Of the fluoride that
remains in the body, approximately 99% is deposited in bones, enamel and dentine.
Page 21
3
Enamel fluoride concentrations are usually lower than dentine and bone. Enamel fluoride
mainly reflects the levels of fluoride exposure during the tooth formation stage, whereas
dentine and bone fluoride levels are generally the result of the dynamic metabolism of
fluoride (Buzalaf and Whitford, 2011).
Fluoride is eliminated from the body through urine, faeces and sweat. The main fluoride
excretion route is exclusively through urine, with about half of the absorbed fluoride
being excreted within 24 hours. Approximately 10-25% of the total daily fluoride intake
is not absorbed systemically and is consequently excreted through faeces (Ekstrand et
al., 1994, Whitford, 1996, Maguire and Zohoori, 2013). Sweat is considered a minor
route of fluoride excretion under most environmental conditions approximately 1-
3ːµmol/L (Smith and Ekstrand, 1996, Whitford, 1996, Buzalaf and Whitford, 2011).
Sources of fluoride exposure
Fluoride is found naturally in soil, rocks and plants and to a certain extent fluoride is
present in water and food (Smith and Ekstrand, 1988, McGrady et al., 2010). Therefore
everyone has some potential for fluoride ingestion on a daily basis. Fluoride may be
ingested from different sources such as drinking water, salt, milk, food and beverages as
well as from dental products such as toothpastes and mouth rinses (Dhar and Bhatnagar,
2009, Buzalaf and Levy 2011). The total intake of fluoride is a risk factor for fluorosis
development. The details of fluorosis risk factors are described in Section 1.2.2.3.
Page 22
4
Discovery of fluoride in caries prevention
The discovery of fluoride in caries prevention is attributed to the investigations carried
out in the United States during the early decades of the 20th century (McKay, 1928, Dean,
1938, Dean, 1942). These studies were originally concerned with identifying the cause
of the endemic condition of ‘mottled enamel’ or ‘fluorosis’ among children in areas
where the water supply contained relatively high concentrations of natural fluoride. Data
showed that children with ‘mottled enamel’ generally had a lower caries experience than
those in areas without fluoride. These discoveries lead to the widespread introduction of
artificial fluoridation of water supply in the United States and other countries worldwide.
Later research moved towards alternative methods of fluoride delivery such as
fluoridated toothpaste (Fanning et al., 1968, Hollender and Koch, 1969, Marthaler,
1974). The use of fluoride toothpaste now constitutes the most common method of
fluoride delivery and has been reported as the main reason for the reduction of caries rate
in many industrialised countries since the 1970s (Bratthall et al., 1996).
Mechanism of fluoride in caries prevention
The anti-caries effect of fluoride has been well established. While in the mid-twentieth
century the systemic effect of fluoride (i.e. incorporation into enamel during tooth
formation) was thought to be crucial, it is now accepted that the primary effect of fluoride
in caries prevention is post-eruptive (Burt, 2004). This includes fluoride delivered
systemically (i.e. water fluoridation, fluoride supplements) or topically (i.e. fluoridated
toothpaste, fluoride varnish/gel). In order to interfere in the dynamics of dental caries
formation, fluoride must be constantly present in the oral environment at low
concentrations. In the presence of fluoride, it has three principal topical mechanisms of
Page 23
5
action in caries prevention. These are inhibition of demineralisation, enhanced
remineralisation, and inhibition of growth of plaque bacteria (Featherstone, 2000,
Featherstone, 2004a).
In order to understand the mechanism of action, it is important to know the normal
composition of tooth structure. This is because the structural dissimilarities between
enamel and dentine have an effect on caries and fluoride activity within these tissues.
Details of normal tooth composition are described below followed by the description of
how fluoride plays a role in caries prevention. The aetiology of dental caries is described
in depth in Section 1.2.3.1.
Normal composition of tooth structure
Teeth are formed from the calcium phosphate mineral hydroxyapatite. The solubility of
hydroxyapatite depends on the pH level and ionic-levels of the hydroxyapatite
components (calcium & phosphate) of the surrounding environment (Ten Cate and
Featherstone, 1991, Ten Cate, 2013). Under normal oral physiological conditions, saliva
and dental biofilms have a neutral pH 7.
Dental hard tissue consists of enamel and dentine, both of which have different
compositions and structures. Enamel is the most highly mineralised tissue and is mainly
comprised of hydroxyapatite crystallites (85% by volume), which are organized in long
and thin apatite crystals. The space between the structure of enamel prims and
hydroxyapatite crystals is filled with water (12% by volume) and organic material (3%
by volume) (Ten Cate and Featherstone, 1991, He and Swain, 2008, Buzalaf and Levy,
2011). Enamel is the hardest tissue in the human body and it has a glossy surface and
varies in colour from light yellow to greyish white (Chun et al., 2014).
Page 24
6
Dentine is a mineralised, elastic, yellow-white, avascular tissue enclosing the central pulp
chamber. Dentine consists of apatite crystals (47% by volume), organic components
(33% organic components) and water (20% by volume) (Marshall et al., 1997). Dentine
has less mineral (hydroxyapatite) than enamel and the crystallites have much smaller
dimension than those in enamel. Although dentine is harder than bone, it is softer than
enamel, so dentine is more prone to caries attack than enamel. The characteristic feature
of dentine is its permeation by closely packed tubules traversing its entire thickness and
containing odontoblasts cells. Odontoblasts located near the pulp chamber can be
simulated to repair dentine when under caries attack (Nanci, 2007).
Fluoride inhibits demineralization
Dental caries is simply described as “demineralization, or loss of mineral from the tooth”
(Featherstone, 2004a, Featherstone, 2004b). Acid produced by the bacteria when they
ferment dietary carbohydrate dissolve the acid soluble dental mineral and produce
soluble calcium and phosphate. These minerals then diffuse out from the tooth and lead
to cavitation if the process is not stopped or reversed. When fluoride is present in an
acidic solution surrounding enamel crystals, it is readily incorporated on to the surface
of carbonated apatite and inhibits mineral loss (Ten Cate and Featherstone, 1991,
Featherstone, 2000).
Fluoride enhances remineralisation
Following demineralisation, the natural repair process for carious lesions may take place
(Zero, 1999, Featherstone, 2004b). This is known as remineralisation and is the process
of placing back the lost mineral. Saliva is supersaturated with calcium and phosphate
ions that can stimulate the mineral to re-enter the tooth structure. The partially
Page 25
7
demineralized surface of the enamel acts as a nucleus for new crystal growth. In the
presence of fluoride during the remineralisation, it adsorbs to the crystal surface and
attracts calcium and phosphate ions to form a new mineral (fluorapatite). The newly
formed mineral has a stronger resistance to dissolution by acid than the original
carbonated apatite (Featherstone, 2000). In addition the buffering capacity of saliva
neutralised bacteria derived acids and favours the remineralisation process.
Fluoride inhibits bacteria growths
Fluoride ions act on the physiology of oral bacteria through several complex
mechanisms. In its ionic form fluoride is not able to cross the cell wall and membrane.
However in the form of hydrogen fluoride, it can penetrate the cariogenic bacteria cell
membrane. When the pH in the plaque drops as the bacteria produce acids, the fluoride
present in the plaque fluid combines with hydrogen ions to form hydrogen fluoride. It
then rapidly diffuses into the cariogenic bacterial cells. Inside the cell, the hydrogen
fluoride dissociates, acidifying the cell and releasing fluoride ions that inhibit bacterial
enzyme activity (Featherstone, 2000). Although the anti-glycolotic effects of fluoride on
oral bacteria metabolism are frequently cited, the degree to which this accounts for the
caries protective effect of fluoride compared with the mineral effects discussed above are
debatable (Ten Cate, 1999, Lussi et al., 2012).
The effect of fluoride on fluorosis development
Balancing the benefits and risks of fluoride is crucial because excessive exposure to
fluoride during a critical period of tooth development is often associated with fluorosis.
This section describes how fluoride acts on enamel and the way it induces dental
Page 26
8
fluorosis. The next Section (1.2.1.6) describes the critical period of development when
teeth are most at risk of fluorosis.
Fluoride ingested during tooth development can result in changes to dental enamel form
and structure due to alteration of the composition of the enamel matrix resulting in altered
apatite crystal growth (Bronckers et al., 2009, Den Besten and Li, 2011). Several
mechanisms have been suggested to explain how dental fluorosis occurs. These include
the systemic effect of fluoride on calcium homeostasis, altered protein secretion,
impaired matrix biosynthesis, direct effects on extracellular proteins and proteinases and
specific effects on cell function and metabolism (LeGeros and Tung, 1983, Browne et
al., 2005). The effect of fluoride on cell function is the mechanism that is most widely
accepted and discussed in the literature. Fluoride is believed to have direct effects
through interactions with the developing ameloblasts or interactions with the
extracellular matrix (Den Besten, 1999, Bronckers et al., 2009).
Fluorosis occurs when fluoride interacts with mineralizing tissues, causing alterations in
the mineralization process. The earliest sign is an increase in tissue hypomineralization
(porosity) along the striae of Retzius (Fejerskov et al., 1994). This would appear as
diffuse lines of opacity following the perikymata on the enamel surface. Severity
increases with increased exposure to fluoride during enamel development. The surface
and, in particular, the subsurface enamel becomes increasingly hypomineralized and
increasingly porous. This subsurface porosity is most likely caused by a delay in the
hydrolysis and removal of enamel proteins, particularly amelogenins during the enamel
maturation stage (Den Besten, 1999). The diffuse lines of opacity appear widened and
begin to merge to produce diffuse patches on the enamel. These patches appear as
confluent chalky white areas of opacity and extend toward the dentine-enamel junction
Page 27
9
as severity increases. In the mild form, it mostly affects the coronal region at the outer
half of the enamel and in the most severe form it may affect the entire enamel. The
development and severity of the fluorosis depends on fluoride dose, timing and duration
(Den Besten, 1999).
Timing of fluoride intake in relation to development of fluorosis in
maxillary central incisors
Knowledge of the risk periods associated with the development of fluorosis is important
not only for the understanding of the processes involved, but also to assist in minimising
the risk of fluorosis when prescribing fluoride for caries prevention.
In order to understand when developing teeth are most at risk of fluorosis, it is crucial to
know when calcification and eruption of primary and permanent teeth occurs (Table 1.1
and Table 1.2).
Calcification of permanent incisors begins at 3-4 months and is completed at 4-5 years.
Completion of the crowns of primary molars overlaps with commencement of
calcification of permanent incisors at around four months of age (Berkowitz et al., 1992).
Enamel is no longer susceptible to fluorosis once its pre-eruptive maturation is complete
(Institute of Medicine, 1997).
Table 1.1 Chronology of permanent teeth calcification and eruption
Central
incisors
Lateral incisors Canines First molars
U L U L U L U L
Calcification
commences
3-4m 3-4m 10-12m 3-4m 4-5m 4-5m Birth Birth
Completion
of crown
4-5y 4-5y 4-5y 4-5y 6-7y 6-7y 2.5-3y 2.5-3y
Appearance
in mouth
7-8y 6-7y 8-9y 7-8y 11-12y 9-10y 6-7y 6-7y
U, upper jaw: L, lower jaw; m, months; y, years. Adapted from Berkowitz et al. (1992).
Page 28
10
Table 1.2 Chronology of primary teeth calcification and eruption
Incisors Canines First molars Second molars
Calcification
commences
3rd-5th month
IU
5th month IU 5th month IU 6th-7th month
IU
Completion of
crown
Age 4-5
months
Age 9 months Age 6 months Age 10-12
months
Appearance in
mouth
Age 6-8
months
Age 16-20
months
Age 12-16
months
Age 21-30
months
IU, In utero. Adapted from Berkowitz et al. (1992).
Which period in tooth development might be most susceptible to the adverse effects of
exposure to elevated levels of fluoride is a matter of debate in the literature. In the late
1980s Evans and Stamm (1991a) examined a series of epidemiologic ‘windows’ or time
frames of differing lengths to determine the critical period during which developing
maxillary central incisors are most prone to fluoride challenge. These authors found that
“the most susceptible period was associated with a critical 4-month period commencing
at 22 months after birth”. The authors also concluded that “fluoride exposure during the
months prior to this period carry less risk than continued exposure for up to 36 months
beyond this critical time”. However, these findings were only relevant to the risk period
for the maxillary incisors and should not be used to infer the risk of fluorosis in relation
to the whole dentition.
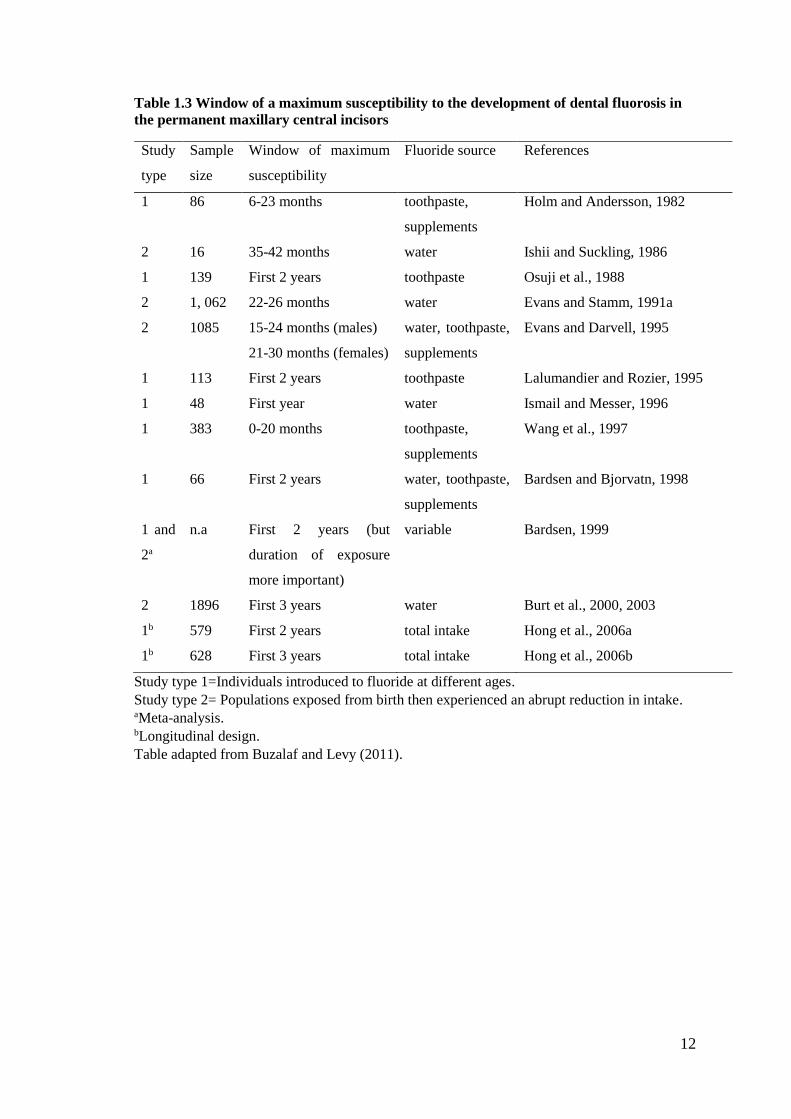
Recently, Buzalaf and Levy (2011) conducted a review of studies that examined the
window of a maximum susceptibility to the development of dental fluorosis in the
permanent maxillary central incisors (Table 1.3). The studies were divided into two
categories: studies involving subjects exposed to fluoride starting at different ages during
tooth development (Holm and Andersson, 1982, Osuji et al., 1988, Lalumandier and
Rozier, 1995, Ismail and Messer, 1996, Wang et al., 1997, Bardsen and Bjorvatn, 1998,
Hong et al., 2006a, Hong et al., 2006b) and subjects exposed to fluoride from birth and
Page 29
11
then experiencing a sudden reduction in daily fluoride intake at different ages during the
amelogenesis period (Ishii and Suckling, 1986, Evans and Darvell, 1995, Bardsen, 1999,
Burt et al., 2000, 2003). The majority of the studies agreed that the risk period for
fluorosis for central incisors is the first two years of life. More recent studies reported the
risk is up to the first three years of life. There is also evidence to suggest a gender
difference between risk period of developing fluorosis from 15 to 24 months in males
and 21 to 30 months in females (Evans and Stamm, 1991a, Evans and Darvell, 1995).
However there is lack of evidence in terms of possible fluorosis development for the
whole permanent dentition. It has been reported that the age during which children are
considered to be susceptible to the development of fluorosis in the whole dentition
(excluding the third molars) is from birth to 8 years of life (Hong et al., 2006a, Hong et
al., 2006b).
Page 30
12
Table 1.3 Window of a maximum susceptibility to the development of dental fluorosis in
the permanent maxillary central incisors
Study
type
Sample
size
Window of maximum
susceptibility
Fluoride source References
1 86 6-23 months toothpaste,
supplements
Holm and Andersson, 1982
2 16 35-42 months water Ishii and Suckling, 1986
1 139 First 2 years toothpaste Osuji et al., 1988
2 1, 062 22-26 months water Evans and Stamm, 1991a
2 1085 15-24 months (males)
21-30 months (females)
water, toothpaste,
supplements
Evans and Darvell, 1995
1 113 First 2 years toothpaste Lalumandier and Rozier, 1995
1 48 First year water Ismail and Messer, 1996
1 383
0-20 months toothpaste,
supplements
Wang et al., 1997
1 66 First 2 years water, toothpaste,
supplements
Bardsen and Bjorvatn, 1998
1 and
2a
n.a First 2 years (but
duration of exposure
more important)
variable Bardsen, 1999
2 1896 First 3 years water Burt et al., 2000, 2003
1b 579 First 2 years total intake Hong et al., 2006a
1b 628 First 3 years total intake Hong et al., 2006b
Study type 1=Individuals introduced to fluoride at different ages.
Study type 2= Populations exposed from birth then experienced an abrupt reduction in intake. aMeta-analysis. bLongitudinal design.
Table adapted from Buzalaf and Levy (2011).
Page 31
13
Summary
It is established that a low level of fluoride in the oral environment helps to interfere in
the dynamics of dental caries formation. However, excessive exposure of fluoride during
tooth development increases the risk of developing fluorosis. The risk periods of
fluorosis for central incisors is the first two to three years of life. Evidence for the risk
periods of fluorosis for the whole dentition is scarce and available evidence considered
the risk from birth to eight years of life. The key literature on the risk factors associated
with fluorosis development is considered in the following section.
1.2.2 Dental Fluorosis
The earlier Section (1.2.1.5) has described how fluorosis develops. This section now
reviews in depth the definition and presentation of fluorosis, risk factors associated with
the development of fluorosis, methods of measurement and trends in fluorosis
prevalence.
Definition
In 1934, Dean originally defined dental fluorosis as “hypomineralization of tooth enamel
or dentine by prolonged ingestion of excessive amounts of fluoride during tooth
development” (Dean, 1934). Other fluorosis definitions proposed by several authors in
the 1980s (Møller, 1982, Murray, 1986, Fejerskov et al., 1988) reported consensus
agreement that fluorosis is a developmental condition caused by excessive concentration
of fluoride disrupting normal amelogenesis.
Page 32
14
Clinical and histological presentation of dental fluorosis
A brief explanation of the histological presentation has been described earlier when
explaining fluorosis development (Section 1.2.1.5). The spectrum of clinical and
histological presentations for fluorosis is broad. Clinically, in its mild form, fluorosed
enamel manifests as white striations or has a white parchment-like appearance. At this
stage, the tooth functions normally. In more severe cases, fluorosed enamel appears
pitted and discoloured and the tooth is prone to wear and fracture (Fejerskov et al., 1990,
Mascarenhas, 2000, Browne et al., 2005, Buzalaf and Levy, 2011,). Dental fluorosis may
also present as a diffuse opacity. This typically is symmetrically distributed about the
mid-line, a feature which can be used to differentiate diffuse opacities attributable to
fluorosis from diffuse opacities arising from other causes. (Ellwood et al., 1994, Buzalaf
and Levy, 2011).
Histologically, fluorosed enamel is characterised by hypomineralisation and subsurface
porosity (Fejerskov et al. 1977). In the mild form, the structural arrangement of the
crystals in the outer layer of enamel is normal, but is more porous or in other words, the
inter-crystalline space is larger than normal. In more severe forms, the hypomineralised
lesion is located deeper to a well mineralised surface zone which is very fragile and
susceptible to mechanical stress that leads to breakdown of the enamel surface (Baelum
et al., 1986, Fejerskov et al., 1990).
Risk factors for dental fluorosis
It is established that fluorosis results from excessive exposure to fluoride during enamel
development (Hong et al. 2006b, Bronckers et al. 2009, Buzalaf and Levy 2011). To a
Page 33
15
certain extent, any source of systematic fluoride ingested during this stage may pose a
level of risk for the development of fluorosis. To date, systematic reviews have identified
four major risk factors for fluorosis: fluoridated water (McDonagh et al., 2000,
Australian National Health and Medical Research Council, 2007, Iheozor-Ejiofor et al.,
2015), fluoride supplements (Ismail and Bandekar, 1999), fluoride toothpaste (Wong et
al., 2010) and infant formulae (Hujoel et al., 2009). Some other sources such as food and
beverages may also be important contributors to total daily fluoride intake (Bronckers et
al., 2009). However, this section focuses on discussing the key evidence for the major
risk factors.
Water fluoridation
The most widely recognised systematic review of water fluoridation was published in
2000 which is also known as York Review (McDonagh et al., 2000). Other published
reviews on water fluoridation such as an Australian review (Australian National Health
and Medical Research Council, 2007) and a Cochrane review (Iheozor‐Ejiofor et al.,
2015) aimed to update this review and adopted different methods in certain areas. All of
these reviews have acknowledged that the benefits of fluoridation in terms of dental
caries prevention and fluorosis is the only entity that has been identified as a side effect
of fluoridation, when fluoride is present at the level for the prevention of dental caries
(0.5-1.0 ppmF).
In the early 1940s, Dean and co-workers (Dean, 1942) reported a higher prevalence of
dental fluorosis (10%) in children resident in areas where the level of fluoride naturally
present in the water was 1.0 ppm compared to children in areas with a negligible level of
fluoride in the water, where 1% of children were affected by fluorosis. Most of the cases
were diagnosed with mild or very mild fluorosis. This degree of prevalence was recorded
Page 34
16
when fluoridated drinking water was the sole significant source of fluoride intake. During
the latter half of the 20th century, studies reported that although the prevalence of
fluorosis remains higher among populations in fluoridated areas, the risk of developing
fluorosis in non-fluoridated areas had increased. This phenomenon can be explained by
multiple exposures to different sources of fluoride such as fluoride toothpaste as well as
foods and beverages processed using fluoridated water and transported to non-fluoridated
areas.
The York review included 88 studies on the association of water fluoridation and dental
fluorosis (McDonagh et al., 2000). Data reported that at a fluoride level of 1 ppm, the
prevalence of fluorosis of aesthetic concern was 12.5% (95% CI 7.0% to 21.5%). This
percentage increases to 48% (95% CI 40% to 57%) when considering fluorosis at any
level. The Australian review identified 10 additional studies and reported a pooled
relative risk of 2.54 (95% CI 1.52-3.56) of developing any fluorosis and 4.01 (95% CI
3.15-5.10) of developing aesthetic fluorosis at water fluoride levels between 0.8-1.2 ppm
(Australian National Health and Medical Research Council, 2007). Although there was
a four-fold risk of developing fluorosis of aesthetic concern with optimal versus
suboptimal water fluoridation, the absolute increase in prevalence was very small,
approximately 4-5%. In a more recent review by Cochrane, authors analysed different
number of studies based on the fluorosis definition used. Authors reported the percentage
of participants with fluorosis of aesthetic concern was 12% (95% CI 8% to 17%; 40
studies) at a fluoride level of 0.7 ppm (Iheozor‐Ejiofor et al., 2015). This percentage
increased to 40% (95% CI 35% to 44%; 90 studies) when considering fluorosis of any
level. All three reviews used the same definition of any fluorosis and aesthetic fluorosis.
Any fluorosis was defined as Developmental Defect of Enamel (DDE), Tooth Surface
Page 35
17
Index of Fluorosis (TSIF), Thylstrup and Fejerskov (TF) Index score greater than zero
or Dean’s classification of ’questionable’ or higher. Aesthetic fluorosis was defined as
TSIF ≥2 or TF ≥3 or Dean’s mild or higher.
In terms of fluorosis studies included in the above-mentioned reviews, many authors
have raised concerns about the quality of the original studies. Many studies were not
blinded in terms of fluoride exposure status of the studied population, the prevalence was
overestimated by different indices used and confounding factors were not controlled
during analysis (McDonagh et al., 2000, Iheozor‐Ejiofor et al., 2015).
Toothpaste
There are mixed findings regarding fluoride toothpaste as a risk factor for fluorosis. In
particular in countries that have combinations of fluoride modalities in place to prevent
dental caries. Several studies have reported a significant association between the use of
fluoride toothpaste in the first two years of life and fluorosis (Mascarenhas and Burt,
1998, Pendrys, 2000, Pereira et al., 2000, Maupome et al., 2003). Studies reported that
early use of toothpaste (Maupome et al., 2003, Pereira et al., 2000), higher brushing
frequency (more than once per day) (Pendrys et al., 1994), a larger quantity of toothpaste
(3/4 of brush head) (Evans, 1991), swallowing toothpaste in infancy (Riordan, 1993a)
and higher fluoride toothpaste concentration have all been reported as risk factors for
fluorosis. Two randomised control trials (Holt et al., 1994, Tavener et al., 2006) found
toothpaste with a higher fluoride concentration was significantly associated with
increased fluorosis prevalence. With regards to fluoride toothpaste concentration, a study
conducted on Australian children living in fluoridated areas (Do and Spencer, 2007)
found a significant decline in fluorosis prevalence after introduction of low concentration
Page 36
18
(400-550ppmF) fluoridated toothpaste. However, a Cochrane review could not confirm
an association between the use of fluoride toothpaste and the prevalence of fluorosis
(Wong et al., 2011). The authors concluded that the benefit of fluoride toothpaste was
only significant in caries prevention for concentrations of 1000ppm and above and there
was only weak evidence that early use of fluoride toothpaste for children under 12
months was associated with an increased risk of fluorosis. The authors emphasized that
the decision of what fluoride levels to use for children under six years should be balanced
between the risk of developing caries and mild fluorosis (Wong et al., 2011).
Fluoride supplements
Fluoride supplements have been used to prevent dental caries in areas where fluoride
levels in the water supply were deficient. They are available as tablets or drops, intended
to be swallowed, as tablets for chewing or lozenges intended to be sucked or dissolve
slowly in the mouth. The availability of the supplements varies by country either upon
prescription, over-the counter sales or through public health programmes.
In terms of dosage, several guidelines have been published in relation to prescription of
fluoride supplements (Banting, 1999, Ismail and Hasson, 2008, Buzalaf and Levy, 2011).
The recommendation is for daily use based on the child’s age and fluoride level in the
drinking water. However, it has been shown that frequently the guidelines were not
followed or were used inappropriately (Banting, 1999, Sohn et al., 2007).
Recommendations on the use of fluoride supplements vary across the world depend on
the need of the specific population. For example, in the US the current recommendations
are 0.25mg fluoride/day from age 6 months to 3 years for children living in areas
containing less than 0.3ppm fluoride in drinking water. In contrast, Canada and
Page 37
19
Switzerland do not recommend fluoride supplements under 3 years of age. Fluoride
supplement use has been linked with low compliance, particularly in those from low
socio-economic backgrounds and thus at greatest risk of dental caries. Fluoride
supplementation using tablets and drops are increasingly regarded as a poor public health
measure (Ismail and Bandekar, 1999, Tubert-Jeannin et al., 2011). As a result fluoride
supplements as a means of caries prevention on a population basis have been re-appraised
in several countries (Oganessian et al., 2007, Rozier et al., 2010).
In the 1990s there were several reviews published by Riordan (Riordan, 1993b, 1996,
1999), Ismail (Ismail 1994, Ismail and Bandekar 1999) and Burt (Burt, 1999) to answer
questions regarding the efficacy of fluoride supplements in caries prevention. Those
reviews were updated by Ismail and Hasson in 2008 and the Cochrane collaboration in
2011 (Tubert-Jeannin et al., 2011). Ismail and Hasson (2008) included more study
designs, which lead to a total of 85 articles included in their review. Out of 85 articles,
20 were clinical trials, 9 were cohort studies, 22 were cross-sectional studies and 8
retrospective studies were included. In contrast, the Cochrane review had more stringent
inclusion criteria and only included randomised controlled trials with a minimum 2 years
of follow-up. As a result, just 11 studies of randomized or quasi-randomized trials were
included in that review (Tubert-Jeannin et al., 2011). There is a consistent agreement
reported by all reviews that fluoride supplements help in reducing caries in permanent
teeth, however the effect of the fluoride supplements on primary teeth was unclear.
In terms of risk of fluoride supplements and fluorosis mixed findings were reported by
Ismail and co-workers and the Cochrane review. Results from the meta-analysis in the
1999 review reported odds ratios of the association between any use of fluoride
supplement and fluorosis of 2.3 (95% CI: 1.5-3.4) and 6.6 (95% CI: 2.9-15.2) in the
cross-sectional/case control and follow-up studies, respectively (Ismail and Bandekar,
Page 38
20
1999). No meta-analysis was reported in the follow-up review in 2008. The 2008 review
included five additional studies. These reported that the use of fluoride supplements
increased the risk of mild to moderate fluorosis. However, these results should be treated
with caution because the majority of studies were assessed as of low study quality and
high risk of bias. For example low compliance of fluoride tablets among study
participants, lack of standardisation of method of fluoride tablet delivery (supervision vs
non-supervision), high rate of subjects’ withdrawal and lack of examiner blinding
(Banting, 1999, Ismail and Bandekar, 1999).
The later review by the Cochrane group (Tubert-Jeannin et al., 2011) reported that there
was insufficient information to determine the risk of fluoride supplements and fluorosis
or other adverse effects. Only one trial was available for analysis (Driscoll et al., 1974).
Data from this study reported that a slight increase in fluorosis prevalence in the fluoride
interventions group (20% in the group with one acidulated phosphate fluoride (APF)
tablet per day and 22% in the group with two APF tablets per day) in comparison to the
placebo control group (15%).
Infant formula
Infant formula is a major source of nutrition during infancy. It can be divided into three
categories; milk-based products, soy-based products and ready-to-feed formulas.
Powdered and liquid concentrate formula require reconstitution with drinking water,
whereas ready-to-feed formulas do not need to be reconstituted.
Historically, infant formulas contained high concentrations of fluoride. Prior to the
1970s in the United States a high level of fluoride in infant formula was associated with
Page 39
21
high fluorosis prevalence in fluoridated and non-fluoridated areas (Silva and Reynolds,
1996, Mascarenhas, 2000). Studies of risk factors for fluorosis among children who were
born before 1979 reported that children in fluoridated areas were at a seven times higher
risk than those in non-fluoridated areas (Pendrys and Katz, 1989, Pendrys et al., 1994).
The reported risk prompted a call for manufacturers to reduce and control the
concentration of fluoride in their products in several countries such as in the US since
1979 (Singer and Ophaug, 1979, Dabeka et al., 1982) and Australia and New Zealand
since 1992-1993 (Do et al., 2012). After reduction of the fluoride level in infant formula,
fluorosis was often associated with sources of water used to reconstitute infant formula.
However, a recent study in Australia reported different findings where infant formula
was associated with a high prevalence of fluorosis in non-fluoridated areas but not in
fluoridated areas. The association persisted after controlling for other fluoride sources
(Do et al., 2012). The authors suggested that the unexpected results could be due to
exposure to other sources of fluoride such as food and beverages. Also there is a
possibility of formula powdered might have still contained a considerable level of
fluoride (Do et al., 2012).
Evidence from a systematic review of infant formula and fluorosis summarised that there
was a weak evidence to support fluoride in infant formula causing fluorosis (Hujoel et
al., 2009). However, infant formula intake may be associated with some detectable level
of fluorosis depending on the level of fluoride of the water used to reconstitute them (OR
1.8, 95% CI 1.4-2.3). Seventeen studies reported in the review reported odds ratio (OR).
A meta-regression analysis indicated that the ORs associating infant formula with enamel
fluorosis increased by 5% for each 0.1ppm increase in the reported levels of fluoride in
the water supply (OR 1.05, 95% CI 1.02-1.09). In terms of the quality of the studies
included in the review, less information was available about the extent of exposure to
Page 40
22
infant formula, the type of infant formula consumed, the fluoride concentration of the
formula and the level of fluoride in the water with which the infant formula was
reconstituted. The authors were unable to determine whether the increased risk was
caused by fluoride intake from infant formula, fluoridated drinking water or other sources
of fluoride such as toothpastes or fluoride supplements (Hujoel et al., 2009). Further
research was recommended to address this issue.
Variation between countries in relation to fluoride level in both drinking water and the
infant formula itself makes advice regarding use of infant formula more complex. In
Canada, where the fluoride level in the public water supply ranges from 0.5 to 0.8 ppm,
the Canadian Dental Association (Canadian Dental Association, 2007) has made no
recommendation regarding infant formula preparations and fluorosis. In the United
States, where water fluoride levels typically range from 0.7 to 1.2 ppm, the guideline by
the American Dental Association (Berg et al., 2011) suggested that those who are
concerned about their children’s exposure to fluoride should use ready-to-feed formula
or should reconstitute the formula with water that has no or low levels of fluoride.
Measuring Fluorosis
Clinical measurement
Several epidemiological indices have been developed and used to describe the clinical
appearance of dental fluorosis. Many researchers have extensively discussed and
criticised each index. Two distinct groups of indices have been proposed for measuring
fluorosis. These can be divided into specific fluorosis indices and descriptive indices:
Page 41
23
i) Specific fluorosis indices: These indices specifically measure fluoride
induced enamel changes, and report the extent and severity of the fluoride
induced changes in dental enamel. Examples are: Dean’s Index (Dean, 1942),
Thylstrup and Fejerskov (TF) Index (Thylstrup and Fejerskov, 1978) and
TSIF Tooth Surface Index of Fluorosis (Horowitz et al., 1984).
ii) Descriptive indices: The indices include all types of enamel defects and are
not specific to dental fluorosis. The indices record enamel defects based on
descriptive criteria without assumptions about the aetiology of the defects.
Examples are: Developmental Defects of Enamel (DDE) Index (FDI, 1992)
and classifications described by Al-Alousi et al (Al-Alousi et al., 1975).
All the measurements and indices described above have been developed from relatively
different rationales. No one Index has emerged as the agreed standard criteria to measure
fluorosis, and the most suitable index of recording fluorosis to a degree depends upon
the objective of the study.
This section highlights the most commonly used indices when reporting fluorosis in the
literature. Dean’s Index was commonly reported in older studies and national surveys.
Many European studies favoured the use of the TF Index. The DDE Index is also popular
in several national surveys, where the main aim is to measure enamel defects and diffuse
opacities commonly considered as ‘fluorosis’. Variation in the indices used in fluorosis
measurement makes comparison difficult across studies. Different studies used different
cut off points of fluorosis definition for the individual index. The most common
categorisation used in the literature is ‘any fluorosis’ and ‘aesthetic fluorosis’. Any
fluorosis defined by DDE, TSIF, TF score greater than zero or Dean’s classification of
Page 42
24
‘questionable’ or greater. Aesthetic fluorosis defined by as TSIF ≥2 or TF ≥3 or Dean’s
mild or higher.(McDonagh et al., 2000, Iheozor‐Ejiofor et al., 2015). However some
researchers argued that the cut-off point used to define any fluorosis and aesthetic is
arbitrary. Population perceptions on aesthetic impact of fluorosis may be the key
indicator to define level of ‘aesthetic fluorosis’ which again varies across studies
(Chankanka et al., 2010).
A description of the most commonly used Indices together with their advantages and
disadvantages is presented in Table 1.4 .
Page 43
25
Table 1.4 Summary of the advantages and disadvantages of fluorosis indices
Index/
Reference
Description Advantages Disadvantages
Dean’s Index
(Dean et al.,
1942)
The initial Dean’s classification in 1934 (Dean, 1934) had 7
classifications (0=normal, 0.5=questionable, 1=very mild,
2=mild, 3=moderate, 4=moderately severe, 5=severe). This
original classification was modified in 1942 into 6 categories
(0=normal, 1=questionable, 2=very mild, 3=mild, 4=moderate,
5=severe). The ‘moderately severe’ category in the original
scale was removed and combined with the ‘severe’ category
(Dean, 1942). Dean’s Index results in a single score for an
individual. If fluorosis is present, the individual will be scored
based upon the two most affected teeth. If the two teeth were
not equally affected, the less affected tooth is scored.
Simple to use; accepted at global
level; long track record of use
supported by literature; allows
historical comparison with old
studies; recognized by World
Health Organization for use in
oral health surveys basic method;
teeth are examined wet -more
relevance to concerns in a public
health context.
Only measure the two most
severely affected teeth, does not
allow measurement of fluorosis
on different tooth surfaces; no
information about location of
affected teeth; the diagnostic
category for ‘questionable’ in
the classification is unclear and
lacks precision; the index lacks
sufficient precision to
distinguish different degrees of
fluorosis; teeth are examined
wet-may overlook minor
opacities (Horowitz, 1986,
Clarkson, 1989, Rozier, 1994).
Community
Fluorosis
Index (CFI),
(Dean, 1946)
Dean also developed the CFI which aims to compare the
average severity of fluorosis between different groups. The CFI
is calculated for a geographic location based on the mean of all
scores for individuals examined. The CFI can be obtained from
statistical weight (ranging from 0 to 4) to each category within
the classification. This index awards weights to the different
scores in Dean’s Index. Normal is awarded 0, 0.5 to
questionable and 1,2,3,4 to very mild, mild, moderate and
severe respectively. CFI scores below 0.4 is not considered as
public health significance. Scores that ranged between 0.4 and
0.6 were borderline significance and CFI scores above 0.6 were
of increasing public health significance.
CFI calculates average severity
of fluorosis between different
groups and the range of value
will determine public health
effect of fluorosis.
The statistical basis for using the
arithmetic mean to calculate the
CFI is questionable on the
grounds that the classification is
based on an ordinal and not an
interval scale; the weights
assigned to each category are
arbitrary (Horowitz, 1986,
Clarkson, 1989, Rozier, 1994).
Page 44
26
Table 1.4 (continued)
Index/
Reference
Description Advantages Disadvantages
Thylstrup-
Fejerskov
(TF) Index,
(Thylstrup and
Fejerskov,
1978).
The TF index was developed in order to refine, modify and
extend the use of Dean’s index. The aim of the index is to record
histological changes that occur in dental fluorosis based on an
ordinal scale. Enamel changes observed on single tooth surfaces
are divided into 10 categories which range from 0 (normal) to
9 (severe condition). Unlike Dean’s Index, TF scores are
applied to the buccal, lingual and occlusal surfaces. In order to
improve sensitivity at low diagnostic thresholds, teeth are
examined after cleaning and drying to emphasize the
appearance of fluorotic change.
Record histological changes that
occur in dental fluorosis based on
an ordinal scale which allow
sufficient precision to distinguish
different degrees of fluorosis; TF
index has been validated
clinically and histologically; TF
index is as commonly used as
Dean’s Index and is particularly
favoured in European studies;
teeth are examined dry -
improved diagnostic sensitivity.
Difficult to standardize tooth
dryness; the effect of drying may
reveal a short period of changes
which have less aesthetic or
public health importance; the
criteria for score 1 and 2 describe
only very minor changes
(Clarkson, 1989).
Developmental
Defect of
Enamel (DDE)
Index,
(FDI, 1992).
The DDE Index was developed by a Working Group of the
Federation Dentaire Internationale (FDI) to provide an
internationally acceptable classification system for
developmental enamel defects. The original index was
criticised as time-consuming and complicated to use and
analyse. To overcome the weaknesses of the index, it was
subsequently modified and presented in three types of defects:
demarcated, diffuse and hypoplastic. Many studies are in
agreement that the diffuse opacities category probably contain
most of the fluoride-related opacities and usually considered a
close approximation of fluorosis (Ellwood et al., 1994,
Mohamed et al., 2010, Wong et al., 2014).
Detailed measurement that
includes a broad range of defects
with information on the
distribution and location; teeth
are examined wet -more
relevance to concerns in a public
health context (FDI, 1992,
Ellwood et al., 1994).
Teeth are examined wet-may
overlook minor opacities; time-
consuming to conduct due to
large volume of information
collected.
Tooth Surface
Index of
Fluorosis
(TSIF),
(Horowitz et
al., 1984).
Researchers at the National Institute for Dental Research in the
United States developed the TSIF index, in an attempt to
improve on Dean’s Index. The TSIF primarily aims to measure
the public health effect or aesthetic concern of fluorosis in a
population. The TSIF requires that the teeth are examined wet
and a score is given to all surfaces (labial, lingual and occlusal
surfaces).
A score is given to all surfaces
instead of individual teeth (labial
and lingual surfaces and occlusal
surface of posterior teeth); the
index improves diagnostic
sensitivity for fluorosis in
Scoring all surfaces may increase
surface-to-surface variation
between examiners; scoring
lingual and hard to see surfaces
may reduce examiner
consistency; possibility of
Page 45
27
Table 1.4 (continued)
Index/
Reference
Description Advantages Disadvantages
TSIF
(continued)
In the TSIF, the ‘questionable’ category of Dean’s index was removed
and the remaining four categories of the index expanded to seven
categories. Categories 1-3 (parchment white fluorosis) are
differentiated by the surface area of the enamel involved. Categories
(4-7) represent different degrees of staining and quantitative loss of
enamel.
severe categories; the index
permits a distinction between
discrete pitting and more
advanced confluent pitting and
staining alone and staining
with pitting; the index is useful
especially in populations
where severe fluorosis is
prevalent; teeth are examined
wet - more relevance to
concerns in a public health
context.
losing data on occlusal
surfaces because of
restorations; teeth are
examined wet-may overlook
minor opacities (Rozier,
1994)
Fluorosis Risk
Index (FRI),
(Pendrys,
1990).
The index was developed to determine the association between age-
specific exposure to fluoride sources and risk of developing fluorosis
The scoring system for this index is based on different enamel surface
zones which were divided into four zones: occlusal/ incisal edge,
incisal one third, middle one third and cervical one third. The index
then divides the enamel surfaces into two groups based on their time
of formation and mineralisation: classification I zones are 10 surface
zones that begin formation during the first year of life; classification
II zones are 48 zones that begin formation during the third year
through to the sixth year of life. The unassigned enamel surface zones
are categorized as questionable (54 surface zones). In total,
approximately 112 zones are scored using this index. Each zone is
scored as either negative for fluorosis (score 0), questionable (score
1), positive for mild to moderate fluorosis (score 2), or positive for
severe fluorosis (score 3). The rationale for this classification was that
different fluoride exposures may have different effects on fluorosis
experience on surface zones that are mineralised at different times
during an individual’s life.
The scoring system of
different zones of a tooth
surface; allows identification
of risk factors of fluorosis;
useful for analytical
epidemiology studies because
it allows identification of age-
specific exposure to fluoride
sources and development of
enamel fluorosis (Rozier,
1994).
The index is complex for its
biological perspective and
application; suitable to
estimate the relative risk of
fluorosis rather than
fluorosis prevalence; the
many surface zones to be
scored may lead to the
possibility of
misclassification and
increase surface variation
both within and between
examiners; teeth need to be
examined either ‘dry’ or
‘wet’ is not clearly stated
(Rozier, 1994).
Page 46
28
Photographic assessment of dental fluorosis
Clinical measurement has several limitations such as lack of standardised examination
method, examiner bias and the different indices used make comparison between studies
difficult. A way of overcoming these shortcomings is development of a standardized
photographic method for capturing a permanent record of the condition of the enamel.
There are however, advantages and disadvantages of photographic assessment in
comparison with the clinical measurement of dental fluorosis. The major benefits of
photographs are that they capture a permanent record and allow blind scoring between
different examiners. In addition, the same method can be used by different investigators
in multi-site epidemiology studies and allow repeated objective assessments of the
photographs (Ellwood et al., 1994, Cochran et al., 2004a, Soto-Rojas et al., 2008).
The disadvantages of using photographs are firstly variation in photographic technique
between different studies such as variation in equipment, lens, lighting system and
quality of image produced (Cochran et al., 2004a). Secondly, difficulties in capturing
teeth images due to lack of accessibility especially for posterior teeth mean that
photographs have only been used to record the subject’s anterior teeth, this could result
in under reporting of the prevalence of dental fluorosis. On the other hand, the greater
detail provided by photographs may well result in over reporting prevalence (Soto-Rojas
et al., 2008)
Imaging techniques in assessing fluorosis can be divided into conventional and digital
photography. In the early introduction of imaging techniques for fluorosis assessment,
conventional photography was often used (Nunn et al., 1993, Ellwood et al., 1994,
Sabieha and Rock, 1998). Although photographic methods have evolved from
conventional transparencies using film to digital images, some researchers still prefer to
Page 47
29
use conventional photography to enable data comparison with different studies that used
the same standardized methods (Cochran et al., 2004a, Cochran et al., 2004b, Wong et
al., 2014).
In recent years, several researchers have reported fluorosis assessment using digital
photography (Tavener et al., 2007, Martins et al., 2009, Cruz-Orcutt et al., 2012, Golkari
et al., 2011). The main benefits of using digital photography are that it allows the
examiner to evaluate the quality of the image captured during the clinical examination
immediately post exposure. It can therefore be repeated if the quality of the image is not
acceptable. In addition, digital photography also allows the examiner to zoom and adjust
to capture the best image instead of using a fixed barrel lens (Golkari et al., 2011). It is
suggested that digital photography can more easily accommodate patient confidentiality
and can be stored in digital systems. Images are, produced instantaneously and do not
require developing of negatives and printing.
Trends in the prevalence of dental fluorosis
Global trends in the prevalence of dental fluorosis
Several indices have been used to measure fluorosis prevalence and may not be directly
comparable. Comparison between studies was made with this limitation in mind. To aid
in consistency in data reporting, fluorosis prevalence described in this section is defined
by, Deans≥2 (very mild or greater), TF≥1, TSIF≥1 and diffuse opacities from DDE Index
unless stated otherwise. A summary of fluorosis prevalence among children in selected
countries is presented in Table 1.5.
Page 48
30
The United States (US) was the first country to introduce community water fluoridation
programmes to prevent dental caries. It has been established that the prevalence of
fluorosis increases with increasing levels of water fluoride. However there is a trend of
increase in fluorosis in the US over the previous 30 years not only in fluoridated areas
but also in non-fluoridated areas (Beltrán-aguilar et al., 2002). Data from the US national
survey using Dean’s Index reported that fluorosis increased among children from 22.6%
in the 1986-1987 survey to 40.6% in the surveys conducted between 1999-2004 surveys.
Similar trends have been reported in Ireland. The percentage of 8 and 15 year-old
children having fluorosis (very mild or higher) was 1% in fluoridated areas in 1984, but
this increased to 11.8% and 18% respectively in 2002. The same trend has observed in
the non-fluoridated areas whereby none of the children had experience of fluorosis in
1984 but the prevalence has increased to 3.3% for the 8 year-olds and 6.5% for the 15
year-olds in 2002 (Whelton et al., 2004a, Whelton and O’Mullane, 2012).
Unlike in the USA and Ireland, an opposite trend has been observed in the UK. There is
a trend of decreasing prevalence of diffuse enamel opacities among 12 year-olds in the
UK from 2003 to 2013. These data were based on the Children’s Dental Health surveys
that were conducted using the DDE index. In terms of individual country, a higher
prevalence of diffuse enamel opacities was observed in England (2003: 18%, 2013: 16%)
followed by Northern Ireland (2003: 11%, 2013: 8%) and Wales (2003: 9%, 2013: 5%)
(Pitts et al., 2015). An opposite trend observed in the UK may be due to only 10% of the
population receiving a fluoridated water supply and the main fluoride delivery is through
fluoridated toothpaste. Another reason could be the different index used to measure
fluorosis. Another study in the UK used TF index to measure fluorosis and blinded
photographic scoring. Results from this study reported a higher fluorosis prevalence in
Page 49
31
fluoridated Newcastle upon Tyne (55%) and non-fluoridated Manchester (27%) than the
UK national prevalence of diffuse opacities (McGrady et al., 2012a).
In Australia, data in 2003/2004 reported the prevalence of fluorosis using blinded
photographic scoring as 26.9%. Further analysis across different birth cohorts indicate a
marked decline in the prevalence of fluorosis (TF≥ 2) among children born after 1993
(8.3%) in comparison to children born before that (17.9%) (Do and Spencer, 2007). The
decline was reported to be mainly linked with the reduction in the concentration of
fluoride in the children toothpaste (400-550 ppm) introduced in 1993 and a combined
effect of fluoride level in the water at 0.6 to 1.1 ppm.
Neighbouring South-East Asia countries like Singapore and Thailand also reported a
high fluorosis prevalence. For example in Singapore, Lo and Bagramian (1996) reported
82.6% fluorosis prevalence at 0.7 ppm optimal fluoridated among 9-16 year-old children.
However in Thailand where some areas have high natural fluoride in the water (0.35-
2.22 ppm), data indicate a high fluorosis prevalence among the studied population
(70.9%) (McGrady et al., 2012b).
Page 50
32
Table 1.5 International prevalence of fluorosis in children from selected countries
Countries
(Area)
Year of
survey
Age Fluorosis
prevalence+
Mean F
level*
Index Reference
USA (Beltrán-
Aguilar et al.,
2010)
National
survey
(NIDR)
1986/87 12-15 22.6 0.7-1.2 Dean’s
National
survey
(NHNES)
1999-
2004
12-15 40.6 0.7-1.2 Dean’s
Ireland
National
survey
1984 8 F:1.0
NF: 0
0.8-1 Dean’s (Whelton et
al., 2004a, Whelton and
O’Mullane,
2012 )
15 F:1.3
NF: 0
National
survey
2002 8 F: 11.8
NF:3.3
0.8-1 Dean’s
15 F:18.0
NF: 6.5
UK (Pitts et al.,
2015) England 2003 12 18 10% of
population in
England
have water
fluoridation
DDE
Northern
Ireland
11
Wales 9
England 2013 12 16 DDE
Northern
Ireland
8
Wales 5
UK (McGrady et
al., 2012a) Newcastle
upon Tyne
2008/09 11-13 55 1 TF
Manchester 27
South
Australia
2002/03 8-13 26.9
1 TF (Do and
Spencer,
2007)
Singapore 1986 9,12,16 82.6 0.7 Dean’s (Lo and
Bagramian,
1996)
Thailand
(Chiang Mai)
Not
stated
8-13 Overall: 70.9
F(>0.9):85.1
F (<0.9):60.0
0.35-2.23
(naturally
fluoridated)
TF (McGrady et
al., 2012b)
+Fluorosis prevalence defined by, Deans≥2, TF≥1, DDE: Diffuse opacities *Mean fluoride (F) level in the water in fluoridated area
NIDR: National Institute of Dental Research, National Survey of Oral Health in U.S. School
Children, 1986–1987.
NHNES: National Health and Nutrition Examination Survey 1999-2004.
Page 51
33
Fluorosis trends in Malaysia
A number of different studies have reported on the degree of fluorosis and enamel defects
in Malaysia. These findings are tabulated in Table 1.6 and Table 1.7. The prevalence of
fluorosis reported in Malaysia ranges from 20.3% to 67.7%, while the presence of diffuse
opacities were reported as ranging from 42.2% to 88.6% in fluoridated areas. Most of the
fluorosis studies were conducted in 1990s and in the early millennium. In the 1991, the
prevalence of fluorosis was reported as only 32.8% (Esa and Razak, 2001). However data
from the National Survey of Enamel Opacities reported an increased prevalence of
fluorosis is in particularly in those living in fluoridated communities (62.3%) (Oral
Health Division Ministry of Health Malaysia, 2011). The national findings were
consistent with a later study in fluoridated Selangor by Tan et al., (2005). In contrast, in
the same year, another local study conducted in fluoridated Negeri Sembilan reported
slightly lower prevalence of fluorosis (27.8%) than the national prevalence (Mohd et al.,
2008). However this study had a low sample size and only involved children in three
schools in one district (Kuala Pilah). The most recent study in 2003/2004 reported
fluorosis prevalence in sub-optimally fluoridated (≤0.4 ppm) areas using TSIF index
(Shaharuddin et al. 2010). The overall prevalence in the selected three cities was 31.6%.
Although the sample size is very small to infer to the state population, this finding is
rather unexpected for a sub-optimal fluoridated area.
Page 52
34
Table 1.6 Studies on prevalence of fluorosis in Malaysia
Areas Age
(years)
Sample
size
Fluorosis
Prevalence* (%)
Index Fluoride
level (ppm)
Year of survey Authors/year
Selangor 12-13 1519 32.8 Dean’s 0.7 1991 (Esa and Razak, 2001)
National survey Dean’s
F areas (overall) 16-17 2153 62.3 0.7 1999 (Oral Health Division
Ministry of Health Malaysia,
2001)
NF areas (overall)
16 756
3.0 -
Selangor 10-11 1343 58.7 Dean’s 2003 (Tan et al., 2005)
N.Sembilan 16-17 431 27.8 0.7 2003 (Mohd et al., 2008)
Sub-optimal F areas
(overall)
12-13 147 31.6 TSIF 0.29±0.18 2003/2004 (Shaharuddin et al., 2010)
Kota Kinabalu, Sabah 12-13 79 20.3 0.08 ±0.06 2003/2004
Pasir Mas, Kelantan 12-13 85 27.1 0.44±0.12 2003/2004
Kuala Terengganu 12-13 83 47.0 0.34-±0.13 2003/2004
F, Fluoridated; NF, Non-fluoridated *Fluorosis prevalence defined by (Dean’s score: very mild or greater, TSIF: score one or higher)
Page 53
35
Table 1.7 Studies on the prevalence of enamel defects in Malaysia using the modified Developmental Defects of Enamel (DDE) Index
Area Age
(years)
Sample
size
Enamel defects (%) % Diffuse
Opacities (DO)
% Bilateral DO Year of
survey
Authors/year
Mouth Tooth Mouth Tooth Mouth Tooth
Johor (overall) 11-12 2388 83.1 29.9 72.1 26.2 - - n/a (Dental Division Johor
Malaysia, 1986) Fluoridated 11-12 88.4 38.4 81.2 34.9 - -
Non-
fluoridated
11-12 73.8 15.1 56.0 11.1 - -
Petaling Jaya 11-12 1024 72.5 40.0 67.1 - - - n/a (Razak and Nik,1986)
Johor adult 203 75.6 13.1 42.2 6.2 18.0 4.3 n/a (Majid et al.,1995)
Penang 12-15 229 76.4 19.1 60.2 16.3 41.5 9.0 n/a (Majid et al., 1996)
Penang 16 1024 67.1 64.5 88.6 - - - 1996 (Sujak et al., 2004)
Malaysia 16 4085 56.0 21.8 53.5 20.1 41.0 13.1 (Oral Health Division
Ministry of Health
Malaysia,1998)
Fluoridated 16 2195 69.6 30.7 67.4 54.2 19.3
Non-
fluoridated
16 1639 38.6 9.7 35.8 23.4 4.7
Kuala Lumpur 11-12 957 90.7 45.1 88.6 - 77.0 - 1997 (Yusoff et al., 2008)
Selangor 10-11 1343 - - - - 58.7 30.1 2003 (Tan et al., 2005)
Adapted from (Tan et al., 2005)
n/a= information not available
Page 54
36
Summary
There are established risk factors associated with fluorosis such as water fluoridation,
fluoridated toothpaste, fluoride tablets and infant formula. However there is some
disagreement between systematic review findings due to different inclusion and
exclusion criteria used in each review. Usually a Cochrane review tends to have a more
stringent inclusion criteria and eventually lead to insufficient information to synthesise.
Several indices have been developed to measure fluorosis. There is no consensus about
the best Index to measure fluorosis but rather depends on individual study objectives.
Within the most commonly used indices in the literature, there is some agreement on
fluorosis case definition to enable comparisons across studies.
1.2.3 Dental Caries
A fluoride based preventive strategy aims for caries prevention. Therefore it is important
to understand the aetiology of the disease and how dental caries is measured and reported.
This section will start by discussing the aetiology of dental caries, followed by a
description of caries measurement and a report on caries trends internationally and in
Malaysia.
Aetiology of dental caries
The term ‘caries’ can be used to refer to both the caries process and caries lesion (Kidd
and Fejerskov, 2004). Dental caries is a complex interaction of dental biofilms and
dietary sugar with tooth structure (Fejerskov, 1997, Ten Cate, 2013). Following eruption
into the oral cavity, the enamel surface will be covered by numerous microbial deposits
and undergoing modification by contact with the oral environment. The bacteria produce
Page 55
37
acids and matrix biofilms from sugar metabolism. Organic acids formed in the dental
biofilms (plaque) will reduce the pH level and penetrate into the enamel and lead to
selective dissolutions inside the tooth. This process is known as demineralisation or
‘caries attack’. Cumulative demineralization processes with prolonged acid challenges
will gradually dissolve and weaken the tooth structure and become a cavity. The initial
stage of demineralization can be reversed with natural repair mechanism known as
remineralisation (Section 1.2.1.4).
After an acid challenge, saliva buffers the acid produced by bacteria. During the
remineralisation process, saliva neutralises the pH level by the deposition of calcium and
phosphate ions (Manji et al., 1991, Kidd and Fejerskov, 2004, Ten Cate, 2013). The acid
production in the biofilm can be reduced by several local factors in the environment such
as salivary flow rate and the concentration of fluoride ions in the oral fluid. Therefore the
caries process has been conceptualised as a “delicate balance…...determined by the
relative weight of the sums of pathological factors [acid-producing bacteria, fermentable
carbohydrates] and protective factors [saliva, calcium, phosphate and fluoride]”
(Featherstone, 1999).
Caries measurement
Various carious assessment systems have been developed since the late 19th century.
This section focuses on the most common caries measurement indices used in
epidemiology surveys, namely the DMF Index and ICDAS system. A description of other
caries classification systems such as Caries Assessment Spectrum and Treatment (CAST)
(Frencken et al., 2011), Significant Caries Index (Bratthall, 2000) and Pulp-Ulcer-
Fistula-Abscess (PUFA) index (Monse et al., 2010) is beyond the scope of this thesis.
Page 56
38
DMF Index
The most commonly used caries index is the DMF (Decay, Missing, Filling) developed
by Klein et al., (1938) and subsequently endorsed by the World Health Organization
(1997). The index is used separately for the deciduous and the permanent dentition.
Upper-case letters (DMF) are used for permanent dentition and lower-case letters (dmf)
for the primary dentition. In terms of index variation, the tooth surfaces (DMFS or dmfs
index) are used as assessment unit as opposed to the tooth. Data in epidemiology surveys
using this index can be used to report the prevalence and severity of the disease at
population level. The prevalence is usually measured by the proportion of the children in
the population who have at least one decayed, missing or filled tooth (% DMFT>0). The
severity of the disease is usually measured by the average number of decayed, missing
or filled teeth (mean DMFT) per child. The advantages of the DMF index are reported to
be a system that is easy to use, valid and reliable, allows comparison of caries prevalence
in various populations and it recognized by the majority of countries for national oral
health survey purposes. However one of the major disadvantages of DMF index is that it
only records cavitated or restored lesions and does not record non-cavitated lesions (i.e.
caries in its early stages, when still confined to dental enamel or non-cavitated dentine
caries). In addition, some researchers have noted limitations with the index, including
the assumption that filled and missing teeth are assumed to have been carious, and the
equal weighting assigned to decayed, filled and missing teeth (Broadbent and Thomson,
2005).
Page 57
39
ICDAS
In the year 2001, a new caries assessment system was developed and the ICDAS-
International Caries Detection Assessment System (Pitts, 2004, Ismail et al., 2007). This
system was developed to facilitate caries epidemiology, research and appropriate clinical
management (Pitts, 2004). Unlike DMF index, the ICDAS system records stages of
caries lesion development which include cavitated and non-cavitated lesions and active
or inactive lesions. The initial development of ICDAS-I included detection of coronal
caries and lesion activity without root caries assessment. In 2009, the ICDAS
coordination committee expanded the discussion and came up with ICDAS-II. The index
has described caries assessment for coronal and root surface and caries assessment
associated with restorations and sealants. The code for coronal caries range from 0 to 6,
indicating severity of the lesion (Appendix 1). Subsequently ICDAS-II became a two-
digit scoring method, where the first digit records restorations/sealants as denoted by a
specific code, followed by the appropriate caries code. The strengths of ICDAS-II are it
includes stages of carious lesion progression in the enamel, the caries assessment can be
carried our through visual/tactile sensation and it has found to be valid and reliable.
Inclusion of stages of enamel carious lesion is important particularly to manage the lesion
progression using caries preventive agents and to assess lesion progression. The
limitations of ICDAS include excessive amount of information collected may result to
difficulty in reporting data in meaningful way, and overestimation of seriousness of
dental experience (Frencken et al., 2011). Some investigators claim it is not practical to
dry surfaces to assess for early enamel caries (code 1) particularly during epidemiology
fieldwork (Frencken et al., 2011, Fisher et al., 2012). However, in terms of drying the
surface, the index has allowed some epidemiology modification, which still enable
assessment of enamel caries without drying. In terms of analysis, full ICDAS detection
Page 58
40
codes can be collapsed to make them equivalent to the traditional DMFT index to enable
comparison across studies (Appendix 2).
Caries trends in children
International trends in the prevalence of dental caries
Globally, the prevalence of dental caries has declined since the 1970s. The largest decline
has been seen in industrialised countries. In terms of differences in trends between the
two dentitions, the caries reduction in permanent teeth was greater than that in the
primary teeth. However the decline seemed to have reached a plateau in both dentitions.
For example in the UK, in 5 year-old children caries prevalence in the primary dentition
reduced significantly from 72% (1973) to 50% (1983) and to 45% (1993), but showed
less improvement in the following decade from 43% (2003) to 31% (2013). Similar
patterns were observed in the permanent dentition among the 12 and 15 year-old children
where the rate of caries reduction continued to slow in the last decade compared to the
preceding twenty years (Pitts et al., 2015). However the decline in improvement has
changed to an increase in caries trend in the US (Dye et al., 2007), Norway (Haugejorden
and Birkeland, 2006) and Australia (Mejia and Ha, 2011). For instance, the United Sates
National Health and Examination Survey (NHANES) data from 1988-1994 and 1999-
2004 indicated that prevalence of caries in primary teeth among children aged 2-5 years
increased from 24% to 28% (Dye et al., 2007). Data reported from Norway for the period
1985-2004 showed a 15-year trend of caries reduction in permanent teeth of 12 year-
olds. However starting in 2000, an increase of 3.3% per year was reported (Haugejorden
and Birkeland, 2006). Table 1.8 presents trends of caries prevalence among children in
selected countries.
Page 59
41
Table 1.8 International prevalence of caries in children from selected countries
Countries Year of
survey
Age Index Caries
prevalence
%
Mean
caries
experience
Reference
USA 1988-
1994
2-5
Primary
dmft 24 1.01 (Dye et al.,
2007)
1984-
2004
28 1.17
Australia
1977 6 dmft - 3.13 (Australian
Institute of
Health and
Welfare et al.,
2016)
1987 Primary - 1.91
1997 - 1.50
2007 - 1.95
1977 12 DMFT - 4.79
1987 Permanent - 1.75
1997 - 0.86
2007
- 0.95
UK+ 1973 5 dmft 72 - (Pitts et al.,
2015) 1983 Primary 50 -
1993 45 -
2003 43 -
2013 ICDAS 31
England,
Wales,
Northern
Ireland+
2003 12 DMFT 43 1.0
2013 Permanent ICDAS 34 0.8
New
Zealand
2004 5 dmft 48.9 2.18 (Schluter and
Lee, 2016) 2009 Primary 44.9 2.01
2013 43.3 1.93
2004 8 DMFT 55 1.60
2009 Permanent 48.4 1.39
2013
46.1 1.15
Norway 1997 5 d3mft 30 1.1 (Haugejorden
and Birkeland,
2005)
2001 Primary 40 1.6
2003 36 1.4
1985 12 D3MFT 81 3.4 (Haugejorden
and Birkeland,
2006)
2000 Permanent 52.2 1.5
2004
59.8 1.7
China 1983 12 DMFT 38.2 0.8 (Wang et al.,
2002) 1995/95 Permanent 45.8 1.0 +Trends comparison was made based on obvious decay experience
Page 60
42
Caries trends in Malaysia
Similar trends in caries experience have been reported in Malaysia. According to the
National Oral Health Survey for Schoolchildren (NOHSS), the dental caries prevalence
for the 12-year-olds declined from 60.9% in 1997 to 41.5% in 2007 (Oral Health Division
Ministry of Health Malaysia, 2010). Data from the School Dental Services reported
caries continued to decrease in 2013 (36.8%), however in a much slower rate Table 1.9.
(Oral Health Division Ministry of Health Malaysia, 2014). In the primary dentition, a
consistent pattern of caries decline was observed from 1995 (87.1%) to 2013 (65.8%)
(Oral Health Division Ministry of Health Malaysia, 2009). However, the rate of reduction
was lower than the permanent dentition (Table 1.10).
Although all states in Malaysia show a reduction in caries experience, there is a wide
variation in terms of caries prevalence and severity across states in Malaysia. The highest
caries prevalence states were among less affluent states with a negligible concentration
of fluoride in the public water supply namely the states of Kelantan and Sabah. The more
affluent states with established fluoridation programmes such as Kuala Lumpur, Johor
and Selangor have a lower caries prevalence than national average.
Page 61
43
Table 1.9 Caries prevalence among 12 year-old children in Malaysia by state
Percentage caries prevalence %
State NOHSS 1997 NOHSS 2007 SDS 2013
West Malaysia
(Peninsular)
Johor 51.0 25.7 25.8
Perak 72.4 40.2 29.5
Kedah 62.8 38.0 28.5
N.Sembilan 52.9 32.8 23.9
Pahang 69.4 43.5 40.7
Perlis 65.2 42.2 29.0
Melaka 49.5 32.4 36.0
Terengganu 73.8 49.5 57.1
Kuala Lumpur 39.8 27.1 18.1
Selangor 44.0 30.2 21.2
Penang 52.9 38.5 30.0
Kelantan 67.7 62.7 65.4
East Malaysia
(Borneo)
Sarawak 72.6 47.1 50.9
Sabah 80.5 73.3 66.8
MALAYSIA
(Mean DMFT)
60.9
(1.9)
41.5
(1.12)
36.8
(0.91)
NOHSS: National Oral Health Survey of School Children 2007 (Oral Health Division Ministry
of Health Malaysia, 2010)
SDS: National data from the School Dental Service (Oral Health Division Ministry of Health
Malaysia, 2014)
Page 62
44
Table 1.10 Dental caries status of 6 year-old preschool children in Malaysia
Peninsular
Malaysia^
70/71
Peninsular
Malaysia^
1988
Malaysia
NOHSS
97
Malaysia
NOHSS
2007
Malaysia
SDS
2013
Caries
prevalence
95.7 89.3 80.9 74.5 65.8
Mean dmft
6.3
6.2
4.1
3.9
n/a
NOHSS: National Oral Health Survey of School Children (Oral Health Division Ministry of
Health Malaysia, 2010).
SDS: National data from the School Dental Service (Oral Health Division Ministry of Health
Malaysia, 2014).
^National data for Peninsular Malaysia (excluding the East Malaysia, Sabah and Sarawak states
in Borneo).
Summary
A dramatic improvement of dental caries has been reported since the mid-twentieth
century. However recent data often suggest either slowing down in the rate of
improvement or indeed an increase again. The ICDAS index is a new validated index
that enable detection of enamel and dentine caries which would contribute to the
improvement of caries recoding and reporting.
1.2.4 Overview of fluoride exposure and caries prevention approach
in Malaysia
This Section considers the approach to preventing dental caries in Malaysia, with a
particular emphasis on the role of fluoride. Specifically the role played by water
fluoridation is discussed as is methods to monitor quality standards and additional
sources of fluoride.
Page 63
45
Exposure to fluoride from water
Malaysia implemented a water fluoridation programme in 1972 with an optimum
fluoride level of 0.7 ppm. The fluoride level in the water has subsequently been reduced
to 0.5 ppm in 2005 (Oral Health Division Ministry of Health Malaysia, 2006). The
reasons for this reduction were an increase in the prevalence of fluorosis and concerns
over the contribution of water fluoridation to total fluoride exposure. Concerns had also
been raised about the higher water intake among the population in a tropical country like
Malaysia with average temperature of 27 to 30 degree Celsius (Malaysian Metrological
Department, 2017). Evidence on the relationship between climatic conditions and
fluorosis levels in the water was first established by Galagan et al. (1957). These authors
found that variation between fluorosis levels could be attributed to different volumes of
water consumed by people living in different temperatures (Galagan et al., 1957).
Therefore climate factors also play a role when considering the recommendation of the
optimal fluoride concentration in the drinking water.
Exposure to fluoride from other sources
Since the 1980s fluoridated toothpaste use has become widespread in Malaysia. Similar
to many other countries, the standard fluoride toothpaste concentration is 1000-1500 ppm
for adults and 500 ppm for children. The previous standard recommendations for
children with regards to amount of toothpaste under six years of age was to use a small
(smear to pea) size and under three years a smear of toothpaste (Oral Health Division
Ministry of Heath Malaysia, 2003a). However this guideline was revised in 2007 (Oral
Health Division Ministry of Health Malaysia, 2007, Malaysian Dental Council, 2009).
The modification to the guideline includes; children under two years of age should have
their teeth brushed without fluoridated toothpaste; a smear size of toothpaste for children
Page 64
46
aged two to four years; and pea size of toothpaste is for children aged four years and
above. Professionally applied fluoride varnish/gel is recommended for children who are
at high risk in developing caries. Some local initiatives took place to improve the oral
health status in non-fluoridated areas. For example a school-based fluoride mouth rinsing
programme in the Sarawak area (Chen et al., 2010). Another preventive strategy adopted
in Malaysia is a school-based fissure sealant programme for seven year-old school
children (Oral Health Division Ministry of Health Malaysia, 2003b). This programme
was established in 1999 and is still carried out in both fluoridated and non-fluoridated
areas as part of the school dental service.
Monitoring of fluoride levels in public water supply
There are three major agencies involved in monitoring fluoride levels in the Malaysian
public water supply. These agencies are the Oral Health Division, Public Health
Department and water treatment plant management.
At the national level, Oral Health Division, the Ministry of Health is responsible for
monitoring the fluoridation programme by setting a standard in the National Indicator
Approach to ensure safety and effectiveness of water fluoridation programme (Oral
Health Division Ministry of Health Malaysia, 2006). The standard level for fluoride in
drinking water is incorporated as a policy into the National Guidelines for Drinking
Water Quality document. At the state level, the District Dental Officer is responsible for
monitoring fluoride levels both at the water treatment plant sampling point and
reticulation points in the district. Fluoride level is measured using test equipment such as
Colorimeters/ ionic colorimeter.
Page 65
47
The Public Health Department, Ministry of Health is authorised to monitor quality of
drinking water. Every three months, water samples are collected from sampling points
by relevant Health Inspectors and tested for fluoride levels by the Chemistry Department.
Any violation on standards should be rectified in time to ensure safety and effectiveness
of the programme. Periodic reports of fluoride levels are disseminated to relevant
departments such as Engineering Division, Ministry of Health, the State Health
Department and the District Health Officer.
The management of the water treatment plants in public and private sector is responsible
for complying with the standard and ensuring that fluoride levels are maintained at
recommended level at all time.
Summary
Malaysia has a strong public health policy in fluoride based caries prevention. In 2005
there was a change in the public health policy with regards to concentration of fluoride
in the water from 0.7 ppm to 0.5 ppm. This policy change aims to achieve benefit of
fluoride in caries prevention and minimise the risk of fluorosis. The next chapter
systematically reviews the existing literature on the impact of reducing or stopping water
fluoridation on dental caries and fluorosis.
Page 66
48
2 The impact of stopping the addition or reducing the
level of fluoride in public water supply: a systematic
review
This chapter presents a systematic review that examines the impact of stopping or
reducing the addition of fluoride to public water supply on dental caries and fluorosis.
Standard of reporting in this review is based on the PRISMA guidelines for systematic
reviews that evaluate health care interventions (Liberati et al., 2009).
Introduction
Systematic reviews have acknowledged the benefits of water fluoridation as a whole
population approach to caries prevention (McDonagh et al., 2000, Australian National
Health and Medical Research Council, 2007, Iheozor‐Ejiofor et al., 2015). According to
the British Fluoridation Society, water fluoridation is currently practiced in 25 countries
worldwide (The Birtish Fluoridation Society, 2012). Although water fluoridation has
proved a successful approach in caries prevention, over time a number of countries have
reviewed their fluoridation policy in light of alternative means of fluoride delivery. There
are a number of countries where fluoridation was used either for a short time on an
experimental basis or having been used for a longer period was stopped. Countries and
areas which have been fluoridated in the past but have removed fluoride from the water
include Scotland (Wigtownshire) (Attwood and Blinkhorn, 1989), Wales (Anglesey)
(Thomas et al., 1995), Finland (Kuopio) (Seppa et al., 1998), Cuba (La, Salud) (Kunzel
and Fischer, 2000), Japan (Okinawa) (Kobayashi et al., 1992), China (Gongzhou) (Wei
and Wei, 2002), South Korea (Cheongju) (Cho et al., 2014) and Canada (Calgary)
(McLaren et al., 2016). Reasons for cessation are discussed further in Section 2.6.4.
Page 67
49
In a number of countries, rather than cease fluoridation completely, the level of fluoride
added to the water has been adjusted downwards. For example the US Public Health
Services recommended lowering fluoride levels in public water supply from the
previously agreed range of 0.7 to 1.2 ppm (parts per million) fluoride (F) to a level of 0.7
ppm (Federal Panel on Community Water Fluoridation, 2015). In Europe, Ireland has
lowered the fluoride concentration in the water from 1.0 ppm to a new range 0.6 - 0.8
ppm, with a target concentration of 0.7 ppm in 2007 (Parnell et al., 2009, Whelton and
O’Mullane, 2012). In Asia, authorities in Hong Kong have reduced the fluoride
concentration in their public water supply twice, from 1ppm to 0.7 ppm in 1978 and then
a further reduction to 0.5 ppm in 1988 (Wong et al., 2014). In Southeast Asia, Singapore
has taken similar action by reducing the concentration of fluoride in drinking water twice
from 0.7 to 0.6 ppm in 1992 and further to 0.5 ppm in 2008 (Petersen et al., 2012). Of
particular relevance to the work reported later in this thesis, in 2005 the Malaysian
Ministry of Health reduced the fluoride level in the public water supply from 0.7 ppm to
a target concentration of 0.5 ppm (Oral Health Division Ministry of Health Malaysia,
2006). Reasons for lowering the ‘optimum’ fluoride level relate mainly to rising concern
over an increased prevalence of dental fluorosis. The relationship between water intake
and local climatic conditions and the contribution of fluoride in drinking water to total
fluoride exposure have also impacted on decisions by authorities on optimal fluoride
levels in the water supply. However the impact of reducing the optimum fluoride
concentration in the water supply has been questioned (Spencer and Do, 2016), as
discussed further in Section 2.7.2.
Existing systematic reviews of water fluoridation have evaluated the effectiveness of
water fluoridation in terms of caries prevention (McDonagh et al., 2000, Australian
National Health and Medical Research Council, 2007, Iheozor‐Ejiofor et al., 2015).
Page 68
50
Previous reviews have also examined the effect of the total cessation of water
fluoridation, but have not been comprehensive in their inclusion of cessation studies. For
example, the York review considered eight cessation studies, which included studies with
negative and positive control groups (McDonagh et al., 2000). However, the recently
published Cochrane review had more stringent inclusion criteria and included only a
single study with a positive control (Iheozor‐Ejiofor et al., 2015). The York review
suggested that the prevalence of dental caries increased following the withdrawal of
water fluoridation. The Cochrane review concluded that ‘there is insufficient
information to determine the effect of stopping community water fluoridation on caries
levels’. A very recent systematic review by McLaren and Singhal (2016) included fifteen
articles on the impact of fluoridation cessation on dental caries. These authors
emphasised the methodological limitations of assessing fluoridation cessation and
highlighted the value of including studies with a historical control. In addition to the
effects of total removal of fluoride from the public supply, McLaren and Singhal
discussed the decision-making circumstances that have surrounded cessation, but were
unable to establish any studies reporting on this topic. Additionally they did not examine
the impact of cessation on fluorosis.
Research on the effects of lowering the optimum fluoride level in the water is less
common than studies that have examined total cessation. However this is important
because as stated above, reduction rather than total cessation appears to be occurring
more frequently in recent years. To date there have been no systematic reviews looking
at the impact of fluoride reduction as opposed to total cessation. The work reported in
this Chapter aims to systematically review the impact of stopping or reducing the fluoride
level in the water on dental caries and fluorosis.
Page 69
51
In this review the terms cessation and reduction are used. Cessation refers to stopping
the addition of fluoride to the public water supply. Reduction implies a downward
change in the concentration at which the water is fluoridated.
Aims
To systematically review the impact of stopping or reducing the fluoride level in the
water on dental caries and fluorosis.
Review Questions
This review sought to answer the following questions:
1. What are the effects of cessation of water fluoridation on the prevalence of
dental caries?
2. What are the effects of cessation of water fluoridation on the prevalence of
dental fluorosis?
3. What are the effects of the reduction of fluoride level in the water on the
prevalence of dental caries?
4. What are the effects of the reduction of fluoride level in the water on the
prevalence of dental fluorosis?
Page 70
52
Materials and Methods
2.4.1 Water fluoridation cessation and dental caries and fluorosis
Type of studies
When reviewing the impact of stopping water fluoridation, the following types of study
were included in the review.
Studies with a historical comparison, populations receiving fluoridated water
then subsequently having fluoride discontinued from the water (pre and post
study with no control group)
Studies comparing at least two populations with one previously fluoridated, the
other with non-fluoridated water (negative control); and
Studies comparing at least two populations with groups from fluoridated areas at
baseline, with one group subsequently having fluoride removed from the water
and the control group remained fluoridated (positive control).
2.4.2 Type of interventions
The review looked at both the permanent or temporary cessation of fluoride in the water
supply in at least one of the study areas. The intervention had to be in place at least for
12 months to allow a meaningful effect of the intervention on caries or fluorosis. Areas
with a natural fluoride level of less than 0.3ppm were regarded as “non-fluoridated”.
Exposure to other sources of fluoride (e.g. fluoridated toothpaste) were not considered
as these were assumed to be similar across fluoridated and non-fluoridated communities.
If no specific information was available for other sources of fluoride, any studies
Page 71
53
conducted after 1975 in industrialised countries were assumed to have been conducted
in the presence of fluoridated toothpaste use in the communities involved.
Type of participants
There were no age limits or other demographic restrictions applied to the populations
included in the review.
2.4.3 Reduction of fluoride in the water on dental caries and dental
fluorosis
The review of studies examining a reduction in the concentration of fluoride in the water
supply (rather than cessation) was conducted in a similar fashion to that for cessation
studies (Section 2.4.1.1). The only difference was related to the type of study included
for fluorosis outcome. Taking consideration of the contrasting aetiology between
fluorosis and caries, studies that used birth cohort analysis was deemed valuable to be
included in this review. Any studies that compared fluorosis prevalence across multiple
age groups that correlated with the change in fluoride level during enamel development
were included. The requirement of ‘two point in time’ was extracted based on change in
exposure to fluoride level during tooth development that occurred at different age. When
reviewing fluorosis, this additional type of study was included in addition to the studies
described earlier.
Outcome measures
The primary outcomes were changes in caries prevalence and the presence of dental
fluorosis. The measures deemed suitable for inclusion in the systematic review are
described below:
Page 72
54
Dental caries
Measures of dental caries were as follows:
A change in the number of decayed, missing and filled deciduous and
permanent surfaces and teeth (dmfs/DMFS and dmft/DMFT)
The percentage of caries free children
Dental fluorosis
Dental fluorosis was measured as the percentage of children affected by fluorosis using
the following indices:
Dean’s Fluorosis Index
Tooth Surface Index of Fluorosis (TSIF)
Thylstrup and Fejerskov (TF) Index
Developmental Defects of Enamel (DDE)
For measurement of fluorosis, the percentage prevalence was based on the index used in
the individual studies. Subjects were defined as having fluorosis with a DDE, TSIF, TF
score greater that zero or Dean’s classification of ‘questionable’ or greater as described
in the York Review (McDonagh et al., 2000).
Other effects of fluoridation
For the context of this review, only dental fluorosis was recorded. Any other adverse
effects (e.g. skeletal fluorosis, hip fractures, cancer, congenital malformations, mortality)
are outside the scope of this review and are not reported.
Page 73
55
Search Methods for Identification of Studies
2.5.1 Electronic searches
For this review, detailed search strategies were developed combining controlled
vocabulary and free text terms for each database searched. In collaboration with a
professional dental subject librarian, the search covered research published from their
starting date to 11th February 2016. The detail of each search strategy and the keywords
used are shown in Appendix 3 to Appendix 6. All publications were searched with no
language restrictions on the language of publication. The searched databases were as
follows:
EMBASE via OVID (1947 to 11th February 2016; Appendix 3)
MEDLINE via OVID (1947 to 11th February 2016; Appendix 4)
The Cochrane Central Register of Controlled Trials (start date to 11th February
2016;Appendix 5)
The Web of Science (1990 to 11th February 2016; Appendix 6)
Additional search strategies
The reference list of the eligible papers was also hand searched. Attempts were made to
contact authors for unpublished papers if necessary (Appendix 7). During the conduct of
the review and beyond the formal end date for the database search a new paper relevant
to this work was published. This and two subsequently identified papers, identified
outside the formal search strategy were identified and are also included in the review.
Page 74
56
2.5.2 Data collection and analysis
Selection of studies
The author of this thesis (NAMN) screened the titles and abstracts based on all references
identified by the electronic searches. Initial exclusions made based on titles and abstracts
were agreed with IGC. For studies appearing to meet the inclusion criteria or for which
there were insufficient data in the title and abstract to make a clear decision, full text
articles were obtained. Two reviewers assessed all full text articles independently and
disagreement was resolved by discussion. The excluded studies and reasons for their
exclusion were recorded as described in Section 2.6.3.
Data extraction and management
Three reviewers (NAMN, IGC, BLC) were involved in the data extraction exercise.
Reviewers were paired for designated articles using data extraction forms (Appendix 8).
Any disagreements were resolved by discussion. The data extraction forms were piloted
on three papers and necessary amendments were made before their use to screen all
papers.
For each study, the following data were recorded (Table 2.1)
Page 75
57
Table 2.1 Key information extracted from each study
Year of publication, country of origin and source of study funding.
Details of the participants including demographic characteristics
(socioeconomic status, ethnicity), age, deciduous or permanent dentition and
inclusion and exclusion criteria.
Details of type of intervention, comparator and co-interventions.
Details of outcomes reported
Details of the confounding factors considered (potential confounders of
relevance to this review include sugar consumption/dietary habits, SES,
ethnicity and the use of other fluoride sources).
Details on comparability of groups with regard to confounding factors.
Details on methods used to control for confounding.
Details relating to both adjusted and unadjusted effect estimates.
Reasons for cessation or reduction of fluoride level in the water.
Assessment of study validity
Each study included in this review was assessed using a validity assessment checklist (a
validity score and level of evidence) that used in the York Review (NHS Centre for
Reviews and Dissemination, 1996, McDonagh et al., 2000)
Each study was assigned a level of evidence using definitions as described in Table 2.2
and a validity score based on the checklist (Appendix 9). The maximum score was 8 for
all study designs.
Page 76
58
Table 2.2 Level of evidence score, adapted from the York Review (McDonagh et al.,
2000)
Level A
Highest quality of evidence,
minimal risk of bias
Prospective studies that started within one year of
discontinuation of water fluoridation and have a
follow up of at least two years for positive effects
and at least five years for negative effects.
Studies either randomised or addressing at least
three possible confounding factors and adjusting for
these in the analysis where appropriate.
Studies where the fluoridation status of participants
is unknown to those assessing outcomes.
Level B
Evidence of moderate
quality, moderate risk of bias
Studies that started within three years of
discontinuation of water fluoridation, with a
prospective follow up for outcomes.
Studies that measured and adjusted for less than
three but at least one confounding factor.
Studies in which fluoridation status of participants
was known to those assessing primary outcomes, but
other provisions were made to prevent measurement
bias.
Level C
Lowest quality of evidence,
high risk of bias
Studies of other designs (e.g. cross sectional),
prospective or retrospective, using concurrent or
historical controls, that meet other inclusion criteria.
Studies that failed to adjust for confounding factors.
Studies that did not prevent measurement bias.
Page 77
59
2.5.3 Data synthesis and outcome measurement
Caries
An excel spreadsheet was created to record data (mean, S.D/S.E, percentage prevalence,
sample size) for all study types (study with no control, study with negative control, study
with positive control). The following caries indices were included in the synthesis:
DMFT/DMFS in the permanent dentition, dmft/dmfs in the primary dentition, percentage
of children who were caries free in the permanent dentition and the percentage of children
who were caries free in the primary dentition.
Studies with no control group
For the caries outcome, in studies with no control group, the comparison of interest was
the difference between post-intervention and pre-intervention score in the mean caries
prevalence (post-pre). A positive difference shows that caries increased after intervention
(cessation or reduction). A negative difference shows that caries decreased after
intervention. However, the interpretation of negative or positive difference of
participants is reversed when percentage caries free is the outcome measure. This is
because while an increase in dmf/DMF is undesirable the percentage caries free
increasing is desirable.
Studies with a control group
For those studies with a control group, only cessation studies were available for analysis.
The measure of effect was the mean caries change found between (intervention-control)
at baseline, and between (intervention-control) at follow up. A larger mean difference in
dmf/DMF (at baseline) indicates a beneficial effect of water fluoridation (positive
difference). A smaller mean difference indicates a non-beneficial effect of water
Page 78
60
fluoridation (negative difference). This also holds true when percentage caries free is
the outcome measure.
Of the studies included in the review, some were not usable because either the mean, or
the standard deviation or the number of participants was missing. The data were compiled
and presented in a descriptive table based on the available information indicating the
general effect of stopping or reducing fluoride concentration in the water. Quantitative
analysis using meta-analysis focused on studies with a control group. To be eligible for
inclusion in the meta-analysis, studies required non-missing information and a minimum
of two studies using the same outcome measure. Details of how the meta-analysis was
conducted are discussed in the following section.
Assessment of heterogeneity
The I2 score and chi-square analyses were used to test for differences between studies
(heterogeneity). This test was use to assess whether the observed variability in study
results (measure of effect) is greater than that expected to occur by chance. If the test of
heterogeneity was not significant (I2: towards 0%, chi-square: p≥ 0.05), fixed-effect
models were used. Whereas, if the test of heterogeneity was significant (I2: towards
100%, chi-square: p<0.05), the random-effect models were used. The analyses were
carried out using STATA Version 13.
Ideally meta-regression will be used to investigate and explain sources of heterogeneity,
however due to lack of data this analysis is not able to perform. The same principle
applied for caries and fluorosis outcomes.
Page 79
61
A meta-analysis for caries outcome
In this review, only cessation studies with a negative control group had a sufficient data
to permit the conduct of a meta-analysis for caries outcome. The comparison of interest
was the difference in mean caries change found between (intervention-control) at
baseline, and between (intervention-control) at follow-up. This is an analysis of the
difference of differences of means, which is slightly different to the usual approach that
forms a simple difference of means between two groups (e.g., control and intervention)
using meta-analysis. Thus, appropriate estimates of the standard deviation and sample
size are therefore necessary with respect to these differences in each arm (i.e., control
and intervention) for meta-analysis. Here the pooled estimate of the standard deviation
based on the pre- and post-standard deviations in each arm (control and intervention) are
used, and the harmonic means of the sample sizes in each arm are found. The formula
used to calculate the difference of the difference was as follows: [(PostCessationI -
PostCessationC) - (PreCessationI - PreCessationC)]. Data were analysed using (STATA
Version13) software to produce a pooled estimate effect.
Results are presented as Forest plots, which show both the results of each individual
study and the pooled results of meta-analysis. The pooled results are identified by the
diamonds within the Forest plot, where the middle of the diamond gives the pooled point-
value estimate for the Standardised Mean Difference (SMD) and its edges give the
associated 95% confidence interval (CI).
Page 80
62
Fluorosis
The percentage prevalence of fluorosis, measured using the indices described in Section
2.4.3.1 was used to determine the impact of fluoride level change. The percentage change
in fluorosis prevalence was calculated as the difference between post-intervention and
pre-intervention (post-pre). A positive difference showed that the fluorosis prevalence
increased after the intervention (cessation or reduction). A negative difference shows that
the fluorosis prevalence decreased after the intervention (cessation or reduction).
A meta-analysis for fluorosis outcome
All of the studies included in the meta-analysis for fluorosis outcome were from studies
without a control group (pre and post studies). The meta-analysis for fluorosis was
divided into three parts. The first analysis combined individual studies on the effect of
reducing fluoride level and fluorosis. The second analysis combined individual studies
on the effect of stopping fluoridation and fluorosis. A third analysis combined studies
from both interventions (stopping or reducing) fluoride level for pooled estimates of
effect across time points.
For the prevalence of fluorosis, outcomes are binary and results are given only for pre to
post-fluoride cessation/reduction. A simple approach is to use meta-analysis based on
odds ratios, which utilises the number of cases of fluorosis pre and post-fluoride
cessation/reduction and overall sample sizes in order to form a pooled estimate effect.
Data were analysed using STATA Version 13 software. Results are presented as Forest
plots, which show both the results of each individual study and the pooled results of
Page 81
63
meta-analysis. The pooled results are identified by the diamonds within the Forest plot,
where the middle of the diamond gives the pooled point-value estimate for the odds ratio
and its edges give the associated 95% confidence interval (CI).
The meta-analysis used for fluorosis outcome differed from that used in caries studies
because of the different study design. The analysis used for fluorosis compared pre and
post intervention, rather than comparing the differences found within (intervention-
control) at baseline and follow up survey.
Results
2.6.1 Results of the search
A total of 385 studies were identified in the database searches as shown in the PRISMA
diagram (Liberati et al., 2009) Figure 2.1. Titles and abstracts were screened and 187
records were excluded as duplicates. A further 169 were deemed irrelevant and excluded.
That left 29 articles for full text review and this was added to by 15 additional articles
identified from other sources. In total, 44 full text articles were screened for eligibility.
Eighteen records were excluded at this stage, leaving 26 papers for data extraction. In
the course of data extraction it became apparent that four of these studies were unsuitable.
Reasons of exclusion are described in section 2.6.3. A total of 22 publications were
included in the review.
Page 82
64
Figure 2.1. PRISMA Flow Diagram
Full text articles reviewed
for eligibility (n=44)
Duplicate
removed (n=187)
Final studies included (n=22)
Excluded studies (n=4)
Single point survey (n=1)
Temporary cessation (n=2)
Missing data (n=1)
Excluded after
title/abstract
reviewed (n=169)
Excluded studies (n=18)
Single point survey (n=5)
Duplicate data (n=4)
Defluoridation technique
(n=4)
Not relevant (n=5) Full text articles reviewed with
data extraction form (n=26)
Full text articles retrieved
from data searches (n= 29)
Records identified through database
searching
MEDLINE (n= 92)
EMBASE (n= 185)
WEB OF SCIENCE (n=72)
COCHRANE LIBRARY (n = 36)
Total (n= 385)
Title/abstract screened (n=198)
Full text articles added from
additional sources (n=12)
Additional studies found
beyond database searching
date (n=3)
Page 83
65
2.6.2 Included studies
A total of sixteen publications on fluoride cessation and six publications on fluoride
reduction were included in this review. No studies were reported as evidence level A
(high quality, bias unlikely). The majority of the studies were cross-sectional in nature.
Study designs were divided into three categories; studies with a positive control group,
studies with a negative control group and studies without a concurrent comparison group
(i.e. studies that relied on a historical control). Summaries of individual study designs
with full details on findings are presented in Appendix 10, characteristics of studies
(Appendix 11) and validity scores are presented in Appendix 12.
Year of publication year ranged from 1962 to 2016. The included studies were divided
into stopping or reducing fluoride level. The study types are explained in Table 2.3
together with the number for each outcome measure (caries and fluorosis). The details of
the included studies are described in the following sections.
Page 84
66
Table 2.3 Number and type of studies categorised by change of fluoride level in the water
and the main outcome measure
Change of
fluoride
level
Study type Definition of study type Number of studies for
each outcome
measure
Caries Fluorosis
Cessation No Control Study that has pre and post-
cessation data in one or more
populations.
7ф 2ф
Negative
control
Study that used a non-
fluoridated area as a control.
The intervention group was
exposed to artificial
fluoridation at baseline and
subsequently fluoride was
removed from the water.
6 0
Positive
control
Study when the intervention
group was exposed to artificial
fluoridation at baseline and
subsequently fluoride was
removed from the water at
follow-up, while the control
group remained artificially
fluoridated at both time points.
2 0
Reduction No control Study that has pre and post-
fluoride reduction in one or
more populations.
1 5
ф One publication reported both outcomes (caries and fluorosis) thus the above Table presents
23 publications.
Page 85
67
Included studies for caries outcome measure
Sixteen publications met the inclusion criteria for the caries outcome. Fifteen of these
publications assessed the effect of stopping fluoridation (Jordan, 1962, DHSS, 1969,
Lemke et al., 1970, Stephen et al., 1987, Attwood and Blinkhorn, 1989, Kalsbeek et al.,
1993, Kunzel and Fischer, 1997, Seppa et al., 1998, Kunzel and Fischer, 2000, Kunzel
et al., 2000, Seppa et al., 2000a, Seppa et al., 2000b, Maupome et al., 2001a, Wei and
Wei, 2002, McLaren et al., 2016) and only one study focused on the effect of reducing
fluoride level in the water on caries (Kunzel, 1980).
Four publications were funded by research grants from research organisations, health
authorities and government organisations (Seppa et al., 1998, Kunzel and Fischer, 2000,
Maupome et al., 2001a, McLaren et al., 2016) while the other publications did not state
their funding sources.
Cessation study (caries outcome)
Of the fifteen publications on caries outcome, eight publications had a control group (two
publications with positive control, six publications with negative control) and the
remaining seven publications were without a control group.
The occurrence of water fluoridation cessation varied by geographic location (USA,
Germany, Scotland, Netherlands, Finland, China and Canada). Four publications were
scored as evidence level B (moderate quality) (Kalsbeek et al., 1993, Maupome et al.,
2001a, Seppä et al., 2000a, McLaren et al., 2016) and the remaining eleven publications
were scored as evidence level C (lowest quality) (Jordan, 1962, DHSS, 1969, Lemke et
al., 1970, Stephen et al., 1987, Attwood and Blinkhorn, 1989, Kunzel and Fischer, 1997,
Page 86
68
Seppa et al., 1998, Seppä et al., 2000b, Kunzel and Fischer, 2000, Kunzel et al., 2000,
Wei and Wei, 2002).
Reduction study (caries outcome)
Only one publication conducted in Germany, looked at effect of lowering fluoride level
on dental caries prevalence (Kunzel, 1980). This study had no comparison group and was
rated as evidence level C.
Included studies for fluorosis outcome measure
Seven publications met the inclusion criteria for the fluorosis outcome (Horowitz and
Heifetz, 1972, Horowitz et al., 1972, Evans, 1989, Evans and Stamm, 1991b, Wei and
Wei, 2002, Clark et al., 2006, Wong et al., 2014). Five publications looked at the effect
of reducing fluoride level in the water and two publications assessed the effect of
stopping fluoridation on fluorosis.
Two studies were funded by research grants from research organisations, health
authorities and government organisations (Clark et al., 2006, Wong et al., 2014), while
the other studies did not state their funding sources.
Cessation studies (fluorosis outcome)
Two studies assessed the effect of stopping fluoridation on fluorosis. These were
conducted in Gongzhou, China (Wei and Wei, 2002) and British Columbia, Canada
(Clark et al., 2006). The Chinese study reported fluorosis prevalence using Dean’s Index
and the Canadian study used the TF Index. The Chinese study was scored as evidence
level C and the Canadian study was scored as evidence level B.
Page 87
69
Reduction studies (fluorosis outcome)
Out of five studies that assessed the effect of reducing fluoride level in the water, three
were conducted in Hong Kong and two in USA. Two Hong Kong studies (Evans, 1989,
Evans and Stamm, 1991b) were linked publications conducted in multiple districts in
Hong Kong, which compared fluorosis prevalence across multiple age groups that were
exposed to different fluoride levels and change of fluoride level occurred during enamel
development. The remaining publications were cross sectional studies without a control
group.
Four publications reported fluorosis prevalence using Dean’s Index and the other used
the DDE Index. Only one study was evidence level B and the remaining four publications
were evidence level C.
2.6.3 Excluded studies
Of 44 studies that were assessed for eligibility, 18 studies were excluded as irrelevant
(Horowitz et al., 1964, Walvekar and Qureshi, 1982, Attwood and Blinkhorn, 1988, King
et al., 1986, King and Wei, 1986, King, 1989, Seaman et al., 1989, Kobayashi et al.,
1992, Treasure and Dever, 1992, Treasure and Dever, 1994, Liang, 1998, Angelillo et
al., 1999, Wu et al., 2000, Maupome et al., 2001b, Seppa et al., 2002, Wong et al., 2006,
Mohapatra et al., 2009, Cho et al., 2014). The reasons for exclusion were as follows
(Table 2.4).
Page 88
70
Table 2.4 Excluded studies and reasons for exclusion following the first stage assessment
of study eligibility
References Reasons for exclusion
(Kobayashi et al., 1992, Treasure and
Dever, 1992, Treasure and Dever, 1994,
Seppa et al., 2002, Cho et al., 2014).
Studies that used a single post-
intervention cross-sectional design.
(Horowitz et al., 1964, Attwood and
Blinkhorn, 1988, Maupome et al., 2001b,
Wong et al., 2006).
Series of publications that refer to the
same data already included in this
review.
(Walvekar and Qureshi, 1982, Liang, 1998,
Wu et al., 2000, Mohapatra et al., 2009).
Studies that focus on defluoridation
technology.
(King et al., 1986, King and Wei, 1986,
King, 1989, Seaman et al., 1989, Angelillo
et al., 1999).
Studies that were not relevant to
stopping or reducing fluoride level in
the water supply.
In the process of data extraction, a further four studies were excluded. Reasons for
exclusion were as follows (Table 2.5).
Table 2.5 Excluded studies and reasons for exclusion following data extraction stage
References Reasons for exclusion
(Burt et al., 2000, Burt et al.,
2003)
Temporary cessation of fluoridation for less than 12
months. Further the data were presented in a
manner which made data extraction impossible.
(Buzalaf et al., 2004) A single post-intervention cross-sectional design.
The date when the study was conducted was not
stated. Duration of post-cessation exposure was not
clear.
(Thomas et al., 1995) A study with no concurrent follow-up data in the
comparison group.
Page 89
71
2.6.4 Date and reasons for change in fluoride level
The year of fluoridation cessation ranged from 1956 to 2011. The year of reducing
fluoride level ranged from 1970 to 1988. All publications focused on children, aged
between 5 years to 15 years.
Several studies reported reasons for water fluoridation cessation and the reasons varied
across studies. These included: technical issues (Thomas et al., 1995), significant
political/economic event (Kunzel and Fischer, 1997, Kunzel et al., 2000), lack of clarity
about pertinent laws (Attwood and Blinkhorn, 1989), observed increases in dental
fluorosis (Wei and Wei, 2002), public vote in favour of cessation (Maupome et al.,
2001a) and opposition or anti-fluoridation movements (Seppa et al., 1998).
Reasons for reduction of fluoride level in the water were related to an increase prevalence
of fluorosis, relationship between water intake and climate condition (Evans, 1989,
Wong et al., 2014) and technical issues (Kunzel, 1980).
2.6.5 Results synthesis
The included studies varied by study design, outcome measure, duration of intervention
(stopping or reducing fluoride level) and differences in fluoride concentration being
compared.
For caries outcome, there were more studies published on stopping water fluoridation
than those reporting a reduction. For the fluorosis outcome measure, there were more
studies published on reducing fluoride level in the water than was the case with cessation.
Page 90
72
To summarise the impact of cessation and reduction on each outcome measure, results
were synthesised as follows:
Articles were classified into four main categories based on change in fluoride level
(stopping or reduction) and outcome measure (caries or fluorosis). For caries, the
outcome of interest was change in the mean DMFT/dmft/DMFS/dmfs and percentage
caries free, and results were grouped into three subsets based on study designs (study
with no control, study with a negative control and study with a positive control). For
fluorosis, the outcome of interest was a change in fluorosis prevalence. For each of these
categories, key information is presented in Tables 2.6 to 2.16 (caries) and Tables 2.17 to
2.18 (fluorosis) and results were described qualitatively. Quantitative analysis was
carried out for studies that met the inclusion criteria for meta-analysis (Sections 2.6.8
and 2.6.10). Analysis was conducted separately for caries and fluorosis outcome
measures.
2.6.6 Studies reporting the impact of changes in fluoride level on
dental caries
Studies on the impact of changing fluoride levels are reported below in two groups: those
where fluoridation ceased and those where there was a partial reduction.
Within these change levels, caries outcome is reported in terms of change in the mean
DMFT/dmft/DMFS/dmfs and also the change in percentage of study participants who
were caries free.
In addition, the outcome is reported according to the study design and the nature of the
control group.
Page 91
73
The only type of study that had a sufficient data to permit the conduct of a meta-analysis
was those with a negative control group. Other types of study are reported qualitatively,
without an attempt to combine their overall estimate of the effect of changed fluoride
levels on caries prevalence.
Stopping fluoridation and caries
Fifteen publications met the inclusion criteria for caries outcome following cessation of
water fluoridation. Results were grouped into three subsets based on study designs as
described in the following section.
Studies with no control group
For studies without a control group, stopping water fluoridation was associated with an
increased level of caries experience for studies published in the 1970s or earlier and a
decreased level of caries experience for studies published from 1997 onwards. The effect
of stopping water fluoridation is shown in Table 2.6. This presents the mean change in
caries prevalence at tooth level (DMFT) before and after cessation. This ranged from -
2.73 to 1.10. The mean change in caries prevalence at surface level (DMFS) is also
shown. This indicates that mean caries prevalence decreased after fluoridation
discontinued. To aid interpretation of the results, a positive difference shows caries
increased after cessation. A negative difference shows that caries decreased after
cessation.
Page 92
74
Table 2.6 Summary of studies with no control group on caries outcome (permanent
dentition) when fluoridation was discontinued
Authors Country/
Area
Age Pre-
survey
Post-
survey
Year
change
in F
level
Mean
caries
(pre)
Mean
caries
(post)
Mean
caries
change#
Outcome: DMFT_studies with no control group
Jordan,
1962
Austin,
USA
6 1955 1959 1956 0.40 0.51 0.11
7 1.20 1.38 0.18
8 2.10 2.07 -0.03
Lemke
et al.,
1970)
Antigo,
USA
8 1960 1964 1960 0.60 1.70 1.10
10 1.70 2.40 0.70
Kunzel
and
Fischer,
1997
Chemnitz,
Germany
8 1987 1995 1990 0.75 0.32 -0.43
12 2.55 1.87 -0.68
15 4.87 3.78 -1.09
Plauen,
Germany
8 1983 1995 1984 0.70 0.58 -0.12
12 3.50 1.98 -1.52
15 6.20 3.47 -2.73
Kunzel
and
Fischer,
2000
La Salud,
Cuba
6/7 1982 1997 1990 0.07 0.07 0
8/9 0.50 0.60 0.10
10/11 1.10 0.80 -0.30
12/13 2.10 1.10 -1.00
Kunzel
et al.,
2000
Spremberg,
Germany
8 1993 1996 1993 0.51 0.34 -0.17
9 0.69 0.50 -0.19
12 2.36 1.45 -0.91
13 2.59 1.63 -0.96
15 4.13 3.74 -0.39
16 5.03 3.86 -1.17
Zittau,
Germany
12
1993
1996
1993
-0.51
2.47 1.96
Wei
and
Wei,
2002
Gongzhou,
China
15 1982 1990 1983 0.90 0.44 -0.46
Outcome: DMFS_study with no control group Kunzel
and
Fischer,
2000
La Salud,
Cuba
6/7 1982 1997 1990 0.10 0.07 -0.03
8/9 0.70 0.70 0
10/11 1.50 1.20 -0.30
12/13 3.10 1.50 -1.60
#Mean caries change= (PostCessation - PreCessation). A positive difference shows that the
mean difference between post and pre, indicating that caries increased after cessation. A
negative difference shows that caries decreased after cessation.
Page 93
75
The impact of stopping fluoridation on the primary dentition is presented in Table 2.7.
There were only two studies that contributed data to this outcome, and the change in both
dmft and dmfs are shown. An increase in caries prevalence in both studies, one
conducted in the USA in the early 1960s and the other in Scotland in the early 1980s,
was observed.
Table 2.7 Summary of studies with a no control group on caries outcome (primary
dentition) when fluoridation was discontinued
Authors Country/
Area
Age Pre-
survey
Post-
survey
Year
change
in F
level
Mean
caries
(pre)
Mean
caries
(post)
Mean
caries
change#
Outcome: dmft_studies with a no control group
Lemke
et al.,
1970
Antigo,
Wisconsin,
USA
5/6 1960 1964 1960 2.50 4.80 2.30
Stephen
et al.,
1987
Wick,
Scotland
5/6 1979 1984 1979 2.60 3.92 1.32
Outcome: dmfs_study with a no control group
Stephen
et al.,
1987
Wick,
Scotland
5/6 1979 1984 1979 7.80 13.33 5.53
#Mean caries change= (PostCessation - PreCessation). A positive difference shows that the
mean difference between post and pre, indicating that caries increased after cessation. A
negative difference shows that caries decreased after cessation
Page 94
76
The impact of stopping fluoridation on the change in the percentage of caries free for
permanent teeth is presented in Table 2.8. The interpretation of negative or positive
difference of caries free is reversed to the change in mean caries prevalence that is
described above. A negative difference in the percentage caries free following water
fluoridation cessation indicates a beneficial effect of water fluoridation. In the older study
(Lemke et al., 1970), results show that proportion of children who were caries free
reduced following fluoridation cessation. However, mixed findings were reported in the
later study by Kunzel and Fischer (2000). Their results indicate that caries free proportion
increased in the older children (10-14 years old) and reduced in the younger children
(age 6-9 years old) after fluoridation was discontinued.
Table 2.8 Summaries of studies with no control group on percentage caries free
(permanent dentition) when water fluoridation was discontinued
Authors Country/
Area
Age Pre-
survey
Post-
survey
Year
change
in F
level
%
caries
free
(pre)
%
caries
free
(post)
%
difference#
(post-pre)
Outcome: % caries free (permanent)_studies with no control group
Lemke
et al.,
1970
Antigo,
Wisconsin,
USA
8 1960 1966 1960 71 38.5 -32.5
10 35 26.2 -8.8
Kunzel
and
La Salud,
Cuba 6/7 1982 1997 1990 95.2 93.9 -1.3
Fischer, 8/9 75.6 65 -10.6
2000 10/11 54.8 59.6 4.8
12/13 33.3 55.2 21.9 #Percentage (%) difference= (PostCessation - PreCessation). A positive difference shows that
the % caries free increased after fluoridation cessation. A negative difference shows that %
caries free decreased after fluoridation cessation.
Page 95
77
Table 2.9 shows the change in the percentage of caries free for primary teeth. Two
studies, which were published in 1970 and 1987, demonstrated that the percentage caries
free reduced following fluoridation cessation. This indicates a beneficial effect of water
fluoridation.
Table 2.9 Summaries of studies with no control group on percentage caries free (primary
dentition) when water fluoridation discontinued
Authors Country/
Area
Age Pre-
survey
Post-
survey
Year
change
in F
level
%
caries
free
(pre)
%
caries
free
(post)
%
difference#
(post-pre)
Outcome: % caries free (primary)_studies without a control group
Stephen
et al.,
1987
Wick,
Scotland
5/6 1979 1984 1979 27.4 24.6 -2.8
Lemke
et al.,
1970
Antigo,
Wisconsin,
USA
5/6 1960 1966 1960 39 19.8 -19.2
#Percentage (%) difference= (PostCessation - PreCessation). A positive difference shows that
the % caries free increased after fluoridation cessation. A negative difference shows that %
caries free decreased after fluoridation cessation.
Page 96
78
Studies with a negative control group
Five publications reported on studies which contained a non-fluoridated area as a
negative control. Three publications presented data on permanent teeth only (DMFT
and/or DMFS, the calculation used to determine the impact of cessation differed from
that where there was no control group. The calculation in this study design accounted
for the change in the control groups are shown in Table 2.10 (footnote).
Two included studies for DMFT indicated a larger mean caries difference between
intervention (fluoridated) and control group at baseline than the mean difference between
intervention (fluoridation ceased) and control group at follow up. This implies a
beneficial effect of water fluoridation. The measure of effect in DMFT ranged from 0.60
to 7.40. These results are presented in Table 2.10.
The range of measure of effect in caries change at surface level (DMFS) in permanent
teeth is -0.19 to 18.80. Stopping fluoridation has resulted in a narrowing of the difference
in caries prevalence between fluoridated and control areas in older children aged (9, 12
and 15 years), suggesting that fluoridation had been beneficial. However, in younger
children aged 6 years, not much difference in the mean caries change was observed
between intervention and control group after fluoridation cessation.
The data presented in Table 2.10, were subsequently used to inform a meta-analysis as
described in Section 2.6.8.
Page 97
79
Table 2.10 Summary of studies with a negative control group on caries outcome (permanent dentition) when fluoridation was discontinued
Authors Country/
Area
Age Pre-
survey
Post-
survey
Year
change
in F
level
Mean
caries
(pre)
A
Mean
caries
(post)
B
Mean
caries
change#
(B-A)
Mean
difference
(pre)
C
Mean
difference
(post)
D
Difference
of the
difference^
(D-C)
Outcome: DMFT_studies with a negative control +Atwood
and
Blinkhorn,
1989
UK,
Stranrear
10 1980 1986 1983 1.66 1.72 0.06 -1.69 -1.09 0.60
Annan
(control)
10 3.35 2.81
-0.54
+Kalsbeek
et al., 1993
Netherland,
Tiel
15 1968 1988 1973 7.4 5.5 -1.9 -6.7 0.7 7.40
Colemborg
(control)
15 14.1 4.8
-9.3
Outcome: DMFS_studies with a negative control +Seppa et
al., 1998
Finland,
Kuopio
6 1992 1995 1992 0.06 0.07 0.01 0.03 -0.04 -0.07
9 0.88 0.69 -0.19 0.18 -0.01 -0.19
12 1.88 1.62 -0.26 -1.11 -0.01 1.10
15 4.00 3.19 -0.81 -1.62 -0.72 0.90
Jyvaskyla
(control)
6 0.03 0.11 0.08
9 0.70 0.70 0
12 2.99 1.63 -1.36
15 5.62 3.91 -1.71 +Kalsbeek
et al., 1993
Netherland,
Tiel
15 1968 1988 1973 10.8 9.6 -1.2 -16.9 1.9 18.80
Colemborg
(control)
15 27.7 7.7
-20.0
+Studies that were included in meta-analysis. #Mean caries change= (PostCessation - PreCessation). A positive difference shows caries increased after cessation. A negative difference shows that caries decreased
after cessation.
Mean difference (pre)=PreCessationIntervention - PreCessationControl.. Mean difference (post) =PostCessationIntervention - PostCessationControl ^Difference of the difference (measure of effect)= (PostCessationI - PostCessationC)- (PreCessationI - PreCessationC). A positive difference shows a beneficial effect of
water fluoridation (the mean caries difference between fluoridated and non-fluoridated areas was narrower after fluoridation cessation). A negative difference shows a
non-beneficial effect of water fluoridation (the mean caries difference between fluoridated and non-fluoridated areas was greater after fluoridation cessation).
Page 98
80
With regards to change in caries experience (dmft) of primary teeth, an older study
reported by DHSS (1969) shows a narrower mean caries difference between fluoridated
and non-fluoridated areas after fluoridation cessation (Table 2.11). This result favours
the benefit of water fluoridation. A study by Atwood and Blinkhorn (1989) showed caries
in primary teeth decreased after fluoridation cessation in both areas. However the
magnitude of caries reduction was greater after fluoridation stopped, this implies the non-
beneficial of water fluoridation.
In terms of caries change at surface level (dmfs) in the primary dentition, the measure of
effect is between -0.03 to -0.66. Results were from just one study (Seppa et al., 2000a)
in different age groups showed that dmfs decreased after fluoridation cessation in both
areas. Findings indicate that stopping fluoridation has resulted in a narrowing of the
difference in caries prevalence between fluoridated and control areas. This implies the
beneficial effects of water fluoridation (Table 2.11).
Page 99
81
Table 2.11 Summary of studies with a negative control group on caries outcome (primary dentition) when fluoridation was discontinued
Authors Country/
Area
Age Pre-
survey
Post-
survey
Year
change
in F
level
Mean
caries
(pre)
A
Mean
caries
(post)
B
Mean
caries
change#
(B-A)
Mean
difference
(pre)
C
Mean
difference
(post)
D
Difference
of the
difference^
(D-C)
Outcome: dmft_studies with a negative control aDHSS, 1969 Scotland,
Kilmarnock
5 1961 1968 1962 3.99 6.89 2.9 -1.82 0.91 2.73
Ayr (control) 5 5.81 5.98 0.17 bAtwood and
Blinkhorn,
1989
UK,
Stranrear
5 1980 1986 1983 2.48 1.17
-1.31
-1.9
-2.65 -0.75
Annan
(control)
5 4.38 3.82
-0.56
Outcome: dmfs_study with a negative control bSeppa et al.,
2000a
Finland,
Kuopio
3 1992 1995 1992 0.47 0.39 -0.08 0.14 0.11 -0.03
6 2.26 1.90 -0.36 0.94 0.64 -0.30
9 4.90 3.55 -1.35 1.99 1.33 -0.66
Jyvaskyla
(control)
3 0.33 0.28 -0.05
6 1.32 1.26 -0.06
9 2.91 2.22 -0.69 aNote included in meta-analysis (missing data on sample, size, s.e/s.d). bOnly one study available with complete data for the outcome measure of interest, not included in meta-analysis. #Mean caries change= (PostCessation - PreCessation). A positive difference shows that caries increased after cessation. A negative difference shows that caries
decreased after cessation.
Mean difference (pre)=PreCessationIntervention - PreCessationControl.
Mean difference (post) =PostCessationIntervention - PostCessationControl ^Difference of the difference (measure of effect)= (PostCessationI - PostCessationC)- (PreCessationI - PreCessationC). A positive difference shows a beneficial effect of
water fluoridation (the mean caries difference between fluoridated and non-fluoridated areas was narrower after fluoridation cessation). A negative difference shows a
counterintuitive effect of water fluoridation (the mean caries difference between fluoridated and non-fluoridated areas was greater after fluoridation cessation).
Page 100
82
Table 2.12 shows the change in the percentage of caries-free for permanent teeth for the single study with a negative control. The proportion
of children who were caries free reduced after water fluoridation stopped. In contrast, the proportion of those caries-free increased in the
control group. Accounting for the change between intervention and control groups at baseline and follow up, the results show only a one
percentage point difference in the proportion of children who were caries-free.
Table 2.12 Summary of studies with a negative control group on percentage caries-free (permanent dentition) when fluoridation was
discontinued
Authors Country/
Area
Age Pre-
survey
Post-
survey
Year
change
in F
level
%
caries
free
(pre)
A
%
caries
free
(post)
B
%
difference#
(B-A)
%
difference
(pre)
%
difference
(post)
Outcome: % caries free (permanent)_studies with a negative control +Seppa
et al.,
2000b
Finland,
Kuopio
12 1992 1995 1992 44 34 -10 15 -14
15 27 25 -2 17 -16
Jyvaskyla
(control)
12 29 48 19
15 10 41 31 #Percentage (%) difference= (PostCessation - PreCessation). A positive difference shows that the % caries free increased after cessation
(does not favours fluoridation). A negative difference shows that % caries free decreased after cessation (favours fluoridation).
Percentage (%) difference (pre)=PreCessationIntervention - PreCessationControl.
Percentage (%) difference (post) =PostCessationIntervention - PostCessationControl
Page 101
83
In terms of the change in the percentage of caries free in the primary dentition, an older
study (DHSS, 1969) showed a decreased in the proportion of children who were caries-
free in area where fluoridation had stopped (Table 2.13).
No difference in the percentage caries-free in the control area was observed. The more
recent study (Seppa et al., 2000b) showed an increased in the proportion of children who
were caries-free in both areas after fluoridation stopped except for children aged 9 years
old. The magnitude of the percentage difference was larger pre-cessation than the post-
cessation which implies a beneficial effect of water fluoridation.
Page 102
84
Table 2.13 Summary of studies with a negative control group on percentage caries-free (primary dentition) when fluoridation was discontinued
#Percentage (%) difference= (PostCessation - PreCessation). A positive difference shows that the % caries free increased after fluoridation cessation
(does not favours fluoridation). A negative difference shows that % caries free decreased after cessation (favours fluoridation)
Percentage (%) difference (pre)=PreCessationIntervention - PreCessationControl.
Percentage (%) difference (post) =PostCessationIntervention - PostCessationControl
Authors Country/
Area
Age Pre-
survey
Post-
survey
Year
change
in F
level
%
caries
free
(pre)
A
%
caries
free
(post)
B
%
difference#
(B-A)
%
difference
(pre)
%
difference
(post)
Outcome: % caries free (primary)_studies with a negative control +Seppa
et al.,
2000b
Finland,
Kuopio
3 1992 1995 1992 85 98 13 -7 4
6 44 67 23 -24 -2
9 21 35 14 -24 -5
Jyvaskyla
(control)
3 92 94 2
6 68 69 1
9 45 40 -5
DHSS,
1969
Kilmarnock,
Scotland
5 1961 1968 1962 20 7 -13 13 0
Ayr
(control)
5 7 7 0
Page 103
85
Studies with a positive control group
There were two studies which included a positive control (i.e. a similar geographic area
in which fluoridation continued). Both studies were conducted in Canada, amongst
populations with a generally low caries experience, living in urban areas that had good
access to dental services. The recent study (McLaren et al., 2016) was conducted
following cessation in 2011. For permanent teeth, results show that there was a trend
towards a decrease in DMFS in the fluoridation cessation group, which was not apparent
in the control group (still fluoridated).
Findings from the McLaren et al. (2016) study were in contrast with another Canadian
study (Maupome et al., 2001a), that did not observe an adverse trend in tooth decay in
the cessation community, when fluoridation stopped in 1992 (Table 2.14). The Maupome
study used the D1D2MFS index and reported a reduction in mean D1D2MFS score in
the cessation community but no change was observed in the control (still fluoridated)
community. In addition, this study also contained a prospective longitudinal
investigation for recording dental caries by assessing transition in smooth and pit and
fissure caries. Children were classified into three groups depending on the change in
extent of their tooth surface caries: progressed, reversed and unchanged between baseline
and follow-up. Among these children, the authors observed that caries progression,
especially on smooth surfaces, was more frequent in the cessation community compared
to the comparison community. Because Maupome and co-workers used a different
approach to recording caries, this study could not be included in a meta-analysis
(Maupome et al., 2001a).
Page 104
86
Table 2.14 Summary of studies with a positive control group on caries outcome (permanent dentition) when fluoridation was discontinued
Authors Country/
Area
Age Pre-
survey
Post-
survey
Year
change
in F
level
Mean
caries
(pre)
A
Mean
caries
(post)
B
Mean
caries
change#
(B-A)
Mean
difference
(pre)
C
Mean
difference
(post)
D
Difference
of the
difference^
(D-C)
Outcome: DMFS_study with positive control
McLaren et
al., 2016
Calgary Grade 2 2004/05 2013/14 2011 0.45 0.15 -0.30 0.2 0.06 -0.26
Edmonton
(control)
Grade 2 0.25 0.21
-0.04
Outcome: D1D2MFS_study with positive
control
Maupome
et al.,
2001a
Canada,
Comox/
Courtney
8 93/94 96/97 1992 1.29 0.63 -0.66 0.92 0.33 -0.59
14 4.93 3.86
-1.07
2.66
1.45 -1.21
Canada,
Kamloops
(control)
8 0.37 0.30 -0.07
14 2.27 2.41
-0.14
#Mean caries change= (PostCessation - PreCessation). A positive difference shows that caries increased after cessation. A negative difference shows
that caries decreased after cessation.
Mean difference (pre)=PreCessationIntervention - PreCessationControl.
Mean difference (post) =PostCessationIntervention - PostCessationControl ^Difference of the difference (measure of effect)= (PostCessationI - PostCessationC)- (PreCessationI - PreCessationC). A positive difference shows a
beneficial effect of water fluoridation (the mean caries difference between fluoridated and non-fluoridated areas was narrower after fluoridation
cessation). A negative difference shows a counterintuitive effect of water fluoridation (the mean caries difference between fluoridated and non-
fluoridated areas was greater after fluoridation cessation).
Page 105
87
In terms of caries experience in the primary dentition, results from McLaren et al. (2016) study show there was an increased caries experience
(dmfs) in both geographic areas, but the magnitude of the increase was greater in the area where fluoridation ceased (Table 2.15). This
implies the beneficial effects of water fluoridation.
Table 2.15. Study with a positive control group on caries outcome (primary dentition) when fluoridation was discontinued
Authors Country/
Area
Age Pre-
survey
Post-
survey
Year
change
in F
level
Mean
caries
(pre)
A
Mean
caries
(post)
B
Mean
caries
change#
(B-A)
Mean
difference
(pre)
D
Mean
difference
(post)
E
Difference
of the
difference^
(D-E)
Outcome: dmfs_study with positive control
McLaren
et al.,
2016
Calgary,
Canada
Grade
2 2004/05 2013/14 2011 2.6 6.4
3.8
-1.9
-0.2 1.7
Edmonton
(control)
Grade
2 4.5 6.6
2.1
#Mean caries change= (PostCessation - PreCessation). A positive difference shows that caries increased after cessation. A negative difference shows
that caries decreased after cessation.
Mean difference (pre)=PreCessationIntervention - PreCessationControl.
Mean difference (post) =PostCessationIntervention - PostCessationControl ^Difference of the difference (measure of effect)= (PostCessationI - PostCessationC)- (PreCessationI - PreCessationC). A positive difference shows a
beneficial effect of water fluoridation (the mean caries difference between fluoridated and non-fluoridated areas was narrower after fluoridation
cessation). A negative difference shows a counterintuitive effect of water fluoridation (the mean caries difference between fluoridated and non-
fluoridated areas was greater after fluoridation cessation).
Page 106
88
2.6.7 The impact of reducing fluoride content of the water supply on
caries prevalence
The studies described in Section 2.6.6.1 have reported the effect of stopping fluoridation
on caries prevalence. This present section reports on the impact of reduction in fluoride
level on caries prevalence.
There was only one study which looked at the effect of reducing fluoride level in the
water supply on caries (Kunzel, 1980). The study was conducted in Karl-Marx-Standt,
Germany where a temporary reduction in the fluoride level occurred on two separate
occasions, in 1970 (1 to 0.5 ppm) and in 1971 (0.5 to 0.2 ppm). These reductions
occurred due to technical reasons (unintended interruption). In the present review, the
0.2 ppm was considered as sub-optimal fluoridation, because this was an unintentional
interruption rather than total cessation. After the interruption, the fluoride concentration
was increased again from 1972 to 1977 and the level of concentration ranged between
0.4 to 0.9 ppm.
This study reported serial surveys of caries experience among children aged 6-15 years
(permanent dentition) and 3-8 years (primary dentition) from 1959 to 1977. This has
produced a large amount of variable data. Therefore, to enable meaningful comparison
with other studies, data were extracted only from children aged 5, 8, 12 and 15 years.
Detail of fluoride concentration in the water for each survey was reported with
appropriate reference.
For permanent teeth, caries prevalence continued to decrease following reduction of
fluoride level in the water supply (Table 2.16). The magnitude of the decrease was greater
when the first reduction occurred (1 to 0.5 ppm). However results should be treated with
Page 107
89
caution as data for pre-reduction survey were only available from 1961 (two years after
water fluoridation implemented).
A similar pattern was observed in the primary teeth (dft), that caries prevalence continue
to reduce following a reduction of fluoride level in the water supply.
However, results should be treated with caution because of a lack of blind outcome
measurement and absence of a comparison community.
Table 2.16 Summary of mean caries data (permanent and primary)
dentition when fluoride level was reduced
Age Year of survey and fluoride levels
1961
1.0 ppm
1970
0.5 ppm
1971
0.2 ppm
Mean DMFT (permanent)
8 1.7 0.4 0.2
12 4.5 1.7 1.7
15 7.1 3.6 3.1
Mean dft (primary)
5 3.9 1.3 0.9
6 4.0 1.9 1.6
Page 108
90
2.6.8 A meta-analysis to examine the relationship between change in
fluoride level and caries
In order to summate the findings for the individual studies identified by this review, it
was thought appropriate to undertake a meta-analysis.
It was not appropriate to combine the three types of study design (no control, negative
control, positive control) into one meta-analysis. Quantitative analysis using meta-
analysis on caries outcome focused on studies with a control group (positive or negative
control). However, as explained in Section 2.6.6.1 only one study with a positive control
and using the DMFT index reported on caries as an outcome. It was not therefore
possible to undertake a meta-analysis for this study type. Only studies with a negative
control were identified in sufficient number to permit the conduct of a meta-analysis.
Three publications with a negative control presented data on DMFT or/and DMFS and
the data were included in the meta-analysis. Details of the included studies are
summarized in Table 2.10 as described earlier in section 2.6.6.1.
Figure 2.2 shows that stopping fluoridation resulted in a narrowing of the difference in
caries prevalence between fluoridated and control areas. This indicates a beneficial effect
of water fluoridation. A statistically significant difference was found in one study. The
range of measures of effect on DMFT score was 0.15 to 0.79. However, the measure of
study variance (heterogeneity) was large and statistically significant (p<0.001), therefore
the results should be interpreted with caution.
Page 109
91
Figure 2.2 Meta-analysis for caries outcome (DMFT)
NOTE: Weights are from random effects analysis
Overall (I-squared = 94.1%, p = 0.000)
Atwood (1989)
Kalsbeek (1993)
Study
1980
1968
Baseline
10 years
15 years
Age
0.48 (-0.14, 1.10)
0.15 (-0.09, 0.40)
0.79 (0.61, 0.96)
SMD (95% CI)
100.00
49.04
50.96
%
Weight
0.48 (-0.14, 1.10)
0.15 (-0.09, 0.40)
0.79 (0.61, 0.96)
SMD (95% CI)
100.00
49.04
50.96
%
Weight
0-.5 0 .5 1 1.5
Standardised Mean Difference
DMFT
Page 110
92
For DMFS outcome, three of five analyses showed a statistically significant difference
that favoured fluoridation (Figure 2.3). The two analyses that did not find a statistically
significant effect were from the same study in different age groups (Seppa et al. 1998).
The range in measures of effect for DMFS score was -0.99 to 1.85.
However, the results should be treated with caution because the study variance
(heterogeneity) was large and statistically significant (p<0.001).
Figure 2.3 Meta-analysis for caries outcome (DMFS)
NOTE: Weights are from random effects analysis
Overall (I-squared = 98.4%, p = 0.000)
Seppa (1998)
Seppa (1998)
Kalsbeek (1993)
Seppa (1998)
Seppa (1998)
Study
1992
1992
1968
1992
1992
Baseline
6 years
9 years
15 years
12 years
15 years
Age
0.42 (-0.55, 1.38)
-0.99 (-1.29, -0.68)
-0.69 (-0.97, -0.40)
0.90 (0.72, 1.08)
1.85 (1.51, 2.18)
1.01 (0.69, 1.33)
SMD (95% CI)
100.00
19.96
%
20.01
20.23
19.88
19.93
Weight
0.42 (-0.55, 1.38)
-0.99 (-1.29, -0.68)
-0.69 (-0.97, -0.40)
0.90 (0.72, 1.08)
1.85 (1.51, 2.18)
1.01 (0.69, 1.33)
SMD (95% CI)
100.00
19.96
%
20.01
20.23
19.88
19.93
Weight
0-1 -.5 0 .5 1 1.5 2
Standardised Mean Difference
DMFS
Page 111
93
2.6.9 Studies reporting the impact on change in fluoridation status on
the prevalence of fluorosis
The following sections report on the impact of changed fluoride levels in the public water
supply on the prevalence of fluorosis. There were no studies which included either a
negative or positive control group. The studies encountered either measured fluorosis pre
and post change on fluoride level, or were studies which compared different age groups
exposed to different levels of fluoride.
Seven publications met the inclusion criteria for fluorosis outcome. Two publications
reported on cessation and seven publications were from areas where the level of fluoride
in the water supply had been reduction. Of these, six publications were included in the
meta-analysis.
Stopping fluoridation and the prevalence of dental fluorosis
Two publications, reported data on cessation of water fluoridation on fluorosis (Wei and
Wei, 2002, Clark et al., 2006). These studies were cross-sectional in nature with historical
controls conducted in China and Canada. Both studies reported a decrease in fluorosis
prevalence following the cessation of water fluoridation. The results are summarised in
Table 2.17.
Page 112
94
Table 2.17 Summary of studies after stopping fluoride level in the water on dental fluorosis
Authors Country/
Area
Age Pre-
survey
Post-
survey
Year
change
in F
level
%
prevalence
(pre)
%
prevalence
(post)
Index
Wei and
Wei,
2002
Gongzhou,
China
15 1982 1990 1983 85.3 21.0 Deans
Clark et
al., 2006
Comox/Court
ney &
Campbell
River, British
Columbia,
Canada
6-9 93/94 2002/03 1992 58.6 24.4 TF
Page 113
95
The study in Canada used the TF index and reported the presence of fluorosis on (a) all
teeth and (b) maxillary anterior teeth alone. For both of these outcome measures,
fluorosis prevalence decreased following the cessation of water fluoridation. When all
teeth are included the reported decrease was greater than when considering only the
anterior teeth.
The Chinese study reported on fluorosis prevalence using Dean’s Index. Results
demonstrated a decrease in fluorosis prevalence following the cessation of water
fluoridation (85.3% to 21.0%). However, these findings should be interpreted with
caution because while the number of affected individuals was described by the separate
categories in Dean’s Index in the pre-cessation survey, for the post-cessation survey,
results were not broken down by level of severity. It is therefore unclear if the fluorosis
prevalence reported post-cessation included the questionable category.
The impact of reducing fluoride level on the prevalence of fluorosis
Five publications which were scored by the author as of low quality, reported data on the
effect of reducing the fluoride level in the water on fluorosis. None of these studies had
a control group. Four publications used Dean’s index and one study used the DDE index
to report fluorosis prevalence. Three publications reported on studies conducted in Hong
Kong and another two publications related to the United States. The Hong Kong studies
were conducted post-1975, and assessed minor reductions in fluoride level (range from
0.15 to 0.27 ppm). The US studies were conducted pre-1975 and assessed much wider
reductions in the level of fluoride as they related to naturally fluoridated communities
(range from 5 to 7 ppm). The type of teeth examined for fluorosis varied across studies.
Two publications reported prevalence on the upper right central incisor (Evans 1989,
Page 114
96
Evans and Stamm, 1991b), one publication on maxillary incisors (Wong et al., 2014) and
two publications on all permanent teeth (Horowitz and Heifetz 1972, Horowitz et al.,
1972). A recent study examined fluorosis with photographs for blind outcome
assessment (Wong et al. 2014). The earlier studies were solely based on clinical
examination, which lacks blinding of outcome assessment (Evans 1989, Evans and
Stamm, 1991b, Horowitz and Heifetz, 1972, Horowitz et al., 1972). The results are
summarised in Table 2.18.
Findings indicated that as fluoride levels decrease, so does the prevalence of fluorosis.
The decreased was greater for studies with major a reduction in fluoride level (5 to 7
ppm).
Page 115
97
Table 2.18 Summary of studies after reducing fluoride level in the water on dental fluorosis
Authors Country/
Area
Age Pre-
survey
Post-
survey
Year
change
in F
level
%
prevalence
(pre)
%
prevalence
(post)
Index
Horowitz
and
Heifetz,
1972
Bartlett
Texas, USA
8-11 1954 1969 1952 97.7 51.0 Deans
Horowitz
et
al.,1972
Britton, USA 8 1948 1970 1954 100 79.2 Deans
++Evans
and
Stamm,
1991b
Hong Kong 7-12 n/a 1986 1978 88.0 77.0 Deans
Wong et
al., 2014
Hong Kong 12 1983 2010 1988 89.3 42.1 DDE
++Study that compared different age groups exposed to different levels of fluoride during development of enamel.
Page 116
98
Two publications of the Hong Kong studies (Evans, 1989, Evans and Stamm, 1991b)
were linked papers whereby the first publication reported prevalence of fluorosis among
four districts and the later publication reported overall fluorosis data of the studied
sample. To avoid data duplication, only overall fluorosis data were used in the analysis.
These studies were a single point study that compared children in different age groups
that were exposed to different fluoride levels, where change in fluoride level occurred
during the period of enamel development. The baseline prevalence data were extracted
from the groups that were exposed to the old fluoride concentration and the ‘after’
prevalence data were extracted from the group that were exposed to the new fluoride
level after reduction occurred.
2.6.10 A meta-analysis to examine the relationship between change
fluoride level and fluorosis
A meta-analysis was performed to summate the findings for the individual fluorosis
studies identified in this review.
The meta-analysis for fluorosis outcome is presented into three analyses on one forest
plot (Figure 2.4). The first analysis combined individual studies on the effect of reducing
fluoride level and fluorosis. The second analysis combined individual studies on the
effect of stopping fluoridation and fluorosis. The third analysis combined studies from
both interventions (stopping or reducing) fluoride level for pooled estimates of effects
across time points. Details of included studies are summarised in Tables 2.17 to 2.18 as
described earlier in Sections 2.6.9.1 to 2.6.9.2 Effort has been made to avoid data
duplication in the meta-analysis. For example, in the study by Clark et al. (2006) that
provided data for anterior teeth only and for all teeth, only fluorosis prevalence for all
teeth was included. In addition, for publications that refer to the same intervention
Page 117
99
(Evans, 1989, Evans and Stamm, 1991b), only one study with overall fluorosis
prevalence was included (Evans and Stamm, 1991b). In total, six publications were
suitable for inclusion in the meta-analysis.
Figure 2.4 shows that fluorosis prevalence decreased following reduction of fluoride
levels in the water. The decrease was greater for studies with a major reduction of
fluoride level (5 to 7 ppm) with odds ratio range between 37.94 to 41.39. However results
should be treated with caution because heterogeneity is high and statistically significant
(p<0.0001). Also there was lack of examiner blinding and small sample sizes.
Figure 2.4 Meta-analysis for fluorosis outcome
NOTE: Weights are from random effects analysis
.
.
Overall (I-squared = 95.3%, p = 0.000)
Study
Clark (2006)
Wong (2014)
Fluoride Cessation
Subtotal (I-squared = 96.8%, p = 0.000)
Subtotal (I-squared = 90.5%, p = 0.001)
Evans (1991)
Wei (2002)
Horowitz (1972)
Fluoride Reduction
Horowitz (1972)
Measure
TFI
DDE
Deans
Deans
Deans
Deans
Age
6.2 to 9 years
12 years
7-12 years
15 years
8 years
8-11 years
Baseline
1993/94
1983
1982
1948
1954
10.01 (4.00, 25.05)
OR (95% CI)
4.32 (2.83, 6.59)
11.48 (8.63, 15.25)
11.11 (2.91, 42.33)
9.27 (1.89, 45.43)
2.20 (1.74, 2.78)
21.93 (9.05, 53.13)
37.94 (2.29, 629.05)
41.39 (12.63, 135.59)
100.00
%
Weight
19.76
20.22
62.94
37.06
20.35
17.30
7.03
15.33
10.01 (4.00, 25.05)
OR (95% CI)
4.32 (2.83, 6.59)
11.48 (8.63, 15.25)
11.11 (2.91, 42.33)
9.27 (1.89, 45.43)
2.20 (1.74, 2.78)
21.93 (9.05, 53.13)
37.94 (2.29, 629.05)
41.39 (12.63, 135.59)
100.00
%
Weight
19.76
20.22
62.94
37.06
20.35
17.30
7.03
15.33
1.25 .5 1 2 4 8 16 32 64 128 256 512
Odds Ratio
All Fluorosis Measures
Page 118
100
Similarly, fluorosis prevalence was significantly decreased after water fluoridation
cessation in both studies. The decrease was greater in the Chinese study (OR: 21.93) in
comparison to the Canadian study (OR: 4.32).
When all studies were combined, the pooled estimate of effect indicated a statistically
significant difference of fluorosis reduction (OR: 10.01, 95%CI: 4.00-25.05). However,
as already discussed, these results should be treated with caution because of high
heterogeneity, lack of blinding and small sample size.
Discussion
This section highlights the key findings of the review, strengths and limitations and
research implications. Whether the findings are in agreement or disagreement with other
published work are also discussed. How the findings from this review link with the main
study and overall implications of the PhD project are discussed in Chapter 6.
2.7.1 Quality of evidence
All available reviews acknowledge that a randomised controlled trial is not feasible as a
study design in evaluating the effectiveness of water fluoridation. This explains the
complexity of assessing such an intervention and why the majority of water fluoridation
studies were mostly cross sectional in nature. Taking into consideration the
methodological limitations in assessing fluoridation, this review also includes additional
studies with no concurrent control group. The aim was to appraise the available literature
with a wider range of study designs.
This study adapted criteria used in the York Review (NHS Centre for Reviews and
Dissemination, 1996) with some modification for study validity assessment. Similar to
Page 119
101
York, some of the included cross sectional studies were ‘upgraded’ as moderate quality
(moderate risk of bias) when they had concurrent control group, blinding of outcome
assessment, and address and control confounding factors in the analysis. Taking these
factors into account, sixteen studies were rated as low quality and six studies are
moderate quality. McLaren and Singhal (2016) reported more studies with moderate
quality of evidence in their water fluoridation cessation review when they used the
Cochrane Collaboration’s tool with some modification to assess risk bias.
In contrast, the Cochrane review introduced a new inclusion criteria requirement when
assessing water fluoridation cessation, namely, studies with a positive reference (control
group remained fluoridated) (Iheozor‐Ejiofor et al., 2015). Unlike the York Review, the
Cochrane work disregarded studies with a negative control (non-fluoridated as control),
which led to only one study available for data synthesis. This strict criteria in assessing
water fluoridation cessation has been challenged by a group of researchers with the basis
of complexity of evaluating population based public health interventions and difficulty
in having a community with a positive reference population (Rugg-Gunn et al., 2016).
These additional study designs have also been agreed as relevant by a recent publication
which sets out recommendations for designing a community fluoridation cessation study
(Singhal et al., 2017).
2.7.2 Agreements and disagreements with other reviews and published work
The York review concluded that caries increased following the cessation of water
fluoridation. Results from our meta-analysis (that only include studies with a negative
control) confirm this finding. However from a qualitative analysis, results were rather
mixed. Studies that were published before the 1990s (four studies) indicate an increased
caries prevalence following cessation (Jordan, 1962, DHSS, 1969, Lemke et al., 1970,
Page 120
102
Stephen et al., 1987). The majority of studies published from the 1990s onwards (nine
studies) indicate a decrease in caries prevalence (Kalsbeek et al., 1993, Kunzel and
Fischer, 1997, Maupome et al., 2001a, Kunzel and Fischer, 2000, Kunzel et al., 2000,
Seppa et al., 2000a, Seppa et al., 2000b, Wei and Wei, 2002). Factors reported to explain
this were attributed to the availability of fluoridated toothpaste and other caries
preventive programmes (such as fluoride varnish, fissure sealants) post-cessation.
Another three studies reported mixed results for different age groups in primary and
permanent dentitions. (Attwood and Blinkhorn, 1989, Seppa et al., 1998, McLaren et al.,
2016). Cessation on dental caries support findings in a recent review by McLaren and
Singhal (2016), that also reported on the mixed results of the effect of stopping water
fluoridation on subsequent caries prevalence.
There is insufficient evidence to determine the effect of lowering fluoride level in the
water supply on dental caries. Only one study with low methodological quality was
included in this review. Data from this study indicate caries in permanent and primary
teeth continue to decrease following reduction of fluoride level in the water supply. This
study rated as at a high risk of bias, reported a series of data in Karl-Marx-Standt,
Germany from 1959 to 1977 (Kunzel, 1980). There was no blinding assessment and data
did not address or control for confounding factors. The reduction occurred twice, in 1970
(1 to 0.5 ppm) and in 1971 (0.5 to 0.2 ppm) due to technical reasons. Some may argue
the inclusion of this study under reduction of fluoride level as opposed to cessation.
Change of the fluoride level was unintentional and not due to change in fluoridation
policy. After the interruption the level was increased again from 1972 to 1977 when the
level of fluoride in the public water supply ranged between 0.4 to 0.9 ppm. In additional,
there was no intention of stopping water fluoridation at the time the study was conducted.
Page 121
103
A series of epidemiological studies from Hong Kong have reported on the prevalence of
fluorosis after reduction of fluoride level in the water supply. However only very limited
data from Hong Kong have considered the impact of changing fluoride levels on caries.
A work published in 2014, cited unpublished data from the Hong Kong Department of
Health that reported no concurrent increase in caries following a change in fluoride
concentration in the water supply (Wong et al., 2014). The exact figure of caries
reduction cannot be extracted because data were presented using a graph.
Spencer and Do (2016) have argued that the traditional method of assessing the
effectiveness of a lower level of fluoride in the water on dental caries has limitations.
These authors questioned what the caries levels would have been if the concentration
remained at the one of the higher levels (i.e. a concurrent control). This argument reflects
similar requirement (concurrent positive control) addressed by Cochrane when assessing
fluoridation cessation. However, the possibility of having a comparable positive
reference community is very challenging if not unfeasible. This is because changes to
fluoridation level are affected by regional and national policy (Rugg-Gunn et al., 2016).
This means that a change in one area is likely to result in a change in all neighbouring
areas, such as when changes have occurred in Hong Kong and Singapore where there is
100% water fluoridation coverage (Petersen et al., 2012).
There are more studies that have reported on the impact of change in the fluoride level
in the water supply on dental fluorosis. This could be due the different role that fluoride
plays in the development of caries and fluorosis, and the time scale involved. Fluorosis
occurs due to excessive exposure to fluoride during tooth development and the risk
period is between birth to three years of life. The use of multiple birth cohorts exposed
Page 122
104
to different fluoride level during tooth development means that less time and effort is
required to study fluorosis than caries, when a number of years have to pass, post the
change in fluoride level(s) for the impact on caries to become clinically evident. Taking
into account the value of birth cohort studies, it was deemed relevant to include this study
design in the review. However, these cross-sectional birth cohort studies were rated as
lower quality in comparison to caries studies that fulfilled the ‘at least two point in time’
requirement.
This design (i.e. birth cohort) was also used in several studies that assessed short term
unintended cessation of water fluoridation on fluorosis where the interruption of the
fluoride provision usually occurred due to technical issues (Burt et al., 2000, Burt et al.,
2003). These studies were identified during data searching but excluded from this review
as not meeting the inclusion criteria (Section 2.6.3). The trend of reducing the optimal
fluoride level in other countries occurred in early 2000s except for Hong Kong and
Singapore. Therefore an appropriate time frame is needed in order to evaluate the impact
of such intervention on dental caries prevalence. The effect of fluoride in caries
prevention is mainly post-eruptive and systemic effect of fluoride during tooth
development for caries prevention is questionable (Featherstone, 2000). This may
explain that full effect of changing the level of fluoride in the water will take longer to
become evidence on the case of dental caries compared with the development of
fluorosis.
Another important factor is the time between baseline and follow-up survey. The
variation in survey time points may affect the estimation of effect size. In addition, an
Page 123
105
equally important factor is the time lapse between change in fluoride level and
subsequent clinical examination with regards to age, the type of teeth examined and stage
of dental development. Changes of water fluoridation status may affect the primary and
permanent dentitions differently. For example, Attwood and Blinkhorn (1989) reported
caries decreased in permanent teeth but increased in primary teeth after cessation. As for
fluorosis evidence suggests that childhood fluorosis can diminish over time (Do et al.,
2016). This may be due to potential effect by external factors after eruption such as wear
or erosion that may reduce the appearance of fluorosis by adolescence (Do et al., 2016).
In terms of the meta-analysis for fluorosis studies, the results obtained in this work
(Section 2.6.10) indicate a decrease in the prevalence of fluorosis after reducing or
stopping fluoridation. A pooled estimate effect indicated a statistically significant
difference in fluorosis reduction (OR: 10.01, 95% CI: 4.00- 25.05). This is as expected,
the dose-response relationship in terms of fluoride level and fluorosis has been
established for decades (Dean, 1938, Dean, 1942) and confirmed by the York Report
(McDonagh et al., 2000) and the Cochrane review (Iheozor‐Ejiofor et al., 2015).
However these results should be treated with caution because of significant heterogeneity
across studies, lack of examiner blinding, small sample sizes and different indices used
to measure fluorosis. The results are mainly derived from low quality primary studies in
which none of the fluorosis studies had concurrent control group. Only newer studies
tend to control for confounders (Clark et al., 2006) and used blind photographic
assessment to score fluorosis (Wong et al., 2014).
Page 124
106
2.7.3 Implications for future research and recommendations
Study design and confounders
Of all the included studies, ten studies (Evans and Stamm, 1991b, Kalsbeek et al., 1993,
Kunzel and Fischer, 1997, Seppa et al., 1998, Seppa et al., 2000a, Seppa et al., 2000b,
Maupome et al., 2001a, Clark et al., 2006, Wong et al., 2014, McLaren et al., 2016)
mentioned potential confounding factors, only four studies (Seppa et al., 2000a,
Maupome et al., 2001a, Clark et al., 2006, McLaren et al., 2016) used analysis to control
for them. Future research should consider appropriate study design and better handling
of confounders. If possible, a longitudinal study design is the ideal method to assess the
effects of change of fluoride level in the water supply. If resources are limited, a study
design with concurrent controls (positive or negative control) is desirable. If this design
is not possible, a repeated cross sectional survey is preferable than a single point survey
(Singhal et al., 2017).
Confounding factors such as exposure to other sources of fluoride (e.g. fluoridated
toothpaste) diet (e.g sugar consumption) and social economic status should be measured
and adjusted in the analysis.
Other possible confounders of particular relevance to fluorosis are temperature and
altitude. People living in climates with a higher mean temperature drink more water, thus
may be exposed to more total fluoride. Higher altitude has also been reported to be
associated with the development of fluorosis, however the mechanism for this is unclear.
Future studies should consider this factor. More research is also needed to measure
Page 125
107
consumption of tap water within a population and how it is associated with fluorosis
development.
Outcome assessment
All of the included studies reported outcomes in child populations only. In caries related
studies ages ranged form 3 to 6 years in the primary dentition and 6 to 15 years in the
permanent dentition. All fluorosis studies measured permanent teeth with ages ranging
from 6 to 12 years. Evaluation amongst older age groups is recommended in future
research.
In terms of outcome measurement, the DMF Index and its variation (tooth level or
surface level) is the most commonly used in caries assessment. One study used a
modified DMFS index (D1D2MFS), which aimed to distinguish different caries level
(Maupome et al., 2001a). Data with different severity of caries are important not only for
monitoring the disease prevalence but also helps in providing effective treatment and
prevention. A new caries index that allows identification of cavitated and non-cavitated
lesion is the International Caries Detection and Assessment System (ICDAS) (Ismail et
al., 2007). This index allows modification for epidemiology survey and data can be re-
coded to match with the traditional DMFT scoring system at the “into dentine” level,
enabling comparison across studies. Therefore, future research is recommended to look
into effect of water fluoridation on different caries severity.
In terms of fluorosis assessment, Dean’s, TF and DDE index was the most commonly
reported index reported in the primary studies. Blinding of fluorosis assessment can be
Page 126
108
achieved using standardized photographs. This method also allows archiving, remote
assessment and data comparison across different time points.
Uniform diagnostic criteria and reporting techniques for caries and fluorosis may
improve the comparability of results across studies and aid in meta-analysis. Future
research should consider this factor for high quality data.
2.7.4 Strengths and limitations
Study strengths
This is the first review that synthesizes evidence on both, stopping or reducing fluoride
level in the water supply on dental caries and fluorosis. This review includes multiple
studies with different designs for comprehensive evidence appraisal. The findings can be
useful for authorities that revisit their fluoridation policy. Gaps in knowledge have been
identified in and the methodological considerations discussed may be valuable future
research on this topic.
Study limitations
Only four major electronic databases were used. Relevant work from non-English
publications and some grey literature such as local reports may have been missed. For
example two non-English articles (Gu and Shen, 1989, Lekesova, 1998) which were not
identified in the original search and analysis were subsequently identified in work
published recently by McLaren and Singhal (2016). These papers did not report on
Page 127
109
fluorosis, only on caries which showed an increased in caries prevalence following
cessation of fluoridation.
The main limitations of the meta-analysis is the lack of data and different outcome
assessment across studies. Although several studies with concurrent control group were
identified that looked into the effect of water fluoridation cessation on dental caries, not
all can be included in the meta-analysis because of missing information (sample size,
standard deviation). This reflects lack of standard in reporting caries data. Similar issue
were encountered in relation to the meta-analysis for fluorosis. An analysis on the dose-
response relationship between fluoride in the water and fluorosis could not be undertaken
because of lack of data.
Conclusions
Twenty-two studies were included in the review. There is limited evidence with low
methodologically quality to determine the effect of stopping or reducing fluoride level in
the public water supply on dental caries and fluorosis. The majority of the studies were
of cross-sectional design and the quality of studies was assessed as low. Stopping water
fluoridation was associated with an increased caries experience for studies published up
to 1989. A decrease in caries experience post cessation / reduction was reported from
1990 onwards. There is insufficient information to determine the impact of reducing the
fluoride level in the water supply on dental caries prevalence. Stopping or reducing
fluoride levels in the water is associated with a decrease in fluorosis prevalence. Future
studies in this area are recommended with appropriate study design and better handling
of confounding factors.
Page 128
110
Chapter summary
There is limited evidence with low to moderate methodological quality to determine the
effect of reducing or stopping fluoride level in the water supply on dental caries and
fluorosis. A summary of the review key findings are as follows:
The available data indicated mixed results on stopping fluoridation and
subsequent prevalence of dental caries.
There is insufficient information to determine the impact of stopping fluoridation
on the subsequent prevalence of dental fluorosis.
There is insufficient information to determine the impact of reducing the fluoride
level in water supply on dental caries prevalence.
Five studies published on reducing the fluoride level in the water supply on
fluorosis. This is associated with a decrease in fluorosis prevalence.
In response to the gaps in knowledge highlighted in this review, the main study of this
PhD project aimed to evaluate the effect of reducing the level of fluoride in the Malaysian
water supply on caries and fluorosis. The rationale and objectives of the study are
described in Chapter 3.
Page 129
111
3 Study rationale, research questions, aims and
objectives
Introduction
This chapter describes the study rationale, research questions and the aims and
objectives of the study.
Study rationale
In Malaysia, as a public health measure to control caries, the public water supply has
been artificially fluoridated since 1972 at a concentration of 0.7ppm (Oral Health
Division Ministry of Health Malaysia, 2006). However, concern arose that a fluoride
concentration at 0.7 ppm maybe too high given increasing exposure to other sources of
fluoride, leading to an increased prevalence of dental fluorosis (Oral Health Division
Ministry of Health Malaysia, 2001, Tan et al., 2005). This prompted a downward
adjustment of fluoride concentration from 0.7 to 0.5 ppm in December 2005 (Oral Health
Division Ministry of Health Malaysia, 2006).
In addition to Malaysia, other countries have reviewed their fluoridation policy in light
of alternative means of fluoride delivery. For example the US Public Health Services
recommended lowering fluoride concentration in the public water supply from the range
of 0.7 to 1.2 ppm to a level of 0.7 ppm (Federal Panel on Community Water Fluoridation,
2015). In Europe, Ireland has lowered the fluoride concentration in the water from to 1.0
ppm to a new range 0.6 - 0.8 ppm, with a target concentration of 0.7 ppm in 2007 (Parnell
et al., 2009, Whelton and O’Mullane, 2012). In Asia, authorities in Hong Kong have
reduced the fluoride concentration in their public water supply twice, from 1 ppm to 0.7
ppm in 1978 and then a further reduction to 0.5 ppm in 1988 (Wong et al., 2014). In
Page 130
112
Southeast Asia, Singapore has taken similar action by reducing the concentration of
fluoride in drinking water twice from 0.7 to 0.6 ppm in 1992 and further to 0.5 ppm in
2008 (Petersen et al., 2012). However, despite the substantial evidence of the
effectiveness of water fluoridation, evidence relating to minor changes of fluoride
concentration of public water supply has seldom been investigated.
Based on the systematic review conducted as part of this PhD (Chapter 2), there have
only been six studies that assessed the effect of reducing fluoride level in the water on
caries (one study) (Kunzel, 1980) and fluorosis (five studies) (Horowitz and Heifetz,
1972, Horowitz et al., 1972, Evans, 1989, Evans and Stamm, 1991b, Wong et al., 2014).
The available studies indicated that reducing fluoride level is associated with a decrease
in fluorosis prevalence. The only caries study reported that caries prevalence continues
to decrease following reduction of fluoride level in the water supply in permanent and
primary dentitions (Künzel, 1980). It can be concluded that there is insufficient evidence
to determine the effect of lowering fluoride level in the water supply on dental caries. In
terms of fluorosis outcome, results mainly derived from low quality primary studies
which none of the fluorosis studies has concurrent control group. Only a newer study
tends to control for confounders (Clark et al., 2006) and used blind photographs
assessment for fluorosis score (Wong et al., 2014).
The situation in Malaysia offers a unique opportunity to evaluate the outcome of the 0.2
ppm adjustment of fluoride concentration in public water supply on both dental caries
and fluorosis. In addition, there is also a need to assess the relationship between exposure
to other fluoride sources such as infant feeding practices, oral hygiene habits and
exposure to fluoride varnish/gel with dental caries and fluorosis.
Page 131
113
Apart from generating evidence on the effectiveness of the policy initiative, information
about fluoride exposure is useful for policy makers, public health planners and health
care professionals when planning effective community-based fluoride therapy for the
prevention of dental caries, while limiting dental fluorosis. Data can also be used to
address public concerns, propose any adjustment to the policies concerning water
fluoridation, control of dental products and oral health awareness programmes. The
evidence from the study would serve as a guide for improving the monitoring system,
and justifying monetary spending and allocations of oral health prevention programmes.
Research questions
The following questions were addressed by the research undertaken:
1. What is the prevalence and severity of dental fluorosis following a 0.2 ppm
reduction of fluoride level in the public water supply?
2. What is the prevalence and severity of dental caries following a 0.2 ppm reduction
of fluoride level in the public water supply?
3. Has the policy measure to reduce the fluoride level in the water supply maintained
the preventive effect of dental caries and reduced the prevalence of fluorosis?
4. Are there any other risk factors (in particular exposure to difference sources of
fluoride) associated with dental fluorosis?
5. Are there any other risk factors (in particular exposure to difference sources of
fluoride) associated with dental caries?
Page 132
114
Aims
The aims for the clinical study were to evaluate the outcomes of the downward
adjustment of fluoride concentration in the community water supply from 0.7 ppm to 0.5
ppm
a. in relation to the prevalence of dental fluorosis
b. in relation to the prevalence of dental caries
Objectives
These aims were broken down into five specific objectives as follows:
1. To determine the prevalence and severity of dental fluorosis among 9 and 12-
year-old Malaysian children living in fluoridated and non-fluoridated areas.
2. To evaluate the prevalence and severity of dental caries among 9 and 12-year-old
Malaysian children living in fluoridated and non-fluoridated areas.
3. To explore associations between changes in fluoride level in the water supply
and dental caries and fluorosis among Malaysian children.
4. To explore risk factors associated with fluorosis, in particular water use, infant
feeding patterns and oral hygiene practices.
5. To explore risk factors associated with caries, in particular water use, infant
feeding patterns and oral hygiene practices.
Page 133
115
4 Materials and methods
This chapter describes details of the study design, sampling method, sample size
calculation, data collection procedure, study instruments and approach to data analysis.
Study design
This study had both a cross sectional and retrospective design. Two types of data were
collected:
Clinical data: on dental fluorosis (including intra-oral photographs) and dental
caries status.
Questionnaire data: retrospective fluoride history, infant feeding practice, oral
hygiene practice and current socio economic status.
Study population
A representative sample (n =1155) of 9 and 12-year-old primary school children in
Malaysia. Data were collected over a five month period from the beginning of January
2015 until the end of May 2015.
Research site
Malaysia is located in the South-East Asia region. The federation of Malaysia comprises
of the Peninsular Malaysia and the East Malaysia which are situated in two different
geographic areas. These are separated by the South China Sea. Peninsular Malaysia
consists of ten states and two Federal Territories which are Perlis, Kedah, Penang, Perak,
Negeri Sembilan, Malacca, Selangor, Johor, Pahang, Kelantan, Terengganu, Federal
Territory of Kuala Lumpur and Federal Territory of Putrajaya. The East of Malaysia
Page 134
116
consists of Sabah, Sarawak and Federal Territory of Labuan on the islands of Borneo
(Department of Survey and Mapping Malaysia, 2013).
Research in the thesis was carried out in Negeri Sembilan (non-fluoridated) and Kelantan
(fluoridated) states which are located in the Peninsular Malaysia (Figure 4.1)
(myMalaysiabooks, n.d).
Figure 4.1 Map of Malaysia
Page 135
117
Sample population, sample size and method of sample
selection
4.4.1 Sample population
The sample population was selected from two states, one fluoridated and the other non-
fluoridated. In Malaysia, more than 95% of the population receive a piped water supply,
however, only 76.7% of the population receive a fluoridated water supply (Oral Health
Division Ministry of Health Malaysia, 2011). In most of the wealthier states more than
90% of the population benefit from fluoridated water, however this public health measure
provides lower coverage in less affluent states such as in Pahang (82.5%), Sarawak
(66.4%), Terengganu (62.8%), Kelantan (14.5%) and Sabah (0.4%) (Oral Health
Division Ministry of Health Malaysia, 2011). The two states with the least fluoridation
coverage are Kelantan located in Peninsular region (West Malaysia), and Sabah, located
in the Borneo region (East Malaysia).
For logistical and financial reasons, Kelantan was selected to represent an area without
water fluoridation. Those districts in which the water was fluoridated in Kelantan state
were excluded from the study. Of the fluoridated states, Negeri Sembilan was selected
based on the following reasons; firstly, the state was the most similar to non-fluoridated
Kelantan state in term of population density and ethnic composition (Department of
Statistics Malaysia, 2016). Secondly, based on technical reports, Negeri Sembilan was
among the fluoridated sates that were reported to be very consistent in maintaining
fluoride levels as recommended by Ministry of Health, Malaysia (Oral Health Division
Ministry of Health Malaysia, 2011). Thirdly, the state is logistically feasible for the
research purposes.
Page 136
118
The Malaysian Ministry of Health has made a downward adjustment of the level of
fluoride in the community water supply from 0.7 ppm to an optimal level of 0.5 ppm on
22nd December 2005 (Oral Health Division Ministry of Health Malaysia 2006, 2011).
The policy measure would have affected Malaysian children born after its introduction
because fluorosis is a product of fluoride intake in early childhood. The outcomes were
assessed by comparing children who were likely to be affected by the policy measures
(test cohort) and children whose teeth developed before the adjustment in fluoride level
(comparison cohort). At the time of the clinical examination in this study, children born
after the policy change were 9 years of age and children born before the policy change
were 12 years of age. The 9 year-old children were born between 1st January to 31st
December 2006 and the 12 year-old children were born between 1st January to 31st
December 2003. The period between the cohorts had been chosen taking into account,
critical fluoride exposure from water fluoridation during maxillary central incisor
development, which is between 16 to 36 months of age (Evans and Stamm 1991a; Levy
et al. 2001; Hong et al. 2006b; Buzalaf and Levy 2011). In this study, the 9 year-old
children in the test cohort had been exposed to 0.5 ppm fluoridated water throughout
their life. Children in the comparison cohort have had mixed exposure to fluoridated
water during the development of their permanent teeth. The oldest children (born
1.1.2003) in this birth cohort were exposed to 0.7 ppm fluoridated water from birth until
2 years of age followed by 0.5 ppm fluoridated water from age 2 to 12. The youngest
children in this birth cohort (born 31.12.2003) were exposed to 0.7 ppm fluoridated water
from birth until 1 year of age followed by 0.5 ppm fluoridated water from age 1 to 12.
Years of fluoride exposure was calculated based on the date of birth and the
commencement of school term in January.
Page 137
119
(Refer Figure 4.2 for developmental period of central incisors and first molars).
Inclusion criteria for children in this study were as follows:
1. Children who were born between (01.01.2006 to 31.12.2006); after the policy
change to lower the level for fluoride in the public water supply from 0.7 ppm to
0.5 ppm and children who were born between (01.01.2003 to 31.12.2003); before
this policy change.
2. Lifelong residents - Born and raised within the boundary of the selected
fluoridated (Negeri Sembilan) and non-fluoridated (Kelantan) states.
3. Provision of informed written consent by the child’s parent or guardian.
4. No medical contraindication to undergoing a clinical dental examination.
5. Fully erupted permanent maxillary central incisors (at least half of the tooth
surface is visible for clinical examination).
Page 138
120
Figure 4.2 Developmental period of central incisors and first molars of children born in 2003 and 2006, and mean fluoride concentration in
Malaysian's drinking water supply
Note: The diagram is produced based on developmental period of permanent dentition (Berkowitz et al., 1992)
Page 139
121
4.4.2 Sample size estimation
The sample size was calculated to achieve the main study objectives which were to
evaluate the outcomes of the downward adjustment of fluoride level in the community
water supply from 0.7ppmF to 0.5ppmF in relation to the prevalence of dental fluorosis
and dental caries.
The subjects of the study were divided into four groups: 9 and 12 years-old children in
fluoridated and non-fluoridated area.
The sample size estimation was as follows:
Fluorosis
For the sample size calculation of this study, the prevalence of ‘mild fluorosis’ in
fluoridated and non-fluoridated communities was considered as several studies have
shown that the increase in fluorosis in areas subject to artificial water fluoridation occurs
mainly in the ‘mild’ categories (Clark, 1994, Mascarenhas, 2000). In the previous
Malaysian national survey of enamel opacities in children aged 16 years-old, the
prevalence of ‘mild fluorosis’ was reported as 17.8% in a fluoridated area and 0.4% in
the non-fluoridated areas, with a corresponding difference between the two areas of
17.4% (Oral Health Division Ministry of Health Malaysia, 2001). Based on clinical
judgment, it is important to clinically detect the percentage difference between the two
areas at 10% and at the same time avoiding a type II error (false negative) in the findings.
The estimated sample size that was required to detect a difference in the prevalence of
fluorosis among children of each group with a statistical significance level of 0.05, a
confidence interval level of 95%, a power of 90%, calculated on the prevalence of mild
fluorosis at 17.8%; results in an estimated minimum sample size of 227 per each cell in
Page 140
122
each of the two age groups in communities with fluoridated and non-fluoridated water.
The estimated total sample required for four groups was therefore 908.
Caries
According to the national survey of school children’s oral health status, caries prevalence
(DMFT) in 12 years-old in Malaysia was 39.0% (Oral Health Division Ministry of Health
Malaysia, 2010) and the mean dmft was 2.6 (S.D: 4.1). A previous international study
study has used a 25% difference as a clinically significant effect (Do, 2004). The sample
size required to detect a 25% difference in population mean decayed, missing and filled
permanent teeth with 90% power and significance level of 0.05 was calculated as a
minimum sample size of 116 per group. The estimated total sample for four groups was
therefore 464 children.
Final sample size estimation
Based on the highest sample size estimation, inflated by an additional 30% to account
for non-respondents, 15% non-consenting and 15% mobility rate yields 1453 children
required for this study [227 x 2 age groups x 2 areas + (30% non-respondents + 15% non-
consented + 15% mobility rate) =1453]. Rounded to 400 children per cell, a total of 1600
children aged 8 and 12-years-old were estimated for this study.
4.4.3 Method of sample recruitment
Sampling of the subjects was conducted according to a two-stage sampling method based
on guidance for child dental health surveys by the British Association for the Study of
Community Dentistry (Pine et al. 1997).
Page 141
123
The first stage is the selection of schools and second stage is selection of children. Two
states in Peninsular Malaysia were selected to represent fluoridated (Negeri Sembilan)
and non-fluoridated (Kelantan) areas. Overall, there were 356 primary schools (Grade
3=16,821 pupils; Grade 6=17,291 pupils) in Negeri Sembilan State Education
Department and 418 primary schools (Grade 3=29, 676 pupils; Grade 6=34,350 pupils)
in Kelantan State Education Department, of which 162 schools (Grade 3=9223 pupils;
Grade 6=10,263 pupils) were located in non-fluoridated districts; only the latter schools
which were included. Therefore the final sampling frame consisted of 518 public primary
schools. Only public schools under coverage of School Dental Services, Ministry of
Health were selected. Private and special schools were excluded from the sampling
frame.
Sampling schools
Schools lists and student enrolment data were obtained from the Ministry of Education,
Malaysia. Schools were divided according to school size (small schools <50 children
aged 9-years / large schools >50 children aged 9 years). Each school was allocated a
number and a random number generator used to select the survey schools.
Selecting schools
The proportions of the total school population of 9-year-old and 12-year-old children
attending each group of the schools were calculated (Appendix 13). The minimum
sample size was 227 per group and 330 children were selected for inclusion in the survey,
so that substitution was not required for absentees.
Assuming a minimum of 50 children examined from each school for each age group,
eight schools were required per state. In addition, three reserve schools were selected
Page 142
124
for each school size in case a school declined to participate. A proportionate sample of
schools based on the ratio of large to small schools was selected.
Sampling individuals
In terms of sampling individuals from each school, the following method was used:
For small schools, every child was selected. For large schools, systematic sampling was
used, when every second child on the class list was selected. All the class lists from a
school were collated and treated as a single list.
Small schools: every child was selected
Large schools: every second child was selected
Based on the Ministry of Education, Malaysia records, there was minimal variation in
relation to student enrolment between different age groups in the same schools, therefore
the same schools were selected for both age groups (9 year-old and 12 year-old).
Therefore a similar sampling process was used for both 9 and 12 year-old children.
Page 143
125
Conduct of study
The fieldwork involved two stages, which were pilot study and main study. A pilot study
was conducted prior to the main data collection. The pilot study involved development
of the questionnaire and the conduct of the pilot study followed the same protocol as
described for main study. Details of the pilot study are described in Sections 4.8 and 4.9.
The main study was conducted as follows:
administration of the questionnaire and obtaining positive consent
a clinical examination of dental caries and fluorosis between two birth
cohorts in selected schoolchildren in fluoridated and non-fluoridated areas
and
an intra-oral photograph of the anterior teeth
An overview of the conduct of study is shown in Figure 4.3.
Page 144
126
Figure 4.3 An overview of the overall conduct of study
Malaysian children attending school dental service
Fluoridated Non-fluoridated
9-year-old 12-year-old 9-year-old 12-year-old
Application for permission
MINISTRY OF EDUCATION, MALAYSIA
KELANTAN & NEGERI SEMBILAN STATE EDUCATION DEPARTMENT
+List of schools
+School size
Invitation to school to participate in this study
Permission from school’s principal
+Student name list
Assigned unique identifying code for each participant
+Questionnaire distribution
+Positive consent
+Tracing residency status
Lifelong residents
Inclusion and exclusion criteria
CLINICAL EXAMINATION
Caries (ICDAS-II)
Fluorosis (Dean’s Index)
Intra-oral photographs for fluorosis
Page 145
127
Data collection instrument and methods of execution
4.6.1 Child identification code
After receiving name list of participants from each school, each child was assigned eight
digits identification code. The first two digits are refer to school code, the next two digits
are refer to age group and the last four digits are unique identifying code for each
individual. The school code and the last four digits code were generated randomly using
excel.
This code was then used as identification number for questionnaire, clinical examination
form, photographic log, photographic fluorosis scoring and data entry procedure.
4.6.2 Final questionnaire
The final version of the parental questionnaire consisted of 29 questions, divided into the
following sections: residency status, demographic characteristics, infant feeding
practices, oral hygiene practices (which sub-divided into previous practice [age less than
6 years old] and current practice [in 2015]), exposure to fluoride varnish/gel and sources
of water at home. A copy of the questionnaire is presented as Appendix 14. Details of
questionnaire development are described in Section 4.8.1.
4.6.3 Questionnaire distribution
After obtaining approval from the selected schools, a set of survey forms (including
consent form, patient information sheet, parental questionnaire) was delivered by hand
to the head teacher or representative teacher of the school. Detailed written (Appendix
15) and verbal instructions were given to the teachers concerning the purpose of the study
and questionnaire content. The pupils selected to participate in the study were given a
Page 146
128
copy of the questionnaire by their teachers. Pupils were advised to deliver the
questionnaire to their parents for completion and return to school on the following day.
Those pupils whose parents had failed to return the questionnaire were given a reminder
one week after the initial distribution. The completed questionnaires and consent form
were then collected by the teachers and passed to the investigator during visits to each
school.
4.6.4 Consent
Alongside with the questionnaire, parents were given an information sheet (Appendix
16) and consent form (Appendix 17). The information sheet provided clear information
explaining the nature and purpose of the research. Consent form refer to provision of a
form which parents can report consent or refusal for the survey (which include taking
intra-oral photograph of their children), indication that parents have read and understood
the information sheet and includes a signature and a date.
The information sheet and consent form were translated to the Malay language and
reported in Appendix 18 and Appendix 19 respectively. An example of an original signed
consent form by parents also enclosed in Appendix 20.
On examination day, children were also asked verbally their willingness to be examined
and photographed.
Page 147
129
4.6.5 Assessment of subject eligibility
Upon receiving all the survey forms from the teachers, the investigator identified
consented children and their lifelong residency status. The subjects were subsequently
assessed for their eligibility for clinical examination based on inclusion criteria described
in Section 4.4.1.
4.6.6 Clinical examination
All examinations were performed by a single examiner, Nor Azlida Mohd Nor (NAMN).
The clinical assessment index is discussed in Sections 4.6.6.1 and 4.6.6.2. Details of
examiner training and calibration exercise are discussed in Section 4.6.6.3. The
examinations were conducted during school hours either in the classroom or first aid
room (Appendix 21). Clinical examinations form for caries and fluorosis are reported in
Appendix 22.
Fluorosis assessment
Children were examined for dental fluorosis on index teeth (maxillary central permanent
incisors) using the Dean’s Index (Dean, 1942). Only the maxillary central incisors were
examined because they are the most aesthetically important. Dean’s Index was chosen
because it is a valid and reliable index and it enables comparison with existing national
data. Dean’s Index is comprised of six categories in an ordinal scale (0=normal, 1
=questionable, 2=very mild, 3=mild, 4=moderate, 5=severe). The criteria for Dean’s
Index Criteria are described in Appendix 23. The advantages and disadvantages of
Dean’s index were discussed in Section 1.2.2.4.
Page 148
130
Caries assessment
Caries status was examined on all erupted teeth using ICDAS-II criteria (ICDAS
Coordinating Committee, 2009). ICDAS-II index was chosen because of the ability of
the system to detect cavitated and non-cavitated lesions making it possible to compare
differences of caries severity between the two populations studied. In addition, it allows
data comparison with local and international studies.
The ICDAS-II index is a two-digit scoring method, where the first digit represents
restorations and sealant codes. The second digit relates to a dental caries code. The caries
code consisted of seven scores (code 0 is sound, codes 1-6 classified as caries). This
study used the epidemiology modification, which allows the use of gauze for drying. The
details of the index are discussed in Section 1.2.3.2. The ICDAS-II criteria are reported
in Appendix 1.
Training of examiner and intra-examiner reproducibility
The examiner was trained by Prof Barbara Chadwick (BLC) and Prof Ivor Chestnutt
(IGC), who are experienced in conducting caries and fluorosis assessment using ICDAS
and Dean’s index.
For caries assessment, the examiner underwent the ICDAS online training module
(International Caries Detection and Assessment System, n.d) followed by a six-hour
ICDAS workshop at the Dental School, Cardiff University in September 2014. The
training workshop involved theoretical explanation and clinical photograph case
scenarios. The training exercise was followed by a calibration exercise using 40 clinical
slides. The diagnoses were compared with the score recorded by the reference examiner
followed by group discussion for every case. In order to test the consistency of the
Page 149
131
examiner in the field, twenty children were re-examined during clinical examination at
random two weeks after the first examination. The level of agreement and intra-examiner
reliability were assessed using the Kappa Statistic. Results of intra and inter-examiner
reliability for caries examination are described in Section 4.9.2.
For fluorosis assessment, the examiner was also previously trained by the Ministry of
Health, Malaysia and international expert (Prof Helen Whelton from the University of
Leeds) as a national examiner for Malaysian National Fluoride Enamel Opacities Survey
in February-March 2013. The comprehensive training involved a combination of
theoretical information, seminar, preliminary diagnostic training, examination of patients
and a calibration exercise. The examiner repeated the same online module slides training
of fluorosis assessment with Dean’s Index used in previous training (Whelton et al., n.d)
in September 2014. The online training consists of four modules, the last of which
generates a kappa value for a calibration exercise using 40 clinical images. The online
training was repeated until the examiner achieved good to excellent kappa score.
The online module training for ICDAS and Dean’ Index was also repeated just before
the commencement of data collection as a refresher session.
For intra-oral photographic training, the examiner was trained by the chief clinical
photographer, Samuel Evans from the Dental School, Cardiff University. The calibration
exercise for fluorosis scoring using photographic methods is described in Sections 4.6.7.2
and 4.8.1.5. Results of intra and inter-examiner reliability for fluorosis scoring are
described in section 4.9.3.
Page 150
132
Training of the recorder
The recorder was trained by the examiner (NAMN) in Malaysia before embarking on
data collection. This training was to ensure that the recorder was familiarised with the
survey forms, field work procedures and equipment to be used.
Method of examination
Fluorosis
Children were examined sitting on a chair in the upright position, with the examiner
(NAMN) facing them with her back to the light (window). Teeth were not cleaned prior
to the examination except for the removal of food debris with gauze or a WHO
periodontal probe if necessary. The distribution pattern of any defects was noted and the
presence or absence of fluorosis recorded in natural light, with the teeth wet. Children
were asked to moisten their teeth .If this not possible, damp cotton wool was used to keep
the teeth moist. If fluorosis was present, diagnosis was based on the condition of the
maxillary central incisors. If the two teeth were not equally affected, the score on the
least affected of the pair was recorded.
Caries
Immediately after fluorosis examination, children were examined for caries on a mobile
dental chair in a supine position. Dental caries was diagnosed by visual examination with
the aid of a portable light (Halogen bulb, Daray light x100, 12 Volt and 20 Watt)
disposable mouth mirror using and a WHO periodontal probe (if necessary) using
ICDAS-II criteria (with epidemiology modification). The teeth were dried and cleaned
with gauze if the presence of debris interfered with the examination of the tooth surface.
Page 151
133
All clinical procedures followed standard infection control guidelines from the Ministry
of Health, Malaysia.
4.6.7 Photographic examination
Standardized photographic method of recording dental fluorosis
Digital images of the maxillary incisors were taken to enable blind scoring of dental
fluorosis. Intraoral photographs were taken using standardized methods described in
previous studies (Cochran et al., 2004a). Standardized images were taken using a digital
SLR camera, Nikon D3300 body, Sigma 105mm f/2.8 macro lense, Sigma ring flash EM
140DG.
Prior to photograph taking, the child was asked to keep their head still and placed their
teeth edge to edge if possible. If it was not possible to maintain edge to edge incisal
contact, the child was instructed to bring their upper and lower central incisors into the
same vertical plane as far as possible. The child was asked to maintain the position for
photography and cheek retractors were inserted to reflect the soft tissues. Sunglasses
were used to protect participants’ eyes during photography. When necessary, teeth were
cleaned with gauze or the periodontal probe if the presence of debris interfered with the
examination. Children were asked to moisten their teeth before the photograph was taken.
If this was not possible, damp cotton wool was used to keep the teeth moist and the
photographs were taken after eight seconds while the teeth were still wet. An assistant
verbally counted down the eight seconds.
Most of the photographs only involved one exposure per child. However on occasion,
where the examiner was not satisfied with the first photograph (such as issues with
specular reflection), further exposures were attempted.
Page 152
134
None of the images contained any identifying aspects of the subject’s face. A photograph
of the children identifying code and their clinical examination form were captured first
followed by the images of their teeth. This process enables the digital images link to a
subject identity.
Blind scoring of fluorosis status
The primary outcome measure for fluorosis was the consensus score from the digital
photographs. This method was used with the aim of minimising bias during clinical
scoring. The final score used was based on agreement from three examiners as described
below.
All digital images were transferred to a computer and transported to the School of
Dentistry, Cardiff University. The best quality image representing each participant was
chosen and later the photographs were mixed randomly for blind fluorosis scoring. All
images (n=1155) were included for assessment and projected onto a white screen using
Microsoft Power Point in a darkened room. Two trained examiners (IGC, BLC) who
were not involved in the clinical examination, scored these photographs together with
the clinical examiner (NAMN). All examiners were blinded to the subject fluoride
exposure and each photographic slide was assigned a unique code number. The three
scorers (NAMN, IGC and BLC) were seated approximately three meters from the screen
and scored the photographs at the same time under identical lighting conditions.
Following individual assessment, all examiners re-examined all photographs and
discussed thoroughly for consensus agreement of final photographic score. Any
problems with the images such as presence of light reflection and flash of the camera
were noted during evaluation of each photograph. A calibration exercise was carried out
using 111 images following the pilot study and inter-examiner reliability was determined
Page 153
135
using the kappa test statistic as described in Section 4.8.1.5. Results of intra and inter-
examiner reliability for fluorosis scoring are described in Section 4.9.3.
The primary outcome measure for fluorosis was based on the consensus score from the
digital photographs. This method was used with aim of minimising bias during clinical
scoring. The score used was based on agreement from the three examiners. Example of
the intra-oral photographs are presented in Appendix 24.
Data management and statistical analysis
4.7.1 Data management
Data entry and processing
There were three individual data sets in this study which refer to questionnaire,
photographic fluorosis score and caries data. For questionnaire and photographic
fluorosis score, the data were entered directly to SPSS software version 21 for statistical
analysis by the examiner (NAMN).
For caries data, a Visual Basic for Windows (Version 10) data entry programme was
specifically designed by a statistician (Damian J Farnell [DJF]) based on examination
record forms that were used in the clinical examination (Appendix 25). Data were entered
using this interface by a research assistant. On completion of caries data entry, the
interface data were converted to SPSS. This data set was than merged with questionnaire
and fluorosis data sets using a unique identifier to form a complete data set of study
participants for analysis. Cross-checking was performed to ensure no data duplication
and other error during merging. Only complete data with clinical and photographic data
were included in the analysis.
Page 154
136
A number of steps were taken throughout data entry of all data sets to ensure data quality.
In order to reduce the chance of human error by transferring data from the questionnaire
and charting sheets into the computer, 50 cases were selected randomly and re-entered
separately after 30 days of first entry by the examiner. The data were then analysed and
verified if differences found in the two entries. Only a very minimal data entry error was
found and therefore it was decided that no duplicate data entry was needed.
Syntax development for dental caries using ICDAS code
In this study, a new caries index namely ICDAS was used for caries measurement. Since
this is an index with a two-digit scoring method, a new syntax for caries outcome
variables was developed by a statistician (DJF) from scratch. Caries was calculated at
three different ICDAS cut-off points; (D1-3) for enamel caries, (D4-6) for dentine caries,
and (D1-6) caries at all level. For teeth surfaces with codes representing both restoration
and caries [i.e. any caries score 4 or greater was (dentine caries supersedes restoration),
the surface was counted as decayed; and in the absence of any caries score 4 or greater
(restoration score supersedes enamel caries) the surface was counted as a restoration].
Fissure sealant codes (code 10 and code 20) were counted as a sound surface. However
if the sealant was associated with caries, the surface was recorded as caries at different
ICDAS cut-off points as mentioned earlier. A summary of the ICDAS and syntax coding
are described in Table 4.1 and Table 4.2.
To ensure the accuracy of the newly developed syntax calculation for caries experience,
data were analysed and compared with a manual caries experience (dmft and DMFT)
calculation. Manual caries calculation was conducted by the investigator (NAMN) and
her supervisor (IGC) using Microsoft Excel independently. Any disagreements were
Page 155
137
resolved by discussion for an agreed manual caries score. This agreed score was then
compared with the syntax caries score. The syntax and manual caries calculation was
piloted on 20 cases. Findings from the pilot test resulted in minor modification to the
syntax. The final syntax was re-tested on an additional 20 cases against manual
calculation and no further amendment was required. The final version of the syntax was
used for data analysis using SPSS.
Table 4.1 Syntax coding for ICDAS
ICDAS Code Code Variable description
97 M Missing due to caries
98 ignore Missing due to other reason
00 Sound Sound
01, 02, 03 D1-3 Enamel caries
04, 05, 06 D4-6 Dentine caries
10, 20 Sound Sound sealant
11, 12, 13, 21, 22, 23 D1-3 Sealant with enamel caries
14, 15, 16, 24, 25,26 D4-6 Sealant with dentine caries
30, 40, 50, 60, 70, 80 F Sound filling
31, 41, 51, 61, 71, 81
32, 42, 52, 62, 72, 82
33, 43, 53, 63, 73, 83
Restoration
supersedes
enamel caries
= F
Filling with enamel caries (count as
filling)
34, 44, 54, 64, 74, 84
35, 45, 55, 65, 75, 85
36, 46, 56, 66, 76, 86
Dentine
caries
supersedes
restoration =
D4-6
Filling with dentine caries (count
as caries)
99 ignore Unerupted teeth (ignore)
All other codes Ignore
Note: similar principles apply for primary teeth, only difference is use of lower case
dmft and dmfs.
Page 156
138
Table 4.2 Syntax coding for DMFT calculation
ICDAS Code Description Variable
code
Variable
description
97 If any surface =97 M Missing
04, 05, 06, 14, 15, 16, 24,
25,26, 34, 44, 54, 64, 74,
84
35, 45, 55, 65, 75, 85
36, 46, 56, 66, 76, 86
Any caries score on any
surfaces 4 or greater
D4-6 Dentine
caries
01, 02, 03, 11, 12, 13, 21,
22, 23
In the absence of any F or
caries score 4 or greater
D1-3 Enamel
Caries
30, 40, 50, 60, 70, 80, 31,
41, 51, 61, 71, 81
32, 42, 52, 62, 72, 82
33, 43, 53, 63, 73, 83
In the absence of any caries
score 4 or greater counts
F Filling
Note: similar principles apply for primary teeth, only difference is use of lower case
dmft and dmfs.
4.7.2 Statistical analysis
This section describes the statistical approach used in this study, which includes:
measurement of independent variables prior to statistical analysis and specific approach
to answering the study objectives.
Measurement of independent variables
Variables from the questionnaire include: socio-demographic characteristics, exposure
to fluoride from the water, fluoride varnish/gel, infant feeding patterns and oral hygiene
practices.
To have a meaningful explanation of each answer options, the data were re-categorised
as follows:
Page 157
139
i) Exposure to fluoride from the water was categorised into three categories: 0.5 ppmF
lifetime, 0.7+0.5 ppmF lifetime and 0 ppmF lifetime.
ii) Demographic characteristic: parents’ education level were categorised into three
categories: ≤primary school (low education level), high school (moderate education
level) and College/University1 level (high education level); parents’ monthly income
were categorised as <MYR2 1000 (low income), MYR 1000-3999 (moderate income),
≥MYR 4000 (high income).
The majority of the respondents were Malay. There were only a small number of other
ethnic groups, which restrict further analysis to compare differences across ethnicity.
Therefore ethnicity was excluded from further analysis.
iii) Oral hygiene practices: age started toothbrushing was categorised as before 2 years
and after 2 years; age started toothbrushing with toothpaste was categorised as before 2
years and after 2 years; frequency toothbrushing was categorised as once per day or less
and twice per day or more; supervised toothbrushing was categorised as never and yes
(those answering everyday and sometimes); habits after toothbrushing was categorised
as swallowed (for those answering ‘swallow/ rinse and swallow’) and spat (for those
answering ‘spit/rinse and spit’); habits of eating and licking toothpaste was categorised
as never and yes (those who answered often and sometimes); amount of toothpaste used
was categorised as small (pea to smear) and large (moderate to full length brush head);
type of toothpaste was categorised as fluoridated (adult and children fluoridated
toothpaste) and non-fluoridated toothpaste. The same questions were asked for two time
frames of oral hygiene practices: previous practices (aged less than 6 years old) and
1 This category includes Malaysian education qualification known as ‘Sijil Tinggi Pelajaran Malaysia’
(STPM), which is equivalent to Pre-University certificate. 2 MYR 4.40 (Malaysian Ringgit) equivalent to 1 USD (United States Dollars)
Page 158
140
current practices (in 2015), therefore the same categorisation were used for these
variables.
iv) Infant feeding practices: infant formula use was categorised as yes and no; aged
finished breast feeding was categorised as finished breast feeding at ≤12 months and after
12 months; aged started infant formula was categorised as at ≤12 months and after 12
months; aged finished breast feeding was categorised as at ≤48 months and after 48
months; duration of infant formula feeding was categorised as at ≤48 months and after
48 months. Information relating to methods of feeding practices was also converted into
a categorical variable: breast feeding only, formula feeding only and a combination of
breast and formula feeding. Respondents who answered ‘yes’ to breast feeding question
and ‘yes’ to infant formula question were categorised as ‘combination of breast and
formula feeding’. Respondents who answered ‘yes’ to breast feeding question and ‘no’
to infant formula question were categorised as ‘breast feeding only’ and those who gave
the opposite response were categorised as ‘formula feeding only’. Respondents with
missing or conflicting information were excluded from further analysis. An example of
conflicting information is when a respondent reported ‘never fed with infant formula’
(Question 9) but answering the following question on infant formula feeding time period
(Question 10 and Question 11).
When evaluating the questionnaire, it was decided that ‘don’t know and not sure’ answers
were excluded from bivariate analysis, which refer to the following questions: Question
18 (supervise toothbrushing), Question 19 (habits after toothbrushing), Question 22 (type
of toothpaste) and Question 24 (exposure to fluoride varnish/gel).
Page 159
141
Statistical analysis plan to address specific objectives of the study
Descriptive analysis was used to explain sample characteristics including frequency and
percentage distribution of gender, parents’ education levels and parents’ socio-economic
status. The data were stratified by age group and fluoridation status.
The overall data in the present study was not normally distributed, therefore non-
parametric tests was employed for association analysis.
Data were analysed using SPSS Version 21 and STATA Version 13 where indicated.
Objective 1
A descriptive analysis was used to describe the prevalence and severity of dental fluorosis
by Dean’s Index. The prevalence of dental fluorosis was based on the percentage of
children having fluorosis on maxillary central incisors by consensus digital photographs
score. The cases for fluorosis were defined as any fluorosis by Dean’s score>0, which
include questionable or greater and fluorosis at Dean’s score≥2 which indicate very mild
or greater. The data were stratified by age group and fluoridation status. Chi square test
was used to compare association between fluorosis prevalence by age group and
fluoridation status. The significance level was set at p<0.05.
Objective 2
Descriptive analysis was used to describe caries experience using ICDAS score
(DMFT/dmft and DMFS/dmfs) by birth cohorts and fluoridation status. To establish how
the decay component using ICDAS-II correlated with the DMF caries classification
scores, the DMFT/dmft and DMFS/dmfs scores were calculated at three cut off points:
scores D1-3/ d1-3 classified as enamel caries, score D4-6/ d4-6 classified as dentine caries
Page 160
142
and D1-6/ d1-6 classified as caries at all levels. A comparison of the ICDAS scoring system
with the DMF index is shown in Appendix 2. In terms of caries prevalence, the dentine
caries prevalence (D4-6MFT>0/ d4-6mft>0) was dichotomized into absence and presence
of the disease. A comparison was made between enamel caries and dentine caries, and
the data were stratified by age group and fluoridation status. To compare the mean caries
scores of the subgroups, non-parametric test was performed (Mann Whitney test). The
significance level was set at p<0.05.
Objective 3
Fluorosis
The differences between birth cohorts was the key factor in comparing prevalence of
fluorosis. In order to detect differences following fluoride level adjustment, the change
in fluorosis prevalence in the fluoridated community was compared to the change in non-
fluoridated community. The ‘baseline’ data were extracted from the groups that were
exposed to the old fluoride level (0.7 ppm) and the ‘after’ prevalence data were extracted
from the group that were exposed to the new fluoride level (0.5 ppm) after the reduction
occurred. Both definitions of fluorosis prevalence (Deans>0, Deans≥2) were analysed.
In addition, the association between the prevalence of aesthetic fluorosis (Deans≥ 2) and
different levels of fluoride exposure in the water were analysed using binary logistic
regression and odds ratio. The non-fluoridated group was used as reference category.
Page 161
143
Caries
Caries experience cannot be compared directly across different age groups. To determine
differences in caries experience following the reduction of fluoride level in the public
water supply, two types of multivariate analyses (namely zero-inflated negative binomial
and generalised linear model) were conducted. These analyses were performed using two
caries outcome measures (mean D4-6MFT and D4-6MFT>0) to generate two caries models
to evaluate the caries preventive effect after the change of fluoride level in the water. The
zero-inflated negative binomial analysis was performed using STATA Version 13 for
caries model 1. The generalised linear model analysis was performed using SPSS
Version 21 for caries model 2. The zero-inflated negative binomial was analysed using
mean caries experience into dentine (D4-6MFT) with different fluoridation status and age
groups. Meanwhile, the generalised linear model was analysed using percentage caries
prevalence into dentine (D4-6MFT>0) with different fluoridation status and age groups.
In both models, data were presented by age, fluoridation status and when interaction
between age and fluoridation were included in the analysis.
Objective 4
Bivariate analysis was used to determine the association between fluorosis and
independent variables from the questionnaire using Chi Square test and odds ratio.
Independent variables were dichotomised prior to bivariate analysis as described in
Section 4.7.2.1. The selection of variables to test for association with fluorosis was based
on the exposure to fluoride during the developmental stages of the central incisors.
Analysis was conducted to explore associations between fluorosis (Deans≥2) as
dependent variable and other factors such as: oral hygiene practices (during the first six
Page 162
144
years of life), infant feeding practices and demographic characteristics as independent
variables. Data on independent variables were obtained from the questionnaire which
included factors such as exposure to fluoride in the water supply; fluoride gel/varnish;
infant feeding patterns (method of feeding, age at which breast-feeding terminated, age
started and finished formula and type of water use to reconstitute formula when it was
used); and oral hygiene practices (the age started toothbrushing, the age at which
toothbrushing with toothpaste started, the frequency of toothbrushing, toothbrushing
supervision, habits after toothbrushing, type of toothpaste and amount of toothpaste
used). Other demographic variables such as gender, age, parents’ education levels, and
parents’ socio-economic status were also tested for association with fluorosis prevalence.
The outcome was reported as unadjusted odds ratios, confidence intervals and p value.
The significant variables were entered into a multivariate logistic regression analysis as
independent predictors as described below.
Multivariate models for fluorosis
Variables with significant association (p<0.05) at bivariate analysis were further
analysed using multivariate logistic regression to develop a model for dental fluorosis
using binary logistic regression. These variables were entered in one block using the
Enter method. Interaction was also tested between inter-dependent factors to test their
contribution to a model. If any interaction were contributory, they were retained and
reported. The outcome was reported as adjusted odds ratios, confidence intervals and p
values.
Page 163
145
Objective 5
Similarly, bivariate analysis was conducted between caries prevalence at dentine level
(D4-6MFT>0) as dependent variables and exposure to fluoride from the water, fluoride
varnish/gel, oral hygiene practices, infant feeding practices and demographic
characteristics as independent variables. The same analysis as described above was
conducted for caries prevalence at all levels (D1-6MFT>0). The outcome was reported as
unadjusted odds ratios, confidence intervals and p value. The significant variables were
entered into a multivariate logistic regression analysis as independent predictors as
described below.
Multivariate models for caries
Variables with significant association (p<0.05) and approaching significant (p<0.10) at
bivariate analysis were further analysed using multiple logistic regression to develop a
model for caries at dentine level (D4-6MFT>0) and caries at both enamel and dentine
levels (D1-6MFT>0) using binary logistic regression. These variables were entered in one
block using the Enter method. Interaction was also tested between inter-dependent
factors to test their contribution to a model. If any interaction were contributory, they
were retained and reported. The outcome was reported as adjusted odds ratios,
confidence intervals and p values.
Page 164
146
Pilot study
The purpose of the pilot study was to test the methods and logistics before the
subsequent conduct of main study.
4.8.1 Questionnaire
Development of draft questionnaire
Specific questions were adapted from a National Survey of Fluoride Enamel Opacities
(NSFEO), Malaysia 2013 (Oral Health Division Ministry of Health, 2013) and the Child
Oral Health Study, Australia 2002/2003 (Do, 2004). Additional questions were
formulated based on literature reviews and group discussion between the author and her
supervisors in order to answer the research objectives. The questionnaire from NSFEO
was available in Malay and English versions. Other questions were underwent translation
process as described in section 4.8.1.2. The English version of the questionnaire draft
was underwent face validation by two dental experts in Cardiff University and required
minor amendments.
The translation process
Following face validation, the original English questionnaire was translated into the
Malay language by a bilingual translator and investigator. Following forward translation,
discussion were carried out to achieve a single Malay version of the questionnaire. A
bilingual expert committee consisting of three dental experts (two dental academics from
the University of Malaya and a dental public health specialist from Ministry of Health,
Malaysia) reviewed both the Malay version and the English version of the questionnaire
independently. The committee reviewed the questionnaire with regards to the wording
used, structure, content and semantic equivalence with the original questionnaire. Any
Page 165
147
discrepancies from independent reviews were discussed thoroughly until consensus was
achieved. Following expert committee discussion, both Malay and English versions
required some modifications as listed in Appendix 26. The English pre-final version of
the questionnaire was assessed by two dental specialists who were native English
speakers. The Malay pre-final version was assessed by a linguistic expert in the
University of Malaya. Following the assessment, no further changes were needed and the
draft underwent pre-testing among a group of Malaysian parents.
The development stage of the parental questionnaire is illustrated in Figure 4.4.
Figure 4.4 Development of the questionnaire
• Review existing questionnaire in the literature
• Additional questions were formulated to answer research question
Questionnaire development
• Forward-backward translation procedure (English-Malay)
Translation process
• Reached consensus on discrepancies
• Agreed on pre-final version
Expert committee
review
• Self-administered (n=111)
• Interview & discussion (n=5)
Pre-testing
Page 166
148
Pre-test of the questionnaire
A pre-final draft of the questionnaire was pre-tested among selected parents (n=111) in
one of the school (Sekolah Kebangsaaan Padang Jawa) in a fluoridated area located in
Shah Alam, Selangor between (20th September to 30th October 2014). Method of the
questionnaire distribution was similar to the method used in the main study as described
in Section 4.6.3. Twenty parents were randomly invited to answer the questionnaire twice
after one week interval for internal reliability test. Results of internal reliability test of
the questionnaire are described in Section 4.9.1. The same parents were also invited for
qualitative interviews to give their feedback on the questionnaire, however only five
parents agreed to participate. During telephone interviews, parents were asked to give
feedback on the clarity of the questionnaire instruction, language, its content and the
times taken to answer overall questions. All telephone interviews were tape-recorded and
transcribed. Findings from the pilot study and interviews resulted in minor amendments
to the questionnaire which was removal of Question 9 “at what age did your child begin
breast feeding?” as this was deemed confusing to the parents.
The final version of the parental questionnaire consisted of 29 questions and divided into
the following sections: residency status, demographic characteristics, infant feeding
practices, oral hygiene practices (which sub-divided into previous practice [age less than
6 years old] and current practice [in 2015]), exposure to fluoride varnish/gel and sources
of water at home.
Clinical examination for pilot study
The clinical assessment index was discussed earlier in Sections 4.6.6.1 and 4.6.6.2.
Details of examiner training and calibration exercise were discussed earlier in Section
Page 167
149
4.6.6.3. During the pilot study, children (n=111) were examined clinically for dental
caries and fluorosis by a single examiner (NAMN) in Malaysia. Twenty children were
re-examined after a two-week interval for intra-examiner reliability. Results of intra-
examiner reliability were described in section 4.9.2.
Photographic assessment of dental fluorosis for pilot study
Two independent photographic examiners (IGC, BLC) and the clinical examiner
(NAMN) scored 111 photographic images of the same children in a standardized manner
as described in Section 4.6.7.2. The blinded fluorosis scores were compared individually
between examiners for both clinical and photographic scoring. Results of intra and inter-
examiner reliability were described in Section 4.9.3.
Results of the pilot study
4.9.1 Internal reliability of the questionnaire
Internal reliability of the questionnaire was assessed using Cronbach’s alpha coefficient.
Twenty parents answered the questionnaire twice after one-week interval. Twelve
questions of oral hygiene practices were used to for test-retest analysis. Internal
consistency was good with Cronbach alpha (α>0.80).
4.9.2 Examiner reliability for caries assessment
Results of inter-examiner reliability of calibration exercise using 40 clinical slides were
substantial (0.61). The kappa score for intra-examiner reliability for the duplicate clinical
examination of caries assessment was excellent (0.81).
Page 168
150
4.9.3 Examiner reliability for fluorosis assessment
The overall findings of examiner reliability for fluorosis assessment using clinical and
photographic methods was published in the Community Dental Health Journal (2016).
The full text article is presented in (Appendix 27). The results described in this section
are the key findings from the publication.
The kappa score for intra-examiner reliability for the duplicate clinical examination of
fluorosis assessment was excellent (0.89).
In terms of weighted kappa statistics, a weight of 1 was given for exact agreement, a
weight of 0.5 was given when examiner disagreed by only one severity level and a weight
of 0 was given when examiners disagreed by more than one severity level.
Table 4.3 shows inter-examiner reliability between clinical and photographic methods.
Inter-examiner reliability between photographic examiners (Examiner 2 and Examiner
3) versus clinical examiner (Examiner 1) was found to have substantial agreement using
both weighted and simple kappa statistics.
Table 4.3 Inter-examiner agreement of dental fluorosis by clinical and photographic
examination
Unweighted data Weighted data
Clinicians Kappa Agreement (%) Kappa Agreement (%)
Examiner 1 clinical
versus Examiner 2
photographs
0.82 92.8% 0.77 89.6%
Examiner 1 clinical
versus Examiner 3
photographs
0.72 89.2% 0.74 86.5%
Page 169
151
Table 4.4 shows all examiners demonstrated substantial to excellent inter-examiner
reliability for photographic scoring (either when they were compared against each other
or when comparison were made with consensus photographs score) with weighted kappa
values ranging from 0.72 to 0.91. There was little difference found between weighted
and simple kappa analysis.
Table 4.4 Inter-examiner agreement of dental fluorosis between individual photographic
score and consensus photographic score
Unweighted data Weighted data
Clinicians Kappa Agreement (%) Kappa Agreement (%)
Examiner 1 vs
Examiner 2
0.78 91.9% 0.80 94.8%
Examiner 1 vs
Examiner 3
0.72 90.1% 0.85 96.2%
Examiner 2 vs
Examiner 3
0.85 94.6% 0.75 89.2%
Examiner 1 vs
Consensus
0.83 93.7% 0.91 95.9%
Examiner 2 vs
Consensus
0.91 96.4% 0.87 94.4%
Examiner 3 vs
Consensus
0.90 96.4% 0.82 92.3%
Note: Consensus photographic score based on the agreement of at least two of the three
examiners. (Examiner 1=clinical and photographic examiner, Examiner 2 and
Examiner 3=photographic examiner only).
Page 170
152
Ethical considerations
Ethical approval to conduct this study was obtained from the Research Ethics Committee,
School of Dentistry, Cardiff University (Appendix 28). Permission to conduct this study
on Malaysian school children was obtained from Malaysian Ministry of Health
(Appendix 29), Ministry of Education (Appendix 30), State Education Department
(Appendix 31). Informed signed consent was obtained from the children’s parents or
guardians. An example of informed signed consent is presented in Appendix 20.
4.10.1 Data confidentially and security
All research data were treated in strict confidence and stored under secure conditions, in
line with Cardiff University data security requirements. To maintain anonymity, all
participants were given a unique individual code in all recorded measurements and files
as a replacement for the subject’s name.
Following field work, questionnaire data were entered straight away into SPSS software.
The original copies of the questionnaire were kept securely at the Department of
Community Oral Health & Clinical Prevention, Faculty of Dentistry, University of
Malaya, Malaysia. Data files which include intra-oral images and soft copies of the
questionnaire data were transferred on a password protected external hard drive from
fieldwork to Cardiff University. In terms of clinical examination forms, original charts
were transferred to Cardiff University by NAMN directly in her personal hand luggage
on a flight from Kuala Lumpur to Cardiff. The original copies of the clinical examination
forms were kept securely at the Dental Research Unit, Cardiff University. Duplicates of
clinical examination forms were held in the Department of Community Oral Health &
Clinical Prevention, Faculty of Dentistry, University of Malaya, Malaysia.
Page 171
153
Where data are recorded directly onto computers software a back-up copy was made
everyday and stored separately on a password protected external hard disc.
Names and other basic information and their corresponding codes were stored in a safe
place, and locked cabinet and only accessible to researchers.
4.10.2 Token of appreciation for participant
As a token of appreciation for participation in the study, children were provided with a
toothbrush and toothpaste. In line with local practice a Certificate of Participation was
given to the Schools involved. In addition to maximise response rate we offered parents
an incentive of entry to a prize draw for one of twenty MYR100 (23 USD) shopping
vouchers.
Page 172
154
5 Results
This results chapter consists of four main sections, each divided into sub-sections. Each
section will report descriptive, bivariate and multivariate analyses which address the
research questions. The data are based on information collected from the parental
questionnaire, photographic examination of dental fluorosis and the clinical examination
for caries. The main sections are divided as follows.
The chapter begins by describing the response rate and description of the study
participants (Section 5.1). Next, the descriptive analysis of the questionnaire data with
regards to exposure to difference sources of fluoride are presented in Section 5.2. These
independent variables were sub-divided into fluoride exposures from water, oral hygiene
habits, infant feeding practices and fluoride gel/varnish (Sections 5.2.1. to 5.2.7).
The following sections are divided into the main outcome measures which were dental
fluorosis (Section 5.3) and caries (Section 5.4). In the dental fluorosis section, results
were presented in the following order: prevalence and severity of dental fluorosis,
association between changes in fluoride level in the water supply and fluorosis
prevalence, as well as association of the other risk factors and fluorosis prevalence
(Sections 5.3.1 to 5.3.2). A multivariable model for dental fluorosis is presented in
Section 5.3.3. In the caries section, results are presented in a similar fashion as fluorosis
section: prevalence and severity of dental caries, association between changes in fluoride
level in the water supply and caries prevalence, as well as association of the other risk
factors and dental caries (Sections 5.4.1 to 5.4.3) and a multivariable model for dental
caries (Section 5.4.4). The last section summarises the key findings of this study (Section
5.5).
Page 173
155
Response rate and description of study participants
This section describes the participant response rate followed by a description of study
participants based on information derived from the parental questionnaire.
5.1.1 Response rate
Initially 20 public schools in Malaysia were invited to participate in the study. Of these
16 schools accepted. Eight schools were from a fluoridated state (Negeri Sembilan) and
another eight schools were from a non-fluoridated state (Kelantan). A total of 1,600
children were approached to participate in this study. Following questionnaire
distribution, 1,298 returned the questionnaire giving an 81.1% overall response rate. The
response rate was higher among children in the fluoridated areas (83.9%) in comparison
to those living in non-fluoridated areas (79.3%). The difference in response rate between
the two areas was statistically significant among the 9 year-old cohort (p=0.038). Table
5.1 presents the number of participants invited and the response rate by age group and
area of residence.
Page 174
156
Table 5.1 Response rate by age group and area of residence
Age/area Number of
participants invited
(questionnaire
distribution)A
Questionnaire
returnedB
Response rate (%)
[B/A x 100]
Fluoridated area (F)
9 400 343 85.8*
12 400 321 80.3NS
Total F 800 664 83.0 NS
Non-fluoridated area (NF)
9 400 291 72.3
12 400 343 85.8
Total NF 800 634 79.3
Overall response for both areas and age groups
F & NF 1600 1298 81.1 *p=0.038 (statistically significant between two areas) NS=not significant
Page 175
157
Of those who responded, 1291 provided signed parental consent. All consented
participants were further assessed for their residency status. At this stage fifty children
were excluded as non-lifelong residents.
Lifelong residents children with parental consent were further assessed for other
inclusion criteria as described in Section 4.4.1 and Section 4.6.5 during the clinical
examination. Reasons for exclusion during this stage of eligibility assessment are
presented in Table 5.2. In total 57 children were absent on clinical examination day. Of
those who attended the examination, 21 children were excluded because of unerupted
upper central incisor/s, followed by fractured incisor(s) (n=4), partially erupted incisor(s)
(n=3) and presence of a fixed orthodontic appliance (n=1). The number of children
excluded across age groups and in fluoridated and non-fluoridated areas was broadly
similar.
Table 5.2 Reasons of exclusion by age group and residency area
Reasons for exclusion
Age/
Area
Absent Unerupted
incisor(s)
Partial
erupt
incisor(s)
Fixed
orthodontic
appliance
Facture
incisor
Total
Fluoridated (F)
9 9 10 3 0 0 22
12 15 1 0 1 2 19
Total F 24 11 3 1 2 41
Non-Fluoridated (NF)
9 13 10 0 0 0 23
12 20 0 0 0 2 22
Total NF 33 10 0 0 2 45
Overall 57 21 3 1 4 86
Page 176
158
In total (n=1155) were clinically examined and photographed. After clinical
examination, all photographs were blind scored for fluorosis scoring (Section 4.6.7). Out
of 1155 photographs available for scoring, 12 photographs were not able to be scored
because of poor quality photographs. This resulted in 1143 children for whom both a
valid photograph and questionnaire data were available for analysis. In terms of caries
analysis, all clinical and questionnaire data (n=1155) were analysed.
Participant flow through each stage of the study is presented in Figure 5.1.
Page 177
159
Figure 5.1 Participants eligibility through each stage of the study
Total questionnaire distribution
(n=1600)
Questionnaire returned (n=1298)
Fluoridated Non-fluoridated
9 year-old 12 year-old 9 year-old 12 year-old
Returned
questionnaire
(n=343)
Returned
questionnaire
(n=321)
Returned
questionnaire
(n=291)
Returned
questionnaire
(n=343)
Non-consented
(n=5)
Non-consented
(n=2)
Consented
(n=341)
Consented
(n=318)
Consented
(n=291)
Consented
(n=341)
Non-lifelong
resident n=11
Non-lifelong
resident n=39
Lifelong
resident
(n=335)
Lifelong
resident
(n=313)
Lifelong
resident
(n=270)
Lifelong
resident
(n=323)
Excluded (n=41)
-Unerupted incisor/s
(n=11)
-Absent (n=24)
-Other reasons (n=6)
Excluded (n=45)
-Unerupted incisor/s
(n=10)
-Absent (n=33)
-Other reasons (n=2)
Clinical
examination
& intra-oral
photographs
(n=313)
Clinical
examination
& intra-oral
photographs
(n=294)
Clinical
examination
& intra-oral
photographs
(n=247)
Clinical
examination
& intra-oral
photographs
(n=301)
Photographs not
able to score (n=11)
Photographs not
able to score (n=1)
Valid intra-
oral
photographs
(n=304)
Valid intra-
oral
photographs
(n=292)
Valid intra-
oral
photographs
(n=246)
Valid intra-
oral
photographs
(n=301)
Fluoridated area
Caries analysis (n = 607)
Fluorosis analysis (n=596)
Non-fluoridated area
Caries analysis (n = 548)
Fluorosis analysis (n=547)
Page 178
160
5.1.2 Description of study participants
A description of the demographic characteristics of study participants by age and
residency area is presented in (Table 5.3 to Table 5.5).
Participants were similar in terms of gender distribution and ethnicity in both birth
cohorts and geographic areas. The majority of the respondents were Malays and there
were more girls than boys were recruited to the study (Table 5.3).
Table 5.3 Demographic characteristics of the study participants
Fluoridated (F)
n (%)
Non-fluoridated (NF)
n (%)
Variables 9 12 Total F 9 12 Total NF
n=313 n=294 n=607 n=247 n=301 n=548
Gender (n=1155)
Male 134 (42.8) 131 (44.6) 265 (43.7) 106 (42.9) 125 (41.5) 231 (42.2)
Female 179 (57.2) 163 (55.4) 342 (56.3) 141 (57.1) 176 (58.5) 317 (57.8)
Ethnicity (n=1155)
Malay 303 (96.8) 283 (96.3) 586 (96.5) 246 (99.6) 298 (99.0) 544 (99.3)
Chinese 0 0 0 0 1 (0.3) 1 (0.2)
Indian 10 (3.2) 10 (3.4) 20 (3.3) 0 0 0
Others 0 1 (0.3) 1 (0.2) 1 (0.4) 2 (0.7) 3 (0.5)
Socio-economic status of the respondents were based on parents’ education level and
parents’ monthly income. For descriptive analysis, parents’ education levels are
presented in five categories (never been to school, primary school, high school, College
and University level). Overall, two thirds of children had parents with education at high
school level, followed by College level, University level and primary school level (Table
5.4). The patterns were slightly different among fathers’ educational level in the non-
fluoridated area. The proportion of fathers with University level education (11.7%) was
Page 179
161
double the proportion of those educated to primary school level (6.4%) among the 9 year-
old children in the non-fluoridated area. The opposite distribution was observed among
12 year-old children in the same area. Only a small proportion (less than 3%) of parents
had not received any formal education in both areas.
Table 5.4 Parents’ education level by age group and residency area
Fluoridated (F)
n (%)
Non-fluoridated (NF)
n (%)
Variables 9 12 Total F 9 12 Total NF
n=313 n=294 n=607 n=247 n=301 n=548
Father education level
(n=1061)
Never been to
school
4 (1.3) 2 (0.7) 6 (1.0) 4 (1.6) 3 (1.0) 7 (1.3)
Primary school 19 (6.0) 15 (3.3) 34 (5.6) 16 (6.4) 39 (13.0) 55 (10.1)
High school 189 (60.3) 181 (61.5) 370 (60.9) 153 (61.9) 182 (60.4) 335 (61.1)
College 46 (14.7) 45 (15.3) 91 (15.0) 23 (9.3) 26 (8.6) 49 (8.9)
University 30 (9.6) 29 (9.8) 59 (9.7) 29 (11.7) 26 (8.7) 55 (10.0)
Mother education level
(n=1092)
Never been to
school
2 (0.6) 5 (1.7) 7 (1.2) 7 (2.8) 8 (2.7) 15 (2.7)
Primary school 21 (6.7) 20 (6.8) 41 (6.7) 21 (8.5) 25 (8.3) 46 (8.4)
High school 163 (52.1) 175 (59.5) 338 (55.7) 147 (59.5) 200 (66.5) 347 (63.3)
College 69 (22.0) 47 (16.0) 116 (19.1) 37 (15.0) 29 (9.6) 66 (12.0)
University 33 (10.5) 36 (12.3) 69 (11.3) 25 (10.1) 22 (7.3) 47 (8.6)
Sums may not total 1155 due to missing response variables
Page 180
162
Parents’ monthly income in (Malaysian Ringgit-MYR) was used as a measure of
economic status. One United States Dollars (USD) is equivalent to 4.40 MYR. The
distribution of the father’s monthly income was different among children living in both
areas studied (Table 5.5). Most fathers in the fluoridated area had a higher income in
comparison to those in the non-fluoridated area. More than half of the fathers in the non-
fluoridated area (58.4%) had income less than MYR 1999 in comparison to those in
fluoridated area (25.6%).
In terms of mother’s monthly income, most mothers reported a low income compared
with that reported by the participants’ fathers. In both areas studied, the majority of
mother’s earned less than MYR 1999. A greater proportion of mothers were in the higher
income bands in the fluoridated when compared with the non-fluoridated states.
Table 5.5 Parents’ monthly income by age group and area of residence
Sums may not total 1155 due to missing response variables
Fluoridated (F)
n (%)
Non-fluoridated (NF)
n (%)
Variables 9 12 Total F 9 12 Total NF
n=313 n=294 n=607 n=247 n=301 n=548
Father income (n=1061)
No income 0 1 (0.3) 1 (0.2) 0 1 (0.3) 1 (0.2)
< MYR 1000 8 (2.6) 10 (3.4) 18 (3.0) 5 (2.0) 2 (0.7) 7 (1.3)
MYR 1001- 1999 75 (24.0) 61 (20.7) 136 (22.4) 133 (53.8) 179 (59.5) 312 (56.9)
MYR 2000- 3999 90 (28.8) 89 (30.3) 179 (29.5) 38 (15.4) 42 (14.0) 80 (14.6)
MYR 4000- 4999 77 (24.6) 65 (22.1) 142 (23.4) 23 (9.3) 26 (8.6) 49 (8.9)
>MYR 5000 40 (12.8) 44 (15.0) 84 (13.8) 26 (10.5) 26 (8.6) 52 (9.5)
Mother income (n=1061)
No income 0 0 0 0 1 (0.3) 1 (0.2)
< MYR 1000 131 (41.9) 144 (49.0) 275 (45.3) 148 (59.9) 189 (62.8) 337 (61.5)
MYR 1001- 1999 40 (12.8) 42 (14.3) 82 (13.5) 37 (15.0) 59 (19.6) 96 (17.5)
MYR 2000- 3999 47 (15.0) 25 (8.5) 72 (11.9) 17 (6.9) 8 (2.7) 25 (4.6)
MYR 4000- 4999 41 (13.1) 38 (12.9) 79 (13.0) 21 (8.5) 20 (6.6) 41 (7.5)
>MYR 5000 27 (8.6) 36 (12.2) 63 (10.4) 16 (6.5) 15 (5.0) 31 (5.7)
Page 181
163
Descriptive analysis on fluoride exposure from water,
infant feeding practices, oral hygiene habits and fluoride
varnish/gel in study participants
This section provides a descriptive analysis of fluoride exposure from multiple sources
among study participants. The fluoride history data were obtained from the parental
questionnaire. The fluoride exposure was divided into four main sub-sections; exposure
to fluoride from water, infant feeding practices, oral-hygiene habits and exposure to
fluoride varnish/gel. Further analysis on how these factors associated to fluorosis and
caries prevalence are described in Sections 5.3.2 and 5.4.3.
5.2.1 Exposure to fluoride from water
Table 5.6 shows exposure to fluoride from drinking water in the participants recruited.
There was a slightly higher proportion of participants resident in the fluoridated area
(52.6%) than in the non-fluoridated area (47.4%). The highest number of participants
was among 9 year-old children in the fluoridated area and the lowest number of
participants was among the 9 year-old children in non-fluoridated area. Of those living
in the fluoridated area, the 9 year-old children were exposed to 0.5 ppmF throughout life
(27.1%) and the older age group were exposed to 0.7 ppmF in the first 2 years of life
followed by 0.5 ppmF (25.5%).
Page 182
164
Table 5.6 Frequency table of exposure to fluoride from water among study participants
Exposure to fluoride from water n (%)
By age group
Fluoridated (F)
9 year-old F 313 (27.1)
12 year-old F 294 (25.5)
Total F 607 (52.6)
Non-fluoridated (NF)
9 year-old NF 247 (21.4)
12 year-old NF 301 (26.1)
Total NF 548 (47.4)
By different level of fluoride exposure
0.5 ppmF lifetime
(9 year-old)
313 (27.1)
0.7 ppmF at first 2 years of life & 0.5ppmF lifetime
(12 year-old)
294 (25.5)
0 ppmF lifetime
(9 and 12 year-old)
548 (47.4)
Page 183
165
5.2.2 Sources of drinking water and use of water filters at home
A question was asked about the usage of water filters at home because there is a tendency
towards use of domestic water filtration systems among in Malaysia due to concerns over
polluted water. Whether fluoride concentred in public water supply is affected by the
filter or not is discussed in Section 6.3.5.
Table 5.7 presents sources of drinking water and the use of a water filter at home. The
majority of respondents reported tap water as the main source of water at home. However
about 11% of children in the non-fluoridated area reported that they had other than tap
water as the source of water at home.
Higher water filter use was reported among those living in the fluoridated area (60%) as
compared to those in non-fluoridated area (42.9%).
Page 184
166
Table 5.7 Sources of drinking water and use of a water filter at home among study
participants
Fluoridated (F)
n (%)
Non-fluoridated (NF)
n (%)
9
(n=313)
12
(n=294)
Total F
(n=607)
9
(n=247)
12
(n=301)
Total NF
(n=548)
Source of
drinking water at
home (n=1142)
Tap water 300 (95.8) 286 (97.3) 586 (96.5) 218 (88.3) 259 (86.0) 477 (87.0)
River/stream/well
water
3 (1.0) 2 (0.7) 5 (0.8) 23 (9.3) 37 (12.3) 60 (10.9)
Bottled water 8 (2.6) 5 (1.7) 13 (2.1) 5 (2.0) 5 (1.7) 1 (0.2)
Others 0 0 0 1 (0.4) 0 0
Filtered tap
water (n=1128)
Yes 185 (59.1) 179 (60.9) 364 (60.0) 99 (40.1) 136 (45.2) 235 (42.9)
No 126 (40.3) 113 (38.4) 239 (39.4) 139 (56.3) 151 (4.3) 290 (52.9)
Sums may not total 1155 due to missing response variables
Page 185
167
5.2.3 Breast-feeding and infant formula practices in study
participants
Infant feeding practices in particular the use of infant formula are potential risk factors
to the development of dental fluorosis. A descriptive analysis of these factors are
presented in this section.
Breast-feeding practices
Table 5.8 shows reported breast-feeding among the study participants. Parents reported
that almost all children had been breast-fed during infancy. However the duration of
breast-feeding varied across age groups and residency area. A higher proportion of
children in the non-fluoridated area were breast-fed up to 24 months in comparison to
those in the fluoridated area.
Table 5.8 Self-reported breast-feeding practices among study participants
Fluoridated
n (%)
Non-fluoridated
n (%)
9
(n=313)
12
(n=294)
Total F
(n=607)
9
(n=247)
12
(n=301)
Total NF
(n=548)
Breast feeding
(n=1155)
Yes 305 (97.4) 287 (97.6) 592 (97.5) 238 (96.4) 298 (99.0) 536 (97.8)
No 8 (2.6) 7 (2.4) 15 (2.5) 9 (3.6) 3 (1.0) 12 (2.2)
Age finished breast
feeding (n=1131)
Before 6 months 60 (19.2) 62 (21.1) 122 (20.1) 19 (7.7) 30 (10.0) 49 (8.9)
6 months to 12 months 88 (28.1) 89 (30.3) 177 (29.2) 42 (17.0) 57 (18.9) 99 (18.1)
13 months to 24 months 98 (31.1) 91 (31.0) 189 (31.1) 144 (58.3) 175 (58.1) 319 (58.2)
After 24 months 61 (9.5) 46 (15.6) 107 (17.6) 33 (13.4) 36 (12.0) 69 (12.6)
Sums may not total 1155 due to missing response variables
Page 186
168
Infant formula practices
Table 5.9 shows infant formula practices among study participants. There was greater
proportion of children in fluoridated area (83.9%) who had been given infant formula
compared to 60.4% of children in the non-fluoridated area who were fed infant formula.
Most of the children in fluoridated area (81.4%) had a combination of breast-feeding and
formula feeding in comparison to only 58.2% of children in the non-fluoridated area who
had combined feeding methods.
Children in the fluoridated area were more likely to have been fed infant formula earlier
(before 12 months of age) than those in the non-fluoridated area. Children resident in the
fluoridated area were older when feeding with infant formula ceased. Half (50.7%) of
parents reported using infant formula beyond 48 months. This contrasts with 22.8% of
parents in the non-fluoridated area who similarly reported that their child stopped using
infant formula beyond 48 months.
The most common means of reconstituting infant formula was to use unfiltered tap water
(59.3%) in the fluoridated area and (50.5%) in the non-fluoridated communities. Infant
formula made-up with filtered tap water was three times more common among children
in the fluoridated area (22%) than those in the non-fluoridated area (7%). Only a small
proportion of respondents reported using bottled water to reconstitute infant formula.
Page 187
169
Table 5.9 Infant formula practices among study participants
Fluoridated
n (%)
Non-fluoridated
n (%)
Variables 9
(n=313)
12
(n=294)
Total F
(n=607)
9
(n=247)
12
(n=301)
Total NF
(n=548)
Infant formula user
(n=1152)
Yes 265 (84.7) 244 (83.0) 509 (83.9) 157 (63.6) 174 (57.8) 331 (60.4)
No 48 (15.3) 49 (16.7) 97 (16.0) 88 (35.6) 127 (42.2) 215 (39.2)
Infant feeding practice
(n=1152)
Infant formula only 8 (2.6) 7 (2.4) 15 (2.5) 9 (3.6) 3 (1.0) 12 (2.2)
Breast feeding only 48 (15.3) 49 (16.7) 97 (16.0) 88 (35.6) 127 (42.2) 215 (39.2)
Combination of breast
feeding and infant
formula
257 (82.1) 237 (80.6) 494 (81.4) 148 (59.9) 171 (56.8) 319 (58.2)
Age started infant
formula (n=850)
Before 6 months 87 (27.8) 80 (27.2) 167 (27.5) 58 (23.5) 57 (18.9) 115 (21.0)
6 months to 12 months 89 (28.4) 72 (24.5) 161 (26.5) 35 (14.2) 31 (10.3) 66 (12.0)
13 months to 24 months 56 (17.9) 55 (18.7) 111 (18.3) 40 (16.2) 58 (19.3) 98 (17.9)
After 24 months 35 (11.2) 39 (13.3) 74 (12.2) 28 (11.3) 30 (10.0) 58 (10.6)
Age finished infant
formula (n=845)
Before 6 months 0 0 0 1 (0.4) 5 (1.7) 6 (1.1)
6 months to 12 months 3 (1.0) 1 (0.3) 4 (0.7) 2 (0.8) 1 (0.3) 3 (0.5)
13 months to 24 months 20 (6.4) 22 (7.5) 42 (6.9) 11 (4.5) 26 (8.6) 37 (6.8)
25-48 months 83 (26.5) 75 (25.5) 158 (26.0) 84 (34.0) 78 (25.9) 162 (29.6)
>48 months 160 (51.1) 148 (50.3) 308 (50.7) 59 (23.9) 66 (21.9) 125 (22.8)
Type of water use to
prepare infant formula (n=839)
Formula user with tap
water
176 (56.2) 184 (62.6) 360 (59.3) 132 (53.4) 145 (48.2) 277 (50.5)
Formula user with
filtered tap water
77 (24.6) 54 (18.4) 131 (21.6) 18 (7.3) 21 (7.0) 39 (7.1)
Formula user with
bottled water
11 (3.5) 7 (2.4) 18 (3.0) 6 (2.4) 8 (2.7) 14 (2.6)
Duration of infant
formula (n=836)
Before 6 months 4 (1.3) 5 (1.7) 9 (1.5) 3 (1.2) 10 (3.3) 13 (2.4)
6 to 12 months 14 (4.5) 14 (4.8) 28 (4.6) 16 (6.5) 23 (7.6) 39 (7.1)
13 to 24 months 42 (13.4) 38 (12.9) 80 (13.2) 43 (17.4) 53 (17.6) 96 (17.5)
25 to 48 months 94 (30.0) 101 (34.4) 195 (32.1) 62 (25.1) 54 (17.9) 116 (21.2)
>48 months 110 (35.1) 85 (28.9) 195 (32.1) 34 (13.8) 31 (10.3) 65 (11.9)
Sums may not total 1155 due to missing response variable
Page 188
170
5.2.4 Age started toothbrushing and age exposed to fluoridated
toothpaste in the study participants
The age at which participants started toothbrushing and using a fluoridated toothpaste
are potential contributing factors to the development of dental fluorosis. The continuous
variable (age started toothbrushing) was dichotomised as before or after 24 months old
for ease of interpretation.
Table 5.10 shows the age at which parents reported that their child started toothbrushing
and the age at which children were exposed to fluoridated toothpaste. Almost all children
brushed their teeth. Two thirds of children in the fluoridated area and over 70% children
in non-fluoridated area started toothbrushing practice after 24 months of age. When they
were asked when toothbrushing with toothpaste commenced, more than one third of
parents answered between 24 to 48 months of age. More children in fluoridated areas
started toothbrushing with toothpaste earlier (before 24 months of age). In contrast
children in the non-fluoridated area tended to brush teeth with toothpaste after 48 months
of age.
Page 189
171
Table 5.10 Age started toothbrushing and age exposed to fluoridated toothpaste among
study participants
Fluoridated (F)
n (%)
Non-fluoridated (NF)
n (%)
9
(n=313)
12
(n=294)
Total F
(n=607)
9
(n=247)
12
(n=301)
Total NF
(n=548)
Does your child brush
their teeth (n=1155)
Yes 312 (99.7 ) 294 (100) 606 (99.8) 246 (99.6) 301 (100) 547 (99.8)
No 1 (0.3) 0 1 (0.2) 1 (0.4) 0 1 (0.2)
Age started tooth
brushing (n=1144)
Before 24 months 116 (37.1) 98 (33.3) 214 (35.3) 65 (26.3) 88 (29.2) 153 (27.9)
After 24 months 197 (62.9) 196 (66.7) 393 (64.7) 181 (73.3) 213 (70.8) 394 (71.9)
Age when toothbrushing with
toothpaste started (n=1151)
Before 24 months 97 (31.0) 88 (29.9) 185 (30.5) 58 (23.5) 67 (22.3) 125 (22.8)
Between 24-48 months 147 (47.0) 138 (46.9) 285 (47.0) 98 (39.7) 134 (44.5) 232 (42.3)
After 48 months 64 (20.4) 66 (22.4) 130 (21.4) 88 (35.6) 100 (33.2) 188 (34.3)
Does not use toothpaste 3 (1.0) 2 (0.7) 5 (0.8) 1 (0.4) 0 1 (0.2)
Sums may not total 1155 due to missing response variables
Page 190
172
5.2.5 Oral hygiene habits when were aged less than six years-old
Parents were asked about their child’s oral hygiene habits using the same questions at
two time periods. The first period was when their child was aged less than six years-old.
These oral hygiene variables were potential contributing factors to the development of
dental fluorosis. The second period was their child oral hygiene habits at the time the
questionnaire was distributed (in 2015). These variables were potential factors associated
with caries prevention. Descriptive analysis of oral hygiene habits were described in this
Section 5.2.5 and also the following Section 5.2.6. The test of association between the
outcome measure and oral hygiene variables were described further in bivariate analyes
(Section 5.3.2.4).
Table 5.11 shows descriptive analysis on participants’ oral hygiene habits when they
were aged less than six years old. More than half of the children in the fluoridated area
were reported as having their teeth brushed twice a day. In comparison 35.6% to 45.5%
of children in the non-fluoridated area reported toothbrushing frequency twice a day
among both age groups respectively. Similar patterns of parental supervision in
toothbrushing activity were reported across birth cohorts and residency area. More than
half of parents reported daily tooth brushing supervision, with a slightly higher
proportion among parents in the fluoridated area.
A similar distribution of after toothbrushing routine was observed among both age
groups and residency area. Only a small proportion practiced the recommended routine
(spit after toothbrushing). The majority rinsed and spat after toothbrushing. About half
of the respondents reported that they sometimes had habits of eating/licking toothpaste.
About 39.1% to 41.5% of the respondents used a moderate amount of toothpaste when
brushing followed by pea size, smear size and large size. The pattern of such practice
Page 191
173
was similar across age groups and residency areas. Over 70% of respondents reported
using children’s fluoridated toothpaste for toothbrushing in their early life. About 10-
17% reported using non-fluoridated toothpaste, the highest proportion being 17.3% in
the younger age cohort in the fluoridated area.
Page 192
174
Table 5.11 Oral hygiene habits at age less than six years old among study participants
Oral hygiene habits at age less than 6 years old
Fluoridated (F)
n (%)
Non-fluoridated (NF)
n (%)
9
(n=313)
12
(n=294)
Total F
(n=607)
9
(n=247)
12
(n=301)
Total NF
(n=548)
Frequency of toothbrushing
(n=1149)
Less than once a day 13 (4.2) 7 (2.4) 20 (3.3) 23 (9.3) 16 (5.3) 39 (7.1)
Once a day 111 (35.5) 96 (32.7) 207 (34.1) 112 (45.3) 113 (37.5) 225 (41.1)
Twice a day 166 (53.0) 163 (55.4) 329 (54.2) 88 (35.6) 137 (45.5) 225 (41.1)
More than twice a day 22 (7.0) 26 (8.8) 48 (7.9) 22 (8.9) 34 (11.3) 56 (10.2)
Frequency of supervise
toothbrushing (n=1148)
Everyday 192 (61.3) 195 (66.3) 387 (63.8) 132 (53.4) 178 (59.1) 310 (56.6)
Sometimes 109 (34.8) 89 (30.3) 198 (32.6) 92 (37.2) 100 (33.2) 192 (35.0)
Never 2 (0.6) 5 (1.7) 7 (1.2) 6 (2.4) 7 (2.3) 13 (2.4)
Not sure 8 (2.6) 3 (1.0) 11 (1.8) 15 (6.1) 15 (5.0) 30 (5.5)
After brushing routine
(n=1148)
Just swallow 5 (1.6) 3 (1.0) 8 (1.3) 8 (3.2) 5 (1.7) 13 (2.4)
Rinse and swallow 15 (4.8) 11 (3.7) 26 (4.3) 10 (4.0) 11 (3.7) 21 (3.8)
Rinse and spit 273 (87.2) 263 (89.5) 536 (88.3) 210 (85.0) 261 (86.7) 471 (85.9)
Just spit 16 (5.1) 12 (4.1) 28 (4.6) 15 (6.1) 20 (6.6) 35 (6.4)
Don’t know 2 (0.6) 3 (1.0) 5 (0.8) 2 (0.8) 3 (1.0) 5 (0.9)
Eating/licking
toothpaste (n=1146)
Often 19 (6.1) 16 (5.4) 35 (5.8) 15 (6.1) 22 (7.3) 37 (6.8)
Sometimes 165 (52.7) 152 (51.7) 317 (52.2) 129 (52.2) 143 (47.5) 272 (49.6)
Never 126 (40.3) 123 (41.8) 249 (41.0) 101 (40.9) 135 (44.9) 236 (43.1)
Amount of toothpaste used
when brushing (n=1146)
Smear 65 (20.8) 44 (15.0) 109 (18.0) 58 (23.5) 47 (15.6) 105 (19.2)
Pea size 82 (26.2) 64 (21.8) 146 (24.1) 64 (25.9) 87 (28.9) 151 (27.6)
Moderate 120 (38.3) 132 (44.9) 252 (41.5) 94 (38.1) 120 (39.9) 214 (39.1)
Large (all bristles) 44 (14.1) 51 (17.3) 95 (15.7) 29 (11.7) 45 (15.0) 74 (13.5)
Type of toothpaste used
when brushing (n=1147)
Fluoridated adult
toothpaste
22 (7.0) 29 (9.9) 51 (8.4) 18 (7.3) 40 (13.3) 58 (10.6)
Fluoridated children
toothpaste
231 (73.8) 227 (77.2) 458 (75.5) 193 (78.1) 223 (74.1) 416 (75.9)
Non-fluoridated
toothpaste
54 (17.3) 30 (10.2) 84 (13.8) 28 (11.3) 29 (9.6) 57 (10.4)
Don’t know 3 (1.0) 6 (2.0) 9 (1.5) 6 (2.4) 8 (2.7) 14 (2.6)
Sums may not total 1155 due to missing response variables
Page 193
175
5.2.6 Oral hygiene habits at the time of study (in year 2015) among
study participants
Table 5.12 shows oral hygiene habits at the time of study in 2015. About 49% of children
in the non-fluoridated area and 60% of children in the fluoridated area reported that they
brushed their teeth twice a day.
Over 90% of children were reported as rinsing and spitting after toothbrushing. Only a
small proportion (2%) reported practiced the recommended routine, which to spit after
toothbrushing. The majority of them reported that they did not have a habit of
eating/licking tooothpaste. About 54.4% to 58.1% of 12 year-old children in both areas
were more likely to use a large amount of toothpaste in comparison to children in younger
age group who were more likely to use a moderate amount of toothpaste (49.4% to
50.8%).
The majority of children in both areas were more likely to use fluoridated adult toothpaste
in comparison to fluoridated children’s toothpaste.
Page 194
176
Table 5.12 Oral hygiene habits at the time of study (in 2015) among study participants
Oral hygiene habits at the time of study (in 2015)
Fluoridated (F)
n (%)
Non-fluoridated (NF)
n (%)
9
(n=313)
12
(n=294)
Total F
(n=607)
9
(n=247)
12
(n=301)
Total NF
(n=548)
Frequency of toothbrushing
(n=1149)
Less than once a day 4 (1.3) 3 (1.0) 7 (1.2) 7 (2.8) 2 (0.7) 9 (1.6)
Once a day 57 (18.2) 41 (13.9) 98 (16.1) 60 (24.3) 43 (14.3) 103 (18.8)
Twice a day 192 (61.3) 171 (58.2) 363 (59.8) 120 (48.6) 146 (48.5) 266 (48.5)
More than twice a day 57 (18.2) 77 (26.2) 134 (22.1) 59 (23.9) 110 (36.5) 169 (30.8)
Frequency of supervised
toothbrushing (n=1149)
Everyday 152 (48.6) 119 (40.5) 271 (44.6) 107 (43.3) 102 (33.9) 209 (38.1)
Sometimes 140 (44.7) 130 (44.2) 270 (44.5) 120 (48.6) 128 (42.5) 248 (45.3)
Never 11 (3.5) 33 (11.2) 44 (7.2) 11 (4.5) 49 (16.3) 60 (10.9)
Not sure 7 (2.2) 10 (3.4) 17 (2.8) 8 (3.2) 22 (7.3) 30 (5.5)
After brushing routine
(n=1148)
Just swallow 1 (0.3) 0 1 (0.2) 0 1 (0.3) 1 (0.2)
Rinse and swallow 3 (1.0) 1 (0.3) 4 (0.7) 4 (1.6) 3 (1.0) 7 (1.3)
Rinse and spit 301 (96.2) 283 (96.3) 584 (96.2) 235 (95.1) 284 (94.4) 519 (94.7)
Just spit 4 (1.3) 7 (2.4) 11 (1.8) 4 (1.6) 6 (2.0) 10 (1.8)
Don’t know 1 (0.3) 1 (0.3) 2 (0.3) 2 (0.8) 7 (2.3) 9 (1.6)
Eating/licking
toothpaste (n=1146)
Often 3 (1.0) 3 (1.0) 6 (1.0) 2 (0.8) 6 (2.0) 8 (1.5)
Sometimes 55 (17.6) 28 (9.5) 83 (13.7) 31 (12.6) 27 (9.0) 58 (10.6)
Never 250 (79.9) 260 (88.4) 510 (84.0) 213 (86.2) 268 (89.0) 481 (87.8)
Amount of toothpaste used
when brushing (n=1144)
Smear 6 (1.9) 4 (1.4) 10 (1.6) 3 (1.2) 3 (1.0) 6 (1.1)
Pea size 19 (6.1) 9 (3.1) 28 (4.6) 27 (10.9) 12 (4.0) 39 (7.1)
Moderate 159 (50.8) 119 (40.5) 278 (45.8) 122 (49.4) 110 (36.5) 232 (42.3)
Large (all bristles) 122 (39.0) 160 (54.4) 282 (46.5) 94 (38.1) 175 (58.1) 269 (49.1)
Type of toothpaste used
when brushing (n=1148)
Fluoridated adult
toothpaste
175 (55.9) 256 (87.1) 431 (71.0) 145 (58.7) 254 (84.4) 399 (72.8)
Fluoridated children
toothpaste
113 (36.1) 22 (7.5) 135 (22.2) 87 (35.2) 32 (10.6) 119 (21.7)
Non-fluoridated
toothpaste
17 (5.4) 11 (3.7) 28 (4.6) 9 (3.6) 10 (3.3) 19 (3.5)
Don’t know 4 (1.3) 3 (1.0) 7 (1.2) 5 (2.0) 5 (1.7) 10 (1.8)
Sums may not total 1155 due to missing response variables
Page 195
177
5.2.7 Exposure to fluoride varnish/gel
Parents were asked whether their children were exposed to fluoride varnish/gel by a
health professional before age six (Table 5.13). Only a small proportion of children were
reported as having received fluoride varnish/gel with a slightly higher percentage among
the 9 year-old children in the non-fluoridated area (17%). Almost one third of the parents
reported they didn’t know whether their children had such exposure.
Table 5.13 Exposure to fluoride varnish/gel before age six, among study participants
Fluoridated (F)
n(%)
Non-fluoridated (NF)
n (% )
9
(n=313)
12
(n=294)
Total F
(n=607)
9
(n=247)
12
(n=301)
Total NF
(n=548)
Exposure to
fluoride varnish
(n=1154)
Yes 35 (11.2) 38 (12.9) 73 (12.0) 42 (17.0) 39 (13.0) 81 (14.8)
No 202 (64.5) 168 (57.1) 370 (61.0) 134 (54.3) 156 (51.8) 290 (52.9)
Don’t know 76 (24.3) 87 (29.6) 163 (26.9) 71 (28.7) 106 (35.2) 177 (32.3)
Sums may not total 1155 due to missing response variables
Page 196
178
Dental fluorosis
The prevalence of dental fluorosis based on the percentage of children having fluorosis
on their maxillary central incisors was determined. This was recorded by consensus
scoring of digital photographs by three examiners (Section 4.6.7.2). Fluorosis cases were
defined by two cut off points. Dean’s score equals “questionable or greater” is reported
as any fluorosis (Dean’s>0). Dean’s score of very mild or greater” is reported as fluorosis
(Dean’s ≥ 2). The fluorosis (Dean’s ≥ 2) case definition was used for bivariate analysis
and multivariate logistic regression.
When testing for association between independent variables and fluorosis, data were
combined for both age groups in both areas. Separate bivariate analysis between
independent variables and fluorosis was also performed for each area, however limited
difference was observed. These data are presented in Appendix 32 and are not reported
in the main results section.
5.3.1 The prevalence and severity of dental fluorosis among study
participants
Table 5.14 shows the distribution of dental fluorosis in fluoridated and non-fluoridated
areas. A clear difference in the proportion of children affected between the fluoridated
and non-fluoridated communities is apparent. In the fluoridated area, the most common
type of fluorosis severity was “very mild” followed by mild, moderate and questionable
categories for both age groups. In the non-fluoridated area, the most common level of
fluorosis severity was “very mild” for the 9 year-old and “questionable” for the 12 year-
old. None of the participants had severe fluorosis.
Page 197
179
Table 5.14 Fluorosis distribution among study participants based on the consensus
photographic score on maxillary central incisors
Fluoridated n (%) Non-fluoridated n (%)
Fluorosis
Dean’s
Score
12 9 Total 12 9 Total
(0) Normal 161 (54.8) 181 (57.8) 342 (56.3) 271 (89.7) 224 (90.7) 494 (90.1)
(1) Questionable 18 (6.1) 23 (7.3) 41 (6.8) 17 (5.6) 6 (2.4) 23 (4.2)
(2) Very mild 48 (16.3) 47 (15.0) 95 (15.7) 10 (3.3) 13 (5.3) 23 (4.2)
(3) Mild 33 (11.2) 32 (10.2) 65 (10.7) 3 (1.0) 2 (0.8) 5 (0.9)
(4) Moderate 32 (10.9) 21 (6.7) 53 (8.7) 1 (0.3) 1 (0.4) 2 (0.4)
(5) Severe 0 0 0 0 0 0
Not able to scorea 2 (0.7) 9 (2.9) 11 (1.8) 0 1 (0.4) 1 (0.2)
Total 294 (100) 313 (100) 607 (100) 301 (100) 247 (100) 548 (100)
a ‘Not able to score’ photos were excluded from further analysis
Page 198
180
Table 5.15 shows the prevalence of fluorosis defined by Dean’s>0 and Dean’s≥ 2 in
fluoridated and non-fluoridated areas. When both age groups were combined, fluorosis
prevalence was significantly higher in fluoridated area than non-fluoridated area
(p<0.001). Similar results were observed for both fluorosis case definitions.
Table 5.15 The prevalence of fluorosis by area of residence
Area Any
fluorosis
Normal p valuea Fluorosis Normal p valuea
(Dean’s > 0)
n (%)
(Dean’s=0)
n (%)
(Dean’s ≥ 2)
n (%)
Dean’s=0)
n (%)
Fluoridated 254 (42.6) 342 (56.3) 0.001 213 (35.7) 383 (64.3) 0.001
Non-
fluoridated
53 (9.7) 494 (90.3) 30 (5.5) 519 (94.5)
aChi square analysis between children living in different areas.
Page 199
181
Table 5.16 shows the prevalence of fluorosis by fluoridation status and age group. In the
fluoridated area, regardless of which outcome measure is used (Deans>0, Deans≥2), the
prevalence of fluorosis was higher among the 12 year-old cohort (38.4% to 44.6%)
compared to the 9 year-old cohort (31.9% to 39.3%). However, the difference was not
statistically significant. In the non-fluoridated area, fluorosis prevalence was higher in
the older age group when case was defined by any fluorosis but the difference was not
statistically significant.
Table 5.16 The prevalence of fluorosis by age group and area of residence
aChi square analysis between 9 and 12 year old children living in the same area.
bThe 12 year-old cohort were exposed to 0.7ppmF in the first two years of life and 0.5ppmF
lifetime. The 9 year-old cohort were exposed to 0.5ppmF lifetime.
Any fluorosis
(Dean’s > 0)
n (%)
p valuea Fluorosis
(Dean’s ≥ 2)
n (%)
p valuea
12 9 12 9
Born 2003 Born 2006 Born 2003 Born 2006
Fluoridatedb 131 (44.6) 123 (39.3) 0.277 113 (38.4) 100 (31.9) 0.139
Non-
fluoridated
3 (10.3) 22 (8.9) 0.594 14 (4.7) 16 (6.5) 0.344
Page 200
182
5.3.2 The relationship between risk factors and dental fluorosis
Bivariate analysis was conducted to assess risk factors (as described in earlier Sections
4.7.2.2) and dental fluorosis (Deans≥2). A relationship between a change in fluoride
concentration in the water and fluorosis is described first, followed by association
between other risk factors and fluorosis. When reporting results from bivariate analysis
on fluorosis outcome, the other risk factors were divided into four sub-sections
(demographic characteristics, infant feeding practices oral hygiene practices at aged less
than six years-old, exposure to fluoride varnish/gel). Independent variables were di or
trichotomised prior to bivariate analysis as described in Section 4.7.2.1 Significant
variables from the bivariate analysis were subsequently used in the multivariate analysis
as described in Section 4.7.2.2.
Relationship between a change in the concentration of fluoride in the
water supply and the prevalence of fluorosis
Results in this section aim to answer the primary research question of this work, whether
a change in fluoride level of the public water supply has an impact on the prevalence of
dental fluorosis.
This study was a single point study that compared children in two age groups that were
exposed to different fluoride levels, where a change in the fluoride level occurred during
the period of enamel development. A non-fluoridated area was used as a control group.
The ‘baseline’ prevalence data were extracted from the groups that were exposed to the
old fluoride concentration and the ‘after’ prevalence data were extracted from the group
Page 201
183
that were exposed to the new fluoride level after reduction occurred. Both definitions of
fluorosis prevalence (Deans>0, Deans≥2) were analysed.
Table 5.17 shows that any fluorosis prevalence decreased following reduction of fluoride
level in the water in fluoridated and non-fluoridated area. Reducing fluoride level in the
water has resulted in a narrowing of the any fluorosis prevalence between fluoridated
and control areas. This implies that the decrease in fluorosis prevalence corresponds with
the reduction (0.2 ppm) of fluoride in the drinking water during the time of enamel
development.
Table 5.17 Proportion of any fluorosis prevalence (Deans>0) after fluoride concentration
in the water supply was reduced
% prevalence
12 year-old
(Pre_reduction)
% prevalence
9 year-old
(Post_reduction)
%
difference
(post-pre)#
%
difference
(pre)
%
difference
(post)
Outcome: Any fluorosis (Deans>0)
Fluoridated 44.6 39.3 -5.3 34.3 30.4
Non-fluoridated
(control)
10.3 8.9 -1.4
#Percentage (%) difference= (PostReduction - PreReduction). A negative difference shows that
the % fluorosis prevalence decreased after reduction of fluoride level in the water.
Percentage (%) difference (pre)=PreReductionIntervention - PreReductionControl.
Percentage (%) difference (post) =PostReductionIntervention – PostReductionControl.
Page 202
184
A similar trend was observed when fluorosis case was defined by (Deans≥2). Accounting
for the change between intervention and control groups at baseline and follow up, the
magnitude of the percentage difference was larger pre-reduction than the post-reduction
group (Table 5.18). This implies a beneficial effect of lowering the fluoride level in the
water in reducing fluorosis prevalence.
Table 5.18 Proportion of fluorosis prevalence (Deans≥2) after fluoride concentration in
the water supply was reduced
% prevalence
12 year-old
(Pre_reduction)
% prevalence
9 year-old
(Post_reduction)
%
difference
(post-pre)#
%
difference
(pre)
%
difference
(post)
Outcome: Fluorosis (Deans≥2)
Fluoridated 38.4 31.9 -6.5 33.7 25.4
Non-fluoridated
(control)
4.7 6.5 1.8
#Percentage (%) difference= (PostReduction - PreReduction). A negative difference shows that
the % fluorosis prevalence decreased after reduction of fluoride level in the water.
Percentage (%) difference (pre)=PreReductionIntervention - PreReductionControl.
Percentage (%) difference (post) =PostReductionIntervention – PostReductionControl.
Page 203
185
Table 5.19 shows the bivariate analysis between the prevalence of fluorosis and different
fluoride exposures from the water in the study participants. For both outcome measures,
children who were exposed to 0.7 ppmF in the first two years of life and then 0.5 ppmF
thereafter were 8 to 11 times more likely to develop fluorosis than those who did not
have any exposure. Those who had been exposed to 0.5 ppmF in the local water supply
throughout life were 6 to 8 times more likely to have in fluorosis compared to the non-
fluoridated reference group. Among those living in the fluoridated area, children who
had been exposed to 0.7 ppmF in the first two years of life and then 0.5 ppmF thereafter
had a higher fluorosis prevalence than those exposed to 0.5 ppmF throughout life but the
difference was not statistically significant.
Page 204
186
Table 5.19 Bivariate analysis of fluorosis prevalence with fluoride exposure from the water in the study participants
Exposure to
fluoride in the
water supply
Fluorosis
Deans≥ 2
n (%)
Unadjusted
Odds ratio
95% CI
p value Any fluorosis
Deans>0
n (%)
Unadjusted
Odds ratio
95% CI
p value
Yes No Yes No
0 lifetime 30 (12.30 517 (57.4) Ref 53 (9.7) 494 (90.3) Ref
0.5ppmF lifetime 100 (41.2) 204 (22.7) 8.45 (5.45-13.10) 0.001 123 (40.5) 181 (59.5) 6.33 (4.40-9.12) 0.001
0.7ppmF for first
2 years and then
0.5ppmF
113 (46.5) 179 (19.9) 10.88 (7.03-
16.84)
0.001 131 (44.9) 161 (55.1) 7.58 (5.26-10.93) 0.001
Ref: reference group
Page 205
187
Relationship between the prevalence of fluorosis and demographic
characteristics of study participants
Table 5.20 presents a bivariate analysis of the prevalence of fluorosis and the
demographic characteristics of the study participants. Girls had a marginally higher
prevalence of fluorosis (22.2%) compared to boys (20%), however the difference was
not statistically significant. Children whose parents had only primary school education
or lower had significantly lower fluorosis prevalence than those whose parents had a
college/university education. Children whose parents had a low monthly income had
significantly lower fluorosis prevalence than those whose parents had high monthly
income.
Page 206
188
Table 5.20 Bivariate analysis of fluorosis prevalence and demographic characteristics of
study participants
Variables
Fluorosis (Deans≥2)
n (%)
Odds ratio
95% CI
p value
Yes No
Gender
Boys 98 (20.0) 393 (80.0) Ref
Girls 145 (22.2) 507 (77.8) 1.15 (0.86-1.53) 0.351
Age
12 year-old 127 (21.4) 466 (78.6) Ref
9 year-old 116 (21.1) 434 (78.9) 0.98 (0.74-1.30) 0.893
Father Education
College/University 60 (24.0) 190 (76.0) Ref
High school 151 (21.7) 546 (78.3) 0.88 (0.62-1.23) 0.447
≤Primary school 12 (11.8) 90 (88.2) 0.42 (0.22-0.82) 0.011
Mother
Education
College/University 68 (23.4) 223 (76.6) Ref
High school 145 (21.3) 535 (78.7) 0.49 (0.64-1.23) 0.481
≤Primary school 14 (12.8) 95 (87.2) 0.48 (0.26-0.90) 0.022
Father monthly
income
≥ MYR 4000 88 (27.2) 235 (72.8) Ref
MYR 1000-3999 131 (18.7) 569 (81.3) 0.62 (0.45-0.84) 0.002
<MYR 1000 2 (7.4) 25 (92.6) 0.21 (0.05-0.92) 0.038
Mother monthly
income
≥ MYR 4000 61 (29.0) 149 (71.0) Ref
MYR 1000-3999 60 (22.1) 212 (77.9) 0.69 (0.46-1.05) 0.080
<MYR 1000 104 (17.1) 504 (82.9) 0.50 (0.35-0.73) 0.000
Ref: reference group
Page 207
189
Relationship between the prevalence of fluorosis and infant feeding
practices
Table 5.21 shows the bivariate association between the prevalence of fluorosis and infant
feeding practices. Children who used infant formula were 2.93 times more likely to have
fluorosis (p<0.001). Children who started formula at an earlier age (12 months or less),
finished formula at a later age (after 48 months) and had longer duration of formula use
(more than 48 months) were significantly associated with a higher fluorosis prevalence.
Children who were breast-fed only had a significantly lower fluorosis prevalence than
those who used formula only. Infant formula reconstituted with tap water or filtered tap
water were significantly associated with high fluorosis prevalence compared to those
who used non-tap water (bottle and other sources). In terms of type of water used to
prepare infant formula, further inspection on separate bivariate analysis between this
independent variables and fluorosis for each area were performed. Data were presented
in Appendix 32. Results shows that residents in fluoridated area who prepared infant
formula with tap water or filtered tap water had significantly higher fluorosis prevalence
compared to those who use non-tap water. No statistical significant difference observed
among residents in non-fluoridated area.
Page 208
190
Table 5.21 Bivariate analysis of fluorosis prevalence and infant feeding practices in the
study participants
Variables
(Infant feeding
practices)
Fluorosis (Deans≥2)
n (%)
Odds ratio
95% CI
p value
Yes No
Use of infant
formula
No 32 (10.4) 277 (89.6) Ref
Yes 210 (25.3) 621 (74.7) 2.93 (1.97-4.36) < 0.001
Breast feeding
No 8 (29.6) 19 (70.4) Ref
Yes 235 (21.1) 881 (78.9) 0.63 (0.27-1.47) 0.286
Age finished breast
feeding
>12 months 104 (15.3) 574 (84.7) Ref
≤12 months 132 (29.9) 309 (70.1) 2.36 (1.76-3.16) < 0.001
Age started formula
>12 months 70 (20.8) 267 (79.2) Ref
≤12 months 145 (28.8) 359 (71.2) 1.54 (1.11-2.14) 0.009
Age finished
formula
>48 months 125 (29.2) 303 (70.8) Ref
≤48 months 89 (21.8) 319 (78.2) 0.68 (0.49-0.93) 0.014
Type of water used
to prepare formula
Bottled water 3 (9.4) 29 (90.6) Ref
Tap water 162 (25.7) 469 (74.3) 3.34 (1.0-11.11) 0.049
Filtered tap water 47 (28.1) 120 (71.9) 3.79 (1.1-13.03) 0.035
Duration of formula
use
>48 months 85 (32.8) 174 (67.2) Ref
≤48 months 125 (22.0) 443 (78.0) 0.58 (0.42-0.80) 0.001
Feeding method
Formula only 8 (29.6) 19 (70.4) Ref
Combine breast &
formula
202 (25.1) 602 (74.9) 0.80 (0.34-1.85) 0.597
Breast only 32 (10.4) 277 (89.6) 0.27 (0.11-0.68) 0.005
Ref: reference group
Page 209
191
Relationship between the prevalence of fluorosis and oral hygiene habits
at age less than six years
The association between fluorosis prevalence and oral hygiene habits at age less than six
years were chosen (over oral hygiene habits at the time of study) based on the exposure
to fluoride during developmental stages of central incisors. There was some variation in
terms of early childhood oral hygiene practices with fluorosis status, however the
associations were not statistically significant (Table 5.22).
Page 210
192
Table 5.22 Bivariate analysis of fluorosis prevalence and oral hygiene habits at age less
than six years among study participants
Variables
(Oral hygiene habits at
age less than 6 years)
Fluorosis (Deans≥2)
n (%)
Odds ratio
95% CI
p value
Yes No
Frequency of
toothbrushing
Twice/day or more 138 (21.1) 516 (78.9) Ref
Once /day or less 104 (21.5) 379 (78.5) 1.03 (0.77-1.37) 0.861
Supervised toothbrushing
Never 4 (20.0) 16 (80.0) Ref
Yes 234 (21.8) 841 (78.2) 1.11 (0.37-3.36) 0.849
Habits after
toothbrushing
Spat 227 (21.5) 831 (78.5) Ref
Swallowed 13 (19.1) 55 (80.9) 0.87 (0.47-1.61) 0.648
Eating/ licking
toothpaste
Never 110 (22.8) 372 (77.2) Ref
Yes 131 (20.1) 521 (79.9) 0.85 (0.64-1.13) 0.267
Amount of toothpaste
used
Medium to large 134 (21.2) 497 (78.8) Ref
Small 107 (21.3) 396 (78.7) 1.00 (0.75-1.33) 0.988
Type of toothpaste used
Non-fluoridated
toothpaste
28 (20.1) 111 (79.9) Ref
Fluoridated toothpaste 210 (21.6) 763 (78.4) 1.09 (0.70-1.70) 0.700
Age started
toothbrushing
After 2 years 161 (20.7) 618 (79.3) Ref
Before 2 years 82 (22.6) 281 (77.4) 1.12 (0.83-1.51) 0.460
Age started
toothbrushing with
toothpaste
After 2 years 172 (20.7) 657 (79.3) Ref
Before 2 years 68 (22.3) 237 (77.7) 1.10 (0.80-1.51) 0.572
Ref: reference group
Page 211
193
Relationship between the prevalence of fluorosis and exposure to fluoride
varnish/gel
Table 5.23 shows the bivariate association between the prevalence of fluorosis and
exposure to fluoride varnish or gel before age six years old. Results indicated that those
who did not receive fluoride varnish/gel had slightly higher fluorosis. However the
difference was not significant.
Table 5.23 Bivariate analysis of fluorosis prevalence and exposure to fluoride gel/varnish
among study participants
Variable Fluorosis (Deans≥2)
n (%)
Odds ratio
95% CI
p value
Yes No
Exposure to fluoride
varnish/gel
No 147 (22.6) 503 (77.4) Ref
Yes 28 (18.2) 126 (81.8) 0.76 (0.49-1.19) 0.231
Ref: reference group
Page 212
194
5.3.3 Multivariate logistic regression models for having fluorosis
(Deans≥2)
Binary logistic regression model using the Enter method was generated for the
prevalence of fluorosis defined by Deans score ≥ 2. Significant variables from the
bivariate analysis were entered into the model as a block. Results were presented as
adjusted odds ratios and 95% confidence intervals.
Table 5.24 shows the multivariate logistic regression model for the prevalence of
fluorosis. Father’s and mother’s education level, father’s and mother’s monthly income,
fluoride exposure from the water, use of infant formula, age finished breast feeding, age
started formula, age finished formula, type of water used to reconstitute formula, duration
of formula use and type of feeding method were contributing factors to the model.
After controlling other factors in the model, exposure to fluoride from the water and type
of water used to reconstitute the infant formula remained significantly associated with
having higher fluorosis prevalence. Children who had been exposed to fluoridated water
had 6 to 9 times the prevalence of dental fluorosis compared to those who did not have
any exposure. Children who had exposed to (0.7ppmF in the first two years of life then
0.5ppmF lifetime) had higher odds of having fluorosis than those who had exposed to
lower fluoride level (0.5ppmF) throughout life. Infant formula reconstituted with tap
water or filtered tap water had 8.78 to 9.90 times the prevalence of fluorosis compared
to those who used non-tap water. Other factors were not significantly associated with
fluorosis in the model.
Page 213
195
Table 5.24 Multivariate logistic regression model for having fluorosis (Deans≥2)
Explanatory
variable
Adjusted
Odds ratio
(95% CI)
p
value
Fluoride level in the water
0 lifetime Ref
0.5 ppmF
lifetime
5.97
(3.32-10.72) 0.000
0.7 ppmF in the
first two years
of life, then 0.5
ppmF
9.12
(5.15-16.14) 0.000
Father education
College/
University
Ref
High school 0.85
(0.50-1.43)
0.532
≤Primary school 0.74
(0.27-2.04)
0.565
Mother Education
College/
University
Ref
High school 1.44
(0.83-2.53)
0.198
≤Primary school 1.09
(0.37-3.19)
0.872
Father income
≥ RM 4000 Ref
RM1000-3999 0.93
(0.57-1.51)
0.766
<RM 1000 0.29
(0.06-1.54)
0.147
Mother income
≥ RM 4000 Ref
RM1000-3999 0.91
(0.48-1.71)
0.763
<RM 1000 0.84
(0.47-1.51)
0.558
Ref: reference group
Explanatory
variable
Adjusted
Odds ratio
(95% CI)
p
value
Infant formula
No Ref
Yes 0.68
(0.02-23.14)
0.831
Age finished breast feeding
>12 months Ref
≤12 months 1.40
(0.85-2.32)
0.188
Age started formula
>12 months Ref
≤12 months 1.10
(0.63-1.92)
0.726
Age finished formula
>48 months Ref
≤48 months 1.00
(0.57-1.75)
0.998
Type of water used to prepare
formula
Bottled water Ref
Tap water 9.90
(1.28-76.38) 0.028
Filtered tap
water
8.78
(1.11-69.71) 0.040
Duration of formula use
>48 months Ref
≤48 months 0.98
(0.54-1.78)
0.955
Feeding method
Formula only Ref
Combine breast
& formula
0.26
(0.01-5.32)
0.378
Breast only - -
Page 214
196
Dental Caries
Caries experience was analysed at tooth level and surface level for both primary and
permanent dentitions. The results were also analysed by age group and area of residence.
Mean caries experience was calculated at three different ICDAS cut-off points; (d/D1-3)
for enamel caries, (d/D4-6) for dentine caries, and (d/D1-6) caries at all levels (that is both
enamel and dentine caries). A comparison of the ICDAS scoring system with the
conventional caries index is shown in Appendix 2. The caries experience of the
permanent dentition at dentine level (D4-6MFT) and caries at all levels (D1-6MFT) were
used for bivariate and multivariate logistic regression.
Caries results are reported in the following sections as caries prevalence, followed by
bivariate and multivariate analyses between risk factors and dental caries.
5.4.1 Prevalence and severity of dental caries in study participants
This section addresses the prevalence and severity of dental caries among study
participants. Results for caries experience are presented based on different level of caries
severity by age group and area of residence. Prevalence of fissure sealants is also
described in the subsequent section (5.4.2.3).
The use of ICDAS as a caries index allowed comparison of enamel and dentine caries
between areas. To ease interpretation between enamel and dentine caries, a ratio
calculation was also used. The ratio between enamel and dentine caries was calculated
by dividing the mean enamel caries (d/D1-3) by the mean dentine caries (d/D4-6) scores.
Page 215
197
Mean caries experience in the permanent dentition
Mean caries experience in the permanent dentition at tooth level
At tooth level, regardless of which level of diagnosis is used, the mean caries experience
in the permanent dentition was significantly lower in the fluoridated area than the non-
fluoridated area for both age groups (p<0.05) (Table 5.25). The enamel caries prevalence
was higher than the dentine caries prevalence for both age groups and area of residence.
When enamel caries lesions were included, the mean DMFT score increased by 2 to 4
times more than when only dentine caries lesions were included among all study
participants. The prevalence of filled teeth was three times higher in non-fluoridated
areas for both age groups and the differences were significant (p<0.001). Missing teeth
due to extraction was also higher among children in the non-fluoridated area and the
difference was significant in 12 year-old children.
Page 216
198
Table 5.25 Mean caries experience of permanent dentition at tooth level and at different
severity of caries for 9 and 12 years-old Malaysian children in fluoridated and non-
fluoridated areas
Age/
Area
D1-3
Mean
(SD)
D4-6
Mean
(SD)
D1-6
Mean
(SD)
M
Mean
(SD)
F
Mean
(SD)
D1-3MFT
Mean
(SD)
D4-6MFT
Mean
(SD)
D1-6MFT
Mean
(SD)
9 year-old cohort
9 F
(n=313)
0.75
(1.08)
0.22
(0.75)
0.97
(1.42)
0.01
(0.08)
0.17
(0.57)
0.93
(1.24)
0.40
(0.96)
1.15
(1.55)
9 NF
(n=247)
0.71
(1.10)
0.24
(0.63)
0.96
(1.37)
0.03
(0.25)
0.45
(0.88)
1.20
(1.46)
0.73
(1.17)
1.44
(1.70)
p valuea
0.646 0.319 0.980 0.142 <0.001 0.043 <0.001 0.021
12 year-old cohort
12 F
(n=294)
1.54
(1.92)
0.13
(0.47)
1.67
(2.04)
0 0.34
(0.80)
1.88
(2.07)
0.47
(0.97)
2.01
(2.19)
12 NF
(n=301)
1.52
(1.62)
0.26
(0.70)
1.78
(1.90)
0.02
(0.16)
1.03
(1.52)
2.57
(2.47)
1.31
(1.81)
2.83
(2.74)
p valuea
0.506 0.006 0.175 0.027 <0.001 <0.001 <0.001 <0.001
aMann Whitney test, association between mean caries by age group and residency area.
F: fluoridated area, NF: non-fluoridated area
D1-3=enamel caries; D4-6=dentine caries; D1-6= caries at all levels of severity.
Page 217
199
Table 5.26 shows ratio of enamel to dentine caries at tooth level in permanent dentition
by age group and area of residence. In both age groups, the ratio of enamel to dentine
caries was higher in the fluoridated than non-fluoridated areas [9 year-old: 3.41 (F) vs
2.96 (NF) and 12-year old: 11.85 (F) vs 5.85 (NF)].
Table 5.26 Ratio of enamel (D1-3) to dentine (D4-6) caries in permanent
dentition at tooth level by age group and area of residence
Age/Area Mean D1-3/ Mean D4-6 Ratio enamel to
dentine caries
9 year-old cohort
9F 0.75/0.22 3.41
9NF 0.71/0.24 2.96
12 year-old cohort
12F 1.54/0.13 11.85
12NF 1.52/0.26 5.85
Page 218
200
Mean caries experience in the permanent dentition at surface level
A similar caries pattern was observed for caries experience in the permanent dentition at
surface level as shown in Table 5.27. The mean caries experience was significantly
higher in children in the non-fluoridated area than children in the fluoridated area for
both age groups (p<0.05). When enamel caries were included, the mean DMFS score
increased by 1.75 to 4 times more than when only dentine lesions were included. The
prevalence of filled surfaces was higher in the non-fluoridated area for the 12 year-old
cohort and the differences were statistically significant (p<0.001). In contrast, the
prevalence of filled surfaces was higher in the fluoridated area among the 9 year-old
cohort and the differences were statistically significant (p<0.001). In terms of missing
teeth due to caries, the prevalence was higher among children in the non-fluoridated area
and the difference was significant in 12 year-old cohort.
Page 219
201
Table 5.27 Mean caries experience of permanent dentition at surface level and at different
degree of caries for 9 and 12 years-old Malaysian children in fluoridated and non-
fluoridated areas
Age/ Area D1-3
(SD)
D4-6
(SD)
D1-6
(SD)
M
(SD)
F
(SD)
D1-3MFS
(SD)
D4-6MFS
(SD)
D1-6MFS
(SD)
9 year-old cohort
9F
(n=313)
0.88
(1.42)
0.44
(1.67)
1.32
(2.27)
0.03
(0.32)
0.22
(0.72)
1.13
(1.66)
0.68
(1.86)
1.57
(2.43)
9 NF
(n=247)
0.89
(1.48)
0.43
(1.24)
1.32
(2.07)
0.55
(1.16)
0.17
(1.22)
1.61
(2.41)
1.14
(2.11)
2.03
(2.81)
p valuea
0.975 0.341 0.805 0.075 <0.001 0.032 <0.001 0.022
12 year-old cohort
12 F
(n=294)
1.90
(2.37)
0.22
(0.98)
2.12
(2.67)
0 0.38
(0.95)
2.28
(2.63)
0.61
(1.46)
2.50
(2.95)
12 NF
(n=341)
1.92
(2.17)
0.31
(0.87)
2.23
(2.52)
0.10
(0.81)
1.37
(2.27)
3.40
(3.73)
1.78
(2.91)
3.70
(4.12)
p valuea
0.416 0.007 0.159 0.027 <0.001 <0.001 <0.001 <0.001
aMann Whitney test, association between mean caries by age group and residency area.
F: fluoridated area, NF: non-fluoridated area
D1-3=enamel caries; D4-6=dentine caries; D1-6= caries at all levels of severity.
Page 220
202
Table 5.28 shows ratio of enamel to dentine caries at surface level in permanent dentition
by age group and area of residence. In the 9 year-old cohort, the ratio of enamel to dentine
caries was higher in the non-fluoridated areas [2.00 (F) vs 2.07 (NF)]. However, in the
12 year-old cohort, the ratio enamel to dentine caries was higher in the fluoridated area
[8.64 (F) vs 6.20 (NF)].
Table 5.28 Ratio of enamel (D1-3) to dentine (D4-6) caries in permanent
dentition at surface level by age group and area of residence
Age/Area Mean D1-3/ Mean D4-6 Ratio enamel to
dentine caries
9 year-old cohort
9F 0.88/0.44 2.00
9NF 0.89/0.43 2.07
12 year-old cohort
12F 1.90/0.22 8.64
12NF 1.92/0.31 6.20
Page 221
203
5.4.2 Mean caries experience in the primary dentition of study
participants
Mean caries experience in the primary dentition at tooth level
Table 5.29 shows the mean caries experience in the primary dentition of study
participants. At tooth level, the mean caries experience was lower in the fluoridated area
than the non-fluoridated area except for mean caries experience at enamel level (d1-3mft)
in 12 year-olds. Although the mean caries experience was higher among children in the
non-fluoridated area, the statistical significant association was only observed between
mean caries at dentine level for both age groups and mean caries at all levels of severity
for the 9 year-old cohort. The number of teeth missing due to caries was 3 times higher
among 9 year-old children in the non-fluoridated area than those in the fluoridated area
and the difference was significant (p<0.001). In both age groups, the mean number of
filled teeth was slightly higher among children in the fluoridated area than the non-
fluoridated area but the difference was not statistically significant.
Page 222
204
Table 5.29 Mean caries experience of primary dentition at tooth level and at different
severity of caries for 9 and 12 years-old Malaysian children in fluoridated and non-
fluoridated areas
Age/
Area
d1-3
(SD)
d4-6
(SD)
d1-6
(SD)
m
(SD)
f
(SD)
d1-3mft
(SD)
d4-6mft
(SD)
d1-6mft
(SD)
9 year-old cohort
9 F
(n=313)
0.92
(1.26)
2.49
(2.69)
3.42
(2.81)
0.24
(0.72)
0.77
(1.17)
1.93
(1.78)
3.50
(2.99)
4.42
(3.06)
9 NF
(n=247)
0.77
(1.05)
4.51
(3.17)
5.29
(3.15)
0.70
(1.32)
0.65
(1.03)
2.12
(1.77)
5.86
(3.32)
6.63
(3.24)
p valuea 0.338 <0.001 <0.001 <0.001 0.387 0.152 <0.001 <0.001
12 year-old cohort
12 F
(n=294)
0.54
(0.99)
0.85
(1.19)
1.40
(1.49)
0 0.19
(0.44)
0.73
(1.17)
1.04
(1.30)
1.58
(1.65)
12 NF
(n=301)
0.42
(0.79)
1.26
(1.48)
1.68
(1.64)
0 0.15
(0.41)
0.56
(0.87)
1.41
(1.48)
1.82
(1.62)
p valuea 0.585 0.023 0.127 - 0.404 0.653 0.036 0.126
aMann Whitney test, association between mean caries among children in fluoridated and non
fluoridated area.
F: fluoridated area, NF: non-fluoridated area
d1-3=enamel caries; d4-6=dentine caries; d1-6= caries at all levels of severity
Page 223
205
In contrast to the permanent dentition, the ratio of enamel to dentine caries was lower in
non-fluoridated than fluoridated area for both age groups [9 year-olds:0.37 (F) vs 0.17
(NF) and 12 year-olds: 0.64 (F) vs 0.33 (NF)]. Results are presented in
Table 5.30.
Table 5.30 Ratio of enamel (d1-3) to dentine (d4-6) caries in primary
dentition at tooth level
Age/Area Mean d1-3/ Mean d4-6 Ratio enamel to
dentine caries
9 year-old cohort
9F 0.92/2.49 0.37
9NF 0.77/4.51 0.17
12 year-old cohort
12F 0.54/0.85 0.64
12NF 0.42/1.26 0.33
Page 224
206
Mean caries experience in the primary dentition at surface level
Table 5.31 shows the mean caries experience in the primary dentition of study
participants at surface level. In contrast to the permanent dentition, the dentine caries
prevalence was higher than the enamel caries prevalence among children in both age
groups and area of residence. Missing surfaces due to caries were higher among 9 year-
old children in the non-fluoridated area and the difference was statistically significant
(p<0.001).
Table 5.31 Mean caries experience of primary dentition at surface level and at different
degree of severity caries for 9 and 12 years-old Malaysian children in fluoridated and
non-fluoridated areas
Age/
Area
d1-3
(SD)
d4-6
(SD)
d1-6
(SD)
m
(SD)
f
(SD)
d1-3mfs
(SD)
d4-6mfs
(SD)
d1-6mfs
(SD)
9 year-old cohort
9F
(n=313)
1.47
(1.81)
5.45
(7.90)
6.92
(7.93)
1.04
(3.17)
1.06
(1.70)
3.58
(4.07)
7.55
(8.79)
9.02
(8.80)
9 NF
(n=247)
1.32
(1.51)
11.00
(10.55)
12.32
(10.46)
3.32
(6.28)
1.00
(1.48)
5.63
(6.16)
15.32
(12.55)
16.63
(12.34)
p valuea
0.776 <0.001 <0.001 <0.001 0.916 <0.001 <0.001 <0.001
12 year-old cohort
12F
(n=294)
0.78
(1.44)
1.67
(2.99)
2.46
(3.21)
0 0.24
(0.55)
1.02
(1.67)
1.91
(3.15)
2.69
(3.41)
12NF
(n=301)
0.58
(1.12)
2.96
(4.49)
3.54
(4.52)
0 0.25
(0.70)
0.83
(1.28)
3.21
(4.52)
3.79
(4.54)
p valuea 0.859 0.007 0.019 - 0.831 0.837 0.006 0.013
aMann Whitney test, association between mean caries among children in fluoridated and non-
fluoridated area.
d1-3=enamel caries; d4-6=dentine caries; d1-6= caries at all levels.
Page 225
207
Similar to caries experience at tooth level, the ratio of enamel to dentine caries was lower
in the non-fluroidated than the fluoridated area for both age groups [9 year-olds: 0.27 (F)
vs 0.12 (NF) and 12 year-olds:0.47 (F) and 0.20 (NF)]. Results are presented in Table
5.32.
Table 5.32 Ratio of enamel (D1-3) to dentine (D4-6) in primary
dentition at surface level by age group and area of residence
Age/Area Mean d1-3/
Mean d4-6
Ratio enamel
to dentine
caries
9 year-old cohort
9F 1.47/5.45 0.27
9NF 1.32/11.00 0.12
12 year-old cohort
12F 0.78/1.67 0.47
12NF 0.58/2.96 0.20
Page 226
208
Percentage caries prevalence in study participants
In terms of percentage caries prevalence, dentine caries (D4-6MFT>0, d4-6mft>0) and
caries at all levels (D1-6MFT>0, d4-6mft>0) were used as the outcome measures and
dichotomised into the absence and presence of the disease. Caries prevalence at dentine
level or at all levels was significantly higher among children in the non-fluoridated area
than those in the fluoridated area (Table 5.33).
Table 5.33 Caries prevalence among 9 and 12 years-old Malaysian children in fluoridated
and non-fluoridated areas
Permanent Primary
Age/ Area D1-6MFT>0
%
D4-6MFT>0
%
d1-6mft>0
%
d4-6mft>0
%
9 year-old cohort
9 F
(n=313)
54.0 24.6 89.2 79.1
9 NF
(n=247)
62.3 40.2 98.3 96.2
p valuea 0.047 <0.001 <0.001 <0.001
12 year-old cohort
12 F
(n=294)
68.7 25.5 66.3 54.5
12 NF
(n=301)
82.4 53.5 86.5 70.8
p valuea <0.001 <0.001 0.001 0.018
aChi Square test, association between caries prevalence by age group and residency area.
F: fluoridated area, NF: non-fluoridated area.
Page 227
209
Severity of caries lesions among study participants
Table 5.34 shows the prevalence and mean scores of severity of caries lesions in
permanent teeth. In general, the number of lesions at dentine level (D4 to D6) was low in
comparison to lesions at enamel level (D1 to D3) for both areas and age groups. For
enamel lesions, decay at D1 was highest followed by decay recorded at the D2 and D3
levels. For dentine lesions, the highest number of lesions was at the D6 level for the 9
year-old cohort in both areas. The pattern was slightly different with the 12 year-old
cohort, which the highest number of dentine lesions was at D4 level for children in the
non-fluoridated area, however no clear pattern was observed among those in the
fluoridated area.
Table 5.34 Activity of caries lesions of permanent dentition by age groups in fluoridated
and non-fluoridated areas at tooth level
Age D1
Mean (SD)
Prevalence
D2
Mean (SD)
Prevalence
D3
Mean (SD)
Prevalence
D4
Mean (SD)
Prevalence
D5
Mean (SD)
Prevalence
D6
Mean (SD)
Prevalence
9 year-old cohort
9F
(n=313)
0.46 (0.79)
31.3%
0.19 (0.53)
14.4%
0.10 (0.32)
9.3%
0.03 (0.19)
2.6%
0.05 (0.30)
3.5%
0.14 (0.57)
10.9%
9NF
(n=247)
0.45 (0.83)
29.1%
0.18 (0.54)
13.0%
0.08 (0.32)
6.9%
0.06 (0.43)
2.0%
0.04 (0.24)
3.6%
0.14 (0.38)
13.0%
12 year-old cohort
12F
(n=294)
0.94 (1.31)
51.0%
0.43 (0.87)
26.2%
0.17 (0.56)
12.6%
0.04 (0.24)
3.1%
0.05 (0.25)
4.4%
0.04 (0.22)
3.7%
12 NF
(n=341)
1.02 (1.26)
56.1%
0.29 (0.58)
23.3%
0.20 (0.54)
15.3%
0.17 (0.58)
10.3%
0.05 (0.21)
4.7%
0.04 (0.20)
4.0%
Page 228
210
Prevalence of fissure sealants in study participants
In addition to the water fluoridation programme, fissure sealants are one of the caries
preventive strategies implemented in Malaysia. Therefore it is important to have an
overview of prevalence of fissure sealants in the study population, in particular when
discussing potential confounders associated with the results of this study (Section 6.3.3).
Table 5.35 shows the prevalence of fissure sealants in study participants. The frequency
of sealants was analysed for sound sealant (ICDAS codes: 10, 20) and combination of
sound sealant and sealant with enamel caries (ICDAS codes: 10, 11, 12, 13, 20, 21, 22,
23). There was significantly higher sealant placement among children in the non-
fluoridated area than those in the fluoridated area. Similar results were observed for both
age groups. The proportion of partial sealants with enamel caries was higher than
proportion of complete sealant with enamel caries for both age groups.
Table 5.35 Mean score and percentage of sealed permanent teeth for 9 and 12 years old
Malaysian children in fluoridated and non-fluoridate areas
Sound Sealant (10,20) Sound sealant & sealant with enamel caries
(10, 11, 12, 13, 20, 21, 22, 23)
Complete Partial Complete Partial
Mean (SD) % Mean (SD) % Mean (SD) % Mean (SD) %
9 year-old cohort
9 (F) 0.05 (0.24) 4.2 0.08 (0.33) 7.0 0.05 (0.24) 4.2 0.09 (0.34) 8.0
9 (NF) 0.13 (0.39) 10.9 0.41 (0.69) 32.0 0.13 (0.39) 10.9 0.49 (0.72) 37.2
p valuea 0.002 <0.001 <0.001 0.002
12 year-old cohort
12 (F) 0.03 (0.18) 2.4 0.06 (0.27) 5.8 0.03 (0.19) 2.7 0.09 (0.33) 7.5
12 (NF) 0.11 (0.38) 9.3 0.28 (0.58) 22.3 0.12 (0.39) 9.6 0.37 (0.68) 27.6
p valuea <0.001 <0.001 <0.001 <0.001
aMann Whitney test, association between mean sealant score by age group and residency area.
Page 229
211
5.4.3 The relationship between risk factors and dental caries
Bivariate analysis was conducted to assess risk factors (as described in earlier Sections
4.7.2.2) and dental caries. The relationship between a change in fluoride concentration
in the water and caries is described first, followed by the association between other risk
factors and caries. When reporting results from bivariate analysis on caries outcome, the
other risk factors were divided into four sub-groups (demographic characteristics, infant
feeding practices, oral hygiene habits and exposure to fluoride varnish/gel). Independent
variables were di or trichotomised prior to bivariate analysis as described in Section
4.7.2.1. Significant variables from the bivariate analysis were subsequently used in the
multivariate analysis as described in Section 4.7.2.2. The prevalence of caries at dentine
level (D4-6MFT>0) and caries at all levels (D1-6MFT>0) were used for bivariate and
binary logistic regression analyses.
When testing for an association between independent variables and caries, data were
combined for both age groups in both areas. Separate bivariate analysis between
independent variables and caries was also performed for each area, however limited
difference was observed. These data are presented in Appendix 34 and are not reported
in the main results section.
Page 230
212
Association between changes of fluoride level in the water supply and
dentine caries prevalence
Results in this section aim to answer the primary research question of this work, whether
the reduction of fluoride level has maintained the preventive effect on dental caries. Data
were analysed using bivariate analysis and multivariate analyses (Section 4.7.2.2).
Table 5.36 shows a bivariate analysis between the prevalence of caries and fluoride
exposure from the water supply in the area where the study participants lived. For both
caries outcome measures, children in the fluoridated area had a significantly lower
caries prevalence than those living in the non-fluoridated area.
Page 231
213
Table 5.36 Bivariate analysis between fluoride exposure from water and prevalence of caries at dentine level (D4-6MFT>0) and caries at
all levels (D1-6MFT>0) in study participants
Variable Dentine caries Unadjusted Caries at all levels Unadjusted
Exposure to
fluoride in the
water
D4-6MFT>0
N (%)
Odds ratio
95% CI
p value
D1-6MFT>0
N (%)
Odds ratio
95% CI
p value
Yes No Yes No
Non-fluoridated 260 (47.4) 288 (52.6) Ref 402 (73.4) 146 (26.6) Ref
Fluoridated 152 (25.0) 455 (75.0) 0.37 (0.29-0.38) <0.001 371 (61.1) 236 (38.9) 0.37 (0.29-0.38) <0.001
Ref: reference group
Page 232
214
Multivariate model between change of fluoride level in the water and dental caries
In contrast to fluorosis analysis, direct comparison across birth cohorts was not possible
for caries prevalence because of the different dentition present in different age groups.
Therefore, two types of multivariate analyses (namely zero-inflated negative binomial
and generalised linear model) were performed to explore the relationship between a
change in fluoride level of the public water supply and dental caries at dentine level
(Section 4.7.2.2). In both models, data were presented by age, fluoridation status and
when interaction between age and fluoridation were controlled in the analysis.
Table 5.37 shows the zero-inflated negative binomial for mean caries experience (at
dentine level) and generalised linear model regression for percentage caries prevalence
(at dentine level) with different fluoridation status and age groups. Model 1 shows that
although mean D4-6MFT is lower in the fluoridated than non-fluoridated area, no
significant association found between the fluoridated and non-fluoridated area when both
age were considered together in the analysis. Similarly, no significant association
observed between the two age groups when both areas were considered together in the
analysis. After allowing for interaction between age group and fluoridation status, the
results show that children who were exposed to fluoride at 0.5 ppm remained
significantly associated with lower caries experience than those who did not have any
exposure.
Model 2 shows that caries prevalence (D4-6MFT>0) is lower in the fluoridated than non-
fluoridated area. Results remained statistically significant between fluoridated and non-
fluoridated area when both age group were considered together in the analysis. In terms
of age, caries prevalence was significantly lower in the 9 year-old children when both
areas were considered together in the analysis. Similar to model 1, after allowing for
Page 233
215
interaction between age group and fluoridation status, the results show that children who
were exposed to the fluoride level (0.5 ppmF throughout life) remained significantly
associated with lower caries experience than those who did not have any exposure.
Results from both models indicate that after controlling the interaction between age-
fluoridation status, the difference of the differences of caries experience between
fluoridated and non-fluoridated areas were statistically significant. This suggest that
caries preventive effect is still maintained following the reduction of fluoride level in the
water.
Table 5.37 Multivariate regression models for mean caries experience and caries
prevalence following reduction of fluoride level in the water
Age
group
Outcome
measure
Fluoridation status p value
(95% Wald CI) Fluoridated+ Non-fluoridated
Zero-inflated negative binomial (Model 1)
9 D4-6MFT
Mean (SD)
[Median]
0.40 (0.96)
[0.00]
0.73 (1.17)
[0.00] p(area) = 0.339†
p(age) = 0.348†
p(age×area)=<0.001†
12 0.47 (0.97)
[0.00]
1.31 (1.81)
[1.00]
Generalised linear model (Model 2)
9
D4-6MFT>0
% caries
prevalence
24.6% 40.2% p(area)=<0.001‡
p(age)=0.021‡
p(age×area)=0.054‡ 12
25.5% 53.5%
+9 year-old children in fluoridated area were exposed to 0.5 ppmF throughout life, and 12 year-
old children in fluoridated area were exposed to 0.7 ppmF in the first two years of life and 0.5
ppmF thereafter.
†Zero-inflated negative binomial
‡ Generalised linear model
p(area): results differ by area (fluoridated and non-fluoridated) when both ages are considered
together.
p(age): results differ by age groups when both areas are considered together.
p(age×area): interaction between age and fluoridation status were included together in the
analysis.
Page 234
216
To decide the best model for this analysis, results from a generalised linear modelling
framework for D4-6MFT were compared to results of a zero-inflated negative binomial
model. Further inspection using Vuong test (Appendix 33) showed that zero-inflated
negative binomial model (Model 1) provided a significantly (p<0.001) better model than
the standard negative binomial model using generalised liner modelling analysis (Model
2). Although some small amount of over-dispersion in the non-zero D4-6MFT data was
also seen, the zero-inflated negative binomial model provided the best model for this
data. Marginal medians were predicted correctly for each group by age and area using
the zero-inflated negative binomial model.
Relationship between the prevalence of caries and demographic
characteristics of study participants
Table 5.38 shows the relationship between demographic characteristics and the
prevalence of caries at dentine level (D4-6MFT>0) and caries at all levels (D1-6MFT>0)
in study participants. Girls had a higher dentine caries score compared to boys and the
difference was statistically significant with caries severity at all levels. Children whose
parents had only primary school education had a higher caries prevalence than those
whose parents had college/university education. Children whose parents had low (<MYR
1000) monthly income also had a higher caries prevalence than those whose parents had
high (≥MYR 4000) monthly income. However, the differences were not statistically
significant. When looking at individual parent income, children whose father had a
moderate monthly income (MYR 1000-3999) had a significantly higher caries
prevalence than those whose fathers had a high monthly income. The use of two different
caries severity levels (caries into dentine and combined enamel and dentine caries) did
not results in major differences in these conclusions.
Page 235
217
Table 5.38 Bivariate analysis between demographic characteristics and prevalence of caries at dentine level (D4-6MFT>0) and caries at
all levels (D1-6MFT>0) in study participants
Variables Dentine caries Unadjusted Caries at all levels Unadjusted
Demographic
characteristics
D4-6MFT>0
N (%)
Odds ratio
95% CI
p value
D1-6MFT>0
N (%)
Odds ratio
95% CI
p value
Yes No Yes No
Gender
Boys 169 (34.1) 327 (65.9) Ref 315 (63.5) 181 (36.5) Ref
Girls 243 (36.9) 416 (63.1) 1.13 (0.89-1.44) 0.325 458 (69.5) 201 (30.5) 1.31 (1.02-1.68) 0.032
Father Education
College/University 85 (33.5) 169 (66.5) Ref 173 (68.1) 81 (23.5) Ref
High school 248 (35.2) 457 (64.8) 1.08 (0.80-1.46) 0.623 468 (66.4) 237 (33.6) 0.93 (0.68-1.26) 0.616
≤Primary school 44 (43.1) 58 (56.9) 1.51 (0.94-2.42) 0.087 75 (68.8) 27 (33.2) 1.30 (0.78-2.17) 0.315
Mother Education
College/University 93 (31.2) 205 (68.8) Ref 198 (66.4) 100 (33.6) Ref
High school 254 (37.1) 431 (62.9) 1.30 (0.97-1.74) 0.077 463 (67.6) 222 (32.4) 1.05 (0.79-1.41) 0.724
≤Primary school 45 (41.3) 64 (58.7) 1.55 (0.99-2.44) 0.058 75 (73.5) 34 (35.5) 1.11 (0.70-1.79) 0.653
Father monthly
income
≥ MYR 4000 102 (31.2) 225 (68.8) Ref 206 (63.0) 121 (37.0) Ref
MYR1000-3999 264 (37.3) 443 (62.7) 1.32 (0.99-1.74) 0.055 490 (69.3) 217 (30.7) 1.33 (1.01-1.75) 0.045
<MYR 1000 10 (37.0) 17 (63.0) 1.30 (0.57-2.93) 0.531 18 (66.7) 9 (33.3) 1.18 (0.51-2.70) 0.704
Mother monthly
income
≥ MYR 4000 76 (35.5) 138 (64.5) Ref 144 (67.3) 70 (32.7) Ref
MYR 1000-3999 85 (30.9) 190 (69.1) 0.81 (0.56-1.19) 0.283 172 (62.5) 103 (37.5) 0.81 (0.56-1.18) 0.505
<MYR 1000 236 (38.5) 377 (61.5) 1.14 (0.82-1.57) 0.438 426 (69.5) 187 (30.5) 1.11 (0.79-1.55) 0.549
Ref: reference group
Page 236
218
Relationship between the prevalence of caries and infant feeding practices
Table 5.39 shows the relationship between the prevalence of dental caries and infant
feeding practices. Children who were reported as being fed with infant formula had a
significantly lower dentine caries prevalence than non-formula users (p<0.001). Type of
water used to reconstitute infant formula was significantly associated with dentine caries
prevalence. Formula users with tap water and filtered tap water were 2.71 and 2.31 times
more likely to have dentine caries than formula users with bottled water. No significant
relationship was found between infant feeding practices with caries prevalence at all
levels.
Page 237
219
Table 5.39 Bivariate analysis between infant feeding practices and prevalence of caries at dentine level (D4-6MFT>0) and caries at all
levels (D1-6MFT>0) in study participants
Variables Dentine caries Unadjusted Caries at all levels Unadjusted
Infant feeding
practices
D4-6MFT>0
n (%)
Odds ratio
95% CI
p value D1-6MFT>0
n (%)
Odds ratio
95% CI
p value
Yes No Yes No
Use of infant
formula
No 144 (46.2) 167 (53.8) Ref 220 (70.5) 92 (29.5) Ref
Yes 266 (31.7) 574 (68.3) 0.54 (0.41-0.71) <0.001 550 (65.5) 290 (34.5) 0.79 (0.60-1.05) 0.107
Breast feeding
No 9 (33.3) 18 (66.7) Ref 21 (77.8) 6 (22.2) Ref
Yes 403 (35.7) 725 (64.3) 1.11 (0.50-2.50) 0.798 752 (66.7) 376 (33.3) 0.57 (0.23-1.43) 0.231
Age finished breast
feeding
>12 months 251 (36.7) 433 (63.3) Ref 457 (66.8) 227 (33.2)
≤12 months 152 (34.0) 295 (66.0) 0.89 (0.69-1.14) 0.356 298 (66.7) 149 (33.3) 0.99 (0.77-1.28) 0.959
Age started formula
>12 months 110 (32.3) 231 (67.1) Ref 228 (66.9) 113 (33.1) Ref
≤12 months 163 (32.0) 346 (68.0) 0.99 (0.74-1.33) 0.943 329 (64.6) 180 (35.4) 0.91 (0.68-1.21) 0.503
Age finished
formula
>48 months 140 (32.3) 293 (67.7) Ref 295 (68.1) 138 (31.9) Ref
≤48 months 131 (31.8) 281 (68.2) 0.98 (0.73-1.30) 0.867 260 (63.1) 152 (36.9) 0.80 (0.60-1.06) 0.125
Ref: reference group
Page 238
220
(Table 5.39 continued)
Variables Dentine caries Unadjusted Caries at all levels Unadjusted
Infant feeding
practices
D4-6MFT>0
n (%)
Odds ratio
95% CI
p value D1-6MFT>0
n (%)
Odds ratio
95% CI
p value
Type of water used
to prepare formula
Yes No Yes No
Bottled water 5 (15.6) 27 (84.4) Ref 21 (65.6) 11 (34.4) Ref
Tap water 213 (33.4) 424 (66.6) 2.71 (1.03-7.14) 0.043 423 (66.4) 214 (33.6) 1.04 (0.49-2.19) 0.927
Filtered tap water 51 (30.0) 119 (70.0) 2.31 (0.84-6.35) 0.103 105 (61.8) 65 (28.2) 0.85 (0.38-1.87) 0.679
Duration of formula
>48 months 79 (30.4) 181 (69.6) Ref 171 (65.8) 89 (34.2) Ref
≤48 months 188 (32.6) 388 (67.4) 1.11 (0.81-1.52) 0.518 373 (64.8) 203 (35.2) 0.89 (0.52-1.52) 0.661
Feeding method
Formula only 9 (33.3) 18 (66.7) Ref 21 (77.8) 6 (22.2) Ref
Combine breast &
formula
257 (31.6) 556 (68.4) 0.92 (0.41-2.09) 0.850 529 (65.1) 284 (34.9) 0.53 (0.21-1.33) 0.178
Breast only 144 (46.2) 168 (53.8) 1.71 (0.75-3.93) 0.203 220 (70.5) 92 (29.5) 0.68 (0.27-1.75) 0.427
Ref: reference group
Page 239
221
Relationship between the prevalence of caries and oral hygiene habits at
the time of study (2015) in study participants
In terms of oral hygiene habits, bivariate analysis were carried out for both, oral hygiene
practices reported as having been practiced at age less than six years and oral hygiene
practices at the time of study (in 2015). The rationale of performing this analysis is that
exposure to fluoride at different stages in life may be associated with caries prevention.
Table 5.40 shows a bivariate analysis between the prevalence of caries and current (2015)
oral hygiene practices. There was some variation in terms of current oral hygiene
practices with caries prevalence at dentine level or at all levels, however the differences
were not significant.
Page 240
222
Table 5.40 Bivariate analysis between oral hygiene habits at the time of study (2015) and prevalence of caries at dentine level (D4-6MFT>0) and
caries at all levels (D1-6MFT>0) in study participants
Variables Dentine caries Unadjusted Caries at all levels Unadjusted
(Oral hygiene
habits, in 2015)
D4-6MFT>0
n (%)
Odds ratio
95% CI
p value D1-6MFT>0
n (%)
Odds ratio
95% CI
p value
Yes No Yes No
Frequency of toothbrushing
Twice/day or
more
342 (36.7) 590 (63.3) Ref 632 (67.8) 300 (32.2) Ref
Once /day or
less
70 (32.3) 147 (67.7) 0.82 (0.60-1.13) 0.220 139 (64.1) 78 (35.9) 0.85 (0.62-1.15) 0.289
Supervise toothbrushing
Never 39 (37.5) 65 (62.5) Ref 75 (72.1) 29 (27.9) Ref
Yes 352 (35.3) 646 (64.7) 0.91 (0.60-1.38 ) 0.651 662 (66.3) 336 (33.7) 0.76 (0.49-1.19) 0.234
Habits after brushing
Spat 398 (35.4) 726 (64.6) Ref 750 (66.7) 374 (33.3) Ref
Swallowed 6 (46.2) 7 (53.8) 1.56 (0.52-4.68) 0.421 10 (76.9) 3 (23.1) 1.66 (0.46-6.08) 0.442
Eating/ licking toothpaste
Never 353 (35.6) 638 (64.4) Ref 663 (66.9) 328 (33.1) Ref
Yes 56 (36.1) 99 (63.9) 1.02 (0.72-1.46) 0.902 105 (67.7) 50 (32.3) 1.04 (0.72-1.49) 0.836
Amount of toothpaste used
Medium to large 381 (35.9) 680 (64.1) Ref 714 (67.3) 347 (32.7) Ref
Small 30 (36.1) 53 (63.9) 1.01 (0.64-1.61) 0.966 55 (66.3) 28 (33.7) 0.96 (0.60-1.53) 0.847
Type of toothpaste
Non-fluoridated 19 (40.4) 28 (59.6) Ref 32 (68.1) 15 (31.9) Ref
Fluoridated 386 (35.6) 698 (64.4) 0.82 (0.45-1.48) 0.501 729 (67.3) 355 (32.7) 0.96 (0.52-1.80) 0.905
Ref: reference group
Page 241
223
Relationship between the prevalence of caries and oral hygiene habits (at
age less than six years) among study participants
Table 5.41 shows the relationship between the prevalence of dental caries and oral
hygiene habits at age less than six years among the study participants. The age at which
children were reported as starting to toothbrush with toothpaste was significantly
associated with the prevalence of caries at dentine level (D4-6MFT) and caries at both
enamel and dentine levels (D1-6MFT). Children who started toothbrushing with
toothpaste after two years had a significantly higher caries prevalence than those started
toothbrushing with toothpaste at younger age. Other variables from early exposure to
fluoride from oral hygiene practices were found to be not significantly associated with
caries prevalence at dentine level or at all levels.
Page 242
224
Table 5.41 Bivariate analysis between oral hygiene habits (at age less than six years) and prevalence of caries at dentine level (D4-6MFT>0) and
caries at all levels (D1-6MFT>0) in study participants
Variables Dentine caries Unadjusted Caries at all levels Unadjusted
Oral hygiene
habits at age
less than 6
years
D4-6MFT>0
n (%)
Odds ratio
95% CI
p value D1-6MFT>0
n (%)
Odds ratio
95% CI
p value
Yes No Yes No
Frequency of
toothbrushing
Twice/day or
more
226 (34.3) 432 (65.7) Ref 446 (67.8) 212 (32.2) Ref
Once /day or
less
185 (37.7) 306 (62.3) 1.16 (0.91-1.47) 0.244 326 (66.4) 165 (33.6) 0.94 (0.73-1.20) 0.621
Supervised
toothbrushing
Never 6 (30.0) 14 (70.0) Ref 14 (70.0) 6 (30.0) Ref
Yes 393 (36.2) 694 (63.8) 1.32 (0.50-3.47) 0.571 734 (67.5) 353 (32.5) 0.89 (0.34-2.34) 0.815
Habits after
brushing
Spat 378 (35.3) 692 (64.7) Ref 717 (67.0) 353 (33.0) Ref
Swallowed 29 (42.6) 39 (57.4) 1.36 (0.83-2.24) 0.224 49 (72.1) 19 (27.9) 1.27 (0.74-2.19) 0.390
Eating/
licking
toothpaste
Never 176 (36.3) 309 (63.7) Ref 329 (67.8) 156 (32.2) Ref
Yes 233 (35.2) 428 (64.8) 0.96 (0.75-1.22) 0.717 441 (66.7) 220 (33.3) 0.95 (0.74-1.22) 0.690
Page 243
225
(Table 5.41 continued)
Variables Dentine caries Unadjusted Caries at all levels Unadjusted
Oral hygiene
habits at age
less than 6
years
D4-6MFT>0
n (%)
Odds ratio
95% CI
p value D1-6MFT>0
n (%)
Odds ratio
95% CI
p value
Yes No Yes No
Amount of
toothpaste
used
Medium to
large
216 (34.0) 419 (66.0) Ref 422 (66.5) 213 (33.5) Ref
Small 194 (38.0) 317 (62.0) 1.19 (0.93-1.51) 0.166 349 (68.3) 162 (31.7) 1.09 (0.85-1.39) 0.509
Type of
toothpaste
Non-
fluoridated
48 (34.0) 93 (66.0) Ref 94 (66.7) 47 (33.3) Ref
Fluoridated 355 (36.1) 628 (63.9) 1.10 (0.76-1.59) 0.632 665 (67.7) 318 (32.3) 1.05 (0.72-1.52) 0.816
Age started
toothbrushing
After 2 years 292 (37.1) 495 (62.9) Ref 524 (66.6) 263 (33.4) Ref
Before 2 years 120 (32.7) 247 (67.3) 0.82 (0.63-1.07) 0.146 249 (67.8) 118 (32.2) 1.06 (0.81-1.38) 0.670
Age started toothbrushing
with toothpaste
After 2 years 315 (37.7) 520 (62.3) Ref 575 (68.9) 260 (31.1) Ref
Before 2 years 94 (30.3) 216 (69.7) 0.72 (0.54-0.95) 0.020 193 (62.3) 117 (37.7) 0.75 (0.57-0.98) 0.035
Ref: reference group
Page 244
226
Relationship between the prevalence of caries and exposure to fluoride
varnish/gel in study participants
For caries prevalence at dentine level, children who did not receive fluoride varnish/gel
had a marginally higher dentine caries prevalence than who received fluoride varnish/gel
(Table 5.42). However the difference was not significant. In contrast, for caries
prevalence at all levels, children who received fluoride varnish/gel had marginally higher
caries prevalence, however the difference was not significant
Page 245
227
Table 5.42 Bivariate analysis between exposure to fluoride varnish/gel and prevalence of caries at dentine level (D4-6MFT>0) and caries at all
levels (D1-6MFT>0) in study participants
Variables
Dentine caries Unadjusted Caries at all levels Unadjusted
D4-6MFT>0
N (%)
Odds ratio
95% CI
p value D1-6MFT>0
N (%)
Odds ratio
95% CI
p value
Yes No Yes No
Exposure to Fluoride
varnish/gel
No 222 (33.6) 438 (66.4) Ref 422 (63.9) 238 (36.1) Ref
Yes 50 (32.5) 104 (67.5) 0.95 (0.65-1.38) 0.782 101 (65.6) 53 (34.4) 1.08 (0.74-1.55) 0.701
Ref: reference group
Page 246
228
5.4.4 Logistic regression models for having dental caries
Binary logistic regression model using the Enter method was generated for the
prevalence of caries defined by D4-6MFT>0 and D1-6MFT>0 separately. Significant
variables (p<0.05) and approaching significant variables (p<0.10) from the bivariate
analysis were entered into the model as a block. Adjusted odds ratios and 95% confidence
intervals are reported in Table 5.43. This shows the multivariate logistic regression model
for the prevalence of dentine caries defined by D4-6MFT>0. Father’s and mother’s
education level, father’s monthly income, exposure to fluoride from water, use of infant
formula, type of water used to reconstitute formula and age started toothbrushing with
toothpaste were contributing factors to the model.
After controlling other factors in the model, exposure to fluoride from water and type of
water use to reconstitute formula remained significantly associated with having higher
dentine caries prevalence. Children who had been exposed to fluoridated water had a
significantly lower dentine caries prevalence than those who did not have any exposure.
Infant formula reconstituted with tap water or filtered tap water had a significantly higher
dentine caries prevalence compared to those who used bottled water.
Page 247
229
Table 5.43 Multivariate logistic regression model for caries prevalence at dentine level
(D4-6MFT>0)
Explanatory variable
Adjusted
Odds ratio (95% CI)
p value
Father education
College/University Ref
High school 0.85 (0.54-1.34) 0.473
≤Primary school 0.57 (0.25-1.29) 0.175
Mother education
College/University Ref
High school 1.10 (0.73-1.66) 0.663
≤Primary school 1.59 (0.73-3.45) 0.246
Father income
≥ MYR 4000 Ref
MYR 1000-3999 1.15 (0.75-1.77) 0.528
<MYR 1000 1.08 (0.32-3.60) 0.906
Fluoride level from the water
Non-fluoridated Ref
Fluoridated 0.43 (0.31-0.60) <0.001
Infant formula
No Ref
Yes 0.61 (0.14-2.61) 0.503
Type of water used to prepare
formula
Bottled water Ref
Tap water 4.32 (1.25-14.99) 0.021
Filtered tap water 4.40 (1.21-16.01) 0.024
Age started toothbrushing with
toothpaste
After 2 years Ref
Before 2 years 0.72 (0.49-1.04) 0.076
Ref: reference group
Page 248
230
Table 5.44 shows the multivariate logistic regression model for the prevalence of caries
at all levels defined by D1-6MFT>0. Gender, father’s monthly income, exposure to
fluoride from water and age started toothbrushing with toothpaste were contributing
factors to the model.
After controlling for other factors in the model, gender and exposure to fluoride from
water remained significantly associated with having lower caries prevalence at all levels.
Girls had a significantly higher caries prevalence than boys. Children who had been
exposed to fluoridated water had a significantly lower caries prevalence than those who
did not have any exposure.
Table 5.44 Multivariate logistic regression model for caries prevalence at all levels (D1-
6MFT)
Explanatory variables Adjusted
Odds ratio (95% CI)
p value
Gender
Boys Ref
Girls 1.31 (1.01-1.71) 0.042
Father income
≥ RM 4000 Ref
RM1000-3999 1.17 (0.88-1.56) 0.281
<RM 1000 1.12 (0.48-2.60) 0.802
Fluoride level
Non-fluoridated Ref
Fluoridated 0.58 (0.44-0.76) <0.001
Age started toothbrushing with
toothpaste
After 2 years Ref
Before 2 years 0.82 (0.61-1.10) 0.181
Page 249
231
5.5 Summary of key findings
Fluorosis
Regardless of which outcome measure was used (Deans>0 or Deans≥2), fluorosis
prevalence was significantly higher among children in the fluoridated area than
the non-fluoridated area.
Reducing fluoride level in the water has resulted in narrowing of fluorosis
prevalence between fluoridated and non-fluoridated areas. This implies that the
decrease in fluorosis prevalence corresponds with the reduction (0.2 ppm) of
fluoride in the drinking water during the time of central incisor development.
From the bivariate analysis, the prevalence of fluorosis (Deans≥2) was
significantly associated with parents’ education level, parents’ monthly income,
fluoride exposure from the water, use of infant formula, the age at which breast
feeding finished, age started formula, age finished formula, type of water used to
reconstitute the formula, duration of formula use and type of feeding method.
After controlling for other factors in the model, exposure to fluoride level from
water and type of water use to reconstitute the formula remained significantly
associated with the prevalence of fluorosis.
Caries
For both age groups, the mean caries experience and percentage of caries
prevalence was significantly lower among children in the fluoridated area than
the non-fluoridated area. Similar results were observed for mean caries
experience in permanent and primary dentitions at tooth and surface levels.
Page 250
232
Findings suggest that a statistically significant caries preventive effect remained
following the reduction of the fluoride level in the public water supply.
In the permanent dentition, the enamel caries prevalence was higher than the
dentine caries prevalence. In contrast, dentine caries prevalence was higher than
enamel caries in the primary dentition. The trends were similar when data were
analysed at tooth or surface levels.
From the bivariate analysis, the prevalence of caries at dentine level (D4-
6MFT>0) was significantly associated with parents’ education level, fathers
monthly income, fluoride level in water, use of infant formula, type of water used
to reconstitute formula milk and age at which the participants were reported as
starting toothbrushing with toothpaste.
After controlling for other factors in the model, the fluoride level in the water
supply and type of water used to reconstitute formula remained significantly
associated with the prevalence of dentine caries.
From the bivariate analysis, the prevalence of caries at all levels (D1-6MFT>0)
was significantly associated with gender, father’s monthly income, exposure to
fluoride level from water and age started toothbrushing with toothpaste.
After controlling for other factors in the model, gender and exposure to fluoride
level in the water supply remained significantly related to the prevalence of dental
caries at all levels of severity.
Page 251
233
6 Discussion
This chapter presents a discussion of the key findings of the thesis (Section 6.1). The
findings are then discussed and compared with other published work (Sections 6.3.1 to
6.3.5). Methodological considerations, study strengths and limitations are also
considered in Section 6.4.
Key findings
Systematic review
The systematic review completed in Chapter 2 reviewed the impact of removing or
reducing the level of fluoride in the public water supply on dental caries and fluorosis.
The findings highlighted the gap in knowledge with respect to the impact of stopping or
reducing the level of fluoride in water supply on dental caries and fluorosis. There were
more studies assessing the impact of cessation as opposed to reduction of fluoride level
in the water supply. The available evidence on stopping water fluoridation has focused
on dental caries as the primary outcome and data indicated mixed results. Studies
published before the 1990s reported increased caries experience post cessation, while
studies published from 1990 onwards reported a decrease in caries experience in the
absence of fluoride. The limited numbers of studies that have reported on reducing
fluoride level in the water supply have mainly focused on dental fluorosis as their primary
outcome and indicate a decrease in fluorosis prevalence. Therefore, further investigations
of these gaps in the evidence were indicated. Findings from the systematic review also
highlighted issues surrounding the methods used in water fluoridation studies such as
lack of examiner blinding and control of confounding factors in the analysis. These issues
should be addressed to increase the quality of the studies in this area of research.
Page 252
234
Main study
The main research undertaken in this thesis was conducted to address deficiencies in the
evidence highlighted in the systematic review chapter. The opportunity arose following
changes in Malaysian water fluoridation policy in 2005, when the optimum concentration
of fluoride in the public water supply was reduced from 0.7 to 0.5 ppm. Therefore, this
study aimed to evaluate the outcomes of a 0.2 ppm downward adjustment of fluoride
concentration in the drinking water on dental fluorosis and caries. The following sections
discuss the key findings of the main study compared with other published work and how
some of the key methodological issues highlighted in systematic reviews have been
addressed.
6.3.1 The prevalence and severity of dental fluorosis following
reduction of fluoride level in the public water supply
As described in the literature review (Chapter 1), comparison across studies with regards
to fluorosis prevalence is complicated by different methods and varying outcome
measures used in previous studies (Section 1.2.2.4).
In the present study, fluorosis prevalence was significantly higher in fluoridated (35.7%
to 42.6%) than non-fluoridated (5.5% to 9.7%) areas. This held true regardless of which
threshold of fluorosis definition was used. The results confirm findings from various
studies that fluorosis prevalence is strongly associated with fluoridated water (Clark,
1994, Adair et al., 1999, Maupome et al., 2003, Khan et al., 2005). Furthermore, some
authorities have reported that it may not be possible to achieve effective fluoride-based
caries prevention without some degree of enamel fluorosis (O' Mullane et al., 2016).
Page 253
235
Results in the present study indicated a lower fluorosis prevalence (Deans ≥ 2= 35.7%)
than the previous national survey that reported 62.3% of fluorosis prevalence in
fluoridated areas (Oral Health Division Ministry of Health Malaysia, 2001). When
comparing with the national and local data, fluorosis at (Deans ≥ 2) is used as case
definition. A similar result was reported by another local study with 58.7% fluorosis
prevalence carried out amongst a representative sample in the fluoridated state of
Selangor (Tan et al., 2005). These studies were conducted among children that were
exposed to 0.7 ppm fluoride in the water throughout life before the change in the
fluoridation policy took place. However, with regards to those in non-fluoridated areas,
there was a small increase in fluorosis prevalence observed in the present study (5.5%)
over that reported in the previous national survey (3%). A similar finding of an increased
prevalence of fluorosis in sub-optimal or non-fluoridated areas were also reported by
another local study (31.6%) but their sample size was rather small (Shaharuddin et al.,
2010). The tendency for an increase in the prevalence of fluorosis in non-fluoridated
areas has also been documented by international studies in the USA (Beltrán-aguilar et
al., 2002), Ireland (Whelton et al., 2004a, Whelton and O’Mullane, 2012) and Canada
(McLaren, 2011). This phenomenon has several possible explanations. Firstly, due to the
increased availability of fluoride from other sources such as fluoride toothpaste and other
dental products such as fluoride mouthwash, and varnish/gels. Secondly by the ‘diffusion
effect’ whereby the residents in a non-fluoridated area can be exposed to fluoride in foods
or beverages that are produced in a fluoridated area and transported to the non-fluoridated
area (Griffin et al., 2001).
In terms of severity, most of the fluorosis observed was in the very mild and mild
category. The previous Malaysian national survey reported similar findings (Oral Health
Division Ministry of Health Malaysia, 2001). This is in agreement with international
Page 254
236
studies conducted in Australia (Do and Spencer, 2007) and Canada (Maupome et al.,
2003). The work carried out in the conduct of this thesis found that of those living in
fluoridated areas the prevalence of moderate fluorosis was higher among children
exposed to 0.7 ppm (10.9%) than 0.5 ppm (6.7%) in the first 2 years of life. The dose
response in relation to the prevalence of moderate fluorosis is further illustrated by a
study in 12 year-olds conducted in Quette, Pakistan, where the concentration of fluoride
in the drinking water was 0.91 ppm (Sami et al., 2015). There the overall prevalence of
fluorosis was reported as 63.6%. The majority (32.1%) was recorded as moderate while
27.5% was categorised as mild (Sami et al., 2015).
Little is known about the effect of reducing fluoride level to a fluoride concentration as
low as 0.5 ppm. This limits the direct comparison of the present data with other studies.
Findings from this study can only be compared with a series of Hong Kong studies that
examined fluorosis prevalence on maxillary central incisors after downward adjustment
of fluoride in Hong Kong water supply. The earlier Hong Kong studies by Evans and
Stamm reported that fluorosis prevalence with Dean’s Index declined from 64% to 47%
after the reduction in fluoridation level from 1.0 ppm to 0.7 ppm (Evans and Stamm,
1991b). The recent data from Hong Kong reported four cross-sectional surveys on
fluorosis prevalence. The fluorosis was blind scored using photographs of maxillary
incisors with DDE index. A similar trend was reported following reduction of fluoride
level in the water from 1.0 (1967) to 0.7 (1978) to 0.5 (1988) (Wong et al., 2014).
Fluorosis decreased from 89.3% in 1983 to 48.5% in 1991 and 32.4 % in 2001 surveys.
However the follow-up survey in 2010 reported fluorosis prevalence has increased to
42.1% while the fluoride level remained the same at 0.5ppm as in 2001. The authors
suggested the increase in prevalence of fluorosis might be contributed to by other sources
Page 255
237
of fluoride such as fluoridated toothpaste, infant formula and fluoride content in food
(Wong et al., 2014). In 2013, the authors conducted another follow-up study and re-
examined the same participants that had participated in 2010 survey. The follow-up drop-
out rate was 35% (Wong et al., 2016). Results indicated a significant decrease in fluorosis
prevalence from 2010 to 2013. The authors concluded that the fluorosis diminished over
time. Possible explanations given were the possibility of tooth wear and the effect of
remineralisation. Constant exposure to saliva, which is supersaturated with calcium and
phosphate, results in continued enamel mineralization that in turn can lead to reduced
opacity in affected areas (Wong et al., 2016). However results should be treated with
caution because the main aim of the later study was to look at overall enamel defects not
just fluorosis. Significant results were only observed for ‘diffuse opacities’ but not on
other enamel defects such demarcated and hypoplastic enamel. Although the DDE index
classifies enamel defects in a descriptive way and does not assume aetiology, one of its
main types, diffuse opacities has been used synonymously as dental fluorosis.
The present study shows a decreased in fluorosis prevalence corresponds with the
reduction (0.2 ppm) of fluoride in the drinking water during the time of maxillary central
incisors development (Chapter 4). The results provide support for the decision to reduce
the fluoride level in the public water supply in Malaysia. Findings further support
previous results that the prevalence of fluorosis is sensitive to even minor changes in
fluoride exposure from drinking water. This is not a novel concept and the fluorosis
outcome has been addressed in a several earlier studies conducted in Hong Kong (Evans,
1989, Evans and Stamm, 1991b, Wong et al., 2014). However, the present study provides
evidence that the change in fluoride level from 0.7 to 0.5 ppm not only resulted in
changes on fluorosis prevalence but also has a significant impact on caries prevalence at
Page 256
238
different thresholds of severity. At 0.5 ppm fluoride in the water fluorosis prevalence is
further reduced without compromising the caries preventive benefit. The impact of such
reduction on caries is further discussed in Section 6.3.3. These new findings add value
to the gap in literature with regards to recent movement towards lower levels of fluoride
in the water.
6.3.2 Risk factors associated with fluorosis
A number of factors have been identified as associated with the prevalence of dental
fluorosis in this study population (Section 5.3.2).
Socio-economic status
High fluorosis prevalence was found to be significantly associated with higher parental
income and education level in bivariate analysis. The link between socio-economic status
and fluorosis has also been reported by other studies in Brazil (Benazzi et al., 2012)
Mexico (Pontigo-Loyola et al., 2014) and Pakistan (Sami et al., 2015). Unlike dental
caries, the relationship between fluorosis and socio-economic status has not been fully
established in the literature. Results across studies were mixed and the socio-economic
status factors were not significant in multivariate regression model in the present study
and other studies reviewed (Benazzi et al., 2012, Pontigo-Loyola et al., 2014, Sami et al.,
2015). Several authors have postulated that a high fluorosis prevalence among affluent
families might be due to the ability to purchase fluoride toothpaste (Benazzi et al., 2012,
Pontigo-Loyola et al., 2014). However, fluorosis prevalence in the present study was
strongly associated with exposure to fluoride in the water rather than to fluoride
toothpaste and oral hygiene practices. Therefore, a potential reason for the bivariate
association could be due to more children with parents of higher socio-economic status
Page 257
239
were exposed to fluoridated water than those in lower socio-economic status. On the
other hand, a study in Pakistan reported children with better family income were less
likely to have fluorosis. There, authors reported that the affluent family linked to better
parental awareness about fluorosis and they were more likely to be concerned with
exposure to fluoride in their children than those from low income families (Sami et al.,
2015).
Infant feeding practices
Another factor associated with fluorosis prevalence was the use of infant formula.
However there was lack of evidence to verify the actual fluoride content of infant formula
in Malaysia. Only one publication ever reported fluoride levels in Malaysian infant
formula. Authors reported the content of fluoride in infant formula when reconstituted
with deionized water (0 ppmF) was low with a mean value of 0.087 ppmF ± 0.04 (Latifah
and Razak, 1989). However, this study was conducted in 1980s and no data on specific
fluoride content in infant formula before dilution with deionized water have been
reported. No other historical data or recent publications from Malaysia are available for
comparison. Effort was made to obtain fluoride content from some of the infant formula
packaging, but no information was available. Therefore, further research is needed to
confirm such association. Based on the international literature, infant formula generally
had a low fluoride content after the 1970s (Mascarenhas, 2000). The low concentration
of fluoride level in infant formula varied from (0.28 μg/F g of milk powder) in United
Kingdom (Zohoori et al. 2012) to (0.41 μg/F g) in Japan (Nohno et al., 2011) and (0.49
μg/F g) in Australia (Clifford et al., 2009). Evidence in the literature suggests that
fluorosis has a weak association with infant formula because of low fluoride level in
infant formula (Koparal et al., 2000, Hujoel et al., 2009, Siew et al., 2009). However it
Page 258
240
shows a strong correlation with type of water used to reconstitute the formula (Nohno et
al., 2011). Findings from the present study are in agreement with previous studies that
reported infant formula reconstituted with fluoridated tap water increases the risk for
dental fluorosis (Ekstrand et al., 1984, Ekstrand, 1989, Pagliari et al., 2006, Siew et al.,
2009, Cressey, 2010). This factor remained statistically significant in the multivariate
model. Duration of infant formula practice also played a role in this study. For instance,
children who had a longer duration of formula use (more than 48 months), were
significantly more likely to be associated with a higher fluorosis score. However this
factor was no longer significant in multivariate model.
The results also indicate that children that were breast-fed during infancy were
significantly less likely to have fluorosis than those who were formula usurers. This
suggests that breast-feeding practices were protective against fluorosis. The findings are
supported by other studies (Van Winkle et al., 1994, Brothwell and Limeback, 2003,
Wondwossen et al., 2006). It is known that, even if a mother is consuming fluoridated
water, human milk maintains very low fluoride concentrations (< 0.5 µM) due to the
limited transfer of fluoride from plasma to breast milk (Ekstrand et al., 1984, Şener et al.,
2007). Furthermore, breast-feeding duration also played a significant protective role in
the current study (Section 5.3.2.3). Children who had been breastfed for a prolonged
period (>12 months) were less likely to develop fluorosis. The same findings have been
reported in Canada (Brothwell and Limeback, 2003) and in Ethiopia (Wondwossen et
al., 2006). In addition, the practice of breast-feeding was found to be linked with the
family economic status. For example in this study, those with low income and low
education levels were more likely to breastfeed their children and to do so for longer.
These findings confirm results from other local studies in Malaysia that have reported a
Page 259
241
higher prevalence of breast-feeding in lower socio-economic status families, and greater
use of infant formula amongst the affluent (Manan, 1995, Yee and Chin, 2007, Tan,
2009). This could be due the fact the majority of the mothers of lower socio economic
status were not working outside the house being full time housewives, which makes
breast-feeding easier than for those who go out to work. This pattern differs from that
observed in the UK (Brown et al., 2010) and USA (Heck et al., 2006), where
breastfeeding is more common in higher socioeconomic groups.
6.3.3 The prevalence and severity of dental caries following reduction
of fluoride level in the water
The present study design is critical in evaluating fluorosis as change of exposure to
fluoride in the water during the first 2 years of life was specifically used for the analysis.
The study design does not allow direct comparison to assess whether the caries
preventive effect of water fluoridation at 0.5 ppm is better than at 0.7 ppm. This is
because the 12 year-old children were only exposed to 0.7 ppm for the first two years of
life. In addition, it is not possible to directly compare the caries experience between 9
and 12 year-olds from cross sectional data because of the different dentition present in
these different age groups. However the study provided results to answer the question
whether the caries preventive effect has been maintained at 0.5 ppm when compared with
the non-fluoridated similarly aged control groups.
Regardless of which threshold of diagnosis was used, the mean caries experience in the
permanent and primary dentitions was significantly lower in the fluoridated than non-
fluoridated areas for both age groups. A higher number of teeth, missing due to caries
Page 260
242
was observed among children in the non-fluoridated area in both dentitions. The
prevalence of filled surfaces was also significantly higher in the non-fluoridated area.
The findings in relation to caries prevalence into dentine are in agreement with results
from the Malaysian national survey (Oral Health Division Ministry of Health Malaysia,
2010) and school dental service data (Oral Health Division Ministry of Health Malaysia,
2014). Additionally, results confirmed existing evidence of the benefit of water
fluoridation in caries prevention reported in other countries (McDonagh et al., 2000,
Parnell et al., 2009, Iheozor‐Ejiofor et al., 2015). As highlighted in many studies, it has
become difficult to investigate the impact of water fluoridation alone in the community
where fluoridated toothpaste use is widespread. For example in the present study, the
majority of the respondents in both areas reported using fluoridated toothpaste when
brushing. Results from this study also confirm findings from the York Review that the
caries preventive effect is still apparent in the fluoridated community that used
fluoridated toothpaste (McDonagh et al., 2000). About 37% of the children in the non-
fluoridated area had fissure sealants and this proportion was found to be significantly
higher than children in the fluoridated area (8%). In addition, about 14.8% of children
were reported to have received fluoride varnish/gel. Although these preventive strategies
were in place, children who had no exposure to fluoride in the water still had a higher
caries score than those that had exposure to fluoridation. Results from this study suggest
that an optimum fluoride concentration of 0.5 ppm maintained a caries preventive effect,
thus supporting the decision to reduce the fluoride level in Malaysian public water
supply.
Caries prevalence in this study was examined using ICDAS II criteria. The ability of the
index to enable detection of early caries lesions provides an opportunity to explore caries
Page 261
243
prevalence in fluoridated and non-fluoridated populations at low levels of caries severity.
Because this is a new index, only limited epidemiological studies are available for
comparison. To allow comparison with other studies that use DMF index, the ICDAS II
codes were collapsed at specific cut-off points for equivalence. There is ongoing debate
concerning the level of equivalence to the DMF index. There is less certainty in the
literature between codes 3 and 4 to be counted as sound or caries. Some authors
considered the cut-off point of caries at code 3 (Braga et al., 2009, Mendes et al., 2010,
Iranzo-Cortes et al., 2013). Whereas ICDAS II itself stated the codes 4, 5 and 6 are
equivalent to caries score of DMF (i.e. into dentine criteria traditionally used in dental
epidemiology (Pitts, 2004, Banting et al. 2005). The present study sets the ICDAS II cut-
off point for comparison with the DMF score at codes 4 to 6. Enamel caries was analysed
at codes 1 to 3.
When looking at caries at different thresholds, there was more enamel caries diagnosed
than dentine caries in both age groups and areas of residence. When enamel caries were
included, the mean DMFT and DMFS score increased by 2 to 4 times more than when
only dentine caries lesions were included. For example for mean caries experience among
12 year-olds in the fluoridated area was 0.47 at (D4-6MFT) and increased to 2.01 at (D1-
6MFT). The inclusion of early caries lesion contributed to the higher overall caries score
diagnosed using ICDAS II in comparison to the traditional DMF score. Similar trends
were observed in other studies that used ICDAS II criteria when assessing caries
prevalence (Cadavid et al., 2010, de Amorim et al., 2012, McGrady et al., 2012a,
Almerich-Silla et al., 2014). For instance in a study conducted in Spain, the mean D4-
6MFT was 0.83 and 3.46 (D1-6MFT) according to ICDAS II criteria (Almerich-Silla et
al., 2014) among 12 year-old children. Similarly in a national survey in Iceland, caries
Page 262
244
prevalence at age 12 years was 1.43 at D3-6MFT and 3.93 at D1-6MFT (Agustsdottir et
al., 2010). Although the prevalence of early caries lesions is higher than dentine caries,
results indicate that the difference in the prevalence between fluoridated and non-
fluoridated is narrower when the caries is reported at this threshold (D1-6MFT). For
example, among the 12 years, D1-6MFT was 2.01 in fluoridated and 2.83 in non-
fluoridated area. Meanwhile caries prevalence at D4-6MFT was 0.47 in fluoridated and
1.31 in non-fluoridated area. Similar findings were reported in a study carried out by Mc
Grady and co-workers that assessed the impact of water fluoridation in Newcastle and
Manchester (Mc Grady et al., 2012a). This raises another important question, whether
water fluoridation prevents or merely delays the progressions of early caries. This could
be answered by a longitudinal study and should be considered in future research.
Many water fluoridation studies used the DMF index and reported caries data at “dentine
level”. Data from this study report caries prevalence in fluoridated and non-fluoridated
communities using ICDAS II index and this has allowed comparison of the relative
contribution of enamel and dentine caries to overall caries experience. Therefore, the
findings make an important contribution to the water fluoridation literature.
No dietary habits (i.e. sugar consumption, soft drinks) were measured in this study.
National data suggest that Malaysian children consumed high added sugar in their diet
and have a high frequency of snacking (Poh et al., 2013). The adult population in
Kelantan was reported to have a higher sugar intake than the national average and this
pattern can be speculated to be similar among the child population (Amarra et al., 2016).
This factor should be considered as an important factor contributes to the high caries
prevalence in Kelantan in addition to no exposure to fluoridated water.
Page 263
245
6.3.4 Risk factors associated with dental caries
The data collected in this study allow analysis for both, pre and post-eruptive exposure
to fluoride on dental caries prevention.
Oral hygiene habits at the time of study in 2015
To examine any post-eruptive effect of fluoride in caries prevention, caries data at
different thresholds were analysed in relation to oral hygiene habits at the time of the
study in 2015. There were some variations in terms of current oral hygiene practices with
caries prevalence at dentine level or at all levels, however the differences were not
statistically significant (Section 5.4.3.4).
Early exposure to fluoride from other sources
To assess any pre-eruptive effect of fluoride, data were analysed using early exposure
variables that influencing caries risk (i.e. oral hygiene practices at age less than 6 years,
infant feeding practices, exposure to fluoride varnish/gel at age less than 6 years). The
analysis, indicated that children who started brushing with toothpaste before 2 years of
age had a significantly lower caries prevalence than those who started brushing with
toothpaste after 2 years. This association was significant both at the caries into dentine
level and at all levels. However no significant relationship was observed for fluorosis
prevalence and the age at which brushing with toothpaste started. This is reassuring and
suggests that the use of fluoride toothpaste at an early age is not contributing to the
prevalence of fluorosis observed. A high proportion of children were reported as being
supervised during toothbrushing. Parental assistance would assist in the toothbrushing
Page 264
246
procedure and control over the use and ingestion of toothpaste. Furthermore, a majority
of parents reported that their children did not have eating/licking toothpaste habits after
toothbrushing.
Children who were reported as being fed with infant formula had a significantly lower
dentine caries prevalence than non-formula users. This factor was associated with a high
fluorosis prevalence. Because fluoride level in the infant formula is generally low, this
association is likely confounded by socioeconomic status as discussed in Section 6.3.2.
However the relationship between the types of water used to reconstitute infant formula
and dental caries was less clear. There was an unexpected finding that the use of tap
water to reconstitute infant formula was associated with higher caries prevalence than
the use of bottled water. This finding may however simply reflect the small number of
bottled water users and so should be treated with caution.
These significant factors were no longer significant in the multivariate analysis. In
addition, other variables from early exposure to fluoride from oral hygiene practices and
infant feeding practices were also found to be not significantly associated with caries
prevalence for permanent teeth. These findings are consistent with other studies that the
pre-eruptive effect of fluoride is less important and the primary effect of fluoride is post-
eruptive (Sampaio and Levy, 2011, Hellwig and Lennon, 2004).
Page 265
247
Demographic characteristics and socio-economic status
In terms of caries association with demographic characteristics, girls had a higher dentine
caries score compared to boys and the gender difference was statistically significant with
caries severity at all levels in the multivariate model. The results in this gender
differences are supported by other studies conducted by (Ramezani et al., 2003, Lukacs,
2011). The factors that cause girls and women to experience more dental caries are not
fully understood. Possible explanations have been proposed, including earlier tooth
eruption in girls and therefore increased time of exposure to the cariogenic process
(Lukacs, 2011, Martinez-Mier and Zandona, 2013). Other reported explanations include
a lower salivary flow rate among females, which has lesser caries protective effect than
their male counterparts. This condition may be influenced by female hormonal
fluctuations (Lukacs and Largaespada, 2006).
Apart from gender, many studies have documented an inverse relationship between
socio-economic status and caries prevalence. Previous studies have reported higher
caries prevalence was found among the children of lower social class and a lower
prevalence in children of higher social class (Lalloo et al., 1999, Reisine and Psoter,
2001). This relationship was attributed to increased oral health awareness and access to
dental care among those in higher socio-economic status. These trends are similar to the
findings from the present study that indicated children whose parents had a low monthly
income and education level had a higher caries prevalence than those whose parents had
a high monthly income and education level. However, the differences were not
statistically significant.
Page 266
248
6.3.5 Other factors
The majority of respondents reported tap water as the main source of water at home and
only 11% of children in the non-fluoridated area reported that they used water from
wells/rivers. In some rural parts of Malaysia, wells are still used as a source of water as
they have no access to piped water (Aini et al., 2007). They are not regulated by any
federal drinking water standards. Thus, this factor did not have any major impact to the
data of the present study.
The high proportion of water filter use reported amongst the population in this study is
of interest. Results show that higher filter use was reported among those living in the
fluoridated area (60%) in comparison to those in the non-fluoridated area (42.9%). These
findings are consistent with other Malaysian studies that reported there was a trend of
increase usage of water filters ranging from 22.9% to 85% (Aini et al., 2007, Tan and
Razak, 2013). The self-reported reasons for using water filtration devices were mainly
for health reasons and to improve water quality (Aini et al., 2007, Loh et al., 2011). There
are many types and brands of filters available in Malaysia. It was reported that some
brands of water filters in Malaysia had no significant effect on fluoride content from
drinking water. For example, a study that collected water samples among households in
Selangor reported that the mean fluoride concentration of unfiltered water (0.541 ± 0.167
ppm) remained unchanged after being filtered (0.534 ± 0.192 ppm) (Tan and Razak,
2013). Another study conducted in Johor reported that 59% of the studied samples used
a carbon activated water filtration system. These carbon filters had no effect on fluoride
levels in drinking water, which level of fluoride remained at 0.43 ppm before and after
filtration (Loh et al., 2011). However, it has been documented in the international
literature that filtration systems such as reverse osmosis and distillations removed
Page 267
249
substantial amounts of fluoride (Glass, 1990, Brown and Aaron, 1991, Whitford, 1994,
Jobson et al., 1999). With regards to a high number of water filter users in this study, it
is likely they are not of the reverse osmosis type so it can be assumed that they did not
have any significant effect on fluoride removal as reported by other local studies. This
likely explains why fluoridated water remained a significant factor associated with
fluorosis and preventive caries effect.
Methodological considerations, study strengths and
limitations
6.4.1 Methodological considerations
Study design and data analysis
This study is a single point cross sectional survey that evaluated the effect of a change of
fluoride level in the water supply on dental fluorosis and caries. Fluorosis prevalence was
compared between two birth cohorts that were exposed to different fluoride levels during
the critical period of maxillary central incisor development.
Dental fluorosis status was directly comparable between two birth cohorts. The
comparison is possible because the main effect on fluorosis development was during the
pre-eruptive period. There may be some changes in the clinical appearance post-eruption
but this probably has a minimal effect of the prevalence and severity of fluorosis. In any
case the ageing effect was likely to be similar between cohorts with regards to fluorosis
measurement. When performing the analysis, the change in fluorosis prevalence in the
fluoridated community was compared to the change in the non-fluoridated community.
The baseline prevalence data were extracted from the groups that were exposed to the
old fluoride level (0.7 ppm) and the ‘after’ prevalence data were extracted from the group
Page 268
250
that were exposed to the new fluoride level (0.5 ppm) after reduction occurred. This
approach resembles the ‘difference of differences’ approach, which is commonly used to
assess the impact of water fluoridation (Listl et al., 2016, Singhal et al., 2017).
In contrast to the fluorosis analysis, the caries status of different birth cohorts was not
directly comparable because of the different stages of development of the dentition in the
different age groups involved. Permanent caries experience increased with age. This
pattern reflects the biological change in the process of ageing, which impacts on caries
prevalence, namely the number of teeth present and the accumulation of caries over time.
The ageing effect was controlled using zero-inflated negative binomial and generalized
linear model regressions when estimating the difference of the differences of caries
experience between fluoridated and non-fluoridated areas. Interaction between age and
fluoridation status were tested and adjusted in the model when performing the analyses.
Comparison of mean caries experience (D4-6MFT) and caries prevalence (D4-6MFT>0)
between cohorts exposed to different fluoride levels (after controlling for ageing effect)
revealed a significant difference. This indicates that the caries preventive effect is still
maintained at 0.5 ppm following the reduction of fluoride level in the water. Children in
both age groups in the fluoridated area were mainly exposed to 0.5 ppm fluoride in the
water throughout their life and the full fluoridation effect can be seen at this level of
concentration.
There is a common problem of dental caries data in children that data are often skewed.
This is due to the fact that the counts are increasingly characterized by a large number of
zero-counts as oral health has improved over time (Preisser et al., 2012). To overcome
excess zeros and over-dispersion, the present study used negative binomial regression
models as recommended by several authors when dealing with count regression
Page 269
251
modelling such as dental caries (Lewsey and Thomson, 2004, Preisser et al., 2012). In
addition, the sample size of the present study was large enough to increase the normality
of the distribution of means. Hence the models are applicable to answer the research
question.
The limitations of a single point cross sectional survey when assessing the effect of water
fluoridation has also been acknowledged by other authors (Singhal et al., 2017). This
limitation applies to the results in the current study. Ideally a two-point survey should be
carried out to confirm the findings. As this is the first study that evaluates the effect of a
reduction of fluoride level in the Malaysian water supply, the results from this study
could be used as a baseline data and a follow-up survey will be considered in future work.
Detail discussion related to recommendations for study design in water fluoridation
studies has been discussed previously in the systematic review chapter (Section 2.7.3).
Time factor for outcome measurement
Time was important in examining the prevalence of fluorosis and caries in the population.
The study was considered as particularly timely for this purpose for several reasons.
Fluorotic enamel maybe affected by some external factors after eruption, such as wear
or dental treatment, although this change would be minimal with mild fluorosis across a
limited number of years. Children aged 12 years-old were chosen instead of an adolescent
group because some evidence suggests that the presentation of fluorosis might be
diminished over time (Wong et al., 2016, Do et al., 2016). The population were also less
likely to have aesthetic dental treatment for fluorosis condition at this age. Children who
were expected to be affected by the change of fluoride level in the water supply (0.5ppm)
would be at age 9 years old in 2015. This age group would have upper central incisors
teeth present for clinical examination of fluorosis to take place.
Page 270
252
6.4.2 Study strengths and limitations
Response rate
The study had achieved the required sample size (Section 4.4.2.3) and received an
excellent overall response rate (81.1%) for a population study. Similarly, satisfactory
response rates for individual state and age groups were also achieved. The good response
rates were attributed to several factors including an incentive offered to the participants,
good cooperation from the schools, teachers, parents and children. As described in
(Section 4.10.2) children in this study were provided with a toothbrush and toothpaste as
a token of appreciation and the parents were offered an incentive of entry to a prize draw
for one of twenty shopping vouchers worth MYR 100 (USD 23) each. The teachers were
also particularly helpful in distributing the questionnaire and encouraged parent’s
consent during data collection.
Sample selection
There might be a criticism about sample selection bias in this study because of
demographic dissimilarities between the fluoridated and non-fluoridated areas. The
distribution of parents’ education level was almost similar in both areas, except there
were more fathers with college education level in the fluoridated area (15%) than those
in non-fluoridated area (10%). Similar patterns were observed in terms of mothers’
education level. Most fathers in the fluoridated area had a higher income in comparison
to those in non-fluoridated area. However the difference was not obvious in terms of
mother’s income level. The majority of the mothers’ in both areas earned less than MYR
1999. Eliminating variations in socioeconomic structure may not be possible due to
limited geographic areas available to act as negative controls (non-fluoridated). As
highlighted in many water fluoridation studies, having a comparable comparison
Page 271
253
community is often challenging. To date, about 77% of the Malaysia population receive
fluoridated water, thus the negative comparison is less readily available. In Peninsular
Malaysia, Kelantan is the only state that is not fluoridated. This is due to political reasons.
The state is ruled by the opposition and water fluoridation was discontinued in 1995.
Many attempts were made to reinstate water fluoridation in Kelantan. In 2006,
reinstitution of fluoridation began in two districts in that state namely, Pasir Mas (65.2%)
and Machang (65%) (Oral Health Division Ministry of Health Malaysia, 2011). In 2012,
the reinstitution of fluoridation expanded to several districts, which include Tumpat
(31.8%), Pasir Puteh (22.8%) and Kota Bahru (5.5%). However the coverage for the
whole population is still relatively low (Dental Division Kelantan Malaysia, 2012). These
districts were among the affluent areas within the state that were excluded from the
sampling frame. The exclusion of some districts explained the differences in terms of
socio-economic status between study populations. One state that is most comparable in
terms of demographic characteristics is Terengganu. However this state has a history of
temporary cessation of water fluoridation in 1999 because of the change in political
leadership and was not suitable to answer our research question. Negeri Sembilan was
found to be the closest state that matched the demographic profile to non-fluoridated state
and geographically feasible for data collection. The authors were aware that caries levels
are expected to differ by socio-demographic characteristics and these factors were
controlled for in the multivariate analysis.
Concentrations of fluoride level in the water
Concentrations of fluoride level in the water rely on the state technical report from each
studied area. Although no attempt was made to validate the fluoride concentration in the
water supply, data from the state technical report was considered reliable as it involves a
Page 272
254
rigorous monitoring process (Dental Division Negeri Sembilan Malaysia, 2012). In
addition, Negeri Sembilan is among the fluoridated states that has been reported to be
very consistent in maintaining fluoride levels as recommended by the Malaysian
Ministry of Health (Oral Health Division Ministry of Health Malaysia, 2011, Oral Health
Division Ministry of Health Malaysia, 2014).
Study instrument
Questionnaire development
The survey instrument used in this survey was previously used by the Malaysian National
Survey (Oral Health Division Ministry of Health Malaysia, 2001, Oral Health Division
Ministry of Health Malaysia, 2013) and Australian Child Dental Survey (Do, 2004) that
explored fluoride exposure history, oral hygiene habits and infant feeding practices
among children. Prior to use of the questionnaire, it was further revised, translated to the
Malay-language, face validated and piloted among a group of Malaysian children. The
internal consistency of the questionnaire was acceptable with a Cronbach’s alpha
(α>0.80) for this study (Field, 2009). The rigorous process of questionnaire development
is an added value to this study.
Self-reported behaviour
A common limitation with this type of study is that it relied on parents’ self-reported
behaviour. A reliance on self-report data is common in researching into many health-
related behaviours, such as diet, physical activity, smoking and alcohol use. There is a
potential risk that respondents tend to answer the questions towards what is socially
acceptable. For example in terms of oral hygiene habits, some parents appeared to be
Page 273
255
aware of the ideal toothbrushing frequency and fluoridated toothpaste. Several steps were
taken to minimize this bias by encouraging honesty and emphasized that the results
would not be individually identifiable.
In addition, effort was also made to validate parents’ self-reported answer on the use of
fluoridated toothpaste. A question on the ‘brand of toothpaste’ helped in validating
fluoridated and non-fluoridated toothpaste use amongst the respondents. The brands of
toothpaste used as reported by the respondents, were crosschecked with the list of type
of toothpastes available in the Malaysian market from the local studies (Musa and Saub,
1998, Tan, 2003). If the brand answered by the participants was not available in the list,
no correction was made in the data management, and the answer (fluoridated or non-
fluoridated toothpaste) was solely based on what was reported by the respondents.
Similarly, if the respondents answered more than one brand that have both fluoridated
and non-fluoridated toothpastes, no validation via toothpaste brand was attempted.
Recall bias
There was a possibility of recall bias in the questionnaire data. This is a common
limitation in this type of approach to data collection (Holloway and Ellwood, 1997). In
addition, the ability of parents to recall the nature of oral hygiene habits and infant
feeding practices were likely to become less accurate with the passage of time. It is
possible that the parents of the younger children probably provided more accurate data
because of the shorter time interval between the practicing of the habit and the answering
of the questionnaire. Nevertheless, retrospective methods of data collection are
commonly reported in the literature because of its practicality, time saving and cost-
effectiveness. The possible recall bias is not expected to systematically affect the
associations explored in this study.
Page 274
256
The questionnaire in this study was designed to minimize this bias. For instance with
regards to questions on oral hygiene habits (i.e. age started toothbrushing with
toothpaste), a point in time reference was used to aid responses and subsequent broad
categories were used in the analysis. The data management process also assists in
identifying and correcting some of the recall biases. One example relates to the question
on infant feeding practices. Respondents with missing or conflicting information were
excluded from further analysis. An example of conflicting information is when a
respondent reported ‘never fed with infant formula’ (Question 9) but answering the
following question on infant formula feeding time period (Question 10 and Question 11)
(Appendix 14).
Outcome assessment
Examiner reliability
Intra and inter-examiner reliability for caries and fluorosis assessment were substantial
to excellent according to the classification by Landis and Koch (1977). This adds credit
to the study and could be attributed to intensive training of the clinical and photographic
examiners and frequent refresher sessions. Additionally, a single trained examiner
carried out the clinical examination of caries and fluorosis. This approach improved the
reliability of the collected data since there was no inter-examiner variation.
Blinding of examiner
It could be argued that the examiner was not blind on the children’s residential status
during clinical examination. Ideally, the examination should be done at a neutral site.
For example, a study in Scotland relocated the study participants for clinical examination
to enable blinding assessment of oral health status between those from fluoridated and
Page 275
257
non-fluoridated areas (Stephen et al., 2002). However, in the present study, the location
of the research sites made it logistically impractical and impossible to do so. However,
this bias was minimized by having only one clinical examiner and blinded data entry.
The caries data were recorded on clinical examination forms and entered into ICDAS
software interface by research assistants, who were blinded towards children’s residential
status and unaware of the value of each code.
On the other hand, this consideration did not affect the quality of fluorosis data, because
it was scored blind using photographs. However, concerns might be raised in terms of
examiner bias of knowing the age of the children from the photographs. Although, the
examiners were blinded towards residential status, those from the younger age groups
may be identifiable based on the stage of dental development, apparent on the
photographs. The only way to overcome this issue is by examining cropped photographs
of two upper central incisors without showing other teeth. However, this approach could
be technically burdensome and extremely time consuming. Furthermore there are
potential issues with distortion and poor image quality with a ‘cropped photographs
technique’ (Do, 2004). Furthermore, this may defeat other benefits of using photographs
such as future use of the image for data comparison and examiner training.
Fluorosis assessment
In this study, maxillary central incisors were chosen as the sole site for the measurement
of fluorosis. Using only index teeth to measure fluorosis may cause underestimation of
the true fluorosis prevalence in the study population. However, restricting the analysis to
maxillary central incisors help in controlling of other potential confounders when
Page 276
258
examining all erupted permanent teeth. This includes minimising variation in dental
fluorosis due to tooth eruption status and variation between tooth types exposed to
different fluoride levels during dentition development (Evans and Stamm, 1991b). Using
the central incisors as the index teeth also has the advantage of using the teeth that are
likely to be of greatest aesthetic concern.
In terms of photographic assessment of fluorosis, only 12 photographs out of 1155
photographs were discarded due to poor quality. The low proportion of discarded
photographs could be attributed to the used of digital photography. This method allows
the examiner to evaluate the quality of the image captured during the clinical examination
immediately post exposure. The main problem faced in taking intra-oral photographs of
anterior teeth is specular reflection. Two alternative methods have been recommended to
overcome this problem. Firstly by using polarizing filters (Robertson and Toumba, 1999)
and secondly by taking photographs at an angle to ensure that the flash is not reflected
back into the lens (Cochran et al., 2004a, Pretty et al., 2012). The second method was
employed in this study as it was deemed appropriate with digital camera as the image
can be repeated if the quality of the image is not acceptable. This technique may be
subject to variability in the angle at which the camera is held and may lead to bias in
operator standardization. However this bias was likely to be of limited effect in the
present study as only one examiner operated the camera.
It may be argued that teeth with dental fluorosis may be confused with other
developmental defects of enamel such as molar incisor hypomineralisation (MIH). In
terms of clinical appearance, enamel opacities due to fluorosis are diffuse and bilaterally
distributed in contrast to the well-demarcated borders of hypomineralisation in MIH.
Page 277
259
The similarity of appearance is more obvious in moderate to severe forms, which present
as brownish and pitted enamel. It is acknowledged that the possibility of misclassification
may have occurred, however the chance of misclassification is low. This is supported by
data relating to the prevalence of moderate fluorosis in the non-fluoridated area (0.4%)
which can act as a reference group. If there were a misclassification of MIH as fluorosis
this would have also reflected on moderate fluorosis prevalence in the non-fluoridated
area. In addition, looking at the prevalence of MIH in Malaysia, the available data
reported prevalence of MIH was 16.9% with the majority of the condition in mild form,
and affecting mainly the first permanent molars rather than the incisors (Hussein et al.,
2015). Unlike fluorosis, to diagnose MIH, at least one first permanent molar has to be
affected and usually the condition is more sensitive to thermal stimuli (Lygidakis et al.,
2010, Alaluusua, 2010). This requirement can be assessed during clinical examination as
opposed to photographic examination. Thus, further research is needed to improve
assessment of MIH using photographs and how it can be done alongside other
developmental defects of enamel such as fluorosis.
In addition, there could have been some misclassification bias due to the difficulty in
distinguishing between moderate fluorosis with brownish pitting appearance and early
caries lesions. However this bias should be minimal due to the use of single clinical
examiner, adequate training and calibration exercise and substantial examiner reliability
scores for caries and fluorosis diagnosis.
Caries assessment
The 9 year-old children in this study are in the mixed dentition stage of dental
development. There is always some problem in determining if missing primary teeth in
Page 278
260
the mixed dentition is due to extraction due to dental caries or if the teeth have been lost
by natural exfoliation. In this study, the missing teeth were coded as unerupted based on
the chronological age of eruption of the primary teeth. If the primary teeth were missing
earlier than the chronological age, respondents were asked reasons for missing teeth. If
the respondents did not recall reasons for missing teeth (i.e. due to caries) they were
considered as missing due to natural exfoliation and the successor permanent tooth
recorded as unerupted. As this was an epidemiology study, radiographs were not taken
to identify missing teeth due to other reasons such as congenitally missing teeth or failure
of eruption.
The primary requirement for applying the ICDAS II system is the examination of clean
and dry teeth. This method of examination without doubt requires more instruments that
incur cost and prolong the examination period. The difference between D1 and D2 is
only based on whether the detection is viewed while wet (D2) or dry using compressed
air (D1). However, air drying of teeth using compressed air was not part of the diagnostic
process as this was considered impractical in the community setting as used in this study
(de Amorim et al., 2012). Drying teeth using gauze may not be an ideal condition to
reflect early caries lesion, D1. This may cause an underestimation of the true population
caries estimate for D1. However, the difference in methodology was not expected to have
a major impact on comparison with other studies that use the tradition DMF index, where
the threshold for a diagnosis of “decay” is into dentine.
ICDAS II consists of a two digit-code system and a new programme is required for
analysis. Challenges occur in analyzing ICDAS data in particular when several
Page 279
261
combination codes exist on the same surface. For example when restoration at tooth level
were observed on the same surface in the presence of one or more enamel or dentine
carious lesions. Whether the condition will be counted as a filling or as a carious lesion.
This problem was solved by creating cut off points for filling and caries at D1-3
(restoration supersedes caries, D4-6 caries supersedes restoration) as described in
methodology chapter (Section 4.7.1.2). Guidelines on how to analyse the combination
codes are not available, therefore a decision was made based on data reported from
previous studies (Agustsdottir et al., 2010, Cadavid et al., 2010, de Amorim et al., 2012,
Iranzo-Cortes et al., 2013).
External validity
Sample from this study is representative for the state of Kelantan and Negeri Sembilan
and suitable to infer the findings for population in Peninsular Malaysia. Results may not
be suitable for generalizing to the Borneo region of Malaysia due to differences in dietary
patterns, ethnic and cultural background.
Causal inference from cross sectional study
The cross-sectional nature of the data did not allow for confirmation of a causal
relationship. This limitation is particularly an issue for evaluation of risk factors
associated with caries and fluorosis (Beck, 1998). However, this limitation may not affect
the evaluation of a population-based preventive approach such as water fluoridation
because the intervention is at population-level and the majority (96.5%) of the
participants lived in a fluoridated community have access to fluoridated water supply.
Page 280
262
Chapter summary
To the best of authors’ knowledge, this is the first study that has investigated the impact
of downward adjustment of fluoride level from 0.7 to 0.5 ppm in the public water supply
on both fluorosis and dental caries as the outcome. The strengths of the study were its
excellent response rate, good examiner reliability, sound sampling technique and
representative sample size. The strength in outcome measurement includes blind-scoring
of photographs and caries scoring at different thresholds of severity using ICDAS II
criteria. The strength of the analysis is that a range of confounding factors were controlled
for in the multivariate model. There exist some limitations, which include recall bias,
self-reported behaviour of oral health and infant feeding practices and the cross-sectional
nature of the data. The present study provides evidence that the change in fluoride level
from 0.7 to 0.5 ppm has resulted in a change in fluorosis prevalence and also has
significant impact on caries prevalence at different thresholds of severity. Fluorosis
prevalence was associated with fluoride in the water and some factors in relation to
infant-feeding practices. Caries prevalence was associated with gender, fluoride in the
water and age started toothbrushing with toothpaste. The implications of the findings on
practice and future research are discussed in the next chapter.
Page 281
263
7 Conclusions and study implications
This chapter outlines the overall thesis conclusions in Section 7.1. This is followed by a
discussion of the implications of the study for policy, practice and future work in Section
7.2.
Conclusions
This thesis presents the results of two projects, collectively aimed at understanding the
impact on oral health of a downward adjustment of the concentration of fluoride in the
public water supply from 0.7 to 0.5 ppm. In doing so, a systematic review was conducted
to critically appraise the literature on stopping fluoridation or reducing the level of
fluoride level in the public water supply on dental caries and fluorosis. Findings
highlighted the gaps in knowledge and several methodological issues in this area of
research, such as lack of examiner blinding and control of confounders. The main study
aimed to evaluate the impact of a reduction in the fluoride level in the Malaysian water
supply on dental fluorosis and caries and explore risk factors associated with such
conditions. Effort was made to address some of the key issues with regards to
methodological issues and potential confounders highlighted in the systematic review
chapter.
The main study conclusions are presented to answer the research questions set out in
Chapter 3 as follows:
Page 282
264
Question 1. What is the prevalence and severity of dental fluorosis following a 0.2
ppm reduction of fluoride level in the public water supply?
The change in water fluoridation policy that reduced the concentration of fluoride in the
Malaysian water supply from 0.7 to 0.5 ppm, has resulted in a decrease in the prevalence
of fluorosis. The results confirm that the prevalence of dental fluorosis is sensitive to
even minor changes in fluoride exposure from drinking water. The decline in the
prevalence of fluorosis was observed across two birth cohorts who were at different
stages of tooth development when the policy initiative was introduced. Children who
were born after the introduction of the policy initiative had a lower prevalence of
fluorosis compared with those who were born before the introduction of the policy
initiative and whose first two years of life were not affected by the reduced fluoride level
in the water supply. However the difference in fluorosis prevalence between cohorts in
the fluoridated areas was not statistically significant.
Overall, fluorosis prevalence was significantly higher in the fluoridated area compared
to the non-fluoridated area. In terms of severity, most of the condition was categorised
as very mild and mild fluorosis.
Question 2. What is the prevalence and severity of dental caries following a 0.2 ppm
reduction of fluoride level in the public water supply?
Following the change in fluoride level, results show that children who were exposed to
0.5 ppm fluoride in the water remained significantly associated with lower caries
experience (D4-6MFT) than those who did not have any exposure. Analysis was
conducted between caries experience in fluoridated and non-fluoridated areas because
Page 283
265
direct comparison across birth cohorts was not possible due to different stages of dental
development and tooth eruption present in the 9 and 12 year-old age groups.
Examining caries prevalence using ICDAS II criteria enabled detection of caries at
different thresholds. Results showed that there was more enamel caries diagnosed than
dentine caries in both age groups and areas of residence. The inclusion of early caries
lesions contributed to higher overall caries score diagnosed using ICDAS II in
comparison to DMF score. Although the prevalence of early caries lesion is higher than
dentine caries, results indicate that the difference in the prevalence between fluoridated
and non-fluoridated is narrower when the caries is reported at this threshold (D1-6MFT).
Question 3. Has the policy measure to reduce the fluoride level in the water supply
maintained the preventive effect of dental caries and reduced the prevalence of
fluorosis?
Findings suggest that the caries preventive effect at 0.5 ppm between the fluoridated and
non-fluoridated areas remained statistically significant following reduction of fluoride
level in the water. However, it is important to highlight that the optimal fluoride
concentration of 0.5 ppm is effective in this study population that has widespread use of
fluoride toothpaste. In terms of fluorosis, the change in water fluoridation policy to 0.5
ppm has resulted in a decrease in fluorosis prevalence.
Question 4. Are there any other risk factors (in particular exposure to difference
sources of fluoride) associated with dental fluorosis?
Several factors were identified as risk factors for fluorosis in this study population. These
include the age at which finished breastfeeding finished, age when infant formula was
started and finished, the duration of formula use, exposure to fluoride in the water,
Page 284
266
parents’ education level, parents’ monthly income, use of infant formula, and type of
water used to reconstitute the formula. However, only two risk factors remained
significantly associated with higher fluorosis prevalence in a logistic regression model,
namely, exposure to fluoride from water and type of water used to reconstitute infant
formula. This confirms existing evidence that fluoride in the water has important
contribution to total fluoride intake and excessive exposure increases the risk of having
fluorosis.
Question 5. Are there any other risk factors (in particular exposure to difference
sources of fluoride) associated with dental caries?
In terms of non-modifying factors, children who were female, had parents’ with low
education level and low fathers’ monthly income were significantly associated with high
caries prevalence. After controlling for other factors in the logistic regression model, the
fluoride level in the water supply and type of water used to reconstitute formula remained
significantly associated with the prevalence of dentine caries (D4-6MFT). Gender and
exposure to fluoride level in the water supply were the significant factors related to the
prevalence of dental caries at all levels of severity (D1-6MFT).
Overall conclusion
This study provides evidence to further support the effectiveness of water fluoridation in
caries prevention. Results provide support to the policy initiative of the reduction of
fluoride level from 0.7 to 0.5 ppm in Malaysian water supply. Modification to the
fluoridation policy has reduced fluorosis and maintained a caries prevention benefit.
Several factors were found to be associated with fluorosis and caries prevalence. While
Page 285
267
the finding of this study contributes to the knowledge of the impact of reducing fluoride
level in the water supply on dental caries and fluorosis, future research is still needed to
confirm the effectiveness of such a reduction in the longer term. Future research could
address some of the limitations and new research questions raised from this study.
Study implications
7.2.1 Implications for policy and practice
While results indicate a reduction in the prevalence of dental fluorosis, the population
always needs close monitoring because it is an indication of the balance between the
benefit and the risks of the use of fluoride in the prevention of dental caries. Findings
from this study indicate that the use of fluoridated tap water to reconstitute infant formula
milk was significantly associated with higher fluorosis prevalence. This poses an
important question as to whether there is a need to develop a guideline with regards to
infant formula preparations in Malaysia, in particular to those living in fluoridated areas.
More research is needed to further examine the contribution of this factor and type of
infant formula with regards to fluorosis. Looking at the international evidence, there is a
variation across different countries in relation to advice regarding the use of infant
formula. For example in the United States, the American Dental Association suggested
that those who are concerned about their children’s exposure to fluoride should use
ready-to-feed formula or should reconstituted the formula with water that has no or low
levels of fluoride (Berg et al., 2011). In Canada, no specific recommendation regarding
infant formula preparations was made.
Page 286
268
This study provides evidence to further support the effectiveness of water fluoridation in
the prevention of dental caries. Findings also provide support to the new Malaysian water
fluoridation policy of optimum fluoride concentration at 0.5 ppm. Although results
indicate that the preventive effect of water fluoridation at 0.5 ppm is still maintained
alongside the use of fluoridated toothpaste, dental caries is still widespread among the
Malaysian population. The high caries into dentine prevalence (40.2% at age 9 and 53.5%
at age 12) in Kelantan indicates there is an urgent need to reinstate and expand the
coverage of water fluoridation in Kelantan. It is acknowledged that expansion of water
fluoridation programmes is politically challenging and requires lengthy and complex
procedures before it can be implemented. Another issue to consider is targeting advice
on fluoride use in relation to fluoridation status. At the present time in Malaysia similar
advice is given regardless of exposure to fluoridated or non-fluoridated water.
In addition, advice on the information of water fluoridation status, the use of fluoride
toothpaste and infant formula must be disseminated to parents and caregivers before or
as soon as possible after the birth of a child. This is important since the first years of life
are critical in terms of the prevention of fluorosis. While dental attendance before the
age of 2 years is uncommon, contact with other health professionals (e.g. midwives) and
nursery caregivers is high. Thus, collaboration with these providers is important to
improve dissemination of oral health information. A system of oral health care of
antenatal mothers and in early childhood care has been implemented by the Ministry of
Health, Malaysia. Therefore, these programmes can be used as a platform to collaborate
and emphasise on the importance of maximising caries prevention and minimising
fluorosis.
Page 287
269
Although there was a decline in terms of moderate fluorosis (from 10.9% to 6.7%)
following reduction of fluoride concentration in the water supply, continuing efforts
should be made to monitor fluorosis at this level of severity. This warrants another
research question whether 0.5 ppm is an appropriate level of fluoride concentration in
Malaysian drinking water. The optimal fluoride level in the drinking water has
traditionally been calculated using Galagan formula, which estimated the daily water
intake under different temperatures condition in the US during the late 1950s (Galagan
et al., 1957). The formula was proposed for American children, presumed that 44% of
their total fluid intake was milk with negligible fluoride levels. However, it can be argued
whether this formula is appropriate for determining fluoride level in other countries with
different climatic conditions and fluid consumption. A study conducted in Pakistan used
a modification to the original Galagan formula on the basis of different fluid consumption
patterns (especially a low intake of milk) among the Pakistan population (Khan et al.,
.2004). Results indicated that the appropriate level of fluoride for Pakistan with an
average temperature of 29 degrees was 0.39 ppm. Therefore, further research is needed
to determine any further revision to water fluoridation policy in Malaysia.
Page 288
270
7.2.2 Implications for future research
Results from this study were based on a single point-survey that compared
children in two birth cohorts who were exposed to different fluoride level in the
water supply during tooth development. This study designs is most relevant to
assess dental fluorosis. Whether fluoride concentration at 0.7 ppm is better than
0.5 ppm in reducing caries prevalence remains unanswered. As a randomized
control trial was not an option and a longitudinal study would be expensive to
conduct, a two-point survey with a comparison group should be considered.
Ideally a study with a positive control (still fluoridated at a higher level)
community is needed to confirm the findings.
Future work should incorporate measurement of tap water consumption. This
information would be useful to explore the relationship of water intake and
outdoor temperature among children and adults. In addition, fluid consumption
from non-tap water such as processed beverages and foods should also be
considered.
The present study only collected data on feeding practices during infancy with a
focus on infant formula and breast-feeding practices. Other important variables
that were not measured in this study are weaning and dietary patterns. This should
be addressed in future work.
Further research is necessary to determine the actual fluoride level of infant
formula and infant foods in the Malaysian market that require reconstitution with
liquid prior to consumption. These data would be useful to assist in formulating
advice with regards to infant feeding practices.
Page 289
271
Future research should also consider measurement and validation of the
concentration of fluoridated toothpaste available in the Malaysian market. This is
particularly useful to explore the association of the combined effect of water
fluoridation at 0.5 ppm and fluoride toothpaste at specific concentrations.
Therefore these two programmes can be endorsed with a coherent link with each
other.
This study only focused on the child population, future work should consider
evaluating the downward adjustment of fluoride level on adults’ oral health
status.
Page 290
272
7.2.3 Recommendations
In general, continuation and expansion of water fluoridation at 0.5 ppm is recommended
for the Malaysian population. It is important to regularly monitor and evaluate the impact
of water fluoridation on caries and fluorosis. Relevant data would assist in promotion,
maintenance and regulation of water fluoridation, as well as guidance on the use of other
forms of fluoride.
The World Health Organization has recommended a range of 0.5 to 1.0 ppm for artificial
fluoridation (World Health Organization, 2004 ). It was further emphasised in the
guideline that the value is not ‘fixed’ but is intended to be adapted to take account of
local conditions of specific countries. The present study was conducted in a tropical
country with average temperatures of 27 to 30 degrees Celsius (Malaysian Metrological
Department, 2017). Findings indicate that fluoridated water at 0.5 ppm concentration
further reduce fluorosis prevalence without compromising caries preventive effect. The
optimal level of 0.5 ppm is appropriate in warmer climates when combined with exposure
to fluoride containing toothpaste. The findings could be relevant to other tropical and
subtropical countries in setting up optimal fluoride concentration in the water.
Page 291
273
References
ADAIR, S. M., HANES, C. M., M., R. C. & WHITFORD, G. M. 1999. Dental caries
and flurosis among children in a rural Georgia area. Pediatric Dentistry, 21, 81-
85.
AGUSTSDOTTIR, H., GUDMUNDSDOTTIR, H., EGGERTSSON, H., JONSSON, S.
H., GUDLAUGSSON, J. O., SAEMUNDSSON, S. R., ELIASSON, S. T.,
ARNADOTTIR, I. B. & HOLBROOK, W. P. 2010. Caries prevalence of
permanent teeth: a national survey of children in Iceland using ICDAS.
Community Dentistry and Oral Epidemiology, 38, 299-309.
AINI, M., FAKHRUL-RAZI, A., MUMTAZAH, O. & CHEN, J. M. 2007. Malaysian
households' drinking water practices: A case study. The International Journal of
Sustainable Development and World Ecology, 14, 503-510.
AL-ALOUSI, W., JACKSON, D., CROMPTON, G. & JENKINS, O. C. 1975. Enamel
mottling in a fluoride and in a non-fluoride community. A study. British Denalt
Journal, 138, 9-15.
ALALUUSUA, S. 2010. Aetiology of Molar-Incisor Hypomineralisation: A systematic
review. European Archives of Paediatric Dentistry, 11, 53-58.
ALMERICH-SILLA, J. M., BORONAT-FERRER, T., M., M.-C. J. & IRANZO-
CORTES, J. E. 2014. Caries prevalence in children from Valencia (Spain) using
ICDAS II criteria, 2010. Medicina Oral Patologia Oral Cirugia Bucal, 19,
e574-580.
AMARRA, M. S., KHOR, G. L. & CHAN, P. 2016. Intake of added sugar in Malaysia:
a review. Asia Pacific Journal of Clinical Nutrition, 25, 227-240.
ANGELILLO, I., TORRE, I., NOBILE, C. & VILLARI, P. 1999. Caries and fluorosis
prevalence in communities with different concentrations of fluoride in the
water. Caries Research, 33, 114-122.
ATTWOOD, D. & BLINKHORN, A. 1988. Trends in dental health of ten-year-old
schoolchildren in South-West Scotland after cessation of water fluoridation. The
Lancet, 332, 266-268.
ATTWOOD, D. & BLINKHORN, A.S. 1989. A reassessment of the dental health of
urban Scottish schoolchildren following the cessation of water
fluoridation. Community Dental Health, 6, 207-214.
AUSTRALIAN INSTITUTE OF HEALTH AND WELFARE, CHRISOPOULOS, S.,
HARFORD, J. E. & ELLERSHAW, A. 2016. Oral health status and dental
care in Australia: key facts and figure 2015. Canberra: AIHW.
AUSTRALIAN NATIONAL HEALTH AND MEDICAL RESEARCH COUNCIL
2007. A systematic review of the efficacy and safety of fluoridation. Canberra:
National Health and Medical Research Council, Australia.
BAELUM, V., MANJI, F. & FEJERSKOV, O. 1986. Posteruptive tooth age and
severity of dental fluorosis in Kenya. European Journal of Oral Sciences, 94,
405-410.
Page 292
274
BANTING, D. W. 1999. International fluoride supplement recommendations.
Community Dentistry and Oral Epidemiology, 27, 57-61.
BANTING, D., EGGERTSSON, H., EKSTRAND, K.R., ZANDONÁ, A.F., ISMAIL,
A.I., LONGBOTTOM, C., PITTS, N.B., REICH, E., RICKETTS, D.,
SELWITZ, R. & SOHN, W. 2005. Rationale and evidence for the international
caries detection and assessment system (ICDAS II). Ann Arbor, 1001, 48109-
1078.
BARDSEN, A. 1999. "Risk periods" associated with the development of dental
fluorosis in maxillary permanent central incisors: a meta-analysis. Acta
Odontologica Scandinavica, 57, 247-256.
BARDSEN, A. & BJORVATN, K. 1998. Risk periods in the development of dental
fluorosis. Clinical Oral Investigations, 2, 155-160.
BECK, J. D. 1998. Risk revisited. Community Dentistry and Oral Epidemiology, 26,
220-225.
BELTRÁN-AGUILAR, E. D., BARKER, L. & DYE, B. A. 2010. Prevalence and
severity of dental fluorosis in the United States, 1999-2004. NCHS Data Brief,
53, 1-8. Centers for Disease Control and Prevention.
BELTRÁN-AGUILAR, E. D., GRIFFIN, S. O. & LOCKWOOD, S. A. 2002.
Prevalence and trends in enamel fluorosis in the United States from the 1930s to
the 1980s. The Journal of the American Dental Association, 133, 157-165.
BENAZZI, A. S., DA SILVA, R. P., DE MENEGHIM, M., AMBROSANO, G. M. &
PEREIRA, A. C. 2012. Dental caries and fluorosis prevalence and their
relationship with socioeconomic and behavioural variables among 12-year-old
schoolchildren. Oral Health and Preventive Dentistry, 10, 65-73.
BERG, J., GERWECK, C., HUJOEL, P. P., KING, R., KROL, D. M., KUMAR, J.,
LEVY, S., POLLICK, H., WHITFORD, G. M., STROCK, S.,
ARAVAMUDHAN, K., FRANTSVE-HAWLEY, J., MEYER, D. M. 2011.
Evidence-based clinical recommendations regarding fluoride intake from
reconstituted infant formula and enamel fluorosis: a report of the American
Dental Association Council on Scientific Affairs. The Journal of the American
Dental Association, 142, 79-87.
BERKOWITZ, B., HOLLAND, G. & MOXHAM, B. 1992. Oral Anatomy. Woulf
Publications.
BRAGA, M. M., OLIVEIRA, L. B., BONINI, G. A., BONECKER, M. & MENDES, F.
M. 2009. Feasibility of the International Caries Detection and Assessment
System (ICDAS-II) in epidemiological surveys and comparability with standard
World Health Organization criteria. Caries Research, 43, 245-249.
BRATTHALL, D. 2000. Introducing the Significant Caries Index together with a
proposal for a new global oral health goal for 12-year-olds. International Dental
Journal, 50, 378-384.
BRATTHALL, D., HÄNSEL‐PETERSSON, G. & SUNDBERG, H. 1996. Reasons for
the caries decline: what do the experts believe? European Journal of Oral
Sciences, 104, 416-422.
Page 293
275
BROADBENT, J. & THOMSON, W. 2005. For debate: problems with the DMF index
pertinent to dental caries data analysis. Community Dentistry and Oral
Epidemiology, 33, 400-409.
BRONCKERS, A.L., LYARUU, D.M. & DEN BESTEN, P.K. 2009. The impact of
fluoride on ameloblasts and the mechanisms of enamel fluorosis. Journal of
Dental Research, 88, 877-893.
BROTHWELL, D. & LIMEBACK, H. 2003. Breastfeeding is protective against dental
fluorosis in a nonfluoridated rural area of Ontario, Canada. Journal of Human
Lactation, 19, 386-390.
BROWN, A. E., RAYNOR, P., BENTON, D. & LEE, M. D. 2010. Indices of multiple
deprivation predict breastfeeding duration in England and Wales. European
Journal of Public Health, 20, 231-235.
BROWN, M. D. & AARON, G. 1991. The effect of point-of-use water conditioning
systems on community fluoridated water. Pediatric Dentistry, 13, 35-38.
BROWNE, D., WHELTON, H. & O'MULLANE, D. 2005. Fluoride metabolism and
fluorosis. Journal of Dentistry, 33, 177-186.
BURT, B. A. 1999. The case for eliminating the use of dietary fluoride supplements for
young children. Journal of Public Health Dentistry, 59, 269-274.
BURT, B. A. 2004. Pre‐and posteruptive fluoride: do both actions control caries?
Journal of Public Health Dentistry, 64, 47-49.
BURT, B. A., KEELS, M. A. & HELLER, K. E. 2000. The effects of a break in water
fluoridation on the development of dental caries and fluorosis. Journal of
Dental Research, 79, 761-769.
BURT, B. A., KEELS, M. A. & HELLER, K. E. 2003. Fluorosis development in seven
age cohorts after an 11-month break in water fluoridation. Journal of Dental
Research, 82, 64-68.
BUZALAF, M. A., DE ALMEIDA, B. S., OLYMPIO, K. P., DA, S. C. V. E. & DE, C.
S. P. S. H. 2004. Enamel fluorosis prevalence after a 7-year interruption in
water fluoridation in Jau, Sao Paulo, Brazil. Journal of Public Health Dentistry,
64, 205-208.
BUZALAF, M. A. & LEVY, S. M. 2011. Fluoride intake of children: considerations
for dental caries and dental fluorosis. Monographs in Oral Science, 22, 1-19.
BUZALAF, M.A. & WHITFORD, G.M. 2011. Fluoride metabolism. Monographs in
Oral Science, 22, 20-36.
CADAVID, A. S., LINCE, C. M. & JARAMILLO, M. C. 2010. Dental caries in the
primary dentition of a Colombian population according to the ICDAS criteria.
Brazilian Oral Research, 24, 211-216.
CANADIAN DENTAL ASSOCIATION. 2007. Fluoride and baby formula. Journal of
Canadian Dental Association, 73, 111.
CHANKANKA, O., LEVY, S. M., WARREN, J. J. & CHALMERS, J. M. 2010. A
literature review of aesthetic perceptions of dental fluorosis and relationships
with psychosocial aspects/oral health‐related quality of life. Community
Dentistry and Oral Epidemiology, 38, 97-109.
Page 294
276
CHEN, C. J. A., LING, K. S., ESA, R., CHIA, J. C., EDDY, A. & YAW, S. L. 2010. A
school‐based fluoride mouth rinsing programme in Sarawak: a 3‐year field
study. Community Dentistry and Oral Epidemiology, 38, 310-314.
CHO, H. J., JIN, B. H., PARK, D. Y., JUNG, S. H., LEE, H. S., PAIK, D. I. & BAE,
K. H. 2014. Systemic effect of water fluoridation on dental caries prevalence.
Community Dentistry and Oral Epidemiology, 42, 341-348.
CHUN, K.J., CHOI, H.H. & LEE, J.Y. 2014. Comparison of mechanical property and
role between enamel and dentin in the human teeth. Journal of Dental
Biomechanics, 5.
CLARK, D. C. 1994. Trends in prevalence of dental fluorosis in North America.
Community Dentistry and Oral Epidemiology, 22, 148-152.
CLARK, D. C., SHULMAN, J. D., MAUPOME, G. & LEVY, S. M. 2006. Changes in
dental fluorosis following the cessation of water fluoridation. Community
Dentistry and Oral Epidemiology, 34, 197-204.
CLARKSON, J. 1989. Review of terminology, classifications, and indices of
developmental defects of enamel. Advances in Dental Research, 3, 104-109.
CLIFFORD, H., OLSZOWY, H., YOUNG, M., HEGARTY, J. & CROSS, M. 2009.
Fluoride content of powdered infant formula meets Australian Food Safety
Standards. Australian and New Zealand Journal of Public Health, 33, 573-576.
COCHRAN, J. A., KETLEY, C. E., SANCHES, L., MAMAI‐HOMATA, E., OILA, A.
M., ARNADOTTIR, I. B., VAN LOVEREN, C., WHELTON, H. P. &
O'MULLANE, D. M. 2004a. A standardized photographic method for
evaluating enamel opacities including fluorosis. Community Dentistry and Oral
Epidemiology, 32, 19-27.
COCHRAN, J. A., KETLEY, C. E., ARNADOTTIR, I. B., FERNANDES, B.,
KOLETSI-KOUNARI, H., OILA, A. M., VAN LOVEREN, C., WHELTON,
H. P. & O'MULLANE, D. M. 2004b. A comparison of the prevalence of
fluorosis in 8-year-old children from seven European study sites using a
standardized methodology. Community Dentistry and Oral Epidemiology, 32,
28-33.
CRESSEY, P. 2010. Dietary fluoride intake for fully formula-fed infants in New
Zealand: impact of formula and water fluoride. Journal of Public Health
Dentistry, 70, 285-291.
CRUZ-ORCUTT, N., WARREN, J. J., BROFFITT, B., LEVY, S. M. & WEBER-
GASPARONI, K. 2012. Examiner reliability of fluorosis scoring: a comparison
of photographic and clinical examination findings. Journal of Public Health
Dentistry, 72, 172-175.
DABEKA, R. W., MCKENZIE, A. D., CONACHER, H. B. & KIRKPATRICK, D. C.
1982. Determination of fluoride in Canadian infant foods and calculation of
fluoride intakes by infants. Canadian Journal of Public Health, 73, 188-191.
DE AMORIM, R. G., FIGUEIREDO, M. J., LEAL, S. C., MULDER, J. &
FRENCKEN, J. E. 2012. Caries experience in a child population in a deprived
area of Brazil, using ICDAS II. Clinical Oral Investigations, 16, 513-520.
Page 295
277
DEAN, H. T. 1934. Classification of mottled enamel diagnosis. The Journal of the
American Dental Association, 21, 1421-1426.
DEAN, H. T. 1938. Endemic fluorosis and its relation to dental caries, US
Government Printing Office.
DEAN, H.T. 1946. Epidemiological studies in the United States. Dental caries and
fluorine, 5-31.
DEAN, H. T., ARNOLD, F. A. J. & ELVOVE, E. 1942. Domestic water and dental
caries. V. Additional studies of relation of fluoride domestic waters to dental
caries experience in 4,425 white children, aged 12-14 years, of 13 cities in 4
states. Public Health Reports, 57, 1155-1179.
DEN BESTEN, P. K. 1999. Mechanism and timing of fluoride effects on developing
enamel. Journal of Public Health Dentistry, 59, 247-251.
DEN BESTEN, P. & LI, W. 2011. Chronic fluoride toxicity: dental fluorosis. In
Fluoride and the Oral Environment. Monographs in Oral Science, 22, 81–96.
DENTAL DIVISION JOHOR MALAYSIA 1986. Epidemiological survey of
developmental defects of dental enamel in Johor. Ministry of Health, Malaysia.
DENTAL DIVISION KELANTAN MALAYSIA. 2012. State Technical Report.
[Laporan Paras Fluorida di Loji Rawatan Air dan Retikulasi, in Malay
language]. Ministry of Health, Malaysia.
DENTAL DIVISION NEGERI SEMBILAN MALAYSIA. 2012. State Technical
Report. [Laporan Paras Fluorida di Loji Rawatan Air dan Retikulasi, in Malay
language]. Ministry of Health, Malaysia.
DEPARTMENT OF STATISTICS MALAYSIA. 2016. Current population estimates,
Malaysia 2014-2016. Available: www.dosm.gov.my [Accessed: 20/03/2014].
DEPARTMENT OF SURVEY AND MAPPING MALAYSIA. 2013. Malaysia Report
Map. The Department of Survey and Mapping Malaysia.
DHAR, V., & BHATNAGAR, M. 2009. Physiology and toxicity of fluoride. Indian
Journal of Dental Research, 20, 350-355.
DHSS 1969. The fluoridation studies in the United Kingdom and results achieved after
11 years. A report of the Committee on Research into Fluoridation. London:
Her Majesty's Stationary Office.
DO, L. C. 2004. Fluoride exposure, dental fluorosis and caries among South
Australian children. PhD thesis, University of Adelaide, Australia.
DO, L. G., HA, D. H. & SPENCER, A.J. 2015. Factors attributable for the prevalence
of dental caries in Queensland children. Community Dentistry and Oral
Epidemiology, 43, 397-405.
DO, L. G., HA, D. H. & SPENCER, A. J. 2016. Natural history and long-term impact
of dental fluorosis: a prospective cohort study. Medical Journal of Australia,
204, 25.
DO, L. G., LEVY, S. M. & SPENCER, A. J. 2012. Association between infant formula
feeding and dental fluorosis and caries in Australian children. Journal of Public
Health Dentistry, 72, 112-121.
Page 296
278
DO, L. G. & SPENCER, A. J. 2007. Decline in the prevalence of dental fluorosis
among South Australian children. Community Dentistry and Oral
Epidemiology, 35, 282-291.
DRISCOLL, W. S., HEIFETZ, S. B. & KORTS, D. C. 1974. Effect of acidulated
phosphate-fluoride chewabie tablets on dental caries in schoolchildren: results
after 30 months. The Journal of the American Dental Association, 89, 115-120.
DYE, B. A., TAN, S., SMITH, V., LEWIS, B. G., BARKER, L. K., THORNTON-
EVANS, G., EKE, P., BELTRÁN-AGUILAR, E., HOROWITZ, A. & LI, C.
2007. Trends in oral health status: United States, 1988-1994 and 1999-2004.
Vital and health statistics. Series 11, Data from the national health survey, 1-92.
EKSTRAND, J. 1989. Fluoride intake in early infancy. Journal of Nutrition, 119,
1856-1860.
EKSTRAND, J., HARDELL, L. I. & SPAK, C. J. 1984. Fluoride balance studies on
infants in a 1-ppm-water-fluoride area. Caries Research, 18, 87-92.
EKSTRAND, J., ZIEGLER, E.E., NELSON, S.E. & FOMON, S.J. 1994. Absorption
and retention of dietary and supplemental fluoride by infants. Advances in
Dental Research, 8, 175-180.
ELLWOOD, R., O'MULLANE, D., CLARKSON, J. & DRISCOLL, W. 1994. A
comparison of information recorded using the Thylstrup Fejerskov index, Tooth
Surface Index of Fluorosis and Developmental Defects of Enamel index.
International Dental Journal, 44, 628-636.
ESA, R. & RAZAK, I. 2001. Dental fluorosis and caries status among 12-13 year-old
school children in Klang district, Malaysia. Annals of Dentistry, 8, 20-24.
EVANS, R. W. 1989. Changes in dental fluorosis following an adjustment to the
fluoride concentration of Hong Kong's water supply. Advances in Dental
Research, 3, 154-160.
EVANS, D. J. 1991. A study of developmental defects in enamel in 10-year-old high
social class children residing in a non-fluoridated area. Community Dental
Health, 8, 31-38.
EVANS, R. W. & STAMM, J. W. 1991a. An epidemiologic estimate of the critical
period during which human maxillary central incisors are most susceptible to
fluorosis. Journal of Public Health Dentistry, 51, 251-259.
EVANS, R. W. & STAMM, J. W. 1991b. Dental fluorosis following downward
adjustment of fluoride in drinking water. Journal of Public Health Dentistry,
51, 91-98.
EVANS, R. W. & DARVELL, B. W. 1995. Refining the estimate of the critical period
for susceptibility to enamel fluorosis in human maxillary central incisors.
Journal of Public Health Dentistry, 55, 238-249.
FANNING, E. A., GOTJAMANOS, T. & VOWLES, N. J. 1968. The use of fluoride
dentifrices in the control of dental caries: methodology and results of a clinical
trial. Australian Dental Journal, 13, 201-206.
FDI (WORLD HEALTH FEDERATION). 1992. A review of the developmental
defects of enamel index (DDE Index). Commission on Oral Health, Research &
Page 297
279
Epidemiology. Report of an FDI Working Group. International Dental Journal,
42, 411-426.
FEATHERSTONE, J. D. 1999. Prevention and reversal of dental caries: role of low
level fluoride. Community Dentistry and Oral Epidemiology, 27, 31-40.
FEATHERSTONE, J. D. 2000. The science and practice of caries prevention. The
Journal of the American Dental Association, 131, 887-899.
FEATHERSTONE, J. 2004a. The continuum of dental caries: evidence for a dynamic
disease process. Journal of Dental Research, 83, C39-C42.
FEATHERSTONE, J. D. 2004b. Topical effects of fluoride in the reversal and
prevention of dental decay. Journal of Public Health Dentistry, 64, 32-34.
FEDERAL PANEL ON COMMUNITY WATER FLUORIDATION. 2015. U.S.
Public Health Service recommendation for fluoride concentration in drinking
water for the prevention of dental caries. Public Health Reports, 130, 1-14.
FEJERSKOV, O., THYLSTRUP, A. & LARSEN, M. J. 1977. Clinical and structural
features and possible pathogenic mechanisms of dental fluorosis. European
Journal of Oral Sciences, 85, 510-534.
FEJERSKOV, O., MANJI, F. & BAELUM, V. 1988. Dental Fluorosis: a Handbook
for Health Workers. Munksgaard, Copenhagen.
FEJERSKOV, O., MANJI, F. & BAELUM, V. 1990. The nature and mechanisms of
dental fluorosis in man. Journal of Dental Research, 69, 692-700.
FEJERSKOV, O., LARSEN, M. J., RICHARDS, A. & BAELUM, V. 1994. Dental
tissue effects of fluoride. Advances in Dental Research, 8, 15-31.
FEJERSKOV, O. 1997. Concepts of dental caries and their consequences for
understanding the disease. Community Dentistry and Oral Epidemiology, 25, 5-
12.
FIELD, A. 2009. Discovering Statistics using SPSS, London, Saga.
FISHER, J., GLICK, M. & COMMITTEE, F. W. D. F. S. 2012. A new model for
caries classification and management: the FDI World Dental Federation caries
matrix. The Journal of the American Dental Association, 143, 546-551.
FRENCKEN, J. E., DE AMORIM, R. G., FABER, J. & LEAL, S. C. 2011. The Caries
Assessment Spectrum and Treatment (CAST) index: rational and development.
International Dental Journal, 61, 117-123.
GALAGAN, D. J., VERMILLION, J. R., NEVITT, G. A., STADT, Z. M. & DART, R.
E. 1957. Climate and fluid intake. Public Health Reports, 72, 484-490.
GLASS, R. 1990. Water purification systems and recommendations for fluoride
supplementation. ASDC Journal of Dentistry for Children, 58, 405-408.
GOLKARI, A., SABOKSEIR, A., PAKSHIR, H. R., DEAN, M. C., SHEIHAM, A. &
WATT, R. G. 2011. A comparison of photographic, replication and direct
clinical examination methods for detecting developmental defects of enamel.
BMC Oral Health, 11, 16.
GRIFFIN, S. Q., GOOCH, B. F., LOCKWOOD, S. A. & L., T. S. 2001. Quantifying
the diffused benefit from water fluoridation in the United States. Community
Dentistry and Oral Epidemiology, 29, 120-129.
Page 298
280
GU, X. S. & SHEN, Y. M. 1989. [Effects of stopping water fluoridation on prevalence
of dental caries in children, in Chinese language]. Zhonghua Yu Fang Yi Xue Za
Zhi, 23, 346-348.
HAUGEJORDEN, O. & BIRKELAND, M.J. 2005. Analysis of the ups and downs of
caries experience among Norwegian children aged five years between 1997 and
2003. Acta Odontologica Scandinavica, 63, 115-122.
HAUGEJORDEN, O. & BIRKELAND, M.J. 2006. Ecological time-trend analysis of
caries experience at 12 years of age and caries incidence from age 12 to 18
years: Norway 1985–2004. Acta Odontologica Scandinavica, 64, 368-375.
HE, L.H. & SWAIN, M.V. 2008. Understanding the mechanical behaviour of human
enamel from its structural and compositional characteristics. Journal of the
Mechanical Behavior of Biomedical Materials, 1, 18-29.
HECK, K. E., BRAVEMAN, P., CUBBIN, C., CHAVEZ, G. F. & KIELY, J. L. 2006.
Socioeconomic status and breastfeeding inititation among California mothers.
Public Health Reports, 121, 51-59.
HELLWIG, E. & LENNON, A. 2004. Systemic versus topical fluoride. Caries
Research, 38, 258-262.
HOLLENDER, L. & KOCH, G. 1969. Influence of topical application of fluoride on
rate of progress of carious lesions in children. A long-term roentgenographic
follow-up. Odontologisk Revy, 20, 37-41.
HOLLOWAY, P. J. & ELLWOOD, R. P. 1997. The prevalence, causes and cosmetic
importance of dental fluorosis in the UK. A review. Community Dental Health,
14, 148-155.
HOLM, A. K. & ANDERSSON, R. 1982. Enamel mineralization disturbances in 12-
year-old children with known early exposure to fluorides. Community Dentistry
and Oral Epidemiology, 10, 335-339.
HOLT, R. D., MORRIS, C. E., WINTER, G. B. & DOWNER, M. C. 1994. Enamel
opacities and dental caries in children who used a low fluoride toothpaste
between 2 and 5 years of age. International Dental Journal, 44, 331-341.
HONG, L., LEVY, S. M., BROFFITT, B., WARREN, J. J., KANELLIS, M. J.,
WEFEL, J. S. & DAWSON, D. V. 2006a. Timing of fluoride intake in relation
to development of fluorosis on maxillary central incisors. Community Dentistry
and Oral Epidemiology, 34, 299-309.
HONG, L., LEVY, S. M., WARREN, J. J., BROFFITT, B. & CAVANAUGH, J.
2006b. Fluoride intake levels in relation to fluorosis development in permanent
maxillary central incisors and first molars. Caries Research, 40, 494-500.
HOROWITZ, H. S., MAIER, F. J. & THOMPSON, M. B. 1964. The Effect of Partial
Defluoridation of a Water Supply on Dental Fluorosis-Results after 11 Years.
American Journal of Public Health and the Nations Health, 54, 1895-1904.
HOROWITZ, H. S. & HEIFETZ, S. B. 1972. The effect of partial defluoridation of a
water supply on dental fluorosis--final results in Bartlett, Texas, after 17 years.
American Journal of Public Health, 62, 767-769.
Page 299
281
HOROWITZ, H. S., HEIFETZ, S. B. & DRISCOLL, W. S. 1972. Partial defluoridation
of a community water supply and dental fluorosis. Health Services Reports, 87,
451.
HOROWITZ, H. S., DRISCOLL, W. S., MEYERS, R. J., HEIFETZ, S. B. &
KINGMAN, A. 1984. A new method for assessing the prevalence of dental
fluorosis--the Tooth Surface Index of Fluorosis. The Journal of the American
Dental Association, 109, 37-41.
HOROWITZ, H. S. 1986. Indexes for measuring dental fluorosis. Journal of Public
Health Dentistry, 46, 179-183.
HUJOEL, P. P., ZINA, L. G., MOIMAZ, S. A. & CUNHA-CRUZ, J. 2009. Infant
formula and enamel fluorosis: a systematic review. The Journal of the
American Dental Association, 140, 841-854.
HUSSEIN, A.,S, FAISAL, M., HARON, M., GHANIM, A.M. & ABU-HASSAN, M.I.
2015. Distribution of Molar Incisor Hypomineralization in Malaysian Children
Attending University Dental Clinic. Journal of Clinical Pediatric Dentistry,39,
219-223.
IHEOZOR-EJIOFOR, Z., WORTHINGTON, H. V., WALSH, T., O'MALLEY, L.,
CLARKSON, J. E., MACEY, R., ALAM, R., TUGWELL, P., WELCH, V. &
GLENNY, A. M. 2015. Water fluoridation for the prevention of dental caries.
Cochrane Database Systematic Reviews, 6, CD010856.
INSTITUTE OF MEDICINE 1997. Fluoride, In: Dietary reference intakes for calcium,
phosphorus, magnesium, vitamin D, and fluoride., Washington, DC, National
Academy Press.
INTERNATIONAL CARIES DETECTION AND ASSESSMENT SYSTEM (ICDAS).
E-learning programme. Available: https://www.icdas.org [Accessed
10/02/2014].
INTERNATIONAL CARIES DETECTION AND ASSESSMENT SYSTEM (ICDAS)
COORDINATING COMMITTEE. 2009. Criteria Manual International Caries
Detection and Assessment System (ICDAS II). Available:
https://www.icdas.org/uploads/ICDAS%20Criteria%20Manual%20Revised%20
2009_2.pdf [Accessed: 30/01/2014].
IRANZO-CORTES, J. E., M., M.-C. J. & ALMERICH-SILLA, J. M. 2013. Caries
diagnosis: agreement between WHO and ICDAS II criteria in epidemiological
surveys. Community Dental Health, 30, 108-111.
ISHII, T. & SUCKLING, G. 1986. The appearance of tooth enamel in children
ingesting water with a high fluoride content for a limited period during early
tooth development. Journal of Dental Research, 65, 974-977.
ISMAIL, A. I. 1994. Fluoride supplements: current effectiveness, side effects, and
recommendations. Community Dentistry and Oral Epidemiology, 22, 164-172.
ISMAIL, A. I. & BANDEKAR, R. R. 1999. Fluoride supplements and fluorosis: a
meta-analysis. Community Dentistry and Oral Epidemiology, 27, 48-56.
ISMAIL, A. I. & HASSON, H. 2008. Fluoride supplements, dental caries and fluorosis:
a systematic review. The Journal of the American Dental Association, 139,
1457-1468.
Page 300
282
ISMAIL, A. I. & MESSER, J. G. 1996. The risk of fluorosis in students exposed to a
higher than optimal concentration of fluoride in well water. Journal of Public
Health Dentistry, 56, 22-27.
ISMAIL, A., SOHN, W., TELLEZ, M., AMAYA, A., SEN, A., HASSON, H. &
PITTS, N. 2007. The International Caries Detection and Assessment System
(ICDAS): an integrated system for measuring dental caries. Community
Dentistry and Oral Epidemiology, 35, 170-178.
JOBSON, M. D., GRIMM 3RD, S., BANKS, K. & HENLEY, G. 1999. The effects of
water filtration systems on fluoride: Washington, DC metropolitan area. ASDC
Journal of Dentistry for Children, 67, 350-354.
JORDAN, W. 1962. The Austin School Health Study. American Journal of Public
Health, 52, 301.
KALSBEEK, H., KWANT, G. W., GROENEVELD, A., DIRKS, O. B., VAN ECK, A.
A. & THEUNS, H. M. 1993. Caries experience of 15-year-old children in The
Netherlands after discontinuation of water fluoridation. Caries Research, 27,
201-205.
KHAN, A., MOOLA, M. H. & CLEATON-JONES, P. 2005. Global trends in dental
fluorosis from 1980 to 2000: a systematic review. The South African Dental
Journal, 60, 418-421.
KHAN, A.A., WHELTON, H. & O'MULLANE, D. 2004. Determining the optimal
concentration of fluoride in drinking water in Pakistan. Community Dentistry
and Oral Epidemiology, 32,166-172.
KIDD, E.A. & FEJERSKOV, O. 2004. What constitutes dental caries? Histopathology
of carious enamel and dentin related to the action of cariogenic biofilms.
Journal of Dental Research, 83, C35-C38.
KING, N. M. & WEI, S. H. 1986. Developmental defects of enamel: a study of 12-
year-olds in Hong Kong. The Journal of the American Dental Association, 112,
835-839.
KING, N. M. 1989. Developmental defects of enamel in Chinese girls and boys in
Hong Kong. Advances in Dental Research, 3, 120-125.
KING, N. M., LING, J. Y., NG, B. V. & WEI, S. H. 1986. The dental caries status and
dental treatment patterns of 12-year-old children in Hong Kong. Journal of
Dental Research, 65, 1371-1374.
KLEIN, H., PALMER, C. E. & KNUTSON, J. W. 1938. Studies on dental caries: I.
Dental status and dental needs of elementary school children. Public Health
Reports (1896-1970), 751-765.
KOBAYASHI, S., KAWASAKI, K., TAKAGI, O., NAKAMURA, M., FUJII, N.,
SHINZATO, M., MAKI, Y. & TAKAESU, Y. 1992. Caries experience in
subjects18–22 years of age after 13 years’ discontinued water fluoridation in
Okinawa. Community Dentistry and Oral Epidemiology, 20, 81-83.
KOPARAL, E., ERTUGRUL, F. & OZTEKIN, K. 2000. Fluoride levels in breast milk
and infant foods. Journal of Clinical Pediatric Dentistry, 24, 299-302.
Page 301
283
KUNZEL, W. 1980. Effect of an interruption in water fluoridation on the caries
prevalence of the primary and secondary dentition. Caries Research, 14, 304-
310.
KUNZEL, W. & FISCHER, T. 1997. Rise and fall of caries prevalence in German
towns with different F concentrations in drinking water. Caries Research, 31,
166-173.
KUNZEL, W. & FISCHER, T. 2000. Caries prevalence after cessation of water
fluoridation in La Salud, Cuba. Caries Research, 34, 20-25.
KUNZEL, W., FISCHER, T., LORENZ, R. & BRUHMANN, S. 2000. Decline of
caries prevalence after the cessation of water fluoridation in the former East
Germany. Community Dentistry and Oral Epidemiology, 28, 382-389.
LALLOO, R., MYBURGH, N. G. & HOBDELL, M. H. 1999. Dental caries, socio-
economic development and national oral health policies. International Dental
Journal, 49, 196-202.
LALUMANDIER, J. A. & ROZIER, R. G. 1995. The prevalence and risk factors of
fluorosis among patients in a pediatric dental practice. Pediatric Dentistry, 17,
19-25.
LANDIS, J. R. & KOCH, G. G. 1977. The measurement of observer agreement for
categorical data. Biometrics, 33, 159-174.
LATIFAH, R. & RAZAK, I. A. 1989. Fluoride levels in infant formulas. The Journal
of Pedodontics, 13, 323-327.
LEGEROS, R. Z. & TUNG, M. S. 1983. Chemical stability of carbonate and
fluoridecontaining apatites. Caries Research, 17, 419-429.
LEKESOVA, I. 1998. [Fluorine in the prevention of dental caries, in Czech language ].
Cas Lek Cesk, 137, 201-206.
LEMKE, C. W., DOHERTY, J. M. & ARRA, M. C. 1970. Controlled fluoridation: the
dental effects of discontinuation in Antigo, Wisconsin. The Journal of the
American Dental Association, 80, 782-786.
LEWSEY, J. & THOMSON, W. 2004. The utility of the zero-inflated Poisson and
zero-inflated negative binomial models: a case study of cross-sectional and
longitudinal DMF data examining the effect of socio-economic
status. Community Dentistry and Oral Epidemiology, 32,183-189.
LIANG, C. 1998. [Evaluation on the effects of water defluoridation measures in China.
Research Group Evaluation on the Effects of Water Defluoridation Measures in
China, in Chinese language]. Wei Sheng Yan Jiu, 27, 16-28.
LIBERATI, A., ALTMAN, D. G., TETZLAFF, J., MULROW, C., GØTZSCHE, P. C.,
IOANNIDIS, J. P., CLARKE, M., DEVEREAUX, P. J., KLEIJNEN, J. &
MOHER, D. 2009. The PRISMA statement for reporting systematic reviews
and meta-analyses of studies that evaluate health care interventions: explanation
and elaboration. PLOS Medicine, 6, e1000100.
LISTL, S., JURGES, H. & WATT, R. G. 2016. Causal inference from observational
data. Community Dentistry and Oral Epidemiology, 44, 409-415.
LO, G. L. & BAGRAMIAN, R. A. 1996. Prevalence of dental fluorosis in children in
Singapore. Community Dentistry and Oral Epidemiology, 24, 25-27.
Page 302
284
LOH, K. H., YAACOB, H., ADNAN, H., OMAR, S. & JAMALUDIN, M. 2011. A
study of the effect of home water filtration systems on fluoride content of
drinking water in Johor. Malaysian Dental Journal, 33, 8-13.
LUKACS, J. R. 2011. Sex differences in dental caries experience: clinical evidence,
complex etiology.Clinical Oral Investigations, 15, 649-656.
LUKACS, J. R. & LARGAESPADA, L. L. 2006. Explaining sex differences in dental
caries prevalence: saliva, hormones and "life-history" etiologies. American
Journal of Human Biology, 18, 540-555.
LUSSI, A., HELLWIG, E. & KLIMEK, J. 2012. Fluorides—mode of action and
recommendations for use. Schweizer Monatsschrift fur Zahnmedizin, 122, 1030.
LYGIDAKIS, N.A, WONG, F., JALEVIK, B., VIERROU, A.M., ALALUUSUA, S. &
ESPELID, I. 2010. Best Clinical Practice Guidance for clinicians dealing with
children presenting with Molar-Incisor-Hypomineralisation (MIH). European
Archives of Paediatric Dentistry, 11, 75-81.
MAGUIRE, A. & ZOHOORI, F.V. 2013. Fluoride balance in infants and young
children in the U.K. and its clinical relevance for the dental team. British Dental
Journal, 214, 587-593.
MAJID, Z., HUSSEIN, N. & BAGRAMIAN, R. 1995. The prevalence of caries and
developmental defects in an adult population in Malaysia. Dental Journal of
Malaysia, 16, 33-39.
MAJID, Z., HUSSEIN, N. & BAGRAMIAN, R. 1996. The prevalence of caries and
enamel defects in 229 Malaysian children 16 years after water fluoridation (a
pilot study). Singapore Dental Journal, 21, 11-15.
MALAYSIAN DENTAL COUNCIL. 2009. Position document use of fluorides in
Malaysia. Putrajaya. Available http://mdc.moh.gov.my/uploads/fluorides.pdf
[Accessed 04/11/2016].
MALAYSIAN METROLOGICAL DEPARTMENT. 2017. Monthly weather bulletin.
Available: http://www.met.gov.my. [Accessed 10/01/17].
MANAN, W. A. 1995. Breast-feeding and infant feeding practice in selected rural and
semi-urban communities in Kemaman, Terengganu. Malaysian Journal of
Nutrition, 1, 51-61.
MANJI, F., FEJERSKOV, O., NAGELKERKE, N.J. & BAELUM, V. 1991. A random
effects model for some epidemiological features of dental caries. Community
Dentistry and Oral Epidemiology, 19, 324-328.
MARSHALL, G.W., MARSHALL, S.J., KINNEY, J.H. & BALOOCH, M.1997. The
dentin substrate: structure and properties related to bonding. Journal of
Dentistry, 25, 441-458.
MARTHALER, T. M. 1974. Caries-inhibition by an amine fluoride dentifrice results
after 6 years in children with low caries activity. Helvetica Odontologica Acta,
18, 35-44.
MARTINEZ-MIER, E. A. & ZANDONA, A. F. 2013. The impact of gender on caries
prevalence and risk assessment. Dental Clinics of North America, 57, 301-315.
MARTINS, C. C., CHALUB, L., LIMA-ARSATI, Y. B., PORDEUS, I. A. & PAIVA,
S. M. 2009. Agreement in the diagnosis of dental fluorosis in central incisors
Page 303
285
performed by a standardized photographic method and clinical examination.
Cadernos de Saúde Pública, 25, 1017-1024.
MASCARENHAS, A. K. & BURT, B. A. 1998. Fluorosis risk from early exposure to
fluoride toothpaste. Community Dentistry and Oral Epidemiology, 26, 241-248.
MASCARENHAS, A. K. 2000. Risk factors for dental fluorosis: a review of the recent
literature. Pediatric Dentistry, 22, 269-277.
MAUPOME, G., CLARK, D. C., LEVY, S. M. & BERKOWITZ, J. 2001a. Patterns of
dental caries following the cessation of water fluoridation. Community Dentistry
and Oral Epidemiology, 29, 37-47.
MAUPOME, G., SHULMAN, J. D., CLARK, D. C., LEVY, S. M. & BERKOWITZ, J.
2001b. Tooth-surface progression and reversal changes in fluoridated and no-
longer-fluoridated communities over a 3-year period. Caries Research, 35, 95-
105.
MAUPOME, G., SHULMAN, J. D., CLARK, D. C. & LEVY, S. M. 2003. Socio-
demographic features and fluoride technologies contributing to higher fluorosis
scores in permanent teeth of Canadian children. Caries Research, 37, 327-334.
MCDONAGH M, WHITING P, BRADLEY M, COOPE, J, SUTTON A,
CHESTNUTT, I, MISSO, K, WILSON, P, TREASURE E, KLEIJNEN J. 2000.
A systematic review of public water fluoridation. University of York.
MCGRADY M.G., ELLWOOD R.P. & PRETTY I.A.2010. Why fluoride? Dental
Update, 37, 595-598.
MCGRADY, M. G., ELLWOOD, R. P., MAGUIRE, A., GOODWIN, M.,
BOOTHMAN, N. & PRETTY, I. A. 2012a. The association between social
deprivation and the prevalence and severity of dental caries and fluorosis in
populations with and without water fluoridation. BMC Public Health, 12, 1122.
MCGRADY, M. G., ELLWOOD, R. P., SRISILAPANAN, P., KORWANICH, N.,
WORTHINGTON, H. V. & PRETTY, I. A. 2012b. Dental fluorosis in
populations from Chiang Mai, Thailand with different fluoride exposures -
Paper 1: assessing fluorosis risk, predictors of fluorosis and the potential role of
food preparation. BMC Oral Health, 12, 16.
MCKAY, F. S. 1928. The Relation of Mottled Enamel to Caries. The Journal of the
American Dental Association, 1922, 15, 1429-1437.
MCLAREN, L. 2011. Drinking water fluoridation in Canada: Review and synthesis of
published literature. Alberta Health Services, Canada.
MCLAREN, L. & SINGHAL, S. 2016. Does cessation of community water
fluoridation lead to an increase in tooth decay? A systematic review of
published studies. Journal of Epidemiology and Community Health, 70, 934-
940.
MCLAREN, L., PATTERSON, S., THAWER, S., FARIS, P., MCNEIL, D.,
POTESTIO, M. & SHWART, L. 2016. Measuring the short-term impact of
fluoridation cessation on dental caries in Grade 2 children using tooth surface
indices. Community Dentistry and Oral Epidemiology, 44, 274-282.
MEJIA, G.C. & HA., D.H. 2011. Dental caries trends in Australian school children.
Australian Dental Journal, 56, 227-230.
Page 304
286
MENDES, F. M., BRAGA, M. M., OLIVEIRA, L. B., ANTUNES, J. L., ARDENGHI,
T. M. & BONECKER, M. 2010. Discriminant validity of the International
Caries Detection and Assessment System (ICDAS) and comparability with
World Health Organization criteria in a cross-sectional study. Community
Dentistry and Oral Epidemiology, 38, 398-407.
MESSER, H.H. & OPHAUG, R.H. 1993. Influence of gastric acidity on fluoride
absorption in rats. Journal of Dental Research, 72, 619-622.
MOHAMED, A. R., THOMSON, W. M. & MACKAY, T. D. 2010. An
epidemiological comparison of Dean's index and the Developmental Defects of
Enamel (DDE) index. Journal of Public Health Dentistry, 70, 344-347.
MOHAPATRA, M., ANAND, S., MISHRA, B. K., GILES, D. E. & SINGH, P. 2009.
Review of fluoride removal from drinking water. Journal of Environmental
Management, 91, 67-77.
MOHD, M. N., SHEIHAM, A. & TSAKOS, G. 2008. Physchological impacts of dental
fluorosis among Malaysian school children. Malaysian Dental Journal, 29, 20-
24.
MØLLER, I. 1982. Fluorides and dental fluorosis. International Dental Journal, 32,
135-147.
MONSE, B., HEINRICH-WELTZIEN, R., BENZIAN, H., HOLMGREN, C. & VAN
PALENSTEIN HELDERMAN, W. 2010. PUFA-an index of clinical
consequences of untreated dental caries. Community Dentistry and Oral
Epidemiology, 38, 77-82.
MURRAY, J. J. 1986. World Health Organization. Appropriate use of fluorides for
human health. Geneva: World Health Organization.
MUSA, S. & SAUB, R. 1998. Toothpastes available in the Malaysian market, Annals
of Dentistry University of Malaya, 5, 45-48.
MYMALAYSIABOOKS. Travel guide on Malaysia and Singapore. Available:
http://www.mymalaysiabooks.com/ [Accessed 07/08/ 2016].
NANCI, A. 2007. Ten Cate's Oral Histology-Pageburst on VitalSource: Development,
Structure, and Function. Elsevier Health Sciences.
NHS CENTRE FOR REVIEWS AND DISSEMINATION 1996. Undertaking
systematic reviews of research on effectiveness: CRD guidelines for those
carrying out or commissioning reviews. Report Number 4, Centre for Reviews
and Dissemination.
NOHNO, K., ZOHOORI, F. V. & MAGUIRE, A. 2011. Fluoride intake of Japanese
infants from infant milk formula. Caries Research, 45, 486-493.
NUNN, J. H., EKANAYAKE, L., RUGG-GUNN, A. J. & SAPARAMADU, K. D.
1993. Assessment of enamel opacities in children in Sri Lanka and England
using a photographic method. Community Dental Health, 10, 175-188.
O' MULLANE, D. M., BAEZ, R. J., JONES, S., LENNON, M. A., PETERSEN, P. E.,
RUGG-GUNN, A. J., H., W. & WHITFORD, G. M. 2016. Fluoride and oral
health. Community Dental Health, 33, 69-99.
Page 305
287
OGANESSIAN, E., LENCOVA, E. & BROUKAL, Z. 2007. Is systemic fluoride
supplementation for dental caries prevention in children still justifiable? Prague
Medical Report, 108, 306-14.
ORAL HEALTH DIVISION MINISTRY OF HEALTH MALAYSIA. 1998. National
oral health survey of school children 1997 (NOHSS 97). Kuala Lumpur: OHD,
Ministry of Health Malaysia.
ORAL HEALTH DIVISION MINISTRY OF HEALTH MALAYSIA. 2001. National
survey of fluoride enamel opacities in 16-year-old children. Putrajaya: OHD,
Ministry of Health Malaysia.
ORAL HEALTH DIVISION MINISTRY OF HEALTH MALAYSIA. 2003a.
Guidelines on oral health care for pre-school children. Putrajaya: OHD,
Ministry of Health Malaysia.
ORAL HEALTH DIVISION MINISTRY OF HEALTH MALAYSIA. 2003b.
Guidelines: a school based fissure sealant programme. Putrajaya: OHD,
Ministry of Health
Malaysia.Available:http://ohd.moh.gov.my/uploads/a_school_based_fissure_se
alant_prog.pdf [Accessed 21/06/206].
ORAL HEALTH DIVISION MINISTRY OF HEALTH MALAYSIA 2006.
Implementation of water fluoridation in Malaysia. Putrajaya: OHD, Ministry of
Health Malaysia.
ORAL HEALTH DIVISION MINISTRY OF HEALTH MALAYSIA. 2007. [Tidak
terlalu awal memulakan penjagaan kesihatan pergigian, in Malay language].
Putrajaya: OHD, Ministry of Health Malaysia.
ORAL HEALTH DIVISION MINISTRY OF HEALTH MALAYSIA 2009. National
Oral Health Survey of School Children (6 year-olds) 2007. Putrajaya: OHD,
Ministry of Health Malaysia.
ORAL HEALTH DIVISION MINISTRY OF HEALTH MALAYSIA. 2010. National
Oral Health Survey of School Children (12 year-olds) 2007. Putrajaya: OHD,
Ministry of Health Malaysia.
ORAL HEALTH DIVISION MINISTRY OF HEALTH MALAYSIA. 2011. Annual
report 2010. Putrajaya: OHD, Ministry of Health Malaysia.
ORAL HEALTH DIVISION MINISTRY OF HEALTH MALAYSIA. 2013. Protocol
fluoride enamel opacities in 16 year-old school children, 2013.Putrajaya: OHD,
Ministry of Health Malaysia.
ORAL HEALTH DIVISION MINISTRY OF HEALTH MALAYSIA. 2014. Annual
Report 2013. Putrajaya: OHD, Ministry of Health Malaysia. Available:
http://ohd.moh.gov.my/v3/images/pdf/ann_rpt14.pdf [Accessed 10/10/2016].
OSUJI, O. O., LEAKE, J. L., CHIPMAN, M. L., NIKIFORUK, G., LOCKER, D. &
LEVINE, N. 1988. Risk factors for dental fluorosis in a fluoridated community.
Journal of Dental Research, 67, 1488-92.
PAGLIARI, A. V., MOIMAZ, S. A. S., SALIBA, O., DELBEM, A. C. B. &
SASSAKI, K. T. 2006. Analysis of fluoride concentration in mother's milk
substitutes. Brazilian Oral Research, 20, 269-274.
Page 306
288
PARNELL, C., WHELTON, H. & O'MULLANE, D. 2009. Water fluoridation.
European Archives Paediatric Dentistry, 10, 141-148.
PENDRYS, D. G. 2000. Risk of enamel fluorosis in nonfluoridated and optimally
fluoridated populations: considerations for the dental professional. The Journal
of the American Dental Association, 131, 746-755.
PENDRYS, D. G. & KATZ, R. V. 1989. Risk of enamel fluorosis associated with
fluoride supplementation, infant formula, and fluoride dentifrice use. American
Journal of Epidemiology, 130, 1199-1208.
PENDRYS, D.G. 1990. The fluorosis risk index: a method for investigating risk
factors. Journal of Public Health Dentistry, 50, 291-298.
PENDRYS, D. G., KATZ, R. V. & MORSE, D. E. 1994. Risk factors for enamel
fluorosis in a fluoridated population. American Journal of Epidemiology, 140,
461-71.
PEREIRA, A. C., DA CUNHA, F. L., MENEGHIM MDE, C. & WERNER, C. W.
2000. Dental caries and fluorosis prevalence study in a nonfluoridated Brazilian
community: trend analysis and toothpaste association. ASDC Journal of
Dentistry for Children, 67, 132-5, 83.
PETERSEN, P. E., BAEZ, R. J. & LENNON, M. A. 2012. Community-oriented
administration of fluoride for the prevention of dental caries: a summary of the
current situation in Asia. Advances in Dental Research, 24, 5-10.
PINE, C. M., PITTS, N. B. & NUGENT, Z. J. 1997. British Association for the Study
of Community Dentistry (BASCD) guidance on sampling for surveys of child
dental health. A BASCD coordinated dental epidemiology programme quality
standard. Community Dental Health, 14,10-17.
PITTS, N. 2004. "ICDAS" an international system for caries detection and assessment
being developed to facilitate caries epidemiology, research and appropriate
clinical management. Community Dental Health, 21, 193-198.
PITTS, N., CHADWICK, B. & ANDERSON, T. 2015. Children’s Dental Health
Survey 2013 Report 2: Dental Disease and Damage in Children England,
Wales and Northern Ireland. London: Health and Social Care Information
Centre.
POH, B., NG, B., SITI HASLINDA, M., NIK SHANITA, S., WONG, J., BUDIN, S.
N., RUZITA, A.T, NG, L.O., KHOUW, I. & NORIMAH A.K. 2013.
Nutritional status and dietary intakes of children aged 6 months to 12 years:
findings of the Nutrition Survey of Malaysian Children (SEANUTS Malaysis).
British Journal of Nutrition, 110, S21-S35.
PONTIGO-LOYOLA, A. P., MEDINA-SOLIS, C. E., LARA-CARRILLO, E.,
PATINO-MARIN, N., ESCOFFIE-RAMIREZ, M., MENDOZA-
RODRIGUEZ, M., DE LA ROSA-SANTILLANA, R. & MAUPOME, G. 2014.
Impact of socio-demographic, socioeconomic, and water variables on dental
fluorosis in adolescents growing up during the implementation of a fluoridated
domestic salt program. Odontology, 102, 105-115.
Page 307
289
PREISSER, J.S., STAMM, J.W., LONG, D.L. AND KINCADE, M.E. 2012. Review
and recommendations for zero-inflated count regression modeling of dental
caries indices in epidemiological studies. Caries Research, 46, 413-423.
PRETTY, I. A., MCGRADY, M., ZAKIAN, C., ELLWOOD, R. P., TAYLOR, A.,
SHARIF, M. O., IAFOLLA, T., MARTINEZ-MIER, E. A., SRISILAPANAN,
P., KORWANICH, N., GOODWIN, M. & DYE, B. A. 2012. Quantitative light
fluorescence (QLF) and polarized white light (PWL) assessments of dental
fluorosis in an epidemiological setting. BMC Public Health, 12, 366.
RAMEZANI, G. H., NOROZI, A. & VALAEL, N. 2003. The prevalence of nursing
caries in 18 to 60 months old children in Qazvin. Journal of Indian Society of
Pedodontics and Preventive Dentistry, 21, 19-26.
RAZAK. I. & NIK, H. N. 1986. Enamel defects in 11-12 year-old subjects in a
fluoridated area. Dental Journal of Malaysia, 9, 23-28.
REISINE, S. T. & PSOTER, W. 2001. Socioeconomic status and selected behavioural
determinants as risk factors for dental caries. Journal of Dental Education, 65,
1009-1016.
RIORDAN, P. J. 1993a. Dental fluorosis, dental caries and fluoride exposure among 7-
year-olds. Caries Research, 27, 71-77.
RIORDAN, P. J. 1993b. Fluoride supplements in caries prevention: a literature review
and proposal for a new dosage schedule. Journal of Public Health Dentistry, 53,
174-189.
RIORDAN, P. J. 1996. The place of fluoride supplements in caries prevention today.
Australian Dental Journal, 41, 335-342.
RIORDAN, P. J. 1999. Fluoride supplements for young children: an analysis of the
literature focusing on benefits and risks. Community Dentistry and Oral
Epidemiology, 27, 72-83.
ROBERTSON, A. J. & TOUMBA, K. J. 1999. Cross-polarized photography in the
study of enamel defects in dental paediatrics. The Journal of Audiovisual Media
in Medicine,, 22, 63-70.
ROZIER, R. G. 1994. Epidemiologic indices for measuring the clinical manifestations
of dental fluorosis: overview and critique. Advances in Dental Research, 8, 39-
55.
ROZIER, R.G., ADAIR, S., GRAHAM, F., IAFOLLA, T., KINGMAN, A., KOHN,
W., KROL, D., LEVY, S., POLLICK, H., WHITFORD, G. AND STROCK, S.
2010. Evidence-based clinical recommendations on the prescription of dietary
fluoride supplements for caries prevention: a report of the American Dental
Association Council on Scientific Affairs. The Journal of the American Dental
Association, 2010; 141, 1480-1489.
RUGG-GUNN, A. J., SPENCER, A. J., WHELTON, H. P., JONES, C., BEAL, J. F.,
CASTLE, P., COONEY, P. V., JOHNSON, J., KELLY, M. P., LENNON, M.
A., MCGINLEY, J., O'MULLANE, D., SGAN-COHEN, H. D., SHARMA, P.
P., THOMSON, W. M., WOODWARD, S. M. & ZUSMAN, S. P. 2016.
Critique of the review of 'Water fluoridation for the prevention of dental caries'
Page 308
290
published by the Cochrane Collaboration in 2015. British Dental Journal, 220,
335-340.
SABIEHA, A. M. & ROCK, W. P. 1998. A comparison of clinical and photographic
scoring using the TF and modified DDE indices. Community Dental Health, 15,
82-87.
SAMI, E., VICHAYANRAT, T. & SATITVIPAWEE, P. 2015. Dental Fluorosis and
Its Relation to Socioeconomic Status, Parents' Knowledge and Awareness
among 12-Year-Old School Children in Quetta, Pakistan. Southeast Asian
Journal of Tropical Medicine and Public Health, 46, 360-368.
SAMPAIO, F. C. & LEVY, S. M. 2011. Systemic fluoride. Monographs in Oral
Science, 22, 133-45.
SCHLUTER, P. J. & LEE, M. 2016. Water fluoridation and ethnic inequities in dental
caries profiles of New Zealand children aged 5 and 12–13 years: analysis of
national cross-sectional registry databases for the decade 2004–2013. BMC
Oral Health, 16, 21.
SEAMAN, S., THOMAS, F. D. & WALKER, W. A. 1989. Differences between caries
levels in 5-year-old children from fluoridated Anglesey and non-fluoridated
mainland Gwynedd in 1987. Community Dental Health, 6, 215-221.
ŞENER, Y., TOSUN, G., KAHVECIOGLU, F., GÖKALP, A. & KOÇ, H. 2007.
Fluoride levels of human plasma and breast milk.European Journal of
Dentistry,, 1, 21-24.
SEPPA, L., HAUSEN, H., KARKKAINEN, S. & LARMAS, M. 2002. Caries
occurrence in a fluoridated and a nonfluoridated town in Finland: a
retrospective study using longitudinal data from public dental records. Caries
Research, 36, 308-314.
SEPPA, L., KARKKAINEN, S. & HAUSEN, H. 1998. Caries frequency in permanent
teeth before and after discontinuation of water fluoridation in Kuopio, Finland.
Community Dentistry and Oral Epidemiology, 26, 256-262.
SEPPA, L., KARKKAINEN, S. & HAUSEN, H. 2000a. Caries in the primary
dentition, after discontinuation of water fluoridation, among children receiving
comprehensive dental care. Community Dentistry and Oral Epidemiology, 28,
281-288.
SEPPA, L., KARKKAINEN, S. & HAUSEN, H. 2000b. Caries Trends 1992–1998 in
Two Low–Fluoride Finnish Towns Formerly with and without Fluoridation.
Caries Research, 34, 462-468.
SHAHARUDDIN, M., KIDAHUS, M. N., SUMARLAN, S., KAMIL, Y. M., ISMAIL,
Y. M., FIRUZ, R. M., YUNUS, A. M., AIZAT, I. S. & DASRILSYAH, S.
2010. Dental fluorosis (DF) and its relationship with fluoride levels in drinking
water in three states in Malaysia. Research Journal of Medical Sciences, 4, 20-
24.
SIEW, C., STROCK, S., RISTIC, H., KANG, P., CHOU, H.-N., CHEN, J.-W.,
FRANTSVE-HAWLEY, J. & MEYER, D. M. 2009. Assessing a potential risk
factor for enamel fluorosis: a preliminary evaluation of fluoride content in
Page 309
291
infant formulas. The Journal of the American Dental Association, 140, 1228-
1236.
SILVA, M. & REYNOLDS, E. C. 1996. Fluoride content of infant formulae in
Australia. Australian Dental Journal, 41, 37-42.
SINGER, L. & OPHAUG, R. 1979. Total fluoride intake of infants. Pediatrics, 63,
460-6.
SINGHAL, S., FARMER, J. & MCLAREN, L. 2017. Methodological considerations
for designing a community water fluoridation cessation study. Community
Dentistry and Oral Epidemiology, 45,193-200.
SMITH, F., & EKSTRAND J. 1988. Fluoride in the environment and intake in man.
In: Ekstrand, J. et al. eds. Fluoride in dentistry. 1st edition ed. Munksgaard,
Copenhagen, 13-24.
SMITH, F. A., & EKSTRAND, J. 1996. The occurance and chemistry of fluoride. In:
Fejerskov, O. et al. eds. Fluoride in Dentistry. 2nd ed. Munksgaard, Copenhagen, 17-26.
SOHN, W., ISMAIL, A. I. & TAICHMAN, L. S. 2007. Caries risk-based fluoride
supplementation for children. Pediatric Dentistry, 29, 23-31.
SOTO-ROJAS, A. E., MARTINEZ-MIER, E. A., URENA-CIRETT, J., JACKSON, R.
D. & STOOKEY, G. K. 2008. Development of a standardisation device for
photographic assessment of dental fluorosis in field studies. Oral Health and
Preventive Dentistry, 6, 29-36.
SPENCER, A. J. & DO, L. G. 2016. Caution needed in altering the 'optimum' fluoride
concentration in drinking water. Community Dentistry and Oral Epidemiology,
44, 101-108.
STEPHEN, K. W., MACPHERSON, L. M. D., GILMOUR, W. H., STUART, R. A. M.
& MERRETT, M. C. W. 2002. A blind caries and fluorosis prevalence study of
school-children in naturally fluoridated and nonfluoridated townships of
Morayshire, Scotland. Community Dentistry and Oral Epidemiology, 30, 70-79.
STEPHEN, K., MCCALL, D. & TULLIS, J. 1987. Caries prevalence in northern
Scotland before, and 5 years after, water defluoridation. British Dental Journal,
163, 324.
SUJAK, S. L., KADIR, R. A. & DOM, T. N. M. 2004. Esthetic perception and
psychosocial impact of developmental enamel defects among Malaysian
adolescents. Journal of Oral Science, 46, 221-226.
TAN, B.S. 2003. Fluorosis and fluoride exposure among Malaysian schoolchildren.
PhD thesis, University of Malaya, Malaysia.
TAN, B. & RAZAK, I. 2013. Impact of Water Filters and Consumption of Bottled
Water on Fluoride Intake. Sains Malaysiana, 42, 115-121.
TAN, B. S., RAZAK, I. A. & FOO, L. C. 2005. Fluorosis prevalence among
schoolchildren in a fluoridated community in Malaysia. Community Dental
Health, 22, 35-39.
TAN, K. 2009. Knowledge, attitude and practice on breastfeeding in Klang, Malaysia.
The International Medical Journal of Malaysia, 8, 17-21.
Page 310
292
TAVENER, J. A., DAVIES, G. M., DAVIES, R. M. & ELLWOOD, R. P. 2006. The
prevalence and severity of fluorosis in children who received toothpaste
containing either 440 or 1,450 ppm F from the age of 12 months in deprived
and less deprived communities. Caries Research, 40, 66-72.
TAVENER, J., DAVIES, R. M. & ELLWOOD, R. P. 2007. Agreement amongst
examiners assessing dental fluorosis from digital photographs using the TF
index. Community Dental Health, 24, 21-25.
TEN CATE, J. & FEATHERSTONE, J. 1991. Mechanistic aspects of the interactions
between fluoride and dental enamel. Critical Reviews in Oral Biology and
Medicine, 2, 283-296.
TEN CATE, J. M. 1999. Current concepts on the theories of the mechanism of action
of fluoride. Acta Odontologica Scandinavica, 57, 325-329.
TEN CATE, J.M. 2013. Contemporary perspective on the use of fluoride products in
caries prevention. British Dental Journal, 214, 161-167.
THE BIRTISH FLUORIDATION SOCIETY. 2012. One in a Million: the facts about
water fluoridation [Online]. Available: https://www.bfsweb.org/one-in-a-
million.
THOMAS, F., KASSAB, J. & JONES, B. 1995. Fluoridation in Anglesey 1993: a
clinical study of dental caries in 5-year-old children who had experienced sub-
optimal fluoridation. British Dental Journal, 178, 55-59.
THYLSTRUP, A. & FEJERSKOV, O. 1978. Clinical appearance of dental fluorosis in
permanent teeth in relation to histologic changes. Community Dentistry and
Oral Epidemiology, 6, 315-328.
TRAUTNER, K. & EINWAG, J.1989. Influence of milk and food on fluoride
bioavailability from NaF and Na2FPO3 in man. Journal of Dental Research,
68, 72-77.
TREASURE, E. T. & DEVER, J. G. 1992. The prevalence of caries in 5-year-old
children living in fluoridated and non-fluoridated communities in New Zealand.
New Zealand Dental Journal, 88, 9-13.
TREASURE, E. T. & DEVER, J. G. 1994. Relationship of caries with socioeconomic
status in 14-year-old children from communities with different fluoride
histories. Community Dentistry and Oral Epidemiology, 22, 226-230.
TUBERT-JEANNIN, S., AUCLAIR, C., AMSALLEM, E., TRAMINI, P.,
GERBAUD, L., RUFFIEUX, C., SCHULTE, A. G., KOCH, M. J., REGE-
WALTHER, M. & ISMAIL, A. 2011. Fluoride supplements (tablets, drops,
lozenges or chewing gums) for preventing dental caries in children. Cochrane
Database Systematic Reviews, 12, CD007592.
VAN WINKLE, S., LEVY, S., KIRITSY, M., HEILMAN, J., WEFEL, J. &
MARSHALL, T. 1994. Water and formula fluoride concentrations: significance
for infants fed formula. Pediatric Dentistry, 17, 305-310.
WALVEKAR, S. V. & QURESHI, B. A. 1982. Endemic fluorosis and partial
defluoridation of water supply - A public health concern in Kenya. Community
Dentistry and Oral Epidemiology, 10, 156-160.
Page 311
293
WANG, H. Y., PETERSEN, P. E., BIAN, J. Y. & ZHANG, B. X. 2002. The second
national survey of oral health status of children and adults in China.
International Dental Journal, 52, 283-290.
WANG, N. J., GROPEN, A. M. & OGAARD, B. 1997. Risk factors associated with
fluorosis in a non-fluoridated population in Norway. Community Dentistry and
Oral Epidemiology, 25, 396-401.
WEI, Z.-D. & WEI, Y. 2002. Fluoridation in China: a clouded future. Fluoride, 35, 1-4.
WHELTON, H., BROWNE, D., FELICIA P. & WHELTON J. Dean’s Index, e-
learning programme. Oral Health Services Research Centre, University
College Cork, Ireland. Available: www.fluorosisindex.com [Accessed
12/02/2014].
WHELTON, H., CROWLEY, E., O'MULLANE, D., DONALDSON, M.,
KELLEHER, V. & CRONIN, M. 2004a. Dental caries and enamel fluorosis
among the fluoridated and non-fluoridated populations in the Republic of
Ireland in 2002. Community Dental Health, 21, 37-44.
WHELTON, H. P., KETLEY, C. E., MCSWEENEY, F. & O'MULLANE, D. M.
2004b. A review of fluorosis in the European Union: prevalence, risk factors
and aesthetic issues. Community Dentistry and Oral Epidemiology, 32, 9-18.
WHELTON, H. & O’ MULLANE, D. 2012. Monitoring the effectiveness of water
fluoridation in the Republic of Ireland. Journal of Irish Dental Association, 58;
S6-S8.
WHITFORD, G. M. 1994. Intake and metabolism of fluoride. Advances in Dental
Research, 8, 5-14.
WHITFORD, G. M. 1999. Fluoride metabolism and excretion in children. Journal of
Public Health Dentistry, 59, 224-228.
WHITFORD, G.M., 1996. Overview of fluoride metabolism and intake. In the
metabolism and toxicity of fluoride. Monographs in Oral Science, 16, 1-9.
WONDWOSSEN, F., ÅSTRØM, A., BJORVATN, K. & BÅRDSEN, A. 2006.
Sociodemographic and behavioural correlates of severe dental fluorosis.
International Journal of Paediatric Dentistry, 16, 95-103.
WONG, H. M., MCGRATH, C. & KING, N. M. 2014. Diffuse opacities in 12-year-old
Hong Kong children - four cross-sectional surveys. Community Dentistry and
Oral Epidemiology, 42, 61-69.
WONG, H. M., MCGRATH, C., LO, E. C. & KING, N. M. 2006. Association between
developmental defects of enamel and different concentrations of fluoride in the
public water supply. Caries Research, 40, 481-486.
WONG, H. M., WEN, Y. F., KING, N. M. & MCGRATH, C. P. 2016. Longitudinal
changes in developmental defects of enamel. Community Dentistry and Oral
Epidemiology, 44, 255-262.
WONG, M. C., CLARKSON, J., GLENNY, A. M., LO, E. C., MARINHO, V. C.,
TSANG, B. W., WALSH, T. & WORTHINGTON, H. V. 2011. Cochrane
reviews on the benefits/risks of fluoride toothpastes. Journal of Dental
Research, 90, 573-579.
Page 312
294
WONG, M. C., GLENNY, A. M., TSANG, B. W., LO, E. C., WORTHINGTON, H. V.
& MARINHO, V. C. 2010. Topical fluoride as a cause of dental fluorosis in
children. Cochrane Database Systematic Reviews, 1, CD007693.
WORLD HEALTH ORGANIZATION. 1997. Oral Health Surveys-Basic Methods.
Geneva: World Health Organization.
WORLD HEALTH ORGANIZATION. 2004. Guidelines for drinking-water
quality (Vol. 1). Geneva: World Health Organization.
WU, J., ZHANG, J., CHEN, Z. & DU, G. 2000. [Survey on children's dental fluorosis
and fluoride content in urine after defluridation to improve drinking water, in
Chinese language]. Wei Sheng Yan Jiu, 29, 218-220.
YEE, C. F. & CHIN, R. 2007. Parental perception and attitudes on infant feeding
practices and baby milk formula in East Malaysia. International Journal of
Consumer Studies, 31, 363-370.
YUSOFF, N., JAAFAR, N., RAZAK, I., CHEW, Y., ISMAIL, N. & BULGIBA, A.
2008. The prevalence of enamel opacities in permanent teeth of 11-12 year-old
school children in Kuala Lumpur, Malaysia. Community Dental Health, 25, 55-
58.
ZERO, D. T. 1999. Dental caries process. Dental Clinics of North America, 43, 635-
664.
ZOHOORI, F.V., MOYNIHAN, P.J., OMID, N., ABUHALOOB, L. & MAGUIRE, A.
2012. Impact of water fluoride concentration on the fluoride content of infant
foods and drinks requiring preparation with liquids before feeding. Community
Dentistry and Oral Epidemiology, 40, 432-440.
Page 313
295
Appendices
Appendix 1 ICDAS II Criteria
Restoration and Sealant
Codes
Caries Code
0= Not sealed or restored 0= Sound tooth surface
1= Sealant, partial 1= First visual change in enamel
2= Sealant, full enamel 2= Distinct visual change in enamel
3= Tooth coloured restoration 3= Enamel breakdown, no dentine
visible
4= Amalgam restoration 4= Dentinal shadow (not cavitated
into dentine)
5= Stainless steel crown 5= Distinct cavity with visible
dentine
6= Porcelain, gold, PFM crown or
veneer
6= Extensive distinct cavity with
visible dentine
7= Lost or broken restoration
8= Temporary restoration MISSING TEETH
97= Extracted due to caries
06 RETAINED ROOT 98= Missing for other reason
99= Unerupted
First digit=Restoration and sealant code.
Second digit=Caries code.
Page 314
296
Appendix 2 Nomenclature for recording dental caries in the present study
In the present study dental caries was recorded using ICDAS II criteria. Due to the
potential for confusion between the different codes and thresholds used to describe
dental caries when using ICDAS and previous caries indices / scoring systems, the
following Table (Table 1) describes the terms used to define thresholds and levels
of dental caries experience. In this study dental caries status is described using the
following principal terms; caries free, free of caries into dentine; enamel caries and
dentine caries.
Table 1 The terms used to describe dental caries status
Terms used in
this study
(designation)
ICDAS caries
codes
Traditional
caries scores,
(e.g. BASCD,
WHO)
Notes
Caries free 00 Sound Describes the
condition free of
either enamel or
dentine caries
Free of caries into
dentine
00, 01, 02 and 03 Sound, D1 and
D2.
This is the status
traditionally
regarded as
“caries-free”. This
is the principal
diagnostic level
used for both
primary and
secondary
outcomes in the
study.
Enamel caries (d1-
3/D1-3)
01, 02, 03 D1 and D2 Caries lesions
limited to enamel
Dentine caries
(d4-6/D4-6)
04, 05 and 06 D3, both cavitated
and non-cavitated
Caries lesions
involving dentine,
also referred to as
obvious dental
decay
BASCD = British Association for the Study of Community Dentistry.
WHO = World Health Organisation.
Page 315
297
Appendix 3 Search strategy: EMBASE
Details of literature search (perfomed on 11th February 2016. All databases were
searched from their start date to 11th February 2016
Embase via Ovid SP searched (start year: 1947)
1 exp Fluoridation/ (6055)
2 exp Fluorides/ (29993)
3 exp Fluorine/ (10661)
4 fluorid*.ti,ab. (45003)
5 fluorin*.ti,ab. (20872)
6 flurid*.ti,ab. (144)
7 flurin*.ti,ab. (14)
8 1 or 2 or 3 or 4 or 5 or 6 or 7 (77484)
9 exp Water Supply/ (30918)
10 water.ti,ab. (687788)
11 8 or 9 (694388)
12 cessation.ti,ab. (72046)
13 break.ti,ab. (40198)
14 interruption.ti,ab. (31288)
15 discontinu*.ti,ab. (138056)
16 re-introduc*.ti,ab. (1823)
17 (adjust* adj1 down*).ti,ab. (204)
18 defluoridation.ti,ab. (291)
19 defluoridation/ (241)
20 12 or 13 or 14 or 15 or 16 or 17 or 18 or 19 (277593)
21 (oral adj1 health).ti,ab. (15154)
22 exp Tooth Disease/ (191821)
23 caries.ti,ab. (34107)
24 dental.ti,ab. (177962)
25 tooth.ti,ab. (66335)
26 teeth.ti,ab. (85767)
27 dentition.ti,ab. (12988)
28 enamel.ti,ab. (24290)
29 exp tooth/ (142556)
30 fluorosis.ti,ab. (3544)
31 flurosis.ti,ab. (15)
32 21 or 22 or 23 or 24 or 25 or 26 or 27 or 28 or 29 or 30 or 31 (415756)
33 8 and 11 and 20 and 32 (185)
Number of articles retrieved: 185
After removed duplicates: 70
Page 316
298
Appendix 4 Search strategy: Medline
Medline via Ovid SP searched (start year: 1946)
1 exp Fluoridation/ (5417)
2 exp Fluorides/ (31105)
3 exp Fluorine/ (6905)
4 fluorid*.ti,ab. (32142)
5 fluorin*.ti,ab. (12741)
6 flurid*.ti,ab. (110)
7 flurin*.ti,ab. (5)
8 1 or 2 or 3 or 4 or 5 or 6 or 7 (60475)
9 exp Water Supply/ (28475)
10 water.ti,ab. (443155)
11 9 or 10 (449419)
12 cessation.ti,ab. (50176)
13 break.ti,ab. (27654)
14 interruption.ti,ab. (19125)
15 discontinu*.ti,ab. (83383)
16 re-introduc*.ti,ab. (1127)
17 (adjust* adj1 down*).ti,ab. (144)
18 defluoridation.ti,ab. (153)
19 12 or 13 or 14 or 15 or 16 or 17 or 18 (178224)
20 exp Oral Health/ (10671)
21 (oral adj1 health).ti,ab. (13552)
22 caries.ti,ab. (29070)
23 dental.ti,ab. (153813)
24 tooth.ti,ab. (56828)
25 teeth.ti,ab. (72464)
26 dentition.ti,ab. (10968)
27 enamel.ti,ab. (21164)
28 Dental Caries Susceptibility/ (2040)
29 exp Tooth/ (71599)
30 exp Tooth Diseases/ (144299)
31 fluorosis.ti,ab. (2308)
32 flurosis.ti,ab. (5)
33 20 or 21 or 22 or 23 or 24 or 25 or 26 or 27 or 28 or 29 or 30 or 31 or 32
(329750)
36 8 and 11 and 19 and 33 (92)
Number of articles retrieved: 92
After removed duplicates: 20
Page 317
299
Appendix 5 Search strategy: The Cochrane central register of controlled trials
Cochrane Central Register of Controlled Trials searched (start year:1990)
Title, abstract and keywords were searched for the following terms:
(fluorid* OR fluorin* OR flurid* OR flurin*)
AND
(water)
AND
(cessation OR break OR interrupt* OR discontinu* OR re-introduc* OR (adjust*
NEAR/1 down*) OR defluoridation)
AND
("oral health" OR caries OR dental OR tooth OR teeth OR dentition OR enamel OR
fluorosis OR flurosis)
Number of articles retrieved: 36
Appendix 6 Search strategy: The web of science
Web of Science searched (Start year: 1990)
(fluorid* OR fluorin* OR flurid* OR flurin*) AND (water) AND (cessation OR
break OR interrupt* OR discontinu* OR re-introduc* OR (adjust* NEAR/1
down*) OR defluoridation) in title, abstract, keywords or Keywords Plus
AND
("oral health" OR caries OR dental OR tooth OR teeth OR dentition OR enamel OR
fluorosis OR flurosis) in title
Number of articles retrieved: 72
Appendix 7 Search strategy: unpublished papers
Attempt was made to contact the following authors, however failed to access the
articles.
1. Hobbs D 1994. Annual report of the Director of Dental Public Health to Powys
2. Wragg K. 1992..Health Authority. Dental caries experience of 5 year olds in
South Derbyshire.
Page 318
300
Appendix 8 Data extraction form
Study tittle:
Authors and year of publication:
Country of study
Geographic location
Year study started
Year study ended
Year of change in
fluoridation
Study design
Inclusion criteria
Exclusion criteria
Other sources of fluoride
Social class
Ethnicity
Other confounding
Fluoride level at baseline
Fluoride level at the end
No of subject (caries)
Age groups (caries)
Caries Index & outcome
DMFT/DMFS/ S.D
(baseline)
DMFT/DMFS/ S.D
(after)
No of subjects (fluorosis)
Age groups (fluorosis)
Fluorosis Index &
outcome
Fluorosis % prevalence
(baseline)
Fluorosis % prevalence
(after)
Funding:
Notes
Page 319
301
Appendix 9 Validity assessment scoring and definition of terms in the tables (adapted from NHS Center for Reviews and Dissemiantion, 1996
in York Review, 2000)
Cohort, Before-After, Ecological and Cross-Sectional Study Designs
Prospective Was the study prospective? Was it planned and started prior to the outcome of interest occurring? Score =1 or
0
Study Design The study design hierarchy for this review= cohort > before-after> ecological> cross-sectional. Score range
between 0.25 -1, with cohort=1, cross-sectional =0.25
Fluoride
measurement
Was the fluoride level reliably measured? Scores range between 0-1
Confounding factors Were confounding factors addressed (measured)? Scores range between 0-1, with 3 or more factors
measure=1
Control for
confounding
Was the adjustment for the possible effect of confounding factors in the analysis? Score range between 0-1,
with stratification by age and sex=0.5, other types of analysis (regression)=1
Blinding Were those measure outcomes (e.g. fluorosis) blind to the exposure status of the person being assessed?
Score=0 or 1
Baseline Survey Was the baseline survey at the point of discontinuation of water fluoridation? Score = 0 or 1
Follow-up Was the final survey an adequate time after the discontinuation of water fluoridation to assess effects (2 years
for caries, 5 years for other effects)? Score 0 or 1
Score Sum of the score of the above questions. Total score is out of 8 possible
Level of Evidence A, B or C based on the levels defined in the methods section
Page 320
302
Case-control Study Designs
Disease validated Was the disease state of the cases reliably assessed and validated? Score =0 or 1
Cases in Series Are the cases representative of a series (or is there a potential for selection bias)? Score =0 or 1
Controls Similar Are the controls selected from a similar population to the cases? Score=0 or 1
Controls Disease-
Free
Is there evidence that the controls are free from disease? Score=0 or 1
Confounding factors Are cases and controls comparable with respect to confounding factors? Score range between 0-1, with 3 or
more factors measured=1
Exposure Assessment
Similar
Was exposure (e.g. to fluoridated water) assessed in the same way for cases and controls? Score 0 or 1
Response Rate
Adequate
Was the response rate adequate (meaning numbers of people included into the study out of those possible)?
Score 0 or 1
Non-response similar Was the non-response rate in the same in cases and controls? Score 0 or 1
Statistical Analysis Was an appropriate statistical analysis performed (e.g. use of matching)? Score= 0 or 1
Score Sum of the scores of the above questions. Total score is out of 9 possible
Level of Evidence A, B or C based on the levels defined in the methods section
Page 321
303
Appendix 10 Summary of the included studies that assess impact of reducing or stopping fluoride level in the water on caries
and fluorosis.
CARIES STUDIES
Studies that assess impact of stopping water fluoridation on caries prevalence
Stopping water fluoridation and caries
Cross sectional survey with no control group
Country Reference Title Comments
Antigo,
Wisconsin,
USA
Lemke et al.
1970
Controlled fluoridation: the
dental effects of
discontinuation in Antigo,
Wisconsin
Study design: Cross sectional survey with no control group
Index/outcome measure: DMFT, dmft, caries free
Validity score: 3.5/8
Level of evidence: C
Funding: Not stated
Key Findings: Caries increased post-cessation
Scotland,
UK
Stephen et al.
1987
Caries prevalence in
Northern Scotland before
and 5 years after water
defluoridation
Study design: Cross sectional survey with no control group
Index/outcome measure: dmft, caries free
Validity score: 3.25/8
Level of evidence: C
Funding: Not stated
Key Findings: Caries increased post-cessation
Germany Kunzel and
Fisher 1997
Rise and fall of caries
prevalence in German towns
with different fluoride
concentrations in drinking
water
Study design: Cross sectional survey with no control group
Index/outcome measure: DMFT
Validity score: 4.25/8
Level of evidence: C
Funding: Not stated
Key Findings: Caries decreased post-cessation
Page 322
304
La Salud,
Cuba
Kunzel and
Fisher 2000
Caries prevalence after
cessation of water
fluoridation in La Salud,
Cuba
Study design: Cross sectional survey with no control group
Index/outcome measure: DMFT, DMFS, caries free
Validity score: 3.25/8
Level of evidence: C
Funding: German Research Council & Cuban Ministry of Health
Key Findings: Caries decreased post-cessation
East
Germany
Kunzel,
Fischer,
Bruhmann,
2000.
Decline of caries prevalence
after the cessation of water
fluoridation in the former
East Germany
Study design: Cross sectional survey with no control group
Index/outcome measure: DMFT, DMFS
Validity score: 3.75/8
Level of evidence: C
Funding: Not stated
Key Findings: Caries decreased post-cessation
Gongzhou,
China
Wei and Wei
2002
Fluoridation in China, a
clouded future
Study design: Cross sectional survey with no control group
Index/outcome measure: DMFT
Validity score: 3.25/8
Level of evidence: C
Funding: Not stated
Key Findings: Caries decreased post-cessation
Austin,
USA
Jordan 1962 The Austin School Health
Study
Study design: Cross sectional survey with no control group
Index/outcome measure: DMFT
Validity score: 3.25/8
Level of evidence: C
Funding: Not stated
Key Findings: Caries increased post-cessation
Page 323
305
Stopping water fluoridation and caries
Cross sectional survey with a negative control group
Country Reference Title Comments
Scotland,
UK
Attwood and
Blinkhorn
1989
A reassessment of dental
health of urban Scottish
schoolchildren following the
cessation of water
fluoridation
Study design: Cross sectional survey with a negative control group
Index/outcome measure: DMFT, dmft
Validity score: 3.5/8
Level of evidence: C
Funding: Not stated
Key Findings: Mixed results on different dentition. Caries increased
in permanent teeth post-cessation, caries decreased in primary teeth
post-cessation
Netherlands Kalsbeek et
al. 1993
Caries experience of 15
year-old children in the
Netherlands after
discontinuation of water
fluoridation
Study design: Cross sectional survey with a negative control group
Index/outcome measure: DMFT, DMFS
Validity score: 5
Level of evidence: B
Funding: Not stated
Key Findings: Caries increased post-cessation
Kuopio and
Jyvaskayla,
Finland
Seppa et al.
1998
Caries frequency in
permanent teeth before and
after discontinuation of
water fluoridation in Kuopio,
Finland
Study design: Cross sectional survey with a negative control group
Index/outcome measure: DMFS
Validity score: 4.5
Level of evidence: C
Funding: Academy of Finland
Key Findings: Mixed results in different age group. Caries increased
in 12 & 15 years, caries decreased in 6 & 9 years (permanent
dentition)
Page 324
306
Kuopio &
Jyvaskayla,
Finland
Seppa et. al.
2000a
Caries in the primary
dentition after
discontinuation of water
fluoridation, among children
receiving comprehensive
dental care
Study design: Cross sectional survey with a negative control group
Index/outcome measure: dmft
Validity score: 4.5/8
Level of evidence: C
Funding: Yrjo Jahnsson Foundation and the Academy Finland
Key Findings: Caries decreased post-cessation
Kuopio and
Jyvaskayla,
Finland
Seppa et al.
2000b
Caries trends 1992-1998 in
the low-fluoride finnish
towns formerly with and
without fluoridation
Study design: Cross sectional survey with a negative control group
Index/outcome measure: Caries free
Validity score: 5.5/8
Level of evidence: B
Funding: Not stated
Key Findings: Caries decreased post-cessation
Kilmarnock,
Scotland
DHSS 1969 The fluoridation studies in
the UK & results achieved
after 11 years. A report of
the committee in research
into fluoridation.
Study design: Cross sectional survey with a negative control group
Index/outcome measure: dmft, caries free
Validity score: 3.5/8
Level of evidence: C
Funding: Not stated
Key Findings: Caries increased post-cessation
Page 325
307
Stopping water fluoridation and caries
Cross sectional survey with a positive control group
Country Reference Title Comments
British
Columbia,
Canada
Maupome et.
al. 2001a
Patterns of dental caries
following the cessation of
water fluoridation
Study design: Cross sectional survey with a positive control group
Index/outcome measure: D1D2MFS
Validity score: 5.5/8
Level of evidence: B
Funding: NHRDF Operating Grant 6610-2225-002
Key Findings: Caries decreased post-cessation
Calgary &
Edmonton,
Canada
McLaren et
al. 2016
Measuring the short-term
impact of fluoridation
cessation on dental caries in
Grade 2 children using tooth
surface indices
Study design: Cross sectional survey with a positive control group
Index/outcome measure:
Validity score: 5.5/8
Level of evidence: B
Funding: Canadian Institutes of Health Research (GIR 127083),
Alberta Health and Alberta Health Services.
Key Findings: Mixed results on different dentition. Caries decreased
in permanent teeth post-cessation, caries increased in primary teeth
post-cessation.
Page 326
308
Studies that assess impact of reducing fluoride level in the water supply on caries prevalence
Reduction of fluoride level in the water and caries
Country Reference Title Comments
Germany
Kunzel 1980 Effect of an interruption in
water fluoridation on caries
prevalence of the primary
and secondary dentition
Study design: Cross sectional survey with historical control
Index: DMFT, dft
Validity score: 3.75/8
Level of evidence: C
Funding: Not stated
Key Findings: Caries in primary and permanent dentition decreased
post-reduction
FLUOROSIS STUDIES
Studies that assess impact of stopping water fluoridation on fluorosis prevalence
Stopping water fluoridation and fluorosis
Country Reference Title Comments
British
Columbia,
Canada
Clark et al.
2006
Changes in dental fluorosis
following the cessation of
water fluoridation
Study design: Cross sectional survey with no control group
Outcome measure: Fluorosis prevalence
Index: TF Index
Validity score: 5.25/8
Level of evidence: B
Funding: Canadian Institutes of Health Research Operating Grant
(MOP-57721) and the National Health Research Development
Program Operating Grant (6610-2225-002).
Key Findings: Fluorosis decreased post-cessation
Page 327
309
Studies that assess impact of reducing fluoride level in the water supply on fluorosis prevalence
Reduction of fluoride level in the water and fluorosis
Country Reference Title Comments
Britton,
USA
Horowitz et
al. 1972
Partial defluoridation of a
Community water supply
and dental fluorosis
Study design: Cross sectional survey with no control group
Index: Dean’s Index
Validity score: 3.75/8
Level of evidence: C
Funding: Not stated
Key Findings: Fluorosis decreased post-reduction
Bartlett,
Texas, USA
Horowitz and
Heifetz 1972
The effect of partial
defluoridation of a water
supply on dental fluorosis-
final results in Bartlett,
Texas, after 17 years
Study design: Cross sectional survey with historical control
Index: Dean’s Index
Validity score: 3.25/8
Level of evidence: C
Funding: Not stated
Key Findings: Fluorosis decreased post-reduction
Hong Kong
Evans et al.
1989
Changes in dental fluorosis
following an adjustment to
the fluoride concentration of
Hong Kong’s water supply
Study design: Multiple birth cohorts analysis
Index: Dean’s Index
Validity score: 3.75/8
Level of evidence: C
Funding: Not stated
Key Findings: Fluorosis decreased post-reduction
Hong Kong
Evans and
Stamm 1991b
Dental fluorosis following
downward adjustment of
fluoride in drinking water
Study design: Multiple birth cohorts analysis
Index: Dean’s Index
Validity score: 3.25/8
Level of evidence: C
Funding: Not stated
Key Findings: Fluorosis decreased post-reduction
Page 328
310
Hong Kong
Wong et al.
2014
Diffuse opacities in 12-year-
old Hong Kong children-
four cross sectional surveys
Study design: Cross sectional survey with no control group
Index: DDE
Validity score: 5.25/8
Level of evidence: B
Funding: Research Grants Council of the Special Administration
Region, China (Project No: 782811)
Key Findings: Fluorosis decreased post-reduction
Page 329
311
Appendix 11. Characteristics of included studies
Characteristic of included studies, ordered by type of study and year of publication
Stopping water fluoridation and caries, cross sectional studies with no control group
Study tittle: The Austin School Health Study
Authors and year of publication: Jordan, 1962
Study details Country of study USA
Geographic location Austin
Year study at baseline 1955
Year study at follow up 1959
Year of change in
fluoridation
1952 (begin WF) ,April 1956 (WF ceased)
Study design Cross sectional with no control
Inclusion &
exclusion
criteria
Inclusion criteria Not stated
Exclusion criteria Not stated
Confounding
factors
Other sources of fluoride Not stated
Social class Not stated
Ethnicity Not stated
Other confounding Not stated
Fluoride levels Fluoride level at baseline 1.2 ppm
Fluoride level at the end 0 (ceased)
Outcome
measure
Caries index 6-12 years
Teeth examined Permanent
Outcomes No of subjects (N) 4321 (total for 6,7 and 8 years)
Age groups 6-12 years examined. Children aged 6,7 and 8
years with complete pre and post-cessation data.
Caries
experience
(before & after)
Age 6 7 8
Survey 1955 1959 1956 1959 1956 1959
DMFT 0.4 0.51 1.2 1.38 2.1 2.07
N 629 721 705 821 698 747
Funding Not stated
Comment ~Water fluoridation began 1952 and WF ceased in April 1956.
~Serial survey in 1952, 1953, 1954, 1955, 1956*, 1957, 1958, 1959. Only data
of children aged 6,7 and 8 were available for pre and post cessation.
Page 330
312
Study tittle: Controlled fluoridation, the dental effects of discontinuation in Antigo,
Wisconsin
Authors and year of publication: Lemke et al., 1970
Study details Country of study USA
Geographic location Antigo, Wisconsin
Year study at
baseline
1960
Year study at follow
up
1966
Year of change in
fluoridation
1960 (WF cessation)
1965 (WF reinstate)
Study design Serial cross sectional with historical control
Inclusion &
exclusion
criteria
Inclusion criteria Life long resident (children whose use of the local water
was continuous except for periods not exceeding 90 days in
any calendar year); consented;and excellent cooperation
Exclusion criteria Not stated
Confounding
factors
Other sources of
fluoride
Not stated
Social class Not stated
Ethnicity Not stated
Other confounding Not stated
Fluoride
levels
Fluoride level at
baseline
Not stated (assume 1ppm)
Fluoride level at the
end
0 (cessation)
Outcome
measure
Caries index DMFT, dmft and % caries free
Teeth examined Permanent and primary teeth
Outcomes No of subjects (N) Total for 3 surveys: 1266
Age groups Kindergarten, 8, 10 and 12 year-old
Caries
experience
(before &
after)
Age Kindergarten 8 year-old 10 year-old
Year N dmft %
caries
free
N DM
FT %
caries
free
N DM
FT %
caries
free
1960 125 2.5 39.0 143 0.6 71.0 137 1.7 35.0
1964 131 4.8 19.8 109 1.7 38.5 130 2.4 26.2
Funding Not stated
Comment ~No information on specific baseline F level (assume optimum level of WF at
1ppm).
~ Data for 12 year-old children were excluded because no information about this age
group in follow up survey.
~Kindergarten children: exact age not stated. Assume average age 5/6.
Page 331
313
Study tittle: Caries experience in Northern Scotland before and 5 years after water
defluoridation
Authors and year of publication: Stephen et al., 1987
Study details Country of study Scotland
Geographic location Wick
Year study at baseline 1979
Year study at follow up 1984
Year of change in
fluoridation
1979 (WF ceased)
Study design Serial cross sectional survey with no control
Inclusion &
exclusion
criteria
Inclusion criteria Lifelong resident
Exclusion criteria Refusal of parental consent, use of fluoride
tablet
Confounding
factors
Other sources of fluoride Not stated
Social class Children were group by different social class
(S.C I+II), (S.C III), (S.C IV & V)
(all social class)
Ethnicity Scottish
Other confounding Not stated
Fluoride levels Fluoride level at baseline 1 ppm
Fluoride level at the end 0.02 ppm
Outcome
measure
Caries index dmft, dmfs and % caries free
Teeth examined Primary
Outcomes No of subjects (N) 1979 (N=106), 1984 (N=126)
Age groups 5-6
Caries
experience
(before & after)
Year dmft
mean (s.e)
dmfs
mean (s.e)
caries free
1979
(baseline)
2.6 (±0.19) 7.80 (±1.11) 27.4%
1984
(after)
3.92
(±0.20)
13.33 (±1.45) 24.6%
Funding Not stated
Comment Clinical and radiograph examination. No blinding of examiner.
Page 332
314
Study tittle: Rise and fall of caries prevalence in German Towns with different fluoride
concentrations in drinking water
Authors and year of publication: Kunzel & Fischer, 1997
Study details Country of study German
Geographic
location
Chemnitz & Plauen
Year study started 1963
Year study ended 1995
Year of change in
fluoridation
Chemnitz= 1990, Plauen=1984;
(1971:22 months fluoride interruption in Chemnitz)
Study design Cross sectional with no control (historical control)
Inclusion &
exclusion
criteria
Inclusion criteria Life long resident
Exclusion criteria Non-continuous resident, disable children
Confounding
factors
Other sources of
fluoride
Fluoride varnish (after 1971), fluoride toothpaste, fluoride
salt (after 1992)
Social class Not stated
Ethnicity Not stated
Other confounding Sugar consumption, fissure sealant
Fluoride
levels
Fluoride level at
baseline
1.0 ± 0.1ppm
Fluoride level at the
end
0
Outcome
measure
Caries index DMFT (Only mean DMFT provided , no S.D reported)
Teeth examined Permanent teeth
Outcomes No of subjects (N) Overall for all age groups. Chemnitz (N=219 594), Plauen
(N=66, 582)
Age groups 6-15 years old
Caries
experience
(before &
after)
Age Chemnitz –DMFT & (N*) Plauen-DMFT & (N*)
1987
(N=29,432)
0.9ppm
1995
(N=12,229)
0.2ppm
1983
(N=7587)
0.9ppm
1995
(N=4852)
0.2ppm
8 0.75
(N=2452)
0.32 (N=1019) 0.7 (N=632) 0.58
(N=404)
12 2.55
(N=2452)
1.87 (N=1019) 3.5 (N=632) 1.98
(N=404)
15 4.87
(N=2452)
3.78 (N=1019) 6.2 (N=632) 3.47
(N=404)
Funding Not stated
Comment *Only an overall sample size per year was provide (not broken down by age).
Values (N) in the results table were determined by dividing the total N (year
survey conducted) by the number of age group (12 groups).
~For Chemnitz, baseline data is refer to 1987 (0.9 ppm), follow-up data is 1995
(0.2ppm). For Plauen, baseline data is taken for 1983 (0.9 ppm), follow-up data is
1995 (0.2ppm). Water fluoridation was implemented in 1972. Authors also
provide survey data in 1959 (pre-fluoridation).
Page 333
315
Study tittle: Caries prevalence after cessation of water fluoridation in La Salud, Cuba
Authors and year of publication: Kunzel & Fischer, 2000
Study details Country of study Cuba
Geographic location La, Salud
Year study at baseline 1982
Year study at follow up 1997
Year of change in
fluoridation
1990
Study design Cross sectional with no control group
Inclusion &
exclusion
criteria
Inclusion criteria -School children who were born in the
community (lifelong residents)
-Gender: girls to boys ratio balanced
Exclusion criteria -Those who moved into town (non-lifelong
residents);those who were ill at the date of caries
examination; and those who merely attended
school in La Salud.
Confounding
factors
Other sources of fluoride After cessation (1990), all children received
mouthrinses with a 0.2% NaF solution fortnightly
(=15times/year). Children aged 2 and 5 in
kindergartens received one or two applications of
F varnish annually.
No fluoride toothpaste available to the studied
community.
Social class Life and nutritional conditions are similar in all
rural communities in Cuba including La Salud
Ethnicity Not stated
Other confounding -Sugar-enriched drinking water and excessive
oranges used by families as an additional calorie
supplement for children.
-Gender balance among study sample
Fluoride levels Fluoride level at baseline 0.8 ppm ± 0.1
Fluoride level at the end 0 ± 0.05 ppm ( fluoridation cessation)
Outcome
measure
Caries index DMFT, DMFS and % caries free
Teeth examined Permanent
Outcomes No of subjects (N) 414
Age groups 6-13 years
Caries
experience
(before & after)
DMFT
1982 1997
Age N DMFT (s.d) N DMFT (s.d)
6-13 (all) 470 0.8 (1.47) 414 0.70 (1.26)
6/7 107 0.07 (0.34) 82 0.07 (0.31)
8/9 159 0.5 (1.04) 123 0.6 (0.98)
10/11 126 1.1 (1.51) 104 0.8 (1.21)
12/13 78 2.1 (2.11) 105 1.1 (1.75)
Page 334
316
DMFS
1982 1997
Age N DMFS
(s.d)
N DMFS (s.d)
6-13 (all) 470 1.2 (2.34) 414 0.91 (1.83)
6/7 107 0.1 (0.73) 82 0.07 (0.31)
8/9 159 0.7 (1.64) 123 0.7 (1.19)
10/11 126 1.5 (2.21) 104 1.2 (2.12)
12/13 78 3.1 (3.75) 105 1.5 (2.46)
% Caries free
Age N 1982 N 1997
6-13 (all) 287 61.6 277 66.9
6/7 101 95.2 77 93.9
8/9 118 75.6 80 65.0
10/11 42 54.8 62 59.6
12/13 26 33.3 58 55.2
Funding German Research Council & Cuban Ministry of Health
Comment ~Water fluoridation was introduced in 1973. Data available for survey in 1973,
1982, 1997. Survey in 1982 were used as a baseline data (survey that available
few years before water fluoridation cessation).
~The same clinical examiners were used for all surveys.
Page 335
317
Study tittle: Decline of caries prevalence after the cessation of water fluoridation in the
former East Germany
Authors and year of publication: Kunzel et al., 2000
Study details Country of study Germany
Geographic location Spremberg & Zittau
Year study at baseline 1993
Year study at follow up 1996
Year of change in
fluoridation
1993
Study design Serial cross sectional survey with no control
Inclusion &
exclusion
criteria
Inclusion criteria Life long resident in Spremberg & Zittau
Exclusion criteria Non-continuous resident, disable children
Confounding
factors
Other sources of
fluoride
Fluoridated toothpaste, fluoride salt, oral hygiene habits
Social class Not stated
Ethnicity Not stated
Other confounding Fissure sealant, reduce sugar consumption, pattern of food
consumption (fast food) – not adjusted in analysis
Fluoride
levels
Fluoride level at
baseline
0.9 ppm
Fluoride level at the
end
0.2 ppm (range 0.12 to 0.19ppm)
Outcome
measure
Caries index DMFT
Teeth examined Permanent
Outcomes No of subjects (N) See table
Age groups 8-12 years
Caries
experience
(before &
after)
Spremberg Zittau
Age 1993 1996
Age 1993 1997
N DMFT N DMFT N DMFT N DMFT
8 224 0.51
(0.97)
158 0.34
(0.79)
8 333 0.56
(1.02)
- -
9 259 0.69
(1.15)
190 0.50
(1.02)
9 324 0.92
(1.38)
- -
12 323 2.36
(2.11)
89 1.45
(1.67)
12 337 2.47
(2.06)
184 1.96
(1.96)
13 327 2.59
(2.19)
180 1.63
(2.02)
13 334 3.16
(2.54)
- -
15 313 4.13
(3.10)
91 3.74
(3.64)
15 264 4.71
(3.33)
- -
16 294 5.03
(3.32)
125 3.86
(3.21)
16 205 4.93
(3.82)
- -
Funding Not stated
Comment ~Clinical examination only. Cross sectional survey in two communities in Germany.
~Fluoridation status not stable before 1993 (therefore only include data from 1993-
1996). Only extract DMFT data, no baseline data for % caries free in 1993.
~In Zittau area: before and after intervention data only available for 12 year-old group.
Page 336
318
Study tittle: Fluoridation in China, a clouded future
Authors and year of publication: Wei & Wei, 2002
Study details Country of study China
Geographic location Gongzhou
Year study at baseline 1982
Year study at follow up 1990
Year of change in
fluoridation
1983 (WF ceased)
Study design Cross sectional survey with no control
Inclusion &
exclusion
criteria
Inclusion criteria Not stated
Exclusion criteria Not stated
Confounding
factors
Other sources of fluoride Not stated
Social class Not stated
Ethnicity Not stated
Other confounding Not stated
Fluoride levels Fluoride level at baseline 0.7 to 0.8 ppm
Fluoride level at the end 0.3 ppm
Outcome
measure
Caries index DMFT
Teeth examined Permanent
Outcomes No of subjects (N) 137
Age groups 15
Caries experience (before
& after) Year N DMFT
1982 75 0.90
1990 62 0.44
Funding Not stated
Comment For baseline survey in 1982 (data available from 12-18 years) but for follow
up survey (1990), data only available for 15 years of age.
Page 337
319
Stopping water fluoridation and caries, cross sectional studies with a negative control
group
Study tittle: The fluoridation studies in the UK & results achieved after 11 years. A report
of the committee in research into fluoridation. London: Her Majesty's Stationary Office;
Reports on Public Health Medical Subjects No. 122.
Authors and year of publication: DHSS, 1969
Study details Country of study Scotland, UK
Geographic location Kilmarnock (WF ceased) & Ayr (control-NF)
Year study at baseline 1956
Year study at follow up 1968
Year of change in
fluoridation
1962 (Oct 1982_WF discontinued)
Study design Cross sectional with negative control group
Inclusion &
exclusion
criteria
Inclusion criteria Not stated
Exclusion criteria Not stated
Confounding
factors
Other sources of fluoride Not stated
Social class Not stated
Ethnicity Not stated
Other confounding Not stated
Fluoride levels Fluoride level at baseline Not clearly stated (Assume 1.0ppm)
Fluoride level at the end 0 (after cessation)
Outcome
measure
Caries index dmft and % caries free
Teeth examined 3 & 4 year-old (full deciduos), 5 & 7 y.old
(molar & canine deciduous)
Outcomes No of subjects (N) Not stated
Age groups 3 to 7
Caries
experience
(before &
after)
Year Kilmanork
(WF ceased)
Ayr
(control-NF)
Mean dmft % caries
free
Mean dmft % caries
free
1961 3.99 20 6.89 4
1968 5.81 7 5.98 7
Funding Not stated
Comment ~Data available for survey in 1956 (prior to fluoridation), 1961, 1964, 1968.
~Sample size was not reported.
~Of those examined, only 5 year-old children were having full effect of
fluoridation.
Page 338
320
Study tittle: A reassessment of the dental health of urban Scottish schoolchildren following
the cessation of water fluoridation
Authors and year of publication: Attwood & Blinkhorn, 1989
Study details Country of study UK
Geographic
location
Stranrear (WF ceased) & Annan (control)
Year study started 1980
Year study ended 1986
Year of change in
fluoridation
1983
Study design Cross sectional negative control group
Inclusion &
exclusion
criteria
Inclusion criteria Life time residents
Exclusion criteria Not stated
Confounding
factors
Other sources of
fluoride
Not stated
Social class Similar social class for both groups
Ethnicity Not stated
Other
confounding
Not stated
Fluoride
levels
Fluoride level at
baseline
1 ppm
Fluoride level at
the end
0 (WF ceased)
Outcome
measure
Caries index DMFT and dmft index.
Teeth examined Permanent and primary teeth
Outcomes No of subjects
(N)
980 (total)
Age groups 5 & 10
Caries
experience
(before &
after)
Stranraer (WF ceased) Annan (NF)-control
Year N 5 y.o
dmft
(s.d)
N 10 y.o DMFT (s.d)
N 5 y.o
dmft
(s.d)
N 10 y.o DMFT
(s.d)
1980 129 2.48
(3.16)
147 1.66
(1.63)
121 4.38
(4.31)
141 3.35
(2.30)
1986 120 1.17
(1.76)
127 1.72
(1.56)
90 3.82
(3.63)
105 2.81
(2.22)
Funding Not stated
Comment Data for 15 year-old only available for 1986 survey. No baseline for this age group,
therefore it was excluded from analysis.
Page 339
321
Study tittle: Caries experience of 15 years old children in the Netherlands after
discontinuation of water fluoridation
Authors and year of publication: Kalsbeek et al., 1993
Study details Country of
study
The Netherlands
Geographic
location
Tiel (WF ceased) & Culemborg (NF control)
Year study
started
1968
Year study
ended
1988
Year of change
in fluoridation
1973
Study design Repeated cross sectional survey with negative control
Inclusion &
exclusion
criteria
Inclusion
criteria
Life long resident, parental consent
Exclusion
criteria
Not stated
Confounding
factors
Other sources
of fluoride
Professional fluoride application (gel), fluoride tablet, fluoride
toothpaste, frequency of toothbrushing
Social class Not stated
Ethnicity Not stated
Other
confounding
Fluoride
levels
Fluoride level
at baseline
1.1 ppm (Tiel); Culemborg (Non-fluoridated)
Fluoride level
at the end
0 (for both areas)
Outcome
measure
Caries index DMFT and DMFS
Teeth
examined
Permanent teeth
Outcomes No of subjects
(N)
Total for all 6 surveys both groups, N=3545 (Tiel=2051,
Colemborg= 1494)
Age groups 15
Caries
experience
(before &
after)
Tiel (WF ceased) Colemborg ( Non-
fluoridated)
Year N DMFT
(s.d)
DMFS
(s.d)
N DMFT
(s.d)
DMFS
(s.d)
1968/69 285 7.4
(±4.0)
10.8
(±7.7)
261 14.1
(±5.7)
27.7
(±14.6)
1987/ 88 297 5.5
(±4.7)
9.6
(±9.9)
241 4.8 (±4.2) 7.7
(±8.2)
Funding Not stated
Comment ~Clinical & radiographs examination.
~Data from six surveys were data available: 1968/69, 1979/80, 1981/82, 1983/84,
1985/86, 1987/88
~The survey in 1968/69 as (pre) and survey in 1987/88 was used as (post-
intervention)
Page 340
322
Study tittle: Caries frequency in permanent teeth before and after discontinuation of water
fluoridation in Kuopio, Finland
Authors and year of publication: Seppa et al., 1998
Study details Country of study Finland
Geographic location Kuopio (WF ceased)& Jyvaskyla (control-NF)
Year study at baseline 1992
Year study at follow up 1995
Year of change in
fluoridation
1992
Study design Repeated cross sectional survey with negative
control
Inclusion &
exclusion
criteria
Inclusion criteria Children age 6,9,12, and 15
Exclusion criteria Not stated
Confounding
factors
Other sources of fluoride Fluoride varnish, fluoride toothpaste, fluoride
tablets/lozenges
Social class Not stated
Ethnicity Finnish
Other confounding Xylitol chewing gum, fluoride varnish,
sealant application,
Fluoride levels Fluoride level at baseline 1 ppm
Fluoride level at the end 0.1 ppm
Outcome
measure
Caries index DMFS
Teeth examined Permanent
Outcomes No of subjects (N) Total 1992 (n=550), 1995 (n=1198)
Age groups 6,9,12 and 15 years
Caries
experience
(before & after)
Mean DMFS (S.E)
Year/
Age
N 6 9 12 15
Fluoridated
1992 278 0.06
(0.04)
0.88
(0.16)
1.88
(0.37)
4.00
(0.59)
1995 617 0.07
(0.04)
0.69
(0.10)
1.62
(0.19)
3.19
(0.28)
Non-Fluoridated
1992 272 0.03
(0.03)
0.70
(0.16)
2.99
(0.47)
5.62
(0.60)
1995 581 0.11
(0.03)
0.70
(0.15)
1.63
(0.23)
3.91
(0.43)
Funding Academy of Finland
Comment Clinical examination & radiographs
Page 341
323
Study tittle: Caries in primary dentition, after discontinuation of water fluoridation, among
children receiving comprehensive dental care
Authors and year of publication: Seppa et al., 2000a.
Study details Country of
study
Finland
Geographic
location
Kuopio (WF cessation) & Jyväskylä (control, naturally fluoridated
0.1ppm)
Year study
at baseline
1992
Year study
at follow up
1995
Year of
change in
fluoridation
1992 ( WF ceased- end of the year)
Study
design
Serial cross sectional survey with control group
Inclusion &
exclusion
criteria
Inclusion
criteria
Consented children
Non-life time resident was included in the analyses ( in Kuopio)
Children resident in Kuopio and Jyvaskyla
Exclusion
criteria
Non consented
Confounding
factors
Other
sources of
fluoride
-Fluoride varnish, fluoride toothpaste, fluoride tablet or lozenges (in
Non-F area).
Social class 2 towns are similar with regard to the distribution of sources of
livelihood.
Ethnicity Finnish?? (not clearly stated)
Other
confounding
-Family income, socio economic status (controlled with logistic
regression)
-Fluoride varnish, fluoride toothpaste, fluoride tablet or lozenges (in
Non-F area).
Fluoride
levels
Fluoride
level at
baseline
1.0ppm
Fluoride
level at the
end
0.1ppm (after cessation in Kuopio)
Outcome
measure
Caries index Invited participant= 1315 , participant rate =917 (for both towns)
Teeth
examined
3, 6, and 9 years
Outcomes No of
subjects
(N)
Kuopio; 1992, n= 222 and 1995, n=453
Jyväskylä; 1992, n=199 and 1995, n=441
Age groups 3,6,9
Page 342
324
Seppa et al., 2000a (continued)
Caries
experience
(before &
after)
Number of participant
WF ceased (Kuopio) Non-F (Jyväskylä)
Age 1992 (N %) 1995 (N %) 1992 (N %) 1995(N %)
3 74 (74%) 142 (79%) 64 (64%) 144 (80%)
6 68 (68%) 152 (84%) 66 (66%) 148 (82%)
9 80 (80%) 159 (88%) 69 (69%) 149 (83%)
dmfs(Mean, SD)
WF ceased (Kuopio) Non-F (Jyväskylä)
1992 1995 1992 1995
Age N Mean
(SD)
N Mean
(SD)
N Mean
(SD)
N Mean
(SD)
3 7
4
0.47
(1.87)
142 0.39
(2.25)
64 0.33
(1.57)
144 0.28
(1.66)
6 6
8
2.26
(2.91)
152 1.90
(3.61)
66 1.32
(2.51)
148 1.26
(2.73)
9 8
0
4.90
(5.13)
159 3.55
(4.39)
69 2.91
(4.30)
149 2.22
(3.55)
Funding Yrjö Jahnsson Foundation and the Academy Finland
Comment
Page 343
325
Study tittle: Caries trends 1992-1998 in Two Low-Fluoride Finish Towns Formerly with
and without fluoridation
Authors and year of publication: Seppa et al., 2000b.
Study details Country of study Finland
Geographic
location
Kuopio (WF cessation); Jyaskyla (control-NF)
Year study at
baseline
1992
Year study at
follow up
1998
Year of change in
fluoridation
1992
Study design Serial cross sectional surveys with negative control
Inclusion &
exclusion
criteria
Inclusion criteria Not stated
Exclusion criteria Not stated
Confounding
factors
Other sources of
fluoride
Fluoride varnish, fluoride toothpaste
Social class Not stated
Ethnicity Not stated
Other
confounding
Information on fissure sealant and fluoride varnish
collected
Fluoride levels Fluoride level at
baseline
1.0ppm
Fluoride level at
the end
0.1ppm(after cessation)
Outcome
measure
Caries index DMFT/dmft, DMFS/dmfs , % caries free
Teeth examined Permanent and primary
Outcomes No of subjects
(N)
1992=688 ,1995=824, 1998=851 (both areas) N for
responded subjects
Age groups 3,6,9,12 and 15 years
Caries experience
(before & after) % caries free
Age Kuopio (WFceased) Jyvaskyla (control)-NF
1992 1995 1998 1992 1995 1998
3 85 91 98 92 93 94
6 44 57 67 68 66 69
9 21 30 35 45 48 40
12 44 38 34 29 46 48
15 27 27 25 10 22 41
N 352 421 437 336 403 414
Funding Not stated
Comment ~Clinical examination and radiographs.
~Mean DMFT & dmfs showed in graph, no exact figure stated except for caries
free . Can’t access raw data as DMFT & dmfs in graph.
Page 344
326
Stopping water fluoridation and caries, cross sectional studies and a positive control
group
Study tittle: Patterns of dental caries following the cessation of water fluoridation
Authors and year of publication: Maupome et al., 2001a
Study details Country of study Canada
Geographic location British Colombia (Comox/Courtney:WF ceased,
Kamloops: positive control)
Year study at baseline 1993/94
Year study at follow up 1996/97
Year of change in
fluoridation
1992
Study design Repeated cross sectional and a longitudinal
investigation with concurrent positive control
Inclusion &
exclusion
criteria
Inclusion criteria Consented
Exclusion criteria Not stated
Confounding
factors
Other sources of fluoride Fluoride toothpaste, fluoride supplement, oral
hygiene practice
Social class Not stated
Ethnicity Not stated
Other confounding Social economic levels, snacking practices
(including beverages), oral hygiene practices
Fluoride levels Fluoride level at baseline Comox/Courtney =1ppm; Kamloops=1ppm
Fluoride level at the end Comox/Courtney =0; Kamloops=1ppm
Outcome
measure
Caries index Modified D1D2MFS index
Teeth examined Permanent teeth
Outcomes No of subjects (N) All subjects (N=5927); life long residents
(N=2994)
Age groups Baseline, 1994/94: Grades 2,3,8 & 9
Follow-up, 1996/96: Grades 5,6,11 & 12
Caries
experience
(before &
after)
Study
site/Grades
Measure 93/94 survey 96/96
survey
WF ceased Subjects -N 1468 1067
Grade 2 & 3 Mean age 8.3 8.2
D1D2MFS
Mean (SD)
1.29 ± 2.10 0.63 ± 1.69
Still
fluoridated
Subjects- N 1239 1111
Grade 2 & 3 Mean age 8.3 8.3
D1D2MFS
Mean (SD)
0.37 ± 1.11 0.30 ±
0.94
WF ceased Subjects -N 1716 1144
Grade 8 & 9 Mean age 14.3 14.3
D1D2MFS
Mean (SD)
4.93 ± 6.43 3.86 ± 5.67
Still
fluoridated
Subjects- N 1504 608
Grade 8 & 9 Mean age 14.4 14.3
D1D2MFS
Mean (SD)
2.27 ± 3.88 2.41 ± 4.58
Page 345
327
Maupome et al., 2001a (continued)
Funding NHRDF Operating Grant 6610-2225-002
Comment ~Data were analysed for both – all subjects & life long residents
~The same children examine in 1993/94 and in the follow up survey 1996/97.
Page 346
328
Study tittle: Measuring the short-term impact of fluoridation cessation on dental caries in
Grade 2 children using tooth surface indices
Authors and year of publication: McLaren et al., 2016
Study details Country of study Canada
Geographic location Calgary (WF ceased) and Edmonton (control)
Year study at baseline 2004/2005
Year study at follow up 2013/2014
Year of change in
fluoridation
2011
Study design Cross sectional with concurrent positive control
Inclusion &
exclusion
criteria
Inclusion criteria Signed parental consent & child verbal consent, life long
resident who reported usually drinking water.
Exclusion criteria Not stated
Confounding
factors
Other sources of fluoride Not stated
Social class Matched population: both large urban centres with
diverse demographic profiles.
Ethnicity Not stated
Other confounding Sugar consumption (mentioned in discussion but no detail
information)
Fluoride
levels
Fluoride level at baseline Not stated (assume 1.0ppm)
Fluoride level at the end 0 (ceased)
Outcome
measure
Caries index DMFS and defs
Teeth examined Permanent teeth:12 teeth-central incisors, lateral incisors,
first molars).
Primary teeth: all primary teeth
Outcomes No of subjects (N) Total (12,581)
Age groups Grade 2
Caries
experienc
e (before
& after)
Calgary (WF ceased)
Mean (95 CI%)
Edmonton (WF continued)
Mean (95 CI%)
Index N 2004/
05
N 2013/
14
N 2004/
05
N 2013/
14
defs 599 2.6
(2.2-
3.0)
3230 6.4
(5.9-
6.9)
6445 4.5
(4.1-
4.8)
2307 6.6
(6.0-
7.2)
DMF
S
590 0.45
(0.37-
0.52)
3182 0.15
(0.13-
0.17)
6373 0.25
(0.22-
0.28)
2263 0.21
(0.17-
0.25)
Funding Canadian Institutes of Health Research (funding reference GIR 127083), Alberta
Health and Alberta Health Services. Lindsay McLaren holds an Applied Public Health
Chair award funded by the Canadian Institutes of Health Research (Institute of
Population and Public Health, Institutes of Musculoskeletal Health and Arthritis), the
Public Health Agency of Canada and Alberta Innovates- Health Solutions.
Comment Total sample size (N) was calculated based on children with primary teeth
Page 347
329
Reduction of fluoride level in the water and caries, cross sectional survey with no
control group
Study tittle: Effect of an interruption in water fluoridation on the caries prevalence of the
primary and secondary dentition
Authors and year of publication: Kunzel, 1980
Study details Country of study Germany
Geographic location Karl-Marx-Stadt
Year study at baseline 1959 (fluoridation begin December 1959)
Year study at follow up 1977
Year of change in
fluoridation
1970 to 1973 (technical problem)-fluoride level
reduced from optimum 1ppm
Study design Series of cross sectional with historical control
Inclusion &
exclusion
criteria
Inclusion criteria Lifelong resident
Aged 6-15 years (permanent dentition)
Aged 3-8 years (deciduous canines and molars)
Exclusion criteria Not stated
Confounding
factors
Other sources of fluoride Not stated
Social class Not stated
Ethnicity Not stated
Other confounding No gender difference in study sample
Fluoride levels Fluoride level at baseline 1.0ppm (± 0.1)
Fluoride level at the end 1970 (0.5ppm), 1971 (0.2ppm), 1972 (0.4ppm)
Outcome
measure
Caries index DMFT and dft
Teeth examined DMFT (all permanent teeth), dft (deciduous
canine and molars)
Outcomes No of subjects (N) 6-15 years (n=20,000), 3-18 years (12,000).
Age groups 3-8 years (primary), 6-15 years (permanent)
Caries
experience
(before &
after)
Age Year /ppm F
1961
1.0ppm
1970
0.5ppm
1971
0.2ppm
1972
0.4ppm
Mean DMFT (permanent)
8 1.7 0.4 0.2 0.3
12 4.5 1.7 1.7 1.4
15 7.1 3.6 3.1 3.0
Mean dft (primary)
5 3.9 1.3 0.9 1.1
6 4.0 1.9 1.6 1.4
Funding Not stated
Comment ~Fluoridation begin December 1959. Fluoride level was reduced from the
water supply due to technical reason. Detailed of fluoride concentration
reported for each year with appropriate reference.
~ For permanent teeth, only data for age 8,12 and 15 were extracted. For
primary teeth, only data for age 5 were extracted.
~Only overall sample size per year provided. Number of subjects not broken
down by age group. Values (N) in the results table were determined by
dividing the N for each year by the number of age group.
Page 348
330
FLUOROSIS STUDIES
Stopping water fluoridation and fluorosis
Study tittle: Changes in dental fluorosis following the cessation of water fluoridation
Authors and year of publication: Clark et al., 2006.
Study details Country of study Canada
Geographic location Comox/Courtenay and Campbell River
communities in British Columbia
Year study started 1993/94
Year study ended 2002/03
Year of change in
fluoridation
1992 (water fluoridation cessation)
Study design Serial cross sectional with no control
Inclusion &
exclusion
criteria
Inclusion criteria Permanent residency status, school children in
second or third grades with parental consent
Exclusion criteria Not stated
Confounding
factors
Other sources of fluoride Fluoride supplement, fluoride dentifrice, oral
hygiene habits
Social class Parental education level
Ethnicity Not stated
Other confounding Not stated
Fluoride levels Fluoride level at baseline 1 ppm
Fluoride level at the end 0 ppm
Outcome
measure
Fluorosis index Thylstrup-Fejerskov Index(TFI) . Any fluorosis
TFI>0
Teeth examined All teeth and maxillary anterior teeth
Outcomes No of subjects (N) 1137 (total)
Age groups 6.2 to 9
Fluorosis prevalence (%),
before and after Group
(N)
Year
survey
% Any fluorosis
All teeth Anterior
teeth
1 (437) 93/94
(baseline)
58.6 45.4
2 (261) 93/94
*[F]
57.4 47.4
3 (293) 96/97 23.0 33.4
4 (146) 2002/03
(after)
24.4 22.0
*[F]: with fluoride supplements
Funding The study was supported by Canadian Institutes of Health Research operating
grant (MOP-57721) and the National Health Research Development Program
operating grant (6610-2225-002)
Note
Page 349
331
Reduction of fluoride level in the water and fluorosis
Study tittle: Partial defluoridation of a community water supply and dental fluorosis
Authors and year of publication: Horowitz et al., 1972
Study details Country of study USA
Geographic location Britton
Year study started 1948
Year study ended 1970
Year of change in
fluoridation
1954 (reduction of F level)
Study design Cross sectional with no control (historical
control)
Inclusion &
exclusion
criteria
Inclusion criteria Life long resident
Exclusion criteria Not stated
Confounding
factors
Other sources of fluoride Not stated
Social class Not stated
Ethnicity Not stated
Other confounding Not stated
Fluoride levels Fluoride level at baseline 6.7 ppm
Fluoride level at the end 1.56 ppm
Outcome
measure
Fluorosis index Dean (any fluorosis Deans>0)
Teeth examined Not stated
Outcomes No of subjects (N) Total: 436
Age groups 8
Fluorosis prevalence (%),
before and after Year N Any fluorosis %
(Deans>0)
1948 (before) 71 100
1960 97 77.3
1965 114 80.7
1970 (after) 154 79.2
Funding Not stated
Note
Page 350
332
Study tittle: The effect of partial defluoridation of a water supply on dental fluorosis- final
results in Bartlett, Texas
Authors and year of publication: Horowitz, 1972
Study details Country of study USA
Geographic location Bartlett,Texas
Year study started 1954
Year study ended 1969
Year of change in
fluoridation
1952
Study design Cross sectional with no control group
(historical control)
Inclusion &
exclusion
criteria
Inclusion criteria Life long resident (from birth to 8 with absence
from the city for no more than 90 days in any
one year).
Exclusion criteria Absent on examination day
Confounding
factors
Other sources of fluoride Not stated
Social class Not stated
Ethnicity Not stated
Other confounding Not stated
Fluoride levels Fluoride level at baseline 8.0 ppm
Fluoride level at the end 1.0 ppm (average)
Outcome
measure
Fluorosis index Dean (any fluorosis Deans>0)
Teeth examined Not stated
Outcomes No of subjects (N) Total= 289 ; survey 1954 (n=132); survey1969
(n=157)
Age groups 8-11 years old
Fluorosis prevalence (%),
before and after Year (N) Any fluorosis
1954 (n=132) 97.7%
1969 (n=157) 51.0%
Funding Not stated
Note
Page 351
333
Study tittle: Changes in dental fluorosis following an adjustment to the fluoride
concentration of the Hong Kong’s water supply
Authors and year of publication: Evans,1989
Study details Country of study Hong Kong
Geographic location 4 districts; Aberdeen, Kowloon, Yuen Long
and Peng Chau
Year study at baseline Not stated
Year study at follow up Not stated
Year of change in
fluoridation
1978
Study design Cross sectional survey with no control group
Inclusion &
exclusion
criteria
Inclusion criteria Lifelong residents, consented children.
Exclusion criteria Non-lifelong residents
Confounding
factors
Other sources of fluoride Not stated
Social class Not stated
Ethnicity Not stated
Other confounding Equal numbers boys and girls in total samples
Fluoride levels Fluoride level at baseline 1ppm (average). The exact F level varies
across district
Fluoride level at the end 0.7 ppm
Outcome
measure
Fluorosis index Deans Index
Teeth examined Upper central right incisor
Outcomes No of subjects (N) Total=2382 (lifelong residents); Aberdeen
(n=859); Yuen Long (n=684), Kowloon
(n=562), Peng Chau (n=274)
Age groups 7-13 years
Fluorosis
prevalence
(%),
before and
after
District Age
group
sample Fluoride
Level
(ppm)
Any
fluorosis
%
Birth cohorts that exposed to higher F level
Aberdeen 12-13 138 0.90 92.8
Yueng
Long
13 108 0.83 78.7
Kowloon 11-12 81 0.78 90.1
Peng
Chau
11-12 33 0.85 81.8
Birth cohorts that exposed to lower F level
Aberdeen 7-8 129 0.63 82.5
Yueng
Long
7-8 63 0.63 85.7
Kowloon 7-8 40 0.63 95.0
Peng
Chau
7-8 23 0.61 95.7
Funding Not stated
Comment This study compare different birth cohorts that exposed to different fluoride
level during development of enamel
Page 352
334
Study tittle: Dental fluorosis following downward adjustment of fluoride in drinking water
Authors and year of publication: Evans & Stamm 1991a
Study details Country of study Hong Kong
Geographic location Not specific (2 metropolitan & 2 rural cities)
Year study started 1973 (not clear)
Year study ended 1986
Year of change in
fluoridation
1978 (reduced F level)
Study design Cross sectional with no control
Inclusion &
exclusion
criteria
Inclusion criteria Parental consent, lifelong resident, erupted
upper right central incisors
Exclusion criteria Non-continuous resident (n=172), author
provides number and reason of exclusion table
Confounding
factors
Other sources of fluoride Fluoridated toothpaste (starting 1983),
formula milk reconstituted with tap water
Social class Not stated
Ethnicity Not stated
Other confounding Not stated
Fluoride levels Fluoride level at baseline 1.0 ppm
Fluoride level at the end 0.7 ppm
Outcome
measure
Fluorosis index Dean’s Index & CFI
Teeth examined Upper right central incisors
Outcomes No of subjects (N) 1062
Age groups 7 to 12
Fluorosis prevalence (%),
before and after Age F level (ppm) Any fluorosis %
12 0.8 88
11 0.8 85
10 0.8+0.6 86
9 0.8+0.6 79
8 0.8+0.6 76
7 0.6 77
Funding Note stated
Note This study compare different birth cohorts that exposed to different fluoride
level during development of enamel
Page 353
335
Study tittle: Diffuse opacities in 12 year-old Hong Kong children
Authors and year of publication: Wong et al., 2014
Study details Country of study Hong Kong
Geographic location Not stated
Year study started 1983
Year study ended 2010
Year of change in
fluoridation
1978=0.7ppm, 1988: 0.5ppm
Study design Serial cross sectional survey with no control
Inclusion &
exclusion
criteria
Inclusion criteria 12 year-old children
Availability of intra-oral photographs of
previous surveys
Exclusion criteria Presence of fixed orthodontic appliances,
overlapping tooth surfaces on the
photographs, missing tooth, fracture of a
tooth, plaque/stain, restoration & decay on
tooth, gingival hyperplasia.
Confounding
factors
Other sources of fluoride Fluoridated toothapaste, toothbrushing habits
Social class Not stated
Ethnicity Not stated
Other confounding Not stated
Fluoride levels Fluoride level at baseline 1.0 ppm
Fluoride level at the end 0.5 ppm
Outcome
measure
Fluorosis index DDE (diffuse opacities =fluorosis)
Teeth examined Photograph scores on maxillary incisors (4
teeth)
Outcomes No of subjects (N) 2658 (total)
Age groups 12
Fluorosis prevalence (%)
Before and after Year N F level Fluorosis %
1983 700 1.0 89.3
1991 670 0.7 48.5
2001 620 0.5 32.4
2010 668 0.5 42.1
Funding Research Grants Council of the special Administrative Region, China
(Project No: 782811)
Note Caries data cited from different studies was presented in graph (caries data
such as mean caries cannot be extracted). Full text references retrieved (2
articles), however relevant data needed is not available.
Page 354
336
Appendix 12 Validity score for each study
CARIES STUDIES
Author Country Study
design
Prospective Fluoride
Measurement
Confounding
Factors
Control for
Confounding
Blinding Baseline
Survey
Follow
Up
Score Level of
Evidence
Reduction studies and caries [historical control]
Kunzel
1980
Germany CS (1/4) 1 1/2
0 0 0 1 1 3.75 C
Cessation studies and caries [historical control]
Lemke
et al.
1970
Wisconsin,
USA
CS (1/4) 1 0 0 0 0 1 1 3.25 C
Stephen
et al.
1987
Scotland,
UK
CS (1/4) 1 0 0 0 0 1 1 3.25 C
Kunzel
&
Fischer,
1997
Germany CS (1/4) 1 0 1 0 0 1 1 4.25 C
Kunzel
&
Fischer,
2000
La Salud,
CUba
CS (1/4) 1 0 0 0 0 1 1 3.25 C
Kunzel
et al.
2000
Germany CS (1/4) 1 1/2
0 0 0 1 1 3.75 C
Wei &
Wei
Gongzhou,
China
CS (1/4) 1 0 0 0 0 1 1 3.25 C
Jordan
1962
USA CS (1/4) 1 0 0 0 0 1 1 3.25 C
Page 355
337
WF cessation & caries studies with positive control
Maupome
et. al., 2001
British
Columbia,
Canada
CS with a
positive
control
(2/4)
1 0 1 1 0 1 1 5.5 B
McLaren et
al., 2016
Calgary &
Edmonton,
Canada
CS with a
positive
control
1 0 1 1 0 1 1 5.5 B
WF cessation & caries studies with negative control
Atwood &
Blinkhorn,
1989
Scotland,
UK
CS with
NF
control
(2/4)
1 0 0 0 0 1 1 3.5 C
Kalsbeek et
al. 1993
Netherlands CS with
NF
control
1 0 1 0 1/2 1 1 5 B
Seppa et
al., 1998
(permanent)
Kuopio &
Jyvaskayla,
Finland
CS with
NF
control
1 0 1 0 0 1 1 4.5 C
Seppa et
al., 2000a
(primary)
Kuopio &
Jyvaskayla,
Finland
CS with
NF
control
1 0 1 1 0 1 1 5.5 B
Seppa et
al., 2000b
Kuopio &
Jyvaskayla,
Finland
CS with
NF
control
1 0 1 0 0 1 1 4.5 C
DHSS,
1969
Kilmanork,
Scotland
CS with
NF
control
1 0 0 0 0 1 1 3.5 C
Page 356
338
FLUOROSIS STUDIES
Author Country Study design Prospective Fluoride
Measurement
Confounding
Factors
Control for
Confounding
Blinding Baseline
Survey Follow
Up
Score Level of
Evidence
Reduction studies and fluorosis
Wong et
al., 2014
Hong
Kong
CS (1/4) 1 0 1 0 1 1 1 5.25 B
Evans et
al., 1989
Hong
Kong
CS birth
cohorts
analysis (1/4)
1/2 1/2
0 0 1 1 1/2 3.75 C
Evans &
Stamm,
1991
Hong
Kong
CS birth
cohorts
analysis (1/4)
1/2 0 1 0 0 1 1/2 3.25 C
Horowitz
&
Heifetz,
1972
Texas,
USA CS (1/4) 1 0 0 0 0 1 1 3.25 C
Horowitz
et al.
1972
Britton,
USA CS (1/4) 1 1/2
0 0 0 1 1 3.75 C
Cessation studies and fluorosis [historical control]
Wei &
Wei,
2002
Gongzhou,
China CS (1/4) 1 0 0 0 0 1 1 3.25 C
Clark et
al, 2006
British
Columbia,
Canada
CS (1/4) 1 0 1 1 0 1 1 5.25 B
Note: CS=cross sectional
Study with historical control (1/4)=0.25, studies with control group (2/4)=0.5
Fluorosis studies (one survey with birth cohorts analysis)= prospective: 1/4 (= 0.5), with follow-up 1/2 (=0.5)
Blinding (not blincing clinically but with with xray)=1/2 (=0.5)
Fluoride measurement: measure F level as part of study (1), if mention reference of appropriate F measurement in the water (0.5
Page 357
339
Appendix 13 Sampling of school and calculated sample size in fluoridated and non-
fluoridated areas
a) Sampling of school and calculated sample size in fluoridated area
FLUORIDATED AREA ( NEGERI SEMBILAN)
Age Districts No of
schools
A
No of
children
B
% of
population
C
Large
schools
Small
Schools
Sample
required
D
Selected
schools
A/B x100 C x 400 D/50
9 Seremban 108 9120 0.54 78 30 212 4
P.Dickson 54 2169 0.13 19 35 52 1
Rembau 30 635 0.04 4 26 16 1*
Kuala Pilah 51 1122 0.07 12 39 28 1**
Jelebu 25 616 0.04 6 19 16 *
Jempol 45 1616 0.10 20 25 40 **
Tampin 43 1543 0.09 21 22 36 1
TOTAL 356 16,821 160 196 400 8
12 Seremban 108 9147 0.53 78 30 210
P.Dickson 54 2201 0.13 19 35 50
Rembau 30 782 0.05 4 26 20
Kuala
Pilah 51 1249 0.07 12 39
28
Jelebu 25 635 0.04 6 19 16
Jempol 45 1691 0.10 20 25 40
Tampin 43 1586 0.09 21 22 36
TOTAL 356 17,291 160 196 400
*/**Due to small number needed per district, two neighbouring districts were combined
(Rembau and Jelebu; Kuala Pilah and Jempol). Similar schools were used for both age groups.
Page 358
340
b) Sampling of school and calculated sample size in non-fluoridated area
NON-FLUORIDATED AREA ( KELANTAN)
Age Districts No of
schools
A
No of
children
B
% of
population
C
Large
schools
Small
Schools
Sample
required
D
Selected
schools
A/B x100 C x 400 D/50
9 Tanah
Merah 33 2185 0.24 28 5
96
2
Jeli 17 914 0.10 13 4 40 1
Bachok 34 2482 0.27 32 2 108 3
Kuala Krai 39 1774 0.19 25 14 76 1
Gua
Musang 39 1868 0.20 20 19
80
1*
TOTAL 162 9233 118 44 400 8
12 Tanah
Merah 33 2488 0.24 28 5
96
Jeli 17 1066 0.10 13 4 40
Bachok 34 2810 0.27 32 2 108
Kuala Krai 39 1900 0.19 25 14 76
Gua
Musang 39 1999 0.19 20 19
80
162 10,263 118 14 400
*Substitute with spare school in Bachok due to flood issue in that particular district during data
collection.
Page 359
341
1. Your child’s name 2. Your child’s date of birth (dd/mm/yyyy)
…………………………………………
………………………………………..
……………………………………….
3. Your child’s gender
□ Male □ Female
4. Your child’s ethnicity
□ Malay □ Chinese □ Indian □ Others (specify)…………………………………
5. Is your child a life-long resident in the area where you currently live?
□ NO (Go to Q6) □ YES ( Go to Q7)
6. If NO, please provide the address(es) of all your child’s previous residence. (Refer example
below)
a. Questionnaire (English version)
Appendix 14 Survey instrument
Previous residential Years of residence
District State From
(Month/Year)
To
(Month/Year)
Example: Kuala Lipis Pahang Sept/2007 Oct/2009
Participant ID:
PART A: Your child’s personal details and residential status
Please provide the following information about your child
Dear parent/guardian,
Pupils in your child’s class have been selected to participate in this survey. To ensure the success of
this survey, we would appreciate if you could answer the following questions.
Please return the completed questionnaire to the school teacher tomorrow. Your child will
receive a toothbrush and toothpaste as a token of appreciation for participation in this survey. We
will offer all parents who send back a completed questionnaire, an incentive of entry to a prize draw
for one of five RM 100 shopping vouchers.
Thank you very much for your assistance. If you have any questions about the questionnaire, feel
free to get in touch with Dr Nor Azlida Mohd Nor (Tel:03-79674805, email: [email protected] )
Page 360
342
7. Was your child breast-fed?
□ YES ( go to Q8) □ NO (go to Q9)
8. At what age did your child finish breast feeding?
……………Months
9. Was your child ever fed with an infant formula?
□ Yes (go to Q10) □ No (go to Q14)
10. At what age did your child start an
infant formula?
11. At what age did your child finish an
infant formula?
………….Years ……………Months
………….Years ……………Months
12. What brands of the infant formula
was he/she fed? (Please write brands)
13. What type of water did you usually
use to prepare the infant formula
for your child? ( Tick one box only)
…………………………………………....
……………………………………………
……………………………………………
□ Tap water
□ Filtered tap water/ Reverse osmosis
□ Bottled water
14. Does your child brush their teeth?
□ Yes (go to Q15) □ No (go to Q24)
15. At what age did you start brushing your child’s teeth?
………….Years ……………Months
16. At what age did your child first use toothpaste? (Tick one box only)
□ Before 2 years old
□ Between 2 to 4 years old
□ After 4 years old
□ Does not use toothpaste
PART B: In this section we want you to recall your child’s previous feeding practice
PART C: In this section, we would like to ask you about the oral hygiene practices of
your child
Page 361
343
For the following questions, please tick one box only about the oral hygiene practices of your child at
two different times: (i) when your child was aged less than 6 years old (ii) current practice
When your child was aged less
than 6 years old
Now (current practice)
17. How often did/does
your child brush
his/her teeth?
□ Less than once a day
□ Once a day
□ Twice a day
□ More than twice a day
□ Less than once a day
□ Once a day
□ Twice a day
□ More than twice a day
18. How often did/do you
usually supervise your
child’s toothbrushing?
□ Everyday
□ Sometimes
□ Never
□ Not sure
□ Everyday
□ Sometimes
□ Never
□ Not sure
19. After tooth brushing
did/does your child
usually
□ Just swallow
□ Rinse and swallow
□ Rinse and spit
□ Just spit
□ Don’t know
□ Just swallow
□ Rinse and swallow
□ Rinse and spit
□ Just spit
□ Don’t know
20. Have you noticed your
child eating or licking
toothpaste
□ Often
□ Sometimes
□ Never
□ Often
□ Sometimes
□ Never
21. Usually, how much
toothpaste did your
child use when
brushing? (Tick one
box only)
A smear on
the brush
□
A pea-sized
amount
□
Moderate
amount
□
Cover all
the brush
bristles
□
A smear on
the brush
□
A pea-sized
amount
□
Moderate
amount
□
Cover all
the brush
bristles
□
22. What type of
toothpaste did/does
your child usually use?
□ Fluoridated adult toothpaste
□ Fluoridated children’s
toothpaste
□ Non-fluoridated toothpaste
□ Don’t know
□ Fluoridated adult toothpaste
□ Fluoridated children’s
toothpaste
□ Non-fluoridated toothpaste
□ Don’t know
23. What toothpaste
brands did/do you
most frequently used
at home for your
child?
(Only one answer
allowed)
…………………………………..
…………………………………..
( Please write the most common
brand used)
……………………………………
……………………………………
(Please write the most common
brand used)
Page 362
344
24. Has your child ever had fluoride varnish or gel applied by their dentist/dental nurse before
age 6? (Tick one box only)
□ Yes □ No □ Don’t know
25. What is the source(s) of drinking
water in your home? (You can tick
more than one answer)
26. If tap water is used, is the tap
water filtered?
□ Tap water
□ River/stream water
□ Bottled water
□ Others (specify)……………………
□ Yes □ No
QUESTION Father or Guardian (A)
Mother or Guardian (B)
a) What is your
occupation?
(Please write)
……………………………………
……………………………………
b) What is the
highest level of
education you
have?
(Tick one box only)
□ Never been to school
□ Did not complete primary school
□ Completed standard 6
□ Completed Form 3
□ Completed Form 5
□ Completed STPM/Certificate/Diploma
□ Completed a degree
□ Completed a postgraduate degree
□ Others:…………………………
□ Never been to school
□ Did not complete primary school
□ Completed standard 6
□ Completed Form 3
□ Completed Form 5
□ Completed STPM/Certificate/Diploma
□ Completed a degree
□ Completed a postgraduate degree
□ Others:…………………………
c) Which category
does your monthly
income fall into? (Tick one box only)
□ No monthly income
□ Less than RM1000
□ RM1001-1999
□ RM2000-3999
□ RM4000-4999
□ More than RM5000
□ No monthly income
□ Less than RM1000
□ RM1001-1999
□ RM2000-3999
□ RM4000-4999
□ More than RM5000
PART D: Characteristics of the household
The following questions are about your household. These questions will help us to
understand if different methods of preventing dental problems work equally well for all
groups within the community and to ensure that the researchers obtain representative
samples of the population.
Page 363
345
1. Nama anak 2. Tarikh lahir anak (dd/mm/yyyy)
…………………………………………
…………………………………………
…………………………………………
3. Jantina anak
□ Lelaki □ Perempuan
4. Kumpulan etnik anak
□ Melayu □ Cina □ India □ Lain-lain (nyatakan)………………………………..
5. Adakah anak anda bermaustatin secara tetap sejak lahir di kawasan anda tinggal sekarang?
□ TIDAK (jawab soalan 6) □ YA (jawab soalan 7)
6. Jika TIDAK, sila nyatakan alamat kediaman tempat tinggal anda terdahulu. (Rujuk contoh di bawah)
b.Questionnaire (Malay version)
Kediaman terdahulu Tahun menetap
Daerah Negeri Dari
(Bulan/Tahun)
Hingga
(Bulan/Tahun)
Contoh: Kuala Lipis Pahang Sept/2007 Okt/2009
Kepada Ibu/Bapa/Penjaga,
Anak tuan/puan adalah di antara pelajar yang terpilih untuk menyertai kajiselidik ini. Untuk menjayakan
kajiselidik ini, kami amat menghargai sekiranya tuan/puan dapat bekerjasama menjawab soalan-soalan
berikut. Borang yang telah lengkap di isi perlulah di kembalikan kepada pihak sekolah pada hari
berikutnya. Anak anda akan menerima berus gigi dan ubat gigi sebagai tanda penghargaan menyertai
kaji selidik ini. Ibu bapa/penjaga yang mengembalikan borang kajiselidik yang lengkap berpeluang untuk
memenangi cabutan bertuah voucher membeli belah bernilai RM100 setiap satu.
Terima kasih di atas kerjasama yang diberikan. Jika anda mempunyai sebarang pertanyaan mengenai kaji
selidik ini, boleh menghubungi Dr. Nor Azlida Mohd Nor (Tel:03-79674805, email: [email protected] )
ID Peserta:
PART A: Maklumat anak anda dan status penempatan
Sila isikan maklumat di bawah
Page 364
346
7. Adakah anak anda pernah menyusu dengan susu ibu?
□ YA ( jawab soalan 8) □ TIDAK (jawab soalan 9)
8. Pada umur berapakah anak anda berhenti menyusu dengan susu ibu?
……………Bulan
9. Adakah anak anda pernah menyusu dengan susu formula?
□ YA ( jawab soalan 10) □ TIDAK (jawab soalan 14)
10. Pada umur berapakah anak anda
mula menyusu dengan susu formula?
11. Pada umur berapakah anak anda
berhenti menyusu dengan susu
formula?
………….Tahun ……………Bulan
………….Tahun ……………Bulan
12. Apakah jenama susu formula yang
digunakan oleh anak anda (Tuliskan jenama)
13. Jenis air yang digunakan untuk
membancuh susu formula anak anda? ( Tandakan satu jawapan sahaja)
…………………………………………......
……………………………………………..
……………………………………………..
□ Air paip (dimasak)
□ Air paip ditapis/reverse osmosis (RO)
□ Air mineral/ air minuman di dalam botol
14. Adakah anak anda memberus gigi?
□ Ya ( jawab soalan 15) □ Tidak (jawab soalan 24)
15. Sejak umur berapakah anak anda mula memberus gigi?
………….Tahun ……………Bulan
16. Sejak umur berapakah anak anda menggunakan ubat gigi? (Tandakan satu jawapan sahaja)
□ Sebelum umur 2 tahun
□ Di antara umur 2 hingga 4 tahun
□ Selepas umur 4 tahun
□ Tidak menggunakan ubat gigi
PART C: Di bahagian ini anda perlu mengimbas kembali amalan kesihatan pergigian
anak anda
PART B: Di bahagian ini anda perlu mengimbas kembali amalan pemakanan anak anda
Page 365
347
Bagi soalan-soalan berikutnya, sila tandakan satu jawapan berkaitan amalan pergigian anak anda
bagi setiap tempoh masa yang diberikan: (i) Sewaktu anak anda berumur 6 tahun ke bawah &
(ii) pada umur sekarang
Amalan pergigian sewaktu anak
anda berumur 6 tahun ke
bawah
Amalan pergigian pada umur
sekarang
17. Kekerapan anak anda
memberus gigi?
□ Kurang dari satu kali sehari
□ Sekali sehari
□ Dua kali sehari
□ Lebih dari dua kali sehari
□ Kurang dari satu kali sehari
□ Sekali sehari
□ Dua kali sehari
□ Lebih dari dua kali sehari
18. Kekerapan anda
mengawasi anak anda
ketika dia memberus
gigi?
□ Setiap hari
□ Kadang kala
□ Tidak pernah
□ Tidak pasti
□ Setiap hari
□ Kadang kala
□ Tidak pernah
□ Tidak pasti
19. Sebaik sahaja selesai
memberus gigi, apakah
yang dilakukan oleh
anak anda?
□ Telan sahaja
□ Kumur dan telan
□ Kumur dan ludah
□ Ludah sahaja
□ Tidak tahu
□ Telan sahaja
□ Kumur dan telan
□ Kumur dan ludah
□ Ludah sahaja
□ Tidak tahu
20. Adakah anda perasan
anak anda menjilat
atau menelan ubat
gigi?
□ Kerap kali
□ Kadangkala
□ Tidak pernah
□ Kerap kali
□ Kadangkala
□ Tidak pernah
21. Pada kebiasaannya
berapa banyak ubat
gigi digunakan oleh
anak anda?
(Tandakan satu jawapan
sahaja)
Secalit ubat
gigi
□
Saiz
kacang
‘pea’
□
Saiz
sederhana
□
Sepanjang
berus gigi
□
Secalit ubat
gigi
□
Saiz
kacang
‘pea’
□
Saiz
sederhana
□
Sepanjang
berus gigi
□
22. Apakah jenis ubat gigi
yang kebiasaannya
digunakan oleh anak
anda?
□ Ubat gigi berfluorida (dewasa)
□ Ubat gigi berfluorida
(kanak-kanak)
□ Ubat gigi tanpa fluorida
□ Tidak tahu
□ Ubat gigi berfluorida (dewasa)
□ Ubat gigi berfluorida
(kanak-kanak)
□ Ubat gigi tanpa fluorida
□ Tidak tahu
23. Apakah jenama ubat
gigi yang biasanya
digunakan anak anda
di rumah?
(Satu jenama sahaja)
…………………………………
…………………………………
(Tuliskan jenama yang paling
kerap diguna)
…………………………………
…………………………………
(Tuliskan jenama yang paling
kerap diguna)
Page 366
348
24. Pernahkah anak anda menerima sapuan gel/varnish fluorida oleh doktor/jururawat
pergigian sewaktu umur di bawah 6 tahun? (Tandakan satu jawapan sahaja)
□ Ya □ Tidak □ Tidak Tahu
25. Apakah sumber-sumber air di rumah
anda?
(Boleh tanda lebih dari satu jawapan)
26. Jika air paip digunakan adakah
penapis air digunakan?
□ Air paip
□ Air sungai
□ Air mineral/reverse osmosis di dalam botol
□ Lain-lain (nyatakan)………………..
□ Ya □ Tidak
SOALAN Bapa atau Penjaga (A)
Ibu atau Penjaga (B)
a) Apakah
pekerjaan anda
(Sila tuliskan)
…………………………………..
……………………………………
b) Taraf
pendidikan
(Tandakan satu
jawapan sahaja)
□ Tidak pernah bersekolah
□ Tidak habis sekolah rendah
□ Tamat Darjah 6
□ Tamat Tingkatan 3
□ Tamat Tingkatan 5
□ Tamat STPM/sijil/diploma
□ Tamat pengajian sarjana muda
□ Tamat pengajian pasca-ijazah
□ Lain-lain:………………………
□ Tidak pernah bersekolah
□ Tidak habis sekolah rendah
□ Tamat Darjah 6
□ Tamat Tingkatan 3
□ Tamat Tingkatan 5
□ Tamat STPM/sijil/diploma
□ Tamat pengajian sarjana muda
□ Tamat pengajian pasca-ijazah
□ Lain-lain:………………………
c) Jumlah
pendapatan
sebulan (Tandakan satu
jawapan sahaja)
□ Tiada pendapatan bulanan
□ Kurang dari RM1000
□ RM1001-1999
□ RM2000-3999
□ RM4000-4999
□ Lebih dari RM5000 dan ke atas
□ Tiada pendapatan bulanan
□ Kurang dari RM1000
□ RM1001-1999
□ RM2000-3999
□ RM4000-4999
□ Lebih dari RM5000 dan ke atas
PART D: Maklumat isi rumah
Soalan berikut adalah mengenai isi rumah. Soalan-soalan ini dapat membantu kami
untuk memahami perbezaan kaedah pencegahan masalah pergigian untuk semua
golongan di dalam masyarakat. Ia juga bagi memastikan penyelidik memperolehi sampel
mencukupi untuk mewakili masyarakat yang pelbagai.
Page 367
349
Appendix 15 Guidelines of questionnaire distribution
(English version)
Dear teacher,
Thank you for helping us to distribute the questionnaire. There are ….. sets of survey forms
which consist of a questionnaire, consent form and patient information sheet. This set of
survey forms need to be distributed to the parents/guardians of children in Grade 3 and Grade 6
of …… classes namely ……………………………………………………………………
1) Patient information sheet: provides a detailed explanation to the parents/guardians about the
survey. The parents/guardians can detached the sheet and keep it for their own reference.
2) Consent form: written approval is required from the parents/guardians for their child to
participate in this study.
3) Questionnaire: comprises of questions relating to the survey objectives. Parents/guardians
who consent to participate are required to complete the questionnaire and return to the school no
later than the 27th February 2015.
If you have any questions about the form, feel free to get in touch with me.
Dr. Nor Azlida Mohd Nor
Department of Community Oral Health and Clinical Prevention
Faculty of Dentistry
University of Malaya
50603 Kuala Lumpur
Tel:03-79674805/ 010-2716747 Email: [email protected]
Page 368
350
Guidelines of questionnaire distribution (Malay version)
Kepada Guru yang berkenaan,
Terima kasih diucapkan atas kerjasama dari pihak sekolah untuk mengagihkan borang kaji selidik
ini. Terdapat …… set borang kaji selidik telah di hantar kepada pihak sekolah. Terdapat 3 jenis
borang yang perlu di agihkan kepada setiap ibu bapa/penjaga pelajar yang telah di jemput untuk
menyertai kaji selidik ini (Tahun 3 dan Tahun 6) dari kelas
………………………………………………………….. Set borang-borang ini mengandungi
butiran seperti berikut.
1) Risalah maklumat adalah bertujuan untuk memberitahu dengan lebih lanjut tentang kaji
selidik ini kepada ibu bapa/penjaga. Risalah ini boleh diceraikan dari borang yang lain untuk
simpanan ibu bapa/penjaga.
2) Borang kebenaran ibu bapa/penjaga bertujuan mendapatkan persetujuan bertulis dari ibu
bapa/penjaga untuk mereka dan anak mereka menyertai kaji selidik ini secara suka rela. Ibu
bapa/penjaga yang bersetuju perlu mengisi bahagian ini dan mengembalikan kepada pihak
sekolah.
3) Borang soal selidik (questionnaire) adalah borang yang perlu di isi secara lengkap oleh ibu
bapa/ penjaga yang bersetuju untuk menyertai kajian ini dan dikembalikan kepada pihak
sekolah.
Untuk makluman, kajian ini hanya melibatkan pemeriksaan gigi dan menjawab borang soal
selidik. Kami memohon jasa baik guru yang terlibat untuk memastikan para pelajar
mengembalikan borang kepada pihak sekolah dalam jangka waktu masa yang ditetapkan iaitu
pada selewat-lewatnya pada 27 Februari 2015. Insentif di tawarkan bagi ibu bapa yang
menghantar borang kaji selidik yang lengkap iaitu berpeluang memenangi 20 voucher cabutan
bertuah bernilai RM 100 setiap satu.
Kerjasama dan sokongan guru-guru dalam kaji selidik ini amat dihargai dan didahului dengan
ucapan ribuan terima kasih.
Sebarang permasalahan boleh di rujuk kepada penyelidik seperti alamat di bawah.
Dr Nor Azlida Mohd Nor
Pensyarah kanan
Jabatan Pergigian Masyarakat & Pencegahan Klinikal
Fakulti Pergigian
Universiti Malaya
50603 Kuala Lumpur.
Tel:03-79674805/ 010-2716747 Email: [email protected]
Page 369
351
PARTICIPANT INFORMATION SHEET
Title: Oral health following adjustment of fluoride levels in Malaysian public water supply
1. Introduction
You and your child are being invited to take part in a research survey. Before you decide it is
important for you to understand why the research is being done and what it will involve. Please
take time to read the following information carefully and discuss it with others if you wish.
Ask us if there is anything that is not clear or if you would like more information. Take time to
decide whether or not you wish to take part. Participation in this research is voluntary and we
hope you will help us with this survey.
2. What is the purpose of the study?
The survey aims to look for cavities and white patches that may or may not be present on the
tooth surface among 9 and 12-year-old school children who are continuous life-long residents
in identified fluoridated and non-fluoridated areas. The information obtained from the survey
will be used to monitor children’s oral health status in Malaysia.
3. Why have I been chosen?
Nine and 12-year-old school children have been randomly chosen to participate in this survey.
This survey will be carried out in selected Malaysian primary schools and carried out by a
government dentist in school. You and your child have been chosen to participate in this survey
at random from the list of names in your child’s class.
4. Do I have to take part?
It is up to you to decide whether or not to take part. If you decide to take part you will be given
this information sheet to keep and be asked to sign a consent form. If you decide to take part
you are still free to withdraw at any time and without giving a reason.
5. What will happen to me if I take part?
If you agree to take part in this survey, we will ask for two things:
Your consent for your child to have a simple dental examination in school.
In addition, the front teeth of your child will be photographed. None of the images will contain
any identifying aspects of your child face. An example of the intraoral image is shown below
(see Figure 1).
We will also send you a questionnaire about your child’s dental health.
Figure 1: Intraoral image of front teeth
Appendix 16 Participant information Sheet (English Version)
Page 370
352
6. What about confidentiality?
All information obtained will be strictly confidential and will only be used for the purpose of
this survey.
7. What do I have to do?
If you agree to take part in this survey, you will have to do the following:
Return the signed consent form to indicate your agreement for your child to participate in the
survey.
We will ask you to complete a questionnaire about your child’s dental health. This will take
about 5-10 minutes to complete.
8. Are there any risks?
There are no risks involved in this survey. The survey will be carried out with the highest
standard of hygiene and only disposable materials and instruments will be used for the oral
examination.
9. Will I receive an incentive for returning the questionnaire?
Yes, we will offer all parents who send back a completed questionnaire, an incentive of entry to
a prize draw for one of twenty RM100 (£20) shopping vouchers.
10. What will happen to the results of the research study?
The results of the survey will help us to understand the current state of children’s dental health
and the impact of oral hygiene practices in young children. The results of the survey will be
published as a PhD thesis. You will not be identified in any report or publication. A copy of the
published results will be available by contacting Dr Nor Azlida Mohd Nor at the address below.
11. Who is organising and funding the research?
This survey is a joint project between Cardiff University and University Malaya funded by
Ministry of Education, Malaysia.
12. Contact for further Information
If you have any questions about the survey, please contact the dentist who will be examining
your child during the survey as follows:
Dr. Nor Azlida Mohd Nor
Department of Community Oral Health and Clinical Prevention
Faculty of Dentistry
University of Malaya
50603 Kuala Lumpur
Tel:03-79674805/ 010-2716747 Email: [email protected]
Page 371
353
Appendix 17 Consent form (English version)
CONSENT FORM
Title: Oral health following adjustment of fluoride levels in Malaysian public
water supply
Researcher: Dr. Nor Azlida Mohd Nor
Please tick (/)
1. I confirm that I have read and understand the information sheet
dated 30th April 2014 (version 1.1) for the above survey and have the
opportunity to ask questions.
2. I understand that my child’s participant in this survey is voluntary
and that I am free to withdraw my child at any time without giving any
reason.
3. I am happy for my child to take part in the above survey. I
consent to photograph(s) of my child’s teeth being taken for dental
records for this survey. I consent to the photograph(s) of my child being
published in open access journal, textbook or other form of medical
publication.
_________________________ _____________________
Child’s name Relationship with the child
__________________________ _______________________ ___________
Parent/Guardian’s name Signature Date
Page 372
354
Appendix 18 Patient Information Sheet (Malay version)
RISALAH MAKLUMAT (untuk ibu bapa/penjaga)
Tajuk: Status kesihatan pergigian selepas penyelarasan kepekatan fluorida di dalam
bekalan air di Malaysia
1. Pengenalan
Anda dan anak anda dijemput untuk mengambil bahagian di dalam kajiselidik ini. Risalah
maklumat ini menerangkan dengan lebih terperinci mengenai kajian dan membantu anda untuk
membuat keputusan jika anda ingin mengambil bahagian. Kajiselidik ini adalah projek bersama
di antara Universiti Malaya dan Cardiff University, United Kingdom di bawah tajaan
Kementerian Pendidikan Malaysia.
2. Apakah tujuan kaji selidik ini?
Kaji selidik ini bertujuan untuk mengenalpasti gigi yang berlubang, tompok keputihan yang
mungkin ada atau tiada pada permukaan gigi kanak-kanak yang berumur 9 dan 12 tahun yang
merupakan penduduk yang bermastautin secara berterusan di kawasan-kawasan yang telah
dikenalpasti mempunyai air berfluorida atau air tidak berfluorida.
3. Kenapa saya terpilih?
Murid-murid sekolah berumur 9 dan 12 tahun telah dipilih secara rawak untuk mengambil
bahagian dalam kajian ini. Kajian ini dijalankan di sekolah-sekolah terpilih di Malaysia oleh
seorang doktor pergigian. Anda dan anak anda terpilih secara rawak untuk mengambil bahagian
dalam kajian ini daripada senarai nama pelajar di dalam kelas anak anda.
4. Perlukah saya mengambil bahagian?
Penyertaan di dalam kajian ini adalah secara sukarela. Jika anda mengambil keputusan untuk
menyertai kajian ini, anda akan di berikan risalah maklumat ini untuk di simpan dan anda di
minta untuk menandatangi borang keberanan sebagai tanda persetujuan. Anda berhak menarik
diri pada bila-bila masa tanpa sebarang sebab.
5. Apa yang akan berlaku sekiranya saya mengambil bahagian?
Jika anda bersetuju untuk meyertai kajiselidik ini, kami memohon melakukan perkara di
bawah:
Kebenaran bertulis untuk anak anda menjalani pemeriksaan gigi di sekolah. Selain itu, gambar
gigi hadapan anak anda akan di rakam. Hanya imej gigi hadapan di rekodkan dan tiada gambar
wajah atau identiti diri anak anda akan di ambil (Gambar 1 sebagai rujukan)
Kami juga akan menghantar borang soal-selidik mengenai kesihatan mulut anak anda.
Gambar 1: Imej gigi hadapan
Page 373
355
6. Bagaimana dengan kerahsiaan identiti?
Segala maklumat yang dikumpul adalah sulit dan hanya digunakan untuk tujuan kajiselidik ini
sahaja.
7. Apa yang perlu saya lakukan?
Jika anda bersetuju untuk meyertai kajian ini, anda perlu melakukan perkara berikut:
Mengembalikan kebenaran bertulis untuk keizinan anak anda menyertai kajian ini
Anda di minta untuk mengisi borang kaji selidik mengenai kesihatan pergigian anak anda. Ini
mengambil masa sekitar 5-10 minit.
8. Adakah terdapat sebarang risiko?
Tiada sebarang risiko untuk anak anda di dalam kajiselidik ini. Kajian ini akan dijalankan
dengan tahap kebersihan dan kawalan infeksi mengikut piawaian dan hanya peralatan pakai
buang akan digunakan semasa pemeriksaan mulut.
9. Adakah saya akan menerima sebarang insentif sekiranya melengkapkan dan
mengembalikan borang kajiselidik?
Ya, ibu bapa/ penjaga berpeluang untuk memenangi hadiah cabutan bertuah iaitu 20 voucher
membeli belah bernilai rm100 setiap satu sekiranya mengembalikan borang soal-selidik yang
lengkap di isi.
10. Apa akan berlaku kepada hasil kajian penyelidikan?
Hasil kajian ini akan membantu kami untuk memahami kesihatan gigi dan impak penjagaan
kesihatan mulut di kalangan kanak-kanak. Keputusan kaji selidik itu akan diterbitkan sebagai
thesis PhD. Identiti anda tidak akan dikenal pasti dalam apa-apa laporan atau penerbitan.
Salinan kajian yang diterbitkan boleh didapati dengan menghubungi Dr Nor Azlida Mohd Nor
di alamat di bawah.
11. Siapakah yang menaja penyelidikan ini?
Kajian ini adalah projek kerjasama di antara Cardiff University dan Universiti Malaya yang di
taja oleh Kementerian Pelajaran Malaysia.
12. Butiran lanjut
Sekiranya anda mempunyai sebarang pertanyaan lanjut, sila hubungi:
Dr. Nor Azlida Mohd Nor
Pensyarah Kanan
Jabatan Kesihatan Pergigian dan Pencegahan Klinikal
Fakulti Pergigian, Universiti Malaya
50603 Kuala Lumpur.
Pejabat : 0379674805 Mobile: 010-2716747 Email: [email protected]
Page 374
356
Appendix 19 Consent form (Malay Version)
BORANG KEBENARAN
Tajuk: Status kesihatan pergigian selepas penyelarasan kepekatan fluorida di
dalam bekalan air di Malaysia
Nama Penyelidik: Dr. Nor Azlida Mohd Nor
Sila tandakan (/)
1. Saya telah membaca dan memahami risalah maklumat bertarikh 30 April 2014 (versi 1.1) untuk kaji selidik ini.
2. Saya memahami bahawa penyertaan anak saya adalah secara sukarela dan boleh menarik diri pada bila-bila masa, tanpa sebarang sebab.
3. Saya bersetuju anak saya mengambil bahagian dalam kaji selidik ini dan
membenarkan gambar gigi anak saya digunakan untuk rekod pergigian kajian ini.
__________________________ _______________________
Nama murid Hubungan dengan murid
__________________________ _______________________ ____________
Nama ibubapa/penjaga Tandatangan Tarikh
Versi:1 .1 Tarikh:30-04-14
Page 375
357
Appendix 20 Example of signed consent form
Page 376
358
Appendix 21 Clinical examination room and procedure
Page 377
359
Appendix 22 Clinical examination form
Page 379
361
Appendix 23 Criteria for Dean’s fluorosis index
Code Classification Criteria
0 Normal The enamel represents the usual translucent
semivitriform type of structure. The surface is smooth, glossy
and usually of pale creamy white colour.
1 Questionnable
(<10% of surface)
The enamel discloses slight (<10% of surface)
aberrations from the translucency of normal enamel,
ranging from a few white flecks to occasional white spots. This
classification is utilised in those instances where a definite
diagnosis is not warranted and a classification of “normal” not
justified.
2 Very mild
(10-25% of
surface)
Small, opaque, paper white areas scattered irregularly over the
tooth but not involving as much as approximately 25 per cent
of the tooth surface.
Frequently included in this classification are teeth
showing no more than about 1 – 2mm of white opacity at the
tip of the summit of the cusps, of the bicuspids or second
molars.
3 Mild
(25-50% of
surface)
The white opaque areas in the enamel of the teeth are more
extensive but do involve as much as 50 percent of the tooth.
4 Moderate All enamel surfaces of the teeth are affected and
surfaces subject to attrition show wear. Brown stain is
frequently a disfiguring feature
5 Severe All enamel surfaces are affected and hypoplasia is so marked
that the general form of the tooth may be
affected. The major diagnostic sign of this classification is
discrete or confluent pitting. Brown stains are widespread and
teeth often present a corroded-like appearance.
Page 380
362
Appendix 24 Example of the intra-oral photographs of fluorosis
Normal
Very mild
Mild
Moderate
Page 381
363
Appendix 25 Visual basic interface for ICDAS caries data
Page 382
364
Appendix 26 Feedback from an expert committee of the questionnaire following face-validation
Original Questionnaire Committee Feedback Pre-questionnaire after modification
Question 4
Your child’s Identity Card (IC) number
Remove this question as it is considered
confidential and not relevant for the
research.
Question 4 was removed
Question 7
Was your child given the following milk at
the infant stage?
Breast feeding How long?
_____ months ____ (years)/
Formula milk Since what age?
_____ months ____ (years)/
Both the above
Consider to rephrase this question and
reorganize the answer options to meet the
objectives of the study.
The changes have been made as follows:
Q9. At what age did your child begin breast feeding?
_____ years / _____months
Q10. At what age did your child finish breast feeding?
_____ years / _____months
Q12. At what age did your child start an infant
formula? _____ years / _____months
Q13. At what age did your child finish an infant
formula? _____ years / _____months
Page 383
365
Original Questionnaire Committee Feedback Pre-questionnaire after modification
Question 15
How did you usually prepare the infant
formula for your child?
Tap water
Reverse osmosis/ filtered tap water
Bottled water
Question 15 (Malay version)
Jenis air yang digunakan untuk membancuh
susu formula anak anda?
Air masak (dimasak)
Air paip ditapis/ reverse osmosis
Air mineral/air minuman di dalam botol
Require rephrasing answer option of
Question 15 from “tap water” to “boiled
tap water” as the word tap water alone may
have a different meaning to Malaysian
population. This is due to the norm practice
of the society to boil tap water before
drinking or preparing infant formula.
The term “reverse osmosis” is considered a
common term among lay population in
Malaysia and this term remained as an
answer option in the Malay version.
Direct translation for “bottled water” to
Malay is “air botol” may give different
meaning to respondents. The committee
suggested to change “bottled water” to
“mineral water” for the English version.
The Malay term that have same conceptual
meaning to original version as “air
mineral/ air minuman di dalam botol”
The changes have been made as follows:
How did you usually prepare the infant formula for
your child?
Tap water (boiled)
Reverse osmosis/ filtered tap water
Mineral water
Jenis air yang digunakan untuk membancuh susu
formula anak anda?
Air masak (dimasak)
Air paip ditapis/ reverse osmosis
Air mineral/air minuman di dalam botol
Page 384
366
Original Questionnaire Committee Feedback Pre-final questionnaire after modification
Question 19
Does your child brush their teeth?
Yes, everyday
Yes, sometimes
Never
Not sure
To remove the term “yes” for answer
options in Question 19
Yes, everyday
Yes, sometimes………..
The changes have been made as follows:
Does your child brush their teeth?
Everyday
Sometimes
Never
Not sure
Page 385
367
Appendix 27 Article in the Community Dental Health Journal
Page 390
372
Appendix 28 Ethical approval from Cardiff University
Page 391
373
Appendix 29 Approval from the Ministry of Health, Malaysia
Page 392
374
Appendix 30 Approval from the Ministry of Education, Malaysia
Page 393
375
Appendix 31 Approval from State Education Department, Malaysia
a. Approval from State Education Selangor for pilot study
Page 394
376
b. Approval from State Education Negeri Sembilan for main study
Page 395
377
b. Approval from State Education Negeri Kelantan for main study
Page 396
378
Appendix 32. Bivariate analyses between risk factors and prevalence of fluorosis
(Deans≥2) in fluoridated and non-fluoridated areas (Tables 1 to 8)
Table 1. Bivariate analysis of fluorosis prevalence and demographic characteristics of
study participants (by area) in a fluoridated
Fluoridated Fluorosis (Deans≥2)
n (%)
Odds ratio
95% CI
p value
Demographic Yes No
Gender
Boys 89 (34.1) 172 (65.9) Ref
Girls 124 (37.0) 211 (63.0) 1.14 (0.81-1.59) 0.461
Father Education
College/University 50 (34.2) 96 (65.8) Ref
High school 131 (36.1) 232 (63.9) 0.82 (0.39-1.76) 0.614
≤Primary school 12 (30.0) 28 (70.0) 1.08 (0.72-1.62) 0.695
Mother
Education
College/University 60 (33.7) 118 (66.3) Ref
High school 124 (37.1) 210 (62.9) 0.73 (0.36-1.48) 0.385
≤Primary school 13 (27.1) 35 (72.9) 1.16 (0.79-1.70) 0.443
Father monthly
income
≥ MYR 4000 54 (39.1) 84 (60.9) Ref
MYR 1000-3999 54 (35.8) 97 (64.2) 0.21 (0.05-0.95) 0.042
<MYR 1000 87 (32.1) 184 (67.9) 1.02 (0.71-1.45) 0.936
Mother monthly
income
≥ MYR 4000 79 (35.6) 143 (64.4) Ref
MYR 1000-3999 111 (35.9) 198 (64.1) 0.74 (0.48-1.13) 0.158
<MYR 1000 2 (10.5) 17 (89.5) 0.87 (0.54-1.40) 0.554
Ref: reference category
Page 397
379
Table 2. Bivariate analysis of fluorosis prevalence and infant feeding practices among
study participants in fluoridated area
Fluoridated Fluorosis (Deans≥2)
n (%)
Odds ratio
95% CI
p value
Infant feeding
practices
Yes No
Use of infant
formula
No 71 (74.7) 24 (25.3) Ref
Yes 188 (37.6) 312 (62.4) 1.78 (1.09-2.93) 0.023
Breast feeding
No 374 (64.4) 207 (35.6) Ref
Yes 6 (40.0) 9 (60.0) 0.83 (0.29-2.37) 0.728
Age finished breast
feeding
>12 months 84 (29.0) 206 (71.0) Ref
≤12 months 124 (42.2) 170 (57.8) 1.79 (0.27-2.52) 0.001
Age started formula
>12 months 58 (32.0) 123 (68.0) Ref
≤12 months 135 (41.8) 188 (58.2) 1.52 (1.04-2.23) 0.031
Age finished
formula
>48 months 116 (38.3) 187 (61.7) Ref
≤48 months 76 (38.0) 124 (62.0) 0.99 (0.68-1.43) 0.949
Type of water used
to prepare formula
Bottled water 1 (5.6) 17 (94.4) Ref
Tap water 144 (40.7) 210 (59.3) 11.66 (1.53-88.57) 0.018
Filtered tap water 46 (35.9) 82 (64.1) 9.54 (1.23-73.99) 0.031
Duration of formula
use
>48 months 80 (41.2) 114 (58.8) Ref
≤48 months 109 (35.9) 195 (64.1) 0.80 (0.55-1.15) 0.228
Feeding method
Formula only 6 (40.0) 9 (60.0) Ref
Combine breast &
formula
182 (37.5) 303 (62.5) 0.90 (0.32-2.57) 0.846
Breast only 24 (25.3) 71 (74.7) 0.51 (0.16-1.57) 0.240
Ref: reference group
Page 398
380
Table 3. Bivariate analysis of fluorosis prevalence and oral hygiene habits at age less than
six years among study participants in fluoridated area
Fluoridated
Fluorosis (Deans≥2)
n (%)
Odds ratio
95% CI
p value
Oral hygiene habits at
age less than 6 years
Yes No
Frequency of
toothbrushing
Twice/day or more 119 (31.9) 254 (68.1) Ref
Once /day or less 93 (42.3) 127 (57.7) 1.13 (0.61-2.09) 0.697
Supervised toothbrushing
Never 3 (42.9) 4 (57.1) Ref
Yes 206 (35.9) 368 (64.1) 0.79 (0.12-5.24) 0.810
Habits after
toothbrushing
Spat 198 (35.8) 355 (64.2) Ref
Swallowed 12 (35.3) 22 (64.7) 2.01 (0.68-5.95) 0.210
Eating/ licking
toothpaste
Never 94 (38.2) 152 (61.8) Ref
Yes 117 (34.0) 227 (66.0) 1.24 (0.80-1.93) 0.329
Amount of toothpaste
used
Medium to large 118 (34.4) 225 (65.6) Ref
Small 93 (37.5) 155 (62.5) 0.84 (0.54-1.30) 0.432
Type of toothpaste used
Non-fluoridated
toothpaste
24 (29.3) 58 (70.7) Ref
Fluoridated toothpaste 184 (36.8) 316 (63.2) 0.50 (0.24-0.99) 0.048*
Age started
toothbrushing
After 2 years 142 (36.9) 243 (63.1) Ref
Before 2 years 71 (33.6) 140 (66.4) 1.13 (0.61-2.09) 0.697
Age started
toothbrushing with
toothpaste
After 2 years 150 (36.7) 259 (63.3) Ref
Before 2 years 60 (33.1) 121 (66.9) 1.23 (0.65-2.35) 0.523
Ref: reference group
Page 399
381
Table 4. Bivariate analysis of fluorosis prevalence and exposure to fluoride gel/varnish
among study participants in a fluoridated area
Fluoridated Fluorosis (Deans≥2)
n (%)
Odds ratio
95% CI
p value
Yes No
Exposure to fluoride
varnish/gel
No 22 (30.1) 51 (69.9) Ref 0.317
Yes 131 (36.3) 230 (63.7) 0.76 (0.44-1.31)
Ref: reference group
Page 400
382
Table 5. Bivariate analysis of fluorosis prevalence and demographic characteristics of
study participants in a non-fluoridated area
Non-fluoridated
Fluorosis (Deans≥2)
n (%)
Odds ratio
95% CI
p value
Demographic Yes No
Gender
Boys 9 (3.9) 221 (96.1) Ref 0.174
Girls 21 (6.6) 296 (93.4) 1.74 (0.78-3.88)
Father Education
College/University 10 (9.6) 94 (90.4) Ref
High school 20 (6.0) 314 (94.0) 0.60 (0.27-1.32) 0.205
≤Primary school 0 62 (100) - -
Mother
Education
College/University 8 (7.1) 105 (92.9) Ref
High school 21 (6.1) 325 (93.9) 0.22 (0.03-1.79) 0.157
≤Primary school 1 (1.6) 60 (98.4) 0.85 (0.37-1.97) 0.702
Father monthly
income
≥ MYR 4000 9 (8.9) 92 (91.1) Ref
MYR 1000-3999 20 (5.1) 371 (94.9) 0.55 (0.24-1.25) 0.154
<MYR 1000 0 8 (100) - -
Mother monthly
income
≥ MYR 4000 7 (9.7) 65 (90.3) Ref
MYR 1000-3999 6 (5.0) 115 (95.0) 0.49 (0.20-1.24) 0.132
<MYR 1000 17 (5.0) 320 (95.0) 0.48 (0.16-1.50) 0.210
Ref: reference group
Page 401
383
Table 6. Bivariate analysis of fluorosis prevalence and infant feeding practices among
study participants in a non-fluoridated area
Non-fluoridated
Fluorosis (Deans≥2)
n (%)
Odds ratio
95% CI
p value
Infant feeding
practices
Yes No
Use of infant
formula
No 8 (3.7) 206 (96.3) Ref
Yes 22 (6.6) 309 (93.4) 1.83 (0.80-4.20) 0.151
Breast feeding
No 2 (16.7) 10 (83.3) Ref
Yes 28 (5.2) 507 (94.8) 0.28 (0.07-1.32) 0.107
Age finished breast
feeding
>12 months 20 (5.2) 368 (94.8) Ref
≤12 months 8 (5.4) 139 (94.6) 1.06 (0.46-2.46) 0.894
Age started formula
>12 months 12 (7.7) 144 (92.3) Ref
≤12 months 10 (5.5) 171 (94.5) 0.70 (0.30-1.67) 0.424
Age finished
formula
>48 months 13 (6.3) 195 (93.8) Ref
≤48 months 9 (7.2) 116 (92.8) 0.86 (0.36-2.07) 0.736
Type of water used
to prepare formula
Bottled water 2 (14.3) 12 (85.7) Ref
Tap water 18 (6.5) 259 (93.5) 0.28 (0.09-2.01) 0.417
Filtered tap water 1 (2.6) 38 (97.4) 0.15 (0.01-1.90) 0.158
Duration of formula
use
>48 months 5 (7.7) 60 (92.3) Ref
≤48 months 16 (6.1) 248 (93.9) 0.77 (0.27-2.20) 0.631
Feeding method
Formula only 2 (6.7|) 10 (83.3) Ref
Combine breast &
formula
20 (6.3) 299 (93.7) 0.33 (0.07-1.63) 0.175
Breast only 8 (3.7) 206 (96.3) 0.19 (0.04-1.04) 0.055
Ref: reference group
Page 402
384
Table 7. Bivariate analysis of fluorosis prevalence and oral hygiene habits at age less than
six years among study participants in a non-fluoridated area
Non-fluoridated Fluorosis (Deans≥2)
n (%)
Odds ratio
95% CI
p value
Oral hygiene habits at
age less than 6 years
Yes No
Frequency of
toothbrushing
Twice/day or more 11 (4.2) 252 (95.8) Ref
Once /day or less 19 (6.8) 262 (93.2) 1.56 (0.60-4.07) 0.364
Supervised toothbrushing
Never 1 (7.7) 12 (92.3) Ref
Yes 28 (5.6) 473 (94.4) 3.94 (0.37-41.41) 0.254
Habits after
toothbrushing
Spat 29 (5.7) 476 (94.3) Ref
Swallowed 1 (2.9) 33 (97.1) 0.61 (0.07-5.25) 0.649
Eating/ licking
toothpaste
Never 16 (6.8) 220 (93.2) Ref
Yes 14 (4.5) 294 (95.5) 1.72 (0.66-4.47) 0.265
Amount of toothpaste
used
Medium to large 16 (5.6) 272 (94.4) Ref
Small 14 (5.5) 241 (94.5) 1.21 (0.48-3.07) 0.691
Type of toothpaste used
Non-fluoridated
toothpaste
4 (7.0) 53 (93.0) Ref
Fluoridated toothpaste 26 (5.5) 447 (94.5) 1.09 (.23-5.12) 0.918
Age started
toothbrushing
After 2 years 19 (4.8) 375 (95.2) Ref
Before 2 years 11 (7.2) 141 (92.8) 0.50 (0.15-1.68) 0.263
Age started
toothbrushing with
toothpaste
After 2 years 22 (5.2) 398 (94.8) Ref
Before 2 years 8 (6.5) 116 (93.5) 1.74 (0.47-6.47) 0.406
Ref: reference category
Page 403
385
Table 8. Bivariate analysis of fluorosis prevalence and exposure to fluoride gel/varnish
among study participants in a non-fluoridated area
Non-fluoridated Fluorosis (Deans≥2)
n (%)
Odds ratio
95% CI
p value
Yes No
Exposure to fluoride
varnish/gel
No 16 (5.5) 273 (94.5) Ref
Yes 6 (7.4) 75 (92.6) 1.37 (0.52-3.61) 0.531
Ref: reference group
Page 404
386
Appendix 33 Vuong test to compare caries Model 1 vs Model 2
Page 405
387
Appendix 34 Bivariate analyses between risk factors and prevalence of caries at dentine level (D4-6MFT>0) and caries at all levels (D1-6MFT>0)
in a fluoridated and non-fluoridated areas (Tables 9 to 18)
Table 9. Bivariate analysis between demographic characteristics and prevalence of caries at dentine level (D4-6MFT>0) and caries at
all levels (D1-6MFT>0) in a fluoridated area
Fluoridated Dentine caries Unadjusted Caries at all levels Unadjusted
Demographic
characteristics
D4-6MFT>0
N (%)
Odds ratio
95% CI
p value
D1-6MFT>0
N (%)
Odds ratio
95% CI
p value
Yes No Yes No
Gender
Boys 61 (23.0) 204 (77.0) Ref 156 (58.9) 109 (41.1) Ref
Girls 91 (26.6) 251 (73.4) 1.21 (0.84-1.76) 0.312 215 (62.9) 127 (37.1) 1.18 (0.85-1.64) 0.316
Father Education
College/University 39 (26.0) 111 (74.0) Ref 98 (65.3) 52 (34.7) Ref
High school 89 (24.1) 281 (75.9) 1.04 (0.41-2.61) 0.932 220 (59.5) 150 (40.5) 0.65 (0.28-1.53) 0.326
≤Primary school 12 (30.0) 28 (70.0) 0.80 (0.46-1.38) 0.415 26 (65.0) 14 (35.0) 0.63 (0.38-1.03) 0.064
Mother Education
College/University 48 (25.9) 137 (74.1) Ref 119 (64.3) 66 (35.7) Ref
High school 82 (24.3) 256 (75.7) 1.36 (0.55-3.41) 0.507 206 (60.9) 132 (39.1) 0.85 (0.37-1.94) 0.690
≤Primary school 13 (27.1) 35 (72.9) 1.25 (0.68-2.28) 0.472 28 (58.3) 20 (41.7) 0.90 (0.54-1.52) 0.698
Father monthly
income
≥ MYR 4000 55 (24.3) 171 (75.7) Ref 135 (59.7) 91 (40.3) Ref
MYR1000-3999 80 (25.4) 235 (74.6) 1.35 (0.39-4.67) 0.639 196 (62.2) 119 (37.8) 1.73 (0.54-5.56) 0.358
<MYR 1000 6 (31.6) 13 (68.4) 1.34 (0.81-2.24) 0.256 12 (63.2) 7 (36.8) 1.50 (0.96-2.35) 0.073
Mother monthly
income
≥ MYR 4000 43 (30.3) 99 (69.7) Ref 92 (64.8) 50 (35.2) Ref
MYR 1000-3999 28 (18.2) 126 (81.8) 0.65 (0.35-1.19) 0.160 86 (55.8) 68 (44.2) 0.93 (0.53-1.62) 0.795
<MYR 1000 72 (26.2) 203 (73.8) 0.38 (0.19-0.76) 0.007 173 (62.9) 102 (37.1) 0.73 (0.40-1.33) 0.305
Ref: reference category
Page 406
388
Table 10. Bivariate analysis between infant feeding practices and prevalence of caries at dentine level (D4-6MFT>0) and caries at all
levels (D1-6MFT>0) in a fluoridated area
Fluoridated Dentine caries Unadjusted Caries at all levels Unadjusted
Infant feeding
practices
D4-6MFT>0
n (%)
Odds ratio
95% CI
p value D1-6MFT>0
n (%)
Odds ratio
95% CI
p value
Yes No Yes No
Use of infant
formula
No 29 (29.4) 68 (70.1) Ref 56 (57.7) 41 (42.3) Ref
Yes 123 (24.2) 386 (75.8) 0.75 (0.46-1.21) 0.234 314 (61.7) 195 (38.3) 1.18 (0.76-1.83) 0.464
Breast feeding
No 3 (20.0) 12 (80.0) Ref 12 (80.0) 3 (20.0) Ref
Yes 149 (25.2) 443 (74.8) 1.35 (0.38-4.83) 0.649 359 (60.6) 233 (39.4) 0.39 (0.11-1.38) 0.143
Age finished breast
feeding
>12 months 69 (23.3) 227 (76.7) Ref 175 (59.1) 121 (40.9) Ref
≤12 months 80 (26.8) 219 (73.2) 1.20 (0.83-1.74) 0.332 187 (62.5) 112 (37.5) 1.15 (0.83-1.61) 0.393
Age started formula
>12 months 40 (21.6) 145 (78.4) Ref 114 (61.6) 71 (38.4) Ref
≤12 months 85 (25.9) 243 (74.1) 1.27 (0.83-1.95) 0.277 202 (61.6) 126 (38.4) 1.00 (0.69-1.45) 0.994
Age finished
formula
>4 months 84 (27.3) 224 (72.3) Ref 200 (64.9) 108 (35.1) Ref
≤48 months 40 (19.6) 164 (80.4) 0.65 (0.42-0.99) 0.048 115 (56.4) 89 (43.6) 0.70 (0.49-1.00) 0.052
Type of water used
to prepare formula
Bottled water 1 (5.6) 17 (94.4) Ref 11 (61.1) 7 (38.9) Ref
Tap water 85 (23.6) 275 (76.4) 5.26 (0.69-40.07) 0.109 221 (61.4) 139 (38.6) 1.01 (0.38-2.67) 0.981
Filtered tap water 37 (28.2) 94 (71.8) 6.69 (0.86-52.10) 0.069 80 (61.1) 51 (38.9) 1.0 (0.36-2.74) 0.997
Page 407
389
Duration of formula
>48 months 53 (27.2) 142 (72.8) Ref 126 (64.6) 69 (35.4) Ref
≤48 months 70 (22.4) 242 (77.6) 0.78 (0.51-1.17) 0.226 185 (59.3) 127 (40.7) 0.80 (0.55-1.16) 0.232
Feeding method
Formula only 3 (20.0) 2 (80.0) Ref 12 (80.0) 3 (20.0) Ref
Combine breast &
formula
120 (24.3) 372 (75.7) 1.28 (0.36-4.62) 0.703 302 (61.1) 192 (38.9) 0.39 (0.11-1.41) 0.152
Breast only 29 (29.9) 68 (70.1) 1.71 (0.45-6.50) 0.434 56 (57.1) 41 (42.3) 0.34 (0.09-1.29) 0.113
Ref: reference category
Page 408
390
Table 11. Bivariate analysis between oral hygiene habits at the time of study (2015) and prevalence of caries at dentine level (D4-6MFT>0) and caries
at all levels (D1-6MFT>0) in fluoridated area
Fluoridated Dentine caries Unadjusted Caries at all levels Unadjusted
(Oral hygiene
habits, in 2015)
D4-6MFT>0
n (%)
Odds ratio
95% CI
p value D1-6MFT>0
n (%)
Odds ratio
95% CI
p value
Yes No Yes No
Frequency of toothbrushing
Twice/day or
more
132 (26.6) 365 (73.4) Ref 305 (61.4) 192 (38.6) Ref
Once /day or
less
20 (19.0) 85 (81.0) 0.65 (0.38-1.10) 0.109 64 (61.0) 41 (39.0) 0.98 (0.64-1.51) 0.937
Supervise toothbrushing
Never 11 (25.0) 33 (75.0) Ref 33 (75.0) 11 (25.0) Ref
Yes 135 (25.0) 406 (75.0) 1.00 (0.49-2.03) 0.995 325 (60.1) 216 (39.9) 0.50 (0.25-1.01) 0.055
Habits after brushing
Spat 150 (25.2) 445 (74.8) Ref 363 (61.0) 232 (39.0) Ref
Swallowed 2 (40.0) 3 (60.0) 1.98 (0.33-11.95) 0.457 4 (80.0) 1 (20.0) 2.56 (0.28-23.01) 0.402
Eating/ licking toothpaste
Never 121 (23.7) 389 (76.3) Ref 310 (60.8) 200 (39.2) Ref
Yes 28 (31.5) 61 (68.5) 1.48 (0.90-2.41) 0.121 56 (62.9) 33 (37.1) 1.10 (0.69-1.74) 0.703
Amount of toothpaste used
Medium to large 145 (25.9) 415 (74.1) Ref 348 (62.1) 212 (37.9) Ref
Small 7 (18.4) 31 (81.6) 0.65 (0.28-1.50) 0.309 20 (52.6) 18 (47.4) 0.68 (0.35-1.31) 0.246
Type of toothpaste
Non-fluoridated 6 (21.4) 22 (78.6) Ref 16 (57.1) 12 (42.9) Ref
Fluoridated 146 (25.8) 420 (74.2) 1.28 (0.51-3.21) 0.606 363 (62.4) 213 (37.6) 1.24 (0.58-2.68) 0.579
Ref: reference category
Page 409
391
Table 12. Bivariate analysis between oral hygiene habits (at age less than six years) and prevalence of caries at dentine level (D4-6MFT>0) and caries
at all levels (D1-6MFT>0) in a fluoridated area
Fluoridated Dentine caries Unadjusted Caries at all levels Unadjusted
Oral hygiene
habits at age less
than 6 years
D4-6MFT>0
n (%)
Odds ratio
95% CI
p value D1-6MFT>0
n (%)
Odds ratio
95% CI
P value
Yes No Yes No
Frequency of
toothbrushing
Twice/day or
more
96 (25.5) 281 (74.5) Ref 235 (62.3) 142 (37.7) Ref
Once /day or
less
56 (24.7) 171 (75.3) 0.96 (0.66-1.40) 0.827 136 (59.9) 91 (40.1) 0.90 (0.64-1.27) 0.554
Supervised
toothbrushing
Never 1 (14.3) 6 (85.7) Ref 4 (57.1) 3 (42.9) Ref
Yes 149 (25.5) 436 (74.5) 2.06 (0.25-17.17) 0.508 361 (61.7) 224 (38.3) 1.21 (0.27-5.45) 0.805
Habits after
brushing
Spat 138 (24.5) 426 (75.5) Ref 346 (61.3) 218 (38.7) Ref
Swallowed 13 (38.2) 21 (61.8) 1.91 (0.93-3.92) 0.077 23 (67.6) 11 (32.4) 1.32 (0.63-2.76) 0.464
Eating/ licking
toothpaste
Never 62 (24.9) 187 (75.1) Ref 154 (61.8) 95 (38.2) Ref
Yes 88 (25.0) 264 (75.0) 1.00 (0.69-1.46) 0.978 215 (61.1) 137 (38.9) 0.97 (0.69-1.35) 0.849
Amount of
toothpaste used
Medium to large 81 (23.3) 266 (76.7) Ref 214 (61.7) 133 (38.3) Ref
Small 71 (27.8) 184 (72.2) 1.27 (0.88-1.83) 0.210 157 (61.6) 98 (38.4) 1.00 (0.71-1.39) 0.980
Page 410
392
Type of
toothpaste
Non-fluoridated 20 (23.8) 64 (76.2) Ref 57 (67.9) 27 (32.1) Ref
Fluoridated 131 (25.7) 378 (74.3) 1.11 (0.65-1.90) 0.707 312 (61.3) 197 (38.7) 0.75 (0.45-1.23) 0.252
Age started
toothbrushing
After 2 years 106 (27.0) 287 (73.0) Ref 241 (61.3) 152 (38.7) Ref
Before 2 years 46 (21.5) 168 (78.5) 0.74 (0.50-1.10) 0.138 130 (60.7) 84 (39.3) 0.98 (0.69-1.37) 0.889
Age started toothbrushing
with toothpaste
After 2 years 115 (27.7) 300 (72.3) Ref 269 (64.8) 146 (35.2) Ref
Before 2 years 36 (19.5) 149 (80.5) 0.63 (0.41-0.96) 0.032 99 (53.5) 86 (46.5) 0.63 (0.44-0.89) 0.009
Ref: reference category
Page 411
393
Table 13. Bivariate analysis between exposure to fluoride varnish/gel and prevalence of caries at dentine level (D4-6MFT>0) and caries at all levels
(D1-6MFT>0) in a fluoridated area
Fluoridated
Dentine caries Unadjusted Caries at all levels Unadjusted
D4-6MFT>0
N (%)
Odds ratio
95% CI
p value D1-6MFT>0
N (%)
Odds ratio
95% CI
p value
Yes No Yes No
Exposure to Fluoride
varnish/gel
No 90 (24.3) 280 (75.7) Ref 215 (58.1) 155 (41.9) Ref
Yes 15 (20.5) 58 (79.5) 0.81 (0.44-1.49) 0.489 42 (57.5) 31 (42.5) 0.98 (0.59-1.62) 0.928
Page 412
394
Table 14. Bivariate analysis between demographic characteristics and prevalence of caries at dentine level (D4-6MFT>0) and caries at
all levels (D1-6MFT>0) in a non-fluoridated area
Non-fluoridated Dentine caries Unadjusted Caries at all levels Unadjusted
Demographic
characteristics
D4-6MFT>0
N (%)
Odds ratio
95% CI
p value
D1-6MFT>0
N (%)
Odds ratio
95% CI
p value
Yes No Yes No
Gender
Boys 108 (46.8) 123 (53.2) Ref 159 (68.8) 72 (31.2) Ref
Girls 152 (47.9) 165 (52.1) 1.05 (0.75-1.47) 0.782 243 (76.7) 74 (23.3) 1.49 (1.02-2.18) 0.041
Father Education
College/University 46 (44.2) 58 (55.8) Ref 75 (72.1) 29 (27.9) Ref
High school 159 (47.5) 176 (52.5) 1.25 (0.57-2.76) 0.584 248 (74.0) 87 (26.0) 1.20 (0.47-3.04) 0.706
≤Primary school 32 (51.6) 30 (48.4) 1.09 (0.60-1.97) 0.784 49 (79.0) 13 (21.0) 0.90 (0.46-1.76) 0.763
Mother Education
College/University 45 (39.8) 68 (60.2) Ref 79 (69.9) 34 (30.1) Ref
High school 172 (49.6) 175 (50.4) 1.52 (0.68-3.42) 0.312 257 (74.1) 90 (25.9) 1.07 (0.42-2.73) 0.894
≤Primary school 32 (52.5) 29 (47.5) 1.41 (0.77-2.60) 0.268 47 (77.0) 14 (23.0) 0.92 (0.46-1.81) 0.802
Father monthly
income
≥ MYR 4000 47 (46.5) 54 (53.5) Ref 71 (70.3) 30 (29.7) Ref
MYR1000-3999 184 (46.9) 208 (53.1) 1.02 (0.22-4.70) 0.978 294 (75.0) 98 (25.0) 1.48 (0.26-8.57) 0.661
<MYR 1000 4 (50.0) 4 (50.0) 0.95 (0.49-1.81) 0.868 6 (75.0) 2 (25.0) 1.57 (0.77-3.20) 0.213
Mother monthly
income
≥ MYR 4000 33 (45.8) 39 (54.2) Ref 52 (72.2) 20 (27.8) Ref
MYR 1000-3999 57 (47.1) 64 (52.9) 0.83 (0.38-1.78) 0.624 86 (71.1) 35 (28.9) 0.83 (0.35-1.94) 0.664
<MYR 1000 164 (48.5) 174 (51.5) 0.73 (0.32-1.67) 0.458 253 (74.9) 85 (25.1) 0.71 (0.28-1.76) 0.454
Ref: reference category
Page 413
395
Table 15. Bivariate analysis between infant feeding practices and prevalence of caries at dentine level (D4-6MFT>0) and caries at all
levels (D1-6MFT>0) in a non-fluoridated area
Non-fluoridated Dentine caries Unadjusted Caries at all levels Unadjusted
Infant feeding
practices
D4-6MFT>0
n (%)
Odds ratio
95% CI
p value D1-6MFT>0
n (%)
Odds ratio
95% CI
p value
Yes No Yes No
Use of infant
formula
No 115 (53.5) 100 (46.5) Ref 164 (76.3) 51 (23.7) Ref
Yes 143 (43.2) 188 (56.8) 0.66 (0.47-0.93) 0.019 236 (71.3) 45 (28.7) 0.77 (0.52-1.15) 0.200
Breast feeding
No 6 (50.0) 6 (50.0) Ref 9 (75.0) 3 (25.0) Ref
Yes 254 (47.4) 282 (52.6) 0.901 (0.29-2.83) 0.858 393 (73.3) 143 (26.7) 0.92 (0.25-3.43) 0.897
Age finished breast
feeding
>12 months 182 (46.9) 206 (53.1) Ref 111 (75.0) 37 (25.0) Ref
≤12 months 72 (48.6) 76 (51.4) 1.07 (0.73-1.57) 0.718 282 (72.7) 106 (27.3) 1.13 (0.73-1.74) 0.587
Age started formula
>12 months 70 (44.9) 86 (55.1) Ref 42 (26.9) 114 (73.1) Ref
≤12 months 78 (43.1) 103 (56.9) 0.93 (0.60-1.43) 0.743 127 (70.2) 54 (29.8) 0.7 (0.54-1.40) 0.555
Age finished
formula
>48 months 56 (44.8) 69 (55.2) Ref 145 (69.7) 63 (30.3) Ref
≤48 months 91 (43.8) 117 (56.3) 0.96 (0.61-1.50) 0.852 95 (76.0) 30 (24.0) 0.73 (0.44-1.21) 0.216
Page 414
396
Type of water used
to prepare formula
Bottled water 4 (28.6) 10 (7.4) Ref 10 (71.4) 4 (28.6) Ref
Tap water 128 (46.2) 149 (53.8) 2.15 (0.66-7.01) 0.206 202 (72.9) 75 (27.1) 1.08 (0.33-3.54) 0.902
Filtered water 14 (35.9) 25 (64.1) 1.40 (0.37-5.30) 0.620 25 (64.1) 14 (35.9) 0.71 (0.19-2.70) 0.602
Duration of formula
>48 months 26 (40.0) 39 (60.0) Ref 45 (69.2) 20 (30.8) Ref
≤48 months 118 (44.7) 146 (55.3) 1.21 (0.70-2.11) 0.494 188 (71.2) 76 (28.8) 1.10 (0.61-1.98) 0.753
Feeding method
Formula only 6 (50.0) 6 (50.0) Ref 9 (75.0) 3 (25.0) Ref
Combine breast &
formula
137 (42.9) 182 (57.1) 0.75 (0.24-2.39) 0.629 227 (71.2) 92 (28.8) 0.82 (0.22-3.11) 0.773
Breast only 115 (53.5) 100 (46.5) 1.15 (0.36-3.68) 0.814 164 (76.3) 51 (23.7) 1.07 (0.28-4.11) 0.919
Ref: reference category
Page 415
397
Table 16. Bivariate analysis between oral hygiene habits at the time of study (2015) and prevalence of caries at dentine level (D4-6MFT>0) and caries
at all levels (D1-6MFT>0) in a non-fluoridated area
Non-fluoridated Dentine caries Unadjusted Caries at all levels Unadjusted
Oral hygiene
habits, in 2015
D4-6MFT>0
n (%)
Odds ratio
95% CI
p value D1-6MFT>0
n (%)
Odds ratio
95% CI
p value
Yes No Yes No
Frequency of toothbrushing
Twice/day or
more
210 (48.3) 225 (51.7) Ref 327 (75.2) 108 (24.8) Ref
Once /day or
less
50 (44.6) 62 (55.4) 0.86 (0.57-1.31) 0.493 75 (67.0) 37 (33.0) 0.67 (0.43-1.05) 0.080
Supervise toothbrushing
Never 28 (46.7) 32 (53.3) Ref 42 (70.0) 19 (30.0) Ref
Yes 217 (47.5) 240 (52.5) 1.03 (0.60-1.77) 0.905 337 (73.7) 120 (26.3) 1.20 (0.67-2.17) 0.538
Habits after brushing
Spat 248 (46.9) 281 (53.1) Ref 387 (73.2) 142 (26.8) Ref
Swallowed 4 (50.0) 4 (50.0) 1.13 (0.28-4.68) 0.861 6 (75.0) 2 (25.0) 1.10 (0.22-5.52) 0.907
Eating/ licking toothpaste
Never 232 (48.2) 249 (51.8) Ref 353 (73.4) 128 (26.6) Ref
Yes 28 (42.4) 38 (57.6) 0.79 (0.47-1.33) 0.376 49 (74.2) 17 (25.8) 1.05 (0.58-1.88) 0.883
Amount of toothpaste used
Medium to large 236 (47.1) 265 (52.9) Ref 366 (73.1) 135 (26.9) Ref
Small 23 (51.1) 22 (48.9) 1.17 (0.64-2.16) 0.607 35 (77.8) 10 (22.2) 1.29 (0.62-2.68) 0.493
Type of toothpaste
Non-fluoridated 13 (68.4) 6 (31.6) Ref 16 (84.3) 3 (15.8) Ref
Fluoridated 240 (46.3) 278 (53.7) 0.40 (0.15-1.06) 0.067 376 (72.6) 142 (27.4) 0.50 (0.14-1.73) 0.272
Ref: reference category
Page 416
398
Table 17. Bivariate analysis between oral hygiene habits (at age less than six years) and prevalence of caries at dentine level (D4-6MFT>0) and caries
at all levels (D1-6MFT>0) in a non-fluoridated area
Non-fluoridated Dentine caries Unadjusted Caries at all levels Unadjusted
Oral hygiene
habits at age less
than 6 years
D4-6MFT>0
n (%)
Odds ratio
95% CI
p value D1-6MFT>0
n (%)
Odds ratio
95% CI
P value
Yes No Yes No
Frequency of
toothbrushing
Twice/day or
more
130 (46.3) 151 (53.7) Ref 211 (75.1) 70 (24.9) Ref
Once /day or
less
129 (48.9) 135 (51.1) 1.11 (0.79-1.55) 0.544 190 (72.0) 74 (28.0) 0.85 (0.58-1.25) 0.409
Supervised
toothbrushing
Never 5 (38.5) 8 (61.5) Ref 10 (76.9) 3 (23.1) Ref
Yes 244 (48.6) 258 (51.4) 1.51 (0.48-4.69) 0.473 373 (74.3) 129 (25.7) 0.88 (0.24-3.20) 0.831
Habits after
brushing
Spat 240 (47.4) 266 (52.6) Ref 371 (73.3) 135 (26.7) Ref
Swallowed 16 (47.1) 18 (52.9) 0.99 (0.49-1.98) 0.966 26 (76.5) 8 (23.5) 1.18 (0.52-2.68) 0.687
Eating/ licking
toothpaste
Never 114 (48.3) 122 (51.7) Ref 175 (74.2) 61 (25.8) Ref
Yes 145 (46.9) 164 (53.1) 0.95 (0.67-1.33) 0.749 226 (73.1) 83 (26.9) 0.95 (0.65-1.40) 0.790
Amount of
toothpaste used
Medium to large 135 (46.9) 153 (53.1) Ref 208 (72.2) 80 (27.8) Ref
Small 123 (48.0) 133 (52.0) 1.05 (0.75-1.47) 0.785 192 (75.0) 64 (25.0) 1.15 (0.79-1.69) 0.464
Page 417
399
Type of
toothpaste
Non-fluoridated 28 (49.1) 29 (50.9) Ref 37 (64.9) 20 (35.1) Ref
Fluoridated 224 (47.3) 250 (52.7) 0.93 (0.54-1.61) 0.790 353 (74.5) 121 (25.5) 1.58 (0.88-2.82) 0.125
Age started
toothbrushing
After 2 years 186 (47.2) 208 (52.8) Ref 283 (71.8) 111 (28.2) Ref
Before 2 years 74 (48.4) 79 (51.6) 1.05 (0.72-1.52) 0.808 119 (77.8) 34 (22.2) 1.37 (0.88-2.13) 0.158
Age started toothbrushing
with toothpaste
After 2 years 200 (47.6) 220 (52.4) Ref 306 (72.9) 114 (27.1) Ref
Before 2 years 58 (46.4) 67 (53.6) 0.95 (0.64-1.42) 0.811 94 (75.2) 31 (24.8) 1.18 (0.52-2.68) 0.687
Ref: reference category
Page 418
400
Table 18. Bivariate analysis between exposure to fluoride varnish/gel and prevalence of caries at dentine level (D4-6MFT>0) and caries at all levels
(D1-6MFT>0) in a non-fluoridated area
Non-fluoridated
Dentine caries Unadjusted Caries at all levels Unadjusted
D4-6MFT>0
N (%)
Odds ratio
95% CI
p value D1-6MFT>0
N (%)
Odds ratio
95% CI
p value
Yes No Yes No
Exposure to Fluoride
varnish/gel
No 132 (45.5) 158 (54.5) Ref 307 (71.4) 83 (28.6) Ref
Yes 35 (43.2) 46 (56.8) 0.91 (1.55-1.50) 0.712 59 (72.8) 22 (27.2) 1.08 (0.62-1.87) 0.795
Ref: reference category
Page 419
401
Appendix 35 List of conferences attended
1. ‘Clinician agreement on fluorosis scoring: a comparison of photographic and clinical
methods’ at Malaysia International Dental Exhibition and Conference, Kuala Lumpur,
12-14th June 2015. (Oral presentation).
2. The British Society for Oral and Dental Research (BSODR) Scientific Meeting 2015,
Cardiff City Hall, 14-16th September 2015. (Participant).
3. ‘Caries experience among Malaysian children in fluoridated and non-fluoridated areas
using ICDAS II criteria’ at the British Association for the Study of Community
Dentistry Conference, Spring Scientific Meeting, Windermere, Cumbria, United
Kingdom, 14-15th April 2016. (Poster presentation).
4. ‘Fluorosis following reduction of fluoride level in the water supply’ at the 95th
General Session & Exhibition of the International Association for Dental Research
(IADR), San Francisco, US, 22-25th March 2017. (Oral presentation).
5. ‘The effects of stopping the addition or reducing the level of fluoride level in the
public water supply: a systematic review’ at the British Association for the Study of
Community Dentistry (BASCD) Spring Scientific Conference, Oxford, United
Kingdom, 6-7th April 2017. (Poster presentation).