Nordic Society Oikos 6WDWLVWLFV DQG 3DUWLWLRQLQJ RI 6SHFLHV 'LYHUVLW\ DQG 6LPLODULW\ DPRQJ 0XOWLSOH &RPPXQLWLHV $XWKRUV 5XVVHOO /DQGH 6RXUFH 2LNRV 9RO 1R 0D\ SS 3XEOLVKHG E\ %ODFNZHOO 3XEOLVKLQJ RQ EHKDOI RI 1RUGLF 6RFLHW\ 2LNRV 6WDEOH 85/ http://www.jstor.org/stable/3545743 $FFHVVHG Your use of the JSTOR archive indicates your acceptance of JSTOR's Terms and Conditions of Use, available at http://www.jstor.org/page/info/about/policies/terms.jsp. JSTOR's Terms and Conditions of Use provides, in part, that unless you have obtained prior permission, you may not download an entire issue of a journal or multiple copies of articles, and you may use content in the JSTOR archive only for your personal, non-commercial use. Please contact the publisher regarding any further use of this work. Publisher contact information may be obtained at http://www.jstor.org/action/showPublisher?publisherCode=black. Each copy of any part of a JSTOR transmission must contain the same copyright notice that appears on the screen or printed page of such transmission. JSTOR is a not-for-profit service that helps scholars, researchers, and students discover, use, and build upon a wide range of content in a trusted digital archive. We use information technology and tools to increase productivity and facilitate new forms of scholarship. For more information about JSTOR, please contact [email protected]. Blackwell Publishing and Nordic Society Oikos are collaborating with JSTOR to digitize, preserve and extend access to Oikos. http://www.jstor.org
Transcript
Nordic Society Oikos
http://www.jstor.org/stable/3545743
Your use of the JSTOR archive indicates your acceptance of JSTOR's Terms and Conditions of Use, available athttp://www.jstor.org/page/info/about/policies/terms.jsp. JSTOR's Terms and Conditions of Use provides, in part, that unlessyou have obtained prior permission, you may not download an entire issue of a journal or multiple copies of articles, and youmay use content in the JSTOR archive only for your personal, non-commercial use.
Please contact the publisher regarding any further use of this work. Publisher contact information may be obtained athttp://www.jstor.org/action/showPublisher?publisherCode=black.
Each copy of any part of a JSTOR transmission must contain the same copyright notice that appears on the screen or printedpage of such transmission.
JSTOR is a not-for-profit service that helps scholars, researchers, and students discover, use, and build upon a wide range ofcontent in a trusted digital archive. We use information technology and tools to increase productivity and facilitate new formsof scholarship. For more information about JSTOR, please contact [email protected].
Blackwell Publishing and Nordic Society Oikos are collaborating with JSTOR to digitize, preserve and extendaccess to Oikos.
Minireviews provides an opportunity to summarize existing knowledge of selected ecological areas, with special emphasis on current topics where rapid and significant advances are occurring. Reviews should be concise and not too wide-ranging. All key references should be cited. A summary is required.
Statistics and partitioning of species diversity, and similarity among multiple communities Russell Lande
Lande, R. 1996. Statistics and partitioning of species diversity, and similarity among multiple communities. - Oikos 76: 5-13.
Species richness, Shannon information, and Simpson diversity are the three most commonly used nonparametric measures of species diversity. The sampling bias and variance of these measures differ greatly. Species richness may be seriously underesti- mated for even very large samples from a speciose community. The bias in species richness and Shannon information depend on unknown parameters of the species abundance distribution. An unbiased estimator exists only for Simpson diversity. Each of these measures is concave, so that the total diversity in a pooled set of communities exceeds (or equals) the average diversity within communities. The total diversity in a set of communities can therefore be partitioned into positive, additive components within and among communities, corresponding to a- and P-diversity. Partitioning Simpson diversity corresponds to an analysis of variance. The propor- tion of the total diversity found within communities provides a natural measure of similarity among multiple communities. The expected similarity among multiple random samples from the same community depends on the number of samples and on the underlying measure of diversity.
R. Lande, Dept of Biology, Univ. of Oregon, Eugene, OR 97403-1210, USA.
Measures of species diversity play a central role in ecology and conservation biology (Whittaker 1960, 1972, Williams 1964, MacArthur 1965, Peet 1974, Pielou 1975, Grassle et al. 1979, Magurran 1988, Noss and Cooperrider 1994). The most commonly employed measures of species diversity are species richness (num- ber of species present in a community), and those based on species frequencies involving Shannon information, H, and Simpson concentration, k.
Whittaker (1960, 1972) defined the important con- cepts of species diversity within and among communi- ties (a- and P-diversity), and the total species diversity in a set of communities (y-diversity). Various measures
of species diversity among communities have been pro- posed, especially for patterns of species richness along environmental gradients (Whittaker 1960, 1972, MacArthur 1965, 1972, Pielou 1975, Allan 1975, Rout- ledge 1977, Wilson and Mohler 1983, Wilson and Shmida 1984, Magurran 1988).
A measure of species diversity should ideally be nonparametric and statistically accurate. It should be applicable to any community independent of species abundance distribution, and should have small bias and sampling variance in samples of moderate size. An important property for a diversity measure, first dis- cussed by Lewontin (1972) for genetic diversity, is strict
Accepted 25 September 1995 Copyright C OIKOS 1996 ISSN 0030-1299 Printed in Ireland - all rights reserved
OIKOS 76:1 (1996) 5
concavity. This means that the total diversity in a pooled set of communities equals or exceeds the aver- age diversity within communities, with equality only for identical communities. Lewontin partitioned the total diversity into a sum of the average diversity within communities and the diversity among communities. As we will see below, such an additive partition of diversity leads naturally to a measure of similarity among multi- ple communities.
Although considerable effort has been devoted to analyzing basic statistics of diversity measures, less attention has been given to theoretical or empirical partitioning of total species diversity within and among communities, and some of the most useful results are scattered through the genetic, statistical and ecological literature. Here I collect and extend results on the three most popular measures of species diversity, and criti- cally evaluate their relative merits with respect to the above properties. Finally I discuss the relative merits of these measures for assessing similarity among commu- nities and for extrapolating total species diversity in a region from samples within and among communities.
Nonparametric measures of species diversity The most popular measures of species diversity are nonparametric and do not depend on any particular species abundance distribution, such as the log series (Fisher et al. 1943), broken stick (MacArthur 1957), or lognormal (Preston 1948) models, from which real com- munities will deviate to some extent.
Species richness This is simply the number of species in a community (or sample) based on presence, rather than relative abun- dance.
Shannon information Let pi be the frequency of species i in a community. The average information per individual is
S
H=- p\ lnp, (1) i = 1
Shannon and Weaver (1962). For a given number of species, S, the information reaches its maximum value, In S, when all species are equally frequent in the com- munity. Many authors use the exponential of Shannon information, e", which for a given number of species has a maximum equal to S.
Simpson concentration The probability that two randomly chosen individuals from a given community are the same species, called the "concentration" by Simpson (1949), is
S
i = 1 (2)
1- is the probability that two randomly chosen
individuals from a given community are different spe- cies, also called the Gini coefficient, which can be used as a measure of diversity (Pielou 1969). The inverse of Simpson concentration, 1/ ?, is often employed to mea- sure species diversity, and for a given number of spe- cies, S, in a community it has a maximum value equal to S when all species are equally frequent.
Statistics of species diversity If two or more samples are known to be different, either a priori because they come from different communities or after rejection of the null hypothesis of homogeneity among samples, it may then be appropriate to test the hypothesis that one community is more diverse than another, using some measure of species diversity. Hutch- eson (1970) described a t-test for the significance of differences in the Shannon information measure of diversity in large samples. More generally, a resampling scheme such as the jackknife or bootstrap is suitable (Efron 1982, Magurran 1988). To assess the accuracy of commonly used nonparametric measures of species di- versity, I here collect and derive approximate formulas for their sampling bias and variance.
Species richness Let S be the actual number of species in a community composed of a very large (effectively infinite) number of individuals. The frequency of the ith species is Pi. Using a carat to denote a sample value, the number of species in a sample of size N is S, with mean
S
E[S]=S- - (1 -pi)N (3a)
(Grassle and Smith 1976). The rarefaction formula of Hurlbert (1971) gives the analog of (3a) for samples from a finite community. Species i is likely to be present in a sample of size N only if piN > 1. Hence in a highly diverse community the observed number of species, 9, may greatly underestimate the actual number of species, S, because rare species frequently will be absent from even very large samples. Several methods have been developed for estimating the actual number of species by extrapolation from samples of various sizes (reviewed in Colwell and Coddington 1994). All extrapolation methods for estimating the actual number of species in a community make implicit or explicit assumptions about the form of the abundance distribution of rare species, and hence may be in error to an unknown extent.
The sampling variance of species richness is exactly (corrected from Stromgren et al. 1973)
S
Var[S] = (1 -)N[1 -(1 p)N]
+ 2Z [(1 -p-pj)N -(1 -p)N(1l -p)N]. (3b) i>j
OIKOS 76:1 (1996) 6
The first (single) summation contains the variances of presence (1) versus absence (0) of each species. The second (double) summation contains the covari- ances of presence versus absence for pairs of species, which are negative and become negligible in compari- sion to the variances for sufficiently large sample sizes.
Shannon information In a random sample of N individuals from a commu- nity, the diversity calculated using the estimated spe- cies frequencies pj, is denoted as /. For large N this has approximate mean and variance
S- (4a) E[H]-H- 2N (4a)
S
Var[H] p (ln p )2- H2 /N (4b) _i= 1
(Pielou 1966, Hutcheson 1970, Bowman et al. 1971). Note that the bias in H depends on the actual num- ber of species, S, which is generally unknown. Hence an unbiased estimator of Shannon information does not exist. Accurate estimation of H requires sampling large numbers of individuals, with 2N much greater than the actual number of species in the com- munity.
Simpson diversity Pielou (1975) and Patil and Taillie (1982) draw an analogy between diversity which measures the variety of categorical (species) identities, and variance which measures the dispersion in quantitaive measurements. It does not appear to have been previously noticed that the Simpson measure of species diversity within a community, 1- X, can be expressed precisely as a variance. If individual k of species i is denoted as a point in S-dimensional space, with coordinates (xlk, ..., Xsk) where xik= 1 and all other coordinates are 0, then the total variance per individual in species identity within the community is
Z E[(xik--pi)2] p,(l -p,) i k i
= 1 - . (5a) Because this is a variance it follows directly that in a random sample of N individuals from a community, estimates of the Simpson diversity, 1- X, calculated using the estimated species frequencies Pj, have mean exactly
E[l-]=( 1- )(l1-X). (5b)
Thus an unbiased estimator of Simpson diversity is
1 - (N 1)-). (Sc) N (- I)
For large samples the approximate variance of Simpson diversity is
4 S Var[l - ] - Z p-2 .
which is the same as that for Simpson's (1949) unbiased estimator of concentration, S.
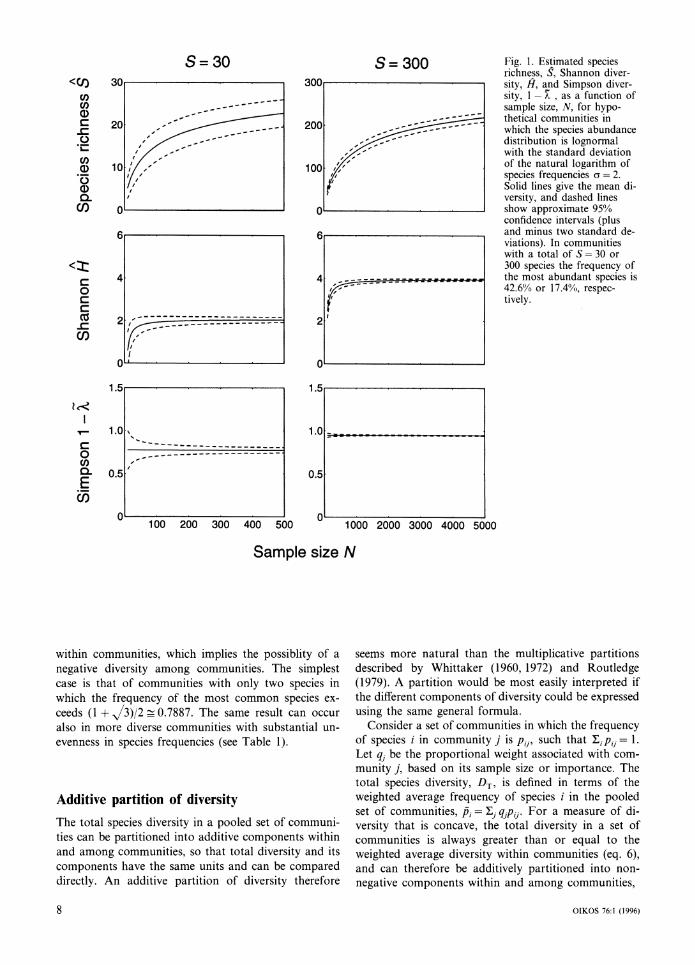
Fig. 1 compares the sampling properties of these three diversity measures for communities of low or high diversity. It can be seen that the estimated species richness can greatly underestimate the actual number of species even for very large samples in a highly diverse community. The standard deviation of species richness also is rather large. Shannon information has a sub- stantial bias for small samples, but the bias is small when 2N >>S. The standard deviation of Shannon di- versity is much smaller than that for species richness. Simpson diversity, 1 - k is not only unbiased, but also has the smallest standard deviation.
Concavity of species diversity measures A desirable property of a measure of species diversity is that the total diversity in a set of communities should be greater than or equal to the (weighted) average diversity within the communities (Lewontin 1972). Let DT be the total species diversity in a set of communities (or samples), computed using the weighted average species frequencies among communities. Denote the diversity within community j as Dj, and let the propor- tional "weight" of this community be qi such that E qj = 1. The weights associated with each com- munity may reflect the relative abundance of the com- munities, the sizes of samples from the communities, or equal weights. A diversity measure is strictly concave when
DT > E qDij with equality only for identical communities. (6)
Species richness obviously is strictly concave. A continuous measure of diversity based on species
frequencies is strictly concave if and only if its matrix of second derivatives is negative definite (Marcus and Minc 1964).
The Shannon information measure of species diver- sity, H, is strictly concave (Aczel and Daroczy 1975: 35).
The Simpson concentration, X, is strictly convex. Hence the diversity measure 1- k is strictly concave. However, the more commonly used inverse Simpson measure of diversity, 1/X, is in general not concave (Patil and Taillie 1982). Thus in some cases using the inverse Simpson measure, the total diversity in a set of communities may be less than the average diversity
(5d)
OIKOS 76:1 (1996) 7
S=30 S= 300
200
100 / I I _
, /
{ / ,
U
4
2 /
_ _ _ _------------
II, I I
1 - -. - - ZZXZNNNNN?
I-
Fig. 1. Estimated species richness, S, Shannon diver- sity, H, and Simpson diver- sity, 1- X , as a function of sample size, N, for hypo- thetical communities in which the species abundance distribution is lognormal with the standard deviation of the natural logarithm of species frequencies o = 2. Solid lines give the mean di- versity, and dashed lines show approximate 95% confidence intervals (plus and minus two standard de- viations). In communities with a total of S = 30 or 300 species the frequency of the most abundant species is 42.6% or 17.4%, respec- tively.
u
1.5
1.0 ..
0.5
0 100 200 300 400 500 1000 2000 3000 4000 5000
Sample size N
within communities, which implies the possiblity of a negative diversity among communities. The simplest case is that of communities with only two species in which the frequency of the most common species ex- ceeds (1 + /3)/2 _ 0.7887. The same result can occur also in more diverse communities with substantial un- evenness in species frequencies (see Table 1).
Additive partition of diversity The total species diversity in a pooled set of communi- ties can be partitioned into additive components within and among communities, so that total diversity and its components have the same units and can be compared directly. An additive partition of diversity therefore
seems more natural than the multiplicative partitions described by Whittaker (1960, 1972) and Routledge (1979). A partition would be most easily interpreted if the different components of diversity could be expressed using the same general formula.
Consider a set of communities in which the frequency of species i in community j is pij, such that lipi = 1. Let qj be the proportional weight associated with com- munity j, based on its sample size or importance. The total species diversity, DT, is defined in terms of the weighted average frequency of species i in the pooled set of communities, p = Ej qijpi' For a measure of di- versity that is concave, the total diversity in a set of communities is always greater than or equal to the weighted average diversity within communities (eq. 6), and can therefore be additively partitioned into non- negative components within and among communities,
OIKOS 76:1 (1996)
30
20
<Co I) a) ci)
0)
C.) cD
10
0
6
4
2
<z 0
C3 co 0)
1.5
1.0
0.5
1-- I
0
.n E 03)
L" It
n
I! I
ti
.dI
- -- -.-.....-..-..-..-..-..-..-..-
/
- - _
_ _ _ _
-- --- --- .-- ---
8
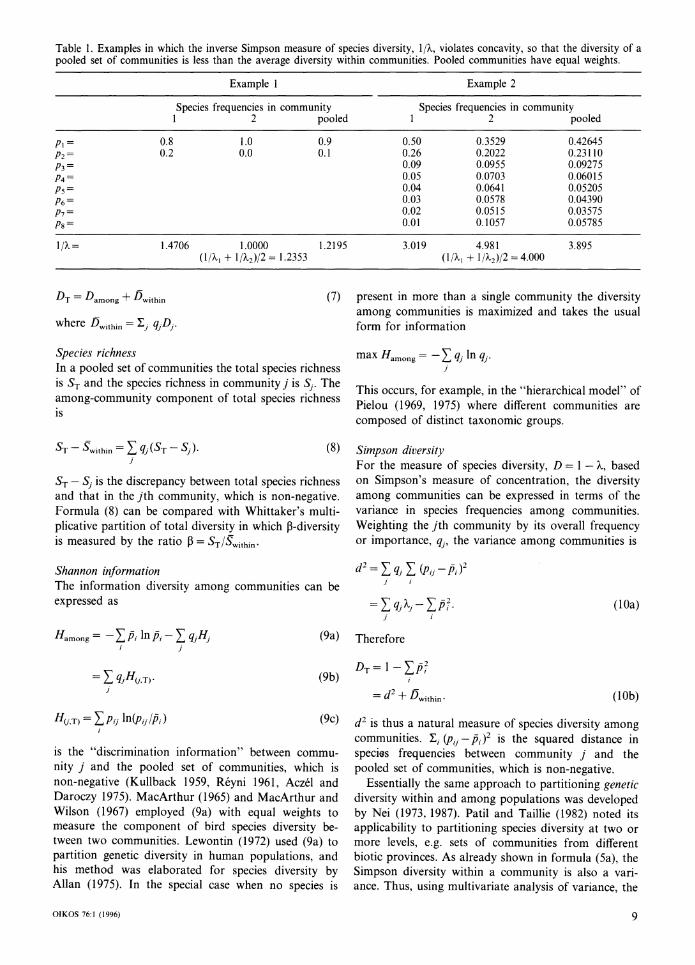
Table 1. Examples in which the inverse Simpson measure of species diversity, 1 /k, violates concavity, so that the diversity of a pooled set of communities is less than the average diversity within communities. Pooled communities have equal weights.
Example 1 Example 2
Species frequencies in community Species frequencies in community 1 2 pooled 1 2 pooled
(7) present in more than a single community the diversity among communities is maximized and takes the usual form for information
Species richness In a pooled set of communities the total species richness is ST and the species richness in community j is Sj. The among-community component of total species richness is
ST- Swithin-E qj(ST- Sj). (8)
ST- Sj is the discrepancy between total species richness and that in the jth community, which is non-negative. Formula (8) can be compared with Whittaker's multi- plicative partition of total diversity in which 3-diversity is measured by the ratio P = ST/Swithin.
Shannon information The information diversity among communities can be expressed as
Hamong = -E Pi ln i -E qHj i I
= E qjH(,T). (9b)
H(,T) = E Pi ln(pij /Pi) (9c)
is the "discrimination information" between commu- nity j and the pooled set of communities, which is non-negative (Kullback 1959, R6yni 1961, Aczel and Daroczy 1975). MacArthur (1965) and MacArthur and Wilson (1967) employed (9a) with equal weights to measure the component of bird species diversity be- tween two communities. Lewontin (1972) used (9a) to partition genetic diversity in human populations, and his method was elaborated for species diversity by Allan (1975). In the special case when no species is
max Hamong -E qj ln qj.
This occurs, for example, in the "hierarchical model" of Pielou (1969, 1975) where different communities are composed of distinct taxonomic groups.
Simpson diversity For the measure of species diversity, D = 1 - k, based on Simpson's measure of concentration, the diversity among communities can be expressed in terms of the variance in species frequencies among communities. Weighting the jth community by its overall frequency or importance, qj, the variance among communities is
d2= E qJ (pZ -_i)2 j i
= E qIX_ E/2. X i (9a) Therefore
DT= 1-ZEp
= d2 + Dwithin. (lOb)
d2 is thus a natural measure of species diversity among communities. -i (pi - i)2 is the squared distance in specios frequencies between community j and the pooled set of communities, which is non-negative.
Essentially the same approach to partitioning genetic diversity within and among populations was developed by Nei (1973, 1987). Patil and Taillie (1982) noted its applicability to partitioning species diversity at two or more levels, e.g. sets of communities from different biotic provinces. As already shown in formula (5a), the Simpson diversity within a community is also a vari- ance. Thus, using multivariate analysis of variance, the
(lOa)
OIKOS 76:1 (1996) 9
total species diversity in a set of communities can be partitioned into additive components of the same func- tional form. This approach facilitates statistical analysis of components of species diversity. Statistical tests on components of variance based on categorical variables can be performed using methods in (Searle et al. 1992) or (Efron 1982).
Similarity among multiple communities
Employing a partition of total species diversity into additive components within and among multiple com- munities, a natural measure of community similarity is
lD = Dwithin/DT
= 1-Damong/DT (11)
which ranges between 0 and 1. For species richness, this reveals that Whittaker's
measure of P-diversity, ST/Wwithin, is not actually a diversity, but rather the inverse of community similarity in species composition.
Based on the Simpson measure of genetic diversity (heterozygosity) Nei (1973, 1987) developed an analogous measure of genetic similarity among popula- tions (GsT) which has been widely used to describe the genetic structure of populations. To measure commu- nity similarity based on Simpson diversity we must use 1 - ~ to estimate diversity within samples in order that the similarity measure not exceed unity, which it could when using the unbiased estimator 1 - i for a finite number of samples (as for the Morisita index of simi- larity between two communities based on the unbiased Simpson concentration [Morisita 1959, Horn 1966, Wolda 1981]).
Standardized measures of community similarity, ranging from 0 to 1, generally are biased downward, so that the true similarity between communities, estimated from random samples, tends to be underestimated. This can be seen most clearly in the expected similarity among random samples from the same community.
Consider first the simplest situation in which a very large (effectively infinite) number of samples of the same size, N, are taken from the same (infinitely large) community. Then the total diversity of the pooled samples is the same as that in the community, DT, and the similarity among communities is
16 D= E[D]/DT (12)
in which E[J5] is the mean value of any one of the three diversity measures in formulas (3a), (4a) and (Sb).
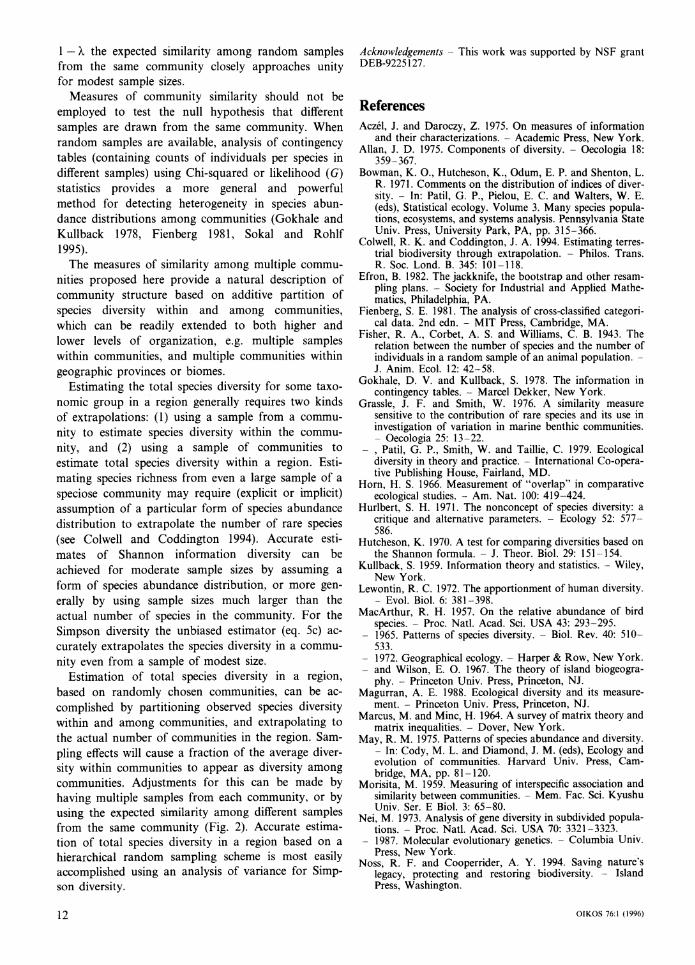
Fig. 2 plots these expected similarities among multiple samples from the same community. The amount of bias in the similarity measures parallels that for the corre- sponding diversity measures. The similarity in species richness among replicate samples has a large bias,
because different samples contain different sets of the rarest species. The bias in similarity of Shannon infor- mation among replicate samples depends on the ratio of total number of species in the community to 2N times the diversity in the community. The bias in similarity based on Simpson concentration depends only on the sample size and is small for moderately large samples.
We also can examine the ratio of the expected diver- sity within random samples of size N from the same community to the expected total diversity in n random samples of size N from the same community, E[D(N)]/ E[D(nN)]. For an infinite number of samples, n = z, this equals the similarity coefficient in formula (12). For a finite number of samples, n < oc, this ratio indicates the approximate behavior of the general formula (11) applied to the similarity among multiple samples from the same community (see Fig. 2).
Discussion Species richness is the most widely used measure of diversity, because of its simplicity in data acquisition and analysis. However, it has a well-known statistical weakness of a potentially large sampling bias, in that rare species often will be absent even in large samples or exhaustive surveys.
The Shannon information measure of species diver- sity, though popular, has a rather tenuous foundation in ecological theory, as noted by Pielou (1966, 1969), Hurlbert (1971), and May (1975). In samples from speciose communities, the Shannon diversity may have a substantial bias (Hutcheson 1970, Bowman et al. 1971). For both species richness and Shannon informa- tion measures of diversity, the bias depends on the actual number of species in a community, which gener- ally is unknown, so that an unbiased estimator of species richness or Shannon information does not exist.
May (1975) preferred diversity measures based on the Simpson index to those based on information, because of the apparent relationship of Simpson's index to variances. However, the commonly used inverse Simp- son diversity 1/X is not concave. When partitioning human genetic diversity, Lewontin (1972) noted that a diversity measure should have the property that the total diversity in a pooled set of communities is greater than or equal to the average diversity within communi- ties. Violation of this property of concavity can pro- duce the uninterpretable result of a negative diversity among communities.
In contrast with the inverse Simpson diversity, the Simpson diversity measure 1 - X, which is the probabil- ity that two randomly chosen individuals are different species, has a number of advantages. 1 - k is precisely the variance of species identity within a community, for which an unbiased estimator exists. Using this measure the total diversity in a set of communities can be
OIKOS 76:1 (1996) 10
Fig. 2. Expected similarity among n samples of N indi- viduals from the same com- munity, based on partition of three measures of the to- tal species diversity in the samples. The number and abundance distribution of species in the community are as in Fig. 1. Solid lines give the exact proportion of the total species diversity in the community expected within samples. Dashed lines are approximations, based on the ratio of the expected diversity within samples to the expected total diversity in n = 2 or 10 samples.
100 200 300 400 500
1-~ n = oo
0 1000 2000 3000 4000 5000
Sample size N
partitioned into the average diversity within the com- munities plus the diversity among communities, with the latter equal to the variance in species frequencies among communities. This measure of species diversity thus facilitates statistical partitioning of species diver- sity within and among communities using analysis of variance.
Partition of total species diversity in a set of commu- nities into additive components within and among com- munities provides a unifying framework with which to measure diversity at different levels of organization using the same general formula, so that a-, P-, and y-diversity are measured in the same way. Additive partition of diversity also suggests a natural measure of similarity among multiple communities, the proportion of the total diversity found within communities.
Coefficients of community similarity inherit the statistical sampling properties of the diversity measures
on which they are based. The similarity among a set of communities can be expected to decrease with increas- ing number of communities in the set because the total diversity increases as more distinct communities are included. Sampling effects also contribute to decreasing the expected similarity among communities, because random samples deviate to some extent from the actual communities.
The expected similarity among random samples from the same community decreases with increasing number of samples because more samples contain a greater total diversity, more closely approximating that in the actual community. For species richness, the expected similarity among random samples from the same com- munity can be substantially less than unity, even with very large sample sizes. For Shannon information this downward bias in community similarity becomes small in samples of moderate size. For Simpson diversity
OIKOS 76:1 (1996)
S=30 S = 300
A S
0.8 , - ?oo
WA H
0.6
0.4
0.2
0.8
0.6 1 -x
0.4
0.2
u
II
n = oo
v
11
1- X the expected similarity among random samples from the same community closely approaches unity for modest sample sizes.
Measures of community similarity should not be employed to test the null hypothesis that different samples are drawn from the same community. When random samples are available, analysis of contingency tables (containing counts of individuals per species in different samples) using Chi-squared or likelihood (G) statistics provides a more general and powerful method for detecting heterogeneity in species abun- dance distributions among communities (Gokhale and Kullback 1978, Fienberg 1981, Sokal and Rohlf 1995).
The measures of similarity among multiple commu- nities proposed here provide a natural description of community structure based on additive partition of species diversity within and among communities, which can be readily extended to both higher and lower levels of organization, e.g. multiple samples within communities, and multiple communities within geographic provinces or biomes.
Estimating the total species diversity for some taxo- nomic group in a region generally requires two kinds of extrapolations: (1) using a sample from a commu- nity to estimate species diversity within the commu- nity, and (2) using a sample of communities to estimate total species diversity within a region. Esti- mating species richness from even a large sample of a speciose community may require (explicit or implicit) assumption of a particular form of species abundance distribution to extrapolate the number of rare species (see Colwell and Coddington 1994). Accurate esti- mates of Shannon information diversity can be achieved for moderate sample sizes by assuming a form of species abundance distribution, or more gen- erally by using sample sizes much larger than the actual number of species in the community. For the Simpson diversity the unbiased estimator (eq. 5c) ac- curately extrapolates the species diversity in a commu- nity even from a sample of modest size.
Estimation of total species diversity in a region, based on randomly chosen communities, can be ac- complished by partitioning observed species diversity within and among communities, and extrapolating to the actual number of communities in the region. Sam- pling effects will cause a fraction of the average diver- sity within communities to appear as diversity among communities. Adjustments for this can be made by having multiple samples from each community, or by using the expected similarity among different samples from the same community (Fig. 2). Accurate estima- tion of total species diversity in a region based on a hierarchical random sampling scheme is most easily accomplished using an analysis of variance for Simp- son diversity.
Acknowledgements - This work was supported by NSF grant DEB-9225127.
References Aczel, J. and Daroczy, Z. 1975. On measures of information
and their characterizations. - Academic Press, New York. Allan, J. D. 1975. Components of diversity. - Oecologia 18:
359-367. Bowman, K. O., Hutcheson, K., Odum, E. P. and Shenton, L.
R. 1971. Comments on the distribution of indices of diver- sity. - In: Patil, G. P., Pielou, E. C. and Walters, W. E. (eds), Statistical ecology. Volume 3. Many species popula- tions, ecosystems, and systems analysis. Pennsylvania State Univ. Press, University Park, PA, pp. 315-366.
Colwell, R. K. and Coddington, J. A. 1994. Estimating terres- trial biodiversity through extrapolation. - Philos. Trans. R. Soc. Lond. B. 345: 101-118.
Efron, B. 1982. The jackknife, the bootstrap and other resam- pling plans. - Society for Industrial and Applied Mathe- matics, Philadelphia, PA.
Fienberg, S. E. 1981. The analysis of cross-classified categori- cal data. 2nd edn. - MIT Press, Cambridge, MA.
Fisher, R. A., Corbet, A. S. and Williams, C. B. 1943. The relation between the number of species and the number of individuals in a random sample of an animal population. - J. Anim. Ecol. 12: 42-58.
Gokhale, D. V. and Kullback, S. 1978. The information in contingency tables. - Marcel Dekker, New York.
Grassle, J. F. and Smith, W. 1976. A similarity measure sensitive to the contribution of rare species and its use in investigation of variation in marine benthic communities. - Oecologia 25: 13-22.
- , Patil, G. P., Smith, W. and Taillie, C. 1979. Ecological diversity in theory and practice. - International Co-opera- tive Publishing House, Fairland, MD.
Horn, H. S. 1966. Measurement of "overlap" in comparative ecological studies. - Am. Nat. 100: 419-424.
Hurlbert, S. H. 1971. The nonconcept of species diversity: a critique and alternative parameters. - Ecology 52: 577- 586.
Hutcheson, K. 1970. A test for comparing diversities based on the Shannon formula. - J. Theor. Biol. 29: 151-154.
Kullback, S. 1959. Information theory and statistics. - Wiley, New York.
Lewontin, R. C. 1972. The apportionment of human diversity. - Evol. Biol. 6: 381-398.
MacArthur, R. H. 1957. On the relative abundance of bird species. - Proc. Natl. Acad. Sci. USA 43: 293-295.
- 1965. Patterns of species diversity. - Biol. Rev. 40: 510- 533.
- 1972. Geographical ecology. - Harper & Row, New York. - and Wilson, E. 0. 1967. The theory of island biogeogra-
phy. - Princeton Univ. Press, Princeton, NJ. Magurran, A. E. 1988. Ecological diversity and its measure-
ment. - Princeton Univ. Press, Princeton, NJ. Marcus, M. and Minc, H. 1964. A survey of matrix theory and
matrix inequalities. - Dover, New York. May, R. M. 1975. Patterns of species abundance and diversity.
- In: Cody, M. L. and Diamond, J. M. (eds), Ecology and evolution of communities. Harvard Univ. Press, Cam- bridge, MA, pp. 81-120.
Morisita, M. 1959. Measuring of interspecific association and similarity between communities. - Mem. Fac. Sci. Kyushu Univ. Ser. E Biol. 3: 65-80.
Nei, M. 1973. Analysis of gene diversity in subdivided popula- tions. - Proc. Natl. Acad. Sci. USA 70: 3321-3323.
- 1987. Molecular evolutionary genetics. - Columbia Univ. Press, New York.
Noss, R. F. and Cooperrider, A. Y. 1994. Saving nature's legacy, protecting and restoring biodiversity. - Island Press, Washington.
OIKOS 76:1 (1996) 12
Patil, G. P. and Taillie, C. 1982. Diversity as a concept and its measurement. - J. Am. Stat. Assoc. 77: 548-561.
Peet, R. K. 1974. The measurement of species diversity. - Annu. Rev. Ecol. Syst. 5: 285-307.
Pielou, E. C. 1966. Shannon's formula as a measure of specific diversity: its use and misuse. - Am. Nat. 100: 463-465.
- 1969. An introduction to mathematical ecology. - Wiley, New York.
- 1975. Ecological diversity. - Wiley, New York. Preston, F. W. 1948. The commonness and rarity of species. -
Ecology 29: 254-283. Reyni, A. 1961. On measures of entropy and information. -
In: Neyman, J. (ed.), Proceedings of the 4th Berkeley Symposium on Mathematical Statistics and Probability, Vol. 1. Univ. of California Press, Berkeley, CA, pp. 547- 561.
Routledge, R. D. 1977. On Whittaker's components of diver- sity. - Ecology 58: 1120-1127.
- 1979. Diversity indices: which ones are admissable. - J. Theor. Biol. 76: 503-515.
Searle, S. R., Casella, G. and McCulloch, C. E. 1992. Variance components. - Wiley, New York.
Shannon, C. E. and Weaver, W. 1962. The mathematical
theory of communication. - Univ. of Illinois Press, Ur- bana, IL.
Simpson, E. H. 1949. Measurement of diversity. - Nature 163: 688.
Sokal, R. R. and F. J. Rohlf. 1995. Biometry. The principles and practice of statistics in biological research, 3rd ed. - Freeman, San Fransisco.
Str6mgren, T., Lande, R. and Engen, S. 1973. Intertidal distribution of the fauna on muddy beaches in the Borgen- fjord area. - Sarsia 53: 49-70.
Whittaker, R. H. 1960. Vegetation of the Siskiyou Mountains, Oregon and California. - Ecol. Monogr. 30: 279-338.
- 1972. Evolution and measurement of species diversity. - Taxon 21: 213-251.
Williams, C. B. 1964. Patterns in the balance of nature and related problems in quantitative ecology. - Academic Press, London.
Wilson, M. V. and Mohler, C. L. 1983. Measuring composi- tional change along gradients. - Vegetatio 54: 129-141.
- and Shmida, A. 1984. Measuring beta diversity with pres- ence-absence data. - J. Ecol. 72: 1055-1064.
Wolda, H. 1981. Similarity indices, sample size and diversity. - Oecologia 50: 296-302.