Page 1
CRICKET MEAL AS AN ALTERNATIVE TO FISHMEAL IN
DIETS FOR AFRICAN CATFISH (Clarias gariepinus)
NORHIDAYAH MOHD TAUFEK
THESIS SUBMITTED IN FULFILMENT OF THE REQUIREMENTS
FOR THE DEGREE OF DOCTOR OF PHILOSOPHY
FACULTY OF SCIENCE
UNIVERSITY OF MALAYA
KUALA LUMPUR
2016
Page 2
ii
UNIVERSITY OF MALAYA
ORIGINAL LITERARY WORK DECLARATION
Name of Candidate: Norhidayah Bt Mohd Taufek (I.C/Passport No:
850525715000)
Matric No: SHC120012
Name of Degree: Doctorate
Title of Project Paper/Research Report/Dissertation/Thesis (“this Work”):
CRICKET MEAL AS AN ALTERNATIVE TO FISHMEAL IN DIETS FOR
AFRICAN CATFISH (Clarias gariepinus)
Field of Study: Biotechnology
I do solemnly and sincerely declare that:
(1) I am the sole author/writer of this Work;
(2) This Work is original;
(3) Any use of any work in which copyright exists was done by way of fair
dealing and for permitted purposes and any excerpt or extract from, or
reference to or reproduction of any copyright work has been disclosed
expressly and sufficiently and the title of the Work and its authorship have
been acknowledged in this Work;
(4) I do not have any actual knowledge nor do I ought reasonably to know that
the making of this work constitutes an infringement of any copyright work;
(5) I hereby assign all and every rights in the copyright to this Work to the
University of Malaya (“UM”), who henceforth shall be owner of the
copyright in this Work and that any reproduction or use in any form or by any
means whatsoever is prohibited without the written consent of UM having
been first had and obtained;
(6) I am fully aware that if in the course of making this Work I have infringed
any copyright whether intentionally or otherwise, I may be subject to legal
action or any other action as may be determined by UM.
Candidate’s Signature Date:
Subscribed and solemnly declared before,
Witness’s Signature Date:
Name:
Designation:
Page 3
iii
ABSTRACT
In Malaysia, extensive farming of African catfish over the past decades has
increased the utilization of fishmeal as the preferred aquafeeds owing to its highly
nutritional properties. However, various pressures have been put on the fish farming
industry to switch to more sustainable diet in order to reduce the dependency on
fishmeal as the sole fish feed. Therefore, the aim of this thesis was to evaluate the
potential of cricket in diets for African catfish in terms of growth performance, nutrient
and amino acids digestibility, immunostimulant properties and susceptibility to
oxidative stress. Four feeding trials were conducted to determine the use of cricket meal
in African catfish diet. Cricket meal was capable of serving as an alternative protein
replacement for fishmeal in the diet of farmed African catfish up to 100% without
negatively affecting body composition and feed utilisation. Besides, fish fed cricket
meal exhibited significantly higher nutrient and amino acids digestibility than fishmeal-
fed fish. Mortalities at 12 days post-challenge with Aeromonas hydrophila was
significantly decreased at dietary of 35% and 40% crude protein (CP) compared to
control (fishmeal diet). From the pathogenic test, Aeromonas hydrophila isolation
shows the highest count in the intestine of the control group while the lowest in the liver
of the fish fed with 35% CP diet suggesting that dietary cricket meal enhanced the
innate immune system and survivability of African catfish. Antioxidant activity of
catalase was higher in 100% cricket meal substitution with 35% CP compared with fish
fed other diets while glutathione S-transferase (GST) and superoxide dismutase (SOD)
showed an increasing trend with higher incorporation of cricket meal although no
significant difference was observed between all diets. These results signify that cricket
meal could be a potential alternative for fishmeal as a protein source in African catfish
diet without having any adverse health effect while at the same time improving growth
and feed efficiency.
Page 4
iv
ABSTRAK
Di Malaysia, penternakan ikan keli Afrika yang telah bermula sejak beberapa
dekad yang lalu telah meningkatkan penggunaan tepung ikan sebagai makanan ikan
keutamaan selaras dengan kandungan nutrisinya yang tinggi. Walaubagaimanapun,
pelbagai tekanan telah dikenakan terhadap industri penternakan bagi menukar kepada
sumber yang lebih lestari untuk mengurangkan kebergantungan terhadap tepung ikan
sebagai makanan keutamaan dalam makanan ikan. Justeru, tesis ini bertujuan untuk
menentukan keberkesanan tepung cengkerik bagi makanan ikan keli Afrika dari segi
kadar tumbesaran, penghadaman nutrisi dan amino asid, stimulasi imun serta kesan
terhadap oksidasi stres. Empat eksperimen telah dijalankan bagi menentukan
keberkesanan tepung cengkerik sebagai makanan ikan keli. Tepung cengkerik mampu
dijadikan alternatif dan menggantikan sehingga 100% tepung ikan tanpa memberi kesan
terhadap komposisi badan dan penggunaan makanan. Selain itu, ikan yang diberi makan
tepung cengkerik menunjukkan penghadaman nutrisi dan amino asid yang lebih tinggi
berbanding ikan yang diberi makan tepung ikan (diet kawalan). Kemortalan pada hari
ke 12 selepas disuntik bakteria Aeromonas hydrophila menunjukkan penurunan yang
signifikan bagi ikan yang diberi diet 35% protein dan 40% protein berbanding tepung
ikan. Berdasarkan analisis patogenasi, bakteria Aeromonas hydrophila menunjukkan
jumlah yang lebih tinggi pada usus ikan yang diberi makan diet kawalan manakala
jumlah yang paling rendah di bahagian hati ikan yang diberi diet 35% protein. Ini
menunjukkan tepung cengkerik dapat meningkatkan sistem imuniti dasar dan
kelangsungan hidup ikan keli. Aktiviti antioksidan catalase lebih tinggi bagi ikan yang
diberi makan 100% tepung cengkerik dengan 35% protein berbanding ikan yang diberi
diet lain. Tambahan pula, Glutathione S-tranferase (GST) dan superoxide dismutase
(SOD) menunjukkan trend yang meningkat bagi diet yang mempunyai peratusan tepung
Page 5
v
cengkerik yang tinggi walaupun tiada perbezaan yang signifikan antara semua diet.
Keputusan ini menunjukkan tepung cengkerik mampu menjadi alternatif kepada tepung
ikan sebagai sumber protein untuk makanan ikan keli Afrika tanpa menjejaskan
kesihatannya dan dalam masa yang sama meningkatkan kadar pembesaran serta
keberkesanan penggunaan makanannya
Page 6
vi
ACKNOWLEDGEMENTS
First of all, I would like to express my special gratitude to my supervisor Dr.
Shaharudin Abdul Razak for providing me the opportunity to enter the world of fish
nutrition and always open the door for a discussion. Thanks to Dr. Zazali Alias, my co-
supervisor for the assistance in biochemistry part of the project. I’m also thankful to my
colleagues in Aqua-nutri laboratory, namely Hasniyati Muin, Firdaus Aspani, Raji
Ameenat Abiodun and Noor hidayati Abu Bakar for their help, advice and support
throughout this work. I would also like to thank Mr. Hanan Md Yusof and his staff in
Fisheries Research Institute, Glami lami, Jelebu for helping with the “pellet-making”
process. Thanks are also due to Dr. Khanom Simarani and her students at Microbiology
department laboratory for technical assistance.
The work of this thesis is part of a larger project funded by IPPP and UMRG
grant, University of Malaya (PG108-2013A) and (RP015G-14AFR) to whom I am
indebted. I am also grateful to MyBrain by Ministry of Education for generously
awarding the scholarship to support my PhD studies.
Finally, I would like to thank my husband Fahmi, for his never-ending support
and encouragement during my studies. Last, but not least, to my parents for their
valuable advice, patience and trust in me.
Page 7
vii
TABLE OF CONTENT
ORIGINAL LITERARY WORK DECLARATION ....... ERROR! BOOKMARK NOT
DEFINED.
ABSTRACT ..................................................................................................................... II
ABSTRAK ...................................................................................................................... IV
ACKNOWLEDGEMENTS ............................................................................................ VI
TABLE OF CONTENT ................................................................................................ VII
LIST OF FIGURE ......................................................................................................... XII
LIST OF TABLE ......................................................................................................... XIII
LIST OF ABBREVIATIONS ....................................................................................... XV
CHAPTER 1: INTRODUCTION ..................................................................................... 1
CHAPTER 2: LITERATURE REVIEW .......................................................................... 4
2.1 Status of world aquaculture ......................................................................................... 4
2.1.1 Global aquaculture .......................................................................................... 4
2.1.2 Aquaculture in Malaysia ................................................................................. 6
2.2 Biology of African catfish ........................................................................................... 9
2.3 Catfish production in Malaysia ................................................................................... 9
2.3.1 Feed and feeding practices in African catfish............................................... 10
2.4 Nutrition requirement for catfish .............................................................................. 11
2.4.1 Protein requirement ...................................................................................... 11
2.4.2 Essential amino acid requirement ................................................................. 13
2.4.3 Lipid requirement ......................................................................................... 15
2.4.4 Carbohydrate and fiber requirement ............................................................. 15
2.4.5 Energy requirement ...................................................................................... 16
2.4.6 Vitamin, minerals and trace elements ........................................................... 17
2.5 Use of fishmeal in aquaculture industry.................................................................... 18
2.6 Nutritive potential of insects for aquaculture diets ................................................... 20
2.7 Potential of cricket meal in animal diet..................................................................... 25
2.8 Digestibility of feed by fish....................................................................................... 26
2.8.1 Methods used for evaluating digestion in fish .............................................. 27
Page 8
viii
2.8.1.1 Direct method .............................................................................. 27
2.8.1.2 Indirect method ........................................................................... 27
2.8.2 Protein and amino acid digestibility ............................................................. 28
2.8.3 Lipid digestibility ......................................................................................... 29
2.8.4 Carbohydrate digestibility ............................................................................ 29
2.9 Nutritional strategies in maintaining health .............................................................. 30
2.9.1 Health control of African catfish .................................................................. 32
2.9.1 Immunostimulant in fish diet ........................................................................ 32
2.9.2 Pathogenicity of Aeromonas hydrophila fed immunostimulant diet in fish. 34
2.10 Oxidative stress biomarkers and antioxidant activity in fish .................................. 35
2.10.1 Catalase ....................................................................................................... 36
2.10.2 Superoxide dismutase ................................................................................. 36
2.10.3 Glutathione S- transferase .......................................................................... 37
2.10.4 Studies on oxidative stress in catfish .......................................................... 38
CHAPTER 3: GROWTH PERFORMANCES AND AMINO ACID ANALYSIS OF
AFRICAN CATFISH FED VARYING LEVELS OF CRICKET MEAL DIETS. ........ 39
3.1 Introduction ............................................................................................................... 39
3.2 Literature review ....................................................................................................... 40
3.3 Material and method ................................................................................................. 41
3.3.1 Experimental diet .......................................................................................... 41
3.3.2 Experimental Fish and set-up ....................................................................... 42
3.3.3 Proximate and chemical analysis of diets and body composition ................ 43
3.3.3.1 Crude protein............................................................................... 43
3.3.3.2 Crude lipid................................................................................... 44
3.3.3.3 Dry matter ................................................................................... 45
3.3.3.4 Ash .............................................................................................. 45
3.3.3.5 Crude fiber .................................................................................. 46
3.3.3.6 Gross energy ............................................................................... 47
3.3.3.7 Nitrogen free extract ................................................................... 47
3.3.4 Amino acid analysis ...................................................................................... 47
3.3.4.1 Sample preparation ..................................................................... 47
3.3.4.2 Drying and derivatization procedure ........................................... 48
3.3.4.3 Chromatographic procedures ...................................................... 48
Page 9
ix
3.3.5 Tryptophan determination ............................................................................ 49
3.3.6 Analysis of experimental data ...................................................................... 50
3.3.7 Statistical analysis ......................................................................................... 50
3.4 Results ....................................................................................................................... 51
3.5 Discussion ................................................................................................................. 64
3.6 Conclusion ................................................................................................................ 67
CHAPTER 4: NUTRIENT AND AMINO ACID DIGESTIBILITY OF CRICKET
MEAL AND FISHMEAL IN AFRICAN CATFISH, Clarias gariepinus DIET ........... 68
4.1 Introduction ............................................................................................................... 68
4.2 Literature review .................................................................................................... 69
4.3 Materials and method ................................................................................................ 70
4.3.1 Experimental Diet ......................................................................................... 70
4.3.2 Experimental Fish and Set-Up ...................................................................... 70
4.3.3 Proximate and Chemical Analysis ................................................................ 71
4.3.4 Chitin determination ..................................................................................... 72
4.3.5 Chromic oxide determination ....................................................................... 73
4.3.6 Amino acid digestibility ............................................................................... 73
4.3.7 Analysis of Experimental Data ..................................................................... 74
4.3.7.1 Growth performance analysis ..................................................... 74
4.3.7.2 Apparent digestibility coefficient................................................ 74
4.3.8 Statistical Analysis........................................................................................ 74
4.4 Results ....................................................................................................................... 76
4.5 Discussion ................................................................................................................. 81
4.6 Conclusion ................................................................................................................ 84
CHAPTER 5: THE EFFECT OF DIETARY CRICKET MEAL ON THE GROWTH
PERFORMANCE AND RESISTANCE AGAINST PATHOGENICITY OF Aeromonas
hydrophila IN AFRICAN CATFISH, Clarias gariepinus. ............................................. 86
5.1 Introduction ............................................................................................................... 86
5.2 Literature Review ...................................................................................................... 87
5.3 Materials and Method ............................................................................................... 88
5.3.1 Experimental diet .......................................................................................... 88
5.3.2 Experimental Fish and set-up ....................................................................... 88
5.3.3 Proximate and chemical analysis .................................................................. 89
Page 10
x
5.3.4 Haematological and biochemical parameters analysis ................................. 90
5.3.5 Plasma total protein determination ............................................................... 90
5.3.6 Albumin and globulin determination ............................................................ 91
5.3.7 Lysozyme assay ............................................................................................ 91
5.3.8 Bacterial pathogen and experimental challenge ........................................... 92
5.3.9 Confirmation of pathogenicity ...................................................................... 92
5.3.10 Analysis of experimental data .................................................................... 93
5.3.11 Statistical analysis ....................................................................................... 93
5.4 Results ....................................................................................................................... 96
5.5 Discussion ............................................................................................................... 101
5.6 Conclusion .............................................................................................................. 106
CHAPTER 6: THE EFFECT OF DIETARY CRICKET MEAL (Gryllus bimaculatus)
ON GROWTH PERFORMANCE, ANTIOXIDANT ENZYME ACTIVITIES AND
HAEMATOLOGICAL RESPONSE OF AFRICAN CATFISH (Clarias gariepinus).
....................................................................................................................................... 107
6.1 Introduction ............................................................................................................. 107
6.2 Literature Review .................................................................................................... 108
6.3 Material and method ............................................................................................... 109
6.3.1 Experimental diet ........................................................................................ 109
6.3.2 Experimental Fish and set-up ..................................................................... 110
6.3.3 Proximate and chemical analysis ................................................................ 110
6.3.4 Amino acid analysis ............................................................................................. 111
6.3.5 Sample preparation ..................................................................................... 111
6.3.6 Haematological parameters analysis........................................................... 112
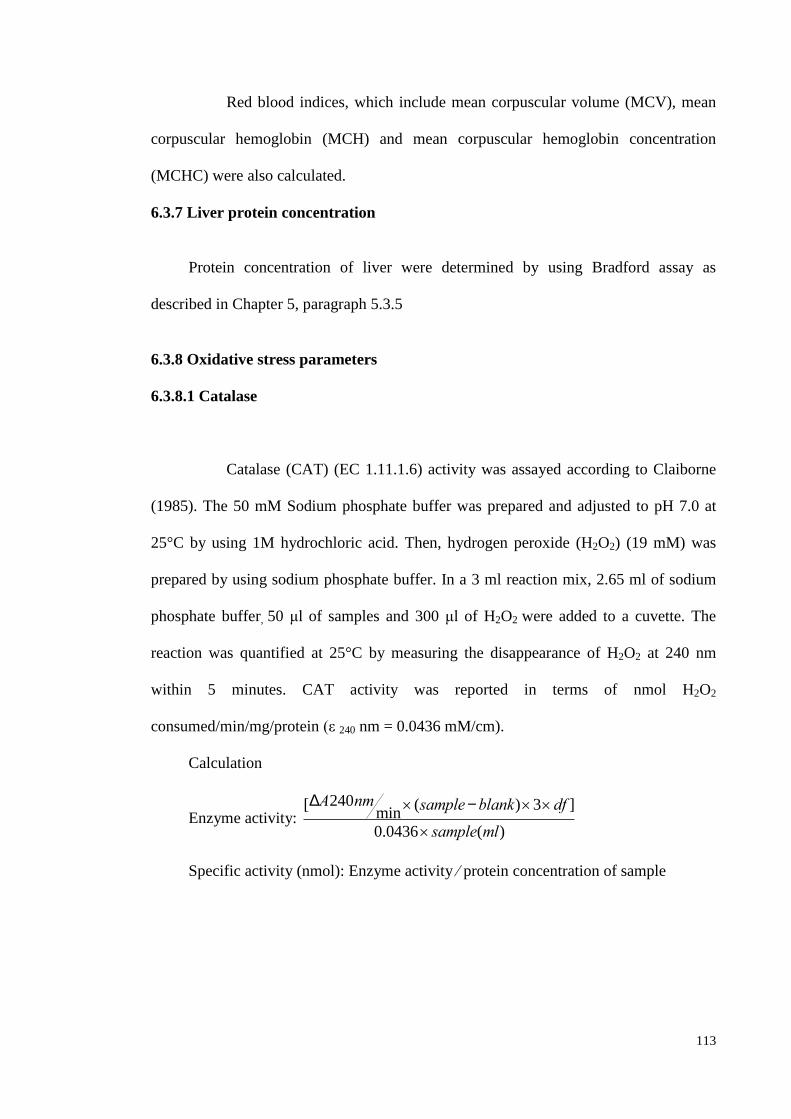
6.3.7 Liver protein concentration......................................................................... 113
6.3.8 Oxidative stress parameters ........................................................................ 113
6.3.8.1 Catalase ..................................................................................... 113
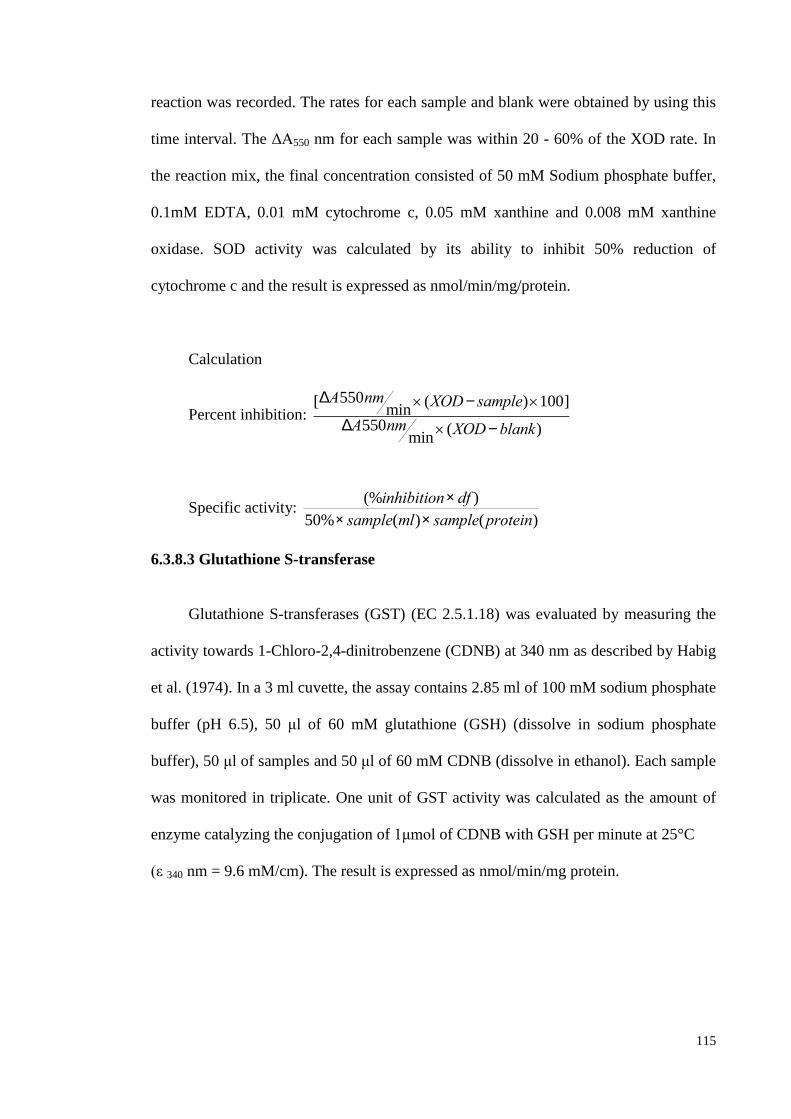
6.3.8.2 Superoxide dismutase ............................................................... 114
6.3.8.3 Glutathione S-transferase .......................................................... 115
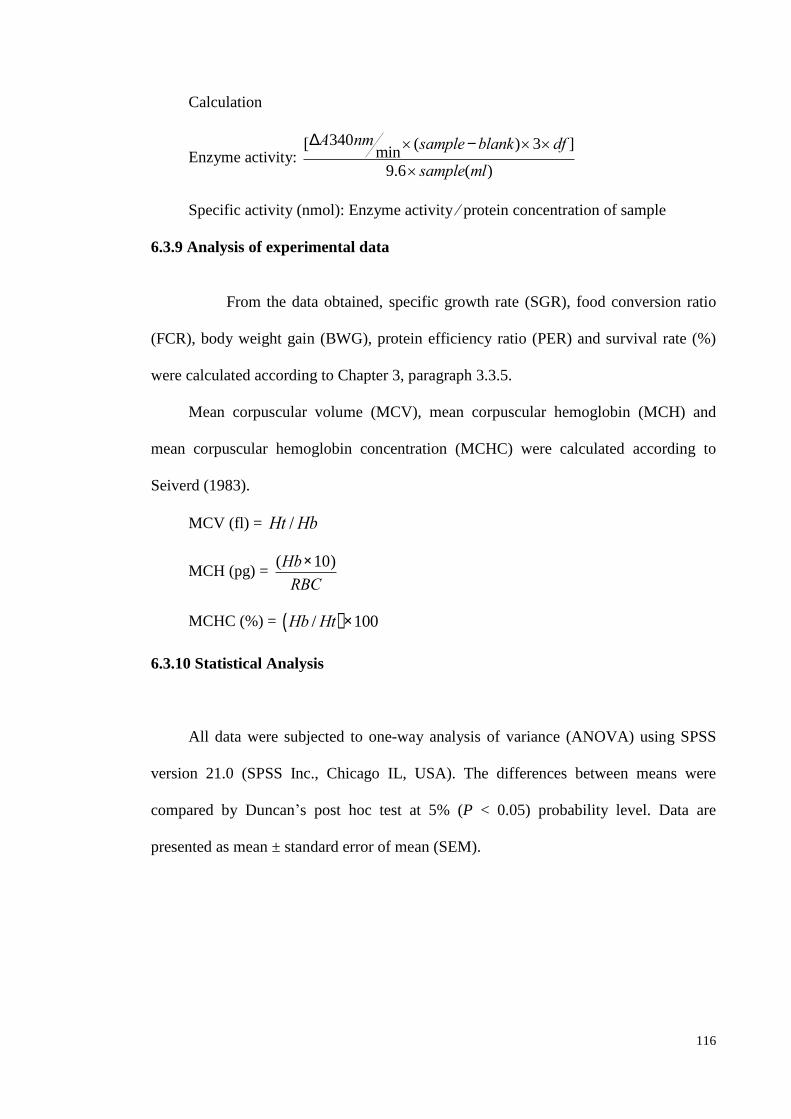
6.3.9 Analysis of experimental data .................................................................... 116
6.3.10 Statistical Analysis ................................................................................... 116
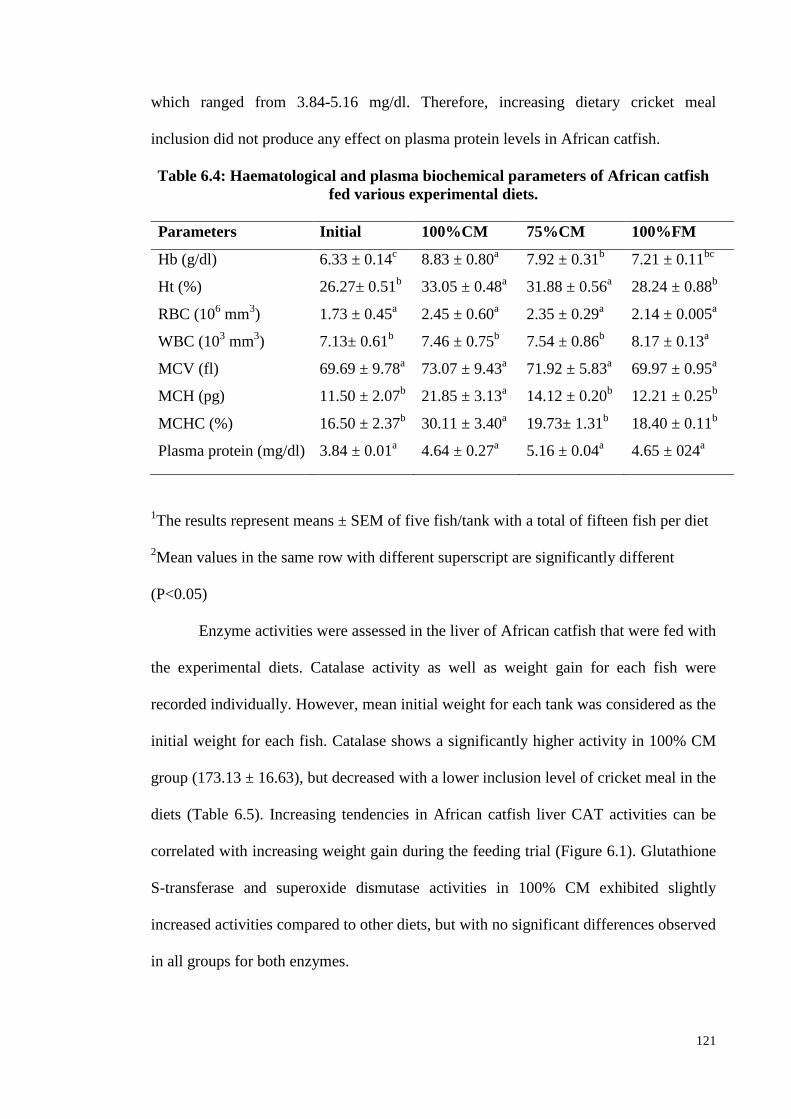
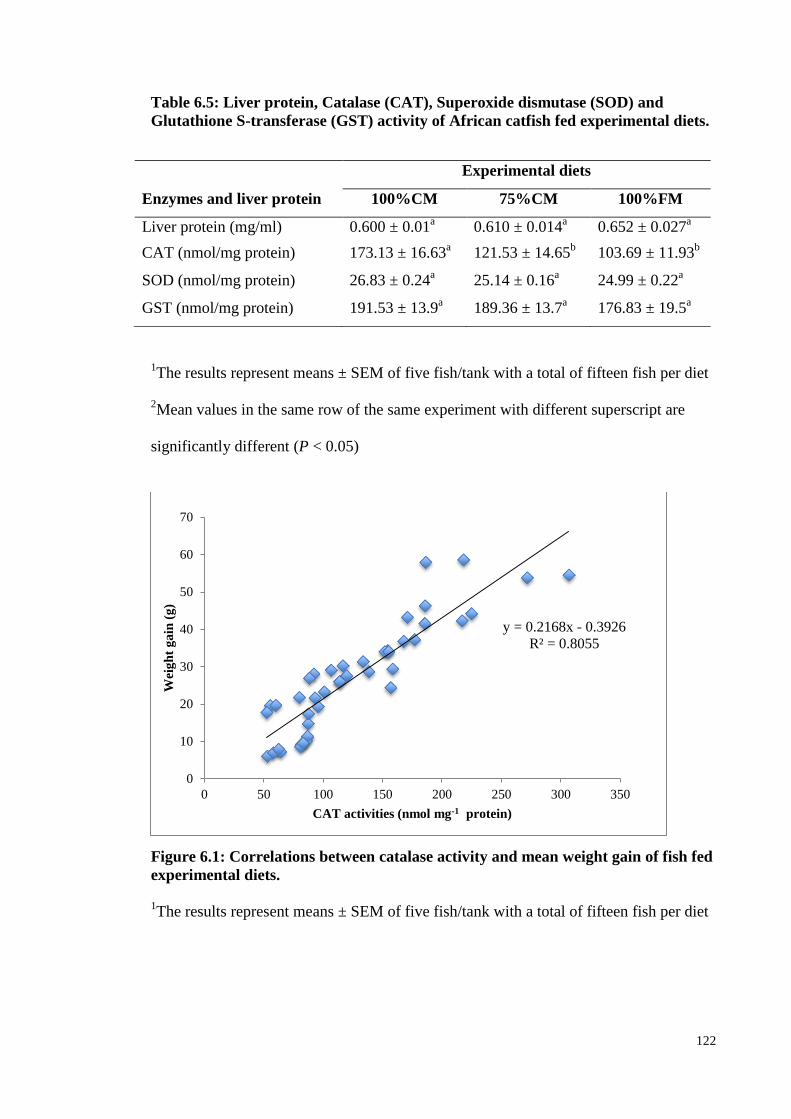
6.4 Results ..................................................................................................................... 119
6.5 Discussion ............................................................................................................... 123
Page 11
xi
6.6 Conclusions ............................................................................................................. 128
CHAPTER 7: GENERAL CONCLUSION AND FUTURE PERSPECTIVE ............. 130
7.1 Conclusion .............................................................................................................. 130
7.2 Future perspective ................................................................................................... 131
REFERENCES .............................................................................................................. 133
LIST OF PUBLICATIONS AND PAPER PRESENTED ........................................... 163
Page 12
xii
LIST OF FIGURE
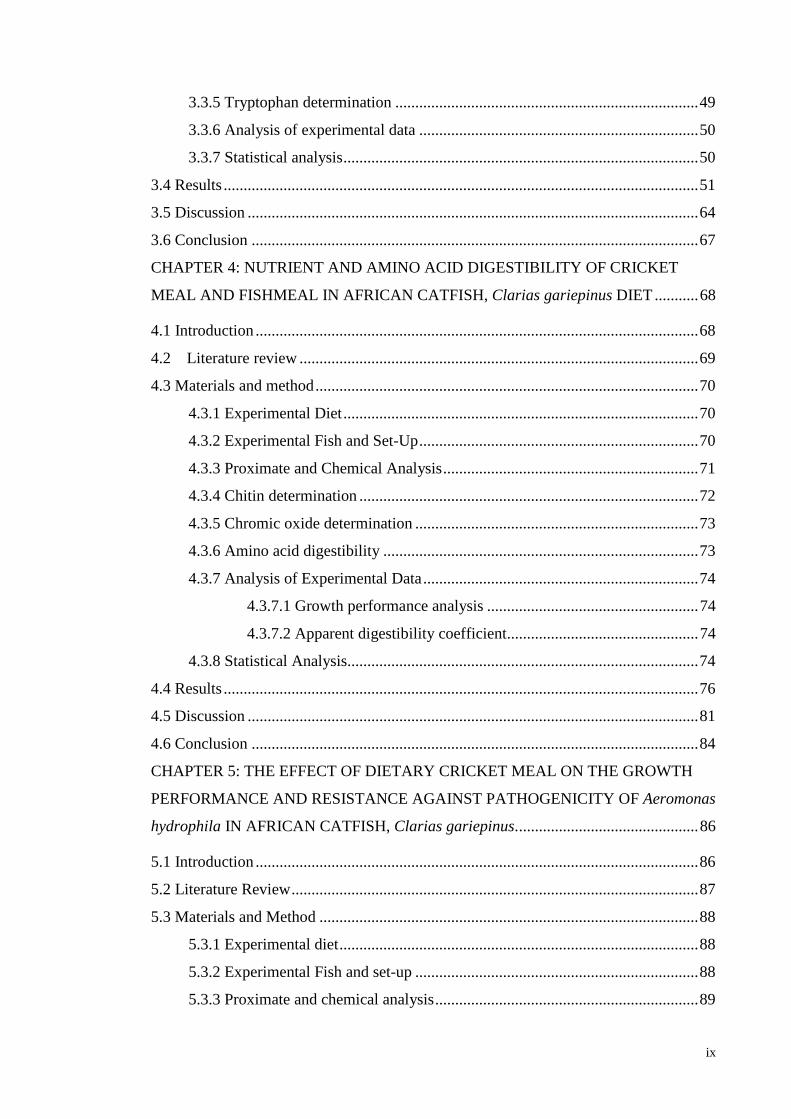
Figure 2.1: Total world aquaculture productions and capture fisheries from 1950 to 2012.
(FAO, 2014) .............................................................................................................. 5
Figure 2.2: Black field cricket (Gryllus bimaculatus) .................................................... 26
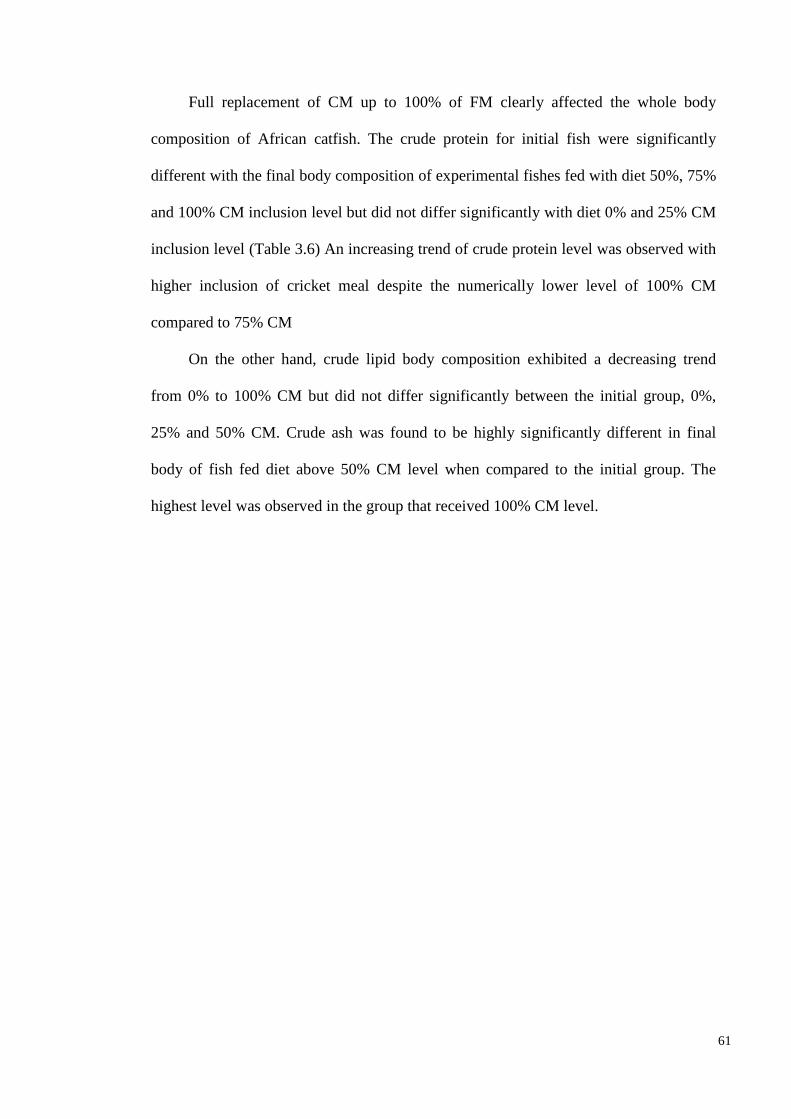
Figure 3.1: Fish fed with fishmeal diet after 56 days of feeding trial ............................ 62
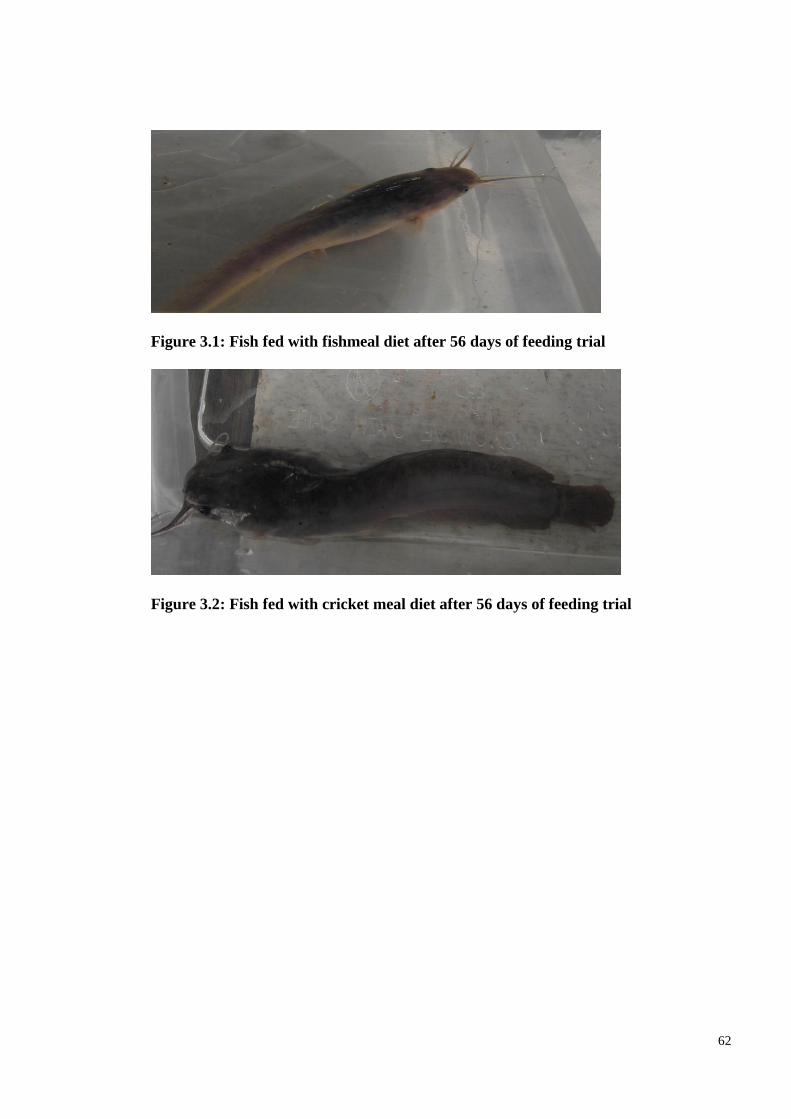
Figure 3.2: Fish fed with cricket meal diet after 56 days of feeding trial ...................... 62
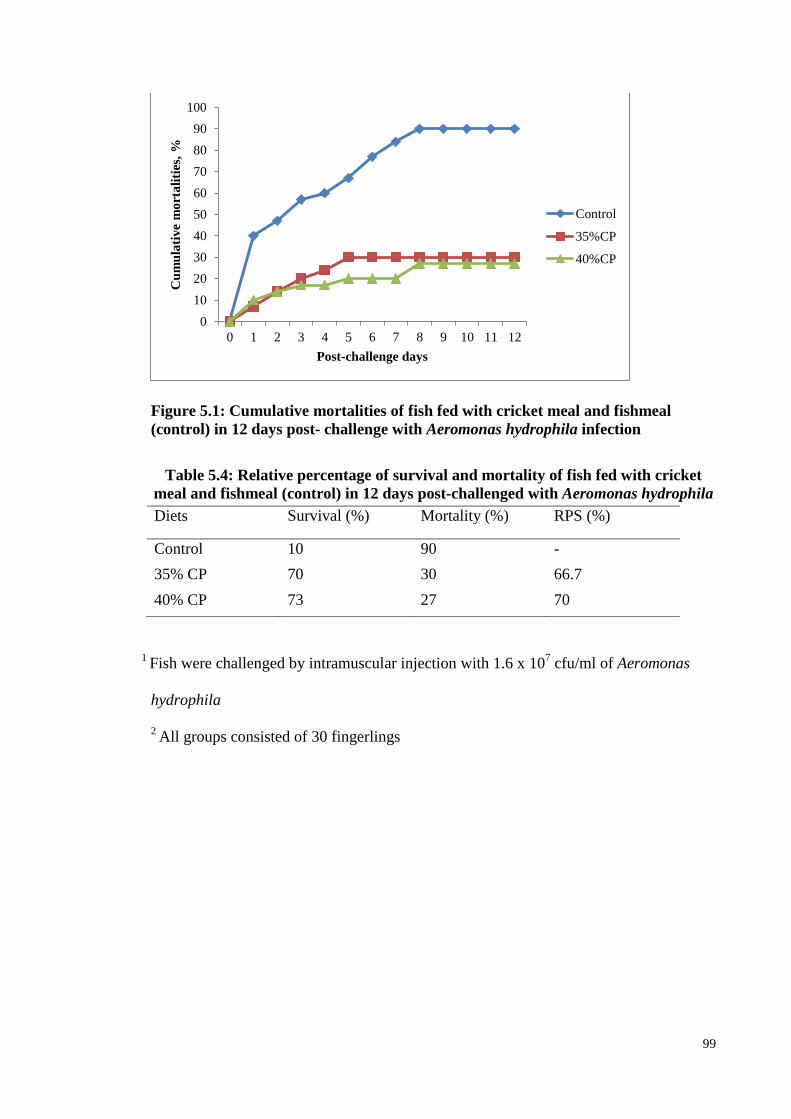
Figure 5.1: Cumulative mortalities of fish fed with cricket meal and fishmeal (control) in
12 days post- challenge with Aeromonas hydrophila infection ............................. 99
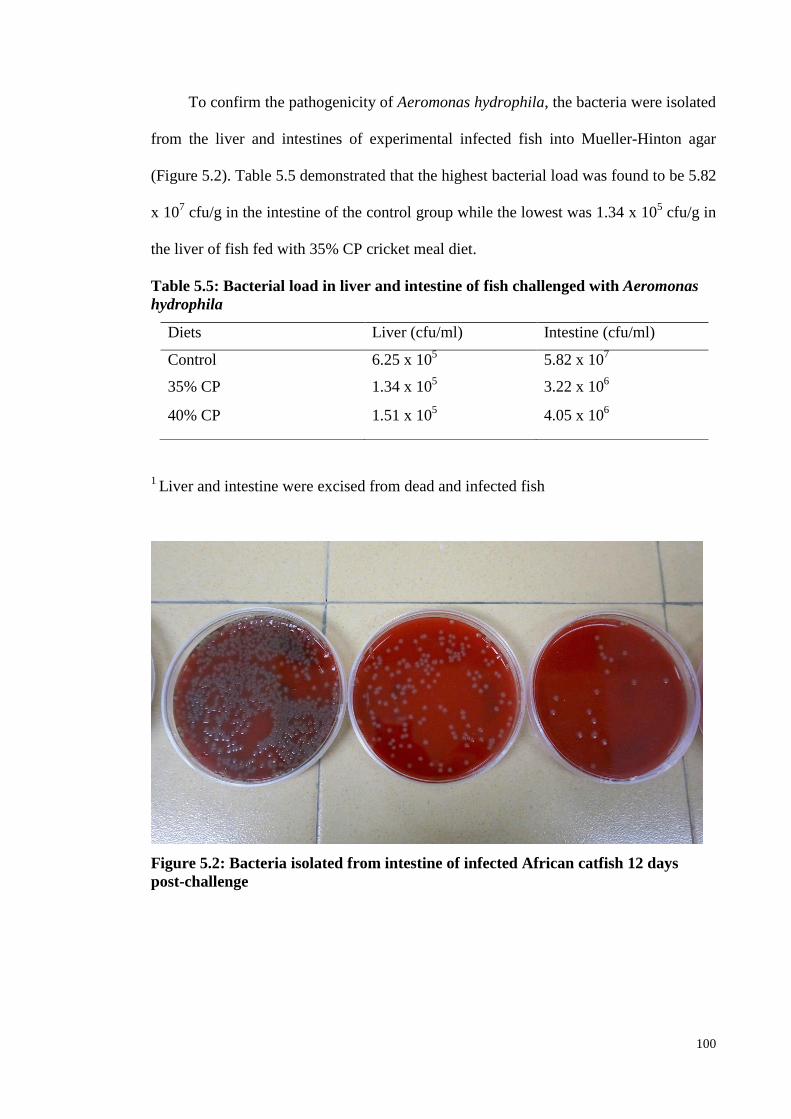
Figure 5.2: Bacteria isolated from intestine of infected African catfish 12 days post-
challenge ............................................................................................................... 100
Figure 5.3: Fish fed with cricket meal showed recovered wound (arrow) on the injected
area 6 days post-challenge .................................................................................... 104
Figure 6.1: Correlations between catalase activity and mean weight gain of fish fed
experimental diets. ................................................................................................ 122
Page 13
xiii
LIST OF TABLE
Table 2.1: World aquaculture production of finfish, crustacean, molluscs and other
aquatic species in 2012 from inland aquaculture and mariculture (in live
weight equivalent) (FAO, 2012) ........................................................................ 5
Table 2.2: Top food aquaculture producers in Asia 2012. (FAO, 2012) ................... 6
Table 2.3: Aquaculture productions from freshwater culture system by species,
2014 in Malaysia ................................................................................................ 8
Table 2.4: Estimated essential amino acid requirements of different fish species
(Jimoh et al., 2014; NRC, 2011). ..................................................................... 14
Table 2.5: Nutritional requirement of catfish ........................................................... 18
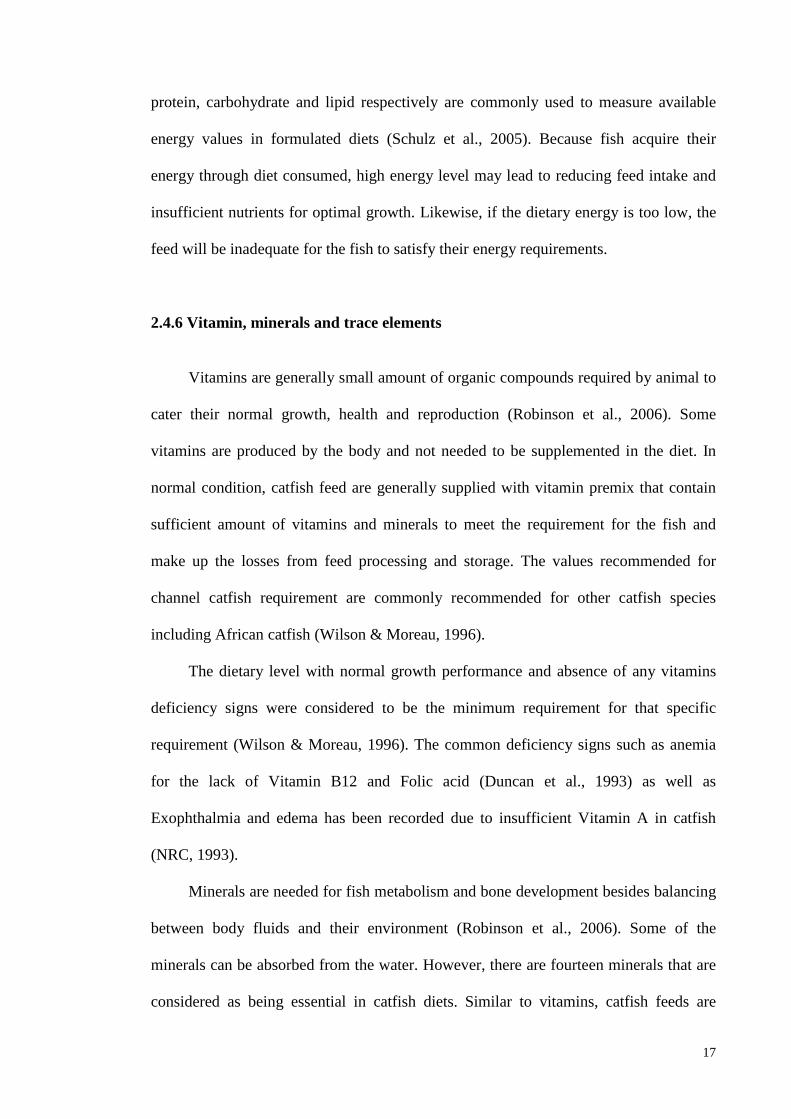
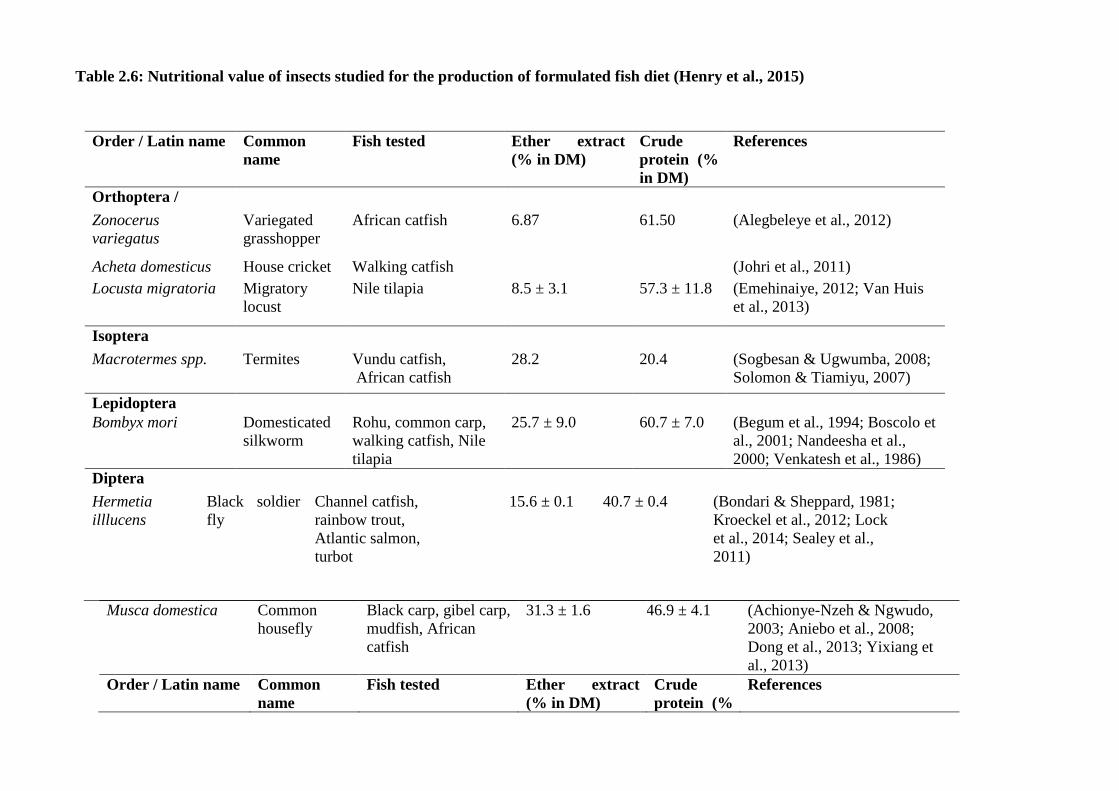
Table 2.6: Nutritional value of insects studied for the production of formulated fish
diet (Henry et al., 2015) ................................................................................... 23
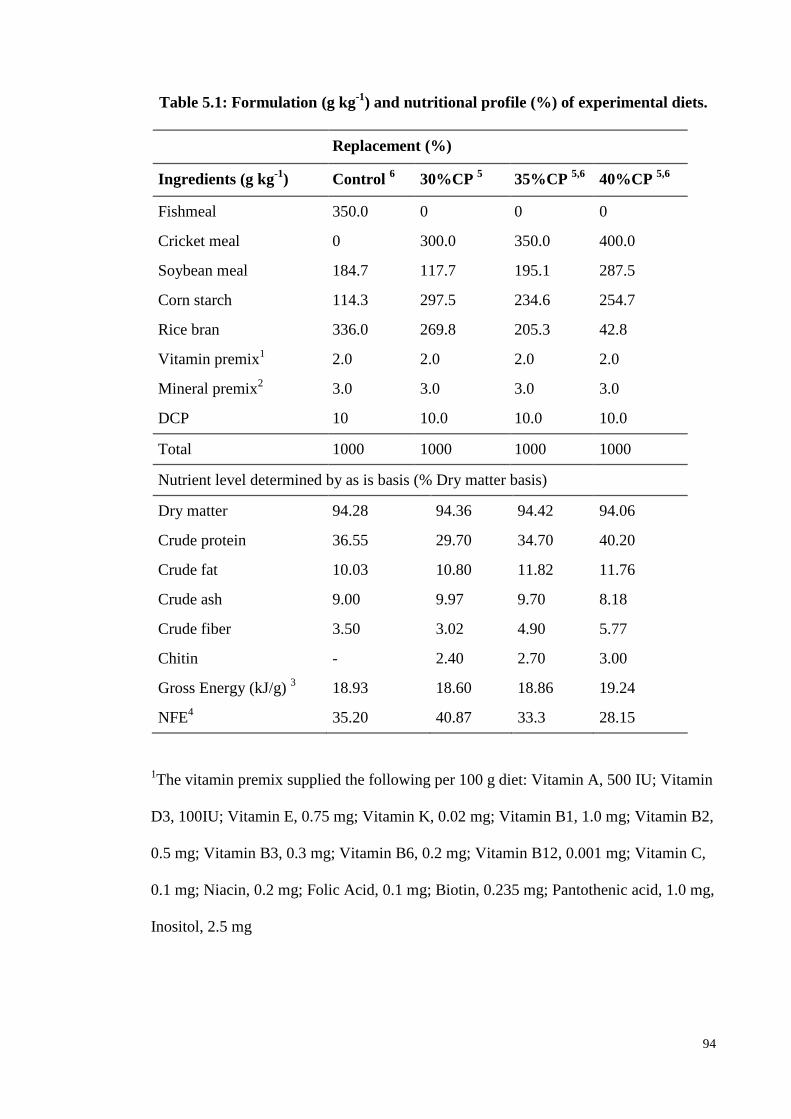
Table 3.1: Formulation (g kg-1
) and nutritional profile (%) of experimental diets .. 52
Table 3.2: Chemical composition of fishmeal, cricket meal and soybean meal used
in the trial diet .................................................................................................. 54
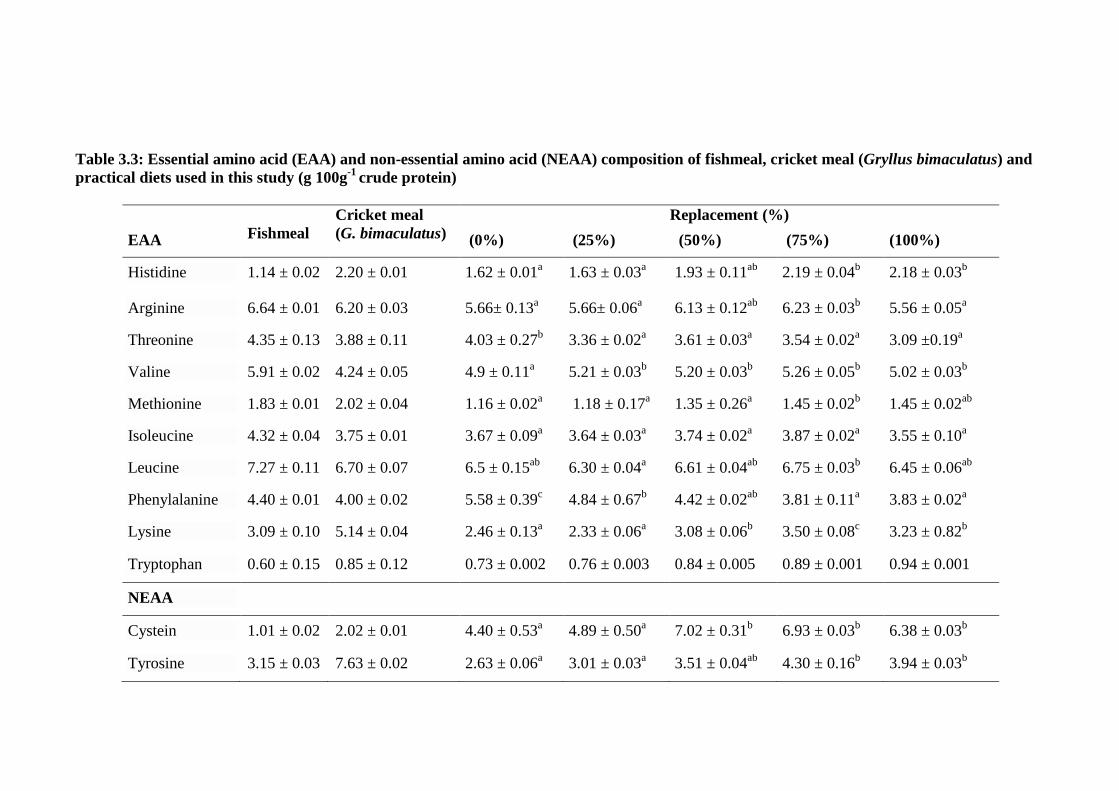
Table 3.3: Essential amino acid (EAA) and non-essential amino acid (NEAA)
composition of fishmeal, cricket meal (Gryllus bimaculatus) and practical
diets used in this study (g 100g-1
crude protein) .............................................. 56
Table 3.4: Amino acid profiles (g 100g-1
crude protein) of field cricket (Gryllus
testaceus), house cricket (Acheta domesticus) and good quality fishmeal. ..... 58
Table 3.5: Growth performance of fish fed the experimental diets. ........................ 60
Table 3.6: Initial and final body composition (g kg-1
) of fish fed the experiment
diets (% Dry matter basis) ................................................................................ 63
Table 4.1: Formulation (g kg-1
) and nutritional profile (%), of fishmeal and cricket
meal diet for the digestibility study .................................................................. 75
Table 4.2: Chemical composition (g kg-1
) of faeces collected from fish fed cricket
meal diet and fishmeal diet (% dry matter basis) ............................................. 77
Table 4.3: Mean (± S.E) Apparent Digestibility Coefficient (ADC %) of crude
protein, crude lipid, dry matter and gross energy in the experimental diets. ... 77
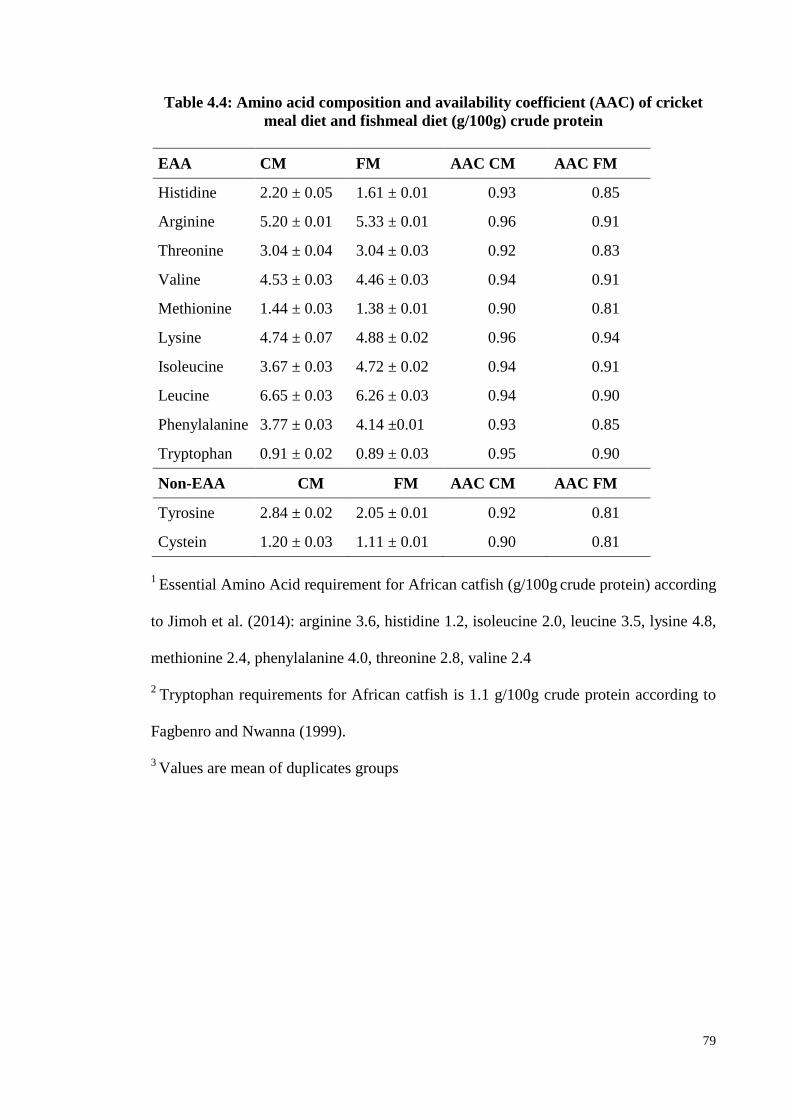
Table 4.4: Amino acid composition and availability coefficient (AAC) of cricket
meal diet and fishmeal diet (g/100g) crude protein ......................................... 79
Table 4.5: Growth performance of fish fed the experimental diets. ........................ 80
Table 5.1: Formulation (g kg-1
) and nutritional profile (%) of experimental diets. . 94
Table 5.2: Growth performance of fish fed the experimental diets. ........................ 97
Page 14
xiv
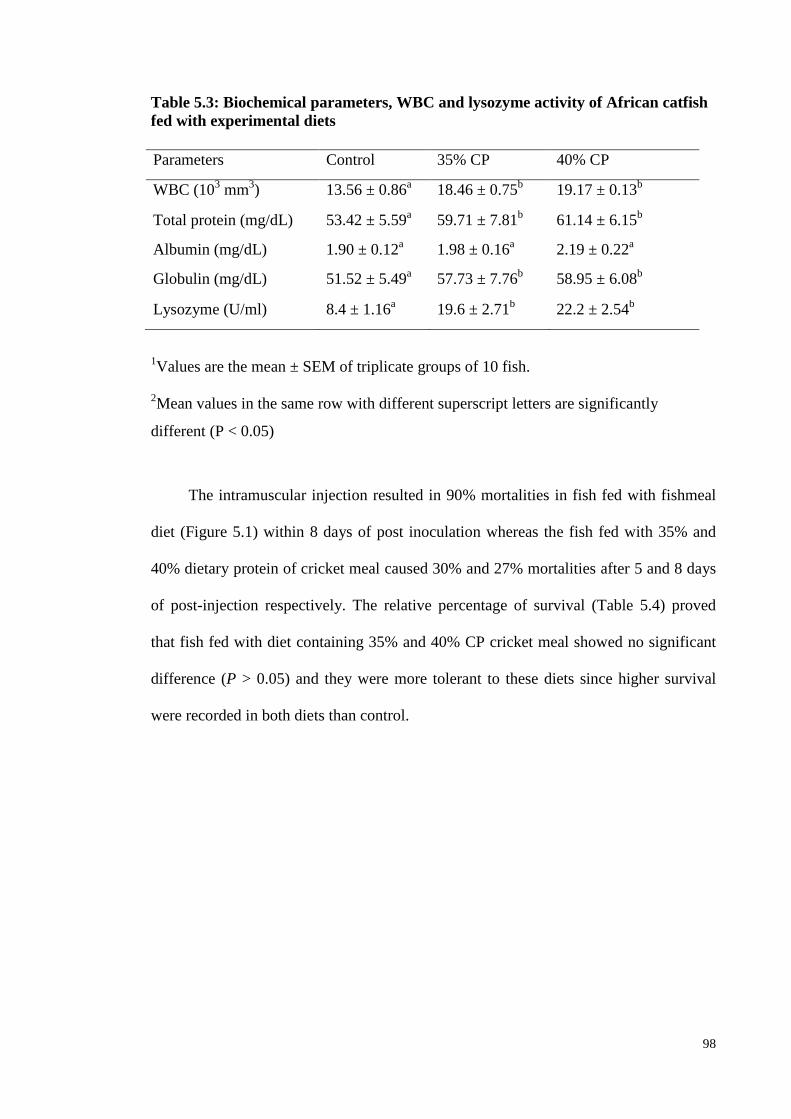
Table 5.3: Biochemical parameters, WBC and lysozyme activity of African catfish
fed with experimental diets .............................................................................. 98
Table 5.4: Relative percentage of survival and mortality of fish fed with cricket
meal and fishmeal (control) in 12 days post-challenged with Aeromonas
hydrophila ........................................................................................................ 99
Table 5.5: Bacterial load in liver and intestine of fish challenged with Aeromonas
hydrophila ...................................................................................................... 100
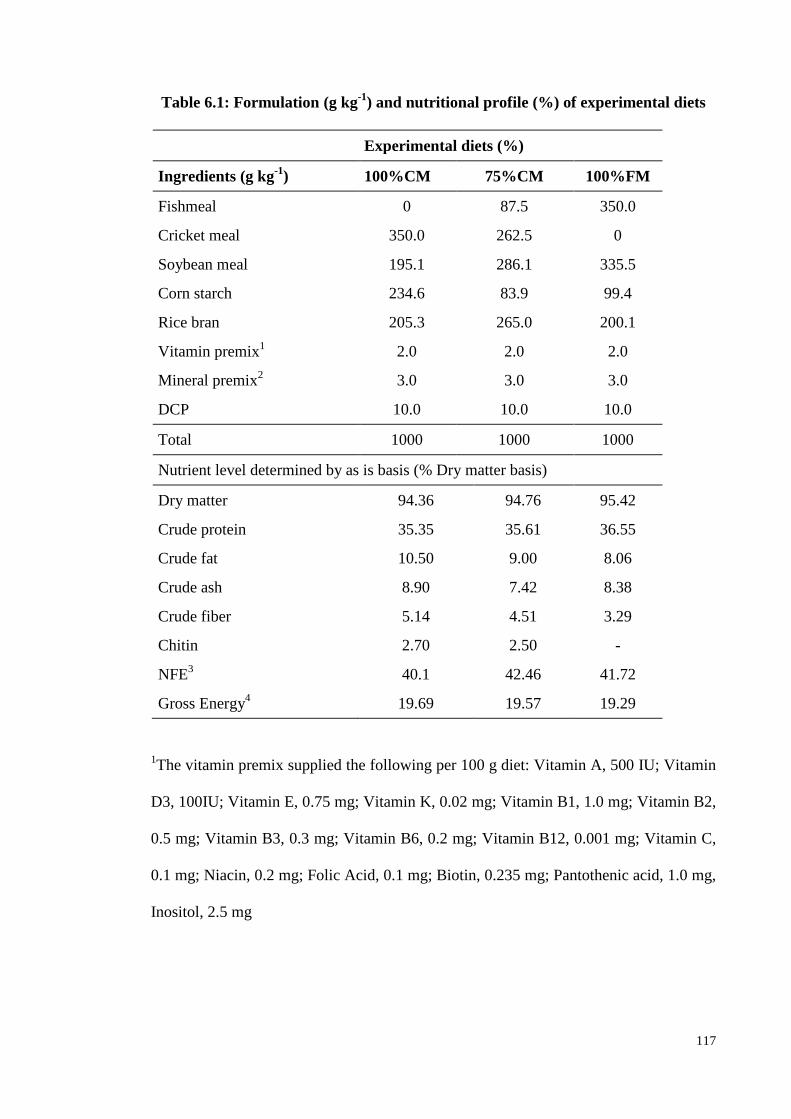
Table 6.1: Formulation (g kg-1
) and nutritional profile (%) of experimental diets 117
Table 6.2: Essential Amino acids of cricket meal diets and African catfish
requirements ................................................................................................... 118
Table 6.3: Growth performance of fish fed the experimental diets. ...................... 120
Table 6.4: Haematological and plasma biochemical parameters of African catfish
fed various experimental diets. ...................................................................... 121
Table 6.5: Liver protein, Catalase (CAT), Superoxide dismutase (SOD) and
Glutathione S-transferase (GST) activity of African catfish fed experimental
diets. ............................................................................................................... 122
Page 15
xv
LIST OF ABBREVIATIONS
AAC – Amino acid coefficient
ADC – Apparent digestibility coefficient
ADF – Acid detergent fiber
BW – Body weight
CAT – Catalase
CFU –Colony forming unit
CM – Cricket meal
DCP – Di calcium phosphate
DE/P – Digestible energy to crude protein ratio
df – Dilution factor
EAA – Essential amino acid
EFA – Essential fatty acid
FCR – Feed conversion ratio
FM – Fishmeal
GE – Gross energy
GST – Glutathione S-transferase
Hb – Hemoglobin
HPLC – High performance liquid chromatography
HSI – Hepatic somatic index
Ht – Hematocrit
HUFA – Highly unsaturated fatty acid
MAS – Motile Aeromonas Species
MCH – Mean corpuscular hemoglobin
Page 16
xvi
MCHC – Mean corpuscular hemoglobin concentration
MCV – Mean corpuscular volume
NFE – Nitrogen free extract
PER – Protein efficiency ratio
PUFA – Polyunsaturated fatty acid
ROS – Reactive oxygen species
RPS – Relative percentage survival
SGR – Specific growth rate
SR – Survival rate
WG – Weight gain
Page 17
1
CHAPTER 1: INTRODUCTION
Human consumption of aquatic food products has been increasing throughout the
years. Demands for aquatic food products including fish have escalated rapidly due to
the annual increase in growth of human population (FAO, 2014). People from rural
areas and developing countries have been recognized as having macronutrients (protein
and energy) and micronutrients (vitamins and minerals) deficiencies (FAO, 2011). Lack
of micronutrients, for example, iodine has been related to goiter and mental retardation
(FAO, 2011). According to FAO (2011), the recording of more than 800,000 child
deaths per year corresponded to zinc deficiency and almost 2 billion people worldwide
are at risk for iron deficiency.
Based on the reports from FAO / WHO consultation expert (FAO & WHO,
2010), there exists convincing evidence to show that fish consumption can reduce the
risk of death from coronary heart disease. The supply of high quality protein mainly
from fish is vital due to the presence of “good” source of amino acid and fatty acid that
could contribute to primary prevention against cardiovascular disease (Kris-Etherton et
al., 2009). Improved neurodevelopment had been reported in infants and young children
whose mother consumed fish during pregnancy (FAO, 2011).
Aquaculture paved the way in increasing the production of aquatic food
products as a result of the declining number of captured wild fish. According to the
statistics by FAO (2012) in the Global Aquaculture Production Volume and Value
Statistics Database, the world aquaculture production in 2012 was estimated at 66.63
million tonnes for food fish, which was produced for human consumption. On average,
aquaculture supplied approximately 9.41 kg of food fish per person for consumption in
Page 18
2
2012 although the production distribution is extremely variable across the globe and on
all continents owing to the uneven development.
In Malaysia, African catfish is nominated as the highest number of
freshwater fish in aquaculture production due to its hardiness and palatability (DOF,
2014). However, feed supply and feed costs are the most expensive components in
sustainable aquaculture farming including African catfish. This is due to the fact that
fishmeal has been utilized as a major protein source in fish and poultry feed. Hence,
alternative protein sources to replace the diminishing production of fishmeal have to be
explored to overcome the increasing market price of fish feed and production of
sustainable products.
Sustainable resources such as insect meals are believed to be a good
candidate for fishmeal replacement given the presence of essential amino acid for the
fish and high content of protein (Henry et al., 2015). To date, numerous researches on
insect meal have been widely studied as an alternative resource for fishmeal. There is no
reliable evidence on the use of cricket meal in formulated fish feed although previous
studies have proven that these insects could give promising result in poultry feed (Wang
et al., 2005).
When introducing new feed materials, it is important to ensure that the feed
does not compromise fish growth and welfare. This is to ensure that the important
aspects enabling healthy growth development especially digestibility, stress and
immune response of the fish could function normally. For this reason, African catfish
was chosen as the species to be researched upon in the current study.
Page 19
3
Objectives of the study
1. To determine the effect of fishmeal replacement with cricket meal on the Growth
Performance of African catfish, Clarias gariepinus
2. To observe the effect of Digestibility of cricket meal and fish meal diets when fed to
African catfish, Clarias gariepinus
3. To assess the impact of dietary cricket meal on Immune Function in African catfish,
Clarias gariepinus
4. To study the influence of cricket meal diet on the Anti-oxidative response and
Haematological effect in African catfish, Clarias gariepinus
Hypothesis of the study
1. Cricket meal can replace conventional fishmeal without any negative effect on African
catfish Growth Performance
2. Cricket meal diet increases the nutrient and amino acid digestibility of African catfish
3. Cricket meal diet increases the immune response and antioxidant enzyme activity of
African catfish
Page 20
4
CHAPTER 2: LITERATURE REVIEW
2.1 Status of world aquaculture
2.1.1 Global aquaculture
Aquaculture is related to the husbandry of aquatic organisms for profitable
purposes. It can be distinguished from captured fisheries by two factors, which include
intervention to enhance stock and ownership of the stock (FAO, 2006). In general, it is
one of the most important industries that play a vital role in generating economic values
in most developing countries including Malaysia. In fact, aquaculture has been
recognized as the fastest growth sector in agribusiness globally with nearly 10% annual
increase (FAO, 2012).
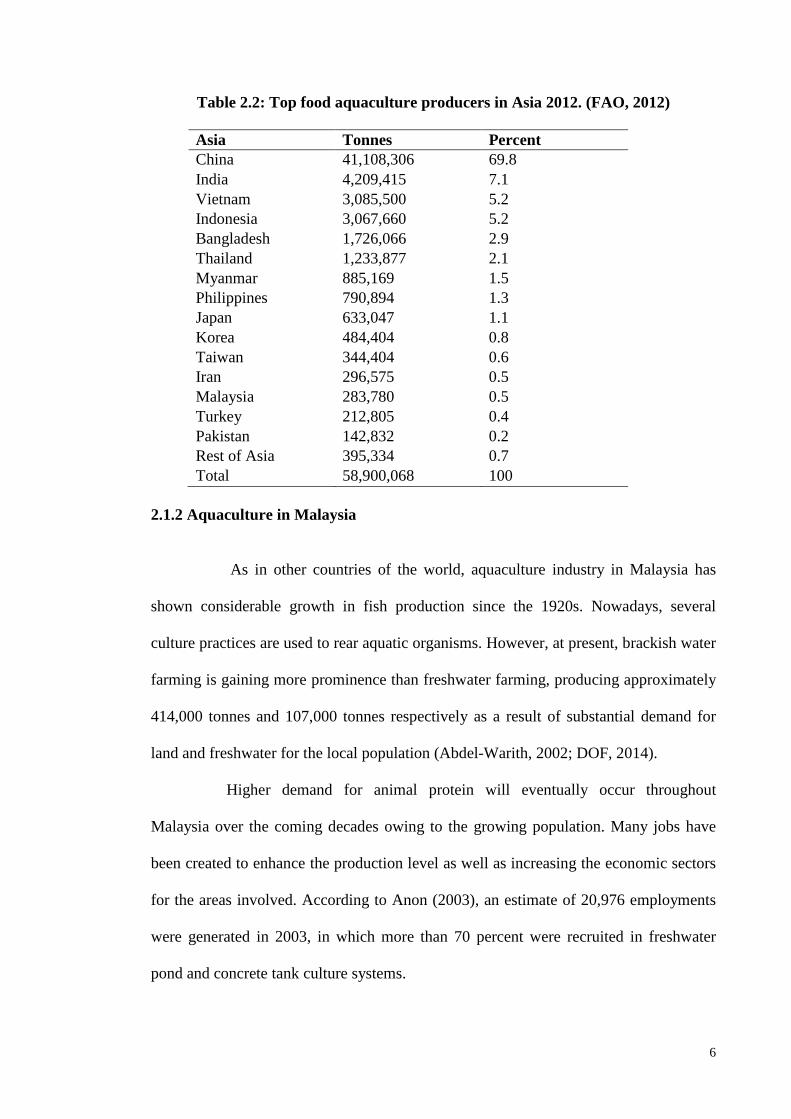
The contribution from aquaculture for global total fish production increased by
16.5 % from 2000 to 2012, which signifies a good growth development. Asia is the only
continent producing more fish in aquaculture than captured fisheries. China has been
dominating the chart of top food fish aquaculture production with 69.8% of global
production followed by India (7.1%), Vietnam and Indonesia, both at 5.2% and
Malaysia, which produced about 0.5% of total fish production worldwide (Table 2.2)
(FAO, 2012).
Driven by high demand and environmental factors, aquaculture is and will be
dominated by developing countries where a great number of employments, with an
estimated of 16 million people especially in rural areas were created through
aquaculture business (FAO, 2012). As highlighted in Table 2.1, inland aquaculture
registered 2-fold higher production compared to mariculture in which finfish was the
main source of production estimated at 66% total value in 2012.
Page 21
5
Table 2.1: World aquaculture production of finfish, crustacean, molluscs and
other aquatic species in 2012 from inland aquaculture and mariculture (in live
weight equivalent) (FAO, 2012)
Inland
aquaculture
Mariculture Sub-total
Aquatic
animals
(Thousand
tonnes)
(Thousand
tonnes)
(Thousand
tonnes)
(Percentage)
Finfish 38,599 5,552 44,151 66.3
Crustacean 2,530 3,917 6,447 9.7
Molluscs 287 14,884 15,171 22.8
Other species 530 335 865 1.3
Total 41,946 24,687 66,635 100
Figure 2.1: Total world aquaculture productions and capture fisheries from 1950
to 2012. (FAO, 2014)
Page 22
6
Table 2.2: Top food aquaculture producers in Asia 2012. (FAO, 2012)
Asia Tonnes Percent
China 41,108,306 69.8
India 4,209,415 7.1
Vietnam 3,085,500 5.2
Indonesia 3,067,660 5.2
Bangladesh 1,726,066 2.9
Thailand 1,233,877 2.1
Myanmar 885,169 1.5
Philippines 790,894 1.3
Japan 633,047 1.1
Korea 484,404 0.8
Taiwan 344,404 0.6
Iran 296,575 0.5
Malaysia 283,780 0.5
Turkey 212,805 0.4
Pakistan 142,832 0.2
Rest of Asia 395,334 0.7
Total 58,900,068 100
2.1.2 Aquaculture in Malaysia
As in other countries of the world, aquaculture industry in Malaysia has
shown considerable growth in fish production since the 1920s. Nowadays, several
culture practices are used to rear aquatic organisms. However, at present, brackish water
farming is gaining more prominence than freshwater farming, producing approximately
414,000 tonnes and 107,000 tonnes respectively as a result of substantial demand for
land and freshwater for the local population (Abdel-Warith, 2002; DOF, 2014).
Higher demand for animal protein will eventually occur throughout
Malaysia over the coming decades owing to the growing population. Many jobs have
been created to enhance the production level as well as increasing the economic sectors
for the areas involved. According to Anon (2003), an estimate of 20,976 employments
were generated in 2003, in which more than 70 percent were recruited in freshwater
pond and concrete tank culture systems.
Page 23
7
Aquaculture in Malaysia has significantly contributed to the high quality of
protein sources for world population as well as food security since the Seventh Malaysia
Plan (1996 – 2000) (FAO, 2008). Thereafter, it has been recognized as one of the
potential commodity that could enhance export revenues besides rubber and oil palm.
For this reason, aquaculture appears to be crucial for the improvement of livelihoods in
a community and contributing to poverty reduction.
Page 24
8
Table 2.3: Aquaculture productions from freshwater culture system by species,
2014 in Malaysia
Species Total (Tonnes)
Milkfish 68.00
River catfish 1,648.29
Snakehead 22.28
Jade Perch 16.80
River carp 1,151.57
Big head carp 1,299.57
Grass carp 426.62
River carp 18.05
Freshwater catfish 46,122.01
Carp / Barb 151.83
Goby 13.09
Javanese carp 1,584.66
River carp 334.80
Common carp 1,759.49
Mrigal carp / Indian carp 134.00
Pacu 59.28
River catfish 11,625.54
Climbing perch 207.69
Rohu 2,171.02
Snakeskin gourami 2.83
Freshwater seabass 5.69
Giant catfish 0.19
Carp / Barp 0.02
Black tilapia 4,145.11
Red tilapia 31,203.09
Giant snakehead 1,121.79
Giant freshwater rrawn 398.10
Red claw shrimp 76.48
Miscellaneous 867.40
Total 106,731.41
Page 25
9
2.2 Biology of African catfish
The genus of Clarias has been widespread throughout African continents with
several species (C. mossambicus, C. lazera) and synonymized as C.gariepinus. It is
typically air-breathing fish species with a scaleless, bony elongated body as well as long
dorsal and anal fin. The head shaped like a helmet and colour varies from dark to light
brown with olive and greyish shades while the underside of the dorsal range from pale
cream to white (Skelton, 2001).
African catfish can tolerate very low oxygen concentrations and survived a
considerable amount of time out of water by using specialized suprabranchial organ
(Safriel & Bruton, 1984) which is a large paired chamber of branches above the gill
arches specifically adapted for air breathing. The ability of the catfish in tolerating
extreme condition allows it to survive in moist sand or burrows with an air-water
interface (Van der Waal, 1998).
In terms of growth, African catfish has been considered to have rapid growth rate
(in length and weight) with ambient condition and habitat (Britz & Pienaar, 1992) as
well as density dependent (Hecht & Appelbaum, 1987).
2.3 Catfish production in Malaysia
African catfish, Clarias gariepinus is a freshwater aquaculture fish, native
to the African continents and has been successfully cultured commercially around the
globe within the tropical and subtropical environments (Adewolu et al., 2008; Çek &
Yilmaz, 2009). This species is well known for its hardiness, high fecundity and ease of
production in captivity, besides their capabilities to grow in high densities, which made
them an excellent candidate for commercial freshwater fish (Haylor, 1991; Toko et al.,
2007). As African catfish provides a good resource for human protein intake, studies on
Page 26
10
feed nutrition on this particular species is essential to establish quality feed resources,
both practical and economical for the fish farmers.
The global production of catfish within the past decade has been rising
exponentially as a result of market demand. However, in 2014, the total production of
catfish in Malaysia dropped to approximately around 46,000 tonnes (DOF, 2014), a
0.08% reduction from 2013 (Table 2.3). Commercial production of African catfish in
Malaysia has begun since the year 2000 with the development of artificial mass seed
production (Tuan et al., 2003). More researches and technical advances in the mass
production of African catfish were explored to intensify the fish yield not only for the
live market but also for the production of other side products such as catfish fillet.
Indeed, the development of African catfish and other aquaculture commodities have
created an economic solution for agriculture-based countries such as Malaysia (DOF,
2014).
2.3.1 Feed and feeding practices in African catfish
The primary cost in aquaculture production at present is fish feed, which
accounts for 50 to 70 percent of operating cost whereby protein is the limiting factor
that influences market price for fish feed (FAO, 2002). Generally, catfish feed
comprises of two different types; pelleted feed and farm-made feeds, which differ in
terms of formulation and quality (Nguyen & Oanh, 2009; Phan et al., 2009). Farm-
made feed generally contains trash fish and other animals, which constituted roughly 50
to 70 percent of overall feed formulation. On the other hand, pelleted feed normally
consists of fishmeal, as the main protein ingredients and formulated according to fish
nutritional requirements. As these sources are costly especially for the small-scale
farmers hence, further studies are required to find cheaper alternatives to replace trash
fish and fishmeal as protein sources.
Page 27
11
African catfish nutrition has been studied extensively in recent decades. As
an omnivorous species, they can utilize plants in their diet efficiently but are more
oriented towards animal-based diet. In addition, they can digest dietary carbohydrate
effectively compared to other fish (Jantrarotai et al., 1994; Phonekhampheng, 2008).
Besides fishmeal, a wide range of under-utilized agricultural products such as rice bran,
cotton seed cake, blood meal and groundnut cake have shown positive results in their
growth development (Abdel-Warith, 2002). Among other non-conventional sources that
have been successfully tested in African catfish feed are hydrolyzed feather meal (Madu
& Ufodike, 2004), toad meal (Ayinla, 2007), rumen epithelial meal (Sotolu &
Adejumoh, 2008) and pigeon pea meal (Ogunji et al., 2008). Generally, catfish required
8 -10 percent of fishmeal in their diet requirement. However, Phonekhampheng et al.
(2009) reported total replacement of fishmeal with golden apple snail meal (Pomacea
canaliculata) increased growth performance and did not affect feed efficiency of
African catfish.
2.4 Nutrition requirement for catfish
2.4.1 Protein requirement
Generally, protein is the costliest component in formulated aquafeed. Fish
consume higher percentage of protein compared to other terrestrial animals due to their
lower energy requirements (NRC, 1983). However, as African catfish is an omnivorous
species, lower dietary protein is sufficient to facilitate their growth compared to
carnivorous fish. High dietary protein content will lead to leakage and wastage of
nitrogen into the environment. In fact, diets that contain sufficient protein for growth
and metabolic requirements together with carbohydrate and lipids to satisfy the energy
need will be environmentally friendly and cost effective (Lucas & Southgate, 2012).
Page 28
12
Li et al. (2006) has demonstrated that dietary level as low as 24% crude protein
(CP) could produce the same growth effect and feed efficiency to the growing fish as
traditionally high protein diets fed to channel catfish, Ictalurus punctatus (32% - 35%)
despite its tendencies to increase body fat content. Therefore, they recommended a
dietary crude protein level of 28% with a stocking density of less than 10,000
individuals per acre; daily fed with more than 80 pounds per acre of feed per day. These
could generate good growth response and decrease fat content with improved yield
quality. On the other hand, in striped catfish, Cho et al. (1985) reported that diet
exceeding 45% crude protein (CP) resulted in depressed growth than a lower percentage
of CP. Diets with 25%, 30% and 35% CP produced optimal growth rates while 20% and
40% CP supported similar growth response.
Currently, the commercial feed contains highly variable CP contents, which
are supplied according to the fish life stages (NRC, 1993). The feed is given in relation
to four phases; fry, juvenile, grow out and broodstock. However, some aquaculture
producers feed their catfish the same amount of crude protein level throughout the
growing season. Highest amount of protein is required in the fry and small fingerlings
phases (40% to 50% CP) to facilitate their growth and subsequently, as they grow
bigger to a juvenile stage, protein requirement reduces to 36 - 40% CP and finally 25 -
36% CP for grow out phase (Li et al., 2006). As for the broodstock, Quintero et al.
(2011) reported that channel catfish fed dietary protein of 32 – 42% did not show any
significant effect on spawning, fecundity or fertilization compared to the lower level of
protein although it did affect eggs size and biochemical composition.
Page 29
13
2.4.2 Essential amino acid requirement
Apparently, all vertebrates including fish require ten essential amino acids,
as they are incapable of synthesizing them and therefore need to be supplied from
external sources. According to Lucas and Southgate (2012), animals do not have any
specific requirements for protein but they need to fulfill the amino acid requirements.
Hence, it is commonly accepted that ‘protein requirement’ indicates the lowest level of
high quality protein needed to comply with amino acid requirements. Generally, the ten
amino acids need to be supplied in the diets are: arginine (arg), histine (his), isoleucine
(ile), leucine (leu), lysine (lys), methionine (met), phenylalanine (phe), threonine (thr),
tryptophan (trp) and valine (val).
There are factors that need to be taken into consideration in regulating
dietary requirements. These include; dietary component, physiological need,
pathological status and environmental factors (Wu, 2013). Methionine and lysine are the
most common limiting amino acids in the practical diet of fish. Some deficient essential
amino acid can be met with additional non-essential amino acid. For example, cysteine
could replace about 60% of the methionine while tyrosine can spare up to 50% of
phenylalanine requirement whereas lysine is the only deficient amino acid that cannot
be replaced. Nevertheless, the problems can be overcome by supplementing lysine in
the diet to meet the requirements (Li et al., 2006).
Page 30
14
Table 2.4: Estimated essential amino acid requirements of different fish species
(Jimoh et al., 2014; NRC, 2011).
Essential amino acids (g 100g-1
crude protein)
Fish Arg His Iso Leu Lys Met Phe Thr Trp Val
Channel
catfish1
4.3 1.5 2.6 3.5 5.1 2.3 2.1 2.2 0.5 3.0
African
catfish2
3.6 1.2 2.0 3.5 4.8 2.4 4.0 2.8 - 2.4
Nile tilapia1 4.2 1.7 3.1 3.4 5.1 2.7 3.8 3.8 1.0 2.8
Common
carp1
4.3 2.1 2.5 3.3 5.7 2.0 6.5 3.9 0.8 3.6
Rainbow
trout1
4.2 1.2 2.8 2.9 5.3 1.9 2.0 2.6 0.4 3.4
Japanese
eel1
4.2 2.0 3.8 4.7 5.1 4.8 5.8 3.8 1.1 3.8
1 Amino acid requirements according to NRC (2011)
2 Amino acid requirements according to Jimoh et al. (2014)
Indispensable amino acids are vital in aiding metabolic reactions and protein
synthesis as well as being precursors for neurotransmitters, hormones and cofactors
(NRC, 2011; Rodehutscord et al., 1997). Therefore, insufficiencies of amino acid could
lead to anatomical abnormalities and subsequently produced poor growth. Methionine
deficiency has proven to cause lens cataract and growth depression in rainbow trout and
lake trout (Cowey et al., 1992; Page et al., 1978). Arginine plays an important role in
producing nitric oxide for macrophage control. Thus, deficiency in this amino acid has
been reported to suppress growth, increase mortality and fin erosion in rainbow trout
(Cho et al., 1992) and channel catfish (Buentello & Gatlin III, 2001; Robinson et al.,
1981). Lack of tryptophan is associated with scoliosis and lordosis in sockeye salmon
and rainbow trout but this infection is not observed in catfish (Poston & Rumsey, 1983;
Wilson et al., 1978).
Page 31
15
2.4.3 Lipid requirement
Lipid has been commonly known to supply essential fatty acid (EFA) vitally
important in animal metabolism. It is an essential energy source for fish that provide
linolenic (n-3) and linoleic (n-6) types of fatty acid (Steffens, 1996). Linolenic acid (n-
3) fatty acid is not produced in freshwater fish and thus, must be included in the diet.
The amount of lipid needed in the formulated diet is based on the desired quality of
fillet, cost, EFA requirement and feed manufacturers limitation (Li et al., 1994).
Through enzymatic systems, the fish were able to produce long chain HUFA, EFA and
DHA to facilitate other metabolic systems and cellular membrane components (Craig &
Helfrich, 2009).
A practical diet for catfish only requires 0.5 % to 0.75% n-3 fatty acid with
less than 5 to 6 percent lipid level (Li et al., 2006). Since protein is an expensive source
of energy, elevated level of dietary lipid up to 15% will reduce cost of the diet and spare
protein without giving any adverse effect to the fish (NRC, 2011). However, higher
lipid level will promote excessive fat deposition in the liver resulting to major health
problems and affecting market quality (Oliva‐Teles, 2012). Other than that, Li et al.
(1994) highlighted that reduced disease resistance and immune function were observed
in channel catfish fed high n-3 PUFA diet particularly in high temperature.
2.4.4 Carbohydrate and fiber requirement
Carbohydrate is the least efficient energy sources compared to protein and
lipid. However in omnivorous fish, especially the warmwater species such as channel
catfish, Pangasius catfish, African catfish and Nile tilapia, carbohydrate is essential for
the energy source other than lipid (Hung et al., 2003; Wilson, 1994). It is stored in fish
Page 32
16
tissues and muscle as glycogen and will be utilized during unfavorable condition such
as hypoxic condition, food scarcity, and high stocking density (Bonga, 1997). Fish
utilize carbohydrate depending on many factors including carbohydrate source,
complexity of the molecule, processing treatment and dietary inclusion level (Enes et
al., 2009; Krogdahl et al., 2010; Stone, 2003; Wilson, 1994). Commercial feed for
catfish commonly contains significant amounts of carbohydrate feedstuff such as corn
meal, rice bran and wheat grain that are rich in starch (Wilson & Poe, 1985).
Approximately, 25% of digestible carbohydrate and less than 3 to 4% crude
fiber are normally fed to fish (Jafri, 1998). On the contrary, Pantazis (2005) reported
that African catfish showed more tolerance to dietary carbohydrate whereby they can
utilize up to 32% carbohydrate. In addition, Jantrarotai et al. (1994) have proposed that
hybrid catfish (C. macrocephalus x C. gariepinus) could tolerate semi-purified feed
containing up to 50% carbohydrate. Nevertheless, Hien et al. (2010) indicated that
striped catfish fed with high dietary carbohydrate resulted in negative growth and
requires longer time to reach marketable size. Crude fiber or cellulose is not well
digested by catfish hence lowering its level in their diet is sufficient for growth (Li et
al., 2006).
2.4.5 Energy requirement
.
Energy requirement in fish is species-specific and is stimulated by water
temperature and physiological status of the fish (Guillaume, 2001). According to
Henken et al. (1986), African catfish requires gross energy and digestible energy of 19
and 14 kJ kg-1
respectively with protein to energy ratio (P/E) of 27 mg kg-1
. However
the P/E increases with increasing temperature from 25.4 mg kJ-1
in 24°C to 34.7 mg kJ-1
at 29°C. Physiological fuel values with the average of 23.9, 17.6 and 39.8 kJ/g of
Page 33
17
protein, carbohydrate and lipid respectively are commonly used to measure available
energy values in formulated diets (Schulz et al., 2005). Because fish acquire their
energy through diet consumed, high energy level may lead to reducing feed intake and
insufficient nutrients for optimal growth. Likewise, if the dietary energy is too low, the
feed will be inadequate for the fish to satisfy their energy requirements.
2.4.6 Vitamin, minerals and trace elements
Vitamins are generally small amount of organic compounds required by animal to
cater their normal growth, health and reproduction (Robinson et al., 2006). Some
vitamins are produced by the body and not needed to be supplemented in the diet. In
normal condition, catfish feed are generally supplied with vitamin premix that contain
sufficient amount of vitamins and minerals to meet the requirement for the fish and
make up the losses from feed processing and storage. The values recommended for
channel catfish requirement are commonly recommended for other catfish species
including African catfish (Wilson & Moreau, 1996).
The dietary level with normal growth performance and absence of any vitamins
deficiency signs were considered to be the minimum requirement for that specific
requirement (Wilson & Moreau, 1996). The common deficiency signs such as anemia
for the lack of Vitamin B12 and Folic acid (Duncan et al., 1993) as well as
Exophthalmia and edema has been recorded due to insufficient Vitamin A in catfish
(NRC, 1993).
Minerals are needed for fish metabolism and bone development besides balancing
between body fluids and their environment (Robinson et al., 2006). Some of the
minerals can be absorbed from the water. However, there are fourteen minerals that are
considered as being essential in catfish diets. Similar to vitamins, catfish feeds are
Page 34
18
typically supplemented with trace mineral premix and adequate supply of all essential
minerals to meet the requirement of catfish (Robinson et al., 2006).
Table 2.5: Nutritional requirement of catfish
Catfish species Nutrients Recommended
level
Major
source
References
African catfish Protein 35 - 40% Fishmeal (Giri et al., 2003)
35% Casein +
Gelatine
(Farhat & Khan,
2011)
Lipid > 8% Palm oil (Lim et al., 2001)
10% Sunflower oil (Hoffman &
Prinsloo, 1995)
Digestible
energy
18.56 kJ g-1
Casein,
Dextrin, fish
oil
(Pantazis, 2005)
Channel catfish Protein 26 -32% Various
source
(Robinson et al.,
2006) Lipid 4-6 %
Digestible
energy
8.5 -9.5
kcal/g protein
Asian catfish Protein 36% Fishmeal,
Soybean
(Singh et al., 2012)
Lipid 8% Cod liver oil,
Corn oil
(Jafri, 1998)
Digestible
energy
14.1 MJ kg-1
2.5 Use of fishmeal in aquaculture industry
Fishmeal is one of the most important and highly utilized protein sources in
animal feed production. Its excellent nutrient properties together with the current laws
prohibiting the use of most meat meals due to food security has made fishmeal the most
used protein source in animal feed manufacturing (Sánchez-Muros et al., 2014).
Fishmeal quality varies due to many factors; among them are the conditions of raw
fresh fish, temperature of cooking and drying.
Anderson et al. (1993) noted that low temperature during cooking and drying will
produce fishmeal with higher quality, classified as low-temperature (LT) type meals but
the standard of fishmeal also varies with this type of condition.
Page 35
19
Fish used for meal production can be divided into three categories (Ariyawansa,
2000). The first category is fish caught for the sole purpose of fishmeal production and
not suitable for direct human consumption due to the high percentage of bones and oil.
Major groups of fish in this category include anchovies, sardines, menhaden and smelts
(Miles & Chapman, 2015). This group of fishmeal produces high quality of essential
nutrients especially well-balanced amino acids and fatty acids. Hence, the price of this
high-quality fishmeal (65% crude protein) ranged from approximately $385 to $554 per
tonnes since the year 2000 which is equivalent to 2.5 to 3.5 times the price of soybean
(Miles & Chapman, 2015).
The second category of fishmeal was produced from by-catch or trash fish. Trash
fish is commonly caught by trawling where it comprised almost 60% of total catch in
inshore water. Among trash fish that have been identified and commonly used for
fishmeal productions are goatfish (Upeneus sp), short mackerel (Rastrelliger
brachisoma) and silver belly (Leiognathus bindus) (Ramalingam et al., 2014).
Generally, trash fish is commonly used for fishmeal production in Malaysia. However,
the quality of trash fish is a major concern. According to Edwards et al. (2004),
although trash fish contains high protein content, the quality declines without proper
storage in ice or chilled water prior to processing. Problems in storage facilities
commonly occurred in offshores fisheries, as the boat would be stationed at the sea for 1
to 4 weeks. Hence, trash fish is commonly used as fishmeal in medium to small scales
fishmeal plant due to the lower price of fish.
The third category of fishmeal was produced from fish offal from the
consumption industries (Ariyawansa, 2000). The protein content of skin, connective
tissue and bone is lower than the whole fish. Consequently, the proportion of essential
amino acids such as methionine and lysine is approximately 10% lower in fish offal
Page 36
20
than that in whole oily fish such as anchovy and pilchard (Hempel, 1993). Crab, scallop
and shrimp waste meal are sometimes included in the fishmeal, which then produced
higher ash content (Hempel, 1993).
In 2013, the global production of fishmeal from the five top producers plummeted
by 11% for the first nine months of 2013 compared to the same period in 2012. This is
due to the drop in Latin American production as a result of the El Nino effects and
quota restrictions (FAO, 2014). The total production of Peru and Chile as the main
fishmeal producers declined to 799,000 tonnes, the worst level over the last five years.
Unfavorable weather in Denmark and Norway also drew a set back in fishing, thus
limiting its production especially for high quality fishmeal in northern Europe. The
limited supply of fishmeal resulted in the hiking of prices of aquaculture feed and is
disadvantageous for small-scale fish producers. Consequently, they opted for lower
quality fishmeal with lower cost, at the expense of producing poor growth rates (FAO,
2014).
However, besides the uncertainty in the production of fishmeal, there are studies
relating to the health effects of consuming fishmeal. Several researches have revealed
that fishmeal is capable of causing bovine spongiform encephalopathy (BSE) as it could
degrade meat meal and other by-products involved in this disease (Easton et al., 2002).
In addition, previous research has been done to determine if fishmeal can be correlated
with polychlorinated biphenyls (PCBs) and results from 37 fishmeal and fish feed
samples from 6 countries confirmed the presence of PCB contamination (Jacobs et al.,
2002).
2.6 Nutritive potential of insects for aquaculture diets
In recent years, there has been an increasing interest in the utilization of
insect meals for animal feeding. To compensate the unstable production of fishmeal,
Page 37
21
numerous studies have been conducted to find alternative protein sources, which
include grains and materials from livestock and poultry remnants. Insects can be
considered as a good candidate for alternative protein source in the fish diet since they
are well known for their part in natural feed for freshwater and marine fish (Howe et al.,
2014). They can be cultured under different environmental conditions as to optimize
their nutritional values apart from being a sustainable resource (Premalatha et al., 2011).
Due to their nutritious value (high protein content and sufficient amino acid) and
potential to reduce carbon footprint, insects can be considered as a prospective
replacement for fishmeal in fish diet. Some of the insects that have been previously
studied are listed in Table 2.4. To produce a significant amount of fish feed, insects
could be reared in mass production to sustain the demand. They also have different
feeding habits and can be fed with by-products acquired from agriculture and other
business industries to optimize the economic and environmental expenses (Makkar et
al., 2014; Tran et al., 2015; Van Huis et al., 2013).
Culturing insects requires less maintenance and is highly efficient, as they do not
require much energy to support high body temperature. In addition, space requirement
is one of the most prominent advantages because they do not require large areas or
much water to grow compared to crops (Rumpold & Schlüter, 2013). When comparing
with other protein source such as plant protein (soybean), insect culturing generally
utilize smaller space and require less water for large-scale production (Makkar et al.,
2014). Thus, insect production could avoid the expansion of land for soybean
cultivation and reduce deforestation. In terms of nutritional value, a study by Yi et al.
(2013) has reported that the level of essential amino acid (EAA) of five insects species
including cricket (Acheta domesticus) were comparable with soybean protein. Soy has
been used as fish feed owing to its cheap price but it is not part of carnivorous and
Page 38
22
omnivorous fish diet. Insects have the advantage over soy as animal-based protein.
However, further research is needed on cost price reduction and investing in up-scaling
productivity. Recently, although the production of insects for human consumption has
attracted much attention, studies relating to utilization of insects in fish feed have been
relatively scanty as compared to poultry.
The mass rearing of insects in quality control substrates will enable the farmers to
monitor closely the potential for bioaccumulation of insecticides and natural toxic
materials in insects to provide harmless sources for fish feed (Spiegel et al., 2013).
Ogunji et al. (2007) have demonstrated the surge of Glutathione S-transferase (GST)
activity in the liver of Nile tilapia fed higher level of maggot meal suggesting the
potential of having toxic residue or pesticides from the maggot itself or in hen manure
originally used in the maggot meal substrate. However, the elevated level of GST does
not result in growth deficiency of the fish.
Several studies conducted using insect meals as protein sources claimed the
ineffectiveness of insects in producing high feed efficiency due to the presence of
chitin. It is commonly presumed that inclusion of chitin in fish diet could lead to
reduced protein and lipid digestibility. However, Finke (2007) suggested that insect
meal would transport only a small amount of chitin to the fishes and thus, will not affect
growth. The growth deficiency is more likely to be stimulated by disproportion of
essential amino acid rather than the presence of chitin. On the other hand, Henry et al.
(2015) gave a comprehensive review on numerous studies that show the efficiency of
chitin in improving fish growth performance.
Page 39
Table 2.6: Nutritional value of insects studied for the production of formulated fish diet (Henry et al., 2015)
Order / Latin name Common
name
Fish tested Ether extract
(% in DM)
Crude
protein (%
in DM)
References
Orthoptera /
Zonocerus
variegatus
Variegated
grasshopper
African catfish 6.87 61.50 (Alegbeleye et al., 2012)
Acheta domesticus House cricket Walking catfish (Johri et al., 2011)
Locusta migratoria Migratory
locust
Nile tilapia 8.5 ± 3.1 57.3 ± 11.8 (Emehinaiye, 2012; Van Huis
et al., 2013)
Isoptera
Macrotermes spp. Termites Vundu catfish,
African catfish
28.2 20.4 (Sogbesan & Ugwumba, 2008;
Solomon & Tiamiyu, 2007)
Lepidoptera
Bombyx mori Domesticated
silkworm
Rohu, common carp,
walking catfish, Nile
tilapia
25.7 ± 9.0 60.7 ± 7.0 (Begum et al., 1994; Boscolo et
al., 2001; Nandeesha et al.,
2000; Venkatesh et al., 1986)
Diptera
Hermetia
illlucens
Black soldier
fly
Channel catfish,
rainbow trout,
Atlantic salmon,
turbot
15.6 ± 0.1 40.7 ± 0.4 (Bondari & Sheppard, 1981;
Kroeckel et al., 2012; Lock
et al., 2014; Sealey et al.,
2011)
Musca domestica Common
housefly
Black carp, gibel carp,
mudfish, African
catfish
31.3 ± 1.6 46.9 ± 4.1 (Achionye-Nzeh & Ngwudo,
2003; Aniebo et al., 2008;
Dong et al., 2013; Yixiang et
al., 2013)
Order / Latin name Common
name
Fish tested Ether extract
(% in DM)
Crude
protein (%
References
Page 40
24
in DM)
Coleoptera
Tenebreo molitor Yellow
mealworm
African catfish,
common catfish,
gilthead seabream,
European seabass,
rainbow trout
30.1 ± 0.7 58.4 ± 0.4 (Piccolo et al., 2014; Roncarati
et al., 2015)
(Gasco et al., 2014a; Gasco et
al., 2014b)
Zophabas morio Superworm Nile tilapia 38.0 ± 0.3 58.4 ± 0.4 (Jabir et al., 2012)
Page 41
25
2.7 Potential of cricket meal in animal diet
House cricket, Acheta domesticus is one of the most important species involved in
pet trade. They have been kept domestically as pets since the 12th
century by the
Chinese people who used them in cricket fights (Suga, 2006). At present, they are the
most abundant cricket species in pet stores, supplied as fish baits or supplementary feed
for ornamental fish and reptiles due to their high nutritional value. However,
entomologists have reported that Acheta domesticus is susceptible to the cricket
paralysis virus called Acheta domesticus Densovirus (AdDNV) which affects major
tissues of the cricket nymph resulting in paralysis and eventual death when they enter
adult phase (Szelei et al., 2011).
In addition, Mormon cricket has been studied in broiler feed for the past three
decades. This species is widely distributed in western North America particularly in
rangeland areas (Lorch et al., 2005). Ramos-Elorduy (2008) has demonstrated that
Mormon cricket (Anabrus simplex) could replace fishmeal and soybean entirely in
broiler diets without affecting growth. Likewise, prior to that, DeFoliart et al. (1982)
and Nakagaki et al. (1987) also reported significantly better growth in broiler fed
Mormon cricket-based diet than corn diet. To date, studies investigating crickets as
potential fish feed in animal feed is scarce although they can be found to be widespread
globally.
Gryllus testaceus is a species that is abundantly found in China and has been
studied as poultry feedstuff. According to Wang et al. (2004), broiler growth did not
show any adverse effect when up to 15% Gryllus testaceus was partially replaced in the
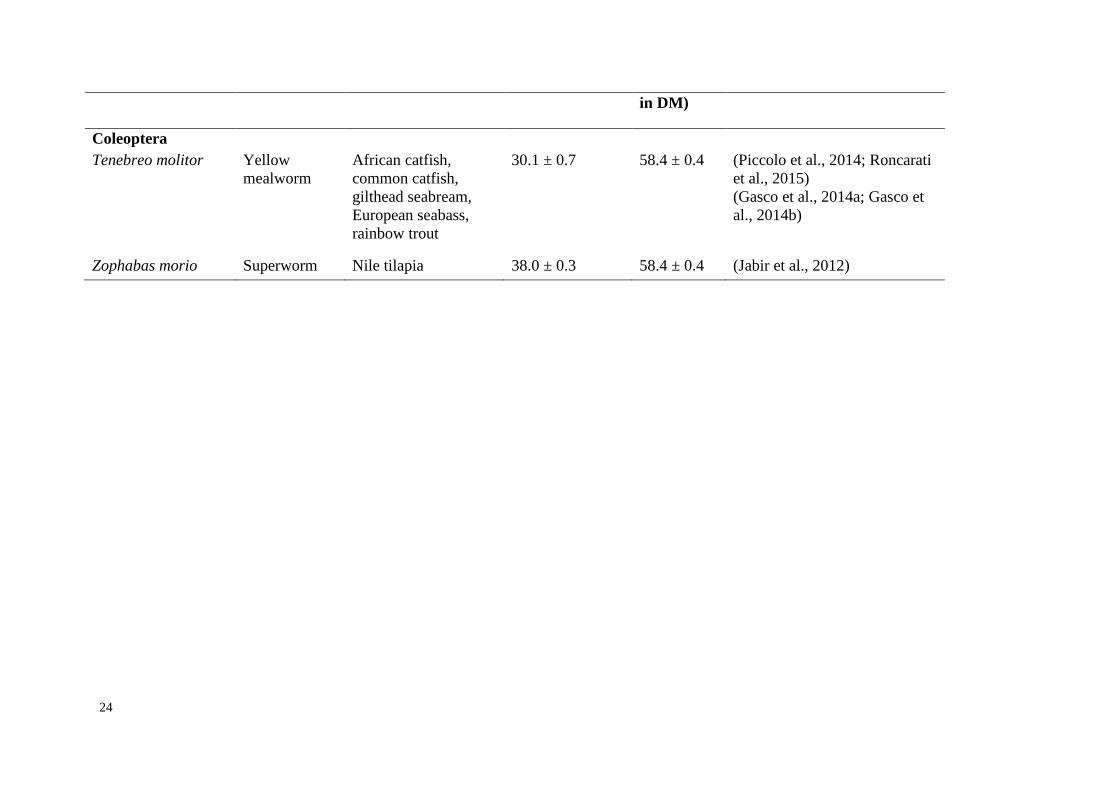
diet. On the other hand, Gryllus bimaculatus or black field cricket (Figure 2.2) is
commonly distributed in a wide variety of environmental condition. They can tolerate a
Page 42
26
wide range of diets, making them a hardy species and is well known for the chirping
noise from the males to attract females.
Figure 2.2: Black field cricket (Gryllus bimaculatus)
2.8 Digestibility of feed by fish
Digestibility value is an important factor in measuring the degree to which
the nutrients from the ingested food, which can be digested by the fish. It also provides
balance ingredients for the formulation of the diet. Feeding approaches, method for
collecting faeces, diet formulation and digestibility measurement are the essential
elements in determining digestive value of nutrients in any ingredients (Glencross et al.,
2007). Hepher (1988) disclosed the three main factors that influence the digestion
process in fish. The first factor is food ingested by the fish and the level to which it is
affected by the effect of digestive enzymes. Second factor is the activity of the digestive
enzyme and the third is duration of the feed susceptible to the action of digestive
enzymes.
Page 43
27
2.8.1 Methods used for evaluating digestion in fish
2.8.1.1 Direct method
A direct estimation method involved measuring all of the nutrients
consumed and all excreted in faeces. This method has an advantage of high accuracy
but care must be taken when collecting the faeces to prevent any leaching of nutrients
into the water. Besides, fish are more prone to stress because the faeces are collected by
stripping and this will affect the digestive and metabolic process leading to unreliable
estimates of digestible value (Lovell, 1989; NRC, 2011).
This technique relies on quantitative measurement of ingested (feed) and egested
(faeces) material by using this equation:
𝐷% =(𝐼 – 𝐸)
𝐼× 100
Where D% = % of apparent digestibility
I = Amount of nutrient ingested
E = Amount of nutrient egested
2.8.1.2 Indirect method
The indirect method involves the collection of faecal sample that is
unaffected by feed materials and the use of indigestible marker for the assessment of
digestibility (NRC, 2011). This method is frequently used by fish producers to evaluate
digestibility for most fish species. The indigestible marker is commonly included in the
feed at low concentration or it could be one of the feed components. Typical marker
used in fish feed that is non-toxic are chromic oxide (Cr2O3), yttrium oxide (Y2O3) and
titanium dioxide (TiO2) (NRC, 2011).
Page 44
28
The amount of feed and faeces marker is presumed to remain constant
during the experimental period and the indigested marker will appear in the faeces
excreted by the fish. The ratio of the marker in the feed and faeces determines the
digestibility of diet and energy. The indirect method is less stressful to the fish as the
faecal matters were collected in holding or rearing tank environment (Bureau & Cho,
1999).
2.8.2 Protein and amino acid digestibility
An extensive amount of research has been directed to estimate the
digestibility of protein in many ingredients in animal and plant feedstuff. McGoogan
and Reigh (1996) stated that protein digestibility is excellent in high dietary protein (>
60%) and low fiber (< 2%) content. The digestion coefficient for crude protein for high
protein feedstuff in channel catfish is in the range of 75% to 95% (NRC, 1993). Protein
digestibility of ingredients such as poultry offal meal, feather meal, blood meal and
gluten meal is comparable to fishmeal ranging in between 85 - 99% apparent digestion
coefficient (ADC) (Allan et al., 2000).
Shahzad et al. (2006) reported that crude protein ADC in plant ingredients (corn
and wheat) is higher than animal ingredients (feather meal) when tested in Labeo rohita.
However, the ADC of animal and plant origin in catfish are similar as reported by
Fagbenro (1996). Pantazis and Neofitou (2004) recorded protein digestibility (70 –
86.6%) for fingerling African catfish weighing approximately 21 g fed with diets
consisting the mixture of algal and blood meal.
Silkworm meal has been proposed to be a suitable replacement for fishmeal
in Clarias batrachus diet. Crude protein digestibility of silkworm pupae meal was
found to be comparable to fishmeal (Borthakur & Sarma, 1998). However, reduced
Page 45
29
growth was observed when fishmeal was totally replaced by grasshopper in both
African and walking catfish, which, could be attributed to low protein and lipid
digestibility (Alegbeleye et al., 2012; Johri et al., 2011).
2.8.3 Lipid digestibility
Lipid is a source of energy that is almost digestible by fish due to the
presence of 2.25 times higher energy compared to carbohydrate (Robinson & Li, 2007).
Hossain et al. (1992) suggested that water temperature and dietary lipid are the factors
that stimulate the lipid digestibility value. Increasing ratio of saturated fatty acid will
negatively influence lipid digestibility in warmwater and coldwater fish species (NRC,
2011).
A range of 76 – 97% of lipid ADC has been reported for channel catfish fed
various sources of fat and approximately 83 – 88% of lipid ADC was observed in
African catfish fed cooked sesame-based diet (Jimoh et al., 2014). In Rohu, lipid
digestibility did not show much difference in the results for animal and plant diet, which
was similarly reported in African catfish (Hossain et al., 1997; Mohanta et al., 2006).
Lipid utilization is species-specific. This can be observed in turbot whereby
growth performance and lipid ADC was reduced as dietary lipid increased up to 15%.
Nevertheless, a different outcome surfaced in trout and Atlantic salmon fed with higher
than 30% lipid, where positive growth and high lipid ADC were observed (Guillaume,
2001).
2.8.4 Carbohydrate digestibility
Starch is the most abundant and least expensive non-protein energy source
available in catfish diet. Studies have proven that freshwater warmwater fish were able
Page 46
30
to digest higher level of carbohydrates than the coldwater or marine fish due to the
increasing level of intestinal amylase activity in warmwater fish species (Stone, 2003).
An experiment conducted by Cho and Slinger (1979) has proven that channel catfish
has the capability to digest up to 65% uncooked starch compared with rainbow trout
which only tolerated less than 50% uncooked starch. Wilson and Poe (1985) suggested
that cooked corn starch was beneficial for channel catfish as it is 38% more digestible
than corn prepared using pellet mill.
It appears that starches are not as digestible as lipid in channel catfish.
Increased dietary carbohydrate will reduce carbohydrate digestibility. Grains including
corn, rice bran and wheat grain are the most utilized source of carbohydrates, which
contribute to a carbohydrate digestibility ranging from 60 to 70 percent in channel
catfish (Cruz, 1975).
Starch digestibility varies according to species and eating habits. Some fish such
as Atlantic halibut cannot tolerate high level of starch, hence reduce carbohydrate
digestibility from 84% to 53% with increasing dietary carbohydrate inclusion from 8%
to 17% (Grisdale-Helland & Helland, 1998). Krogdahl et al. (2005) stated that
herbivorous fish could digest non-starch carbohydrates as opposed to carnivorous fish
owing to the presence of sufficient gut microbiota.
2.9 Nutritional strategies in maintaining health
The importance of nutrition playing a main role in preventing hazardous
health effects on human and other animals including fish has been long established over
the years. The past three decades has seen increasing interest in studying the connection
between nutrition, immune response and disease resistance in fish (Lim & Webster,
2001). Due to the initial lack of understanding on the immune system of fish, initially,
Page 47
31
very little success was achieved in fish nutrition research. However, in some studies,
there are evidence that could relate the connection of dietary nutrition to immune
function and disease resistance. In addition, the appearances of immunostimulants,
nutrient bioavailability and interactions as well as feeding regulation are also important
factors that could affect fish health (Lim & Webster, 2001).
The growing production of commercial aquaculture from a high demanding
market has also resulted in increasing casualty due to infectious diseases. This is one of
the major issues associated with economic loss in aquaculture industry (Barman et al.,
2013; Lovell, 1996). Primarily, the method of combating disease was focused on
treatments whereby antibiotic-resistance strains of bacteria were used for the infected
fish. However, problems arise when the administration of antibiotics were not carried
out in a proper way. The infected fish did not consume the medicated feed during the
period of their illness, hence a proper dose is not well administered. Besides, the use of
chemotherapeutics is costly for use in ponds and excessive usage will contaminate the
environment (Anderson, 1992).
For this reason, scientists have promoted preventive measures rather than
treatments to preserve animal health and disease resistance (Ogier de Baulny et al.,
1996). The development of vaccines have shown positive result for some fish species
but due to its high cost, it is not an effective solution since there are many other
commercial diseases in the aquaculture industry (Raa et al., 1992). Therefore, other
methods such as the establishment of immunostimulants through modification of the
diet and feeding system was introduced (Jadhav et al., 2006; Sakai, 1999).
Page 48
32
2.9.1 Health control of African catfish
The earliest work on African catfish health control have been evaluated by
numerous researchers since 1987 through Huisman and Richter (1987) and Boon et al.
(1987). During the early years major infestation by protozoan and metazoan such as
Costia, Chilodonella and Dactylogyrus are commonly found in African catfish cultured
in tropical pond. Treatments by organic phosphate esters (Bromex, Dipterex and
Masoten) (Viveen et al., 2013) are normally applied through the fish to control the
spreading of the infections. However, in cultured hatchery condition, antibiotics such as
chloramphenicol and oxytetracycline are commonly supplied in the diets as curative
agents. Those infections are predominantly associated with environmental changes such
as temperature, water quality and fish handling.
Another symptom that could be destructive to fingerlings African catfish is
Ruptured Intestine Syndrome (Boon et al., 1987) or open belly disease where it affected
the fingerlings during 5 to 8 weeks post-hatch when given at high feeding level. The
disease would cause ruptures in the caudal part of intestinal part and consequently lead
to mortality. Besides, other disease such as broken head disease is frequently observed
in broodfish kept in high-density tank. It will lead to inflammation of skull due to lateral
skull break. The high waste production from feed due to low appetite of fish was the
main cause for the outbreak of this disease (Huisman & Richter, 1987).
2.9.1 Immunostimulant in fish diet
Immunostimulant is a favorable non-nutritive dietary supplement that could
enhance disease control in fish by increasing innate immune response against
pathogenic bacteria (Jadhav et al., 2006; Lim & Webster, 2001). In comparison to
Page 49
33
mammals, fish is more dependable towards nonspecific defense mechanisms, in which
immunostimulant plays a major role in managing the health strategies of fish (Barman
et al., 2013). Beta glucans (β-Glucan), levamisole, peptidoglycan, chitin, chitosan yeast
and vitamins are among the most studied products and have proven to be effective as an
immunostimulant in fish (Dautremepuits et al., 2004b; Kawakami et al., 1998; Villamil
et al., 2003). They can be applied to the fish through injection, bathing and orally of
which the latter method is the most practical and commonly used (Philip et al., 2001).
Dalmo et al. (1996) highlighted that diet with inclusion level of 50 - 200μg/ml β-
Glucan increased survival of Atlantic salmon following challenge with Vibrio
anguillarum and Vibrio salmonicida. A similar result was observed in gilthead sea
bream with oral administration of 500mg/kg β-Glucan while fish fed with levamisole
increased phagocytosis, respiratory burst, lymphokine production and complement
activation (Mulero et al., 1998). The use of levamisole; an antihelminthic chemical
compound in fish as possible modulator to enhance nonspecific immune activity and
resistance towards pathogenic bacteria has also been positively observed in carp and
rainbow trout (Findlay et al., 2000; Gannam & Schrock, 1999; Siwicki, 1990).
Chitin is one of the most abundant biopolymer mostly found in the shells of
crustacean, insect’s cuticle and cell wall of fungi. Chitosan is the deacetylated product
derived from chitin (Knorr, 1984). Both polymers have proven to have significant effect
in boosting immune response for some fish species. According to Vahedi and
Ghodratizadeh (2011), administration of 10 – 50 mg/kg chitin in rainbow trout diet
enhanced their immune system. It could also increase respiratory burst, phagocytic and
cytotoxic activity in gilthead sea bream (Esteban et al., 2001). Chitosan has been
utilized as an immunostimulant in rainbow trout, brook trout and gilthead sea bream to
Page 50
34
protect them against pathogenic bacteria and improve nonspecific immunity (Anderson
& Siwicki, 1994; Cuesta et al., 2003; Siwicki et al., 1994).
2.9.2 Pathogenicity of Aeromonas hydrophila fed immunostimulant diet in fish.
Motile aeromonad septicemia (MAS) is a disease commonly infecting
warmwater freshwater fish species and also could occur in brackish water. Aeromonas
hydrophila; a gram-negative bacteria is one of the three species besides Aeromonas
sobria and Aeromonas caviae, that are associated with MAS (Lim & Webster, 2001).
These organisms, which are well known as facultative opportunists, normally infect fish
that are exposed to the environmental stressor, other parasitic infection, skin injury and
even stress during transport or handling. Pathologic conditions associated with
Aeromonas hydrophila include dermal ulceration, hemorrhagic septicaemia, fin rot
disease and scale protrusion disease (Cipriano et al., 1984).
Numerous studies on immunostimulant feed supplement in plant extract, animal
origin and other biological substances have been recorded over the years. Dietary intake
of chitosan has shown the highest level of survival in common carp compared to
levamisole and chitin when challenged with Aeromonas hydrophila (Gopalakannan &
Venkatesan, 2006). The same effect was observed in rainbow trout with the
supplementation of diets containing chitosan-oligosaccharides (Lin et al., 2009).
Many studies have been done to investigate the use of plant as immunostimulant.
The incorporation of medicinal plants, Ficus benghalensis and Leucanea leucocephala
in African catfish diet has proven to have antibacterial activity against Aeromonas
hydrophila (Verma et al., 2013). Inclusion of fucoidan in the diets of African catfish has
proven to enhance humoral and cellular immunity as well as increasing the resistance
against pathogenic bacteria under the condition of heavy metal pollution (El-Boshy et
Page 51
35
al., 2014). Barros et al. (2002) has demonstrated that supplementation of soybean meal
with 203 - 283 mg /kg of iron is sufficient to maintain normal immune response and
enhance protection against Edwardsiella ictaluri bacteria in Channel catfish
However, very few studies on immunostimulant have been done by using animal
source of diets. Animal extracts such as tunicate has demonstrated to be efficient in
improving survival rates and increasing phagocytosis level of eel following injection
with Aeromonas hydrophila (Davis & Hayasaka, 1984).
2.10 Oxidative stress biomarkers and antioxidant activity in fish
A living organism is susceptible to a wide variety of stress when in contact
with diverse environmental condition. The presence of stress in environmental
conditions will normally activate reactive oxygen species (ROS), generally initiating as
side products of tissue respiration. Continuous exposure to stressful states will
subsequently elevate the ROS-mediated oxidative damage (Stoliar & Lushchak, 2012).
Lushchak (2011) has proposed that oxidative stress occurs when increased ROS
concentration disturbs the cellular metabolism as well as its regulation, and
continuously impairs the cellular components.
The trigger of oxidative expression could cause antioxidant response leading to
the expression of genes encoding antioxidant enzymes and rising of ROS scavengers
(Stoliar & Lushchak, 2012). Despite that, in some situation, level of ROS exceeds that
of their depletion causing oxidative stress (Halliwell & Gutteridge, 1999; Livingstone,
2001). Starvation has been described as one of the factors that are responsible for the
increasing ROS generation in animal due to unaccustomed feed leading to food
deprivation (Domenicali et al., 2001). It appears that there are several antioxidants that
play significant roles in modulating antioxidant defense in animals. The antioxidant
Page 52
36
enzymes such as superoxide dismutase, catalase and glutathione S-transferase are
amongst the enzymes that are important in protecting the living organism from ROS
through their defense mechanism.
2.10.1 Catalase
Catalase (CAT) enzyme commonly found in peroxisome, is responsible for
catalyzing the decomposition of hydrogen peroxide (H2O2), producing water and
molecular oxygen in addition to defending cell against oxidative damage (Sun, 1990).
In the mitochondria particularly in the liver of rat, catalase activities were reported to
decrease with increasing age (Tiana et al., 1998). To date, studies related to
antioxidative enzymes in fish nutrition are still lacking especially in determining CAT
activities.
Ogunji et al. (2011) reported an elevated level of CAT activities in the liver of
carp fed with maggot meal. This is attributable to the high lipid content in maggot meal
and also correlated with higher growth rates and good feed efficiency. This is consistent
with the result found by Rueda-Jasso et al. (2004) in which they found that high dietary
lipid resulted in increasing CAT activities. On the other hand, moderate increases in
CAT activities were reported in starved dentex liver (Morales et al., 2004) but no
significant effects were found in rainbow trout (Hidalgo et al., 2002). Nevertheless,
starvation studies on sea bream shows that CAT activities decreases on partial food
restriction and fasting fish (Pascual et al., 2003).
2.10.2 Superoxide dismutase
It is well established that superoxide dismutase (SOD) rapidly converts
superoxide anion (O2−) into less harmful H2O2, and later catalyzed by CAT and
Page 53
37
Glutathione peroxidase (GPx) into water and oxygen. According to Camougrand and
Rigoulet (2001), increasing mitochondrial oxygen consumption enhanced the
production of O2−. Hence, it is considered as one of the most responsive enzymes for
acknowledging oxidative stress in animals (Winston & Di Giulio, 1991). Superoxide
dismutase activities in rat liver is comparable to that of CAT whereby decreasing levels
were found in aging rats (Tiana et al., 1998).
The activity of many antioxidant enzymes including CAT and SOD is
influenced by the presence of copper in the diet. Copper deficiency in the diet will lead
to a decline in SOD and cytochrome oxidase activity resulting in the formation of
cataract in fish (Guillaume, 2001). Shao et al. (2014) observed higher levels of CAT and
SOD in black sea bream fed on high levels of soybean and protein concentrate diet than
the control diet. Furthermore, studies with gibel carp fed with selenium supplement has
shown to decrease the amount of serum SOD (Han et al., 2011).
2.10.3 Glutathione S- transferase
Glutathione S-transferase (GST) plays a crucial role in detoxifying
endogenous toxic metabolites and many environmental contaminants together with
tripeptide glutathione (GSH). Additionally, it also functions in phase II lipid peroxidase
detoxification (Leaver et al., 1993; Nimmo, 1987). It is important as a protection for
living organisms against peroxidative damage and useful in detoxification of toxics such
as pesticides, oil and other hydrocarbons (Fisher & Burggren, 2007).
Fish has been commonly used in monitoring the biomarker of water and
contaminant due to their sensitivity towards polluted environment (Amado et al., 2006a;
Amado et al., 2006b). Ogunji et al. (2007) reported that the utilization of maggot meal
in tilapia and common carp did not show any significant changes in GST activities
Page 54
38
corresponding to fishmeal fed fish suggesting that maggot meal did not contain any
compound that could stimulate the generation of ROS. In order to ensure that the feed
materials given to the fish do not contain any harmful substances, studies in determining
GST activities in nutritional analysis is essential.
2.10.4 Studies on oxidative stress in catfish
Numerous studies have attempted to investigate oxidative stress in catfish
species. Considerable amount of studies primarily concentrated on the effect of feed
additive to enhance antioxidant enzyme have been studied extensively. Several feed
additives such as Quercetin has shown to increase antioxidant status in silver catfish due
to the presence of flavonoid which contain antioxidant properties and prevent lipid
peroxidation (Pês et al., 2016). Furthermore, the inclusion of 0.3 g per kg of organic
selenium in environmental copper toxicity could increase hepatic Glutathione
peroxidase (GPX) thereby protecting cell membranes against oxidative damage in
African catfish (Abdel-Tawwab et al., 2007).
Besides feed, studies on environmental contaminant by looking at the oxidative
stress and antioxidant defense enzymes in African catfish have also attracted much
attention. Studies by Ibrahim and Harabawy (2014) examined the impact of carbofuran
in Clarias gariepinus and reported the disturbance in antioxidant defense system. The
result shows that exposure to carbofuran induced significant decrease in antioxidant
enzyme (CAT, SOD, GST and GPX) in African catfish organs.
Page 55
39
CHAPTER 3: GROWTH PERFORMANCES AND AMINO ACID ANALYSIS
OF AFRICAN CATFISH FED VARYING LEVELS OF CRICKET MEAL
DIETS.
3.1 Introduction
The increasing world population boosted the demand for protein sources which
had inevitably impacted the aquaculture industry to produce high-yielding fish with
lower cost. Fish feed constitutes 80% of operating cost in aquaculture whereby protein
is the limiting factor that influences the market price of fish feed (Shepherd & Jackson,
2013; Tacon et al., 2011).
Simultaneously, as aquaculture industry has been considered as the fastest-
growing industry in the animal food sector (FAO, 2014), studies on sustainable
resources to expand this industry are essential. Apart from the aquaculture sector,
terrestrial animal production is also a major consumer of fishmeal (Mallison, 2013),
which led to its high cost of production due to declining amount of wild-caught fish
available in its production process.
Insects meal particularly crickets can be used successfully as sustainable sources
for animal feeds, while they are readily available around the world. Since there is a
dearth of information on cricket meal as feed resources for fish, this study aims to
experimentally investigate the effect of varying level of cricket meal (CM) as fishmeal
(FM) replacement in African catfish diet on their growth performances, feed utilization,
body composition and survival rate.
Page 56
40
3.2 Literature review
The use of other sustainable sources as alternatives to FM in relation to the
production of formulated feed has reduced the dependency on FM. Due to the high price
of FM and increasing demand from aquaculture production has led to the establishment
of research in insect protein for aquaculture and livestock (Barroso et al., 2014; Henry
et al., 2015). Insect meal such as grasshopper meal (Ojewola et al., 2005), termites meal
(Fadiyimu et al., 2003), superworm meal (Jabir et al., 2012) and maggot meal as well as
molluscs such as garden snail, and plants feedstuff (Francis et al., 2001) have been
identified as successful alternatives for FM replacement.
Crickets have been commonly used as complementary food source for
ornamental fish, reptiles as well as in poultry industry. Previous studies have reported
that field crickets gave a promising result as a soybean replacement in broiler diet
(Ramos-Elorduy et al., 2002). Although these investigations reported interesting results
in the poultry industry, no attempt was done to explore the potential of crickets as
formulated diet for fish.
Nevertheless, there are some trials that have already been done using Orthoptera
insects in fish feeding. According to Alegbeleye et al. (2012), 13% dietary inclusion of
variegated grasshopper could improve growth performances of catfish. However, total
replacement of grasshopper meal from fishmeal reduced growth of African and walking
catfish (Alegbeleye et al., 2012; Johri et al., 2011). Other insects that have been tested
in catfish are mealworm which could substitute up to 40% of fishmeal (Ng et al., 2001)
while maggot meal were able to replace 75 -100% of fishmeal in African catfish diet
without affecting their nutrient efficiency (Fasakin et al., 2003; Madu & Ufodike, 2004)
Cricket can be found in abundance in the tropics, easily cultured and mass harvested in
Page 57
41
controlled environments with the benefit of low cost of production, therefore, it can be a
suitable candidate for alternative protein resources for animal diet.
African catfish is regarded as one of the most cultivated and popular freshwater
fish in Malaysia and is increasing in demand by the growing local market. Thus, many
researches have highlighted the study on different aspects of this particular fish in order
to enhance its growth and increase productivity.
3.3 Material and method
3.3.1 Experimental diet
Adult live field crickets (Gryllus bimaculatus) used in the formulated diet were
purchased from a local field crickets farm. The crickets were fed chicken feed in the
form of mash throughout their life cycle. They were then transported to the laboratory
and refrigerated at -20°C before being dried in an oven at 60°C. The dried crickets were
then grounded with dry feed grinder and kept in a cold room (4°C) prior to proximate
analysis. All the raw materials for the ingredients including fishmeal, corn meal, rice
bran, soybean, vitamins, mineral and Di calcium Phosphate (DCP) were purchased from
a local livestock feed center.
Formulation and chemical composition of all the experimental diets and
feed ingredients were tabulated in Table 1. Various inclusion percentage of CM were
formulated as 0% (control), 25%, 50%, 75% and 100% inclusion level to yield an
isonitrogenous content of 28% crude protein dry matter and isoenergetic content with
approximately ±19 kJ/g. Winfeed 2.8 version software was used to formulate the feed.
All dry ingredients were grounded in a hammer mill (Disk Mill, FFC 454). Vitamins,
minerals and DCP were mixed thoroughly with the dry ingredients and water was added
to the mixture prior to being pelleted into sizes of 1mm diameter using a mini pelleting
Page 58
42
machine (KCM, Y132M-4). The wet pellets were then dried in an oven at 70°C for 24
hours and later stored in a cold room (4°C) until used for feeding.
3.3.2 Experimental Fish and set-up
African catfish were purchased from local farmers and transported to the
Freshwater Aquarium Laboratory located in the Institute of Biological Sciences, Faculty
of Science, University of Malaya. Two hundred and twenty five (225) African catfish
fingerlings were randomly divided into five groups, each in triplicates of 15 fishes per
tank with average weight of 4.00 ± 0.8g. All the fishes were acclimatized to natural
environment condition for 2 weeks prior to the feeding trials and fed with a commercial
diet (Dindings) twice per day at 0900h and 1500h during the acclimatization and
throughout the experiment, and uneaten food was collected and dried after feeding to
determine the feed intake. Water quality was monitored regularly and any mortality was
recorded. Fifteen plastic tanks (3’ x 2’ x 1’) with the capacity of 100 liters of water with
closed re-circulation system were used in these feeding activities. The tanks were
equipped with top filter pump at a flow rate of 20 L min-1
and aeration with the air-stone
diffuser was provided in each tank for circulation of dissolved oxygen. Tap water,
which was treated with anti-chlorine, was used and 20-30% of water was replaced once
in two days to maintain water quality.
The feed were given at a rate of 10% of their Body weight (BW) ratio at the
beginning of the feeding trial. The level was adjusted according to the BW after
weighing them once in two weeks and the final feeding rate was at 5% of their BW
ratio. Total feed intake was measured by adding up total feed intake per fish and
deducted by the uneaten feed. The feeding trials were conducted over 56 days. At the
end of the experiment, all fishes were weighed, sacrificed for body composition and
frozen at -20°C for further analysis
Page 59
43
The water qualities for all tanks were measured according to the method of
American Public Health Association, 1992. Water temperature was maintained at 28-
29°C, pH at 6.0-6.8 and dissolved oxygen (DO) above 5.0 mg/L. Ammonia and nitrate
were determined weekly and the levels were maintained below 0.8 mg/ml and 1.9
mg/ml respectively (Marion, 1998).
3.3.3 Proximate and chemical analysis of diets and body composition
The experimental diets, ingredients and body composition were analysed for
proximate composition according to Association of Official Analytical Chemist method
(AOAC, 2003)
3.3.3.1 Crude protein
Kjeldahl method was used to analyse crude protein after acid digestion.
Briefly, 150 mg of sample were weighed into Kjeldahl digestion tube and 1 tablet of
100 mg Selenium Kjeltabs Catalyst and 6 ml concentrated sulphuric acid were added.
The tubes were digested in FOSS Tecator Digestor Auto at 420°C for 1 hour. Then,
they were left to cool down for 15 minutes before beginning the distillation process. An
80 ml of de-ionized water and 50 ml of sodium hydroxide were added to each digestion
tube, mixed thoroughly and distilled with 25 ml of 4% boric acid and titration indicator
by using Kjeltec semi auto analyser. For the titration indicator, 100 mg bromocresol
green were dissolved in 100 ml methanol before adding with 70 ml methyl red solution
in 100 ml methanol. About 7 to 8 drops of bromocresol green + methyl red indicator
were added to the conical flask beaker containing boric acid. Finally, 0.01 M
hydrochloric acid was used to titrate the distillation product in the conical flask and the
titration values were recorded. All samples and blanks were analysed in triplicates.
Page 60
44
The protein content of the samples and blanks were calculated as:
% Nitrogen = (𝑆−𝐵)(𝑁)(14.007)×100
(𝐵)×1000
% Protein = (%𝑁𝑖𝑡𝑟𝑜𝑔𝑒𝑛) × (6.25)
Where S = Titrate of HCl (ml)
B = sample / blank (g)
N = HCl molar (0.0994)
3.3.3.2 Crude lipid
Soxhlet method with petroleum ether extraction (FOSS Soxtec 2055) was used to
measure crude lipid content of diets and fish body composition. Briefly, the extraction
cups were weighed after drying in an oven. Then, 2 g of samples were weighed and
added into the cellulose thimble while the extraction cups were filled with 80 ml
petroleum ether. Both thimbles and extraction cups were placed in the Foss Tecator
Extraction Unit and the extraction process was performed for 1 hour. Subsequently, the
extraction cups were dried in an oven with 120°C for 2 hours and later cooled off in a
desiccator before weighing. The samples in the thimbles were kept in dry environment
to be used in crude fiber analysis. All samples were analyzed in triplicates.
The lipid content of the samples were calculated as:
% Lipid = (W3-W2)
W1´100
Where W1 = weight of sample (g)
W2 = weight of extraction cup initial (g)
W3 = weight of extraction cup final (g)
Page 61
45
3.3.3.3 Dry matter
Empty dried crucibles were weighed and approximately 4 g of samples were
placed in the crucibles. The weight for both crucible with samples were recorded prior
to drying in the oven at 105°C for 24 hours to a constant weight. Then, the crucibles
were cooled off in a desiccator before reweighing to obtain the final weight.
The dry matter content of the samples was calculated as:
Dry matter = (W3-W1)
(W2 -W1)´100
Where W1 = Weight of empty crucible
W2 = Weight of crucible + sample
W3 = Weight of crucible + sample after drying in 105°C
3.3.3.4 Ash
The ash content of diets and body composition was determined by drying the
samples used in the dry matter determination in muffle furnace (Naberthem) at 600°C
overnight. Then, the samples were cooled in a desiccator before reweighing to
determine the ash content.
The ash content was calculated as:
Ash % = (W4 -W1)
(W3-W1)´100
Where W1 = Weight of empty crucible
W3 = Weight of crucible + sample after drying in 105°C
W4 = Weight of crucible + sample after drying in 600°C
Page 62
46
3.3.3.5 Crude fiber
Crude fiber was determined after an alkali and acid digestion by using defatted
samples from crude lipid extraction analysis. Fiber capsules and the lids were weighed
together. Approximately 50 – 100 mg of samples were weighed, put into the capsules
and the lids secured. Extraction vessel with 350 ml of 1.25% (v/v) sulphuric acid was
placed on a hot plate and heated to boil. The capsule tray with fiber capsules containing
samples was placed in the carousel and put on the stopper to lock the capsules in place.
Extraction carousel was partially lowered into the boiling reagent sufficient to immerse
the samples. Gentle boiling was carried out for 30 minutes and after 5 minutes of
boiling; the carousel was removed from the extraction vessel. The extraction carousel
was washed with boiling water 3 times with fresh hot water each time. Then, the
extraction vessel was filled with 350 ml 1.25% (w/v) sodium hydroxide on the hot plate
and boiled. The same procedures as the sulphuric acid were repeated and the washing
procedures were performed 3 times. Later, the sample were washed once in 1% (v/v)
hydrochloric acid and finally in boiling water. The capsules were dried in an oven at
130°C for 2 hours. They were then cooled off in a desiccator and weighed. The weighed
capsules were placed in pre-weighed and pre-dried crucibles for ashing procedure at
600°C for 4 hours. They were then cooled off in a desiccator before reweighing to
determine the crude fiber content
The crude fiber content was calculated as:
% Crude fiber = W3- (W1´C)- (W5-W4-D)
W2´100
Where W1 = Initial capsule weight (mg)
W2 = Sample weight (mg)
W3 = Capsule + residue weight (mg)
Page 63
47
W4 = Empty ashing crucible (mg)
W5 = Total ash (g)
C = Blank correction for capsule solubility
D = Capsule ash (mg)
3.3.3.6 Gross energy
Gross energy for every diets and body composition was calculated using the
following factors: crude protein = 23.9 kJ/g, crude lipids = 39.8 kJ/g and NFE = 17.6
kJ/g (Schulz et al., 2005).
3.3.3.7 Nitrogen free extract
Nitrogen free extract (NFE) or carbohydrate is calculated as = 100 - (% crude
protein + % crude fat + % crude fiber + % crude ash)
3.3.4 Amino acid analysis
Amino acid profiles were conducted using the High Performance Liquid
Chromatography (HPLC) (JASCO CO-2065 Plus, Intelligent Column Oven) by using
the Pico-Tag method (Heinrikson and Meredith, 1984).
3.3.4.1 Sample preparation
All samples were ground, dried and assayed for crude protein prior to amino
acid analysis. The crude protein of the samples determined the amount of samples used
in the amino acid analysis. The weight of each sample was measured by dividing 4 with
the crude protein content (i.e. crude protein for soybean meal is 39 %, thus 4/39 = 0.10
g of the sample were used for the analysis). The weighed samples were hydrolyzed with
6 N hydrochloric acid and vortexed. Then, they were flushed with nitrogen gas for 1
Page 64
48
minute and dried in an oven at 140°C for 24 hours and cooled off at room temperature.
A 10 ml internal standard, α-amino-N butyric acid (AABA) was added to the samples
and made up with 60 ml de-ionized water. Finally, the samples were filtered and kept in
-20°C for further analysis. The internal standard was prepared by dissolving 0.2578 g
AABA and made up to 1 L of 0.1 N hydrochloric acid.
3.3.4.2 Drying and derivatization procedure
Hydrolysis samples were filtered with 0.20 μm cellulose nitrate membrane
filter and 10 μl of the samples were placed in a vial. The redrying agent was prepared,
which consisted of methanol, water and triethylamine (2:2:1 v/v) and derivatization
reagent, which was composed of methanol, triethylamine, water and
phenylisothiocyanate (PITC) (7:1:1:1 v/v).
Hydrochloric acid from the samples was removed by vacuum and dried at
room temperature for 30 minutes. The samples were then vacuumed with 20 μl redrying
agents and later derivatization reagent was added to the mixture and vortexed before
being left at room temperature for 20 minutes. The samples were then re-vacuumed
again for 30 minutes to ensure the reagents are completely dried at this stage.
3.3.4.3 Chromatographic procedures
Separation of PITC derivatives occurred in high performance liquid
chromatography (HPLC). The column used is from Agilent Technologies. The mobile
phase consisted of two eluants labeled as A and B. Solvent A is composed of 0.1 M
ammonium acetate while solvent B consisted of 440 ml solvent A mixed with 460 ml
acetonitrile and 100 ml methanol. Both eluants were filtered, degassed and kept under
room temperature. The samples and standard were mixed with 100 μl of solvent A and
vortexed for 15 minutes before being injected into the HPLC machine. The amino acid
Page 65
49
contents of the samples were determined by comparison of peak retention times to the
known standard.
3.3.5 Tryptophan determination
Tryptophan from the samples was hydrolyzed by using alkaline, which is
Lithium hydroxide (LiOH. H2O), 4.3 N and determined by using fluorescence detector
using excitation and emission wavelength given. Briefly, tryptophan standard was
prepared by weighing 0.05 g of tryptophan into 50 ml volumetric flask. Hydrochloric
acid (0.1 N) was added into the flask and placed into ultra-sonicator to dissolve the
salute. A total of 50 ml of distilled water was added to the solution to make a 1000
μg/ml tryptophan concentration. Then, 50 μl of the solution was added to 10 ml mobile
phase to make 50 μg/ml. Tryptophan standard of 10 μL was injected into HPLC system.
Lithium hydroxide was prepared by dissolving 36.09 g of LiOH. H2O in 200 ml
distilled water to measure up to 10 samples. Samples were prepared by adding 0.2 g of
samples and 15 ml of LiOH. H2O together into a screw-capped tube. The solution was
flush with liquid nitrogen and heated at 120°C for 16 hours. The hydrolysate was
transferred into a beaker and 9 ml of 6 N HCl with distilled water was added to make a
total volume of less than 100 ml. The pH was adjusted to 4.5 by using HCl and dilute to
100 ml with water into a volumetric flask. The reagent was then filtered through filter
paper and finally small aliquot was filtrated through a syringe filter (0.2 μm cellulose
acetate membrane) before 10 μL of the samples were injected into the HPLC system.
Page 66
50
3.3.6 Analysis of experimental data
From the experimental data obtained, specific growth rate (SGR), feed conversion
ratio (FCR), body weight gain (BWG), protein efficiency ratio (PER), total feed intake
(TFI) and survival rate (SR) were calculated as follows:
1) Body weight gain = final weight – initial weight
2) FCR = food fed / live weight gain
3) SGR =(ln final weight of fish – ln initial weight of fish / time of experiment)
4) PER = live weight gain (g) / protein fed (g)
5) TFI = Average of total feed intake per fish (g)
6) SR (%) = (final number of fish / initial number of fish) × 100
All calculations were measured according to triplicates tanks treatments.
3.3.7 Statistical analysis
All data were subjected to one-way analysis of variance (ANOVA) using
SPSS version 21.0 (SPSS Inc., Chicago IL, USA). The differences between means were
compared by Duncan’s post hoc test at 5% (P < 0.05) probability level. Data are
presented as means ± standard error of mean (SEM).
Page 67
51
3.4 Results
The inclusion level of CM (0%, 25%, 50%, 75%, 100%) in the diets with
isonitrogenous crude protein (28%) and chemical composition of the experimental diets
are shown in Table 3.1. The fishmeal and cricket meal were formulated according to the
percentage inclusion level of the diets and their nutrient compositions are shown in
Table 3.2. However, soybean, rice bran and corn meal were changed and evaluated to
make sure the overall composition were the same amongst all the diets. The results of
the present study clearly indicated that growth performances of African catfish
fingerlings were affected by the different experimental diets of CM. Daily water
temperature, pH and DO for every tank were observed and maintained to the standard
requirement. Generally, there were no significant difference between treatments and
remained in the suitable range for African catfish growth indicating that the
experimental diets did not affect water quality of the fish.
Page 68
52
Table 3.1: Formulation (g kg-1
) and nutritional profile (%) of experimental diets
Replacement (%)
Ingredients (g kg-1
) (0%) (25%) (50%) (75%) (100%)
Fishmeal 300.0 225.0 150.0 75.0 0.0
Cricket meal 0 75.0 150.0 225.0 300.0
Soybean meal 58.6 9.8 19.2 33.3 96.2
Corn starch 324.6 142.4 146.6 165.9 341.7
Rice bran 301.8 532.8 519.1 485.8 247.1
Vitamin premix1 2.0 2.0 2.0 2.0 2.0
Mineral premix2 3.0 3.0 3.0 3.0 3.0
DCP 10 10.0 10.0 10.0 10.0
Total 1000 1000 1000 1000 1000
Nutrient level determined by as is basis (% Dry matter basis)
Dry matter 94.36 94.42 94.06 93.26 93.14
Crude protein 28.0 28.00 27.50 27.70 27.90
Crude fat 8.43a 8.51
a 9.71
b 9.42
b 9.45
b
Crude ash 9.00b 8.55
ab 8.24
ab 7.42
a 7.55
a
Crude fiber 1.36a 1.86
a 2.90
ab 3.15
b 3.24
c
Gross Energy3 18.42 18.44 18.48 18.39 18.35
NFE4 47.57
b 47.50
b 45.71
ab 45.57
ab 45.00
a
Page 69
53
Table 3.1 continued
1The vitamin premix supplied the following per 100 g diet: Vitamin A, 500 IU; Vitamin
D3, 100 IU; Vitamin E, 0.75 mg; Vitamin K, 0.02 mg; Vitamin B1, 1.0 mg; Vitamin
B2, 0.5 mg; Vitamin B3, 0.3 mg; Vitamin B6, 0.2 mg; Vitamin B12, 0.001 mg; Vitamin
C, 0.1 mg; Niacin, 0.2 mg; Folic Acid, 0.1 mg; Biotin, 0.235 mg; Pantothenic acid, 1.0
mg, Inositol, 2.5 mg
2The mineral premix supplied the following per kg diet: Selenium, 0.2 mg; Iron, 8 mg;
Manganese 1.0 mg; Zinc, 8.0 mg; Copper, 0.15 mg; Potassium Chloride, 0.4 mg;
Magnesium Oxide, 0.6 mg; Sodium Bicarbonate, 1.5 mg; Iodine, 1.0 mg; Cobalt, 0.25
mg.
3Gross Energy was calculated as 23.9, 39.8, 17.6 kJ/g for protein, fat and NFE
respectively (Schulz et al., 2005).
4NFE= 100- (% crude protein + % crude lipid + % crude ash+ % crude fiber).
Page 70
54
Table 3.2: Chemical composition of fishmeal, cricket meal and soybean meal used
in the trial diet
Component Fishmeal Cricket meal Soybean meal
Dry matter (%) 85.59 95.18 90.01
Crude protein % 53.61 57.02 39.34
Crude lipid (%) 2.69 13.90 2.23
Crude ash (%) 19.30 4.83 7.25
Crude fiber (%) 4.64 9.21 2.80
Page 71
55
Ten amino acids, (methionine, arginine, threonine, tryptophan, histidine,
isoleucine, lysine, leucine, valine and phenylalanine) are not synthesised in fish,
therefore, need to be supplied in their feeding materials (NRC, 1993). All compounds of
essential amino acids (EAA) were present in experimental diets (Table 3.3). The values
of amino acid in the diets containing CM were equal or slightly higher compared to the
control (0%) which can be considered negligible. All Essential amino acid (EAA) tested
in this study were compared with the EAA requirements for catfish as reported by
Jimoh et al, (2014) and Fagbenro & Nwanna, (1999).
The amino acid profiles for fishmeal and cricket meal are shown in Table
3.3. Compared to fishmeal, the cricket meal is relatively rich in limiting amino acid;
methionine, lysine and cysteine as well as greater in histidine and tyrosine. On the other
hand, fishmeal is comparatively higher in threonine, valine, isoleucine and leucine.
Page 72
Table 3.3: Essential amino acid (EAA) and non-essential amino acid (NEAA) composition of fishmeal, cricket meal (Gryllus bimaculatus) and
practical diets used in this study (g 100g-1
crude protein)
Fishmeal
Cricket meal
(G. bimaculatus)
Replacement (%)
EAA (0%) (25%) (50%) (75%) (100%)
Histidine 1.14 ± 0.02 2.20 ± 0.01 1.62 ± 0.01a 1.63 ± 0.03
a 1.93 ± 0.11
ab 2.19 ± 0.04
b 2.18 ± 0.03
b
Arginine 6.64 ± 0.01 6.20 ± 0.03 5.66± 0.13a 5.66± 0.06
a 6.13 ± 0.12
ab 6.23 ± 0.03
b 5.56 ± 0.05
a
Threonine 4.35 ± 0.13 3.88 ± 0.11 4.03 ± 0.27b 3.36 ± 0.02
a 3.61 ± 0.03
a 3.54 ± 0.02
a 3.09 ±0.19
a
Valine 5.91 ± 0.02 4.24 ± 0.05 4.9 ± 0.11a 5.21 ± 0.03
b 5.20 ± 0.03
b 5.26 ± 0.05
b 5.02 ± 0.03
b
Methionine 1.83 ± 0.01 2.02 ± 0.04 1.16 ± 0.02a 1.18 ± 0.17
a 1.35 ± 0.26
a 1.45 ± 0.02
b 1.45 ± 0.02
ab
Isoleucine 4.32 ± 0.04 3.75 ± 0.01 3.67 ± 0.09a 3.64 ± 0.03
a 3.74 ± 0.02
a 3.87 ± 0.02
a 3.55 ± 0.10
a
Leucine 7.27 ± 0.11 6.70 ± 0.07 6.5 ± 0.15ab
6.30 ± 0.04a 6.61 ± 0.04
ab 6.75 ± 0.03
b 6.45 ± 0.06
ab
Phenylalanine 4.40 ± 0.01 4.00 ± 0.02 5.58 ± 0.39c 4.84 ± 0.67
b 4.42 ± 0.02
ab 3.81 ± 0.11
a 3.83 ± 0.02
a
Lysine 3.09 ± 0.10 5.14 ± 0.04 2.46 ± 0.13a 2.33 ± 0.06
a 3.08 ± 0.06
b 3.50 ± 0.08
c 3.23 ± 0.82
b
Tryptophan 0.60 ± 0.15 0.85 ± 0.12 0.73 ± 0.002 0.76 ± 0.003 0.84 ± 0.005 0.89 ± 0.001 0.94 ± 0.001
NEAA
Cystein 1.01 ± 0.02 2.02 ± 0.01 4.40 ± 0.53a 4.89 ± 0.50
a 7.02 ± 0.31
b 6.93 ± 0.03
b 6.38 ± 0.03
b
Tyrosine 3.15 ± 0.03 7.63 ± 0.02 2.63 ± 0.06a 3.01 ± 0.03
a 3.51 ± 0.04
ab 4.30 ± 0.16
b 3.94 ± 0.03
b
Page 73
57
Continue from Table 3.3 Replacement (%)
NEAA Fishmeal Cricket meal
(G. bimaculatus)
(0%) (25%) (50%) (75%) (100%)
Aspartic acid 6.05 ± 0.02 6.93 ± 0.02 1.95 ± 0.006b 1.78 ± 0.004
a 1.99 ± 0.01
bc 2.15 ± 0.04
d 2.00 ± 0.006
c
Glutamic acid 12.08 ± 0.11 10.92 ± 0.06 3.24 ± 0.06a 3.16 ± 0.003
a 3.30 ± 0.01
a 3.56 ± 0.09
b 3.17 ± 0.008
a
Serine 8.16 ± 0.02 4.11 ± 0.01 0.02 ± 0.003a 1.46 ± 0.02
d 1.36 ± 0.06
c 1.30 ± 0.002
c 1.04 ± 0.05
b
Glycine 7.41 ± 0.15 5.00 ± 0.11 0.01 ± 0.001a 1.49 ± 0.01
d 1.40 ± 0.01
d 1.41 ± 0.008
c 1.22 ± 0.008
b
Alanine 4.77 ± 0.04 0.58 ± 0.03 1.13 ± 0.01a 1.37 ± 0.006
b 1.56 ± 0.007
c 1.82 ± 0.008
d 2.07 ± 0.02
e
1Essential Amino Acid requirement (g/100g
crude protein) according Jimoh et al, (2014): arginine 3.6, histidine 1.2, isoleucine 2.0, leucine 3.5, lysine
4.8, methionine 2.4, phenylalanine 4.0, threonine 2.8, valine 2.4, tryptophan 1.1
2Values are means ± S.D of duplicates samples
3Mean values in the same row with different superscript are significantly different (P < 0.05)
Page 74
58
Table 3.4: Amino acid profiles (g 100g-1
crude protein) of field cricket (Gryllus
testaceus), house cricket (Acheta domesticus) and good quality fishmeal.
EAA 1G. testaceus
2A. domesticus
3Good quality
fishmeal
Histidine 1.9 2.3 3.6
Arginine 3.7 6.1 6.14
Threonine 2.8 3.6 4.4
Valine 4.4 5.1 5.2
Methionine 1.9 1.4 2.5
Isoleucine 3.1 4.4 4.8
Leucine 5.5 9.8 7.8
Phenylalanine 2.9 3.0 4.1
Lysine 4.8 5.4 7.9
Cystein1 1 0.8 1
Tyrosine1 3.9 5.2 3.2
1 Non-essential amino acid
Source: 1(Wang et al., 2005),
2(Finke, 2002),
3 (Lall & Anderson, 2005)
Page 75
59
During the 56 days of feeding trial, all experimental diets were well accepted by
African catfish fingerlings. The effect of growth performance and survival of the fish
fed the experimental diets are presented in Table 3.5. Growth performance and feed
utilisation of fish fed 100% CM were significantly improved compared to the lower
percentage of CM replacement. Reduced weight gain was observed in the group fed
with 25% CM although it does not differ significantly with 0% and 50%CM. Lower
weight gain was observed in fish fed diet 0% until 75%, which suggested that diet with
increased replacement of fishmeal by crickets meal from 50% up to 100% enhanced the
growth performance, feed efficiency and survival rate of African catfish fingerlings.
Feed conversion ratio was significantly lower in 100% CM inclusion level
(average: 2.20) as compared to the lowest inclusion level. Similarly, this result is
confirmed by a significant increase protein efficiency ratio (PER) and specific growth
rate (SGR) of fish fed 100% CM (average: 1.69 and 2.32 respectively) than those fed
with 0% to 50% CM. Values of SGR and PER increased gradually with increasing
amount of CM inclusion level from 50% up to 100%. In general, these growth
parameters were positively parallel with increasing CM level from 50% upwards, which
suggested that African catfish could well utilize cricket meal as protein sources in their
diet
Page 76
Table 3.5: Growth performance of fish fed the experimental diets.
1Values are the mean ± SEM of triplicate groups of 15 fish per tank.
2Mean values in the same row with different superscript are significantly different (P < 0.05)
Replacement (%)
Parameters (0%) (25%) (50%) (75%) (100%)
TFI (g fish-1
) 21.76 ± 0.88a 21.19 ± 0.82
a 25.44 ± 0.39
ab 24.08 ± 2.04
ab 32.23 ± 0.86
c
BWG (g) 6.23 ± 0.25a 6.13 ± 1.10
a 7.43 ± 0.54
ab 8.38 ± 0.14
b 14.68 ± 0.78
c
SGR (%/day) 1.49 ± 0.10a 1.24 ± 0.23
a 1.42 ± 0.12
a 1.69 ± 0.03
ab 2.32 ± 0.15
b
FCR 3.50 ± 0.82c 3.48 ±1 .77
c 3.43 ± 1.05
c 2.87 ± 0.53
b 2.20 ± 0.17
a
PER 1.11 ± 0.08a 1.11 ± 0.17
a 1.15 ± 0.09
a 1.36 ± 0.09
ab 1.69 ± 0.17
b
SR (%) 93.30 ± 3.84a 86.70 ± 2.22
a 86.70 ± 2.22
a 93.30 ± 3.84
a 93.30 ± 6.66
a
Page 77
61
Full replacement of CM up to 100% of FM clearly affected the whole body
composition of African catfish. The crude protein for initial fish were significantly
different with the final body composition of experimental fishes fed with diet 50%, 75%
and 100% CM inclusion level but did not differ significantly with diet 0% and 25% CM
inclusion level (Table 3.6) An increasing trend of crude protein level was observed with
higher inclusion of cricket meal despite the numerically lower level of 100% CM
compared to 75% CM
On the other hand, crude lipid body composition exhibited a decreasing trend
from 0% to 100% CM but did not differ significantly between the initial group, 0%,
25% and 50% CM. Crude ash was found to be highly significantly different in final
body of fish fed diet above 50% CM level when compared to the initial group. The
highest level was observed in the group that received 100% CM level.
Page 78
62
Figure 3.1: Fish fed with fishmeal diet after 56 days of feeding trial
Figure 3.2: Fish fed with cricket meal diet after 56 days of feeding trial
Page 79
63
Table 3.6: Initial and final body composition (g kg-1
) of fish fed the experiment diets (% Dry matter basis)
1Values are the mean ± SEM of triplicate groups of 15 fish per tank.
2Mean values in the same row with different letters are significantly different (P < 0.05)
Replacements (%)
Components Initial (0%) (25%) (50%) (75%) (100%)
Crude protein 46.18 ± 0.51a 46.34 ± 0.11
a 46.87 ± 1.00
a 47.53 ± 2.08
b 48.88 ± 1.50
b 48.33 ± 0.62
b
Crude lipid 16.38 ± 2.28c 16.82 ± 0.84
c 16.99 ± 2.24
c 16.92 ± 1.07
c 14.71 ± 0.19
b 13.90 ± 1.56
a
Crude ash 16.64 ± 0.03a 17.69 ± 0.49
a 19.24 ± 1.26
ab 20.36 ± 0.52
b 22.78 ± 0.91
bc 25.29 ± 1.11
c
Dry matter 91.37 ± 1.00a 92.00 ± 1.76
a 95.46 ± 0.57
b 94.63 ± 2.15
b 97.69 ± 0.31
c 97.61 ± 0.24
c
Page 80
64
3.5 Discussion
The results of the present study clearly indicated that growth performances of
African catfish fingerlings were affected by the different experimental diet of cricket
meal. The crude protein for field cricket, Gryllus bimaculatus in this study was analyzed
as 57% on a dry weight basis (Table 3.2), which is slightly lower than the percentage of
other species such as Gryllus testaceus, 58.3% (Wang et al., 2005), mormon crickets
Anabrus simplex Haldeman, 59.8% (DeFoliart et al., 1982) and house crickets Acheta
domesticus, 62% but somewhat higher than the variegated grasshopper, Zonocerus
variegatus, 26.8 (Alegbeleye et al., 2012) and cornfield grasshopper, Sphenarium
purpurascens, 52.6% (Ramos-Elorduy et al., 1997) from Orthoptera species.
Fishmeal used in this study is locally made and utilized by most local
farmers here in Malaysia. This fishmeal has higher ash content (19%), lower crude
protein (53.6%) and crude fat (2.96%) than the high quality fishmeal commonly used in
commercial fish feed that contains more than 66% crude protein and around 8% to 11%
crude fat along with ash that is lower than 12%. It is also more economical than the
imported, higher quality fishmeal. Hence, the amino acid profiles for the fishmeal used
in this study also shows the lower level of histidine, methionine and lysine compared to
higher quality of fishmeal reported by Lall and Anderson (2005).
Higher levels of arginine, leucine and phenylalanine were recorded in Gryllus
bimaculatus tested in this study in comparison to Gryllus testaceus as reported by Wang
et al. (2005). In addition, studies by Finke (2002) on house cricket, (Acheta domesticus)
amino acid profile shows a comparable result as Gryllus bimaculatus but somewhat
higher level of leucine appeared in A.domesticus.
Page 81
65
Lysine and methionine are the most limiting amino acid in fish feed particularly in
plants and animal byproducts. Thus many commercial diets include lysine and
methionine supplementation to satisfy the amino acid requirement for their fish feed
(Nunes et al., 2014). Similarly, in this case, all experimental diets are deficient in lysine,
methionine and phenylalanine. However according to Robinson and Li, (2006), the non-
essential amino acid such as cysteine can replace about 60% of methionine requirement
while tyrosine can spare up to 50% of phenylalanine in catfish diet.
Robinson and Li (2007) have proposed that crude protein level as low as 26% is
still accepted for growing catfish and in their revised publication, they have suggested
that crude protein of 28% provide good growth at stocking density of less than 10,000
per acre per day with 1000 fish growing up to 100 pounds (Robinson & Li, 2007)..
However, it was observed that FCR levels were extremely high for Diet 0% until 100%.
This situation may be attributed to insufficient crude protein level for the practical diet
formulation in African catfish fingerlings. As a result, future studies on higher crude
protein level will be beneficial to generate lower FCR value and consequently increase
growth rate.
Other insects that have been tested in catfish diet have shown poor growth in total
replacement for fishmeal. Previous studies by Roncarati et al. (2015) highlighted the
inclusion of mealworm (Tenebrio molitor) (50.8% crude protein) in common catfish
could enhance their growth although fishmeal fed fish (51.6% crude protein) showed
significantly higher weight gain than mealworm group. As for survival, the control diet
(0%) and 75% and 100% CM inclusion level showed the highest rate (average: 93.3%)
compared to 25% and 50% CM (average: 86.7) although the differences observed were
insignificant.
Page 82
66
Body composition was affected by many factors including growth, ingredient
used in the diets and water temperature. Apart from that, feed rate also could affect
body composition of fish (Ahmed, 2007; Kim et al., 2012). The results showed that
gross body composition of fish fed with 50% to 100% CM inclusion level showed
significantly higher crude protein content than those fed with lower inclusion of cricket
meal. However, higher fat content in fish fed with lower inclusion level of CM might be
resulted due to lower feed intake and thereby possibly impair growth (Johansen et al.,
2003). Increasing body lipid deposition must be carefully considered as it could affect
carcass quality, storage characteristics and flavor (Hillestad & Johnsen, 1994).
Since cricket meal in this study was acquired from local supplier and the amount
of local farmers producing them is limited, the price was fairly still expensive compared
to fishmeal. In tropical areas, crickets can be produced in large amount and relatively
within a short period of time. Therefore, although the price is the limiting factor here,
further research to develop a lower cost, practical method, as well as sustainable manner
for mass production culture of cricket will be beneficial to reduce production cost.
Page 83
67
3.6 Conclusion
The study of insects as substitutes for fishmeal has been growing over the years in
order to find sustainable resources to replace a very volatile and expensive fishmeal.
However, unlike other insects such as maggot meal, flies and silkworm, the information
about crickets as protein sources for fish feed is very limited compared to poultry feed.
Field crickets, Gryllus bimaculatus as an animal protein source is a very good candidate
since they contain sufficient amount of EAA for fish requirement. Besides, this species
can be harvested in a considerable amount with mass rearing under controlled condition
In conclusion, the use of a practical diet containing 100% CM is appropriate for
growth and nutrition utilisation of African catfish fingerlings. With a view to reduce
feed cost for the aquaculture and other livestock industry, further studies on cricket
meal as alternatives protein source should continue to be carried out since it holds great
potential.
Page 84
68
CHAPTER 4: NUTRIENT AND AMINO ACID DIGESTIBILITY OF CRICKET
MEAL AND FISHMEAL IN AFRICAN CATFISH, Clarias gariepinus DIET
4.1 Introduction
The study of fisheries nutrition started since the early 1930s. The evaluation
of fish feed efficiency by using digestibility, metabolizability and growth are similarly
utilized as in warm-blooded animals (Belal, 2005).
Digestion coefficient is crucial in determining fish diets in terms of growth
(Lovell, 2012). The apparent digestibility can be measured by using two methods. The
first method is regarded as ‘direct method’, which relies on quantitative measurement of
ingested (feed) and egested (faeces) materials. The second method is called ‘indirect
method’ (Lovell, 2012) or ‘indicator method’ by determining the percentage of the
marker (i.e., chromic oxide, barium oxide, etc.) in the feed and sample of the faeces to
estimate the digestibility coefficient.
Recently, there has been increasing interest in the use of insect meals as a
protein ingredients, However, there are still uncertainties on the digestibility of insects
meal in fish feed due to the presence of chitin in some insects. Little is known about the
efficiency of cricket meal as an ingredient in formulated feed as well as its effect on
digestibility by fish. Therefore, this study was conducted to assess the growth
performance, nutrient digestibly and amino acid digestibility of cricket meal and
fishmeal fed to Clarias gariepinus.
Page 85
69
4.2 Literature review
Insect meals have captivated interest among researchers due to their high
protein content and ease of culturing within a relatively short period of time. However,
the digestibility of fish when consuming insects were the concern of the researchers due
to the presence of chitin that could diminish the apparent digestibility, hence reduce
growth performance. Despite that, many studies have proven that fish performance were
either improved or not affected by the dietary inclusion of insects, crustaceans or
benthic invertebrate in which chitin is one of the compound present (Henry et al., 2015).
Apparently, insects contain lower levels of carbohydrate than plants with
approximately lesser than 20% in which most considerably consists of chitin from the
exoskeleton (Barroso et al., 2014). However, the amount of chitin varies according to
species and developmental stage. The fish’s ability in digesting chitin is also debatable
since some fish can digest chitin better than others. Incorporating chitin has
immunostimulatory effect in marine fish diet but generally it is one of the limiting
factors present in insects that could reduce its digestibility by fish (Barroso et al., 2014;
Ng et al., 2001).
Page 86
70
4.3 Materials and method
4.3.1 Experimental Diet
Adult live cricket and all raw ingredients were purchased and processed
according to the experimental diet procedure elaborated in Chapter 3, paragraph 3.3.1.
Chromic oxide (Cr2O3) at 0.5% concentration was incorporated into the diet as an inert
marker.
Table 1 shows the composition and nutrition profiles of the diets involved in
this feeding trial. Two iso-nitrogenous diets with 30% crude protein content were used
in this experiment. The cricket meal diet contained 30% inclusion of cricket meal while
the fishmeal diet contained 30% fishmeal. For both diets, the remaining 70% consisted
of other ingredients, including soybean, rice bran, corn meal, vitamin, minerals and Di-
calcium phosphate, (DCP).
4.3.2 Experimental Fish and Set-Up
Ninety (90) Clarias gariepinus weighing 51.70 ± 0.8 g were randomly divided
into two groups, each in triplicates of 15 fishes. All the fishes were obtained from a
local supplier and acclimatized to natural environmental conditions for two weeks prior
to the feeding trials.
Faecal material was collected once daily in the morning from the bottom of
filtration box prior to feeding. Faeces from each replicated treatment were dried and
stored for chemical analysis.
Six plastic tanks (3’ x 2’ x 1’), which contained 100 liters of water in closed re-
circulation system, were used for the feeding activities. The tanks were equipped with
top filter pump with a flow rate of 20 L/min for the circulation of dissolved oxygen. Tap
Page 87
71
water, which was treated with anti-chlorine, was used and 20-30% of water was
replaced once in two days to maintain water quality.
The commercial diets (Dindings) were fed twice per day at 0900 and 1500
hour during the acclimatisation period. After two weeks, the experimental diet was fed
twice daily at the same times throughout the experimental period. The feeds were given
at a rate of 3% of Body weight (BW) ratio at the beginning of the feeding trial and the
final feeding rate was at 1% of their BW ratio. Uneaten food was collected and dried in
an oven and then weighed to determine the total feed. The level was adjusted according
to the BW after weighing them once in two weeks. The feeding trials were conducted
over 56 days duration.
The water quality for all tanks was measured according to the method by
APHA (1992) as described in Chapter 3, paragraph 3.3.2
4.3.3 Proximate and Chemical Analysis
The experimental diets and ingredients were analyzed for the proximate
composition according to the Association of Official Analytical Chemist methods
(AOAC, 2003) as described in Chapter 3, paragraph 3.3.3. Kjeldahl method was used to
estimate crude protein after acid digestion using FOSS Tecator Digestor Auto. Moisture
and dry matter were determined by drying in an oven at 105°C to constant weight. Ash
was measured by combustion in a muffle furnace (Naberthem) at 600°C. Crude lipid
content was measured with petroleum ether extraction by using Soxhlet method (FOSS
Soxtec 2055). Nitrogen-free extract (NFE) is calculated as = 100 - (% crude protein +
% crude fat + % crude fiber + % crude ash + % moisture). Gross energy for every diet
was calculated using the following factors: crude protein = 23.9 kJ/g, crude lipids =
39.8 kJ/g and NFE = 17.6 kJ/g (Schulz et al., 2005).
Page 88
72
4.3.4 Chitin determination
Chitin content in raw cricket meal was estimated by measuring the acid detergent
fiber (ADF) and protein residue of ADF according to Marono et al. (2015) and AOAC
(1990). The ADF solution was prepared by using 10 L of distilled water, 360 g of
hexadecyltrimethylammonium bromide, 500 ml of sulphuric acid and the solution was
made up to 18 L with distilled water. All samples were defatted and ground to pass a
1 mm forage mill prior to use. A total of 1 g of sample (W0) was added into 600 ml
Berzelius beaker with 100 ml of ADF solution. Then, the reagent was boiled for one
hour using a refluxing apparatus. On the other hand, 50 ml crucibles were dried at
100°C overnight before weighing (W1). The crucibles were placed in vacuum unit and
the reagents were poured through the crucible prior to vacuum process. Hot water was
used to rinse the crucibles until all the traces were removed. After hot water is filtered
off, acetone was used to rinse repeatedly and finish the rinsing portion until the drained
liquid is cleared. The samples collected were placed in small crucibles and dried in an
oven overnight at 105°C and later cooled to room temperature in a desiccator before
weighing (W2) on the next day. The samples residue were then analysed for ash (W3)
and crude protein to determine chitin composition in the cricket meal.
The ADF content of the samples was calculated as:
% ADF = (W2 -W1)[ ]W0
´100
% ADF ash = (W3-W1)
(W2 -W1)´100
Chitin in raw cricket meal was calculated as follows:
Chitin (%) = ash free ADF (%) – ADF crude protein (%)
Page 89
73
4.3.5 Chromic oxide determination
Chromic oxide indicator in faeces and feed were measured according to the
method of Furukawa (1966). Briefly, 50 to 100 mg of samples were weighed and dried
in an oven at 60°C overnight. Then, the samples were transferred into borosilicate
digestion tube with 6 ml of nitric acid and incubated overnight at room temperature. The
next day, all the samples were digested in 150°C for approximately one hour and later
cooled off at room temperature. A volume of 3 ml of 70% perchloric acid was added to
the tube and digested at 220°C for 75 minutes until the appearance of strong red colour
and later cooled off at room temperature. The cooled samples were decanted from the
tube into a volumetric flask and made up to 50 ml with distilled water. Then the
absorbance of each sample of feed and faeces were recorded from atomic
spectrophotometer at 452.4 nm.
4.3.6 Amino acid digestibility
Amino acid profiles for diets and faeces were determined using the High
Performance liquid Chromatography (HPLC) (JASCO CO-2065 Plus, Intelligent
Column Oven) and the contents were determined by comparison peak retention times to
a known standard by using the Pico-Tag method by Heinrikson and Meredith (1984)
while Tryptophan was determined after alkaline hydrolysis according to (Nielsen &
Hurrell, 1985) as described in Chapter 3, paragraph 3.3.4.
Page 90
74
4.3.7 Analysis of Experimental Data
4.3.7.1 Growth performance analysis
From the data obtained, specific growth rate (SGR), food conversion ratio
(FCR), body weight gain (BWG), protein efficiency ratio (PER) and survival rate (%)
were calculated according to Chapter 3, paragraph 3.3.5.
4.3.7.2 Apparent digestibility coefficient
The Apparent digestibility coefficient (ADC) for the crude protein, lipid, dry
matter, carbohydrate and amino acid availability coefficient (AAC) of fish fed with
cricket meal and fishmeal were calculated according to (Cho et al., 1982)
ADC for protein, lipid, carbohydrate, ash and amino acid availability coefficient (AAC)
ADC / AAC = 1- (DC
FC))´ (
FN
DN)
The ADC for dry matter
ADC = 100 -[100´ (DC
FC)]
Where DC= % dietary Cr2O3
FC = % faecal Cr2O3
FN = % faecal nutrient
DN = % dietary nutrient
4.3.8 Statistical Analysis
All growth data and ADC values were subjected to Independent sample T-Test
using SPSS version 21.0. The differences between means were determined at 5% (P <
0.05) probability level. Confidence intervals were calculated as mean ± SE (standard
error).
Page 91
75
Table 4.1: Formulation (g kg-1
) and nutritional profile (%), of fishmeal and cricket
meal diet for the digestibility study
Ingredients Fishmeal diet Cricket meal diet
Fishmeal 300 0
Crickets meal 0 300
Soybean meal 117.7 117.8
Corn meal 297.0 243.9
Ricebran 269.8 318.3
Vitamins premix 2.0 2.0
Minerals premix 3.0 3.0
DCP 10 10
Chromic oxide 5.0 5.0
Nutritional profile (%)
Crude Protein 29.92 29.30
Crude lipid 8.63 9.67
Dry matter 95.57 96.42
Ash 9.67 9.53
Crude fiber 1.50 2.36
Chitin - 2.27
NFE / Carbohydrate 45.85 45.56
Gross Energy (kJ g-1
) 18.65 18.87
1The vitamin premix supplied the following per 100 g diet: Vitamin A, 500 IU; Vitamin
D3, 100 IU; Vitamin E, 0.75 mg; Vitamin K, 0.02 mg; Vitamin B1, 1.0 mg; Vitamin
B2, 0.5 mg; Vitamin B3, 0.3 mg; Vitamin B6, 0.2 mg; Vitamin B12, 0.001 mg; Vitamin
C, 0.1 mg; Niacin, 0.2 mg; Folic Acid, 0.1 mg; Biotin, 0.235 mg; Pantothenic acid, 1.0
mg, Inositol, 2.5 mg
2The mineral premix supplied the following per kg diet: Selenium, 0.2 mg; Iron, 8 mg;
Page 92
76
Table 4.1 continued
Manganese 1.0 mg; Zinc, 8.0 mg; Copper, 0.15 mg; Potassium Chloride, 0.4 mg;
Magnesium Oxide, 0.6 mg; Sodium Bicarbonate, 1.5 mg; Iodine, 1.0 mg; Cobalt, 0.25
mg.
4.4 Results
Diet compositions and nutritional profiles of cricket meal and fishmeal diet fed to
the African catfish were reported in Table 4.1. Chromic oxide was included in the diets
as inert marker. Chitin was estimated in the cricket meal diet based on chitin
composition in raw cricket meal. The raw cricket meal contains approximately 7.15%
chitin after ADF analysis while the cricket meal diet used in this experiment was
formulated to have 2.27% chitin content.
Table 4.2 summarized the chemical composition of faecal materials collected
from the fish during the feeding trials. Higher crude protein and ash content were
observed in faeces from fishmeal group. On the contrary, the crude fiber content of the
cricket meal-fed fish was higher than that of the fishmeal group (12.56, 11.23
respectively). Carbohydrate or NFE was also higher in cricket meal than fishmeal group
(43.04 and 38.45 respectively) while no significant differences (P > 0.05) were
observed in gross energy in both groups of fish.
The apparent digestibility coefficients for both diets are shown in Table 4.3.
Generally, both diets showed significant differences in all ADC components. The
cricket meal had significantly higher (P < 0.05) ADC for crude protein (81.21 ± 0.03%),
crude lipid (89.82 ± 0.02%), dry matter (73.97 ± 0.01%) and gross energy (64.42 ±
0.01) whereas fishmeal showed lower level of ADC with crude protein level of (78.22 ±
0.03%), crude lipid (82.03 ± 0.02%) dry matter (62.26 ± 0.02%) and gross energy
Page 93
77
(56.52 ± 0.03). Hence, cricket meal can be considered as highly digestible compared to
fishmeal.
Table 4.2: Chemical composition (g kg-1
) of faeces collected from fish fed cricket
meal diet and fishmeal diet (% dry matter basis)
Components Fishmeal Cricket meal
Crude protein 14.52 11.30
Crude lipid 1.7 1.6
Ash 4.5 2.9
Dry matter 70.4 71.4
Crude fiber 11.23 12.56
Gross energy (kJ/g) 10.91 10.91
NFE 38.45 43.04
Table 4.3: Mean (± S.E) Apparent Digestibility Coefficient (ADC %) of crude
protein, crude lipid, dry matter and gross energy in the experimental diets.
Components Fishmeal Cricket meal
Crude protein 78.22 ± 0.03a 81.21 ± 0.03
b
Crude lipid 82.03 ± 0.02a 89.82 ± 0.02
b
Dry matter 62.26 ± 0.02a 73.97± 0.01
b
Gross Energy 56.52 ± 0.03a 64.42 ± 0.01
b
1 Values are means of triplicate groups of 15 fish. Mean values in the same row with
different superscript are significantly different (P < 0.05)
Page 94
78
Generally, all essential amino acids (EAA) were present in both diets based on the
amino acid composition of the experimental diets presented in Table 4.4. Leucine was
the most abundant indispensable amino acid in both diets. With the exception of
Isoleucine and Phenylalanine, the values of EAA compounds for the cricket meal were
found to be slightly higher than the fishmeal, but not statistically significant at
(P > 0.05). However, the essential amino acid of methionine and tryptophan in both
diets with the addition of phenylalanine in cricket meal did not fulfill the requirement of
African catfish as reported Jimoh et al. (2014).
All compounds of amino acid availability coefficient (AAC) in cricket meal
exhibited higher level than fishmeal. Apparently, amino acid availability reflected crude
protein digestibility. The level of amino acid availability coefficient in cricket meal
group (AAC CM) ranges from 0.906 to 0.961 while fishmeal (AAC FM) was between
0.812 to 0.938 with lysine as the most digestible AAC compound for both diets. On the
other hand, methionine (0.81) in fishmeal and (0.90) in cricket meal was the least
digested indispensable amino acid.
Page 95
79
Table 4.4: Amino acid composition and availability coefficient (AAC) of cricket
meal diet and fishmeal diet (g/100g) crude protein
EAA CM FM AAC CM AAC FM
Histidine 2.20 ± 0.05 1.61 ± 0.01 0.93 0.85
Arginine 5.20 ± 0.01 5.33 ± 0.01 0.96 0.91
Threonine 3.04 ± 0.04 3.04 ± 0.03 0.92 0.83
Valine 4.53 ± 0.03 4.46 ± 0.03 0.94 0.91
Methionine 1.44 ± 0.03 1.38 ± 0.01 0.90 0.81
Lysine 4.74 ± 0.07 4.88 ± 0.02 0.96 0.94
Isoleucine 3.67 ± 0.03 4.72 ± 0.02 0.94 0.91
Leucine 6.65 ± 0.03 6.26 ± 0.03 0.94 0.90
Phenylalanine 3.77 ± 0.03 4.14 ±0.01 0.93 0.85
Tryptophan 0.91 ± 0.02 0.89 ± 0.03 0.95 0.90
Non-EAA CM FM AAC CM AAC FM
Tyrosine 2.84 ± 0.02 2.05 ± 0.01 0.92 0.81
Cystein 1.20 ± 0.03 1.11 ± 0.01 0.90 0.81
1
Essential Amino Acid requirement for African catfish (g/100g crude protein) according
to Jimoh et al. (2014): arginine 3.6, histidine 1.2, isoleucine 2.0, leucine 3.5, lysine 4.8,
methionine 2.4, phenylalanine 4.0, threonine 2.8, valine 2.4
2 Tryptophan requirements for African catfish is 1.1 g/100g crude protein according to
Fagbenro and Nwanna (1999).
3 Values are mean of duplicates groups
Page 96
80
The growth performance and feed utilization parameters of Clarias gariepinus are
shown in Table 4.5. During the experimental period, no mortality was recorded. At the
end of the feeding trials, fish that consumed cricket meal diet increased their weight
gain significantly (P < 0.05) (50.13 ± 0.49 g/fish) compared to the fishmeal diet
(37.11± 0.50 g/fish). Feed conversion ratio (FCR), for cricket meal-fed fish
demonstrated a significantly lower level (P < 0.05) (1.68 ± 0.004) while protein
efficiency ratio (PER) had higher (P < 0.05) (2.02 ± 0.004) than those fed with
fishmeal. However, the specific growth rate was not significantly affected by both diets
(P > 0.05).
Table 4.5: Growth performance of fish fed the experimental diets.
Variables Fishmeal Cricket meal
TFI (g/day) 82.76 ± 0.6a 84.22 ± 1.5
a
BWG (g fish-1
) 37.11± 0.50a 50.13 ± 0.49
b
FCR 2.23 ± 0.003a 1.68 ± 0.004
b
SGR (%/day) 1.01 ± 0.001a 1.25 ± 0.002
a
PER 1.50 ± 0.002a 2.02 ± 0.004
b
SR (%) 100a 100
a
1 Values are means of triplicate groups of 15 fish.
2 Mean values in the same row with different superscript are significantly different (P <
0.05)
Page 97
81
4.5 Discussion
Generally, there are three systems to collect faeces that could produce meaningful
estimates of nutrient digestibility in ways that could minimize the leaching (Bureau &
Cho, 1999). The first system was proposed by Ogino et al. (1973) where fish faeces are
collected through a filtration column from the effluent water in the fish tank. The
second system is called Guelph system in which a settling column is used to separate
the faeces from the effluent water (Cho et al., 1985). The third system was introduced
by Choubert et al, 1979 where faecal material was filtered out by mechanical rotating
screen and it is called St-Pee system. In this study, the former system by Ogino et al.
(1973) was used to collect fish faeces. The uneaten feed were collected 10 to 15 minutes
after feeding session and faeces were gathered prior to feeding every day.
The results presented above shows that the cricket meal, which was composed of
30% crude protein cricket meal, was more digestible than fishmeal to Clarias
gariepinus in terms of crude protein, lipid, dry matter and gross energy. The ADC crude
protein value for cricket meal (76.08%) and fish meal (63.92%) were within the range
of crude protein ADC levels (58-92%) in various animal and plant-based diets fed to
Clarias isheriensis (47.5-51.2 g) as reported by Fagbenro (1996).
Other insects such as non-defatted and defatted silkworm pupae resulted in higher
protein digestibility than fishmeal when fed to rohu. Mozambique tilapia could utilize
silkworm pupae with high apparent protein digestibility up to 86% (Hossain et al.,
1992) while walking catfish showed similar digestibility of CP to fishmeal (Borthakur
& Sarma, 1998). Besides that, migratory locust also has demonstrated comparable
digestibility as that of fishmeal when substituted up to 25% (Abanikannda, 2012).
However, other insects such as superworm meal and grasshopper meal have shown
Page 98
82
significantly reduced digestibility rates in tilapia and African catfish respectively
(Alegbeleye et al., 2012; Jabir et al., 2012).
The current study shows that fishmeal contains lower dry matter and energy
ADC level. The crude protein ADC for fishmeal recorded in this study was slightly
lower than the 82% reported by Pantazis and Neofitou (2004) for African catfish with
approximately 65 g of weight. Alegbeleye et al. (2012) also recorded similar amount of
protein digestibility with fingerlings of African catfish (4 – 5 g). This difference is due
to many factors including the origin of the fishmeal itself. The fishmeal used in this
study was locally made and utilized by most local farmers in Malaysia. Hence, it is
more economical but is lower in nutrient availability compared to the imported ones.
We believe that studies with local fishmeal are essential for the references of local fish
producers although future investigation with higher quality fishmeal will be beneficial
as a whole.
Various studies have reported that inclusion of chitin in aqua feeds can improve
growth rate in some fish species (Tibbetts & Lall, 2013) and enhances immune response
and disease resistance against pathogens (Harikrishnan et al., 2012; and Zhang et al.,
2012). Chitin is an integral part of invertebrate cuticle (exoskeleton) and can be used as
toxin binder, which significantly diminishes the adverse effect of aflatoxin, and
mycotoxin that may possess carcinogenic activity (Khajarern et al., 2003). However,
other studies have suggested that a high level of chitin in fish diet will results in a
higher FCR level, thus, reducing growth performance (Goodman, 1989) (and
Alegbeleye et al., 2012).
According to Longvah et al. (2011), chitin could inhibit the efficiency of protein
utilization. Previous research by Ozimek et al. (1985) has claimed that removal of chitin
from honey bees elevated the net protein utilization from 42 to 62, which was almost
Page 99
83
equivalent to casein. On the other hand, according to Finke (2007), most of the nitrogen
recovered in insect meal is from amino acid but only a small amount is related to chitin.
The amount of chitin in black field cricket meal in the current study (7.5%) is lower
than adult field cricket, Gryllus testaceus (8.7%) (Wang et al., 2005) but somewhat
higher than mealworm larvae, Tenebrio molitor (5.75%) and black soldier fly larvae,
Hermetia illucens (4.25%) (Marono et al., 2015).
The lipid ADC of the cricket meal differs significantly (P < 0.05) compared to the
fishmeal. The high ADC content of lipid from cricket meal indicated a strong ability of
African catfish to utilize the lipid component of insects. Lipids are the preferable energy
source than carbohydrates and are almost completely digestible in fish. Moreover, an
increase in dietary lipids will increase protein digestibility (NRC, 1993).
The ADC for energy is affected by many factors including the source,
composition, freshness of the source as well as processing temperature in producing the
meal. The energy digestibility observed in commercial fishmeal used in this study is
relatively lower than Omena (78.20%) and anchovy fishmeal (86.0%) as reported by
Maina et al. (2002). In Japanese seabass, energy digestibility of non-defatted silkworm
pupae meal is 75%, which is significantly higher than cricket meal in the present study.
Cricket meal digestible energy is also categorised as low when compared to other
animal protein sources such as fishmeal, poultry-by-product and hydrolyzed feather
meal (Kitagima & Fracalossi, 2011).
Insects appear to be a good source of amino acid. The amounts of other
compounds of EAA, except phenylalanine and methionine were higher than the
recommended levels for African catfish (methionine - 2.4% and phenylalanine - 4.0%)
as suggested by Jimoh et al. (2014). However, the deficiencies were overcome with the
additional non- essential amino acids of cysteine and tyrosine.
Page 100
84
The AAC of indispensable amino acid in the cricket meal diet was higher and
showed fewer variations than that of fishmeal. However, it should be noted that all
AAC in both diets was greater than 0.80. To the author’s knowledge, no studies on the
essential amino acid AAC of insect meal have been conducted in fish nutrition. For this
reason, it is not possible to compare the values obtained in the current studies with
published data from the fish diet. Nevertheless, Penkov et al. (2002) have demonstrated
high amino acid digestibility (lysine 94%, methionine 95%) by using silkworm pupae
meal in geese diet. On the other hand, studies with housefly meal in broiler diet reported
faecal crude protein digestibility of 69% while the amino acid availability was much
higher with >90% which might be attributed to indigestibility of chitin (Pretorius,
2011).
In terms of growth performance indicators, the findings of the present study
were consistent with the nutrient ADC observations, whereby, weight gain, FCR, and
PER values were better in the cricket meal group than the reference group. However,
similar to ADC data, no significant differences were found in SGR and survival rates.
The reduced growth performance of fish on the fishmeal group may be due to
inefficient utilization of local commercial fishmeal used in this study by African catfish
as a result of low digestibility.
4.6 Conclusion
In conclusion, the result from the present study indicates that protein from cricket
meal is well digested by African catfish at the level that is markedly higher than local
fishmeal. Although the level is considerably adequate for standard African catfish
digestibility, the nutrient digestibility of cricket meal is comparatively less than other
protein sources for alternative fishmeal replacement. Processing of cricket meal in order
Page 101
85
to enhance fish palatability, nutrient availability, and digestibility to meet the
requirements for fish nutrition is potential for future research. The utilisation of cricket
meal as an alternative formulated feedstuff was suitable to Clarias gariepinus as the
EAA present in the diet proved to be sufficient for growth performance. The present
findings suggested that cricket meal can be included in African catfish diet without
impairing their nutrient digestibility while simultaneously elevating their growth
performance
Page 102
86
CHAPTER 5: THE EFFECT OF DIETARY CRICKET MEAL ON THE
GROWTH PERFORMANCE AND RESISTANCE AGAINST
PATHOGENICITY OF Aeromonas hydrophila IN AFRICAN CATFISH, Clarias
gariepinus.
5.1 Introduction
The main objectives of the aquaculture industry are to gain optimal growth and
produce high quality fish, as it is a well-established fact that nutritional status is an
essential factor in determining growth and capability of all animals including fish to
withstand diseases. Disease outbreak is most common when stress appeared through a
variety of factors, which included poor nutrition (Lall, 2000; Pohlenz & Gatlin, 2014).
In recent years, heightened attention has been given in the development of proper diets
that could improve health, immunity and prevent disease outbreak that could avoid
major economic losses in farmed aquatic animals.
In view of the ineffective use of antibiotics in aquaculture, feed with
immunostimulant properties has been suggested as alternatives to the antimicrobial
agent for improving fish health. In the present experiment, administration of cricket
meal as a protein source and recent findings on the effect of cricket meal on the immune
response of catfish is discussed.
Page 103
87
5.2 Literature Review
Knowledge of dietary protein is important in determining the optimum protein
requirement for the development of cost-effective feed. Higher dietary crude protein
level has been associated with increased growth performance. However, dietary protein
has a certain threshold level where the growth development will be depressed as protein
intake exceeds beyond that level (Kim & Lall, 2001; Yang et al., 2002).
Motile Aeromonas species (MAS) or better known as the aerobic bacteria namely
Aeromonas hydrophila, Aeromonas caviae and Aeromonas sobria were associated with
most hazardous infection disease, which affected African catfish (Janda & Abbott,
2010). Studies have proven that fish infected with MAS led to skin lesion and
hemorrhage septicaemia (Ahamad et al., 2013; Anyanwu et al., 2015; Law, 2001) which
resulted in massive mortalities and financial loss to fish farmers worldwide. Hence, the
production of feed as an immunostimulant for preventing bacteria disease has been in
demand especially in avoiding the use of antibiotics. Antibiotics may encourage the
development of pathogens, resulting in a negative impact on the fish due to the
accumulation of antibiotic residue (Depaola et al., 1995; McPhearson et al., 1991;
Schmidt et al., 2000).
Chitin is a natural, common constituent polymer found in crustacean shells, insect
exoskeloton and fungi cell wall. It has been widely studied in aquaculture as an
immunostimulant to protect salmonid, white shrimp, rainbow trout and brook trout
against bacterial disease (Siwicki et al., 1994; Vahedi & Ghodratizadeh, 2011; Wang &
Chen, 2005). Crickets have been known to contain a significant amount of chitin and
have proven to give a positive response in the growth of African catfish (Taufek et al.,
2016).
Page 104
88
5.3 Materials and Method
5.3.1 Experimental diet
Adult live crickets and all raw ingredients were purchased and processed
according to the experimental diet procedure elaborated in Chapter 3, paragraph 3.3.1
Formulation and chemical composition of all the experimental diets and feed
ingredients were tabulated in Table 5.1. Three formulated diets were used in the first
feeding trial which includes 30% crude protein (30% CP), 35% CP and 40% CP cricket
meal diet. The second feeding trial involved 35% and 40% CP cricket meal as well as
35% CP fishmeal as control. Winfeed 2.8 version software was used to establish the
formulated feed. All dry ingredients were grounded in a hammer mill (Disk Mill, FFC
454). Vitamins, minerals and DCP were mixed thoroughly with the dry ingredients and
water was added to the mixture prior to being pelleted into sizes of 1mm in diameter
using a mini pelleting machine (KCM, Y132M-4). The wet pellets were then dried in an
oven at 70°C for 24 hours and later stored in a cold room (4°C) until used for feeding.
5.3.2 Experimental Fish and set-up
African catfish were acquired from local farmers and transported to the
Freshwater Aquarium Laboratory located in the Institute of Biological Sciences, Faculty
of Science, University of Malaya. The fingerlings were randomly divided into three
groups for both experiments each in triplicates of 15 fishes (average weight 15.5 ± 0.8
g) and 10 fishes (average weight 22.5 ± 0.6 g) in the first and the second experiment
respectively. All the fish were acclimatized to natural environment condition for 2
weeks prior to the feeding trials and fed with commercial diet twice per day during the
acclimatization and throughout the experiment. Uneaten food was collected after
Page 105
89
feeding and weighed to determine the total feed consumed. Water quality was
monitored regularly and any mortality was recorded. Nine plastic tanks (3’ x 2’ x 1’)
with a capacity of 100 liters of water with closed re-circulation system were used in
these feeding activities. The tanks were equipped with top filter pump at a flow rate of
20 L/min and aeration diffuser was provided in each tank for circulation of dissolved
oxygen. Tap water, which was treated with anti-chlorine, was used and 20-30% of water
was replaced once in two days to maintain water quality
The feed were given at 10% of their body weight (BW) throughout the experiment
for both feeding trials. The experiments were conducted over 56 days for the first
feeding trial and 40 days for the second. The water quality for all tanks were measured
according to the method by APHA (1992) as described in Chapter 3, paragraph 3.3.2
5.3.3 Proximate and chemical analysis
The experimental diets, ingredients and body composition were analyzed for the
proximate composition according to Association of Official Analytical Chemist method
(AOAC, 2000) as described in Chapter 3, paragraph 3.3.3. Kjedahl method was used to
analyze crude protein after acid digestion (FOSS Tecator Digestor Auto). Moisture and
dry matter were measured by drying in an oven at 105°C to constant weight.
Meanwhile, ash was determined by combustion in a muffle furnace (Naberthem) at
600°C. Soxhlet method with petroleum ether extraction (FOSS Soxtec 2055) was used
to measure crude lipid content. Nitrogen free extract (NFE) is calculated as = 100 - (%
crude protein + % crude fat + % crude ash + % crude fiber). Gross energy for every
diets and body composition was calculated using the following factors: crude protein =
23.9 kJ/g, crude lipids = 39.8 kJ/g and NFE = 17.6 kJ/g (Schulz et al., 2005).
Page 106
90
5.3.4 Haematological and biochemical parameters analysis
After 40 days of feeding trial for the second experiment, blood samples were
randomly collected from five fishes from each tank. About 500 μl of blood from each
fish was sampled from caudal circulation and transferred into tubes containing heparin
as an anticoagulant. Following centrifugation, plasma was collected and stored in -80°C
for biochemical parameters analysis. Prior to centrifugation, 100 μl of the whole blood
were separated and stored at 4°C for white blood cell count (WBC). The acetic acid
(3%) (v/v), gelatin violet (1%) (w/v) and a drop of methylene blue were mixed for
WBC diluting fluid. The blood samples were diluted at 1:20 with triplicate counts for
each sample and counted through haemocytometry by using Neubaeur haemocytometer.
5.3.5 Plasma total protein determination
Protein concentration for liver and blood plasma were determined using Bradford
assay, which contains Coomassie Brilliant Blue G reagent, and bovine serum albumin
(BSA) as the standard (Bradford, 1976). Coomasie Brilliant Blue G-250 (100 mg) was
dissolved in 50 ml of 95% ethanol. A 100 ml of 85% (v/v) phosphoric acid was added
to the mixture and the solution was made up to a final solution of 1 L with distilled
water. The solution was filtered with Whatman No.1 filter paper and left overnight
before use. Bovine serum albumin (BSA) stock solution with a concentration of
1.0 mg/ml was prepared in distilled water. From the stock solution, six standards
solutions were prepared from the range of 51 to 306 μg/ml. The absorbance was read at
595 nm and the amounts of BSA in the standards were plotted against their average
absorbance. The protein content of the samples was estimated from the standard curve.
Page 107
91
5.3.6 Albumin and globulin determination
Plasma albumin was determined by using bromocresol green according to
Doumas et al. (1971). The stock solution of bromocresol green was prepared by
dissolving 0.15 g (0.25 mM) of bromocresol green into 0.1 M NaOH and diluted to a
1 L with distilled water. Then, 4.5 ml of 30% Brij 35 solution (w/v), 0.004 mM of
sodium azide and 150 ml of stock solution was made up into 1 L with 0.075 M
succinate buffer. The solution was adjusted to pH 4.2 with 1 M HCl before being stored
in 4°C. Albumin standards stock solution were prepared by using 0.05 g/ml bovine
serum albumin (BSA) and diluted in ultrapure water. Six standard solutions were
prepared from the stock solution ranging from 0.63 - 3.76 μg/ml. A total of 100 μl of
samples were put in their respective tubes and 5 ml of bromocresol green reagent was
added into each tube before incubation for 5 minutes. The mixtures were then
transferred into appropriate cuvettes and absorbances were measured at 620 nm.
Plasma globulin content was calculated by subtracting albumin content from total
protein content.
5.3.7 Lysozyme assay
Lysozyme activity was assayed spectrophotometrically according to Shugar
(1952) with slight modification by using lyophilized Micrococcus lysodekticus (A450) as
the substrate in phosphate buffer (66 mM, pH 6.24). A 100 μl of plasma sample was
added to 2.5 ml substrate suspension. The absorbance was measured at 450 nm in room
temperature for 10 minutes and the initial and final absorbance were recorded. A
lysozyme activity unit was defined as the amount of enzyme producing a decrease in
absorbance of 0.001/min
Page 108
92
5.3.8 Bacterial pathogen and experimental challenge
Aeromonas hydrophila used in this study was obtained from the National Fish
Health Research Center (NaFish), located in Batu Maung, Penang, Malaysia. The
bacterium was cultured in Tryptone Soy Broth (TSB) overnight at 30°C. Subsequently,
the bacterial suspension was washed with phosphate buffer saline (PBS, pH 7.4) and
diluted to get the desired concentration for the bacteria challenge.
Prior to performing the bacteria challenge to the fish under study, the LD50 dose of
the bacteria was established by challenging another group of fish to the unrelated but
same bacteria sp. Ninety fish were divided into nine tanks, with each treatment being
composed of 10 fish. The nine treatments composed of 1.6 × 10⁴ to 10
12 colony forming
unit /ml. Mortalities were observed within 96 hours and water variables were monitored
during the experiment. The LD50 calculated from this experiment was 1.6 x 10⁷ cfu/ml.
This concentration was used for the subsequent challenge.
After 40 days of the second feeding trial, 10 fish per tank were intra-muscularly
injected with 0.1 ml bacterial suspension. The fish continued to receive their respective
feed and mortalities were recorded daily over 12 days post-challenge.
5.3.9 Confirmation of pathogenicity
Freshly dead fish were collected and immediately dissected to isolate Aeromonas
hydrophila in the liver and intestine. The fish were dissected aseptically whereby the
samples were homogenized in 1:10 volume of physiological saline. The homogenized
solution was diluted serially and 100 μl from each serial dilution were spread onto
selective media, which contained Mueller-Hinton agar supplemented with 5%
defibrinated sheep blood and 30μg/ml ampicillin (Misra et al., 1989). They were
Page 109
93
incubated at 30°C for 12 hours and the colonies formed were calculated according to
Rashid et al. (1994).
Bacterial CFU/g of fish organ = No. of colonies counted in the plate × 10n × 100
Where n was the dilution factor
5.3.10 Analysis of experimental data
From the data obtained, specific growth rate (SGR), food conversion ratio (FCR),
body weight gain (BWG), protein efficiency ratio (PER) and survival rate (%) were
calculated after 56 days of the first feeding trial according to Chapter 3, paragraph 3.3.5.
The relative percentage of survival (RPS) of the fish was calculated after
challenge with Aeromonas hydrophila according to (Amend & McDowell, 1983)
RPS = 1-(% mortality in cricket meal group / % mortality in control group) × 100.
5.3.11 Statistical analysis
All data were subjected to one-way analysis of variance (ANOVA) using SPSS
version 21.0 (SPSS Inc., Chicago IL, USA). The differences between means were
compared by Duncan’s post hoc test at 5% (P < 0.05) probability level. Data are
presented as mean ± standard error (SE).
Page 110
94
Table 5.1: Formulation (g kg-1
) and nutritional profile (%) of experimental diets.
Replacement (%)
Ingredients (g kg-1
) Control 6 30%CP
5 35%CP
5,6 40%CP
5,6
Fishmeal 350.0 0 0 0
Cricket meal 0 300.0 350.0 400.0
Soybean meal 184.7 117.7 195.1 287.5
Corn starch 114.3 297.5 234.6 254.7
Rice bran 336.0 269.8 205.3 42.8
Vitamin premix1 2.0 2.0 2.0 2.0
Mineral premix2 3.0 3.0 3.0 3.0
DCP 10 10.0 10.0 10.0
Total 1000 1000 1000 1000
Nutrient level determined by as is basis (% Dry matter basis)
Dry matter 94.28 94.36 94.42 94.06
Crude protein 36.55 29.70 34.70 40.20
Crude fat 10.03 10.80 11.82 11.76
Crude ash 9.00 9.97 9.70 8.18
Crude fiber 3.50 3.02 4.90 5.77
Chitin - 2.40 2.70 3.00
Gross Energy (kJ/g) 3 18.93 18.60 18.86 19.24
NFE4 35.20 40.87 33.3 28.15
1The vitamin premix supplied the following per 100 g diet: Vitamin A, 500 IU; Vitamin
D3, 100IU; Vitamin E, 0.75 mg; Vitamin K, 0.02 mg; Vitamin B1, 1.0 mg; Vitamin B2,
0.5 mg; Vitamin B3, 0.3 mg; Vitamin B6, 0.2 mg; Vitamin B12, 0.001 mg; Vitamin C,
0.1 mg; Niacin, 0.2 mg; Folic Acid, 0.1 mg; Biotin, 0.235 mg; Pantothenic acid, 1.0 mg,
Inositol, 2.5 mg
Page 111
95
Table 5.1 continued
2The mineral premix supplied the following per kg diet: Selenium, 0.2 mg; Iron, 8 mg;
Manganese 1.0 mg; Zinc, 8.0 mg; Copper, 0.15 mg; Potassium Chloride, 0.4 mg;
Magnesium Oxide, 0.6 mg; Sodium Bicarbonate, 1.5 mg; Iodine, 1.0 mg; Cobalt, 0.25
mg.
3 Gross energy for every diets and body composition was calculated using the following
factors: crude protein = 23.9 kJ/g, crude lipids = 39.8 kJ/g and NFE = 17.6 kJ/g (Schulz
et al., 2005).
4NFE= % Dry matter - (% crude protein + % crude fat + % crude ash+ % crude fiber)
5Diets used in the first feeding trial
6Diets used in the second feeding trial
Page 112
96
5.4 Results
In this study, the level of dietary protein influenced growth parameters.
Significantly high levels of weight gain, specific growth rate and protein efficiency ratio
were observed in fish fed with 35% crude protein diet (P < 0.05) (Table 5.2). Food
conversion ratio was lowest in the diet of 35% CP, although no significant difference
was found in the diet of 40% CP. The result demonstrated that fish fed with dietary
protein at 30% shows the lowest growth response but improved (P < 0.05) as the dietary
level increased to 35% CP and slightly diminished as the level reached 40% CP.
However, the survival rate for all treatments remains at 100% throughout the
experimental period. These indicate that diet with 35% CP level satisfied the
requirement to achieve best growth performance for African catfish. In the second
experiment, dietary 35% and 40% were selected due to the insignificant differences
observed between both diets in terms of BWG and SGR compared to 30% group.
Page 113
97
Table 5.2: Growth performance of fish fed the experimental diets.
1Values are the mean ± SEM of triplicate groups of 15 fish.
2Mean values in the same row with different superscript letters are significantly
different (P<0.05)
White blood cell (WBC) count of fish fed control diet was significantly lower
than cricket meal fed-fish (Table 5.3). However, the values did not differ among fish fed
cricket meal diets. A significant reduction (P < 0.05) in total protein was detected in
control group whereas no significant differences were observed in both cricket meal
groups. On the other hand, the level of albumin did not show significant differences
among all diets (P > 0.05). The globulin concentration significantly decreased in the
control group although no significant difference was observed in the 40% CP cricket
meal fed fish. Similarly, lysozyme activity of those fed the control diet reduced
significantly (P < 0.05) when compared to cricket meal diet.
Variable 30%CP 35%CP 40%CP
TFI (g fish-1
) 56.44 ± 1.80 b 57.90 ± 1.48
b 51.93 ±1.87
a
BWG (g fish-1
) 10.70 ± 0.43a 15.54 ± 0.67
b 13.26 ± 0.38
ab
FCR (g/g) 1.94 ± 0.81a 1.5 ± 0.45
a 1.6 ± 0.12
a
SGR (g/g) 1.99 ± 0.11a 2.55 ± 0.17
b 2.28 ± 0.23
ab
PER (g/g) 1.86 ± 0.04a 2.29 ± 0.10
b 1.95 ± 0.09
a
SR (%) 100a 100
a 100
a
Page 114
98
Table 5.3: Biochemical parameters, WBC and lysozyme activity of African catfish
fed with experimental diets
1Values are the mean ± SEM of triplicate groups of 10 fish.
2Mean values in the same row with different superscript letters are significantly
different (P < 0.05)
The intramuscular injection resulted in 90% mortalities in fish fed with fishmeal
diet (Figure 5.1) within 8 days of post inoculation whereas the fish fed with 35% and
40% dietary protein of cricket meal caused 30% and 27% mortalities after 5 and 8 days
of post-injection respectively. The relative percentage of survival (Table 5.4) proved
that fish fed with diet containing 35% and 40% CP cricket meal showed no significant
difference (P > 0.05) and they were more tolerant to these diets since higher survival
were recorded in both diets than control.
Parameters Control 35% CP 40% CP
WBC (103 mm
3) 13.56 ± 0.86
a 18.46 ± 0.75
b 19.17 ± 0.13
b
Total protein (mg/dL) 53.42 ± 5.59a 59.71 ± 7.81
b 61.14 ± 6.15
b
Albumin (mg/dL) 1.90 ± 0.12a 1.98 ± 0.16
a 2.19 ± 0.22
a
Globulin (mg/dL) 51.52 ± 5.49a 57.73 ± 7.76
b 58.95 ± 6.08
b
Lysozyme (U/ml) 8.4 ± 1.16a 19.6 ± 2.71
b 22.2 ± 2.54
b
Page 115
99
Figure 5.1: Cumulative mortalities of fish fed with cricket meal and fishmeal
(control) in 12 days post- challenge with Aeromonas hydrophila infection
Table 5.4: Relative percentage of survival and mortality of fish fed with cricket
meal and fishmeal (control) in 12 days post-challenged with Aeromonas hydrophila
1 Fish were challenged by intramuscular injection with 1.6 x 10
7 cfu/ml of Aeromonas
hydrophila
2 All groups consisted of 30 fingerlings
0
10
20
30
40
50
60
70
80
90
100
0 1 2 3 4 5 6 7 8 9 10 11 12
Cu
mu
lati
ve
mo
rta
liti
es,
%
Post-challenge days
Control
35%CP
40%CP
Diets Survival (%) Mortality (%) RPS (%)
Control 10 90 -
35% CP 70 30 66.7
40% CP 73 27 70
Page 116
100
To confirm the pathogenicity of Aeromonas hydrophila, the bacteria were isolated
from the liver and intestines of experimental infected fish into Mueller-Hinton agar
(Figure 5.2). Table 5.5 demonstrated that the highest bacterial load was found to be 5.82
x 107 cfu/g in the intestine of the control group while the lowest was 1.34 x 10
5 cfu/g in
the liver of fish fed with 35% CP cricket meal diet.
Table 5.5: Bacterial load in liver and intestine of fish challenged with Aeromonas
hydrophila
1 Liver and intestine were excised from dead and infected fish
Figure 5.2: Bacteria isolated from intestine of infected African catfish 12 days
post-challenge
Diets Liver (cfu/ml) Intestine (cfu/ml)
Control 6.25 x 10⁵ 5.82 x 10
7
35% CP 1.34 x 10⁵ 3.22 x 10
6
40% CP 1.51 x 10⁵ 4.05 x 10
6
Page 117
101
5.5 Discussion
Proteins are biomolecules that are composed of 50% carbon, 16% nitrogen, 21.5%
oxygen and 6.5% hydrogen. Due to the fact that protein is one of the most expensive
component in fish feed, protein requirement for each fish cultured need to be taken into
consideration. Wastage of dietary protein due to non-quantification of accurate protein
requirement by using any protein source in the fish feed will lead to profit reduction and
most importantly to environmental issues. Although fish are capable of ingesting high
protein diet, approximately 65% of the protein consumed might be excreted as ammonia
(NH3) as well as solid waste (Craig & Helfrich, 2009). Hence, the optimum level of
dietary protein not only will promote high growth and feed efficiency but also reduce
water quality deterioration especially in intensive fish farming or recirculating
aquaculture systems (Oishi et al., 2010).
The results of the present study clearly show that dietary cricket meal of 35%
crude protein level enhanced the growth of African catfish. The optimum protein levels
in the diet for African catfish defined by weight gain, FCR, PER and SGR was found to
be 35%. This finding is consistent with a report from past studies by Farhat and Khan
(2011) which recommended the inclusion of protein in the range of 34.4% - 39.6% to
optimize the growth potential in African catfish fingerling. However, the protein
requirement in this study is higher than the required amount suggested for Clarias
batrachus with 30% inclusion level (Chuapoehuk, 1987), although higher values (40 –
55%) were suggested for warm water fish in general (NRC, 1983).
Protein or amino acids are essential for growth, reproduction and replacement of
depleted tissue. The amino acid is converted to glucose as an energy source for the brain
and red blood cells. The optimum crude protein in the fish diet may vary due to
different factors including water quality, diet composition, protein quality, digestibility,
Page 118
102
fish size and genetics (Akiyama et al., 1997; De Silva et al., 2000; Fatma Abidi &
Khan, 2010; Shearer, 2000). In the present study, fish fed with 30% CP shows
depressed growth after 56 days of feeding. This may be attributed to insufficient
digestible energy to crude protein (DE/P) ratio due to lower crude protein level
(Robinson et al., 2006). At each protein level, feed consumption was reduced in diets
with the highest energy levels. Growth depression was also observed as the diet reached
up to 40% CP when dietary energy becomes too high, the feed consumption is reduced,
resulting in less intake of essential nutrients (Farhat & Khan, 2011; Robinson et al.,
2006).
In the second experiment, the white blood cell count showed a significant
increased level in the fish fed cricket meal diet. White blood cells play an important role
in non-specific immunity and indicator of fish health status. Hence, increase WBC’s
count reduce the immunosuppression caused by Aeromonas hydrophila diet due to the
presence of chitin as immmunostimulant in cricket meal. This result is also supported
by other works that reported an increase in WBC count in Labeo rohita juveniles when
fed with levamisole and ascorbic acid (Choudhury et al., 2005) and garlic peel in
African catfish diet (Thanikachalam et al., 2010).
The plasma/serum protein particularly albumin and globulin play a major role in
maintaining immune response of fish. In the present study, increased plasma protein and
globulin of fish fed with cricket meal suggests a stronger immune response of fish fed
this diet. Previous research by Siwicki (1990) has reported an elevated level of serum
total protein when β-glucan (0.2%) and chitosan (0.5%) in common carp diet. Besides,
increased in total protein, albumin and globulin were also observed in olive flounder fed
with chitosan (Dautremepuits et al., 2004a).
Page 119
103
Lysozyme activity has been primarily used as a defense mechanism of
nonspecific humeral immunity that could disrupt the cell wall of harmful pathogens
invaders particularly parasites, bacteria and virus. It has been reported to have anti-
bacterial activity, which could cause lysis and stimulate phagocytosis in bacteria (Ellis,
1999). The increase in lysozyme activity of fish fed with cricket meal suggested that the
presence of chitin could enhance the lysozyme activity in fish and can be considered to
be a natural protective mechanism in fish. A number of studies indicate that chitin and
chitosan, as well as herbal supplementation enriched diet could elevate lysozyme
activity in fish. Diet enriched with 1% chitin has been reported to increase lysozyme
activity in Cirrhina mirgala (Mari et al., 2014) while Esteban et al. (2001) reported no
significant differences between 100 mg/kg chitin and control diet fed to gilthead
seabream. Based on previous studies in Cyprinus carpio, dietary inclusion of chitosan
induced significantly higher lysozyme activity in chitosan fed fish followed by
levamisole and chitin (Gopalakannan & Venkatesan, 2006). On the other hand, African
catfish fed supplemented indigenous plant has also been reported to increase lysozyme
activity (Kumar et al., 2013).
Disease resistance was measured by determining the survival of the animal after
being challenged with certain pathogen (Palti et al., 1999). Fish are most susceptible to
bacteria and virus due to direct contact with the environment. The mucus and skin or
scales are natural barriers to foreign substances, and act as non-specific or innate
defense mechanism thus suppressing the colonization of fish pathogen. These
mechanisms prevent the attachment, invasion or multiplication of the invaders on or in
the tissues. In the current study, RPS of fish fed with cricket meal was higher (66.7-
70%) up to 12 days post-injection in comparison to fishmeal diet. Relative percentage
Page 120
104
survival values exceeding 50% indicates a positive effect of the vaccine (Amend &
McDowell, 1983).
From the observation after the challenge, all fish developed clinical sign such as
loss of balance, spreading of grayish – white lesion on the surface of the body up to
caudal fin and the fin bases become reddish in color. These clinical symptoms were
observed in all fish. However, the group fed with cricket meal showed wound recovery
after six days post-challenge with no loss in appetite and hence consumed their
respective feed up until 12 days after challenge. As a result, the mortality rate was
reduced and they stop dying after 8 and 5 days post-infection for 40% CP and 35% CP
respectively. This situation might be due to enhancement of the non-specific immune
system of the fish by cricket meal. On the other hand, the control group exhibited highly
stressed condition and thus did not consume their feed and consequently most of them
died after 12 days post-challenge.
Figure 5.3: Fish fed with cricket meal showed recovered wound (arrow) on the
injected area 6 days post-challenge
Page 121
105
Wang et al. (2005) have reported that field crickets contain 8.7% chitin; a
compound which has strong experimental evidence as an effective immunostimulant in
various fishes and also has the ability to improve growth performance of snow trout and
golden mahseer (Mohan et al., 2009). Some studies have also demonstrated the potency
of chitin as immunostimulators that could enhance immune response, disease resistance
and survival of fish and shellfish (Esteban et al., 2001; Kawakami et al., 1998; Sakai et
al., 1992). Mari et al. (2014) have observed approximately 70% reduction of mortalities
of Cirrhina mrigala against Aphanomyces invadans bacteria when fed 10% chitin
supplemented diet. On the other hand, a diet containing 0.75% chitin shows a
significantly high RPS (63.16%) in Macrobrachium rosenbergii compared to chitin-free
diet when challenged against white tail disease viruses. However, studies using insects
meal to evaluate the effect on immunostimulant is very limited. At present, housefly,
Musca domestica have proven to provide increased protection against Edwardsiella
trada and significantly enhanced peritoneal phagocytic activity in red sea bream (Ido et
al., 2015).
The intestine and liver tissues of African catfish infected with Aeromonas
hydrophila were cultured to confirm death as a result of Aeromonas hydrophila and the
pathogenicity test was also conducted to determine the bacterial loads isolated in both
livers and intestines of fish fed the experimental diets. Based on bacterial isolation from
the fish after the challenge, the intestine showed higher bacteria load than liver. This
was also observed in the climbing perch with 9.4 x 10⁸ cfu/g and 2.9 x 10
6 cfu/g in
intestine and liver respectively (Hossain et al., 2013). In addition, Asian stinging
catfish, Heteropneustes fossilis also exhibited higher levels of bacteria accumulation in
intestine (1.8 x 10⁹ cfu/g) than liver (6.46 x 10
8 cfu/g) (Mostafa et al., 2008). However,
a finding by Sarkar and Rashid (2012) in their study indicated that walking catfish,
Page 122
106
Clarias batrachus showed higher bacterial load in the liver (6.5 x 10⁸ cfu/g) compared
to intestine (5.6 x 10⁷ cfu/g). Thus, it was proven that Aeromonas hydrophila was
pathogenic to African catfish, which caused 90% mortalities if the fish were only fed
with fishmeal without any immunostimulant.
5.6 Conclusion
These findings suggested that in general, cricket meal with 35% crude protein
level were able to improve growth performance and reduce disease resistance against
pathogenic Aeromonas hydrophila as it enhances the non-specific immunity of African
catfish. Antibody produced from the immunostimulatory effect on cricket meal plays a
role in conferring significant protection against Aeromonas hydrophila infection on
catfish. Thus, cricket meal can act as an immunostimulant and potential protein sources
in African catfish diet. Further studies need to be carried out to isolate and characterize
the active compound in cricket meal other than chitin that was responsible for
antibacterial activity and determines other biochemical aspects of the fish against
Aeromonas hydrophila.
Page 123
107
CHAPTER 6: THE EFFECT OF DIETARY CRICKET MEAL (Gryllus 1
bimaculatus) ON GROWTH PERFORMANCE, ANTIOXIDANT ENZYME 2
ACTIVITIES AND HAEMATOLOGICAL RESPONSE OF AFRICAN CATFISH 3
(Clarias gariepinus). 4
6.1 Introduction 5
6
Today, insects meal are gaining acknowledgement from researchers for their 7
potential as fishmeal replacement. However, a major concern associated with the use of 8
insects is the possibility of the presence of harmful substance or compound in the 9
insects that could cause unfavorable physiological effects on fish which could lead to a 10
reduction in growth performance (Barros et al., 2002; Zheng et al., 2012) and 11
occurrence of abnormalities in haematological parameters (Dabrowski et al., 2001; Yue 12
& Zhou, 2008). 13
Crickets belong to the Orthoptera order of insects, which was reported to have a 14
high crude protein level ranging from 55% to 73% and sufficient essential amino acid 15
except for methionine and lysine, which can be supplied directly in the feed (Barroso et 16
al., 2014; Finke, 2002). Presently, live crickets are commercially available in pet stores, 17
supplied as fish baits or supplementary feed for ornamental fish such as Arowana and 18
reptiles such as iguana due to their high nutritional value. Previous study by Taufek et 19
al. (2013) have reported that cricket meal can replace up to 100% of fishmeal and 20
produced better growth performance than the control diet in African catfish nutrition. 21
Hence, this study was conducted due to its importance in assessing the suitability 22
of cricket meal in African catfish nutrition without compromising on their growth and 23
feed efficiency. Thus, the aim of this research was to elucidate the influence of the field 24
Page 124
108
cricket, Gryllus bimaculatus as full or partial substitute for fishmeal on growth, 25
antioxidant response and hematological parameters in African catfish. 26
6.2 Literature Review 27
28
Reactive oxygen species (ROS) affects all aerobic organisms including fish. It is 29
regarded to be major mediators of oxygen cytotoxicity (Buetler et al., 2004). In 30
response, animals developed an antioxidant defense mechanism to combat the action of 31
ROS. Lacking in antioxidant defense will increase ROS, resulting in oxidative stress 32
(Jacob, 1995). This mechanism involves various antioxidant compounds, consisting of 33
dietary tocopherol, vitamin C and antioxidant defense enzymes (Buettner, 1993). The 34
oxidation of lipid present in the feed could affect palatability of the feed, therefore 35
reducing feed intake and fish growth. Besides, amino acids, fatty acids, vitamins and 36
minerals deficiencies can also affect feed intake (Ogunji et al., 2007). 37
A number of enzymes known to have major antioxidant activity in fish including 38
superoxide dismutase (SOD) (EC 1.15.1.1) which is responsible for catalyzing the 39
reduction of superoxide anion (O2−) to hydrogen peroxides (H2O2) while catalase (CAT) 40
(EC 1.11.1.6) is accountable for reducing H2O2 to H2O. Another enzyme activity that 41
has been and is continuously being studied in fish is Glutathione S-transferase (GST) 42
(EC 2.5.1.18), which is in charge of the detoxification of foreign compounds. This 43
enzyme catalyzes the conjugation of glutathione reduced form (GSH) with compound 44
containing electrophilic center through the formation of a thioether bond between the 45
sulphur atom of GSH and the substrate (Chasseaud, 1979; Mannervik, 1985). The 46
activities of these enzymes may differ in organs and tissues of freshwater and marine 47
fish (Wdziȩczak et al., 1982). Other factors that determine the activities of antioxidant 48
enzymes in fish can include feeding behavior, environmental condition and other 49
Page 125
109
ecological backgrounds (Radi & Matkovics, 1988; Roche & Bogé, 1996; Winston & Di 50
Giulio, 1991). 51
Haematological indices are essential tools as an indicator to evaluate the 52
physiological and physiopathological changes in fish (Hrubec et al., 2000; Rainza-Paiva 53
et al., 2000). Stocking density and feeding habits are among the ecological factors that 54
influence biochemical parameters (Barnhart, 1969; Turnbull et al., 2005). Besides that, 55
pollutant and other environmental factors could also induce the variations in 56
haematological parameters. 57
58
6.3 Material and method 59
6.3.1 Experimental diet 60
61
Adult live field cricket and all raw ingredients were purchased and 62
processed according to the experimental diet procedure elaborated in Chapter 3, 63
paragraph 3.3.1. 64
Formulation and chemical composition of all the experimental diets and 65
feed ingredients are tabulated as in Table 6.1. Three formulated isonitrogenous and 66
isoenergetic diets (35% crude protein and 19 kJ/g respectively) were used in the feeding 67
trials. They were; 100% cricket meal (100% CM), 75% cricket meal (75% CM) and 68
100% fishmeal (100% FM). The 100% FM acted as control. The experimental diets 69
were chosen according to the previous result in Chapter 3. Winfeed version 2.8 software 70
was used to formulate the diets. 71
72
73
74
Page 126
110
6.3.2 Experimental Fish and set-up 75
76
African catfish, (Clarias gariepinus) were obtained from local farmers and 77
transported to the Freshwater Aquarium Laboratory located at the Institute of Biological 78
Sciences, Faculty of Science, University of Malaya. The fingerlings were randomly 79
divided into three groups each in triplicates of 10 fishes (average weight 13.2 ± 0.3 g). 80
All the fish were acclimatized to natural environmental conditions for 2 weeks prior to 81
the feeding trials and fed with commercial diets twice per day during the acclimatization 82
period. The feed was given twice daily ad-libitum during the trials for over forty-nine 83
days. Total feed intakes were recorded and all uneaten food was collected after feeding 84
and weighed to determine the total feed consumed. Water quality was monitored 85
regularly and any mortality was recorded. Nine plastic tanks (3’ x 2’ x 1’) with a 86
capacity of 100 liters of water with closed re-circulation system were used in these 87
feeding activities. The tanks were equipped with top filter pumps at a flow rate of 20 88
L/min together with an aeration diffuser in each tank for circulation of dissolved 89
oxygen. Dechlorinated tap water was used and 20-30% of water was replaced once 90
within two days to maintain water quality. 91
The water quality for all tanks were measured according to the method by 92
APHA (1992) as described in Chapter 3, paragraph 3.3.2 93
6.3.3 Proximate and chemical analysis 94
95
The experimental diets and ingredients were analyzed for proximate 96
composition according to the Association of Official Analytical Chemist methods 97
(AOAC, 2003) as described in Chapter 3, paragraph 3.3.3. Kjedahl method was used to 98
analyze crude protein after acid digestion (FOSS Tecator Digestor Auto). Moisture and 99
dry matter were measured by drying in an oven at 105°C to constant weight. 100
Page 127
111
Meanwhile, ash was determined by combustion in a muffle furnace (Naberthem) at 101
600°C. Crude lipid content was measured by using petroleum ether extraction (FOSS 102
Soxtec 2055) according to Soxhlet method. Fiber was determined after alkali and acid 103
digestion. Chitin was estimated by using the acid detergent fiber (ADF) and protein 104
residue of ADF according to Marono et al, (2015). Nitrogen free extract (NFE) was 105
calculated as = 100 - (% crude protein + % crude fat + % crude ash). Gross energy for 106
every diets and body composition was calculated using the following factors: crude 107
protein = 23.9 kJ/g, crude lipids = 39.8 kJ/g and NFE = 17.6 kJ/g according to Schulz et 108
al. (2005). 109
6.3.4 Amino acid analysis 110
111
Amino acid profiles for diets was determined using the High Performance 112
Liquid Chromatography (HPLC) (JASCO CO-2065 Plus, Intelligent Column Oven) and 113
the contents were determined by comparison peak retention times to a known standard 114
by using the Pico-Tag method by Heinrikson and Meredith (1984) while Tryptophan 115
was determined after alkaline hydrolysis according to Nielsen and Hurrell (1985) as 116
described in Chapter 3, paragraph 3.3.4. 117
6.3.5 Sample preparation 118
119
After 7 weeks of feeding trials, liver and blood samples were randomly 120
collected from five fishes in each tank. The sacrificed fish were marked individually 121
and their body weights, as well as liver weights were recorded accordingly. The livers 122
were excised and weighed in order to obtain the hepatic somatic index (HSI%). A total 123
of 0.6 g of each liver was homogenized in 6 ml buffer containing 25 mM sodium 124
phosphate buffer (pH 7.4), 0.1 mM protease inhibitor, 1.0 mM EDTA, 0.1 mM 125
dithiothreitol (DTT) and 0.1 mM phenylthiourea (PTU). The homogenates were 126
Page 128
112
centrifuged at 100,000 ×g (Beckman 80Ti) for 30 minutes at 4°C and the supernatants 127
were stored at -80°C for further analysis. 128
Prior to liver collection, blood was collected from five fish in each tank. 129
About 500 μL of blood from each fish was sampled from caudal circulation, which was 130
divided into two portions; one for haematological parameters and another for plasma 131
protein analysis. The blood was drawn using 1 ml syringe with needle size of 22G 1½ 132
inch and placed in anti-coagulant tubes before being stored in a refrigerator (4°C) until 133
its use for further haematological analysis. Another portion was centrifuged at 3500 rpm 134
for 15 minutes to obtain plasma and later stored in a -80°C freezer until plasma protein 135
analysis. 136
6.3.6 Haematological parameters analysis 137
138
Red blood cell (RBC) and white blood cells (WBC) counts were done 139
microscopically using Neubauer haemocytometer (Assistant, Germany). Isotonic saline 140
(0.85%) was used for RBC diluent while 3% acetic acid (v/v), 1% gelatin violet (w/v) 141
and a drop of methylene blue were mixed for WBC diluting fluid. The blood samples 142
were diluted at 1:200 and 1:20 for RBC and WBC respectively, with triplicate counts 143
for each sample. 144
Hematocrit (Ht) was analyzed using capillary tubes and spun at 12,000 rpm for 5 145
minutes in a microhematocrit centrifuge. The result was then measured according to 146
microcapillary reader. Hemoglobin (Hb) was determined by calorimetric 147
cyanmethemoglobin method as described by Baker and Silverton (1985). Human 148
hemoglobin (Sigma-Aldrich) was used as standard and 5 ml of Drabkin’s Reagent 149
(Sigma-Aldrich) was diluted with 20 μl of whole blood sample and incubated for 15 150
minutes. The samples were measured at an absorbance of 540 nm. 151
Page 129
113
Red blood indices, which include mean corpuscular volume (MCV), mean 152
corpuscular hemoglobin (MCH) and mean corpuscular hemoglobin concentration 153
(MCHC) were also calculated. 154
6.3.7 Liver protein concentration 155
156
Protein concentration of liver were determined by using Bradford assay as 157
described in Chapter 5, paragraph 5.3.5 158
159
6.3.8 Oxidative stress parameters 160
6.3.8.1 Catalase 161
162
Catalase (CAT) (EC 1.11.1.6) activity was assayed according to Claiborne 163
(1985). The 50 mM Sodium phosphate buffer was prepared and adjusted to pH 7.0 at 164
25°C by using 1M hydrochloric acid. Then, hydrogen peroxide (H2O2) (19 mM) was 165
prepared by using sodium phosphate buffer. In a 3 ml reaction mix, 2.65 ml of sodium 166
phosphate buffer, 50 μl of samples and 300 μl of H2O2 were added to a cuvette. The 167
reaction was quantified at 25°C by measuring the disappearance of H2O2 at 240 nm 168
within 5 minutes. CAT activity was reported in terms of nmol H2O2 169
consumed/min/mg/protein (ε 240 nm = 0.0436 mM/cm). 170
Calculation 171
Enzyme activity: [DA240nm
min´ (sample-blank)´3´df ]
0.0436´ sample(ml) 172
Specific activity (nmol): Enzyme activity ⁄ protein concentration of sample 173
174
175
Page 130
114
6.3.8.2 Superoxide dismutase 176
177
Superoxide dismutase (SOD) (EC 1.15.1.1) activity was measured 178
according to the method of McCord and Fridovich (1969). SOD assay is composed of 179
solution A, which contains 25 ml of 200 mM sodium phosphate buffer (pH 7.8), 50 ml 180
of 0.01 mM xanthine, 1 ml of 1.1 mM cytochrome c and 1 ml of 10.70 mM 181
Ethylenediaminetetraacetic acid sodium salt dihydrate (EDTA). All reagents were 182
reconstituted in 100 ml beaker and mixed well. A small amount of 1 M NaOH was 183
added to dissolve xanthine and pH was adjusted to 7.8 with 1 M HCl at 25°C. The 184
solution was then transferred to a volumetric flask and made up to 100 ml with purified 185
water. 186
Xanthine oxidase (XOD) was prepared in ice-water containing approximately 187
0.08unit/mg immediately before its use. A total of 2.8 ml solution A was pipetted into 4 188
cuvettes, each in duplicate samples of blank and XOD. The absorbance was monitored 189
spectrophotometrically at 550 nm in 25°C until constant and then 200 μl of purified 190
water was added into the blank cuvette while 100 μl of purified water and 100 μl of 191
XOD reagent was added to the respective XOD cuvettes. The increase in absorbance 192
was monitored for approximately 5 minutes and the change of absorbance for the XOD 193
cuvettes versus the blank for this reaction were maintained at 0.025 ± 0.005. 194
All reagents were equilibrated to 25°C prior to the beginning of the assay. A total 195
of 2.8 ml of solution A was added to the sample cuvette and 100 μl of samples were 196
added. Each sample was monitored in triplicate. The absorbance was observed at 197
550 nm until constant, then 100 μl of XOD were added into all samples cuvettes. The 198
inversions were mixed thoroughly and increases in absorbance at 550 nm within 5 199
minutes were observed. The fastest linear rate over 1 minute interval for the XOD 200
Page 131
115
reaction was recorded. The rates for each sample and blank were obtained by using this 201
time interval. The ΔA550 nm for each sample was within 20 - 60% of the XOD rate. In 202
the reaction mix, the final concentration consisted of 50 mM Sodium phosphate buffer, 203
0.1mM EDTA, 0.01 mM cytochrome c, 0.05 mM xanthine and 0.008 mM xanthine 204
oxidase. SOD activity was calculated by its ability to inhibit 50% reduction of 205
cytochrome c and the result is expressed as nmol/min/mg/protein. 206
207
Calculation 208
Percent inhibition: [DA550nm
min´ (XOD- sample)´100]
DA550nmmin
´ (XOD-blank) 209
Specific activity: (%inhibition´df )
50%´ sample(ml)´ sample(protein) 210
6.3.8.3 Glutathione S-transferase 211
212
Glutathione S-transferases (GST) (EC 2.5.1.18) was evaluated by measuring the 213
activity towards 1-Chloro-2,4-dinitrobenzene (CDNB) at 340 nm as described by Habig 214
et al. (1974). In a 3 ml cuvette, the assay contains 2.85 ml of 100 mM sodium phosphate 215
buffer (pH 6.5), 50 μl of 60 mM glutathione (GSH) (dissolve in sodium phosphate 216
buffer), 50 μl of samples and 50 μl of 60 mM CDNB (dissolve in ethanol). Each sample 217
was monitored in triplicate. One unit of GST activity was calculated as the amount of 218
enzyme catalyzing the conjugation of 1μmol of CDNB with GSH per minute at 25°C 219
(ε 340 nm = 9.6 mM/cm). The result is expressed as nmol/min/mg protein. 220
221
222
223
Page 132
116
Calculation 224
Enzyme activity: [DA340nm
min´ (sample-blank)´3´df ]
9.6´ sample(ml) 225
Specific activity (nmol): Enzyme activity ⁄ protein concentration of sample 226
6.3.9 Analysis of experimental data 227
228
From the data obtained, specific growth rate (SGR), food conversion ratio 229
(FCR), body weight gain (BWG), protein efficiency ratio (PER) and survival rate (%) 230
were calculated according to Chapter 3, paragraph 3.3.5. 231
Mean corpuscular volume (MCV), mean corpuscular hemoglobin (MCH) and 232
mean corpuscular hemoglobin concentration (MCHC) were calculated according to 233
Seiverd (1983). 234
MCV (fl) = Ht /Hb 235
MCH (pg) = (Hb´10)
RBC 236
MCHC (%) = Hb /Ht( )´100 237
6.3.10 Statistical Analysis 238
239
All data were subjected to one-way analysis of variance (ANOVA) using SPSS 240
version 21.0 (SPSS Inc., Chicago IL, USA). The differences between means were 241
compared by Duncan’s post hoc test at 5% (P < 0.05) probability level. Data are 242
presented as mean ± standard error of mean (SEM). 243
Page 133
117
Table 6.1: Formulation (g kg-1
) and nutritional profile (%) of experimental diets 244 245
Experimental diets (%)
Ingredients (g kg-1
) 100%CM 75%CM 100%FM
Fishmeal 0 87.5 350.0
Cricket meal 350.0 262.5 0
Soybean meal 195.1 286.1 335.5
Corn starch 234.6 83.9 99.4
Rice bran 205.3 265.0 200.1
Vitamin premix1 2.0 2.0 2.0
Mineral premix2 3.0 3.0 3.0
DCP 10.0 10.0 10.0
Total 1000 1000 1000
Nutrient level determined by as is basis (% Dry matter basis)
Dry matter 94.36 94.76 95.42
Crude protein 35.35 35.61 36.55
Crude fat 10.50 9.00 8.06
Crude ash 8.90 7.42 8.38
Crude fiber 5.14 4.51 3.29
Chitin 2.70 2.50 -
NFE3 40.1 42.46 41.72
Gross Energy4 19.69 19.57 19.29
246
1The vitamin premix supplied the following per 100 g diet: Vitamin A, 500 IU; Vitamin 247
D3, 100IU; Vitamin E, 0.75 mg; Vitamin K, 0.02 mg; Vitamin B1, 1.0 mg; Vitamin B2, 248
0.5 mg; Vitamin B3, 0.3 mg; Vitamin B6, 0.2 mg; Vitamin B12, 0.001 mg; Vitamin C, 249
0.1 mg; Niacin, 0.2 mg; Folic Acid, 0.1 mg; Biotin, 0.235 mg; Pantothenic acid, 1.0 mg, 250
Inositol, 2.5 mg 251
252
253
Page 134
118
Table 6.1 continued 254
2The mineral premix supplied the following per kg diet: Selenium, 0.2 mg; Iron, 8 mg; 255
Manganese 1.0 mg; Zinc, 8.0 mg; Copper, 0.15 mg; Potassium Chloride, 0.4 mg; 256
Magnesium Oxide, 0.6 mg; Sodium Bicarbonate, 1.5 mg; Iodine, 1.0 mg; Cobalt, 0.25 257
mg. 258
3NFE= 100- (%protein + %fat + % ash+ %fiber) 259
4Gross Energy was calculated as 23.9, 39.8, 17.6 kJ/g for protein, fat and NFE 260
respectively (Schulz et al., 2005) 261
Table 6.2: Essential Amino acids of cricket meal diets and African catfish 262
requirements 263 264
Experimental diets
Amino acids (g/100g protein) 75% CM 100% CM African catfish EAA
Histidine 2.25 2.23 1.21
Arginine 6.20 5.80 3.61
Threonine 3.62 3.51 2.81
Valine 5.29 5.32 2.41
Methionine 1.51 1.52 2.41
Isoleucine 3.93 3.86 2.01
Leucine 6.82 6.56 3.51
Phenylalanine 3.86 3.94 4.01
Lysine 4.53 4.79 4.81
Tryptophan 0.97 0.94 1.12
Methionine + Cystine * 2.69 2.75 2.4
265
* Non-essential amino acid 266
1 African catfish requirement according to Jimoh et al. (2014) 267
2 African catfish requirement according to Fagbenro and Nwanna (1999) 268
Page 135
119
6.4 Results 269
270
Chitin was estimated in the cricket meal diet based on chitin composition in raw 271
cricket meal. The raw cricket meal contains approximately 7.15% chitin after ADF 272
analysis, while the cricket meal diet used in this experiment was estimated to have 273
2.50% and 2.70% chitin for 75% CM and 100% CM, respectively. Throughout the 274
experimental period, water parameters were monitored regularly to ensure that the 275
results obtained in this study was not influenced by poor water quality. 276
The essential amino acid (EAA) tested in this study was compared with the EAA 277
requirement for catfish as reported by Jimoh et al. (2014), as well as Fagbenro and 278
Nwanna (1999) in Table 6.2. Generally, all essential amino acids were present in both 279
cricket meal diets with Leucine as the most abundant amino acid in both diets. The 280
values of amino acid in the diets containing cricket meal were higher or within the range 281
of African catfish requirements, except methionine. 282
The outcomes from the growth performance assessment as shown in Table 6.3 283
demonstrated that cricket meal was a good substitute for fishmeal as a protein source in 284
African catfish diet. Feed intake of fish fed with fishmeal was significantly lower (P < 285
0.05) than those fed with cricket meal. Total replacement of cricket meal (100% CM) 286
diet showed significantly higher weight gain compared to the control diet (100% FM), 287
but no significant differences in weight gain were observed between 75% CM and 288
100% FM diets. Feed conversion and protein efficiency ratio values were insignificant 289
(P > 0.05) between all diets, although 100% CM shows to be numerically the lowest 290
value of FCR and highest in PER. Specific growth rates were significantly higher (P < 291
0.05) in fish fed with cricket meal, but fishmeal-fed fish shows better results in terms of 292
Page 136
120
hepatosomatic index. Survival rates observed were more than 86.6% in all groups, 293
which suggested that all diets did not significantly affect survival rate. 294
Table 6.3: Growth performance of fish fed the experimental diets. 295 296
297
1The results represent means ± SEM of ten fish/tank with a total of thirty fish per diet 298
2Mean values in the same row with different superscript are significantly different (P < 299
0.05) 300
301
Haematological indices for all of the fish fed with the experimental diets were 302
shown in Table 6.4. The haemoglobin, MCH and MCHC appeared to show an 303
increasing trend with additional cricket meal in the diets and significantly higher values 304
(P < 0.05) were shown in 100% CM compared with the other groups. No significant 305
difference in red blood cell count and MCV were observed in all groups (P > 0.05), 306
while Ht demonstrated significantly higher values (P < 0.05) in fish fed with cricket 307
meal diet (31.08 - 33.05%) in comparison to the control diet and initial fish. White 308
blood cells were insignificantly different (P > 0.05) between cricket meal groups and 309
initial fish, but fishmeal fed-fish showed a significantly higher value compared to other 310
groups. The plasma protein values did not differ significantly throughout the diets, 311
Experimental diets
Variables 100%CM 75%CM 100%FM
TFI (g fish-1
) 39.90 ± 1.43b 38.00 ± 1.12
b 30.06 ± 1.36
a
BWG (g fish-1
) 35.70 ± 5.18b 30.63 ± 1.36
ab 19.20 ± 0.97
a
FCR (g/g) 1.17 ± 0.20a 1.24 ± 0.05
a 1.58 ± 0.08
a
SGR (g/g) 2.76 ± 0.23b 2.63 ± 0.10
b 1.93 ± 0.14
a
PER (g/g) 2.56 ± 0.38a 2.30 ± 0.10
a 1.82 ± 0.09
a
HSI (g/g) 1.22 ± 0.08a 1.20 ± 0.08
a 1.65 ± 0.09
b
SR (%) 90 ± 0.00 a 86.6 ± 3.33
a 90 ± 5.77
a
Page 137
121
which ranged from 3.84-5.16 mg/dl. Therefore, increasing dietary cricket meal 312
inclusion did not produce any effect on plasma protein levels in African catfish. 313
Table 6.4: Haematological and plasma biochemical parameters of African catfish 314
fed various experimental diets. 315 316
Parameters Initial 100%CM 75%CM 100%FM
Hb (g/dl) 6.33 ± 0.14c 8.83 ± 0.80
a 7.92 ± 0.31
b 7.21 ± 0.11
bc
Ht (%) 26.27± 0.51b 33.05 ± 0.48
a 31.88 ± 0.56
a 28.24 ± 0.88
b
RBC (106 mm
3) 1.73 ± 0.45
a 2.45 ± 0.60
a 2.35 ± 0.29
a 2.14 ± 0.005
a
WBC (103 mm
3) 7.13± 0.61
b 7.46 ± 0.75
b 7.54 ± 0.86
b 8.17 ± 0.13
a
MCV (fl) 69.69 ± 9.78a 73.07 ± 9.43
a 71.92 ± 5.83
a 69.97 ± 0.95
a
MCH (pg) 11.50 ± 2.07b 21.85 ± 3.13
a 14.12 ± 0.20
b 12.21 ± 0.25
b
MCHC (%) 16.50 ± 2.37b 30.11 ± 3.40
a 19.73± 1.31
b 18.40 ± 0.11
b
Plasma protein (mg/dl) 3.84 ± 0.01a 4.64 ± 0.27
a 5.16 ± 0.04
a 4.65 ± 024
a
317
1The results represent means ± SEM of five fish/tank with a total of fifteen fish per diet 318
2Mean values in the same row with different superscript are significantly different 319
(P<0.05) 320
Enzyme activities were assessed in the liver of African catfish that were fed with 321
the experimental diets. Catalase activity as well as weight gain for each fish were 322
recorded individually. However, mean initial weight for each tank was considered as the 323
initial weight for each fish. Catalase shows a significantly higher activity in 100% CM 324
group (173.13 ± 16.63), but decreased with a lower inclusion level of cricket meal in the 325
diets (Table 6.5). Increasing tendencies in African catfish liver CAT activities can be 326
correlated with increasing weight gain during the feeding trial (Figure 6.1). Glutathione 327
S-transferase and superoxide dismutase activities in 100% CM exhibited slightly 328
increased activities compared to other diets, but with no significant differences observed 329
in all groups for both enzymes. 330
331
Page 138
122
Table 6.5: Liver protein, Catalase (CAT), Superoxide dismutase (SOD) and 332
Glutathione S-transferase (GST) activity of African catfish fed experimental diets. 333
334
1The results represent means ± SEM of five fish/tank with a total of fifteen fish per diet 335
2Mean values in the same row of the same experiment with different superscript are 336
significantly different (P < 0.05) 337
338
339
Figure 6.1: Correlations between catalase activity and mean weight gain of fish fed 340
experimental diets. 341 342 1The results represent means ± SEM of five fish/tank with a total of fifteen fish per diet 343
344
y = 0.2168x - 0.3926
R² = 0.8055
0
10
20
30
40
50
60
70
0 50 100 150 200 250 300 350
Wei
gh
t g
ain
(g
)
CAT activities (nmol mg-1 protein)
Experimental diets
Enzymes and liver protein 100%CM 75%CM 100%FM
Liver protein (mg/ml) 0.600 ± 0.01a 0.610 ± 0.014
a 0.652 ± 0.027
a
CAT (nmol/mg protein) 173.13 ± 16.63a 121.53 ± 14.65
b 103.69 ± 11.93
b
SOD (nmol/mg protein) 26.83 ± 0.24a 25.14 ± 0.16
a 24.99 ± 0.22
a
GST (nmol/mg protein) 191.53 ± 13.9a 189.36 ± 13.7
a 176.83 ± 19.5
a
Page 139
123
6.5 Discussion
To date, there is no reliable study on cricket meal as formulated feed for fish.
Hence, the present study was conducted to evaluate the growth and biochemical aspects
of fish when given cricket meal as the main protein ingredient in comparison to
fishmeal in fish feed. However, there are numerous studies, which evaluated cricket
meal as poultry feedstuff with a positive effect. Previous studies by Ramos-Elorduy
(2008) highlighted that Mormon cricket meal, Anabrus simplex can replace fishmeal
and soybean entirely in the broiler diet. Similar findings were reported by Nakagaki et
al. (1987) and DeFoliart et al. (1982) who found significantly better growth of broiler in
cricket meal-based diet compared with corn diet. Wang et al. (2005) also indicated that
15% of field cricket meal, Gryllus testaceus supplementation could replace fishmeal
diet without adverse effects on broiler’s weight gain.
Insects are very efficient at transforming a wide variety of organic matter into an
edible mass, which was partly due to the fact that they are cold-blooded animals.
Therefore, they utilize less energy to regulate body temperature. Other than their
beneficial effect of sustainable and smaller ecological footprint, insect farming reduces
the amount of water and land used dedicated to grow food or livestock. Insect meal was
widely studied in recent years and is considered as a sustainable substitute for fishmeal
in fish diet. Numerous insects had been explored to be utilized in fish feed including
grasshopper (Z. variegatus), termites (M. subhyalinus), maggot (M. domestica), meal
worms (T. molitor), silkworm pupae (B. mori), and black soldier fly (H. illucens) as fish
feed and have proven to be good candidates for fishmeal replacement (Alegbeleye et al.,
2012; Ng et al., 2001; Ogunji et al., 2011; Sogbesan & Ugwumba, 2008; St‐Hilaire et
al., 2007).
Page 140
124
The inclusion of up to 80% mealworm in African catfish diet was reported to
produce similar growth as fishmeal diet. On the other hand, silkworm meal could
substitute up to 75% protein in Asian stinging catfish without reducing growth
performance. Similarly, tilapia were able to accept silkworm pupae meal, which
resulted in high protein digestibility (85-86%) (Henry et al., 2015; Makkar et al., 2014).
However, in Orthoptera insects, grasshopper meal and locust meal could only replace
up to 25% of fishmeal without affecting growth and nutrient utilization of African
catfish (Alegbeleye et al., 2012; Balogun, 2011). According to Alegbeleye et al. (2012),
a higher inclusion of grasshopper meal reduced digestibility due to the presence of
chitin.
The growth and nutrient efficiency of the fishes increased as cricket meal level
increased in their diets. Significant reduction in feed consumption was observed in fish
fed with dietary fishmeal, which might be attributed to the lower freshness level of
fishmeal compared to cricket meal. Reducing level of freshness in the feed will be less
favourable to the fish which resulted in a lower feed intake (Suarez et al., 1999). Weight
gain elevates considerably in full cricket meal diet compared to fishmeal that results in
higher SGR value in cricket meal fed fish. Feed conversion ratio and protein efficiency
ratio did not differ significantly between cricket meal and fishmeal diet, although
numerically better values were observed in 100% CM fed fish, therefore suggesting the
possibility that a full replacement of fishmeal with cricket meal could yield a positive
growth response in African catfish juveniles. Higher hepatosomatic index (HSI) in fish
fed with fishmeal diet can be attributed to high glycogen and lipid accumulation in the
liver. (Chaiyapechara et al., 2003; Lie, 2001). The greater growth of African catfish fed
75% and 100% cricket meal might be attributed to the greater nutritional value and
digestibility of cricket meal compared to the fishmeal diet.
Page 141
125
Cricket meal appears to be a good source of amino acid for African catfish diet.
With the exception of methionine, all EAA in cricket meal diet were higher or within
the range of African catfish requirements. Although methionine level was insufficient,
non-essential amino acids, such as cysteine can replace about 60% of methionine
requirements in catfish diet (Lovell, 1989).
Haematological parameters play a vital role in evaluating physiological status of
the fish under study. Besides, it can also be a useful tool to assess feed composition and
nutritional status in relation to environmental conditions affecting fish (Svobodová et
al., 2005). Haematocrit, red blood cell, and white blood cell are used as indicators in
monitoring the environment, fish health, and feed toxicity in aquatic animals (Ozovehe,
2013).
A higher level of Hb, MCH, MCHC and Ht were demonstrated in the cricket meal
diet. However the values in all the groups are in accordance with healthy African catfish
haematological parameters (Dienye & Olumuji, 2014; Erhunmwunse & Ainerua, 2013).
The level of RBC did not differ significantly in all groups whereas WBC showed a
slightly increased level in the fish fed with fishmeal diet, which is usually associated
with the rising numbers of antigens in the circulating system (Oyawoye & Ogunkunle,
1998). Nevertheless, the values in all groups were within the normal range recorded for
African catfish (Musa & Omoregie, 1999). The haematological parameters indicated
that fishes fed with cricket meal had better health status than those of fishmeal fed fish.
Oxidative stress occurs when there is a disproportion of ROS production with the
volume of antioxidant systems to control their damaging effects (Monaghan et al.,
2009). ROS are essential by-products of normal metabolic processes that could damage
DNA in the cell nucleus and is harmful to other proteins and lipids within cell
Page 142
126
membranes if not suppressed by the antioxidant mechanism (Monaghan et al., 2009;
Pamplona & Costantini, 2011)
Catalase activity is correlated with an increasing concentration of H2O2
(Wdziȩczak et al., 1982; Wilhelm Filho et al., 2005). In the present study, we detected a
higher activity of this enzyme in the liver of African catfish fed with 100% CM diet
followed in descending order by 75% CM, and the lowest was observed in the control
group. A positive relationship was found between CAT and weight gain of the fish, R2 =
0.8017, which suggested that enhanced CAT activities were induced by higher growth
response due to high metabolic rates. This situation was in accordance with Pascual et
al. (2003) who observed that CAT activity decreased in fasting fish, and therefore,
reducing their weight. However, the activities increased when the fish were fed back
normally and they regained their weight back.
The response of the antioxidant mechanism could differ between fish size where
smaller fish showed lower antioxidant parameters than larger fish following the same
stress exposure between the two sizes (Kanak et al., 2014). The reduced growth
response in the fishmeal group might be attributed to less feed intake leading to the
generation of reactive oxygen species and consequently, decreased CAT activities
(Pascual et al., 2003; Robinson et al., 1997).
The incorporation of cricket meal in the diets did not differ significantly with GST
activity. However, cricket-based diet exhibited numerically higher activities than
fishmeal, with a similar tendency in activities correlating to CAT. This was supported
by Ogunji et al. (2011) who also found that CAT and GST activities in carp liver
produced a similar trend when including maggot meal in their diet.
On the other hand, although superoxide dismutase activities showed no significant
differences between all of the groups, the 100% CM group demonstrated higher hepatic
Page 143
127
SOD activities compared with the 75% CM and 100% FM groups whose trend was
similar as CAT activities. This result is consistent with the fact that the first line of
defence against ROS is represented by the CAT-SOD enzyme mechanism. Hence, SOD
catalyses the reduction of superoxide anions into hydrogen peroxide, which is later
decomposed by CAT at intra- and extracellular levels (Nordberg & Arner, 2001).
The simultaneous induction of SOD and the significant increase in CAT activity
in the 100% CM group are in agreement with previous studies done with other fishes,
such as gibel carp fed with selenium and the inclusion of lycopene in rainbow trout
(Han et al., 2011; Sahin et al., 2014). The observation of decreased activity of SOD and
CAT in the liver of fishes fed with fishmeal could account for the increased lipid
peroxidation as indicative of oxidative stress. We can suppose that a reduced level of
SOD was attributed to the accumulation of H2O2 due to the reducing level of CAT. As a
consequence, SOD levels were also suppressed by the accumulation of superoxide
anion (O2-). This hypothesis was supported by Bagnyukova et al. (2006); Wilhelm Filho
et al. (1993) and Wu et al. (2006).
The increasing level of GST in any substance implies that it contains compounds
that could stimulate the biotransformation of xenobiotics. In this case, although GST
activity is numerically higher in cricket meal treated groups, the effect is insignificant
owing to the fact that the crickets used in this experiment were raised in a control
substrate and were not fed with any materials exposed to harmful chemicals. The GST
contributes to the detoxification of oxidative stress products by catalysing the
conjugation of a variety of metabolites, including xenobiotic metabolites and
lipoperoxidation products, with GSH and by transforming the toxic compounds into
more easily dischargeable ones. Glutathione S-transferases biotransformation has
proven to increase energy consumed, which then stimulate oxidative stress (Cazenave et
Page 144
128
al., 2006; Wiegand et al., 2007). However, the minor effect in the biotransformation by
GST does not influence growth efficiency in cricket meal-fed fish.
Crickets were known to contain a significant amount of chitin in their
exoskeleton. Various aquatic animals demonstrated an increase in innate immune
response when incorporating chitin in their diet (Powell & Rowley, 2007; Sakai et al.,
1992; Vahedi & Ghodratizadeh, 2011). Based on our previous studies, crickets show a
positive result as an immunostimulant in African catfish due to the presence of
antimicrobial activity in chitin. In addition, chitin and its derivatives were reported to
have antioxidant properties that could prevent deleterious effects in various diseases
(Khoushab & Yamabhai, 2010; Ngo & Kim, 2014). However, some studies reported a
reduced digestibility in fish when fed a higher inclusion of insect meal due to the
presence of chitin (Alegbeleye et al., 2012; Köprücü & Özdemir, 2005).
6.6 Conclusions
The data obtained during this experiment suggested that dietary cricket meal
could improve growth performance of African catfish and enhance feed efficiency.
Antioxidant responses of fish fed 100% cricket meal diet increased CAT activity,
although only a minor effect was observed in SOD and GST activities. These facts
demonstrated that cricket meal diet could boost antioxidant status when given to
African catfish in a formulated diet. Moreover, the haematological findings also
supported the fact that diet containing up to 100% cricket meal is possible for feeding
African catfish without adverse effects. Further works concerning the impact of cricket
meal on other antioxidative enzymes as well as haematological parameters in different
physiological situations should be taken into consideration. Finally, a future study by
using crickets that fed on unused byproducts and raised in a more sustainable way could
Page 145
129
be taken into consideration. This could have significant implications for the aquaculture
industry where insect meal is more acceptable as sustainable protein sources.
Page 146
130
CHAPTER 7: GENERAL CONCLUSION AND FUTURE PERSPECTIVE
7.1 Conclusion
Based on the findings presented from the current study in this thesis, the
following conclusions can be made:
Field cricket could replace up to 100% of fishmeal in African catfish due to their higher
growth parameters with increasing CM level from 50% upwards. However, crude
protein level of 28% is insufficient to provide optimal growth for African catfish
fingerlings.
The essential amino acids for every diet were within the range of African catfish
requirement except for methionine, phenylalanine and lysine (in Chapter 3). However,
cysteine and tyrosine can spare up to 60% and 50% of methionine and phenylalanine
respectively. Increasing crude protein level in Chapter 4 and 6 do increase lysine
composition in cricket meal diet.
The findings from digestibility study suggest that cricket meal is well digested by
African catfish as it shows significantly higher ADC for protein, lipid, dry matter and
gross energy compared to local fishmeal used in this study. However, the level of
nutrient digestibility is still comparatively lower than other protein sources.
The presence of chitin in cricket meal diets did not affect growth performance and feed
efficiency of African catfish.
The inclusion of 35% crude protein level in cricket meal diet could enhance growth
performance as well as increase RPS up to 12 days post-challenge with Aeromonas
hydrophila. Increasing levels of lysozyme in cricket meal groups indicated that the
presence of chitin in cricket meal could be a natural protective mechanism in fish.
Page 147
131
Full replacement of cricket meal (100% CM) in African catfish diet enhanced CAT
activity despite the minor effect in SOD and GST enzymes.
Haematological indicators also suggested that the values of blood parameters of cricket
meal and fishmeal fed fish gave no indications of abnormalities as they were within the
normal range of healthy African catfish.
7.2 Future perspective
The current findings add substantially to a growing knowledge on fish nutrition
particularly in finding new solutions for sustainable feed. In all experimental trials, the
methionine levels in cricket meal diet were lower than the required amount for African
catfish nutrition although cysteine could replace the insufficient amount. However, the
inclusion of synthetic amino acid particularly methionine has the potential to contribute
positive effects in increasing growth performance.
In this thesis, fishmeal used was purchased from a local manufacturer, which is
commonly used by farmers in Malaysia. It is more economical but lower in nutritional
values compared to imported fishmeal. Hence, a further study by utilizing higher quality
fishmeal is necessary to determine the full potential of cricket meal.
Digestibility is a common issue in insect meals that needs to be addressed in order
to create a potential value for insect protein. Nutrient digestibility of cricket meal by
removing the chitin portion of the insects (wings and legs) could be factors that can
contribute to increase digestibility and thus ought to be explored further. Besides,
extrusion process of the feed could also be beneficial for increasing digestibility.
Further experimental investigations are needed to estimate other immunological
parameters such as phagocytic activity, respiratory burst and bactericidal activity to gain
more clarification on non-specific defense mechanism.
Page 148
132
The present study only observes CAT, SOD and GST to determine oxidative
stress when fish were supplied with cricket meal. However, it is known that the
oxidation of lipid in the feed could affect the feed palatability. Hence, further
investigation in lipid peroxidation and other antioxidative enzymes would be very
interesting.
Cricket meal showed potential as fishmeal replacement particularly as a
sustainable resource. However, currently the expensive price of crickets is the major
issue due to lack of up-scale production in Malaysia since the market is mainly focused
on zoos and pet shops. One possibility could be to emphasize on reducing the
production cost for cricket farm yet still profitable in order to be competitive with
commonly used protein sources.
Finally, the fish produced need to be tested for sensory quality since it is one of
the important factors that determine the marketability of the fish if these products are
going to be mass produced in future fish feed. With more additional research, cricket
meal could be a potential major protein source not only in aqua-feed but also for other
animal diets.
Page 149
133
REFERENCES
Abanikannda, M. F. (2012). Nutrient digestibility and haematology of Nile tilapia
(Oreochromis niloticus) fed with varying levels of locust (Locusta migratoria) meal.
(Bachelor of Aquaculture and Fisheries Management), Federal University of
Agriculture, Abeokuta, Ogun State.
Abdel-Tawwab, M., Mousa, M. A. A., & Abbass, F. E. (2007). Growth performance and
physiological response of African catfish, Clarias gariepinus (B.) fed organic selenium
prior to the exposure to environmental copper toxicity. Aquaculture (Amsterdam,
Netherlands), 272(1–4), 335-345.
Abdel-Warith, A.-W. A. (2002). Suitability of selected raw materials and by-products in
formulated feeds for Nile tilapia Oreochromis niloticus and African catfish Clarias
gariepinus. (Doctorate), University of Plymouth.
Achionye-Nzeh, C., & Ngwudo, O. (2003). Growth response of Clarias anguillaris fingerlings
fed larvae of Musca domestica and soyabean diet in the laboratory. Bioscience Research
Communications, 15(3), 221 - 223.
Adewolu, M. A., Adeniji, C. A., & Adejobi, A. B. (2008). Feed utilization, growth and survival
of Clarias gariepinus (Burchell 1822) fingerlings cultured under different photoperiods.
Aquaculture (Amsterdam, Netherlands), 283(1), 64-67.
Ahamad, B., Punniamurthy, D., Kumar, N., Malmarugan, V., Suresh, R., & Ranganathan, V.
(2013). Outbreak of bacterial haemorrhagic septicaemia in freshwater carps in
Thanjavur region of Tamil Nadu. Paper presented at the Proceedings of the national
seminar on current perspectives in Biological Sciences (NSOCPIBS–2012).
Ahmed, I. (2007). Effect of ration size on growth, body composition, and energy and protein
maintenance requirement of fingerling Indian major carp, Labeo rohita (Hamilton).
Fish Physiology and Biochemistry, 33(3), 203-212.
Akiyama, T., Oohara, I., & Yamamoto, T. (1997). Comparison of essential amino acid
requirements with A/E ratio among fish species (Review Paper). Fish Sc, 63(6), 963-
970.
Alegbeleye, W. O., Obasa, S. O., Olude, O. O., Otubu, K., & Jimoh, W. (2012). Preliminary
evaluation of the nutritive value of the variegated grasshopper (Zonocerus variegatus
L.) for African catfish Clarias gariepinus (Burchell. 1822) fingerlings. Aquaculture
Research, 43(3), 412-420.
Page 150
134
Allan, G. L., Parkinson, S., Booth, M. A., Stone, D. A., Rowland, S. J., Frances, J., & Warner-
Smith, R. (2000). Replacement of fish meal in diets for Australian silver perch,
Bidyanus bidyanus: I. Digestibility of alternative ingredients. Aquaculture (Amsterdam,
Netherlands), 186(3), 293-310.
Amado, L. L., Da Rosa, C. E., Leite, A. M., Moraes, L., Pires, W. V., Pinho, G. L. L., Martins,
C. M. G., Robaldo, R. B., Nery, L. E. M., & Monserrat, J. M. (2006a). Biomarkers in
croakers Micropogonias furnieri (Teleostei: Sciaenidae) from polluted and non-polluted
areas from the Patos Lagoon estuary (Southern Brazil): Evidences of genotoxic and
immunological effects. Marine Pollution Bulletin, 52(2), 199-206.
Amado, L. L., Robaldo, R. B., Geracitano, L., Monserrat, J. M., & Bianchini, A. (2006b).
Biomarkers of exposure and effect in the Brazilian flounder Paralichthys orbignyanus
(Teleostei: Paralichthyidae) from the Patos Lagoon estuary (Southern Brazil). Marine
Pollution Bulletin, 52(2), 207-213.
Amend, D. F., & McDowell, T. (1983). Current problems in the control of channel catfish
virus. Journal of World Mariculture Society, 14(1‐4), 261-267.
Anderson, D. P. (1992). Immunostimulants, adjuvants, and vaccine carriers in fish: applications
to aquaculture. Annual Review of Fish Diseases, 2, 281-307.
Anderson, D. P., & Siwicki, A. K. (1994). Duration of protection against Aeromonas
salmonicida in brook trout immunostimulated with glucan or chitosan by injection or
immersion. The Progressive Fish-Culturist, 56(4), 258-261.
Anderson, J. S., Lall, S. P., Anderson, D. M., & McNiven, M. A. (1993). Evaluation of protein
quality in fishmeal by chemical and biological assays. Aquaculture (Amsterdam,
Netherlands), 115(3), 305-325.
Aniebo, A., Erondu, E., & Owen, O. (2008). Proximate composition of housefly larvae (Musca
domestica) meal generated from mixture of cattle blood and wheat bran. Livestock
Research for Rural Development, 20(12), 1-5.
Anon. (2003). Annual Fisheries Statistics. Department of Fisheries Malaysia, Ministry of
Agriculture and Agro-Based Industry:
Anyanwu, M. U., Chah, K. F., & Shoyinka, V. S. (2015). Evaluation of pathogenicity of motile
Aeromonas species in African catfish. Inter J Fish Aquatic Studies, 2(3), 93-98.
AOAC. (1990). Official Method of Analysis. Association of Official Analytical Chemists:
Page 151
135
AOAC. (2003). Official methods of analysis. Association of Official Analytical Chemists.,
Virginia, U.S.A:
APHA. (1992). Standard Methods for the Examination of Water and Wastewater. Washington,
DC:
Ariyawansa, S. (2000). The evaluation of functional properties of fish meal. United Nations
University, Fisheries Training Programme, Project Final, Sri Lanka, 125.
Ayinla, O. A. (2007). Analysis of feeds and fertilizers for sustainable aquaculture development
in Nigeria. FAO Fisheries Technical Paper, 497, 453.
Bagnyukova, T. V., Chahrak, O. I., & Lushchak, V. I. (2006). Coordinated response of goldfish
antioxidant defenses to environmental stress. Aquatic Toxicology, 78(4), 325-331.
Baker, F., & Silverton, R. (1985). Introduction to Medical Laboratory Technology, Butlerworth
and Co: Ltd.
Balogun, B. I. (2011). Growth performance and feed utilization of Clarias gariepinus (Teugels)
fed different dietary levels of soaked Bauhinia monandra (Linn.) seed meal and sun-
dried locust meal (Schistocerca gregaria). (PhD), Ahmadu Bello University, Zaria,
Nigeria.
Barman, D., Nen, P., Mandal, S. C., & Kumar, V. (2013). Immunostimulants for aquaculture
health management. J Marine Sci Res Dev, 3(134), 2.
Barnhart, R. A. (1969). Effects of certain variables on hematological characteristics of rainbow
trout. Transactions American Fish Soc, 98(3), 411-418.
Barros, M. M., Lim, C., & Klesius, P. H. (2002). Effect of soybean meal replacement by
cottonseed meal and iron supplementation on growth, immune response and resistance
of Channel Catfish (Ictalurus puctatus) to Edwardsiella ictaluri challenge. Aquaculture
(Amsterdam, Netherlands), 207(3), 263-279.
Barroso, F. G., de Haro, C., Sánchez-Muros, M.-J., Venegas, E., Martínez-Sánchez, A., &
Pérez-Bañón, C. (2014). The potential of various insect species for use as food for fish.
Aquaculture (Amsterdam, Netherlands), 422, 193-201.
Begum, N. N., Chakraborty, S. C., Zaher, M., Abdul, M. M., & Gupta, M. V. (1994).
Replacement of fishmeal by low‐cost animal protein as a quality fish feed ingredient
for indian major carp, labeo rohita, fingerlings. Journal of the Science of Food and
Agriculture, 64(2), 191-197.
Page 152
136
Belal, I. E. (2005). A review of some fish nutrition methodologies. Bioresour Technol, 96(4),
395-402.
Bondari, K., & Sheppard, D. (1981). Soldier fly larvae as feed in commercial fish production.
Aquaculture (Amsterdam, Netherlands), 24, 103-109.
Bonga, S. W. (1997). The stress response in fish. Physiological Reviews, 77(3), 591-625.
Boon, J. H., Oorschot, R. W. A., Henken, A. M., & Van Doesum, J. H. (1987). Ruptured
intestine syndrome of unknown etiology in young African catfish, Clarias gariepinus
(Burchell 1822), and its relation to the feeding level. Aquaculture (Amsterdam,
Netherlands), 63(1), 283-300.
Borthakur, S., & Sarma, K. (1998). Protein and fat digestibility of non-conventional fishmeal
replacers incorporated in the diets of fish Clarias batrachus (Linn.). Environment and
ecology, 16(2), 368-371.
Boscolo, W. R., Hayashi, C., Meurer, F., & Soares, C. M. (2001). Fish, meat and bone, poultry
by-products and silkworm meals as attractive in diets for Nile tilapia (Oreochromis
niloticus) fingerlings. Revista Brasileira de Zootecnia, 30(5), 1397-1402.
Bradford, M. M. (1976). A rapid and sensitive method for the quantitation of microgram
quantities of protein utilizing the principle of protein-dye binding. Analytical
Biochemistry, 72(1), 248-254.
Britz, P., & Pienaar, A. (1992). Laboratory experiments on the effect of light and cover on the
behaviour and growth of African catfish, Clarias gariepinus (Pisces: Clariidae). Journal
of Zoology, 227(1), 43-62.
Buentello, J. A., & Gatlin III, D. M. (2001). Effects of elevated dietary arginine on resistance of
channel catfish to exposure to Edwardsiella ictaluri. Journal of Aquatic Animal Health,
13(3), 194-201.
Buetler, T. M., Krauskopf, A., & Ruegg, U. T. (2004). Role of superoxide as a signaling
molecule. Physiology, 19(3), 120-123.
Buettner, G. R. (1993). The pecking order of free radicals and antioxidants: lipid peroxidation,
α-tocopherol, and ascorbate. Archives of Biochemistry and Biophysics, 300(2), 535-543.
Bureau, D., & Cho, C. (1999). Measuring digestibility in fish. Fish Nutrition Research
Laboratory, University of Guelph, Ontario, Canada:
Page 153
137
Camougrand, N., & Rigoulet, M. (2001). Aging and oxidative stress: studies of some genes
involved both in aging and in response to oxidative stress. Respiration Physiology,
128(3), 393-401.
Cazenave, J., Bistoni, M. d. l. Á., Zwirnmann, E., Wunderlin, D. A., & Wiegand, C. (2006).
Attenuating effects of natural organic matter on microcystin toxicity in zebra fish
(Danio rerio) embryos—benefits and costs of microcystin detoxication. Environmental
Toxicology, 21(1), 22-32.
Çek, Ş., & Yilmaz, E. (2009). The effect of varying dietary energy on gonad development at
first sexual maturity of the Sharptooth catfish (Clarias gariepinus Burchell, 1822).
Aquaculture International, 17(6), 553-563.
Chaiyapechara, S., Casten, M. T., Hardy, R. W., & Dong, F. M. (2003). Fish performance, fillet
characteristics, and health assessment index of rainbow trout (Oncorhynchus mykiss)
fed diets containing adequate and high concentrations of lipid and vitamin E.
Aquaculture (Amsterdam, Netherlands), 219(1), 715-738.
Chasseaud, L. (1979). The Role of Glutathione and Glutathione S'transferases in the
Metabolism of Chemical Carcinogens and Other Electrophilic Agents: Academic Press.
Cho, C., Cowey, C., & Watanabe, T. (1985, 23-26 August 1983). Finfish nutrition in Asia:
methodological approaches to research and development Paper presented at the Asian
finfish nutrition workshop IDRC, Singapore.
Cho, C., & Slinger, S. (1979). Apparent digestibility measurement in feedstuffs for rainbow
trout. Finfish Nutrition and Fishfeed Technology, 2, 239-247.
Cho, C., Slinger, S., & Bayley, H. (1982). Bioenergetics of salmonid fishes: energy intake,
expenditure and productivity. Comparative Biochemistry Physiology Part B :
Comparative Biochemistry, 73(1), 25-41.
Cho, C. Y., Kaushik, S., & Woodward, B. (1992). Dietary arginine requirement of young
rainbow trout (Oncorhynchus mykiss). Comparative Biochemistry and Physiology Part
A: Physiology, 102(1), 211-216.
Choudhury, D., Pal, A., Sahu, N., Kumar, S., Das, S., & Mukherjee, S. (2005). Dietary yeast
RNA supplementation reduces mortality by Aeromonas hydrophila in rohu (Labeo
rohita L.) juveniles. Fish & Shellfish Immunology, 19(3), 281-291.
Chuapoehuk, W. (1987). Protein requirements of walking catfish, Clarias batrachus
(Linnaeus), fry. Aquaculture (Amsterdam, Netherlands), 63(1), 215-219.
Page 154
138
Cipriano, R., Bullock, G., & Pyle, S. (1984). Aeromonas hydrophila and motile aeromonad
septicemias of fish. US Fish and Wildlife Service:
Claiborne, A. (1985). Catalase activity. CRC handbook of methods for oxygen radical research,
1, 283-284.
Cowey, C., Young Cho, C., Sivak, J., Weerheim, J., & Stuart, D. (1992). Methionine intake in
rainbow trout (Oncorhynchus mykiss), relationship to cataract formation and the
metabolism of methionine. The Journal of Nutrition, 122(5), 1154-1163.
Craig, S., & Helfrich, L. A. (2009). Understanding fish nutrition, feeds, and feeding. College of
agriculture and life science, Virginia polytechnic institute and state university:
Cruz, E. M. (1975). Determination of nutrient digestibility in various classes of natural and
purified feed materials of channel catfish. (Doctorate), Auburn University, Alabama.
Cuesta, A., Esteban, M. Á., & Meseguer, J. (2003). In vitro effect of chitin particles on the
innate cellular immune system of gilthead seabream (Sparus aurata L.). Fish &
Shellfish Immunology, 15(1), 1-11.
Dabrowski, K., Lee, K.-J., Rinchard, J., Ciereszko, A., Blom, J. H., & Ottobre, J. S. (2001).
Gossypol isomers bind specifically to blood plasma proteins and spermatozoa of
rainbow trout fed diets containing cottonseed meal. Biochimica et Biophysica Acta
(BBA)-General Subjects, 1525(1), 37-42.
Dalmo, R., Bogwald, J., Ingebrigtsen, K., & Seljelid, R. (1996). The immunomodulatory effect
of laminaran [β (1, 3)‐D‐glucan] on Atlantic salmon, Salmo salar L., anterior
kidney leucocytes after intraperitoneal, peroral and peranal administration. Journal of
Fish Diseases, 19(6), 449-457.
Dautremepuits, C., Paris-Palacios, S., Betoulle, S., & Vernet, G. (2004a). Modulation in hepatic
and head kidney parameters of carp (Cyprinus carpio L.) induced by copper and
chitosan. Comp Biochem Physiol Part C: Toxicol & Pharmacol, 137(4), 325-333.
Dautremepuits, C., Paris-Palacios, S., Betoulle, S., & Vernet, G. (2004b). Modulation in
hepatic and head kidney parameters of carp (Cyprinus carpio L.) induced by copper and
chitosan. Comparative Biochemistry and Physiology Part C: Toxicology &
Pharmacology, 137(4), 325-333.
Davis, J., & Hayasaka, S. (1984). The enhancement of resistance of the American eel, Anguilla
rostrata Le Sueur, to a pathogenic bacterium, Aeromonas hydrophila, by an extract of
the tunicate, Ecteinascidia turbinata. Journal of Fish Diseases, 7(4), 311-316.
Page 155
139
De Silva, S. S., Gunasekera, R. M., & Gooley, G. (2000). Digestibility and amino acid
availability of three protein‐rich ingredient‐incorporated diets by Murray cod
Maccullochella peelii peelii (Mitchell) and the Australian shortfin eel Anguilla australis
Richardson. Aquaculture Research, 31(2), 195-205.
DeFoliart, G., Finke, M., & Sunde, M. (1982). Potential value of the Mormon cricket
(Orthoptera: Tettigoniidae) harvested as a high-protein feed for poultry. Journal of
Economic Entomology, 75(5), 848-852.
Depaola, A., Peeler, J. T., & Rodrick, G. E. (1995). Effect of oxytetracycline-medicated feed on
antibiotic resistance of gram-negative bacteria in catfish ponds. Applied and
Environmental Microbiology, 61(6), 2335-2340.
Dienye, H., & Olumuji, O. (2014). Growth performance and haematological responses of
African mud catfish Clarias gariepinus fed dietary levels of Moringa oleifera leaf meal.
Net Journal of Agricultural Science, 2(2), 79-88.
DOF. (2014). Perangkaan perikanan tahun 2014. http://www.dof.gov.my/fishery-statistics:
Domenicali, M., Caraceni, P., Vendemiale, G., Grattagliano, I., Nardo, B., Dall’Agata, M.,
Santoni, B., Trevisani, F., Cavallari, A., & Altomare, E. (2001). Food deprivation
exacerbates mitochondrial oxidative stress in rat liver exposed to ischemia-reperfusion
injury. The Journal of Nutrition, 131(1), 105-110.
Dong, G., Yang, Y., Song, X., Yu, L., Zhao, T., Huang, G., Hu, Z., & Zhang, J. (2013).
Comparative effects of dietary supplementation with maggot meal and soybean meal in
gibel carp (Carassius auratus gibelio) and darkbarbel catfish (Pelteobagrus vachelli):
growth performance and antioxidant responses. Aquaculture Nutrition, 19(4), 543-554.
Doumas, B. T., Watson, W. A., & Biggs, H. G. (1971). Albumin standards and the
measurement of serum albumin with bromcresol green. Clinica Chimica Acta, 31(1),
87-96.
Duncan, P. L., Lovell, R. T., Butterworth Jr, C., Freeberg, L. E., & Tamura, T. (1993). Dietary
folate requirement determined for channel catfish, Ictalurus punctatus. The Journal of
nutrition, 123(11), 1888.
Easton, M., Luszniak, D., & Von der Geest, E. (2002). Preliminary examination of contaminant
loadings in farmed salmon, wild salmon and commercial salmon feed. Chemosphere,
46(7), 1053-1074.
Edwards, P., Tuan, L. A., & Allan, G. L. (2004). A survey of marine trash fish and fish meal as
aquaculture feed ingredients in Vietnam.
Page 156
140
El-Boshy, M., El-Ashram, A., Risha, E., Abdelhamid, F., Zahran, E., & Gab-Alla, A. (2014).
Dietary fucoidan enhance the non-specific immune response and disease resistance in
African catfish, Clarias gariepinus, immunosuppressed by cadmium chloride.
Veterinary Immunology and Immunopathology, 162(3–4), 168-173.
Ellis, A. (1999). Immunity to bacteria in fish. Fish & Shellfish Immunology, 9(4), 291-308.
Emehinaiye, P. A. (2012). Growth performance of Oreochromis niloticus fingerlings fed with
varying levels of migratory locust (locusta migratoria) meal. F. U. o. A. Aquacult. Fish.
Manage., Abeokuta, Nigeria. Retrieved from Aquacult. Fish. Manage., Federal
University of Agriculture, Abeokuta, Nigeria:
Enes, P., Panserat, S., Kaushik, S., & Oliva-Teles, A. (2009). Nutritional regulation of hepatic
glucose metabolism in fish. Fish Physiology and Biochemistry, 35(3), 519-539.
Erhunmwunse, N., & Ainerua, M. (2013). Characterization of Some Blood Parameters of
African Catfish (Clarias gariepinus). American-Eurasian Journal of Toxicology
Science, 5(3), 72-76.
Esteban, M. A., Cuesta, A., Ortuno, J., & Meseguer, J. (2001). Immunomodulatory effects of
dietary intake of chitin on gilthead seabream (Sparus aurata L.) innate immune system.
Fish Shellfish Immunology, 11, 303 - 305.
Fadiyimu, A. A., Ayodele, A. O., Olowu, P. A., & Folorunso, O. R. (2003). Performance of
finishing broilers fed graded levels of termites meal as replacement for fish meal. Paper
presented at the Proceeding of the 28th Annual Conference of Nigerean society for
Animal Production.
Fagbenro, O. (1996). Apparent digestibility of crude protein and gross energy in some plant and
animal‐based feedstuffs by Clarias isheriensis (Siluriformes: Clariidae)(Sydenham
1980). Journal of Applied Ichthyology, 12(1), 67-68.
Fagbenro, O., & Nwanna, L. (1999). Dietary tryptophan requirement of the African catfish,
Clarias gariepinus. Journal of Applied Aquaculture, 9(1), 65-72.
FAO. (2002). Protein sources for the animal feed industry. Paper presented at the Expert
Consultation and Workshop, Bangkok.
FAO. (2006). State of world aquaculture 2006. Rome:
FAO. (2008). National Aquaculture Sector Overview. Malaysia. National Aquaculture Sector
Overview Fact Sheets. Rome:
Page 157
141
FAO. (2011). Combating micronutrient deficiencies: food-based approaches. Rome:
FAO. (2012). Global aquaculture production volume and value statistics database updated to
2012. Rome:
FAO. (2014). The State of World Fisheries and Aquaculture - Opportunities and challenges.
Rome:
FAO, & WHO. (2010). Joint FAO/WHO expert consultation on the risks and
benefits of fish consumption Rome:
Farhat, & Khan, M. A. (2011). Growth, feed conversion, and nutrient retention efficiency of
African Catfish,Clarias gariepinus,(Burchell) fingerling fed diets with varying levels of
protein. Journal of Applied Aquaculture, 23(4), 304-316.
Fasakin, E., Balogun, A., & Ajayi, O. (2003). Evaluation of full‐fat and defatted maggot
meals in the feeding of clariid catfish Clarias gariepinus fingerlings. Aquaculture
Research, 34(9), 733-738.
Fatma Abidi, S., & Khan, M. A. (2010). Dietary tryptophan requirement of fingerling rohu,
Labeo rohita (Hamilton), based on growth and body composition. Journal of the World
Aquaculture Society, 41(5), 700-709.
Findlay, V., Zilberg, D., & Munday, B. (2000). Evaluation of levamisole as a treatment for
amoebic gill disease of Atlantic salmon, Salmo salar L. Journal of Fish Diseases, 23(3),
193-198.
Finke, M. D. (2002). Complete nutrient composition of commercially raised invertebrates used
as food for insectivores. Zoological Biology, 21(3), 269-285.
Finke, M. D. (2007). Estimate of chitin in raw whole insects. Zoological Biology, 26(2), 105-
115.
Fisher, S. A., & Burggren, W. W. (2007). Role of hypoxia in the evolution and development of
the cardiovascular system. Antioxidants & redox signaling, 9(9), 1339-1352.
Francis, G., Makkar, H. P. S., & Becker, K. (2001). Antinutritional factors present in plant-
derived alternate fish feed ingredients and their effects in fish. Aquaculture, 199(3–4),
197-227.
Page 158
142
Furukawa, A. (1966). On the acid digestion method for the determination of chromic oxide as
an index substance in the study of digestibility of fish feed. Nippon Suisan Gakkaishi,
32, 502-506.
Gannam, A. L., & Schrock, R. M. (1999). Immunostimulants in fish diets. Journal of Applied
Aquaculture, 9(4), 53-89.
Gasco, L., Belforti, M., Rotolo, L., Lussiana, C., Parisi, G., Terova, G., Roncarati, A., & Gai, F.
(2014a). Mealworm (Tenebrio molitor) as a potential ingredient in practical diets for
rainbow trout (Oncorhynchus mykiss). Paper presented at the Abstract Book Conference
Insects to Feed The World, The Netherlands.
Gasco, L., Gai, F., Piccolo, G., Rotolo, L., Lussiana, C., Molla, P., & Chatzifotis, S. (2014b).
Substitution of fish meal by Tenebrio molitor meal in the diet of Dicentrarchus labrax
juveniles. Insects to Feed The World, The Netherlands, 14-17.
Giri, S. S., Sahoo, S. K., Sahu, A. K., & Meher, P. K. (2003). Effect of dietary protein level on
growth, survival, feed utilisation and body composition of hybrid Clarias catfish
(Clarias batrachus × Clarias gariepinus). Animal Feed Science and Technology,
104(1–4), 169-178.
Glencross, B., Booth, M., & Allan, G. (2007). A feed is only as good as its ingredients–a
review of ingredient evaluation strategies for aquaculture feeds. Aquaculture nutrition,
13(1), 17-34.
Goodman, W. (1989). Chitin: a magic bullet. The Food Insect Newsletter, 3, 6-9.
Gopalakannan, A., & Venkatesan, A. (2006). Immunomodulatory effect of dietary intake of
Chitin, Chitosan and Levamisole on the immune system of Cyprinus carpio and control
of Aeromonas hydrophila infection in ponds. Aquaculture (Amsterdam, Netherlands),
255, 179-187.
Grisdale-Helland, B., & Helland, S. (1998). Macronutrient utilization by Atlantic halibut
(Hippoglossus hippoglossus): diet digestibility and growth of 1 kg fish. Aquaculture
(Amsterdam, Netherlands), 166(1), 57-65.
Guillaume, J. (2001). Nutrition and feeding of fish and crustaceans: Springer Science &
Business Media.
Habig, W. H., Pabst, M. J., & Jakoby, W. B. (1974). Glutathione S-transferases the first
enzymatic step in mercapturic acid formation. Journal of Biological Chemistry,
249(22), 7130-7139.
Page 159
143
Halliwell, B., & Gutteridge, J. M. (1999). Free radicals in biology and medicine (Vol. 3):
Oxford university press Oxford.
Han, D., Xie, S., Liu, M., Xiao, X., Liu, H., Zhu, X., & Yang, Y. (2011). The effects of dietary
selenium on growth performances, oxidative stress and tissue selenium concentration of
gibel carp (Carassius auratus gibelio). Aquaculture Nutrition, 17(3), 741-749.
Harikrishnan, R., Kim, J.-S., Balasundaram, C., & Heo, M.-S. (2012). Dietary supplementation
with chitin and chitosan on haematology and innate immune response in Epinephelus
bruneus against Philasterides dicentrarchi. Experimental Parasitology, 131(1), 116-
124.
Haylor, G. (1991). Controlled hatchery production of Clarias gariepinus (Burchell 1822):
growth and survival of fry at high stocking density. Aquaculture Research, 22(4), 405-
422.
Hecht, T., & Appelbaum, S. (1987). Notes on the growth of Israeli sharptooth catfish (Clarias
gariepinus) during the primary nursing phase. Aquaculture (Amsterdam, Netherlands),
63(1), 195-204.
Heinrikson, R. L., & Meredith, S. C. (1984). Amino acid analysis by reverse-phase high-
performance liquid chromatography: precolumn derivatization with
phenylisothiocyanate. Analytical Biochemistry, 136(1), 65-74.
Hempel, E. (1993). Constraints and possibilities for developing aquaculture. Aquaculture
International, 1(1), 2-19.
Henken, A., Machiels, M., Dekker, W., & Hogendoorn, H. (1986). The effect of dietary protein
and energy content on growth rate and feed utilization of the African catfish Clarias
gariepinus (Burchell 1822). Aquaculture (Amsterdam, Netherlands), 58(1-2), 55-74.
Henry, M., Gasco, L., Piccolo, G., & Fountoulaki, E. (2015). Review on the use of insects in
the diet of farmed fish: Past and future. Animal Feed Science and Technology, 203, 1-
22.
Hepher, B. (1988). Nutrition of pond fishes: Cambridge University Press.
Hidalgo, M. C., Expósito, A., Palma, J. M., & de la Higuera, M. (2002). Oxidative stress
generated by dietary Zn-deficiency: studies in rainbow trout (Oncorhynchus mykiss).
The International Journal of Biochemistry & Cell Biology, 34(2), 183-193.
Page 160
144
Hien, T. T. T., Phuong, N., Le Tu, T., & Glencross, B. (2010). Assessment of methods for the
determination of digestibilities of feed ingredients for Tra catfish, Pangasinodon
hypothalamus. Aquaculture Nutrition, 16(4), 351-358.
Hillestad, M., & Johnsen, F. (1994). High-energy/low-protein diets for Atlantic salmon: effects
on growth, nutrient retention and slaughter quality. Aquaculture (Amsterdam,
Netherlands), 124(1), 109-116.
Hoffman, L., & Prinsloo, J. (1995). The influence of different dietary lipids on the growth and
body-composition of the African sharptooth catfish, Clarias-gariepinus (burchell) (Vol.
91, pp. 315-320): Bureau scientific publisher, South Africa.
Hossain, M., Nahar, N., & Kamal, M. (1997). Nutrient digestibility coefficients of some plant
and animal proteins for rohu (Labeo rohita). Aquaculture (Amsterdam, Netherlands),
151(1), 37-45.
Hossain, M., Nahar, N., Kamal, M., & Islam, M. (1992). Nutrient digestibility coefficients of
some plant and animal proteins for tilapia (Oreochromis mossambicus). Journal of
Aquaculture in the Tropics, 7, 257-266.
Hossain, M. F., Rahman, M. M., & Sayed, M. (2013). Experimental infection of indigenous
climbing perch Anabas testudineus with Aeromonas hydrophila bacteria. Progressive
Agriculture, 22(1-2), 105-114.
Howe, E. R., Simenstad, C. A., Toft, J. D., Cordell, J. R., & Bollens, S. M. (2014).
Macroinvertebrate Prey Availability and Fish Diet Selectivity in Relation to
Environmental Variables in Natural and Restoring North San Francisco Bay Tidal
Marsh Channels. San Francisco Estuary and Watershed Science, 12(1).
Hrubec, T. C., Cardinale, J. L., & Smith, S. A. (2000). Hematology and plasma chemistry
reference intervals for cultured tilapia (Oreochromis hybrid). Veterinary Clinical
Pathology, 29(1), 7-12.
Huisman, E. A., & Richter, C. J. J. (1987). Reproduction, growth, health control and
aquacultural potential of the African catfish, Clarias gariepinus (Burchell 1822).
Aquaculture (Amsterdam, Netherlands), 63(1), 1-14.
Hung, L., Lazard, J., Mariojouls, C., & Moreau, Y. (2003). Comparison of starch utilization in
fingerlings of two Asian catfishes from the Mekong River (Pangasius bocourti
Sauvage, 1880, Pangasius hypophthalmus Sauvage, 1878). Aquaculture Nutrition, 9(4),
215-222.
Page 161
145
Ibrahim, A. T. A., & Harabawy, A. S. A. (2014). Sublethal toxicity of carbofuran on the
African catfish Clarias gariepinus: Hormonal, enzymatic and antioxidant responses.
Ecotoxicology and Environmental Safety, 106, 33-39.
Ido, A., Iwai, T., Ito, K., Ohta, T., Mizushige, T., Kishida, T., Miura, C., & Miura, T. (2015).
Dietary effects of housefly (Musca domestica) (Diptera: Muscidae) pupae on the growth
performance and the resistance against bacterial pathogen in red sea bream (Pagrus
major) (Perciformes: Sparidae). Applied Entomology and Zoology, 50(2), 213-221.
Jabir, M. D. A. R., Razak, S. A., & Vikineswary, S. (2012). Nutritive potential and utilization
of super worm (Zophobas morio) meal in the diet of Nile tilapia (Oreochromis
niloticus) juvenile. African Journal of Biotechnology, 11(24), 6592 - 6598.
Jacob, R. A. (1995). The integrated antioxidant system. Nutrition research, 15(5), 755-766.
Jacobs, M. N., Covaci, A., & Schepens, P. (2002). Investigation of selected persistent organic
pollutants in farmed Atlantic salmon (Salmo salar), salmon aquaculture feed, and fish
oil components of the feed. Environmental Science & Technology, 36(13), 2797-2805.
Jadhav, V. S., Khan, S. I., Girkar, M. M., & Gitte, M. J. (2006). The role of immunostimulants
in fish and shrimp aquaculture. Aquaculture Asia, 11(3), 24.
Jafri, A. (1998). Effect of dietary carbohydrate-to-lipid ratio on growth and body composition
of walking catfish (Clarias batrachus). Aquaculture (Amsterdam, Netherlands), 161(1),
159-168.
Janda, J. M., & Abbott, S. L. (2010). The genus Aeromonas: taxonomy, pathogenicity, and
infection. Clinical Microbiology Reviews, 23(1), 35-73.
Jantrarotai, W., Sitasit, P., & Rajchapakdee, S. (1994). The optimum carbohydrate to lipid ratio
in hybrid Clarias catfish (Clarias macrocephalus× C. gariepinus) diets containing raw
broken rice. Aquaculture (Amsterdam, Netherlands), 127(1), 61-68.
Jimoh, W., Fagbenro, O., & Adeparusi, E. (2014). Response of African Catfish, Clarias
gariepinus (Burchell 1822), fingerlings fed diets containing differently timed wet-heat-
treated sesame (Sesamum indicum) seedmeal. Agriculture Science, 5, 1159-1171.
Johansen, S., Sveier, H., & Jobling, M. (2003). Lipostatic regulation of feed intake in Atlantic
salmon Salmo salar L. defending adiposity at the expense of growth? Aquaculture
Research, 34(4), 317-331.
Page 162
146
Johri, R., Singh, R., & Johri, P. (2011). Impact of formulated plant and animal supplimented
diets on nutritional efficiency, growth and body composition in juveniles of Clarias
batrachus in experimental tanks. Journal of Experimental Zoology, 14(1), 59-68.
Kanak, E., Dogan, Z., Eroglu, A., Atli, G., & Canli, M. (2014). Effects of fish size on the
response of antioxidant systems of Oreochromis niloticus following metal exposures.
Fish Physiology and Biochemistry, 40(4), 1083-1091.
Kawakami, H., Shinohara, N., & Sakai, M. (1998). The non-specific immunostimulation and
adjuvant effects of Vibrio anguillarum bacterin, M-glucan, chitin and freund's complete
adjuvant against Pasteurella piscicida infection in yellowtail [Seriola quinqueradiata].
Fish Pathology (Japan), 33(4), 287 - 292.
Khajarern, J., Khajarern, S., Moon, T., & Lee, J. (2003). Effects of dietary supplementation of
fermented chitin-chitosan (fermkit) on toxicity of mycotoxin in ducks. Asian
Australasian Journal Of Animal Sciences, 16(5), 706-713.
Khoushab, F., & Yamabhai, M. (2010). Chitin research revisited. Marine Drugs, 8(7), 1988-
2012.
Kim, J.-D., & Lall, S. P. (2001). Effects of dietary protein level on growth and utilization of
protein and energy by juvenile haddock (Melanogrammus aeglefinus). Aquaculture
(Amsterdam, Netherlands), 195(3), 311-319.
Kim, K.-D., Lim, S. G., Kang, Y. J., Kim, K.-W., & Son, M. H. (2012). Effects of dietary
protein and lipid levels on growth and body composition of juvenile far eastern catfish
Silurus asotus. Asian-Australasian journal of animal sciences, 25(3), 369.
Kitagima, R. E., & Fracalossi, D. M. (2011). Digestibility of Alternative Protein‐Rich
Feedstuffs for Channel Catfish, Ictalurus punctatus. Journal of the World Aquaculture
Society, 42(3), 306-312.
Knorr, D. (1984). Use of chitinous polymers in food: A challenge for food research and
development. Food Technology (USA).
Köprücü, K., & Özdemir, Y. (2005). Apparent digestibility of selected feed ingredients for Nile
tilapia (Oreochromis niloticus). Aquaculture (Amsterdam, Netherlands), 250(1-2), 308-
316.
Kris-Etherton, P. M., Grieger, J. A., & Etherton, T. D. (2009). Dietary reference intakes for
DHA and EPA. Prostaglandins, Leukotrienes and Essential Fatty Acids, 81(2), 99-104.
Page 163
147
Kroeckel, S., Harjes, A.-G., Roth, I., Katz, H., Wuertz, S., Susenbeth, A., & Schulz, C. (2012).
When a turbot catches a fly: Evaluation of a pre-pupae meal of the Black Soldier Fly
(Hermetia illucens) as fish meal substitute—Growth performance and chitin
degradation in juvenile turbot (Psetta maxima). Aquaculture (Amsterdam, Netherlands),
364, 345-352.
Krogdahl, Å., Hemre, G., & Mommsen, T. (2005). Carbohydrates in fish nutrition: digestion
and absorption in postlarval stages. Aquaculture nutrition, 11(2), 103-122.
Krogdahl, Å., Penn, M., Thorsen, J., Refstie, S., & Bakke, A. M. (2010). Important
antinutrients in plant feedstuffs for aquaculture: an update on recent findings regarding
responses in salmonids. Aquaculture Research, 41(3), 333-344.
Kumar, S., Raman, R., Pandey, P., Mohanty, S., Kumar, A., & Kumar, K. (2013). Effect of
orally administered azadirachtin on non-specific immune parameters of goldfish
Carassius auratus (Linn. 1758) and resistance against Aeromonas hydrophila. Fish &
Shellfish Immunology, 34(2), 564-573.
Lall, S., & Anderson, S. (2005). Amino acid nutrition of salmonids: dietary requirements and
bioavailability. Cahiers Options Méditerranéennes, 63, 73-90.
Lall, S. P. (2000). Nutrition and health of fish. Paper presented at the Advances en Nutrición
Acuícola V. Memorias del V Simposium Internacional de Nutrición Acuícola., Yucatán,
Mexico.
Law, M. (2001). Differential diagnosis of ulcerative lesions in fish. Environmental Health
Perspectives, 109(5), 681.
Leaver, M. J., Scott, K., & George, S. G. (1993). Cloning and characterization of the major
hepatic Glutathione S-transferase from a marine teleost flatfish, the plaice (Pleuronectes
platessa), with structural similarities to plant, insect and mammalian Theta class
isoenzymes. Biochemistry Journal, 292, 189-195.
Li, M. H., Robinson, E. H., Oberle, D. F., & Bosworth, B. G. (2006). Effects of dietary protein
concentration and feeding regimen on channel catfish, Ictalurus punctatus, production.
Journal of the World Aquaculture Society, 37(4), 370-377.
Li, M. H., Wise, D. J., Johnson, M. R., & Robinson, E. H. (1994). Dietary menhaden oil
reduced resistance of channel catfish (Ictalurus punctatus) to Edwardsiella ictaluri.
Aquaculture (Amsterdam, Netherlands), 128(3), 335-344.
Lie, Ø. (2001). Flesh quality–the role of nutrition. Aquaculture Research, 32(1), 341-348.
Page 164
148
Lim, C., & Webster, C. D. (2001). Nutrition and fish health: Food Products Press.
Lim, P.-K., Boey, P.-L., & Ng, W.-K. (2001). Dietary palm oil level affects growth
performance, protein retention and tissue vitamin E concentration of African catfish,
Clarias gariepinus. Aquaculture (Amsterdam, Netherlands), 202(1–2), 101-112.
Lin, L., Xuefeng, C., Chuan, H., Min, X., Xiufeng, W., & Haining, C. (2009). Immune
response, stress resistance and bacterial challenge in juvenile rainbow trouts
Oncorhynchus mykiss fed diets containing chitosan-oligosaccharides. Current Zoology,
55(6), 1-14.
Livingstone, D. (2001). Contaminant-stimulated reactive oxygen species production and
oxidative damage in aquatic organisms. Marine Pollution Bulletin, 42(8), 656-666.
Lock, E., Arsiwalla, T., & Waagbø, R. (2014). Insect meal: A promising source of nutrients in
the diet of Atlantic salmon (Salmo salar). Paper presented at the Insects to Feed The
World, The Netherlands.
Longvah, T., Mangthya, K., & Ramulu, P. (2011). Nutrient composition and protein quality
evaluation of eri silkworm (Samia ricinii) prepupae and pupae. Food Chemistry, 128(2),
400-403.
Lorch, P. D., Sword, G. A., Gwynne, D. T., & Anderson, G. L. (2005). Radiotelemetry reveals
differences in individual movement patterns between outbreak and non‐outbreak
Mormon cricket populations. Ecological Entomology, 30(5), 548-555.
Lovell, T. (1989). Nutrition and Feeding of Fish: Springer Science & Business Media.
Lovell, T. (1996). Fish, Feed & Nutrition: Feed Deprivation Increases Resistance Of Channel
Catfish To Bacterial Infection. Aquaculture magazine, 22, 65-67.
Lovell, T. (2012). Nutrition and Feeding of Fish: Springer Science & Business Media.
Lucas, J. S., & Southgate, P. C. (2012). Aquaculture: Farming aquatic animals and plants:
John Wiley & Sons.
Lushchak, V. I. (2011). Environmentally induced oxidative stress in aquatic animals. Aquatic
Toxicology, 101(1), 13-30.
Page 165
149
Madu, C., & Ufodike, E. (2004). Growth and survival of catfish (Clarias anguillaris) juveniles
fed live tilapia and maggot as unconventional diets. Journal of Aquatic Sciences, 18(1),
47-52.
Maina, J. G., Beames, R. M., Higgs, D., Mbugua, P. N., Iwama, G., & Kisia, S. M. (2002).
Digestibility and feeding value of some feed ingredients fed to tilapia Oreochromis
niloticus (L.). Aquaculture Research, 33(11), 853-862.
Makkar, H. P., Tran, G., Heuzé, V., & Ankers, P. (2014). State-of-the-art on use of insects as
animal feed. Animal Feed Science and Technology, 197, 1-33.
Mallison, A. (2013). Marine Ingredients Overview. Intrafish Investment Forum:
Mannervik, B. (1985). The isoenzymes of glutathione transferase: John Wiley & Sons.
Mari, L. S. S., Jagruthi, C., Anbazahan, S. M., Yogeshwari, G., Thirumurugan, R., Arockiaraj,
J., Mariappan, P., Balasundaram, C., & Harikrishnan, R. (2014). Protective effect of
chitin and chitosan enriched diets on immunity and disease resistance in Cirrhina
mrigala against Aphanomyces invadans. Fish & Shellfish Immunology, 39(2), 378-385.
Marion, J. E. (1998). Water quality for pond aquaculture. International Center for Aquaculture
and Aquatic Environment, Alabama Agricultural Experiment Station, Auburn
University:
Marono, S., Piccolo, G., Loponte, R., Di Meo, C., Attia, Y. A., Nizza, A., & Bovera, F. (2015).
In vitro crude protein digestibility of Tenebrio molitor and Hermetia illucens insect
meals and its correlation with chemical composition traits. Italian Journal of Animal
Science, 14, 338-343.
McCord, J. M., & Fridovich, I. (1969). Superoxide dismutase an enzymic function for
erythrocuprein (hemocuprein). Journal of Biological Chemistry, 244(22), 6049-6055.
McGoogan, B. B., & Reigh, R. C. (1996). Apparent digestibility of selected ingredients in red
drum (Sciaenops ocellatus) diets. Aquaculture (Amsterdam, Netherlands), 141(3), 233-
244.
McPhearson, R. M., DePaola, A., Zywno, S. R., Motes, M. L., & Guarino, A. M. (1991).
Antibiotic resistance in Gram-negative bacteria from cultured catfish and aquaculture
ponds. Aquaculture (Amsterdam, Netherlands), 99(3), 203-211.
Miles, R., & Chapman, F. (2015). The Benefits of Fish Meal in Aquaculture Diets. UF/IFAS
Extension:
Page 166
150
Misra, S. K., Bhadra, R. K., Pal, S., & Nair, G. B. (1989). Growth of Aeromonas spp. on
Butzler Campylobacter selective agar and evaluation of the agar for the primary
isolation of Aeromonas spp. from clinical specimens. Journal of Clinical Microbiology,
27(2), 346-347.
Mohan, M., Bhanja, S., & Basade, Y. (2009). Performance of chitin incorporated diet on the
indigenous Kumaon Himalayan fishes: snow trout, Schizothorax richardsonii (Gray)
and golden mahseer, Tor putitora (Hamilton). Indian Jounal of Fisheries, 56(2), 135-
137.
Mohanta, K., Mohanty, S., Jena, J., & Sahu, N. (2006). Apparent protein, lipid and energy
digestibility coefficients of some commonly used feed ingredients in formulated
pelleted diets for silver barb, Puntius gonionotus. Aquaculture Nutrition, 12(3), 211-
218.
Monaghan, P., Metcalfe, N. B., & Torres, R. (2009). Oxidative stress as a mediator of life
history trade‐offs: mechanisms, measurements and interpretation. Ecology Letters,
12(1), 75-92.
Morales, A. E., Perez-Jimenez, A., Hidalgo, M. C., Abellan, E., & Cardenete, G. (2004).
Oxidative stress and antioxidant defenses after prolonged starvation in Dentex dentex
liver. Comparative Biochemistry and Physiology: Toxicology & Pharmacology, 139(1-
3), 153-161.
Mostafa, K., Islam, M., & Rashid, M. M. (2008). Experimental pathogenesis of Aeromonas
hydrophila bacteria in stinging catfish Heteropneustes fossilis. Bangladesh J Fish Res,
12(1), 27-33.
Mulero, V., Esteban, M., Munoz, J., & Meseguer, J. (1998). Dietary intake of levamisole
enhances the immune response and disease resistance of the marine teleost gilthead
seabream (Sparus aurataL.). Fish & Shellfish Immunology, 8(1), 49-62.
Musa, S., & Omoregie, E. (1999). Haematological changes in the mudfish, Clarias gariepinus
(Burchell) exposed to malachite green. Journal of Aquatic Science, 14(1), 37-42.
Nakagaki, B., Sunde, M., & DeFoliart, G. (1987). Protein quality of the house cricket, Acheta
domesticus, when fed to broiler chicks. Poultry Science, 66(8), 1367-1371.
Nandeesha, M., Gangadhara, B., Varghese, T., & Keshavanath, P. (2000). Growth response and
flesh quality of common carp, Cyprinus carpio fed with high levels of nondefatted
silkworm pupae. Asian Fisheries Science, 13(3), 235-242.
Page 167
151
Ng, W. K., Liew, F. L., Ang, L. P., & Wong, K. W. (2001). Potential of mealworm (Tenebrio
molitor) as an alternative protein source in practical diets for African catfish, Clarias
gariepinus. Aquaculture Research, 32(s1), 273-280.
Ngo, D.-H., & Kim, S.-K. (2014). Antioxidant effects of chitin, chitosan and their derivatives:
Elsevier Inc.: Oxford, UK.
Nguyen, P., & Oanh, D. (2009). Striped catfish (Pangasianodon hypophthalmus) aquaculture in
Viet Nam: an unprecedented development within a decade. Success stories in Asian
aquaculture, ed. SS De Silva, and FB Davy, 133-150.
Nielsen, H. K., & Hurrell, R. F. (1985). Tryptophan determination of food proteins by HPLC
after alkaline hydrolysis. Journal of the Science of Food and Agriculture, 36(9), 893-
907.
Nimmo, I. (1987). The Glutathione S-transferases of fish. Fish Physiology and Biochemistry,
3(4), 163-172.
Nordberg, J., & Arner, E. S. (2001). Reactive oxygen species, antioxidants, and the mammalian
thioredoxin system. Free Radical Biology and Medicine, 31(11), 1287-1312.
NRC. (1983). Nutrient requirements of warmwater fishes and shellfishes. Washington DC,
USA:
NRC. (1993). Nutrient Requirements of Fish. Washington, DC, USA.:
NRC. (2011). Nutrient requirements of fish and shrimp. Washington DC, USA
Nunes, A. J., Sá, M. V., Browdy, C. L., & Vazquez-Anon, M. (2014). Practical
supplementation of shrimp and fish feeds with crystalline amino acids. Aquaculture
(Amsterdam, Netherlands), 431, 20-27.
Ogier de Baulny, M., Quentel, C., Fournier, V., Lamour, F., & Le Gouvello, R. (1996). Effect
of long-term oral administration of β-glucan as an immunostimulant or an adjuvant on
some non-specific parameters of the immune response of turbot Scophthalmus maximus.
Diseases of Aquatic Organisms, 26(2), 139-147.
Ogino, C., Kakino, J., & Chen, M. (1973). Protein nutrition in fish. 2. Determination of
metabolic fecal nitrogen and endogenous nitrogen excretions of Carp. Bulletin of the
Japanese Society of Scientific Fisheries, 39(5), 519-523.
Page 168
152
Ogunji, J. O., Nimptsch, J., Wiegand, C., & Schulz, C. (2007). Evaluation of the influence of
housefly maggot meal (magmeal) diets on catalase, Glutathione S-transferase and
glycogen concentration in the liver of Oreochromis niloticus fingerling. Comparative
Biochemistry and Physiology. Part A: Molecular and Integrative Physiology, 147(4),
942-947.
Ogunji, J. O., Nimptsch, J., Wiegand, C., Schulz, C., & Rennert, B. (2011). Effect of housefly
maggot meal (magmeal) diets on catalase, and Glutathione S-transferase in the liver and
gills of carp Cyprinus carpio fingerling. International Aquatic Research, 3, 11-20.
Ogunji, J. O., Osuigwe, D. I., Okogwu, O., & Uwadiegwu, N. (2008). Response of African
catfish, Clarias gariepinus (Burchell, 1822), to diets of pigeon pea, Cajanus cajan,
subjected to different processing methods. Journal of the World Aquaculture Society,
39(2), 215-224.
Oishi, C. A., Nwanna, L. C., & Pereira Filho, M. (2010). Optimum dietary protein requirement
for Amazonian Tambaqui, Colossoma macropomum Cuvier, 1818, fed fish meal free
diets. Acta Amazonica, 40(4), 757-762.
Ojewola, G. S., F.C., O., & Ukoha, O. A. (2005). Comparative utilization of three animal
protein sources by broiler chickens. International Journal of Poultry Science, 4, 462-
467.
Oliva‐Teles, A. (2012). Nutrition and health of aquaculture fish. Journal of Fish Diseases,
35(2), 83-108.
Oyawoye, E., & Ogunkunle, M. (1998). Physiological and biochemical effects of raw jack
beans on broilers. Paper presented at the Proc.: Annual Conference of Nigerian Society
of Animal Production, Abeokuta, Nigeria.
Ozimek, L., Sauer, W. C., Kozikowski, V., Ryan, J., Jørgensen, H., & Jelen, P. (1985).
Nutritive value of protein extracted from honey bees. Journal of Food Science, 50(5),
1327-1329.
Ozovehe, B. N. (2013). Growth Performance, Haematological Indices and Some Biochemical
Enzymes of Juveniles Clarias gariepinus (Burchell 1822) Fed Varying Levels of
Moringa oleifera Leaf Meal Diet. Journal of Aquaculture Research Development,
4(166), 2.
Page, J., Rumsey, G., Riis, R., & Scott, M. (1978). Dietary sulfur requirements of fish-
nutritional and pathological criteria. Paper presented at the Federation Conference.
Page 169
153
Palti, Y., Tinman, S., Cnaani, A., Avidar, Y., Ron, M., & Hulata, G. (1999). Comparative study
of biochemical and non-specific immunological parameters in two tilapia species
(Oreochromis aureus and O. mossambicus). Israeli Journal of Aquaculture Bamidgeh,
51, 148-156.
Pamplona, R., & Costantini, D. (2011). Molecular and structural antioxidant defenses against
oxidative stress in animals. American Journal of Physiological-Regulator Integrative
Comparative Physiological, 301(4), 843-863.
Pantazis, P. A. (2005). Protein to energy ratios in African catfish fed purified diets: is Clarias
gariepinus (Burchell) an ordinary carnivore? Archives of Polish Fisheries, 13(2).
Pantazis, P. A., & Neofitou, C. N. (2004). Digestibility of nutrients and energy in diets for the
African atfish Clarias gariepinus (Burchell 1822). Israeli Journal of Aquaculture–
Bamidgeh, 56(3), 176-187.
Pascual, P., Pedrajas, J., Toribio, F., López-Barea, J., & Peinado, J. (2003). Effect of food
deprivation on oxidative stress biomarkers in fish (Sparus aurata). Chemico-Biological
Interactions, 145(2), 191-199.
Penkov, D., Kipriotis, E., Grekov, D., & Ivanov, K. (2002). Determination of the amino acid
content and digestibility of the silkworm (bombyx mori) pupae meal, a waste of reeling
factories, in gees. Epitheorese Zootechnikes Epistemes, 77-85.
Pês, T. S., Saccol, E. M. H., Ourique, G. M., Londero, É. P., Gressler, L. T., Golombieski, J. I.,
Glanzner, W. G., Llesuy, S. F., Gonçalves, P. B. D., Neto, J. R., Baldisserotto, B., &
Pavanato, M. A. (2016). Quercetin in the diet of silver catfish: Effects on antioxidant
status, blood parameters and pituitary hormone expression. Aquaculture (Amsterdam,
Netherlands), 458, 100-106.
Phan, L. T., Bui, T. M., Nguyen, T. T., Gooley, G. J., Ingram, B. A., Nguyen, H. V., Nguyen,
P. T., & De Silva, S. S. (2009). Current status of farming practices of striped catfish,
Pangasianodon hypophthalmus in the Mekong Delta, Vietnam. Aquaculture
(Amsterdam, Netherlands), 296(3), 227-236.
Philip, R., Sreekumar, K., Anas, A., & Bright Singh, I. (2001). Immunostimulants–source,
diversity, commercial preparations and mode of application. National Workshop on
Aquaculture Medicine:
Phonekhampheng, O. (2008). On-Farm Feed Resources for Catfish (Clarias gariepinus)
Production in Laos. (Doctorate), Swedish University of Agricultural Science.
Page 170
154
Phonekhampheng, O., Hung, L., & Lindberg, J. (2009). Ensiling of Golden Apple snails
(Pomacea canaliculata) and growth performance of African catfish (Clarias
gariepinus) fingerlings fed diets with raw and ensiled Golden Apple snails as protein
source. Livestock Research for Rural Development, 21(2).
Piccolo, G., Marono, S., Gasco, L., Iannaccone, F., Bovera, F., & Nizza, A. (2014). Use of
Tenebrio molitor larvae meal in diets for gilthead sea bream Sparus aurata juveniles.
Insects to Feed The World, The Netherlands, 14-17.
Pohlenz, C., & Gatlin, D. M. (2014). Interrelationships between fish nutrition and health.
Aquaculture (Amsterdam, Netherlands), 431, 111-117.
Poston, H. A., & Rumsey, G. L. (1983). Factors affecting dietary requirement and deficiency
signs of L-tryptophan in rainbow trout. The Journal of nutrition, 113(12), 2568-2577.
Powell, A., & Rowley, A. F. (2007). The effect of dietary chitin supplementation on the
survival and immune reactivity of the shore crab, Carcinus maenas. Comparative
Biochemical Physiology Part A: Molecular & Integrative Physiology, 147(1), 122-128.
Premalatha, M., Abbasi, T., Abbasi, T., & Abbasi, S. (2011). Energy-efficient food production
to reduce global warming and ecodegradation: The use of edible insects. Renewable and
Sustainable Energy Reviews, 15(9), 4357-4360.
Pretorius, Q. (2011). The evaluation of larvae of Musca domestica (common house fly) as
protein source for broiler production. Stellenbosch: Stellenbosch University.
Quintero, H., Durland, E., Allen Davis, D., & Dunham, R. (2011). Effect of lipid
supplementation on reproductive performance of female channel catfish, Ictalurus
punctatus, induced and strip‐spawned for hybridization. Aquaculture Nutrition, 17(2),
117-129.
Raa, J., Roerstad, G., Engstad, R., & Robertsen, B. (1992). The use of immunostimulants to
increase resistance of aquatic organisms to microbial infections. Diseases in Asian
aquaculture, 1, 39-50.
Radi, A. A. R., & Matkovics, B. (1988). Effects of metal ions on the antioxidant enzyme
activities, protein contents and lipid peroxidation of carp tissues. Comparative
Biochemical Physiology Part C: Comparative Pharmacology, 90(1), 69-72.
Rainza-Paiva, M., Ishikawa, C., Das Eiras, A., & Felizardo, N. (2000). Haemotological analysis
of ‘chara’ Pseudoplatystoma fasciatum in captivity. Aquaculture (Amsterdam,
Netherlands), 2-6.
Page 171
155
Ramalingam, V., Thirunavukkarasu, N., Chandy, N., & Rajaram, R. (2014). Proximate
composition of trash fishes and their utilization as organic amendment for plant growth.
Journal of the Marine Biological Association of India, 56(2), 12.
Ramos-Elorduy, J. (2008). Energy supplied by edible insects from Mexico and their nutritional
and ecological importance. Ecology of Food and Nutrition, 47(3), 280-297.
Ramos-Elorduy, J., González, E. A., Hernández, A. R., & Pino, J. M. (2002). Use of Tenebrio
molitor (Coleoptera: Tenebrionidae) to recycle organic wastes and as feed for broiler
chickens. Journal of Economic Entomology, 95(1), 214-220.
Ramos-Elorduy, J., Moreno, J. M. P., Prado, E. E., Perez, M. A., Otero, J. L., & De Guevara,
O. L. (1997). Nutritional value of edible insects from the state of Oaxaca, Mexico.
Journal of Food Compostion and Analysis, 10(2), 142-157.
Rashid, M. M., Honda, K., Nakai, T., & Muroga, K. (1994). An ecological study on
Edwardsiella tarda in flounder farms. Gyobyo Kenkyu / Fish Pathology, 29(4), 221-
227.
Robinson, E., & Li, M. (2007). Catfish protein nutrition: revised. Mississippi Agricultural and
Forestry Experimental Station. Bulletin, 1159.
Robinson, E., Menghe, H., & Li, C. D. H. (2006). Catfish Nutrition : Nutrient Requirement. A.
o. Congress. Retrieved from Mississippi State University Extension Service:
Robinson, E. H., Wilson, R. P., & Poe, W. E. (1981). Arginine requirement and apparent
absence of a lysine-arginine antagonist in fingerling channel catfish. The Journal of
Nutrition, 111(1), 46-52.
Robinson, M. K., Rustum, R. R., Chambers, E. A., Rounds, J. D., Wilmore, D. W., & Jacobs,
D. O. (1997). Starvation enhances hepatic free radical release following endotoxemia.
Journal of Surgical Research, 69(2), 325-330.
Roche, H., & Bogé, G. (1996). Fish blood parameters as a potential tool for identification of
stress caused by environmental factors and chemical intoxication. Marine
Environmental Research, 41(1), 27-43.
Rodehutscord, M., Becker, A., Pack, M., & Pfeffer, E. (1997). Response of rainbow trout
(Oncorhynchus mykiss) to supplements of individual essential amino acids in a
semipurified diet, including an estimate of the maintenance requirement for essential
amino acids. The Journal of nutrition, 127(6), 1166-1175.
Page 172
156
Roncarati, A., Gasco, L., Parisi, G., & Terova, G. (2015). Growth performance of common
catfish (Ameiurus melas Raf.) fingerlings fed mealworm (Tenebrio molitor) diet.
Journal of Insects for Food as Feed, 1-8.
Rueda-Jasso, R., Conceiçao, L. E., Dias, J., De Coen, W., Gomes, E., Rees, J.-F., Soares, F.,
Dinis, M. T., & Sorgeloos, P. (2004). Effect of dietary non-protein energy levels on
condition and oxidative status of Senegalese sole (Solea senegalensis) juveniles.
Aquaculture (Amsterdam, Netherlands), 231(1), 417-433.
Rumpold, B. A., & Schlüter, O. K. (2013). Potential and challenges of insects as an innovative
source for food and feed production. Innovative Food Science & Emerging
Technologies, 17, 1-11.
Safriel, O., & Bruton, M. N. (1984). Aquaculture in South Africa: A cooperative research
programme: National Scientific Programmes Unit: CSIR.
Sahin, K., Yazlak, H., Orhan, C., Tuzcu, M., Akdemir, F., & Sahin, N. (2014). The effect of
lycopene on antioxidant status in rainbow trout (Oncorhynchus mykiss) reared under
high stocking density. Aquaculture (Amsterdam, Netherlands), 418, 132-138.
Sakai, M. (1999). Current research status of fish immunostimulants. Aquaculture (Amsterdam,
Netherlands), 172(1), 63-92.
Sakai, M., Kamiya, H., Ishii, S., Atsuta, S., & Kobayashi, M. (1992). The immunostimulating
effects of chitin in rainbow trout, Oncorhynchus mykiss. Diseases in Asian Aquaculture,
1, 413-417.
Sánchez-Muros, M.-J., Barroso, F. G., & Manzano-Agugliaro, F. (2014). Insect meal as
renewable source of food for animal feeding: a review. Journal of Cleaner Production,
65, 16-27.
Sarkar, M., & Rashid, M. M. (2012). Pathogenicity of the bacterial isolate Aeromonas
hydrophila to catfishes, carps and perch. Journal of Bangladesh Agriculture University,
10(1), 157-161.
Schmidt, A. S., Bruun, M. S., Dalsgaard, I., Pedersen, K., & Larsen, J. L. (2000). Occurrence of
antimicrobial resistance in fish-pathogenic and environmental bacteria associated with
four Danish rainbow trout farms. Applied and Environmental Microbiology, 66(11),
4908-4915.
Schulz, C., Knaus, U., Wirth, M., & Rennert, B. (2005). Effects of varying dietary fatty acid
profile on growth performance, fatty acid, body and tissue composition of juvenile pike
perch (Sander lucioperca). Aquaculture Nutrition, 11(6), 403-413.
Page 173
157
Sealey, W. M., Gaylord, T. G., Barrows, F. T., Tomberlin, J. K., McGuire, M. A., Ross, C., &
St‐Hilaire, S. (2011). Sensory analysis of rainbow trout, Oncorhynchus mykiss, fed
enriched black soldier fly prepupae, Hermetia illucens. Journal of the World
Aquaculture Society, 42(1), 34-45.
Seiverd, C. E. (1983). Hematology for medical technologists: Lea & Febiger.
Shahzad, K., Salim, M., & Asad, F. (2006). Evaluation of apparent digestibility coefficient of
corn, wheat and feather meal for Labeo rohita. Pakistan Journal of Zoology (Pakistan).
Shao, Q., Wang, Y., Zhou, J., Zhou, F., Hua, Y., & Zhang, J. (2014, 25 - 30 May). Evaluation
of soybean protein concentrate as fish meal alternative in diets for juvenile black sea
bream (Acanthopagrus schlegelii) with supplementation of methionine and lysine. Paper
presented at the 16th International Symposium on Fish Nutrition and Feeding, Cairns
Convention Centre, Australia.
Shearer, K. (2000). Experimental design, statistical analysis and modelling of dietary nutrient
requirement studies for fish: a critical review. Aquaculture Nutrition, 6(2), 91-102.
Shepherd, C., & Jackson, A. (2013). Global fishmeal and fish‐oil supply: inputs, outputs and
marketsa. Journal of Fish Biology, 83(4), 1046-1066.
Shugar, D. (1952). The measurement of lysozyme activity and the ultra-violet inactivation of
lysozyme. Biochimica et Biophysica Acta, 8, 302-309.
Singh, A. K., Srivastava, S. C., Ansari, A., Kumar, D., & Singh, R. (2012). Environmental
monitoring and health risk assessment of African catfish Clarias gariepinus (Burchell,
1822) cultured in rural ponds, India. Bulletin of Environmental Contamination and
Toxicology, 89(6), 1142-1147.
Siwicki, A. K. (1990). Immunostimulating influence of levamisole on nonspecific immunity in
carp (Cyprinus carpio). Developmental and Comparative Immunology, 13(1), 87-91.
Siwicki, A. K., Anderson, D. P., & Rumsey, G. L. (1994). Dietary intake of immunostimulants
by rainbow trout affects non-specific immunity and protection against furunculosis.
Veterinary Immunology and Immunopathology, 41(1), 125-139.
Skelton, P. H. (2001). A complete guide to the freshwater fishes of southern Africa: Struik
Publisher.
Sogbesan, A., & Ugwumba, A. (2008). Nutritional evaluation of termite (Macrotermes
subhyalinus) meal as animal protein supplements in the diets of Heterobranchus
Page 174
158
longifilis (Valenciennes, 1840) fingerlings. Turkish Journal of Fisheries and Aquatic
Sciences, 8(1), 149-157.
Solomon, S., & Tiamiyu, L. (2007). Wing Reproductive Termite (Macrotremes nigeriensis)-
Soybean (Glyxine max) Meals Blend as Dietary Protein Source in the Practical Diets of
Heterobranchus bidorsalis Fingerlings. Pakistan Journal of Nutrition, 6(3), 267-270.
Sotolu, A., & Adejumoh, M. (2008). Nutrient values and Utilization of rumen epithelia meal by
African catfish for sustainable aquaculture practices. World Journal of Biological
Research, 1(2).
Spiegel, v. d. M., Noordam, M., & Fels‐Klerx, v. d. H. (2013). Safety of novel protein sources
(insects, microalgae, seaweed, duckweed, and rapeseed) and legislative aspects for their
application in food and feed production. Comprehensive reviews in food science and
food safety, 12(6), 662-678.
St‐Hilaire, S., Sheppard, C., Tomberlin, J. K., Irving, S., Newton, L., McGuire, M. A.,
Mosley, E. E., Hardy, R. W., & Sealey, W. (2007). Fly prepupae as a feedstuff for
rainbow trout, Oncorhynchus mykiss. Journal of the World Aquaculture Society, 38(1),
59-67.
Steffens, W. (1996). Importance and benefit of using lipids in fish nutrition. Fett-Lipid, 98(9),
292-299.
Stoliar, O. B., & Lushchak, V. I. (2012). Environmental pollution and oxidative stress in fish:
INTECH Open Access Publisher.
Stone, D. A. (2003). Dietary carbohydrate utilization by fish. Reviews in Fisheries Science,
11(4), 337-369.
Suarez, L. E. C., Ricque, D., Pike, H. I., & Cuzon, G. (1999). Determination of some factors
affecting the nutritional and biotoxicological value of fishmeal for use in feed for
shrimp culture and to establish quality control norms. International Fishmeal & Oil
Manufacturers Association:
Suga, Y. (2006). Independent paper. Chinese cricket-fighting. International Journal of Asian
Studies, 3(01), 77-93.
Sun, Y. (1990). Free radicals, antioxidant enzymes, and carcinogenesis. Free Radical Biology
and Medicine, 8(6), 583-599.
Page 175
159
Svobodová, Z., Máchová, J., Drastichová, J., Groch, L., Lusková, V., Poleszczuk, G., Velíšek,
J., & Kroupová, H. (2005). Haematological and biochemical profiles of carp blood
following nitrite exposure at different concentrations of chloride. Aquaculture Research,
36(12), 1177-1184.
Szelei, J., Woodring, J., Goettel, M., Duke, G., Jousset, F.-X., Liu, K., Zadori, Z., Li, Y., Styer,
E., & Boucias, D. (2011). Susceptibility of North-American and European crickets to
Acheta domesticus densovirus (AdDNV) and associated epizootics. Journal of
Invertebrate Pathology, 106(3), 394-399.
Tacon, A. G., Hasan, M. R., & Metian, M. (2011). Demand and supply of feed ingredients for
farmed fish and crustaceans: trends and prospects: Food and Agriculture Organisation.
Taufek, N. M., Aspani, F., Muin, H., Raji, A. A., Alias, Z., & Razak, S. A. (2016). The effect
of dietary cricket meal (Gryllus bimaculatus) on growth performance, antioxidant
enzyme activities, and haematological response of African catfish (Clarias gariepinus).
Fish Physiology and Biochemistry, 42(4), 1143 - 1155.
Taufek, N. M., Razak, S. A., Alias, Z., & Muin, H. (2013). Potential value of black cricket
meal as protein replacement for fishmeal in African Catfish, (Clarias gariepinus)
fingerlings nutrition. Paper presented at the Advancements in Marine and Freshwater
Science, UMTAS Kuala Terengganu.
Thanikachalam, K., Kasi, M., & Rathinam, X. (2010). Effect of garlic peel on growth,
hematological parameters and disease resistance against Aeromonas hydrophila in
African catfish Clarias gariepinus (Bloch) fingerlings. Asian Pacific Journal of
Tropical Medicine, 3(8), 614-618.
Tiana, L., Caib, Q., & Wei, H. (1998). Alterations of antioxidant enzymes and oxidative
damage to macromolecules in different organs of rats during aging. Free Radical
Biology and Medicine, 24(9), 1477-1484.
Tibbetts, S. M., & Lall, S. P. (2013). Effect of dietary inclusion of Atlantic snow crab,
Chionoecetes opilio and Northern pink shrimp, Pandalis borealis processing by-
products on nutrient digestibility by juvenile haddock, Melanogrammus aeglefinus .
Animal Feed Science and Technology, 182(1), 126-130.
Toko, I., Fiogbe, E. D., Koukpode, B., & Kestemont, P. (2007). Rearing of African catfish
(Clarias gariepinus) and vundu catfish (Heterobranchus longifilis) in traditional fish
ponds (whedos): effect of stocking density on growth, production and body
composition. Aquaculture (Amsterdam, Netherlands), 262(1), 65-72.
Tran, G., Heuzé, V., & Makkar, H. (2015). Insects in fish diets. Animal Frontiers, 5(2), 37-44.
Page 176
160
Tuan, N. A., Phuong, N. T., Liem, P. T., & Thuong, N. (2003). Results of the study on
Pangasius catfishes and their future development. Journal of Mekong Fisheries, 12,
129-134.
Turnbull, J., Bell, A., Adams, C., Bron, J., & Huntingford, F. (2005). Stocking density and
welfare of cage farmed Atlantic salmon: application of a multivariate analysis.
Aquaculture (Amsterdam, Netherlands), 243(1), 121-132.
Vahedi, G., & Ghodratizadeh, S. (2011). Effect of chitin supplemented diet on innate immune
response of rainbow trout. World Journal of Fisheries Marine Science, 3(6), 509-513.
Van der Waal, B. (1998). Survival strategies of sharptooth catfish Clarias gariepinus in
desiccating pans in the northern Kruger National Park. Koedoe, 41(2), 131-138.
Van Huis, A., Van Itterbeeck, J., Klunder, H., Mertens, E., Halloran, A., Muir, G., &
Vantomme, P. (2013). Edible insects—future prospects for food and feed security.
FAO, Rome.
Venkatesh, B., Mukherji, A., Mukhopadhyay, P., & Dehadrai, P. (1986). Growth and
metabolism of the catfish Clarias batrachus (Linn.) fed with different experimental
diets. Proceedings: Animal Sciences, 95(4), 457-462.
Verma, V. K., Rani, K. V., Sehgal, N., & Prakash, O. (2013). Immunostimulatory effect of
artificial feed supplemented with indigenous plants on Clarias gariepinus against
Aeromonas hydrophila. Fish & Shellfish Immunology, 35(6), 1924-1931.
Villamil, L., Figueras, A., & Novoa, B. (2003). Immunomodulatory effects of nisin in turbot
(Scophthalmus maximus L.). Fish & Shellfish Immunology, 14(2), 157-169.
Viveen, W., Richter, C., Van Oordt, P., Janssen, J., & Huisman, E. (2013). Practical manual for
the culture of the African catfish (Clarias gariepinus).
Wang, D., Bai, Y. y., Li, J. h., & Zhang, C. x. (2004). Nutritional value of the field cricket
(Gryllus testaceus walker). Insect Science, 11(4), 275-283.
Wang, D., Zhai, S. W., Zhang, C. X., Bai, Y. Y., An, S. H., & Xu, Y. N. (2005). Evaluation on
nutritional value of field crickets as a poultry feedstuff. Asian Australian Journal of
Animal Science, 18, 667-670.
Wang, S.-H., & Chen, J.-C. (2005). The protective effect of chitin and chitosan against Vibrio
alginolyticus in white shrimp Litopenaeus vannamei. Fish & Shellfish Immunology,
19(3), 191-204.
Page 177
161
Wdziȩczak, J., Zaleśna, G., Wujec, E., & Peres, G. (1982). Comparative studies on superoxide
dismutase, catalase and peroxidase levels in erythrocytes and livers of different
freshwater and marine fish species. Comparative Biochemistry and Physiology Part B:
Comparative Biochemistry, 73(2), 361-365.
Wiegand, C., Akkanen, J., Pehkonen, S., & Kukkonen, G. (2007). Bioaccumulation and energy
costs of detoxication and antioxidative enzymes of Lumbriculus variegatus, treated with
paraquat and dissolved organic matter. Chemosphere, 66, 558-566.
Wilhelm Filho, D., Giulivi, C., & Boveris, A. (1993). Antioxidant defences in marine fish—I.
Teleosts. Comparative Biochemistry and Physiology Part C: Pharmacology, Toxicology
and Endocrinology, 106(2), 409-413.
Wilhelm Filho, D., Torres, M. A., Zaniboni-Filho, E., & Pedrosa, R. C. (2005). Effect of
different oxygen tensions on weight gain, feed conversion, and antioxidant status in
piapara, Leporinus elongatus (Valenciennes, 1847). Aquaculture (Amsterdam,
Netherlands), 244(1-4), 349-357.
Wilson, R. (1994). Utilization of dietary carbohydrate by fish. Aquaculture (Amsterdam,
Netherlands), 124(1), 67-80.
Wilson, R. P., Allen Jr, O. W., Robinson, E. H., & Poe, W. E. (1978). Tryptophan and
threonine requirements of fingerling channel catfish. The Journal of Nutrition, 108(10),
1595-1599.
Wilson, R. P., & Moreau, Y. (1996). Nutrient requirements of catfishes (Siluroidei). Aquatic
Living Resources, 9, 103-111.
Wilson, R. P., & Poe, W. E. (1985). Apparent digestible protein and energy coefficients of
common feed ingredients for channel catfish. The Progressive Fish-Culturist, 47(3),
154-158.
Winston, G. W., & Di Giulio, R. T. (1991). Prooxidant and antioxidant mechanisms in aquatic
organisms. Aquatic Toxicology, 19(2), 137-161.
Wu, G. (2013). Amino acids: biochemistry and nutrition: CRC Press.
Wu, W., Mak, C., & Ko, R. (2006). Cloning and characterization of the Cu/Zn superoxide
dismutase of Trichinella pseudospiralis. Parasitology Research, 98(4), 281-287.
Page 178
162
Yang, S.-D., Liou, C.-H., & Liu, F.-G. (2002). Effects of dietary protein level on growth
performance, carcass composition and ammonia excretion in juvenile silver perch
(Bidyanus bidyanus). Aquaculture (Amsterdam, Netherlands), 213(1), 363-372.
Yi, L., Lakemond, C. M. M., Sagis, L. M. C., Eisner-Schadler, V., van Huis, A., & van Boekel,
M. A. J. S. (2013). Extraction and characterisation of protein fractions from five insect
species. Food Chemistry, 141(4), 3341-3348.
Yixiang, M., Jianhua, Y., Jinyun, Z., Xianping, Y., Xia, W., Chenglong, S., & Pei, L. (2013).
The Influence of Maggot Meal and L-Carnitine on Growth, Immunity, Antioxidant
Indices and Disease Resistance of Black Carp (Mylopharyngodon Piceus). Journal of
the Chinese Cereals and Oils Association, 2, 1-9.
Yue, Y.-R., & Zhou, Q.-C. (2008). Effect of replacing soybean meal with cottonseed meal on
growth, feed utilization, and hematological indexes for juvenile hybrid tilapia,
Oreochromis niloticus × O. aureus. Aquaculture (Amsterdam, Netherlands), 284(1),
185-189.
Zhang, Y., Feng, S., Chen, J., Qin, C., Lin, H., & Li, W. (2012). Stimulatory effects of
chitinase on growth and immune defense of orange-spotted grouper (Epinephelus
coioides). Fish & Shellfish Immunology, 32(5), 844-854.
Zheng, Q., Wen, X., Han, C., Li, H., & Xie, X. (2012). Effect of replacing soybean meal with
cottonseed meal on growth, hematology, antioxidant enzymes activity and expression
for juvenile grass carp, Ctenopharyngodon idellus. Fish Physiology and Biochemistry,
38(4), 1059-1069.
Page 179
163
LIST OF PUBLICATIONS AND PAPER PRESENTED
Taufek, N.M., Aspani, F., Muin, H., Raji, A.A., Alias, Z., Razak, S.A (2016). The effect
of dietary cricket meal (Gryllus bimaculatus) on growth performance, antioxidant
activities and haematological response of African catfish (Clarias gariepinus). Fish
Physiology and Biochemistry. 42 (4): 1143 - 1155
Taufek, N.M., Muin, H., Raji, A.A., Yusof, H., Alias, Z., Razak, S.A (2016). Apparent
digestibility coefficient and Amino acid availability of cricket meal, Gryllus
bimaculatus and fishmeal in African catfish, Clarias gariepinus diet. Accepted for
publication by Journal of World Aquaculture Society. DOI: 10.11/jwas.12302
Taufek, N.M., Aspani, F., Muin, H., Raji, A.A., Alias, Z., Razak, S.A (2016). Effect of
dietary cricket meal on the growth performance and resistance against pathogenicity of
Aeromonas hydrophila in African catfish, Clarias gariepinus. Under review in
Aquaculture Nutrition.
Taufek, N.M., Muin, H., Raji, A.A., Yusof, H., Alias, Z., Razak, S.A (2016). Potential
of cricket meal in the diet of African catfish, Clarias gariepinus. Under review in
Applied Journal of Animal Research.
Page 180
164
Potential value of black field cricket meal as protein replacement for African catfish,
Clarias gariepinus fingerlings nutrition, UMTAS, 12th
International UMT Annual
Symposium, 8th
– 10th
October 2013, Permai Hotel Kuala Terengganu – Poster
presentation
Effect of varying level of dietary crude protein of black cricket meal on growth
performance and body composition in fingerlings African catfish, Clarius gariepinus
(Burchell, 1822), 16th
International Symposium on Fish Nutrition and Feeding 2014,
25th
-30th
May 2014, Great Barrier Reef Cairns, Australia – Poster presentation
Apparent digestibility of cricket meal of African catfish, Clarias gariepinus,
International Conference on Waste Management, Ecology and Biological Sciences
(WMEBS’15), 13th
– 14th
May 2015, Kuala Lumpur – Oral presentation.