Norm-Referenced Test Reading Comprehension and Mathematics Results: READING COMPREHENSION MEDIAN %ILE Std. Curric. ESE MATHEMATICS MEDIAN %ILE School LEP All Students 2003 2004 Std. Curric. ESE LEP All Students Median Percentile Scores, by Grade Level and Curriculum Group, for 2003 and 2004, Grades 2-10 2003 2004 2003 2004 2003 2004 2003 2004 2003 2004 2003 2004 2003 2004 0040 LIBERTY CITY CHARTER SCHOOL Grade 02 n/a * n/a n/a 58 61 58 61 n/a * n/a n/a 41 53 41 53 Grade 03 n/a n/a n/a n/a 57 44 57 44 n/a n/a n/a n/a 61 51 61 51 Grade 04 * n/a n/a n/a 36 49 36 49 * n/a n/a n/a 51 55 51 55 Grade 05 n/a * n/a n/a 63 38 63 38 n/a * n/a n/a 53 59 53 59 Grade 06 * * n/a n/a 61 50 63 52 * * n/a n/a 70 67 70 67 0041 AIR BASE ELEMENTARY SCHOOL Grade 02 n/a * n/a n/a 80 72 80 74 n/a * n/a n/a 71 53 71 53 Grade 03 * * n/a n/a 70 78 71 78 * * n/a n/a 70 74 70 78 Grade 04 * * n/a n/a 75 70 75 70 * * n/a n/a 78 75 82 75 Grade 05 * * n/a n/a 73 73 73 73 * * n/a n/a 68 73 73 73 Notes: No data are reported when fewer than 10 students in a category were tested, as indicated by an "*." No students were tested in the curriculum group in one of the two years, as indicated by an "n/a." 1 A curriculum group listing will not appear if no students in the group were tested in either year. Office of Assessment and Data Analysis Grade 2 is the locally administered Stanford Achievement Test, 9th ed. (SAT-9); grades 3-10 results are based on the state's FCAT NRT (SAT-9) program.
Transcript
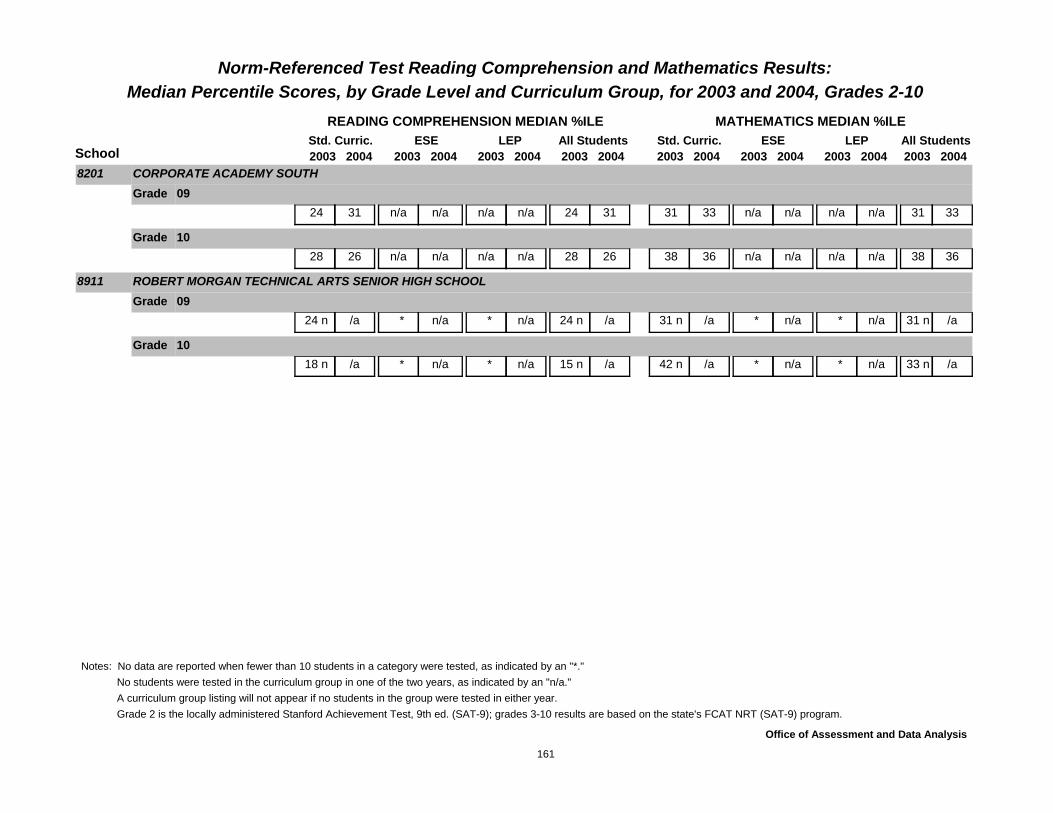
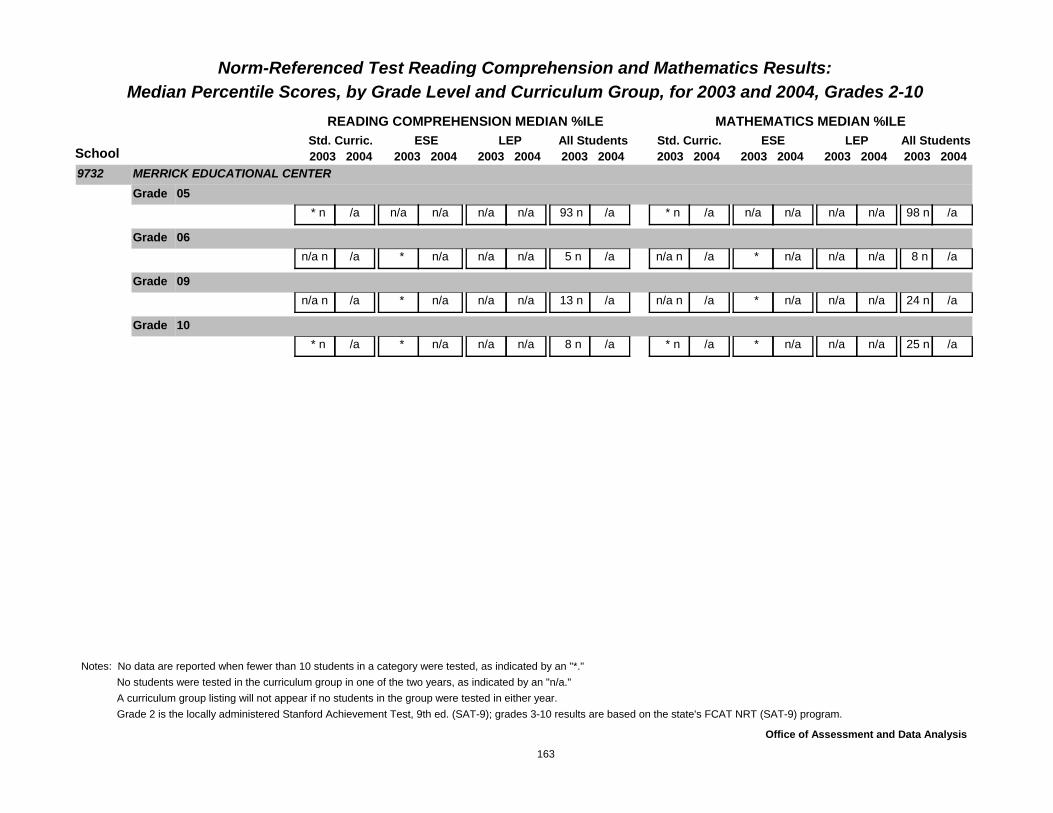
Norm-Referenced Test Reading Comprehension and Mathematics Results:
READING COMPREHENSION MEDIAN %ILE Std. Curric. ESE
MATHEMATICS MEDIAN %ILE
School LEP All Students
2003 2004Std. Curric. ESE LEP All Students
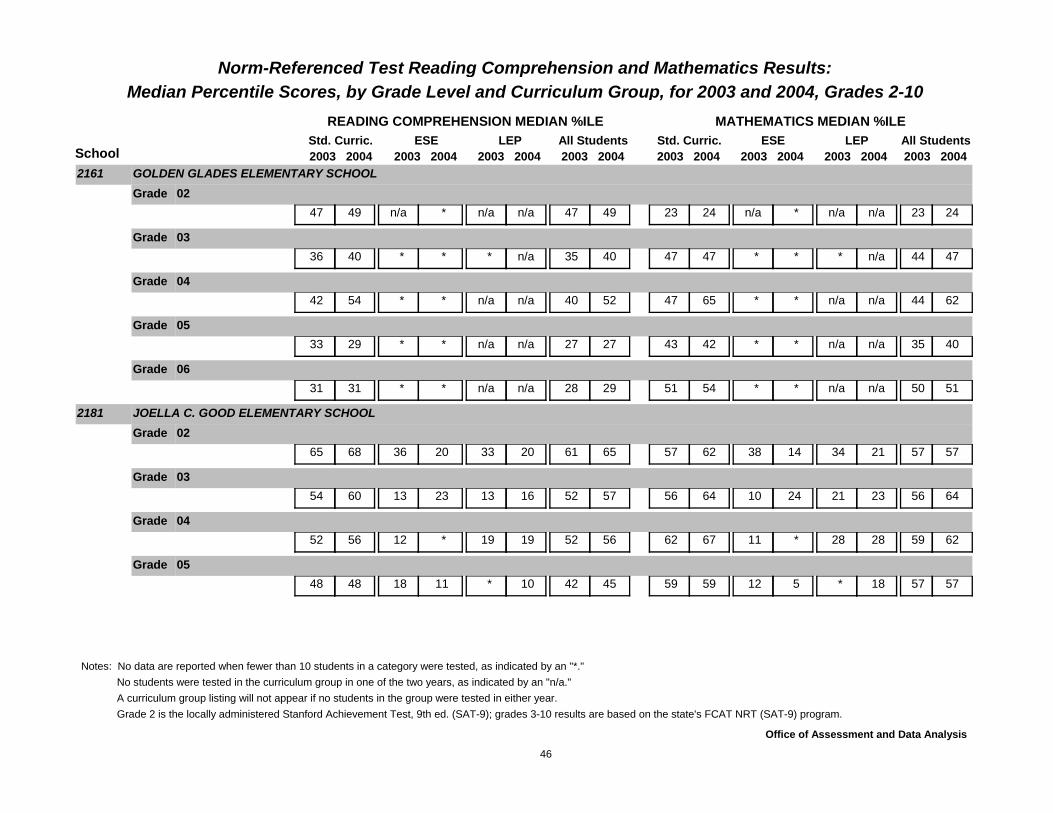
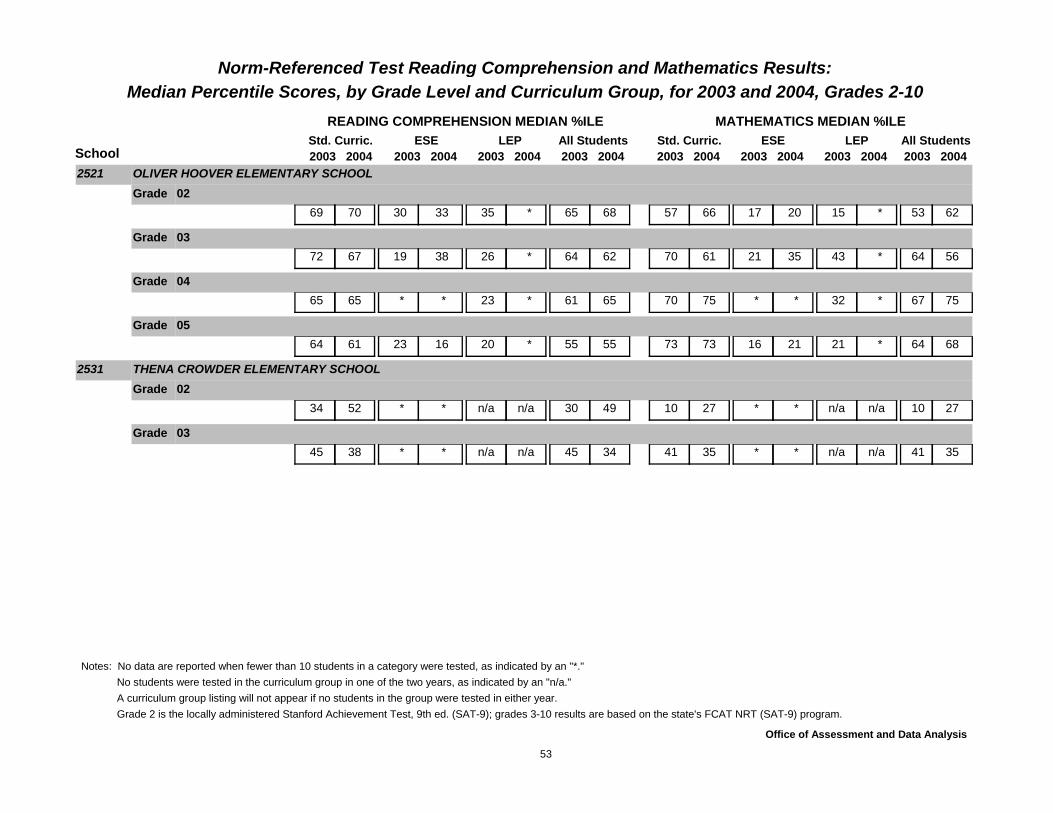
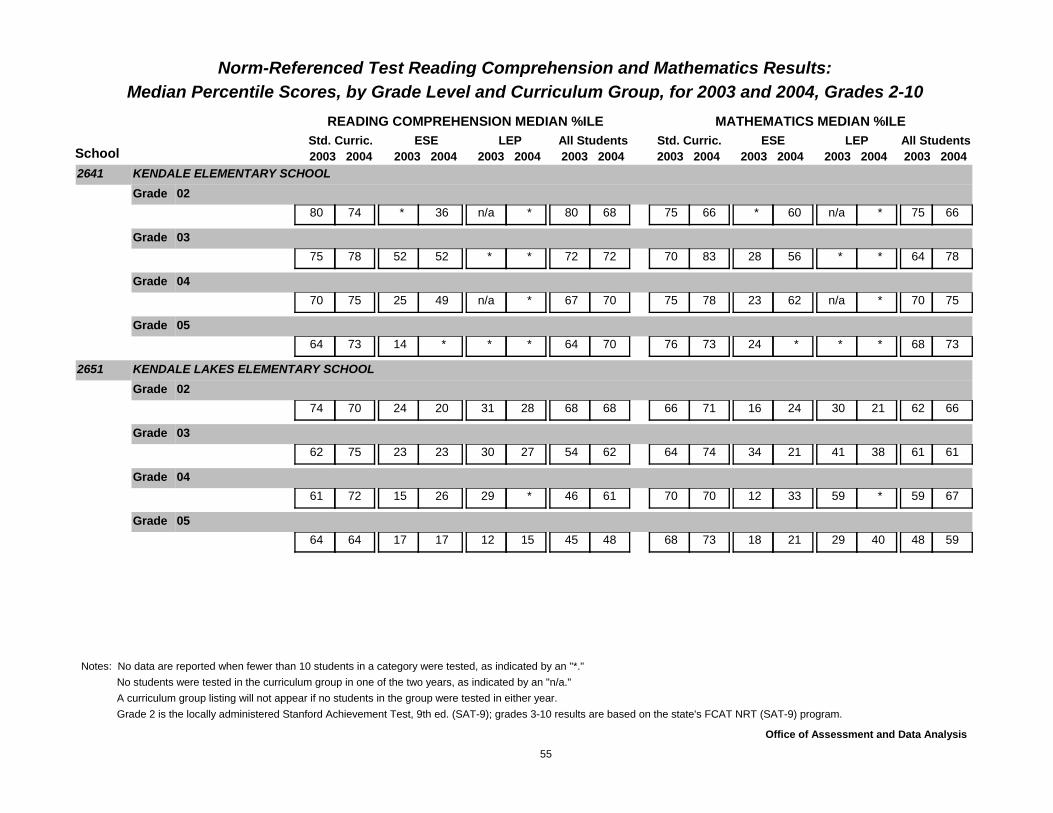
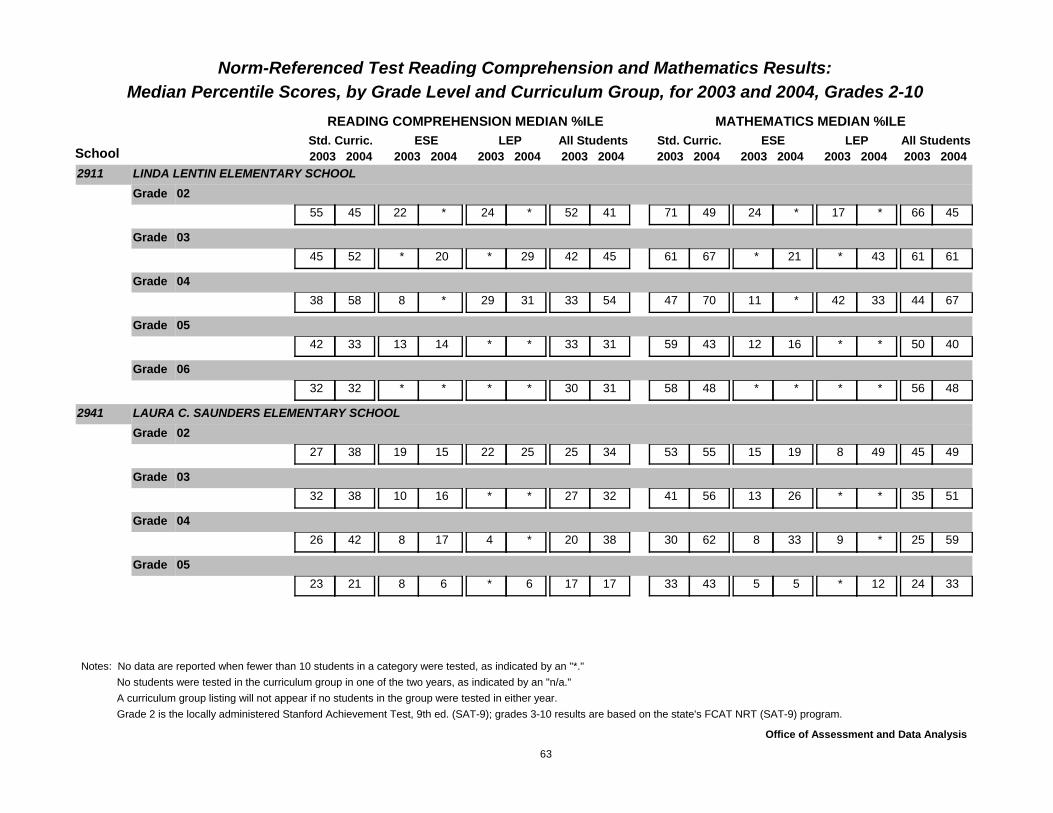
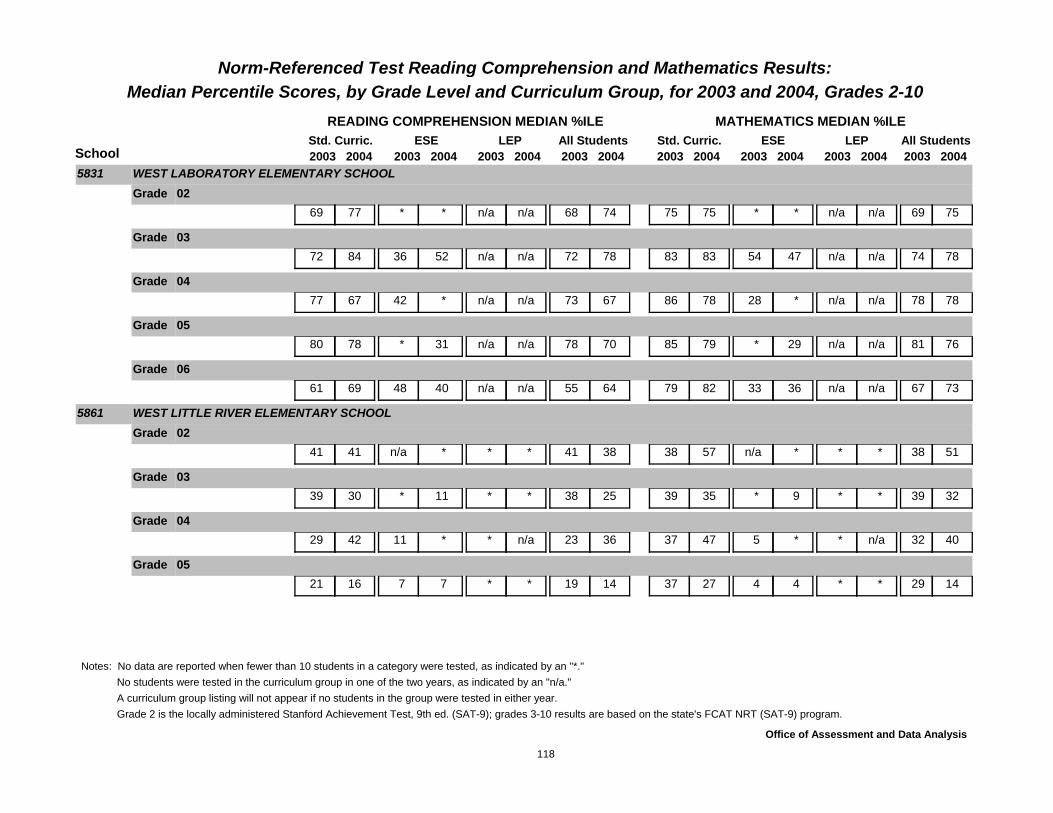
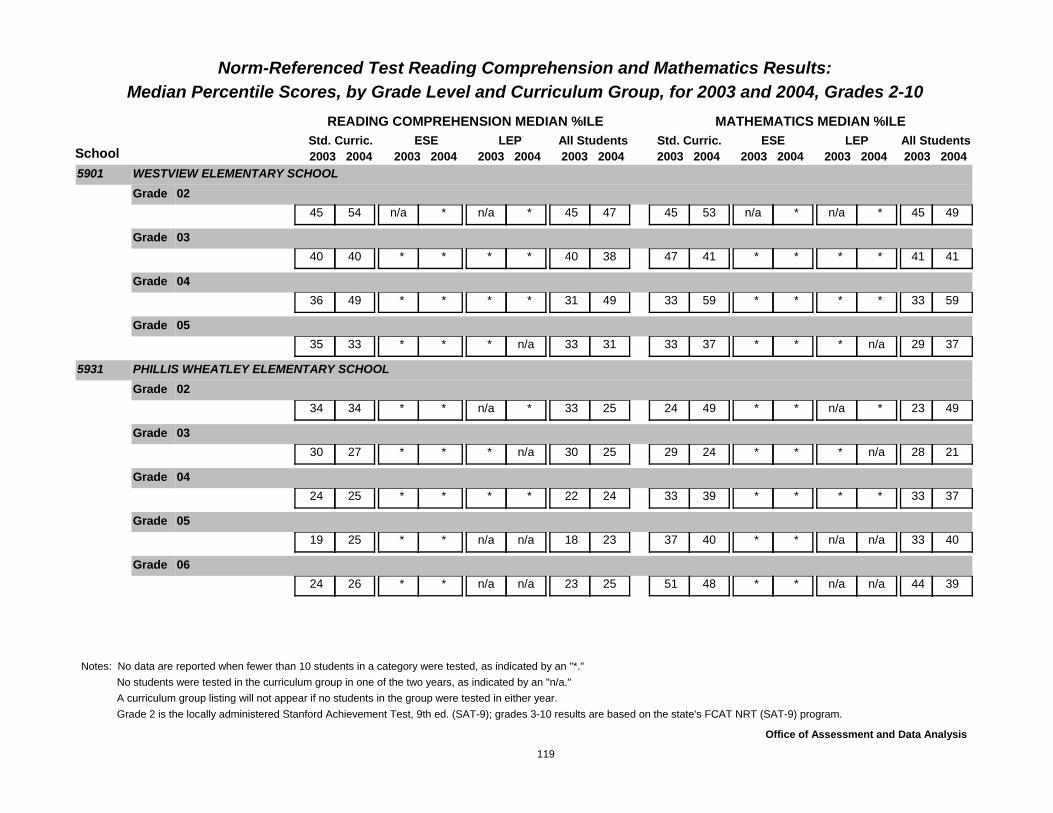
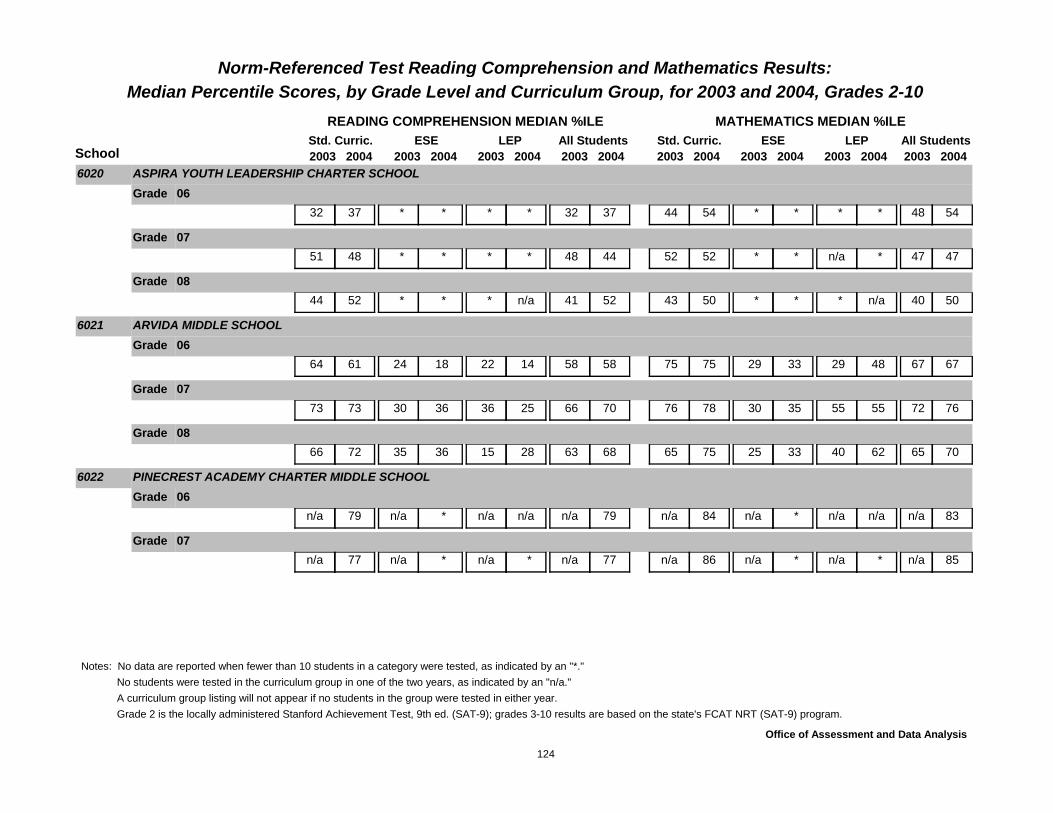
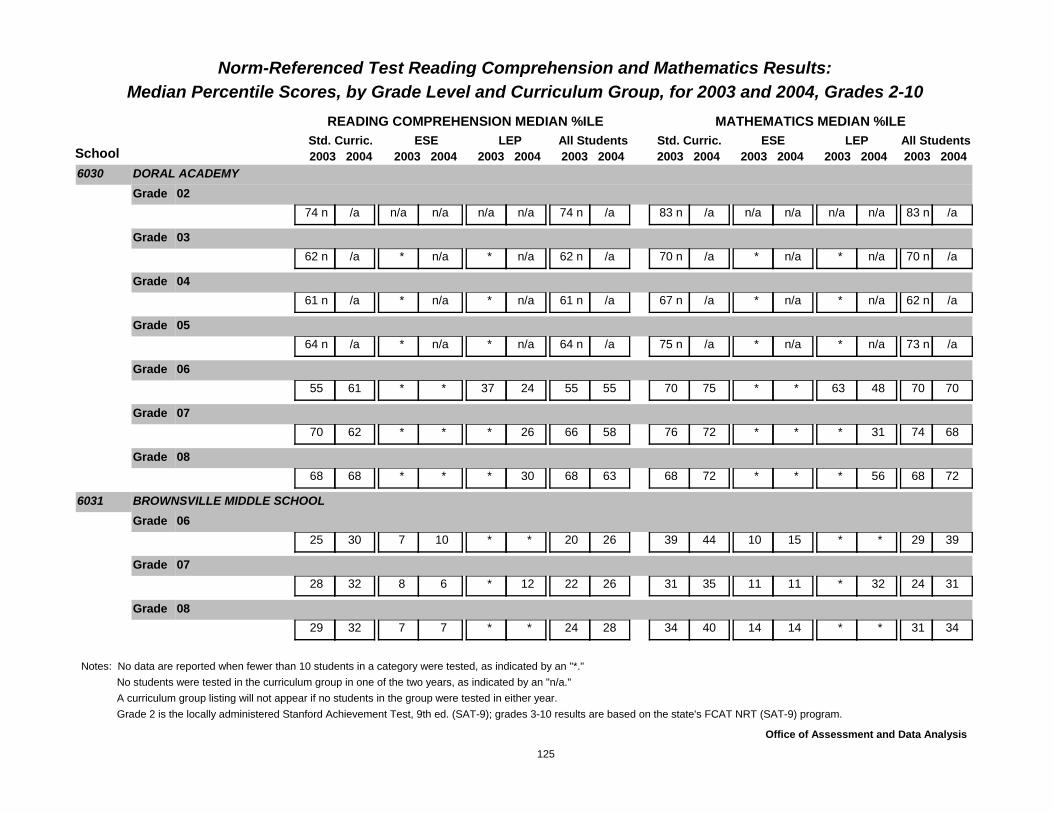
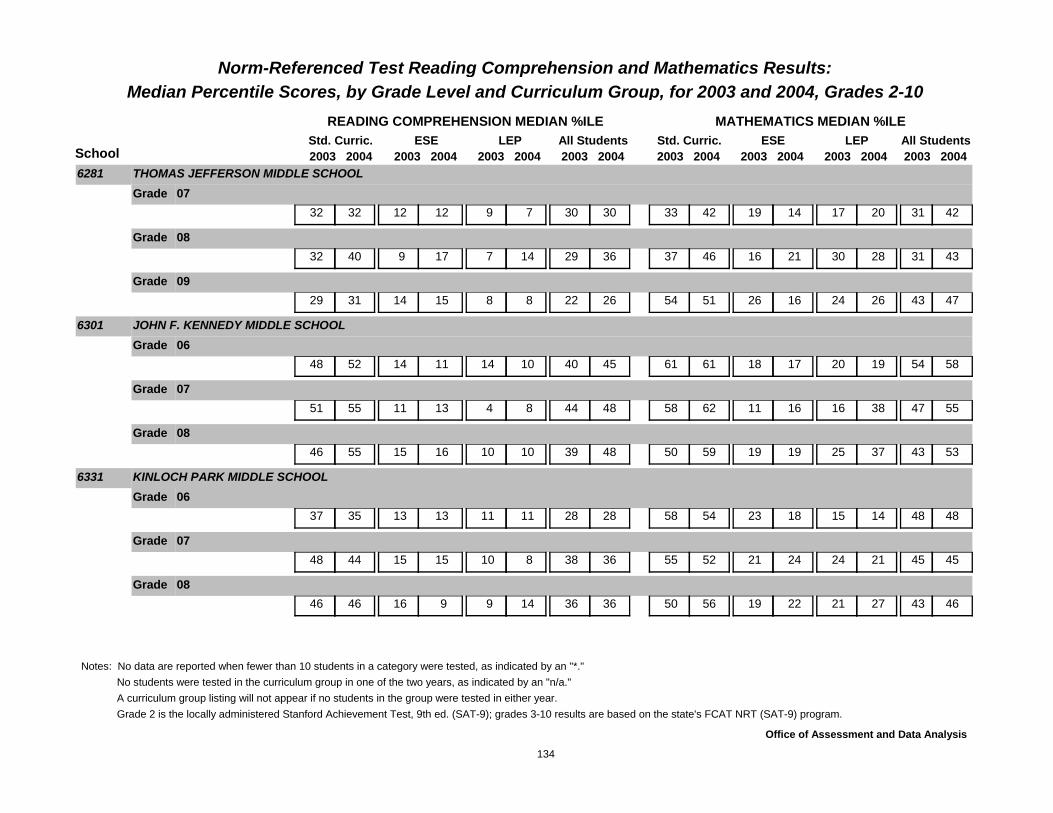
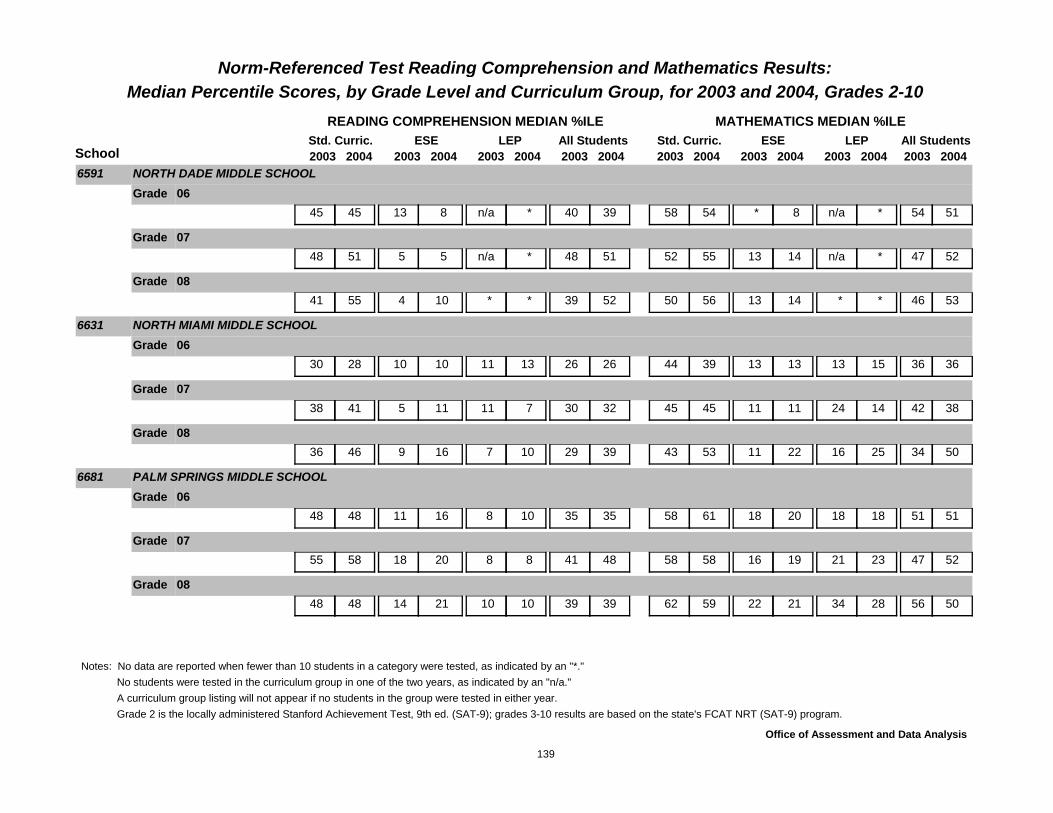
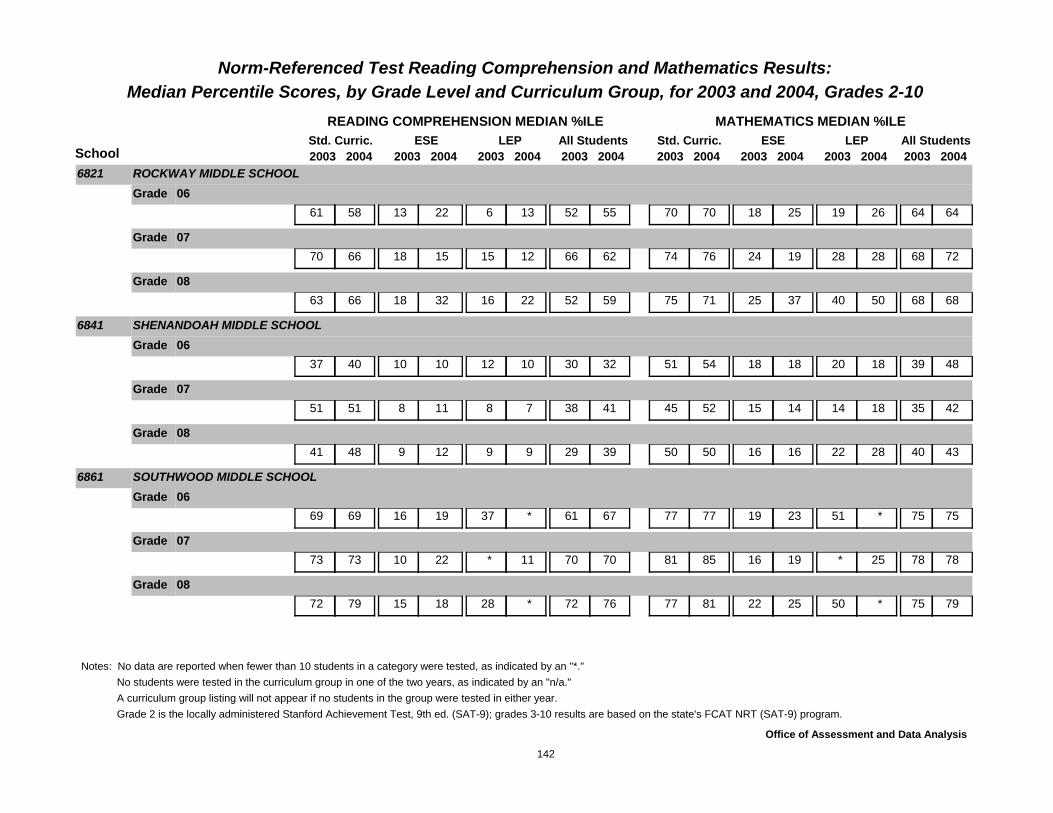
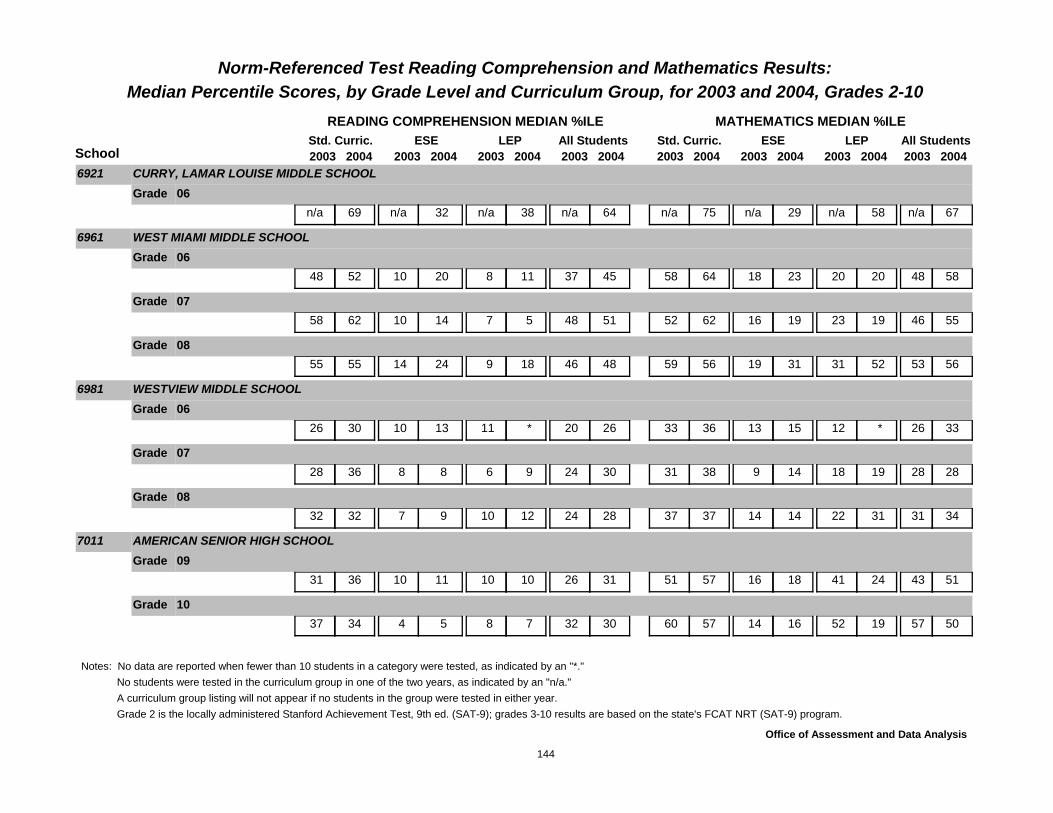
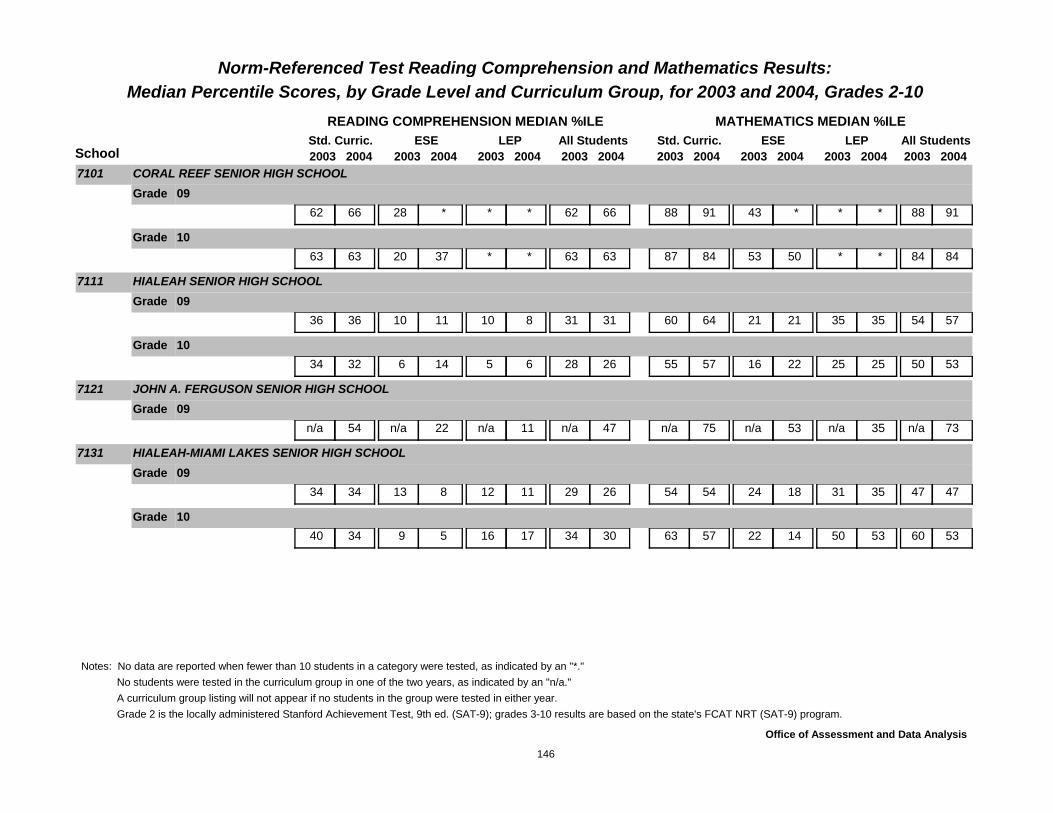
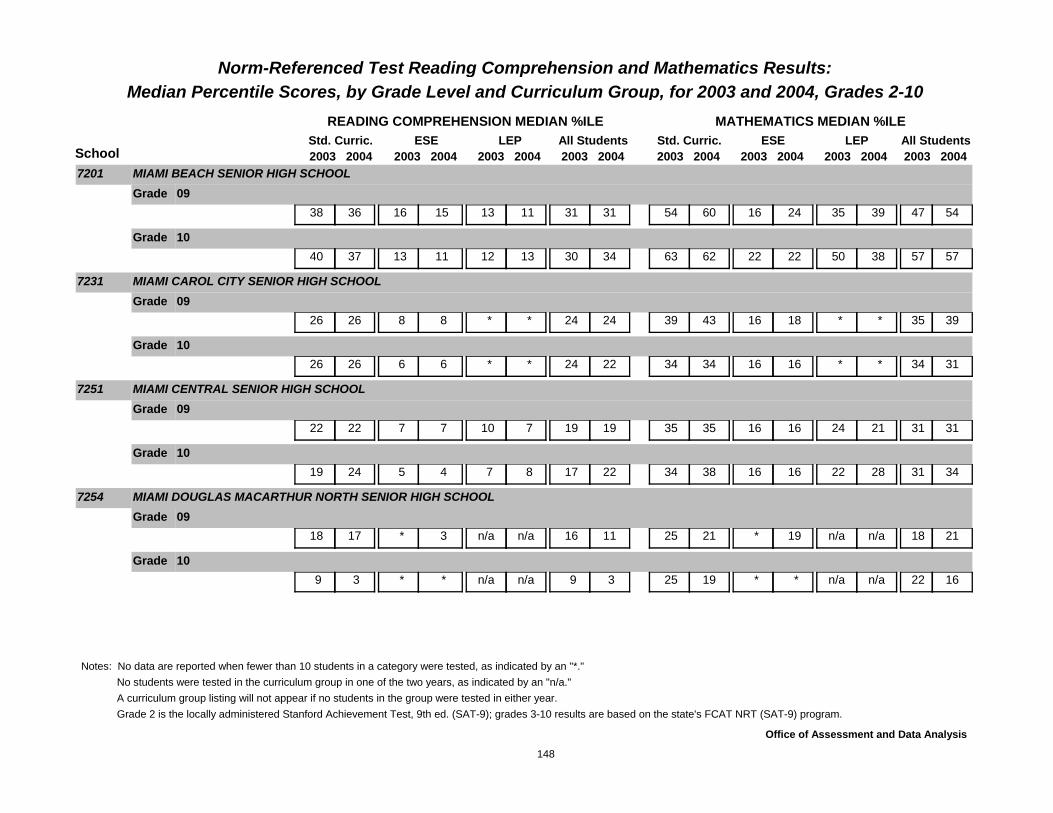
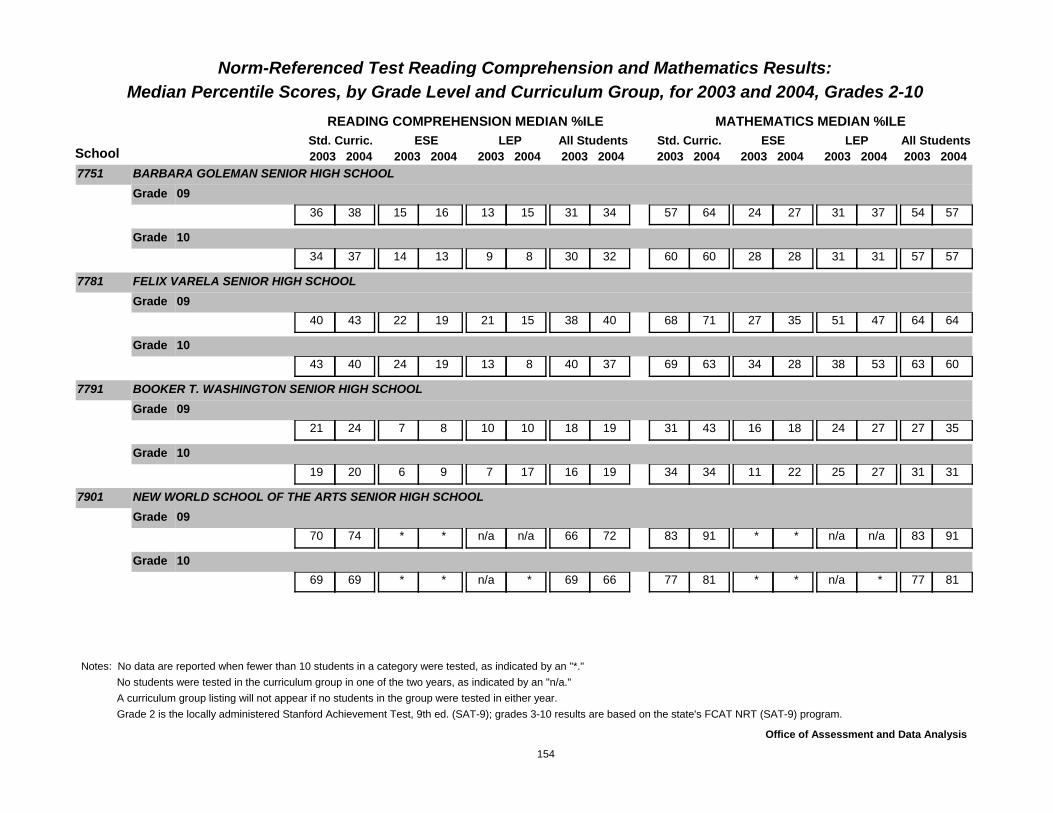
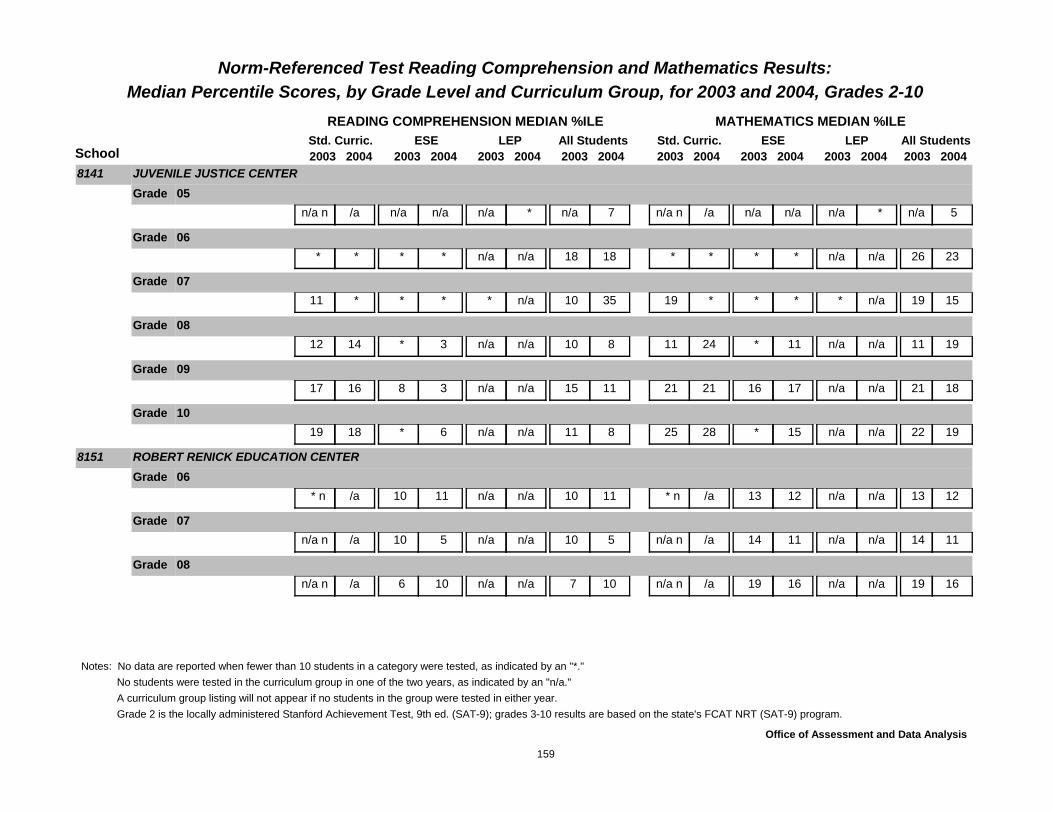
Median Percentile Scores, by Grade Level and Curriculum Group, for 2003 and 2004, Grades 2-10
2003 2004 2003 2004 2003 2004 2003 2004 2003 2004 2003 2004 2003 20040040 LIBERTY CITY CHARTER SCHOOL
Notes: No data are reported when fewer than 10 students in a category were tested, as indicated by an "*."No students were tested in the curriculum group in one of the two years, as indicated by an "n/a."
1
A curriculum group listing will not appear if no students in the group were tested in either year.
Office of Assessment and Data Analysis
Grade 2 is the locally administered Stanford Achievement Test, 9th ed. (SAT-9); grades 3-10 results are based on the state's FCAT NRT (SAT-9) program.
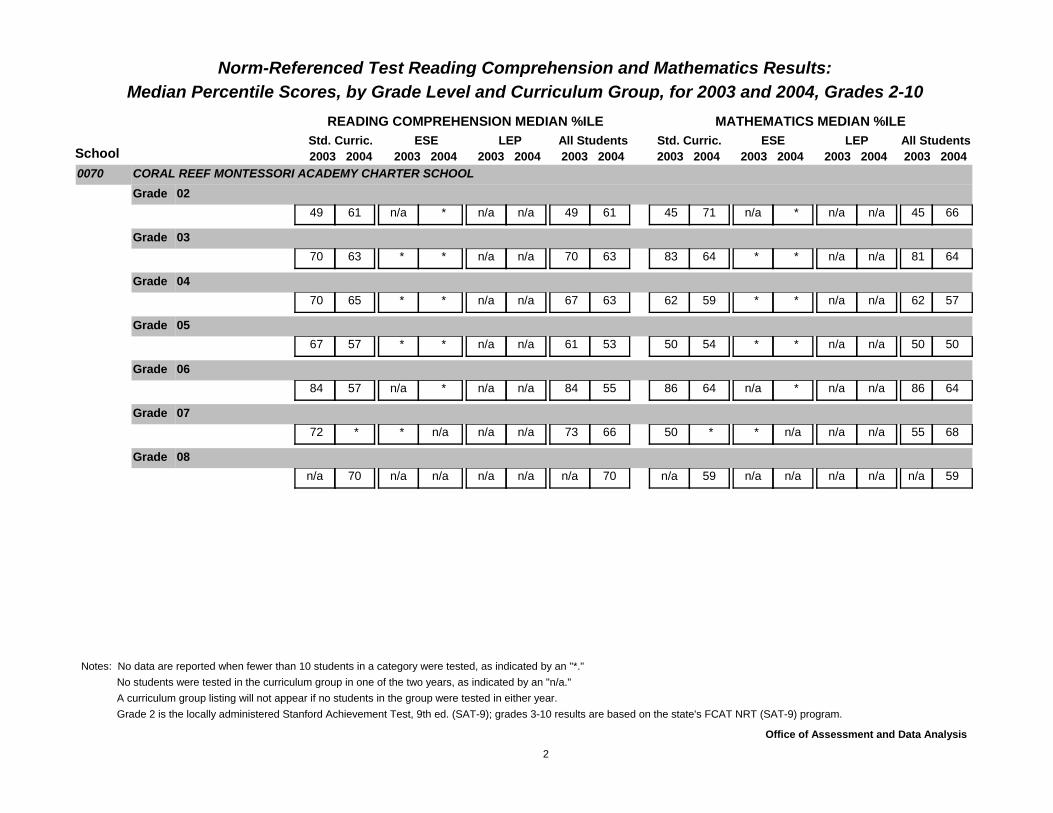
Norm-Referenced Test Reading Comprehension and Mathematics Results:
READING COMPREHENSION MEDIAN %ILE Std. Curric. ESE
MATHEMATICS MEDIAN %ILE
School LEP All Students
2003 2004Std. Curric. ESE LEP All Students
Median Percentile Scores, by Grade Level and Curriculum Group, for 2003 and 2004, Grades 2-10
2003 2004 2003 2004 2003 2004 2003 2004 2003 2004 2003 2004 2003 20040070 CORAL REEF MONTESSORI ACADEMY CHARTER SCHOOL
Notes: No data are reported when fewer than 10 students in a category were tested, as indicated by an "*."No students were tested in the curriculum group in one of the two years, as indicated by an "n/a."
2
A curriculum group listing will not appear if no students in the group were tested in either year.
Office of Assessment and Data Analysis
Grade 2 is the locally administered Stanford Achievement Test, 9th ed. (SAT-9); grades 3-10 results are based on the state's FCAT NRT (SAT-9) program.
Norm-Referenced Test Reading Comprehension and Mathematics Results:
READING COMPREHENSION MEDIAN %ILE Std. Curric. ESE
MATHEMATICS MEDIAN %ILE
School LEP All Students
2003 2004Std. Curric. ESE LEP All Students
Median Percentile Scores, by Grade Level and Curriculum Group, for 2003 and 2004, Grades 2-10
2003 2004 2003 2004 2003 2004 2003 2004 2003 2004 2003 2004 2003 20040071 EUGENIA B. THOMAS ELEMENTARY SCHOOL
Notes: No data are reported when fewer than 10 students in a category were tested, as indicated by an "*."No students were tested in the curriculum group in one of the two years, as indicated by an "n/a."
3
A curriculum group listing will not appear if no students in the group were tested in either year.
Office of Assessment and Data Analysis
Grade 2 is the locally administered Stanford Achievement Test, 9th ed. (SAT-9); grades 3-10 results are based on the state's FCAT NRT (SAT-9) program.
Norm-Referenced Test Reading Comprehension and Mathematics Results:
READING COMPREHENSION MEDIAN %ILE Std. Curric. ESE
MATHEMATICS MEDIAN %ILE
School LEP All Students
2003 2004Std. Curric. ESE LEP All Students
Median Percentile Scores, by Grade Level and Curriculum Group, for 2003 and 2004, Grades 2-10
2003 2004 2003 2004 2003 2004 2003 2004 2003 2004 2003 2004 2003 20040091 BOB GRAHAM EDUCATION CENTER
Notes: No data are reported when fewer than 10 students in a category were tested, as indicated by an "*."No students were tested in the curriculum group in one of the two years, as indicated by an "n/a."
4
A curriculum group listing will not appear if no students in the group were tested in either year.
Office of Assessment and Data Analysis
Grade 2 is the locally administered Stanford Achievement Test, 9th ed. (SAT-9); grades 3-10 results are based on the state's FCAT NRT (SAT-9) program.
Norm-Referenced Test Reading Comprehension and Mathematics Results:
READING COMPREHENSION MEDIAN %ILE Std. Curric. ESE
MATHEMATICS MEDIAN %ILE
School LEP All Students
2003 2004Std. Curric. ESE LEP All Students
Median Percentile Scores, by Grade Level and Curriculum Group, for 2003 and 2004, Grades 2-10
2003 2004 2003 2004 2003 2004 2003 2004 2003 2004 2003 2004 2003 20040100 MATER CENTER SCHOOL, INC.
Grade 06 * n/a * n/a 52 n /a 52 n /a * n/a * n/a 61 n /a 61 n /a
Grade 07 * n/a * n/a 58 n /a 62 n /a * n/a * n/a 55 n /a 58 n /a
Grade 08 * n/a * n/a 52 n /a 52 n /a * n/a * n/a 67 n /a 68 n /a
Notes: No data are reported when fewer than 10 students in a category were tested, as indicated by an "*."No students were tested in the curriculum group in one of the two years, as indicated by an "n/a."
5
A curriculum group listing will not appear if no students in the group were tested in either year.
Office of Assessment and Data Analysis
Grade 2 is the locally administered Stanford Achievement Test, 9th ed. (SAT-9); grades 3-10 results are based on the state's FCAT NRT (SAT-9) program.
Norm-Referenced Test Reading Comprehension and Mathematics Results:
READING COMPREHENSION MEDIAN %ILE Std. Curric. ESE
MATHEMATICS MEDIAN %ILE
School LEP All Students
2003 2004Std. Curric. ESE LEP All Students
Median Percentile Scores, by Grade Level and Curriculum Group, for 2003 and 2004, Grades 2-10
2003 2004 2003 2004 2003 2004 2003 2004 2003 2004 2003 2004 2003 20040101 ARCOLA LAKE ELEMENTARY SCHOOL
Notes: No data are reported when fewer than 10 students in a category were tested, as indicated by an "*."No students were tested in the curriculum group in one of the two years, as indicated by an "n/a."
6
A curriculum group listing will not appear if no students in the group were tested in either year.
Office of Assessment and Data Analysis
Grade 2 is the locally administered Stanford Achievement Test, 9th ed. (SAT-9); grades 3-10 results are based on the state's FCAT NRT (SAT-9) program.
Norm-Referenced Test Reading Comprehension and Mathematics Results:
READING COMPREHENSION MEDIAN %ILE Std. Curric. ESE
MATHEMATICS MEDIAN %ILE
School LEP All Students
2003 2004Std. Curric. ESE LEP All Students
Median Percentile Scores, by Grade Level and Curriculum Group, for 2003 and 2004, Grades 2-10
Notes: No data are reported when fewer than 10 students in a category were tested, as indicated by an "*."No students were tested in the curriculum group in one of the two years, as indicated by an "n/a."
7
A curriculum group listing will not appear if no students in the group were tested in either year.
Office of Assessment and Data Analysis
Grade 2 is the locally administered Stanford Achievement Test, 9th ed. (SAT-9); grades 3-10 results are based on the state's FCAT NRT (SAT-9) program.
Norm-Referenced Test Reading Comprehension and Mathematics Results:
READING COMPREHENSION MEDIAN %ILE Std. Curric. ESE
MATHEMATICS MEDIAN %ILE
School LEP All Students
2003 2004Std. Curric. ESE LEP All Students
Median Percentile Scores, by Grade Level and Curriculum Group, for 2003 and 2004, Grades 2-10
Notes: No data are reported when fewer than 10 students in a category were tested, as indicated by an "*."No students were tested in the curriculum group in one of the two years, as indicated by an "n/a."
8
A curriculum group listing will not appear if no students in the group were tested in either year.
Office of Assessment and Data Analysis
Grade 2 is the locally administered Stanford Achievement Test, 9th ed. (SAT-9); grades 3-10 results are based on the state's FCAT NRT (SAT-9) program.
Norm-Referenced Test Reading Comprehension and Mathematics Results:
READING COMPREHENSION MEDIAN %ILE Std. Curric. ESE
MATHEMATICS MEDIAN %ILE
School LEP All Students
2003 2004Std. Curric. ESE LEP All Students
Median Percentile Scores, by Grade Level and Curriculum Group, for 2003 and 2004, Grades 2-10
2003 2004 2003 2004 2003 2004 2003 2004 2003 2004 2003 2004 2003 20040200 SPIRAL TECH ELEMENTARY CHARTER SCHOOL
Notes: No data are reported when fewer than 10 students in a category were tested, as indicated by an "*."No students were tested in the curriculum group in one of the two years, as indicated by an "n/a."
9
A curriculum group listing will not appear if no students in the group were tested in either year.
Office of Assessment and Data Analysis
Grade 2 is the locally administered Stanford Achievement Test, 9th ed. (SAT-9); grades 3-10 results are based on the state's FCAT NRT (SAT-9) program.
Norm-Referenced Test Reading Comprehension and Mathematics Results:
READING COMPREHENSION MEDIAN %ILE Std. Curric. ESE
MATHEMATICS MEDIAN %ILE
School LEP All Students
2003 2004Std. Curric. ESE LEP All Students
Median Percentile Scores, by Grade Level and Curriculum Group, for 2003 and 2004, Grades 2-10
2003 2004 2003 2004 2003 2004 2003 2004 2003 2004 2003 2004 2003 20040241 RUTH K. BROAD/BAY HARBOR ELEMENTARY SCHOOL
Notes: No data are reported when fewer than 10 students in a category were tested, as indicated by an "*."No students were tested in the curriculum group in one of the two years, as indicated by an "n/a."
10
A curriculum group listing will not appear if no students in the group were tested in either year.
Office of Assessment and Data Analysis
Grade 2 is the locally administered Stanford Achievement Test, 9th ed. (SAT-9); grades 3-10 results are based on the state's FCAT NRT (SAT-9) program.
Norm-Referenced Test Reading Comprehension and Mathematics Results:
READING COMPREHENSION MEDIAN %ILE Std. Curric. ESE
MATHEMATICS MEDIAN %ILE
School LEP All Students
2003 2004Std. Curric. ESE LEP All Students
Median Percentile Scores, by Grade Level and Curriculum Group, for 2003 and 2004, Grades 2-10
Notes: No data are reported when fewer than 10 students in a category were tested, as indicated by an "*."No students were tested in the curriculum group in one of the two years, as indicated by an "n/a."
11
A curriculum group listing will not appear if no students in the group were tested in either year.
Office of Assessment and Data Analysis
Grade 2 is the locally administered Stanford Achievement Test, 9th ed. (SAT-9); grades 3-10 results are based on the state's FCAT NRT (SAT-9) program.
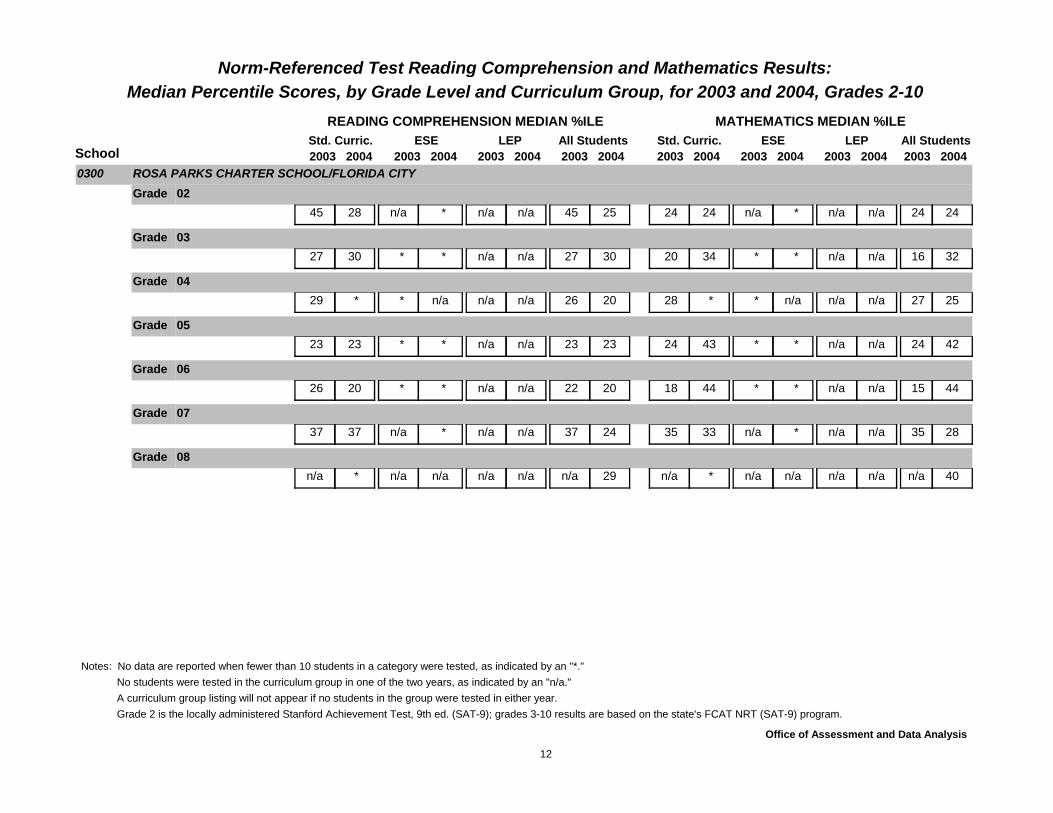
Norm-Referenced Test Reading Comprehension and Mathematics Results:
READING COMPREHENSION MEDIAN %ILE Std. Curric. ESE
MATHEMATICS MEDIAN %ILE
School LEP All Students
2003 2004Std. Curric. ESE LEP All Students
Median Percentile Scores, by Grade Level and Curriculum Group, for 2003 and 2004, Grades 2-10
2003 2004 2003 2004 2003 2004 2003 2004 2003 2004 2003 2004 2003 20040300 ROSA PARKS CHARTER SCHOOL/FLORIDA CITY
Notes: No data are reported when fewer than 10 students in a category were tested, as indicated by an "*."No students were tested in the curriculum group in one of the two years, as indicated by an "n/a."
12
A curriculum group listing will not appear if no students in the group were tested in either year.
Office of Assessment and Data Analysis
Grade 2 is the locally administered Stanford Achievement Test, 9th ed. (SAT-9); grades 3-10 results are based on the state's FCAT NRT (SAT-9) program.
Norm-Referenced Test Reading Comprehension and Mathematics Results:
READING COMPREHENSION MEDIAN %ILE Std. Curric. ESE
MATHEMATICS MEDIAN %ILE
School LEP All Students
2003 2004Std. Curric. ESE LEP All Students
Median Percentile Scores, by Grade Level and Curriculum Group, for 2003 and 2004, Grades 2-10
Notes: No data are reported when fewer than 10 students in a category were tested, as indicated by an "*."No students were tested in the curriculum group in one of the two years, as indicated by an "n/a."
13
A curriculum group listing will not appear if no students in the group were tested in either year.
Office of Assessment and Data Analysis
Grade 2 is the locally administered Stanford Achievement Test, 9th ed. (SAT-9); grades 3-10 results are based on the state's FCAT NRT (SAT-9) program.
Norm-Referenced Test Reading Comprehension and Mathematics Results:
READING COMPREHENSION MEDIAN %ILE Std. Curric. ESE
MATHEMATICS MEDIAN %ILE
School LEP All Students
2003 2004Std. Curric. ESE LEP All Students
Median Percentile Scores, by Grade Level and Curriculum Group, for 2003 and 2004, Grades 2-10
2003 2004 2003 2004 2003 2004 2003 2004 2003 2004 2003 2004 2003 20040400 RYDER ELEMENTARY CHARTER SCHOOL
Notes: No data are reported when fewer than 10 students in a category were tested, as indicated by an "*."No students were tested in the curriculum group in one of the two years, as indicated by an "n/a."
14
A curriculum group listing will not appear if no students in the group were tested in either year.
Office of Assessment and Data Analysis
Grade 2 is the locally administered Stanford Achievement Test, 9th ed. (SAT-9); grades 3-10 results are based on the state's FCAT NRT (SAT-9) program.
Norm-Referenced Test Reading Comprehension and Mathematics Results:
READING COMPREHENSION MEDIAN %ILE Std. Curric. ESE
MATHEMATICS MEDIAN %ILE
School LEP All Students
2003 2004Std. Curric. ESE LEP All Students
Median Percentile Scores, by Grade Level and Curriculum Group, for 2003 and 2004, Grades 2-10
2003 2004 2003 2004 2003 2004 2003 2004 2003 2004 2003 2004 2003 20040441 BLUE LAKES ELEMENTARY SCHOOL
Notes: No data are reported when fewer than 10 students in a category were tested, as indicated by an "*."No students were tested in the curriculum group in one of the two years, as indicated by an "n/a."
15
A curriculum group listing will not appear if no students in the group were tested in either year.
Office of Assessment and Data Analysis
Grade 2 is the locally administered Stanford Achievement Test, 9th ed. (SAT-9); grades 3-10 results are based on the state's FCAT NRT (SAT-9) program.
Norm-Referenced Test Reading Comprehension and Mathematics Results:
READING COMPREHENSION MEDIAN %ILE Std. Curric. ESE
MATHEMATICS MEDIAN %ILE
School LEP All Students
2003 2004Std. Curric. ESE LEP All Students
Median Percentile Scores, by Grade Level and Curriculum Group, for 2003 and 2004, Grades 2-10
Notes: No data are reported when fewer than 10 students in a category were tested, as indicated by an "*."No students were tested in the curriculum group in one of the two years, as indicated by an "n/a."
16
A curriculum group listing will not appear if no students in the group were tested in either year.
Office of Assessment and Data Analysis
Grade 2 is the locally administered Stanford Achievement Test, 9th ed. (SAT-9); grades 3-10 results are based on the state's FCAT NRT (SAT-9) program.
Norm-Referenced Test Reading Comprehension and Mathematics Results:
READING COMPREHENSION MEDIAN %ILE Std. Curric. ESE
MATHEMATICS MEDIAN %ILE
School LEP All Students
2003 2004Std. Curric. ESE LEP All Students
Median Percentile Scores, by Grade Level and Curriculum Group, for 2003 and 2004, Grades 2-10
2003 2004 2003 2004 2003 2004 2003 2004 2003 2004 2003 2004 2003 20040500 ROSA PARKS COMMUNITY SCHOOL/OVERTOWN
Grade 02n/a n/a n/a n/a 63 n /a * n /a n/a n/a n/a n/a 40 n /a * n /a
Notes: No data are reported when fewer than 10 students in a category were tested, as indicated by an "*."No students were tested in the curriculum group in one of the two years, as indicated by an "n/a."
17
A curriculum group listing will not appear if no students in the group were tested in either year.
Office of Assessment and Data Analysis
Grade 2 is the locally administered Stanford Achievement Test, 9th ed. (SAT-9); grades 3-10 results are based on the state's FCAT NRT (SAT-9) program.
Norm-Referenced Test Reading Comprehension and Mathematics Results:
READING COMPREHENSION MEDIAN %ILE Std. Curric. ESE
MATHEMATICS MEDIAN %ILE
School LEP All Students
2003 2004Std. Curric. ESE LEP All Students
Median Percentile Scores, by Grade Level and Curriculum Group, for 2003 and 2004, Grades 2-10
Notes: No data are reported when fewer than 10 students in a category were tested, as indicated by an "*."No students were tested in the curriculum group in one of the two years, as indicated by an "n/a."
18
A curriculum group listing will not appear if no students in the group were tested in either year.
Office of Assessment and Data Analysis
Grade 2 is the locally administered Stanford Achievement Test, 9th ed. (SAT-9); grades 3-10 results are based on the state's FCAT NRT (SAT-9) program.
Norm-Referenced Test Reading Comprehension and Mathematics Results:
READING COMPREHENSION MEDIAN %ILE Std. Curric. ESE
MATHEMATICS MEDIAN %ILE
School LEP All Students
2003 2004Std. Curric. ESE LEP All Students
Median Percentile Scores, by Grade Level and Curriculum Group, for 2003 and 2004, Grades 2-10
Notes: No data are reported when fewer than 10 students in a category were tested, as indicated by an "*."No students were tested in the curriculum group in one of the two years, as indicated by an "n/a."
19
A curriculum group listing will not appear if no students in the group were tested in either year.
Office of Assessment and Data Analysis
Grade 2 is the locally administered Stanford Achievement Test, 9th ed. (SAT-9); grades 3-10 results are based on the state's FCAT NRT (SAT-9) program.
Norm-Referenced Test Reading Comprehension and Mathematics Results:
READING COMPREHENSION MEDIAN %ILE Std. Curric. ESE
MATHEMATICS MEDIAN %ILE
School LEP All Students
2003 2004Std. Curric. ESE LEP All Students
Median Percentile Scores, by Grade Level and Curriculum Group, for 2003 and 2004, Grades 2-10
Notes: No data are reported when fewer than 10 students in a category were tested, as indicated by an "*."No students were tested in the curriculum group in one of the two years, as indicated by an "n/a."
20
A curriculum group listing will not appear if no students in the group were tested in either year.
Office of Assessment and Data Analysis
Grade 2 is the locally administered Stanford Achievement Test, 9th ed. (SAT-9); grades 3-10 results are based on the state's FCAT NRT (SAT-9) program.
Norm-Referenced Test Reading Comprehension and Mathematics Results:
READING COMPREHENSION MEDIAN %ILE Std. Curric. ESE
MATHEMATICS MEDIAN %ILE
School LEP All Students
2003 2004Std. Curric. ESE LEP All Students
Median Percentile Scores, by Grade Level and Curriculum Group, for 2003 and 2004, Grades 2-10
Notes: No data are reported when fewer than 10 students in a category were tested, as indicated by an "*."No students were tested in the curriculum group in one of the two years, as indicated by an "n/a."
21
A curriculum group listing will not appear if no students in the group were tested in either year.
Office of Assessment and Data Analysis
Grade 2 is the locally administered Stanford Achievement Test, 9th ed. (SAT-9); grades 3-10 results are based on the state's FCAT NRT (SAT-9) program.
Norm-Referenced Test Reading Comprehension and Mathematics Results:
READING COMPREHENSION MEDIAN %ILE Std. Curric. ESE
MATHEMATICS MEDIAN %ILE
School LEP All Students
2003 2004Std. Curric. ESE LEP All Students
Median Percentile Scores, by Grade Level and Curriculum Group, for 2003 and 2004, Grades 2-10
2003 2004 2003 2004 2003 2004 2003 2004 2003 2004 2003 2004 2003 20040721 GEORGE WASHINGTON CARVER ELEMENTARY SCHOOL
Notes: No data are reported when fewer than 10 students in a category were tested, as indicated by an "*."No students were tested in the curriculum group in one of the two years, as indicated by an "n/a."
22
A curriculum group listing will not appear if no students in the group were tested in either year.
Office of Assessment and Data Analysis
Grade 2 is the locally administered Stanford Achievement Test, 9th ed. (SAT-9); grades 3-10 results are based on the state's FCAT NRT (SAT-9) program.
Norm-Referenced Test Reading Comprehension and Mathematics Results:
READING COMPREHENSION MEDIAN %ILE Std. Curric. ESE
MATHEMATICS MEDIAN %ILE
School LEP All Students
2003 2004Std. Curric. ESE LEP All Students
Median Percentile Scores, by Grade Level and Curriculum Group, for 2003 and 2004, Grades 2-10
2003 2004 2003 2004 2003 2004 2003 2004 2003 2004 2003 2004 2003 20040771 DR. WILLIAM A. CHAPMAN ELEMENTARY SCHOOL
Notes: No data are reported when fewer than 10 students in a category were tested, as indicated by an "*."No students were tested in the curriculum group in one of the two years, as indicated by an "n/a."
23
A curriculum group listing will not appear if no students in the group were tested in either year.
Office of Assessment and Data Analysis
Grade 2 is the locally administered Stanford Achievement Test, 9th ed. (SAT-9); grades 3-10 results are based on the state's FCAT NRT (SAT-9) program.
Norm-Referenced Test Reading Comprehension and Mathematics Results:
READING COMPREHENSION MEDIAN %ILE Std. Curric. ESE
MATHEMATICS MEDIAN %ILE
School LEP All Students
2003 2004Std. Curric. ESE LEP All Students
Median Percentile Scores, by Grade Level and Curriculum Group, for 2003 and 2004, Grades 2-10
2003 2004 2003 2004 2003 2004 2003 2004 2003 2004 2003 2004 2003 20040831 CLAUDE PEPPER ELEMENTARY SCHOOL
Notes: No data are reported when fewer than 10 students in a category were tested, as indicated by an "*."No students were tested in the curriculum group in one of the two years, as indicated by an "n/a."
24
A curriculum group listing will not appear if no students in the group were tested in either year.
Office of Assessment and Data Analysis
Grade 2 is the locally administered Stanford Achievement Test, 9th ed. (SAT-9); grades 3-10 results are based on the state's FCAT NRT (SAT-9) program.
Norm-Referenced Test Reading Comprehension and Mathematics Results:
READING COMPREHENSION MEDIAN %ILE Std. Curric. ESE
MATHEMATICS MEDIAN %ILE
School LEP All Students
2003 2004Std. Curric. ESE LEP All Students
Median Percentile Scores, by Grade Level and Curriculum Group, for 2003 and 2004, Grades 2-10
Notes: No data are reported when fewer than 10 students in a category were tested, as indicated by an "*."No students were tested in the curriculum group in one of the two years, as indicated by an "n/a."
25
A curriculum group listing will not appear if no students in the group were tested in either year.
Office of Assessment and Data Analysis
Grade 2 is the locally administered Stanford Achievement Test, 9th ed. (SAT-9); grades 3-10 results are based on the state's FCAT NRT (SAT-9) program.
Norm-Referenced Test Reading Comprehension and Mathematics Results:
READING COMPREHENSION MEDIAN %ILE Std. Curric. ESE
MATHEMATICS MEDIAN %ILE
School LEP All Students
2003 2004Std. Curric. ESE LEP All Students
Median Percentile Scores, by Grade Level and Curriculum Group, for 2003 and 2004, Grades 2-10
2003 2004 2003 2004 2003 2004 2003 2004 2003 2004 2003 2004 2003 20040950 AVENTURA CHARTER ELEMENTARY SCHOOL
Notes: No data are reported when fewer than 10 students in a category were tested, as indicated by an "*."No students were tested in the curriculum group in one of the two years, as indicated by an "n/a."
26
A curriculum group listing will not appear if no students in the group were tested in either year.
Office of Assessment and Data Analysis
Grade 2 is the locally administered Stanford Achievement Test, 9th ed. (SAT-9); grades 3-10 results are based on the state's FCAT NRT (SAT-9) program.
Norm-Referenced Test Reading Comprehension and Mathematics Results:
READING COMPREHENSION MEDIAN %ILE Std. Curric. ESE
MATHEMATICS MEDIAN %ILE
School LEP All Students
2003 2004Std. Curric. ESE LEP All Students
Median Percentile Scores, by Grade Level and Curriculum Group, for 2003 and 2004, Grades 2-10
2003 2004 2003 2004 2003 2004 2003 2004 2003 2004 2003 2004 2003 20041001 CORAL PARK ELEMENTARY SCHOOL
Notes: No data are reported when fewer than 10 students in a category were tested, as indicated by an "*."No students were tested in the curriculum group in one of the two years, as indicated by an "n/a."
27
A curriculum group listing will not appear if no students in the group were tested in either year.
Office of Assessment and Data Analysis
Grade 2 is the locally administered Stanford Achievement Test, 9th ed. (SAT-9); grades 3-10 results are based on the state's FCAT NRT (SAT-9) program.
Norm-Referenced Test Reading Comprehension and Mathematics Results:
READING COMPREHENSION MEDIAN %ILE Std. Curric. ESE
MATHEMATICS MEDIAN %ILE
School LEP All Students
2003 2004Std. Curric. ESE LEP All Students
Median Percentile Scores, by Grade Level and Curriculum Group, for 2003 and 2004, Grades 2-10
2003 2004 2003 2004 2003 2004 2003 2004 2003 2004 2003 2004 2003 20041020 YOUTH CO-OP CHARTER SCHOOL
Notes: No data are reported when fewer than 10 students in a category were tested, as indicated by an "*."No students were tested in the curriculum group in one of the two years, as indicated by an "n/a."
28
A curriculum group listing will not appear if no students in the group were tested in either year.
Office of Assessment and Data Analysis
Grade 2 is the locally administered Stanford Achievement Test, 9th ed. (SAT-9); grades 3-10 results are based on the state's FCAT NRT (SAT-9) program.
Norm-Referenced Test Reading Comprehension and Mathematics Results:
READING COMPREHENSION MEDIAN %ILE Std. Curric. ESE
MATHEMATICS MEDIAN %ILE
School LEP All Students
2003 2004Std. Curric. ESE LEP All Students
Median Percentile Scores, by Grade Level and Curriculum Group, for 2003 and 2004, Grades 2-10
Notes: No data are reported when fewer than 10 students in a category were tested, as indicated by an "*."No students were tested in the curriculum group in one of the two years, as indicated by an "n/a."
29
A curriculum group listing will not appear if no students in the group were tested in either year.
Office of Assessment and Data Analysis
Grade 2 is the locally administered Stanford Achievement Test, 9th ed. (SAT-9); grades 3-10 results are based on the state's FCAT NRT (SAT-9) program.
Norm-Referenced Test Reading Comprehension and Mathematics Results:
READING COMPREHENSION MEDIAN %ILE Std. Curric. ESE
MATHEMATICS MEDIAN %ILE
School LEP All Students
2003 2004Std. Curric. ESE LEP All Students
Median Percentile Scores, by Grade Level and Curriculum Group, for 2003 and 2004, Grades 2-10
2003 2004 2003 2004 2003 2004 2003 2004 2003 2004 2003 2004 2003 20041121 CORAL WAY ELEMENTARY SCHOOL
Notes: No data are reported when fewer than 10 students in a category were tested, as indicated by an "*."No students were tested in the curriculum group in one of the two years, as indicated by an "n/a."
30
A curriculum group listing will not appear if no students in the group were tested in either year.
Office of Assessment and Data Analysis
Grade 2 is the locally administered Stanford Achievement Test, 9th ed. (SAT-9); grades 3-10 results are based on the state's FCAT NRT (SAT-9) program.
Norm-Referenced Test Reading Comprehension and Mathematics Results:
READING COMPREHENSION MEDIAN %ILE Std. Curric. ESE
MATHEMATICS MEDIAN %ILE
School LEP All Students
2003 2004Std. Curric. ESE LEP All Students
Median Percentile Scores, by Grade Level and Curriculum Group, for 2003 and 2004, Grades 2-10
Notes: No data are reported when fewer than 10 students in a category were tested, as indicated by an "*."No students were tested in the curriculum group in one of the two years, as indicated by an "n/a."
31
A curriculum group listing will not appear if no students in the group were tested in either year.
Office of Assessment and Data Analysis
Grade 2 is the locally administered Stanford Achievement Test, 9th ed. (SAT-9); grades 3-10 results are based on the state's FCAT NRT (SAT-9) program.
Norm-Referenced Test Reading Comprehension and Mathematics Results:
READING COMPREHENSION MEDIAN %ILE Std. Curric. ESE
MATHEMATICS MEDIAN %ILE
School LEP All Students
2003 2004Std. Curric. ESE LEP All Students
Median Percentile Scores, by Grade Level and Curriculum Group, for 2003 and 2004, Grades 2-10
Notes: No data are reported when fewer than 10 students in a category were tested, as indicated by an "*."No students were tested in the curriculum group in one of the two years, as indicated by an "n/a."
32
A curriculum group listing will not appear if no students in the group were tested in either year.
Office of Assessment and Data Analysis
Grade 2 is the locally administered Stanford Achievement Test, 9th ed. (SAT-9); grades 3-10 results are based on the state's FCAT NRT (SAT-9) program.
Norm-Referenced Test Reading Comprehension and Mathematics Results:
READING COMPREHENSION MEDIAN %ILE Std. Curric. ESE
MATHEMATICS MEDIAN %ILE
School LEP All Students
2003 2004Std. Curric. ESE LEP All Students
Median Percentile Scores, by Grade Level and Curriculum Group, for 2003 and 2004, Grades 2-10
2003 2004 2003 2004 2003 2004 2003 2004 2003 2004 2003 2004 2003 20041371 MARJORY STONEMAN DOUGLAS ELEMENTARY SCHOOL
Notes: No data are reported when fewer than 10 students in a category were tested, as indicated by an "*."No students were tested in the curriculum group in one of the two years, as indicated by an "n/a."
33
A curriculum group listing will not appear if no students in the group were tested in either year.
Office of Assessment and Data Analysis
Grade 2 is the locally administered Stanford Achievement Test, 9th ed. (SAT-9); grades 3-10 results are based on the state's FCAT NRT (SAT-9) program.
Norm-Referenced Test Reading Comprehension and Mathematics Results:
READING COMPREHENSION MEDIAN %ILE Std. Curric. ESE
MATHEMATICS MEDIAN %ILE
School LEP All Students
2003 2004Std. Curric. ESE LEP All Students
Median Percentile Scores, by Grade Level and Curriculum Group, for 2003 and 2004, Grades 2-10
2003 2004 2003 2004 2003 2004 2003 2004 2003 2004 2003 2004 2003 20041441 PAUL LAWRENCE DUNBAR ELEMENTARY SCHOOL
Notes: No data are reported when fewer than 10 students in a category were tested, as indicated by an "*."No students were tested in the curriculum group in one of the two years, as indicated by an "n/a."
34
A curriculum group listing will not appear if no students in the group were tested in either year.
Office of Assessment and Data Analysis
Grade 2 is the locally administered Stanford Achievement Test, 9th ed. (SAT-9); grades 3-10 results are based on the state's FCAT NRT (SAT-9) program.
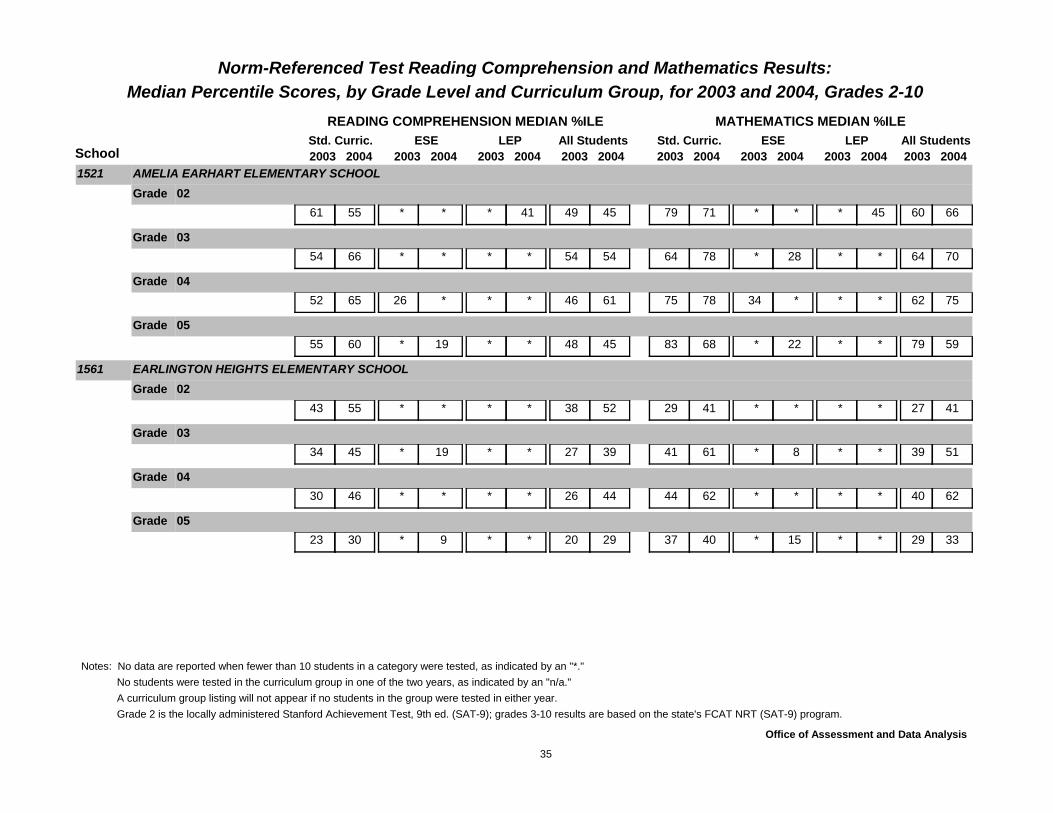
Norm-Referenced Test Reading Comprehension and Mathematics Results:
READING COMPREHENSION MEDIAN %ILE Std. Curric. ESE
MATHEMATICS MEDIAN %ILE
School LEP All Students
2003 2004Std. Curric. ESE LEP All Students
Median Percentile Scores, by Grade Level and Curriculum Group, for 2003 and 2004, Grades 2-10
Notes: No data are reported when fewer than 10 students in a category were tested, as indicated by an "*."No students were tested in the curriculum group in one of the two years, as indicated by an "n/a."
35
A curriculum group listing will not appear if no students in the group were tested in either year.
Office of Assessment and Data Analysis
Grade 2 is the locally administered Stanford Achievement Test, 9th ed. (SAT-9); grades 3-10 results are based on the state's FCAT NRT (SAT-9) program.
Norm-Referenced Test Reading Comprehension and Mathematics Results:
READING COMPREHENSION MEDIAN %ILE Std. Curric. ESE
MATHEMATICS MEDIAN %ILE
School LEP All Students
2003 2004Std. Curric. ESE LEP All Students
Median Percentile Scores, by Grade Level and Curriculum Group, for 2003 and 2004, Grades 2-10
2003 2004 2003 2004 2003 2004 2003 2004 2003 2004 2003 2004 2003 20041601 EDISON PARK ELEMENTARY SCHOOL
Notes: No data are reported when fewer than 10 students in a category were tested, as indicated by an "*."No students were tested in the curriculum group in one of the two years, as indicated by an "n/a."
36
A curriculum group listing will not appear if no students in the group were tested in either year.
Office of Assessment and Data Analysis
Grade 2 is the locally administered Stanford Achievement Test, 9th ed. (SAT-9); grades 3-10 results are based on the state's FCAT NRT (SAT-9) program.
Norm-Referenced Test Reading Comprehension and Mathematics Results:
READING COMPREHENSION MEDIAN %ILE Std. Curric. ESE
MATHEMATICS MEDIAN %ILE
School LEP All Students
2003 2004Std. Curric. ESE LEP All Students
Median Percentile Scores, by Grade Level and Curriculum Group, for 2003 and 2004, Grades 2-10
2003 2004 2003 2004 2003 2004 2003 2004 2003 2004 2003 2004 2003 20041681 LILLIE C. EVANS ELEMENTARY SCHOOL
Notes: No data are reported when fewer than 10 students in a category were tested, as indicated by an "*."No students were tested in the curriculum group in one of the two years, as indicated by an "n/a."
37
A curriculum group listing will not appear if no students in the group were tested in either year.
Office of Assessment and Data Analysis
Grade 2 is the locally administered Stanford Achievement Test, 9th ed. (SAT-9); grades 3-10 results are based on the state's FCAT NRT (SAT-9) program.
Norm-Referenced Test Reading Comprehension and Mathematics Results:
READING COMPREHENSION MEDIAN %ILE Std. Curric. ESE
MATHEMATICS MEDIAN %ILE
School LEP All Students
2003 2004Std. Curric. ESE LEP All Students
Median Percentile Scores, by Grade Level and Curriculum Group, for 2003 and 2004, Grades 2-10
Notes: No data are reported when fewer than 10 students in a category were tested, as indicated by an "*."No students were tested in the curriculum group in one of the two years, as indicated by an "n/a."
38
A curriculum group listing will not appear if no students in the group were tested in either year.
Office of Assessment and Data Analysis
Grade 2 is the locally administered Stanford Achievement Test, 9th ed. (SAT-9); grades 3-10 results are based on the state's FCAT NRT (SAT-9) program.
Norm-Referenced Test Reading Comprehension and Mathematics Results:
READING COMPREHENSION MEDIAN %ILE Std. Curric. ESE
MATHEMATICS MEDIAN %ILE
School LEP All Students
2003 2004Std. Curric. ESE LEP All Students
Median Percentile Scores, by Grade Level and Curriculum Group, for 2003 and 2004, Grades 2-10
2003 2004 2003 2004 2003 2004 2003 2004 2003 2004 2003 2004 2003 20041761 DAVID FAIRCHILD ELEMENTARY SCHOOL
Notes: No data are reported when fewer than 10 students in a category were tested, as indicated by an "*."No students were tested in the curriculum group in one of the two years, as indicated by an "n/a."
39
A curriculum group listing will not appear if no students in the group were tested in either year.
Office of Assessment and Data Analysis
Grade 2 is the locally administered Stanford Achievement Test, 9th ed. (SAT-9); grades 3-10 results are based on the state's FCAT NRT (SAT-9) program.
Norm-Referenced Test Reading Comprehension and Mathematics Results:
READING COMPREHENSION MEDIAN %ILE Std. Curric. ESE
MATHEMATICS MEDIAN %ILE
School LEP All Students
2003 2004Std. Curric. ESE LEP All Students
Median Percentile Scores, by Grade Level and Curriculum Group, for 2003 and 2004, Grades 2-10
2003 2004 2003 2004 2003 2004 2003 2004 2003 2004 2003 2004 2003 20041811 DANTE B. FASCELL ELEMENTARY SCHOOL
Notes: No data are reported when fewer than 10 students in a category were tested, as indicated by an "*."No students were tested in the curriculum group in one of the two years, as indicated by an "n/a."
40
A curriculum group listing will not appear if no students in the group were tested in either year.
Office of Assessment and Data Analysis
Grade 2 is the locally administered Stanford Achievement Test, 9th ed. (SAT-9); grades 3-10 results are based on the state's FCAT NRT (SAT-9) program.
Norm-Referenced Test Reading Comprehension and Mathematics Results:
READING COMPREHENSION MEDIAN %ILE Std. Curric. ESE
MATHEMATICS MEDIAN %ILE
School LEP All Students
2003 2004Std. Curric. ESE LEP All Students
Median Percentile Scores, by Grade Level and Curriculum Group, for 2003 and 2004, Grades 2-10
2003 2004 2003 2004 2003 2004 2003 2004 2003 2004 2003 2004 2003 20041881 HENRY M. FLAGLER ELEMENTARY SCHOOL
Notes: No data are reported when fewer than 10 students in a category were tested, as indicated by an "*."No students were tested in the curriculum group in one of the two years, as indicated by an "n/a."
41
A curriculum group listing will not appear if no students in the group were tested in either year.
Office of Assessment and Data Analysis
Grade 2 is the locally administered Stanford Achievement Test, 9th ed. (SAT-9); grades 3-10 results are based on the state's FCAT NRT (SAT-9) program.
Norm-Referenced Test Reading Comprehension and Mathematics Results:
READING COMPREHENSION MEDIAN %ILE Std. Curric. ESE
MATHEMATICS MEDIAN %ILE
School LEP All Students
2003 2004Std. Curric. ESE LEP All Students
Median Percentile Scores, by Grade Level and Curriculum Group, for 2003 and 2004, Grades 2-10
Notes: No data are reported when fewer than 10 students in a category were tested, as indicated by an "*."No students were tested in the curriculum group in one of the two years, as indicated by an "n/a."
42
A curriculum group listing will not appear if no students in the group were tested in either year.
Office of Assessment and Data Analysis
Grade 2 is the locally administered Stanford Achievement Test, 9th ed. (SAT-9); grades 3-10 results are based on the state's FCAT NRT (SAT-9) program.
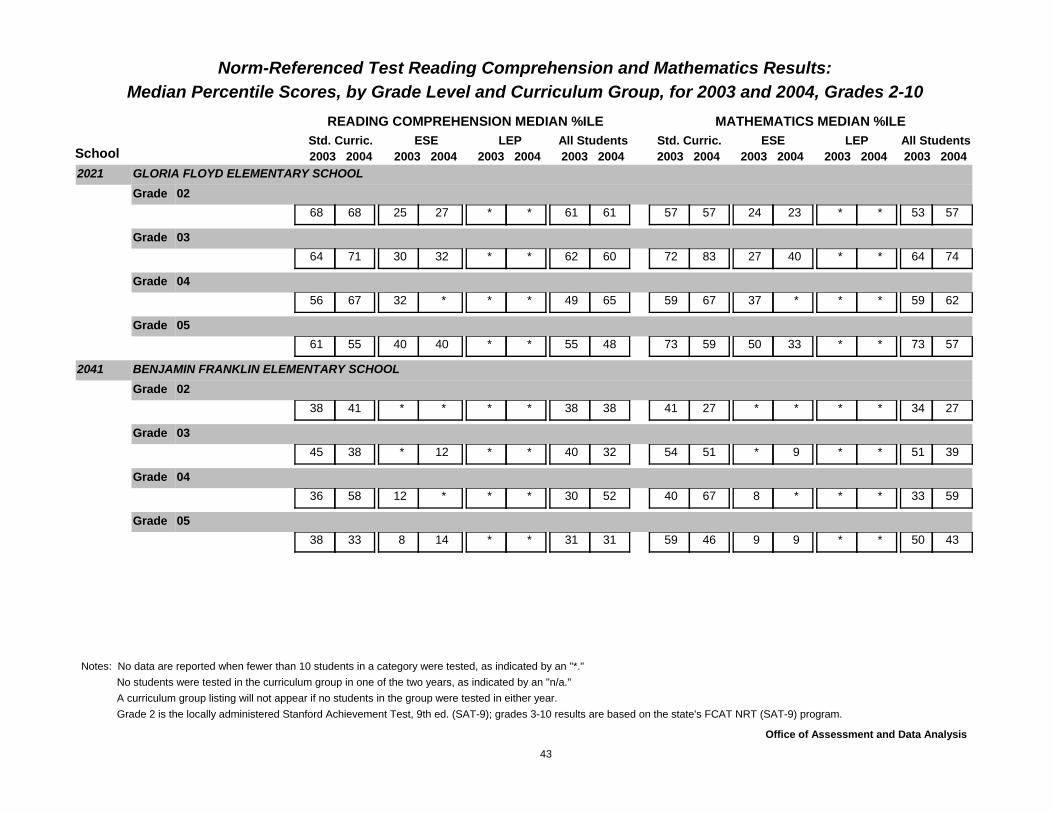
Norm-Referenced Test Reading Comprehension and Mathematics Results:
READING COMPREHENSION MEDIAN %ILE Std. Curric. ESE
MATHEMATICS MEDIAN %ILE
School LEP All Students
2003 2004Std. Curric. ESE LEP All Students
Median Percentile Scores, by Grade Level and Curriculum Group, for 2003 and 2004, Grades 2-10
Notes: No data are reported when fewer than 10 students in a category were tested, as indicated by an "*."No students were tested in the curriculum group in one of the two years, as indicated by an "n/a."
43
A curriculum group listing will not appear if no students in the group were tested in either year.
Office of Assessment and Data Analysis
Grade 2 is the locally administered Stanford Achievement Test, 9th ed. (SAT-9); grades 3-10 results are based on the state's FCAT NRT (SAT-9) program.
Norm-Referenced Test Reading Comprehension and Mathematics Results:
READING COMPREHENSION MEDIAN %ILE Std. Curric. ESE
MATHEMATICS MEDIAN %ILE
School LEP All Students
2003 2004Std. Curric. ESE LEP All Students
Median Percentile Scores, by Grade Level and Curriculum Group, for 2003 and 2004, Grades 2-10
2003 2004 2003 2004 2003 2004 2003 2004 2003 2004 2003 2004 2003 20042060 GIBSON CHARTER SCHOOL
Notes: No data are reported when fewer than 10 students in a category were tested, as indicated by an "*."No students were tested in the curriculum group in one of the two years, as indicated by an "n/a."
44
A curriculum group listing will not appear if no students in the group were tested in either year.
Office of Assessment and Data Analysis
Grade 2 is the locally administered Stanford Achievement Test, 9th ed. (SAT-9); grades 3-10 results are based on the state's FCAT NRT (SAT-9) program.
Norm-Referenced Test Reading Comprehension and Mathematics Results:
READING COMPREHENSION MEDIAN %ILE Std. Curric. ESE
MATHEMATICS MEDIAN %ILE
School LEP All Students
2003 2004Std. Curric. ESE LEP All Students
Median Percentile Scores, by Grade Level and Curriculum Group, for 2003 and 2004, Grades 2-10
Notes: No data are reported when fewer than 10 students in a category were tested, as indicated by an "*."No students were tested in the curriculum group in one of the two years, as indicated by an "n/a."
45
A curriculum group listing will not appear if no students in the group were tested in either year.
Office of Assessment and Data Analysis
Grade 2 is the locally administered Stanford Achievement Test, 9th ed. (SAT-9); grades 3-10 results are based on the state's FCAT NRT (SAT-9) program.
Norm-Referenced Test Reading Comprehension and Mathematics Results:
READING COMPREHENSION MEDIAN %ILE Std. Curric. ESE
MATHEMATICS MEDIAN %ILE
School LEP All Students
2003 2004Std. Curric. ESE LEP All Students
Median Percentile Scores, by Grade Level and Curriculum Group, for 2003 and 2004, Grades 2-10
2003 2004 2003 2004 2003 2004 2003 2004 2003 2004 2003 2004 2003 20042161 GOLDEN GLADES ELEMENTARY SCHOOL
Notes: No data are reported when fewer than 10 students in a category were tested, as indicated by an "*."No students were tested in the curriculum group in one of the two years, as indicated by an "n/a."
46
A curriculum group listing will not appear if no students in the group were tested in either year.
Office of Assessment and Data Analysis
Grade 2 is the locally administered Stanford Achievement Test, 9th ed. (SAT-9); grades 3-10 results are based on the state's FCAT NRT (SAT-9) program.
Norm-Referenced Test Reading Comprehension and Mathematics Results:
READING COMPREHENSION MEDIAN %ILE Std. Curric. ESE
MATHEMATICS MEDIAN %ILE
School LEP All Students
2003 2004Std. Curric. ESE LEP All Students
Median Percentile Scores, by Grade Level and Curriculum Group, for 2003 and 2004, Grades 2-10
Notes: No data are reported when fewer than 10 students in a category were tested, as indicated by an "*."No students were tested in the curriculum group in one of the two years, as indicated by an "n/a."
47
A curriculum group listing will not appear if no students in the group were tested in either year.
Office of Assessment and Data Analysis
Grade 2 is the locally administered Stanford Achievement Test, 9th ed. (SAT-9); grades 3-10 results are based on the state's FCAT NRT (SAT-9) program.
Norm-Referenced Test Reading Comprehension and Mathematics Results:
READING COMPREHENSION MEDIAN %ILE Std. Curric. ESE
MATHEMATICS MEDIAN %ILE
School LEP All Students
2003 2004Std. Curric. ESE LEP All Students
Median Percentile Scores, by Grade Level and Curriculum Group, for 2003 and 2004, Grades 2-10
2003 2004 2003 2004 2003 2004 2003 2004 2003 2004 2003 2004 2003 20042281 GREYNOLDS PARK ELEMENTARY SCHOOL
Notes: No data are reported when fewer than 10 students in a category were tested, as indicated by an "*."No students were tested in the curriculum group in one of the two years, as indicated by an "n/a."
48
A curriculum group listing will not appear if no students in the group were tested in either year.
Office of Assessment and Data Analysis
Grade 2 is the locally administered Stanford Achievement Test, 9th ed. (SAT-9); grades 3-10 results are based on the state's FCAT NRT (SAT-9) program.
Norm-Referenced Test Reading Comprehension and Mathematics Results:
READING COMPREHENSION MEDIAN %ILE Std. Curric. ESE
MATHEMATICS MEDIAN %ILE
School LEP All Students
2003 2004Std. Curric. ESE LEP All Students
Median Percentile Scores, by Grade Level and Curriculum Group, for 2003 and 2004, Grades 2-10
2003 2004 2003 2004 2003 2004 2003 2004 2003 2004 2003 2004 2003 20042331 CHARLES R. HADLEY ELEMENTARY SCHOOL
Notes: No data are reported when fewer than 10 students in a category were tested, as indicated by an "*."No students were tested in the curriculum group in one of the two years, as indicated by an "n/a."
49
A curriculum group listing will not appear if no students in the group were tested in either year.
Office of Assessment and Data Analysis
Grade 2 is the locally administered Stanford Achievement Test, 9th ed. (SAT-9); grades 3-10 results are based on the state's FCAT NRT (SAT-9) program.
Norm-Referenced Test Reading Comprehension and Mathematics Results:
READING COMPREHENSION MEDIAN %ILE Std. Curric. ESE
MATHEMATICS MEDIAN %ILE
School LEP All Students
2003 2004Std. Curric. ESE LEP All Students
Median Percentile Scores, by Grade Level and Curriculum Group, for 2003 and 2004, Grades 2-10
Notes: No data are reported when fewer than 10 students in a category were tested, as indicated by an "*."No students were tested in the curriculum group in one of the two years, as indicated by an "n/a."
50
A curriculum group listing will not appear if no students in the group were tested in either year.
Office of Assessment and Data Analysis
Grade 2 is the locally administered Stanford Achievement Test, 9th ed. (SAT-9); grades 3-10 results are based on the state's FCAT NRT (SAT-9) program.
Norm-Referenced Test Reading Comprehension and Mathematics Results:
READING COMPREHENSION MEDIAN %ILE Std. Curric. ESE
MATHEMATICS MEDIAN %ILE
School LEP All Students
2003 2004Std. Curric. ESE LEP All Students
Median Percentile Scores, by Grade Level and Curriculum Group, for 2003 and 2004, Grades 2-10
Notes: No data are reported when fewer than 10 students in a category were tested, as indicated by an "*."No students were tested in the curriculum group in one of the two years, as indicated by an "n/a."
51
A curriculum group listing will not appear if no students in the group were tested in either year.
Office of Assessment and Data Analysis
Grade 2 is the locally administered Stanford Achievement Test, 9th ed. (SAT-9); grades 3-10 results are based on the state's FCAT NRT (SAT-9) program.
Norm-Referenced Test Reading Comprehension and Mathematics Results:
READING COMPREHENSION MEDIAN %ILE Std. Curric. ESE
MATHEMATICS MEDIAN %ILE
School LEP All Students
2003 2004Std. Curric. ESE LEP All Students
Median Percentile Scores, by Grade Level and Curriculum Group, for 2003 and 2004, Grades 2-10
Notes: No data are reported when fewer than 10 students in a category were tested, as indicated by an "*."No students were tested in the curriculum group in one of the two years, as indicated by an "n/a."
52
A curriculum group listing will not appear if no students in the group were tested in either year.
Office of Assessment and Data Analysis
Grade 2 is the locally administered Stanford Achievement Test, 9th ed. (SAT-9); grades 3-10 results are based on the state's FCAT NRT (SAT-9) program.
Norm-Referenced Test Reading Comprehension and Mathematics Results:
READING COMPREHENSION MEDIAN %ILE Std. Curric. ESE
MATHEMATICS MEDIAN %ILE
School LEP All Students
2003 2004Std. Curric. ESE LEP All Students
Median Percentile Scores, by Grade Level and Curriculum Group, for 2003 and 2004, Grades 2-10
2003 2004 2003 2004 2003 2004 2003 2004 2003 2004 2003 2004 2003 20042521 OLIVER HOOVER ELEMENTARY SCHOOL
Notes: No data are reported when fewer than 10 students in a category were tested, as indicated by an "*."No students were tested in the curriculum group in one of the two years, as indicated by an "n/a."
53
A curriculum group listing will not appear if no students in the group were tested in either year.
Office of Assessment and Data Analysis
Grade 2 is the locally administered Stanford Achievement Test, 9th ed. (SAT-9); grades 3-10 results are based on the state's FCAT NRT (SAT-9) program.
Norm-Referenced Test Reading Comprehension and Mathematics Results:
READING COMPREHENSION MEDIAN %ILE Std. Curric. ESE
MATHEMATICS MEDIAN %ILE
School LEP All Students
2003 2004Std. Curric. ESE LEP All Students
Median Percentile Scores, by Grade Level and Curriculum Group, for 2003 and 2004, Grades 2-10
2003 2004 2003 2004 2003 2004 2003 2004 2003 2004 2003 2004 2003 20042541 HOWARD DRIVE ELEMENTARY SCHOOL
Notes: No data are reported when fewer than 10 students in a category were tested, as indicated by an "*."No students were tested in the curriculum group in one of the two years, as indicated by an "n/a."
54
A curriculum group listing will not appear if no students in the group were tested in either year.
Office of Assessment and Data Analysis
Grade 2 is the locally administered Stanford Achievement Test, 9th ed. (SAT-9); grades 3-10 results are based on the state's FCAT NRT (SAT-9) program.
Norm-Referenced Test Reading Comprehension and Mathematics Results:
READING COMPREHENSION MEDIAN %ILE Std. Curric. ESE
MATHEMATICS MEDIAN %ILE
School LEP All Students
2003 2004Std. Curric. ESE LEP All Students
Median Percentile Scores, by Grade Level and Curriculum Group, for 2003 and 2004, Grades 2-10
Notes: No data are reported when fewer than 10 students in a category were tested, as indicated by an "*."No students were tested in the curriculum group in one of the two years, as indicated by an "n/a."
55
A curriculum group listing will not appear if no students in the group were tested in either year.
Office of Assessment and Data Analysis
Grade 2 is the locally administered Stanford Achievement Test, 9th ed. (SAT-9); grades 3-10 results are based on the state's FCAT NRT (SAT-9) program.
Norm-Referenced Test Reading Comprehension and Mathematics Results:
READING COMPREHENSION MEDIAN %ILE Std. Curric. ESE
MATHEMATICS MEDIAN %ILE
School LEP All Students
2003 2004Std. Curric. ESE LEP All Students
Median Percentile Scores, by Grade Level and Curriculum Group, for 2003 and 2004, Grades 2-10
2003 2004 2003 2004 2003 2004 2003 2004 2003 2004 2003 2004 2003 20042661 KENSINGTON PARK ELEMENTARY SCHOOL
Notes: No data are reported when fewer than 10 students in a category were tested, as indicated by an "*."No students were tested in the curriculum group in one of the two years, as indicated by an "n/a."
56
A curriculum group listing will not appear if no students in the group were tested in either year.
Office of Assessment and Data Analysis
Grade 2 is the locally administered Stanford Achievement Test, 9th ed. (SAT-9); grades 3-10 results are based on the state's FCAT NRT (SAT-9) program.
Norm-Referenced Test Reading Comprehension and Mathematics Results:
READING COMPREHENSION MEDIAN %ILE Std. Curric. ESE
MATHEMATICS MEDIAN %ILE
School LEP All Students
2003 2004Std. Curric. ESE LEP All Students
Median Percentile Scores, by Grade Level and Curriculum Group, for 2003 and 2004, Grades 2-10
Notes: No data are reported when fewer than 10 students in a category were tested, as indicated by an "*."No students were tested in the curriculum group in one of the two years, as indicated by an "n/a."
57
A curriculum group listing will not appear if no students in the group were tested in either year.
Office of Assessment and Data Analysis
Grade 2 is the locally administered Stanford Achievement Test, 9th ed. (SAT-9); grades 3-10 results are based on the state's FCAT NRT (SAT-9) program.
Norm-Referenced Test Reading Comprehension and Mathematics Results:
READING COMPREHENSION MEDIAN %ILE Std. Curric. ESE
MATHEMATICS MEDIAN %ILE
School LEP All Students
2003 2004Std. Curric. ESE LEP All Students
Median Percentile Scores, by Grade Level and Curriculum Group, for 2003 and 2004, Grades 2-10
Grade 03n/a n/a n/a n/a 40 n /a 41 n /a n/a n/a n/a n/a 32 n /a 32 n /a
Notes: No data are reported when fewer than 10 students in a category were tested, as indicated by an "*."No students were tested in the curriculum group in one of the two years, as indicated by an "n/a."
58
A curriculum group listing will not appear if no students in the group were tested in either year.
Office of Assessment and Data Analysis
Grade 2 is the locally administered Stanford Achievement Test, 9th ed. (SAT-9); grades 3-10 results are based on the state's FCAT NRT (SAT-9) program.
Norm-Referenced Test Reading Comprehension and Mathematics Results:
READING COMPREHENSION MEDIAN %ILE Std. Curric. ESE
MATHEMATICS MEDIAN %ILE
School LEP All Students
2003 2004Std. Curric. ESE LEP All Students
Median Percentile Scores, by Grade Level and Curriculum Group, for 2003 and 2004, Grades 2-10
2003 2004 2003 2004 2003 2004 2003 2004 2003 2004 2003 2004 2003 20042781 KINLOCH PARK ELEMENTARY SCHOOL
Notes: No data are reported when fewer than 10 students in a category were tested, as indicated by an "*."No students were tested in the curriculum group in one of the two years, as indicated by an "n/a."
59
A curriculum group listing will not appear if no students in the group were tested in either year.
Office of Assessment and Data Analysis
Grade 2 is the locally administered Stanford Achievement Test, 9th ed. (SAT-9); grades 3-10 results are based on the state's FCAT NRT (SAT-9) program.
Norm-Referenced Test Reading Comprehension and Mathematics Results:
READING COMPREHENSION MEDIAN %ILE Std. Curric. ESE
MATHEMATICS MEDIAN %ILE
School LEP All Students
2003 2004Std. Curric. ESE LEP All Students
Median Percentile Scores, by Grade Level and Curriculum Group, for 2003 and 2004, Grades 2-10
Notes: No data are reported when fewer than 10 students in a category were tested, as indicated by an "*."No students were tested in the curriculum group in one of the two years, as indicated by an "n/a."
60
A curriculum group listing will not appear if no students in the group were tested in either year.
Office of Assessment and Data Analysis
Grade 2 is the locally administered Stanford Achievement Test, 9th ed. (SAT-9); grades 3-10 results are based on the state's FCAT NRT (SAT-9) program.
Norm-Referenced Test Reading Comprehension and Mathematics Results:
READING COMPREHENSION MEDIAN %ILE Std. Curric. ESE
MATHEMATICS MEDIAN %ILE
School LEP All Students
2003 2004Std. Curric. ESE LEP All Students
Median Percentile Scores, by Grade Level and Curriculum Group, for 2003 and 2004, Grades 2-10
Notes: No data are reported when fewer than 10 students in a category were tested, as indicated by an "*."No students were tested in the curriculum group in one of the two years, as indicated by an "n/a."
61
A curriculum group listing will not appear if no students in the group were tested in either year.
Office of Assessment and Data Analysis
Grade 2 is the locally administered Stanford Achievement Test, 9th ed. (SAT-9); grades 3-10 results are based on the state's FCAT NRT (SAT-9) program.
Norm-Referenced Test Reading Comprehension and Mathematics Results:
READING COMPREHENSION MEDIAN %ILE Std. Curric. ESE
MATHEMATICS MEDIAN %ILE
School LEP All Students
2003 2004Std. Curric. ESE LEP All Students
Median Percentile Scores, by Grade Level and Curriculum Group, for 2003 and 2004, Grades 2-10
2003 2004 2003 2004 2003 2004 2003 2004 2003 2004 2003 2004 2003 20042901 LEISURE CITY K-8 CENTER
Notes: No data are reported when fewer than 10 students in a category were tested, as indicated by an "*."No students were tested in the curriculum group in one of the two years, as indicated by an "n/a."
62
A curriculum group listing will not appear if no students in the group were tested in either year.
Office of Assessment and Data Analysis
Grade 2 is the locally administered Stanford Achievement Test, 9th ed. (SAT-9); grades 3-10 results are based on the state's FCAT NRT (SAT-9) program.
Norm-Referenced Test Reading Comprehension and Mathematics Results:
READING COMPREHENSION MEDIAN %ILE Std. Curric. ESE
MATHEMATICS MEDIAN %ILE
School LEP All Students
2003 2004Std. Curric. ESE LEP All Students
Median Percentile Scores, by Grade Level and Curriculum Group, for 2003 and 2004, Grades 2-10
2003 2004 2003 2004 2003 2004 2003 2004 2003 2004 2003 2004 2003 20042911 LINDA LENTIN ELEMENTARY SCHOOL
Notes: No data are reported when fewer than 10 students in a category were tested, as indicated by an "*."No students were tested in the curriculum group in one of the two years, as indicated by an "n/a."
63
A curriculum group listing will not appear if no students in the group were tested in either year.
Office of Assessment and Data Analysis
Grade 2 is the locally administered Stanford Achievement Test, 9th ed. (SAT-9); grades 3-10 results are based on the state's FCAT NRT (SAT-9) program.
Norm-Referenced Test Reading Comprehension and Mathematics Results:
READING COMPREHENSION MEDIAN %ILE Std. Curric. ESE
MATHEMATICS MEDIAN %ILE
School LEP All Students
2003 2004Std. Curric. ESE LEP All Students
Median Percentile Scores, by Grade Level and Curriculum Group, for 2003 and 2004, Grades 2-10
2003 2004 2003 2004 2003 2004 2003 2004 2003 2004 2003 2004 2003 20042981 LIBERTY CITY ELEMENTARY SCHOOL
Notes: No data are reported when fewer than 10 students in a category were tested, as indicated by an "*."No students were tested in the curriculum group in one of the two years, as indicated by an "n/a."
64
A curriculum group listing will not appear if no students in the group were tested in either year.
Office of Assessment and Data Analysis
Grade 2 is the locally administered Stanford Achievement Test, 9th ed. (SAT-9); grades 3-10 results are based on the state's FCAT NRT (SAT-9) program.
Norm-Referenced Test Reading Comprehension and Mathematics Results:
READING COMPREHENSION MEDIAN %ILE Std. Curric. ESE
MATHEMATICS MEDIAN %ILE
School LEP All Students
2003 2004Std. Curric. ESE LEP All Students
Median Percentile Scores, by Grade Level and Curriculum Group, for 2003 and 2004, Grades 2-10
2003 2004 2003 2004 2003 2004 2003 2004 2003 2004 2003 2004 2003 20043030 DORAL ACADEMY CHARTER
Notes: No data are reported when fewer than 10 students in a category were tested, as indicated by an "*."No students were tested in the curriculum group in one of the two years, as indicated by an "n/a."
65
A curriculum group listing will not appear if no students in the group were tested in either year.
Office of Assessment and Data Analysis
Grade 2 is the locally administered Stanford Achievement Test, 9th ed. (SAT-9); grades 3-10 results are based on the state's FCAT NRT (SAT-9) program.
Norm-Referenced Test Reading Comprehension and Mathematics Results:
READING COMPREHENSION MEDIAN %ILE Std. Curric. ESE
MATHEMATICS MEDIAN %ILE
School LEP All Students
2003 2004Std. Curric. ESE LEP All Students
Median Percentile Scores, by Grade Level and Curriculum Group, for 2003 and 2004, Grades 2-10
Notes: No data are reported when fewer than 10 students in a category were tested, as indicated by an "*."No students were tested in the curriculum group in one of the two years, as indicated by an "n/a."
66
A curriculum group listing will not appear if no students in the group were tested in either year.
Office of Assessment and Data Analysis
Grade 2 is the locally administered Stanford Achievement Test, 9th ed. (SAT-9); grades 3-10 results are based on the state's FCAT NRT (SAT-9) program.
Norm-Referenced Test Reading Comprehension and Mathematics Results:
READING COMPREHENSION MEDIAN %ILE Std. Curric. ESE
MATHEMATICS MEDIAN %ILE
School LEP All Students
2003 2004Std. Curric. ESE LEP All Students
Median Percentile Scores, by Grade Level and Curriculum Group, for 2003 and 2004, Grades 2-10
2003 2004 2003 2004 2003 2004 2003 2004 2003 2004 2003 2004 2003 20043100 MATER EAST CHARTER SCHOOL
Notes: No data are reported when fewer than 10 students in a category were tested, as indicated by an "*."No students were tested in the curriculum group in one of the two years, as indicated by an "n/a."
67
A curriculum group listing will not appear if no students in the group were tested in either year.
Office of Assessment and Data Analysis
Grade 2 is the locally administered Stanford Achievement Test, 9th ed. (SAT-9); grades 3-10 results are based on the state's FCAT NRT (SAT-9) program.
Norm-Referenced Test Reading Comprehension and Mathematics Results:
READING COMPREHENSION MEDIAN %ILE Std. Curric. ESE
MATHEMATICS MEDIAN %ILE
School LEP All Students
2003 2004Std. Curric. ESE LEP All Students
Median Percentile Scores, by Grade Level and Curriculum Group, for 2003 and 2004, Grades 2-10
Notes: No data are reported when fewer than 10 students in a category were tested, as indicated by an "*."No students were tested in the curriculum group in one of the two years, as indicated by an "n/a."
68
A curriculum group listing will not appear if no students in the group were tested in either year.
Office of Assessment and Data Analysis
Grade 2 is the locally administered Stanford Achievement Test, 9th ed. (SAT-9); grades 3-10 results are based on the state's FCAT NRT (SAT-9) program.
Norm-Referenced Test Reading Comprehension and Mathematics Results:
READING COMPREHENSION MEDIAN %ILE Std. Curric. ESE
MATHEMATICS MEDIAN %ILE
School LEP All Students
2003 2004Std. Curric. ESE LEP All Students
Median Percentile Scores, by Grade Level and Curriculum Group, for 2003 and 2004, Grades 2-10
Notes: No data are reported when fewer than 10 students in a category were tested, as indicated by an "*."No students were tested in the curriculum group in one of the two years, as indicated by an "n/a."
69
A curriculum group listing will not appear if no students in the group were tested in either year.
Office of Assessment and Data Analysis
Grade 2 is the locally administered Stanford Achievement Test, 9th ed. (SAT-9); grades 3-10 results are based on the state's FCAT NRT (SAT-9) program.
Norm-Referenced Test Reading Comprehension and Mathematics Results:
READING COMPREHENSION MEDIAN %ILE Std. Curric. ESE
MATHEMATICS MEDIAN %ILE
School LEP All Students
2003 2004Std. Curric. ESE LEP All Students
Median Percentile Scores, by Grade Level and Curriculum Group, for 2003 and 2004, Grades 2-10
Notes: No data are reported when fewer than 10 students in a category were tested, as indicated by an "*."No students were tested in the curriculum group in one of the two years, as indicated by an "n/a."
70
A curriculum group listing will not appear if no students in the group were tested in either year.
Office of Assessment and Data Analysis
Grade 2 is the locally administered Stanford Achievement Test, 9th ed. (SAT-9); grades 3-10 results are based on the state's FCAT NRT (SAT-9) program.
Norm-Referenced Test Reading Comprehension and Mathematics Results:
READING COMPREHENSION MEDIAN %ILE Std. Curric. ESE
MATHEMATICS MEDIAN %ILE
School LEP All Students
2003 2004Std. Curric. ESE LEP All Students
Median Percentile Scores, by Grade Level and Curriculum Group, for 2003 and 2004, Grades 2-10
2003 2004 2003 2004 2003 2004 2003 2004 2003 2004 2003 2004 2003 20043301 MIAMI PARK ELEMENTARY SCHOOL
Notes: No data are reported when fewer than 10 students in a category were tested, as indicated by an "*."No students were tested in the curriculum group in one of the two years, as indicated by an "n/a."
71
A curriculum group listing will not appear if no students in the group were tested in either year.
Office of Assessment and Data Analysis
Grade 2 is the locally administered Stanford Achievement Test, 9th ed. (SAT-9); grades 3-10 results are based on the state's FCAT NRT (SAT-9) program.
Norm-Referenced Test Reading Comprehension and Mathematics Results:
READING COMPREHENSION MEDIAN %ILE Std. Curric. ESE
MATHEMATICS MEDIAN %ILE
School LEP All Students
2003 2004Std. Curric. ESE LEP All Students
Median Percentile Scores, by Grade Level and Curriculum Group, for 2003 and 2004, Grades 2-10
Notes: No data are reported when fewer than 10 students in a category were tested, as indicated by an "*."No students were tested in the curriculum group in one of the two years, as indicated by an "n/a."
72
A curriculum group listing will not appear if no students in the group were tested in either year.
Office of Assessment and Data Analysis
Grade 2 is the locally administered Stanford Achievement Test, 9th ed. (SAT-9); grades 3-10 results are based on the state's FCAT NRT (SAT-9) program.
Norm-Referenced Test Reading Comprehension and Mathematics Results:
READING COMPREHENSION MEDIAN %ILE Std. Curric. ESE
MATHEMATICS MEDIAN %ILE
School LEP All Students
2003 2004Std. Curric. ESE LEP All Students
Median Percentile Scores, by Grade Level and Curriculum Group, for 2003 and 2004, Grades 2-10
2003 2004 2003 2004 2003 2004 2003 2004 2003 2004 2003 2004 2003 20043421 M. A. MILAM K-8 CENTER
Notes: No data are reported when fewer than 10 students in a category were tested, as indicated by an "*."No students were tested in the curriculum group in one of the two years, as indicated by an "n/a."
73
A curriculum group listing will not appear if no students in the group were tested in either year.
Office of Assessment and Data Analysis
Grade 2 is the locally administered Stanford Achievement Test, 9th ed. (SAT-9); grades 3-10 results are based on the state's FCAT NRT (SAT-9) program.
Norm-Referenced Test Reading Comprehension and Mathematics Results:
READING COMPREHENSION MEDIAN %ILE Std. Curric. ESE
MATHEMATICS MEDIAN %ILE
School LEP All Students
2003 2004Std. Curric. ESE LEP All Students
Median Percentile Scores, by Grade Level and Curriculum Group, for 2003 and 2004, Grades 2-10
2003 2004 2003 2004 2003 2004 2003 2004 2003 2004 2003 2004 2003 20043431 PHYLLIS R. MILLER ELEMENTARY SCHOOL
Notes: No data are reported when fewer than 10 students in a category were tested, as indicated by an "*."No students were tested in the curriculum group in one of the two years, as indicated by an "n/a."
74
A curriculum group listing will not appear if no students in the group were tested in either year.
Office of Assessment and Data Analysis
Grade 2 is the locally administered Stanford Achievement Test, 9th ed. (SAT-9); grades 3-10 results are based on the state's FCAT NRT (SAT-9) program.
Norm-Referenced Test Reading Comprehension and Mathematics Results:
READING COMPREHENSION MEDIAN %ILE Std. Curric. ESE
MATHEMATICS MEDIAN %ILE
School LEP All Students
2003 2004Std. Curric. ESE LEP All Students
Median Percentile Scores, by Grade Level and Curriculum Group, for 2003 and 2004, Grades 2-10
Notes: No data are reported when fewer than 10 students in a category were tested, as indicated by an "*."No students were tested in the curriculum group in one of the two years, as indicated by an "n/a."
75
A curriculum group listing will not appear if no students in the group were tested in either year.
Office of Assessment and Data Analysis
Grade 2 is the locally administered Stanford Achievement Test, 9th ed. (SAT-9); grades 3-10 results are based on the state's FCAT NRT (SAT-9) program.
Norm-Referenced Test Reading Comprehension and Mathematics Results:
READING COMPREHENSION MEDIAN %ILE Std. Curric. ESE
MATHEMATICS MEDIAN %ILE
School LEP All Students
2003 2004Std. Curric. ESE LEP All Students
Median Percentile Scores, by Grade Level and Curriculum Group, for 2003 and 2004, Grades 2-10
2003 2004 2003 2004 2003 2004 2003 2004 2003 2004 2003 2004 2003 20043541 ROBERT RUSSA MOTON ELEMENTARY SCHOOL
Notes: No data are reported when fewer than 10 students in a category were tested, as indicated by an "*."No students were tested in the curriculum group in one of the two years, as indicated by an "n/a."
76
A curriculum group listing will not appear if no students in the group were tested in either year.
Office of Assessment and Data Analysis
Grade 2 is the locally administered Stanford Achievement Test, 9th ed. (SAT-9); grades 3-10 results are based on the state's FCAT NRT (SAT-9) program.
Norm-Referenced Test Reading Comprehension and Mathematics Results:
READING COMPREHENSION MEDIAN %ILE Std. Curric. ESE
MATHEMATICS MEDIAN %ILE
School LEP All Students
2003 2004Std. Curric. ESE LEP All Students
Median Percentile Scores, by Grade Level and Curriculum Group, for 2003 and 2004, Grades 2-10
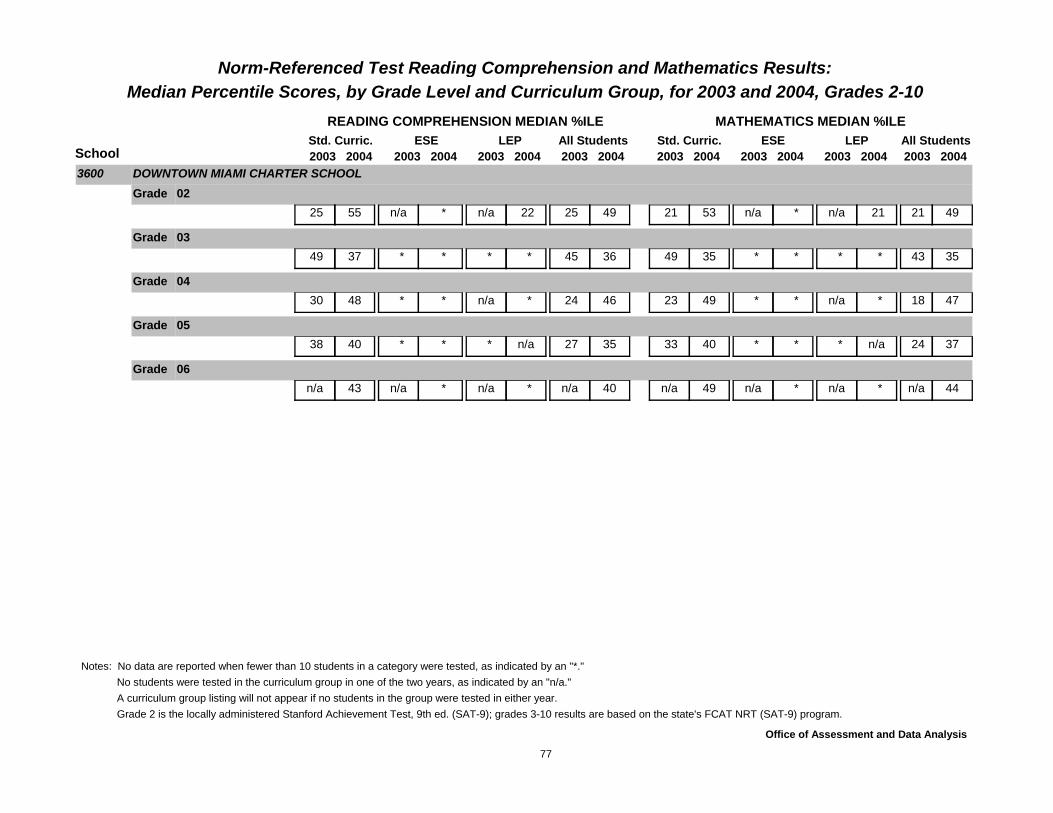
2003 2004 2003 2004 2003 2004 2003 2004 2003 2004 2003 2004 2003 20043600 DOWNTOWN MIAMI CHARTER SCHOOL
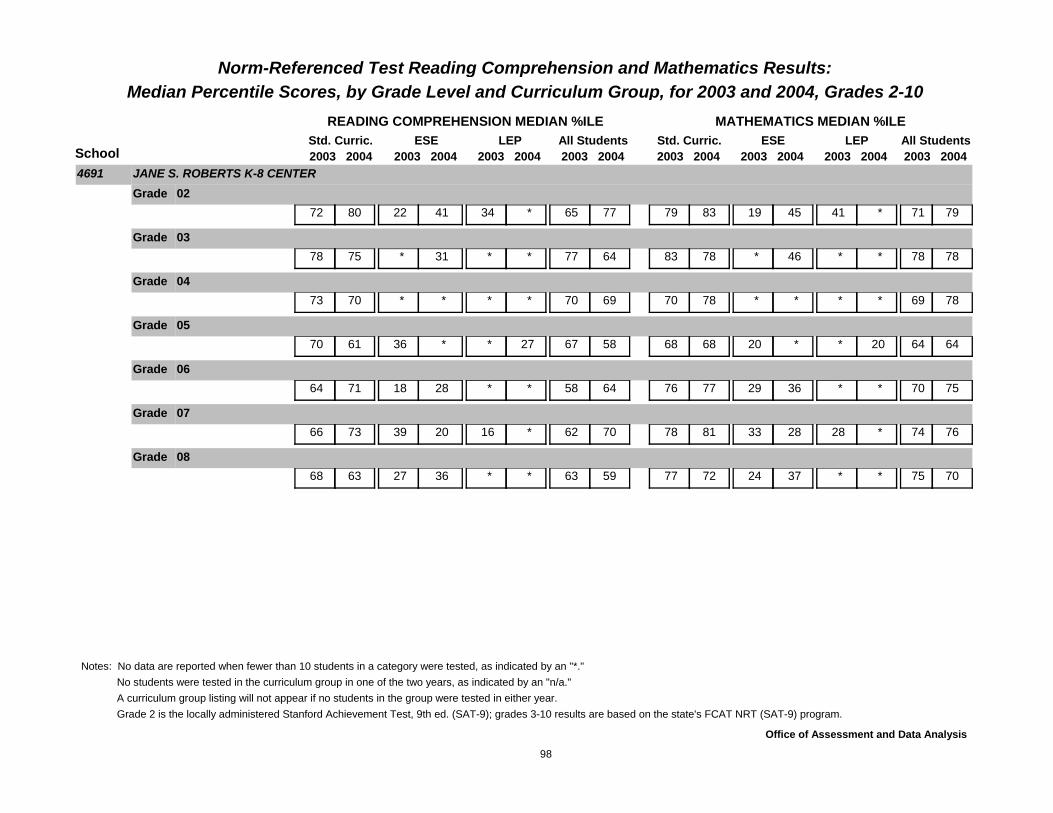
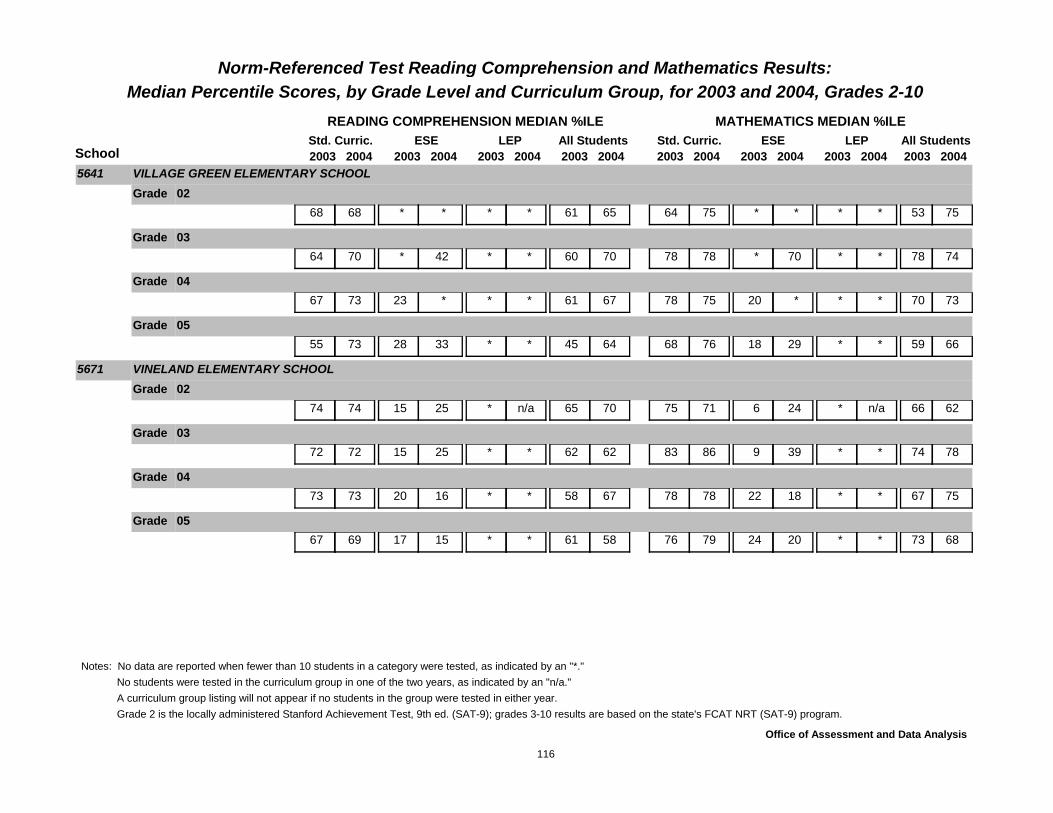
Notes: No data are reported when fewer than 10 students in a category were tested, as indicated by an "*."No students were tested in the curriculum group in one of the two years, as indicated by an "n/a."
77
A curriculum group listing will not appear if no students in the group were tested in either year.
Office of Assessment and Data Analysis
Grade 2 is the locally administered Stanford Achievement Test, 9th ed. (SAT-9); grades 3-10 results are based on the state's FCAT NRT (SAT-9) program.
Norm-Referenced Test Reading Comprehension and Mathematics Results:
READING COMPREHENSION MEDIAN %ILE Std. Curric. ESE
MATHEMATICS MEDIAN %ILE
School LEP All Students
2003 2004Std. Curric. ESE LEP All Students
Median Percentile Scores, by Grade Level and Curriculum Group, for 2003 and 2004, Grades 2-10
2003 2004 2003 2004 2003 2004 2003 2004 2003 2004 2003 2004 2003 20043610 KEYS GATE CHARTER SCHOOL
Notes: No data are reported when fewer than 10 students in a category were tested, as indicated by an "*."No students were tested in the curriculum group in one of the two years, as indicated by an "n/a."
78
A curriculum group listing will not appear if no students in the group were tested in either year.
Office of Assessment and Data Analysis
Grade 2 is the locally administered Stanford Achievement Test, 9th ed. (SAT-9); grades 3-10 results are based on the state's FCAT NRT (SAT-9) program.
Norm-Referenced Test Reading Comprehension and Mathematics Results:
READING COMPREHENSION MEDIAN %ILE Std. Curric. ESE
MATHEMATICS MEDIAN %ILE
School LEP All Students
2003 2004Std. Curric. ESE LEP All Students
Median Percentile Scores, by Grade Level and Curriculum Group, for 2003 and 2004, Grades 2-10
Notes: No data are reported when fewer than 10 students in a category were tested, as indicated by an "*."No students were tested in the curriculum group in one of the two years, as indicated by an "n/a."
79
A curriculum group listing will not appear if no students in the group were tested in either year.
Office of Assessment and Data Analysis
Grade 2 is the locally administered Stanford Achievement Test, 9th ed. (SAT-9); grades 3-10 results are based on the state's FCAT NRT (SAT-9) program.
Norm-Referenced Test Reading Comprehension and Mathematics Results:
READING COMPREHENSION MEDIAN %ILE Std. Curric. ESE
MATHEMATICS MEDIAN %ILE
School LEP All Students
2003 2004Std. Curric. ESE LEP All Students
Median Percentile Scores, by Grade Level and Curriculum Group, for 2003 and 2004, Grades 2-10
Notes: No data are reported when fewer than 10 students in a category were tested, as indicated by an "*."No students were tested in the curriculum group in one of the two years, as indicated by an "n/a."
80
A curriculum group listing will not appear if no students in the group were tested in either year.
Office of Assessment and Data Analysis
Grade 2 is the locally administered Stanford Achievement Test, 9th ed. (SAT-9); grades 3-10 results are based on the state's FCAT NRT (SAT-9) program.
Norm-Referenced Test Reading Comprehension and Mathematics Results:
READING COMPREHENSION MEDIAN %ILE Std. Curric. ESE
MATHEMATICS MEDIAN %ILE
School LEP All Students
2003 2004Std. Curric. ESE LEP All Students
Median Percentile Scores, by Grade Level and Curriculum Group, for 2003 and 2004, Grades 2-10
2003 2004 2003 2004 2003 2004 2003 2004 2003 2004 2003 2004 2003 20043781 BARBARA J. HAWKINS ELEMENTARY SCHOOL
Notes: No data are reported when fewer than 10 students in a category were tested, as indicated by an "*."No students were tested in the curriculum group in one of the two years, as indicated by an "n/a."
81
A curriculum group listing will not appear if no students in the group were tested in either year.
Office of Assessment and Data Analysis
Grade 2 is the locally administered Stanford Achievement Test, 9th ed. (SAT-9); grades 3-10 results are based on the state's FCAT NRT (SAT-9) program.
Norm-Referenced Test Reading Comprehension and Mathematics Results:
READING COMPREHENSION MEDIAN %ILE Std. Curric. ESE
MATHEMATICS MEDIAN %ILE
School LEP All Students
2003 2004Std. Curric. ESE LEP All Students
Median Percentile Scores, by Grade Level and Curriculum Group, for 2003 and 2004, Grades 2-10
2003 2004 2003 2004 2003 2004 2003 2004 2003 2004 2003 2004 2003 20043861 NORTH GLADE ELEMENTARY SCHOOL
Notes: No data are reported when fewer than 10 students in a category were tested, as indicated by an "*."No students were tested in the curriculum group in one of the two years, as indicated by an "n/a."
82
A curriculum group listing will not appear if no students in the group were tested in either year.
Office of Assessment and Data Analysis
Grade 2 is the locally administered Stanford Achievement Test, 9th ed. (SAT-9); grades 3-10 results are based on the state's FCAT NRT (SAT-9) program.
Norm-Referenced Test Reading Comprehension and Mathematics Results:
READING COMPREHENSION MEDIAN %ILE Std. Curric. ESE
MATHEMATICS MEDIAN %ILE
School LEP All Students
2003 2004Std. Curric. ESE LEP All Students
Median Percentile Scores, by Grade Level and Curriculum Group, for 2003 and 2004, Grades 2-10
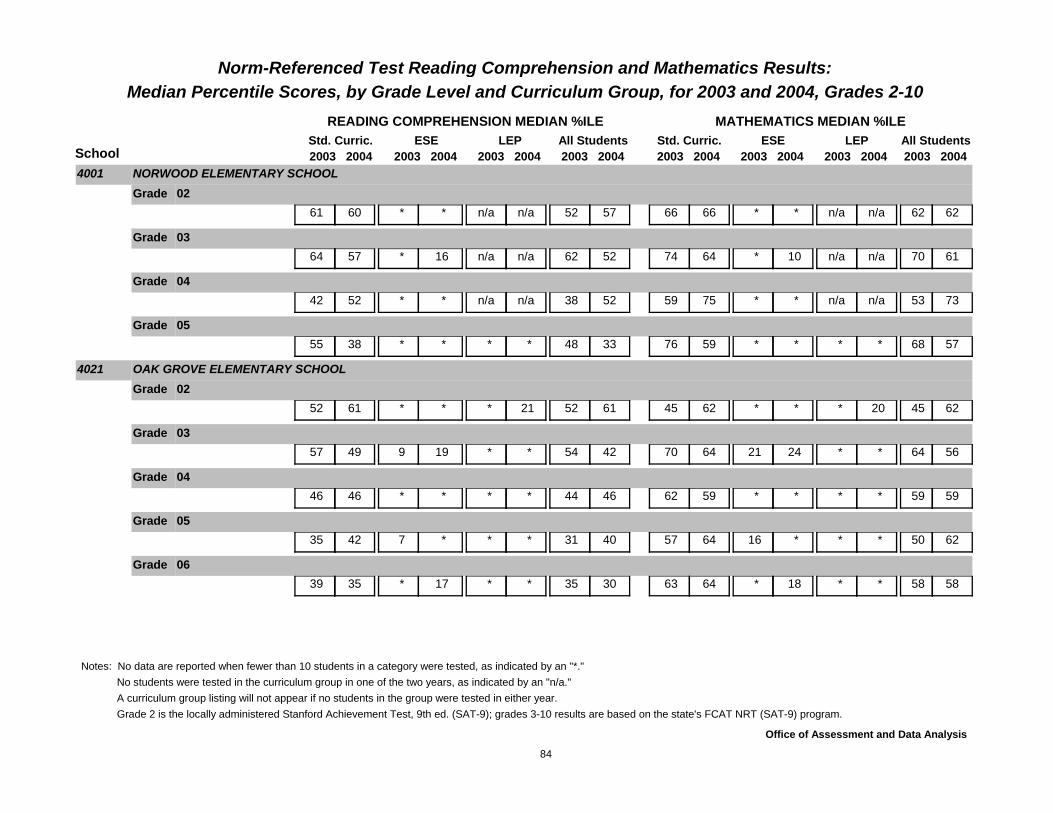
2003 2004 2003 2004 2003 2004 2003 2004 2003 2004 2003 2004 2003 20043941 NORTH MIAMI ELEMENTARY SCHOOL
Notes: No data are reported when fewer than 10 students in a category were tested, as indicated by an "*."No students were tested in the curriculum group in one of the two years, as indicated by an "n/a."
83
A curriculum group listing will not appear if no students in the group were tested in either year.
Office of Assessment and Data Analysis
Grade 2 is the locally administered Stanford Achievement Test, 9th ed. (SAT-9); grades 3-10 results are based on the state's FCAT NRT (SAT-9) program.
Norm-Referenced Test Reading Comprehension and Mathematics Results:
READING COMPREHENSION MEDIAN %ILE Std. Curric. ESE
MATHEMATICS MEDIAN %ILE
School LEP All Students
2003 2004Std. Curric. ESE LEP All Students
Median Percentile Scores, by Grade Level and Curriculum Group, for 2003 and 2004, Grades 2-10
Notes: No data are reported when fewer than 10 students in a category were tested, as indicated by an "*."No students were tested in the curriculum group in one of the two years, as indicated by an "n/a."
84
A curriculum group listing will not appear if no students in the group were tested in either year.
Office of Assessment and Data Analysis
Grade 2 is the locally administered Stanford Achievement Test, 9th ed. (SAT-9); grades 3-10 results are based on the state's FCAT NRT (SAT-9) program.
Norm-Referenced Test Reading Comprehension and Mathematics Results:
READING COMPREHENSION MEDIAN %ILE Std. Curric. ESE
MATHEMATICS MEDIAN %ILE
School LEP All Students
2003 2004Std. Curric. ESE LEP All Students
Median Percentile Scores, by Grade Level and Curriculum Group, for 2003 and 2004, Grades 2-10
Notes: No data are reported when fewer than 10 students in a category were tested, as indicated by an "*."No students were tested in the curriculum group in one of the two years, as indicated by an "n/a."
85
A curriculum group listing will not appear if no students in the group were tested in either year.
Office of Assessment and Data Analysis
Grade 2 is the locally administered Stanford Achievement Test, 9th ed. (SAT-9); grades 3-10 results are based on the state's FCAT NRT (SAT-9) program.
Norm-Referenced Test Reading Comprehension and Mathematics Results:
READING COMPREHENSION MEDIAN %ILE Std. Curric. ESE
MATHEMATICS MEDIAN %ILE
School LEP All Students
2003 2004Std. Curric. ESE LEP All Students
Median Percentile Scores, by Grade Level and Curriculum Group, for 2003 and 2004, Grades 2-10
2003 2004 2003 2004 2003 2004 2003 2004 2003 2004 2003 2004 2003 20044091 OLYMPIA HEIGHTS ELEMENTARY SCHOOL
Notes: No data are reported when fewer than 10 students in a category were tested, as indicated by an "*."No students were tested in the curriculum group in one of the two years, as indicated by an "n/a."
86
A curriculum group listing will not appear if no students in the group were tested in either year.
Office of Assessment and Data Analysis
Grade 2 is the locally administered Stanford Achievement Test, 9th ed. (SAT-9); grades 3-10 results are based on the state's FCAT NRT (SAT-9) program.
Norm-Referenced Test Reading Comprehension and Mathematics Results:
READING COMPREHENSION MEDIAN %ILE Std. Curric. ESE
MATHEMATICS MEDIAN %ILE
School LEP All Students
2003 2004Std. Curric. ESE LEP All Students
Median Percentile Scores, by Grade Level and Curriculum Group, for 2003 and 2004, Grades 2-10
2003 2004 2003 2004 2003 2004 2003 2004 2003 2004 2003 2004 2003 20044171 ORCHARD VILLA ELEMENTARY SCHOOL
Notes: No data are reported when fewer than 10 students in a category were tested, as indicated by an "*."No students were tested in the curriculum group in one of the two years, as indicated by an "n/a."
87
A curriculum group listing will not appear if no students in the group were tested in either year.
Office of Assessment and Data Analysis
Grade 2 is the locally administered Stanford Achievement Test, 9th ed. (SAT-9); grades 3-10 results are based on the state's FCAT NRT (SAT-9) program.
Norm-Referenced Test Reading Comprehension and Mathematics Results:
READING COMPREHENSION MEDIAN %ILE Std. Curric. ESE
MATHEMATICS MEDIAN %ILE
School LEP All Students
2003 2004Std. Curric. ESE LEP All Students
Median Percentile Scores, by Grade Level and Curriculum Group, for 2003 and 2004, Grades 2-10
Notes: No data are reported when fewer than 10 students in a category were tested, as indicated by an "*."No students were tested in the curriculum group in one of the two years, as indicated by an "n/a."
88
A curriculum group listing will not appear if no students in the group were tested in either year.
Office of Assessment and Data Analysis
Grade 2 is the locally administered Stanford Achievement Test, 9th ed. (SAT-9); grades 3-10 results are based on the state's FCAT NRT (SAT-9) program.
Norm-Referenced Test Reading Comprehension and Mathematics Results:
READING COMPREHENSION MEDIAN %ILE Std. Curric. ESE
MATHEMATICS MEDIAN %ILE
School LEP All Students
2003 2004Std. Curric. ESE LEP All Students
Median Percentile Scores, by Grade Level and Curriculum Group, for 2003 and 2004, Grades 2-10
2003 2004 2003 2004 2003 2004 2003 2004 2003 2004 2003 2004 2003 20044281 PALM SPRINGS NORTH ELEMENTARY SCHOOL
Notes: No data are reported when fewer than 10 students in a category were tested, as indicated by an "*."No students were tested in the curriculum group in one of the two years, as indicated by an "n/a."
89
A curriculum group listing will not appear if no students in the group were tested in either year.
Office of Assessment and Data Analysis
Grade 2 is the locally administered Stanford Achievement Test, 9th ed. (SAT-9); grades 3-10 results are based on the state's FCAT NRT (SAT-9) program.
Norm-Referenced Test Reading Comprehension and Mathematics Results:
READING COMPREHENSION MEDIAN %ILE Std. Curric. ESE
MATHEMATICS MEDIAN %ILE
School LEP All Students
2003 2004Std. Curric. ESE LEP All Students
Median Percentile Scores, by Grade Level and Curriculum Group, for 2003 and 2004, Grades 2-10
Notes: No data are reported when fewer than 10 students in a category were tested, as indicated by an "*."No students were tested in the curriculum group in one of the two years, as indicated by an "n/a."
90
A curriculum group listing will not appear if no students in the group were tested in either year.
Office of Assessment and Data Analysis
Grade 2 is the locally administered Stanford Achievement Test, 9th ed. (SAT-9); grades 3-10 results are based on the state's FCAT NRT (SAT-9) program.
Norm-Referenced Test Reading Comprehension and Mathematics Results:
READING COMPREHENSION MEDIAN %ILE Std. Curric. ESE
MATHEMATICS MEDIAN %ILE
School LEP All Students
2003 2004Std. Curric. ESE LEP All Students
Median Percentile Scores, by Grade Level and Curriculum Group, for 2003 and 2004, Grades 2-10
2003 2004 2003 2004 2003 2004 2003 2004 2003 2004 2003 2004 2003 20044391 IRVING AND BEATRICE PESKOE ELEMENTARY SCHOOL
Notes: No data are reported when fewer than 10 students in a category were tested, as indicated by an "*."No students were tested in the curriculum group in one of the two years, as indicated by an "n/a."
91
A curriculum group listing will not appear if no students in the group were tested in either year.
Office of Assessment and Data Analysis
Grade 2 is the locally administered Stanford Achievement Test, 9th ed. (SAT-9); grades 3-10 results are based on the state's FCAT NRT (SAT-9) program.
Norm-Referenced Test Reading Comprehension and Mathematics Results:
READING COMPREHENSION MEDIAN %ILE Std. Curric. ESE
MATHEMATICS MEDIAN %ILE
School LEP All Students
2003 2004Std. Curric. ESE LEP All Students
Median Percentile Scores, by Grade Level and Curriculum Group, for 2003 and 2004, Grades 2-10
Notes: No data are reported when fewer than 10 students in a category were tested, as indicated by an "*."No students were tested in the curriculum group in one of the two years, as indicated by an "n/a."
92
A curriculum group listing will not appear if no students in the group were tested in either year.
Office of Assessment and Data Analysis
Grade 2 is the locally administered Stanford Achievement Test, 9th ed. (SAT-9); grades 3-10 results are based on the state's FCAT NRT (SAT-9) program.
Norm-Referenced Test Reading Comprehension and Mathematics Results:
READING COMPREHENSION MEDIAN %ILE Std. Curric. ESE
MATHEMATICS MEDIAN %ILE
School LEP All Students
2003 2004Std. Curric. ESE LEP All Students
Median Percentile Scores, by Grade Level and Curriculum Group, for 2003 and 2004, Grades 2-10
2003 2004 2003 2004 2003 2004 2003 2004 2003 2004 2003 2004 2003 20044461 PINE VILLA ELEMENTARY SCHOOL
Notes: No data are reported when fewer than 10 students in a category were tested, as indicated by an "*."No students were tested in the curriculum group in one of the two years, as indicated by an "n/a."
93
A curriculum group listing will not appear if no students in the group were tested in either year.
Office of Assessment and Data Analysis
Grade 2 is the locally administered Stanford Achievement Test, 9th ed. (SAT-9); grades 3-10 results are based on the state's FCAT NRT (SAT-9) program.
Norm-Referenced Test Reading Comprehension and Mathematics Results:
READING COMPREHENSION MEDIAN %ILE Std. Curric. ESE
MATHEMATICS MEDIAN %ILE
School LEP All Students
2003 2004Std. Curric. ESE LEP All Students
Median Percentile Scores, by Grade Level and Curriculum Group, for 2003 and 2004, Grades 2-10
2003 2004 2003 2004 2003 2004 2003 2004 2003 2004 2003 2004 2003 20044501 POINCIANA PARK ELEMENTARY SCHOOL
Notes: No data are reported when fewer than 10 students in a category were tested, as indicated by an "*."No students were tested in the curriculum group in one of the two years, as indicated by an "n/a."
94
A curriculum group listing will not appear if no students in the group were tested in either year.
Office of Assessment and Data Analysis
Grade 2 is the locally administered Stanford Achievement Test, 9th ed. (SAT-9); grades 3-10 results are based on the state's FCAT NRT (SAT-9) program.
Norm-Referenced Test Reading Comprehension and Mathematics Results:
READING COMPREHENSION MEDIAN %ILE Std. Curric. ESE
MATHEMATICS MEDIAN %ILE
School LEP All Students
2003 2004Std. Curric. ESE LEP All Students
Median Percentile Scores, by Grade Level and Curriculum Group, for 2003 and 2004, Grades 2-10
2003 2004 2003 2004 2003 2004 2003 2004 2003 2004 2003 2004 2003 20044541 RAINBOW PARK ELEMENTARY SCHOOL
Notes: No data are reported when fewer than 10 students in a category were tested, as indicated by an "*."No students were tested in the curriculum group in one of the two years, as indicated by an "n/a."
95
A curriculum group listing will not appear if no students in the group were tested in either year.
Office of Assessment and Data Analysis
Grade 2 is the locally administered Stanford Achievement Test, 9th ed. (SAT-9); grades 3-10 results are based on the state's FCAT NRT (SAT-9) program.
Norm-Referenced Test Reading Comprehension and Mathematics Results:
READING COMPREHENSION MEDIAN %ILE Std. Curric. ESE
MATHEMATICS MEDIAN %ILE
School LEP All Students
2003 2004Std. Curric. ESE LEP All Students
Median Percentile Scores, by Grade Level and Curriculum Group, for 2003 and 2004, Grades 2-10
Notes: No data are reported when fewer than 10 students in a category were tested, as indicated by an "*."No students were tested in the curriculum group in one of the two years, as indicated by an "n/a."
96
A curriculum group listing will not appear if no students in the group were tested in either year.
Office of Assessment and Data Analysis
Grade 2 is the locally administered Stanford Achievement Test, 9th ed. (SAT-9); grades 3-10 results are based on the state's FCAT NRT (SAT-9) program.
Norm-Referenced Test Reading Comprehension and Mathematics Results:
READING COMPREHENSION MEDIAN %ILE Std. Curric. ESE
MATHEMATICS MEDIAN %ILE
School LEP All Students
2003 2004Std. Curric. ESE LEP All Students
Median Percentile Scores, by Grade Level and Curriculum Group, for 2003 and 2004, Grades 2-10
Notes: No data are reported when fewer than 10 students in a category were tested, as indicated by an "*."No students were tested in the curriculum group in one of the two years, as indicated by an "n/a."
97
A curriculum group listing will not appear if no students in the group were tested in either year.
Office of Assessment and Data Analysis
Grade 2 is the locally administered Stanford Achievement Test, 9th ed. (SAT-9); grades 3-10 results are based on the state's FCAT NRT (SAT-9) program.
Norm-Referenced Test Reading Comprehension and Mathematics Results:
READING COMPREHENSION MEDIAN %ILE Std. Curric. ESE
MATHEMATICS MEDIAN %ILE
School LEP All Students
2003 2004Std. Curric. ESE LEP All Students
Median Percentile Scores, by Grade Level and Curriculum Group, for 2003 and 2004, Grades 2-10
2003 2004 2003 2004 2003 2004 2003 2004 2003 2004 2003 2004 2003 20044691 JANE S. ROBERTS K-8 CENTER
Notes: No data are reported when fewer than 10 students in a category were tested, as indicated by an "*."No students were tested in the curriculum group in one of the two years, as indicated by an "n/a."
98
A curriculum group listing will not appear if no students in the group were tested in either year.
Office of Assessment and Data Analysis
Grade 2 is the locally administered Stanford Achievement Test, 9th ed. (SAT-9); grades 3-10 results are based on the state's FCAT NRT (SAT-9) program.
Norm-Referenced Test Reading Comprehension and Mathematics Results:
READING COMPREHENSION MEDIAN %ILE Std. Curric. ESE
MATHEMATICS MEDIAN %ILE
School LEP All Students
2003 2004Std. Curric. ESE LEP All Students
Median Percentile Scores, by Grade Level and Curriculum Group, for 2003 and 2004, Grades 2-10
Notes: No data are reported when fewer than 10 students in a category were tested, as indicated by an "*."No students were tested in the curriculum group in one of the two years, as indicated by an "n/a."
99
A curriculum group listing will not appear if no students in the group were tested in either year.
Office of Assessment and Data Analysis
Grade 2 is the locally administered Stanford Achievement Test, 9th ed. (SAT-9); grades 3-10 results are based on the state's FCAT NRT (SAT-9) program.
Norm-Referenced Test Reading Comprehension and Mathematics Results:
READING COMPREHENSION MEDIAN %ILE Std. Curric. ESE
MATHEMATICS MEDIAN %ILE
School LEP All Students
2003 2004Std. Curric. ESE LEP All Students
Median Percentile Scores, by Grade Level and Curriculum Group, for 2003 and 2004, Grades 2-10
2003 2004 2003 2004 2003 2004 2003 2004 2003 2004 2003 2004 2003 20044761 ROYAL PALM ELEMENTARY SCHOOL
Notes: No data are reported when fewer than 10 students in a category were tested, as indicated by an "*."No students were tested in the curriculum group in one of the two years, as indicated by an "n/a."
100
A curriculum group listing will not appear if no students in the group were tested in either year.
Office of Assessment and Data Analysis
Grade 2 is the locally administered Stanford Achievement Test, 9th ed. (SAT-9); grades 3-10 results are based on the state's FCAT NRT (SAT-9) program.
Norm-Referenced Test Reading Comprehension and Mathematics Results:
READING COMPREHENSION MEDIAN %ILE Std. Curric. ESE
MATHEMATICS MEDIAN %ILE
School LEP All Students
2003 2004Std. Curric. ESE LEP All Students
Median Percentile Scores, by Grade Level and Curriculum Group, for 2003 and 2004, Grades 2-10
2003 2004 2003 2004 2003 2004 2003 2004 2003 2004 2003 2004 2003 20044841 SANTA CLARA ELEMENTARY SCHOOL
Notes: No data are reported when fewer than 10 students in a category were tested, as indicated by an "*."No students were tested in the curriculum group in one of the two years, as indicated by an "n/a."
101
A curriculum group listing will not appear if no students in the group were tested in either year.
Office of Assessment and Data Analysis
Grade 2 is the locally administered Stanford Achievement Test, 9th ed. (SAT-9); grades 3-10 results are based on the state's FCAT NRT (SAT-9) program.
Norm-Referenced Test Reading Comprehension and Mathematics Results:
READING COMPREHENSION MEDIAN %ILE Std. Curric. ESE
MATHEMATICS MEDIAN %ILE
School LEP All Students
2003 2004Std. Curric. ESE LEP All Students
Median Percentile Scores, by Grade Level and Curriculum Group, for 2003 and 2004, Grades 2-10
Notes: No data are reported when fewer than 10 students in a category were tested, as indicated by an "*."No students were tested in the curriculum group in one of the two years, as indicated by an "n/a."
102
A curriculum group listing will not appear if no students in the group were tested in either year.
Office of Assessment and Data Analysis
Grade 2 is the locally administered Stanford Achievement Test, 9th ed. (SAT-9); grades 3-10 results are based on the state's FCAT NRT (SAT-9) program.
Norm-Referenced Test Reading Comprehension and Mathematics Results:
READING COMPREHENSION MEDIAN %ILE Std. Curric. ESE
MATHEMATICS MEDIAN %ILE
School LEP All Students
2003 2004Std. Curric. ESE LEP All Students
Median Percentile Scores, by Grade Level and Curriculum Group, for 2003 and 2004, Grades 2-10
Notes: No data are reported when fewer than 10 students in a category were tested, as indicated by an "*."No students were tested in the curriculum group in one of the two years, as indicated by an "n/a."
103
A curriculum group listing will not appear if no students in the group were tested in either year.
Office of Assessment and Data Analysis
Grade 2 is the locally administered Stanford Achievement Test, 9th ed. (SAT-9); grades 3-10 results are based on the state's FCAT NRT (SAT-9) program.
Norm-Referenced Test Reading Comprehension and Mathematics Results:
READING COMPREHENSION MEDIAN %ILE Std. Curric. ESE
MATHEMATICS MEDIAN %ILE
School LEP All Students
2003 2004Std. Curric. ESE LEP All Students
Median Percentile Scores, by Grade Level and Curriculum Group, for 2003 and 2004, Grades 2-10
Notes: No data are reported when fewer than 10 students in a category were tested, as indicated by an "*."No students were tested in the curriculum group in one of the two years, as indicated by an "n/a."
104
A curriculum group listing will not appear if no students in the group were tested in either year.
Office of Assessment and Data Analysis
Grade 2 is the locally administered Stanford Achievement Test, 9th ed. (SAT-9); grades 3-10 results are based on the state's FCAT NRT (SAT-9) program.
Norm-Referenced Test Reading Comprehension and Mathematics Results:
READING COMPREHENSION MEDIAN %ILE Std. Curric. ESE
MATHEMATICS MEDIAN %ILE
School LEP All Students
2003 2004Std. Curric. ESE LEP All Students
Median Percentile Scores, by Grade Level and Curriculum Group, for 2003 and 2004, Grades 2-10
2003 2004 2003 2004 2003 2004 2003 2004 2003 2004 2003 2004 2003 20045061 DR. CARLOS J. FINLAY ELEMENTARY SCHOOL
Notes: No data are reported when fewer than 10 students in a category were tested, as indicated by an "*."No students were tested in the curriculum group in one of the two years, as indicated by an "n/a."
105
A curriculum group listing will not appear if no students in the group were tested in either year.
Office of Assessment and Data Analysis
Grade 2 is the locally administered Stanford Achievement Test, 9th ed. (SAT-9); grades 3-10 results are based on the state's FCAT NRT (SAT-9) program.
Norm-Referenced Test Reading Comprehension and Mathematics Results:
READING COMPREHENSION MEDIAN %ILE Std. Curric. ESE
MATHEMATICS MEDIAN %ILE
School LEP All Students
2003 2004Std. Curric. ESE LEP All Students
Median Percentile Scores, by Grade Level and Curriculum Group, for 2003 and 2004, Grades 2-10
2003 2004 2003 2004 2003 2004 2003 2004 2003 2004 2003 2004 2003 20045091 SOUTH POINTE ELEMENTARY SCHOOL
Notes: No data are reported when fewer than 10 students in a category were tested, as indicated by an "*."No students were tested in the curriculum group in one of the two years, as indicated by an "n/a."
106
A curriculum group listing will not appear if no students in the group were tested in either year.
Office of Assessment and Data Analysis
Grade 2 is the locally administered Stanford Achievement Test, 9th ed. (SAT-9); grades 3-10 results are based on the state's FCAT NRT (SAT-9) program.
Norm-Referenced Test Reading Comprehension and Mathematics Results:
READING COMPREHENSION MEDIAN %ILE Std. Curric. ESE
MATHEMATICS MEDIAN %ILE
School LEP All Students
2003 2004Std. Curric. ESE LEP All Students
Median Percentile Scores, by Grade Level and Curriculum Group, for 2003 and 2004, Grades 2-10
2003 2004 2003 2004 2003 2004 2003 2004 2003 2004 2003 2004 2003 20045121 SNAPPER CREEK ELEMENTARY SCHOOL
Notes: No data are reported when fewer than 10 students in a category were tested, as indicated by an "*."No students were tested in the curriculum group in one of the two years, as indicated by an "n/a."
107
A curriculum group listing will not appear if no students in the group were tested in either year.
Office of Assessment and Data Analysis
Grade 2 is the locally administered Stanford Achievement Test, 9th ed. (SAT-9); grades 3-10 results are based on the state's FCAT NRT (SAT-9) program.
Norm-Referenced Test Reading Comprehension and Mathematics Results:
READING COMPREHENSION MEDIAN %ILE Std. Curric. ESE
MATHEMATICS MEDIAN %ILE
School LEP All Students
2003 2004Std. Curric. ESE LEP All Students
Median Percentile Scores, by Grade Level and Curriculum Group, for 2003 and 2004, Grades 2-10
2003 2004 2003 2004 2003 2004 2003 2004 2003 2004 2003 2004 2003 20045131 NORTH DADE CENTER FOR MODERN LANGUAGES
Notes: No data are reported when fewer than 10 students in a category were tested, as indicated by an "*."No students were tested in the curriculum group in one of the two years, as indicated by an "n/a."
108
A curriculum group listing will not appear if no students in the group were tested in either year.
Office of Assessment and Data Analysis
Grade 2 is the locally administered Stanford Achievement Test, 9th ed. (SAT-9); grades 3-10 results are based on the state's FCAT NRT (SAT-9) program.
Norm-Referenced Test Reading Comprehension and Mathematics Results:
READING COMPREHENSION MEDIAN %ILE Std. Curric. ESE
MATHEMATICS MEDIAN %ILE
School LEP All Students
2003 2004Std. Curric. ESE LEP All Students
Median Percentile Scores, by Grade Level and Curriculum Group, for 2003 and 2004, Grades 2-10
2003 2004 2003 2004 2003 2004 2003 2004 2003 2004 2003 2004 2003 20045201 SOUTH HIALEAH ELEMENTARY SCHOOL
Notes: No data are reported when fewer than 10 students in a category were tested, as indicated by an "*."No students were tested in the curriculum group in one of the two years, as indicated by an "n/a."
109
A curriculum group listing will not appear if no students in the group were tested in either year.
Office of Assessment and Data Analysis
Grade 2 is the locally administered Stanford Achievement Test, 9th ed. (SAT-9); grades 3-10 results are based on the state's FCAT NRT (SAT-9) program.
Norm-Referenced Test Reading Comprehension and Mathematics Results:
READING COMPREHENSION MEDIAN %ILE Std. Curric. ESE
MATHEMATICS MEDIAN %ILE
School LEP All Students
2003 2004Std. Curric. ESE LEP All Students
Median Percentile Scores, by Grade Level and Curriculum Group, for 2003 and 2004, Grades 2-10
2003 2004 2003 2004 2003 2004 2003 2004 2003 2004 2003 2004 2003 20045281 SOUTH MIAMI HEIGHTS ELEMENTARY SCHOOL
Notes: No data are reported when fewer than 10 students in a category were tested, as indicated by an "*."No students were tested in the curriculum group in one of the two years, as indicated by an "n/a."
110
A curriculum group listing will not appear if no students in the group were tested in either year.
Office of Assessment and Data Analysis
Grade 2 is the locally administered Stanford Achievement Test, 9th ed. (SAT-9); grades 3-10 results are based on the state's FCAT NRT (SAT-9) program.
Norm-Referenced Test Reading Comprehension and Mathematics Results:
READING COMPREHENSION MEDIAN %ILE Std. Curric. ESE
MATHEMATICS MEDIAN %ILE
School LEP All Students
2003 2004Std. Curric. ESE LEP All Students
Median Percentile Scores, by Grade Level and Curriculum Group, for 2003 and 2004, Grades 2-10
Notes: No data are reported when fewer than 10 students in a category were tested, as indicated by an "*."No students were tested in the curriculum group in one of the two years, as indicated by an "n/a."
111
A curriculum group listing will not appear if no students in the group were tested in either year.
Office of Assessment and Data Analysis
Grade 2 is the locally administered Stanford Achievement Test, 9th ed. (SAT-9); grades 3-10 results are based on the state's FCAT NRT (SAT-9) program.
Norm-Referenced Test Reading Comprehension and Mathematics Results:
READING COMPREHENSION MEDIAN %ILE Std. Curric. ESE
MATHEMATICS MEDIAN %ILE
School LEP All Students
2003 2004Std. Curric. ESE LEP All Students
Median Percentile Scores, by Grade Level and Curriculum Group, for 2003 and 2004, Grades 2-10
Notes: No data are reported when fewer than 10 students in a category were tested, as indicated by an "*."No students were tested in the curriculum group in one of the two years, as indicated by an "n/a."
112
A curriculum group listing will not appear if no students in the group were tested in either year.
Office of Assessment and Data Analysis
Grade 2 is the locally administered Stanford Achievement Test, 9th ed. (SAT-9); grades 3-10 results are based on the state's FCAT NRT (SAT-9) program.
Norm-Referenced Test Reading Comprehension and Mathematics Results:
READING COMPREHENSION MEDIAN %ILE Std. Curric. ESE
MATHEMATICS MEDIAN %ILE
School LEP All Students
2003 2004Std. Curric. ESE LEP All Students
Median Percentile Scores, by Grade Level and Curriculum Group, for 2003 and 2004, Grades 2-10
Notes: No data are reported when fewer than 10 students in a category were tested, as indicated by an "*."No students were tested in the curriculum group in one of the two years, as indicated by an "n/a."
113
A curriculum group listing will not appear if no students in the group were tested in either year.
Office of Assessment and Data Analysis
Grade 2 is the locally administered Stanford Achievement Test, 9th ed. (SAT-9); grades 3-10 results are based on the state's FCAT NRT (SAT-9) program.
Norm-Referenced Test Reading Comprehension and Mathematics Results:
READING COMPREHENSION MEDIAN %ILE Std. Curric. ESE
MATHEMATICS MEDIAN %ILE
School LEP All Students
2003 2004Std. Curric. ESE LEP All Students
Median Percentile Scores, by Grade Level and Curriculum Group, for 2003 and 2004, Grades 2-10
2003 2004 2003 2004 2003 2004 2003 2004 2003 2004 2003 2004 2003 20045481 TREASURE ISLAND ELEMENTARY SCHOOL
Notes: No data are reported when fewer than 10 students in a category were tested, as indicated by an "*."No students were tested in the curriculum group in one of the two years, as indicated by an "n/a."
114
A curriculum group listing will not appear if no students in the group were tested in either year.
Office of Assessment and Data Analysis
Grade 2 is the locally administered Stanford Achievement Test, 9th ed. (SAT-9); grades 3-10 results are based on the state's FCAT NRT (SAT-9) program.
Norm-Referenced Test Reading Comprehension and Mathematics Results:
READING COMPREHENSION MEDIAN %ILE Std. Curric. ESE
MATHEMATICS MEDIAN %ILE
School LEP All Students
2003 2004Std. Curric. ESE LEP All Students
Median Percentile Scores, by Grade Level and Curriculum Group, for 2003 and 2004, Grades 2-10
2003 2004 2003 2004 2003 2004 2003 2004 2003 2004 2003 2004 2003 20045561 FRANCES S. TUCKER ELEMENTARY SCHOOL
Notes: No data are reported when fewer than 10 students in a category were tested, as indicated by an "*."No students were tested in the curriculum group in one of the two years, as indicated by an "n/a."
115
A curriculum group listing will not appear if no students in the group were tested in either year.
Office of Assessment and Data Analysis
Grade 2 is the locally administered Stanford Achievement Test, 9th ed. (SAT-9); grades 3-10 results are based on the state's FCAT NRT (SAT-9) program.
Norm-Referenced Test Reading Comprehension and Mathematics Results:
READING COMPREHENSION MEDIAN %ILE Std. Curric. ESE
MATHEMATICS MEDIAN %ILE
School LEP All Students
2003 2004Std. Curric. ESE LEP All Students
Median Percentile Scores, by Grade Level and Curriculum Group, for 2003 and 2004, Grades 2-10
2003 2004 2003 2004 2003 2004 2003 2004 2003 2004 2003 2004 2003 20045641 VILLAGE GREEN ELEMENTARY SCHOOL
Notes: No data are reported when fewer than 10 students in a category were tested, as indicated by an "*."No students were tested in the curriculum group in one of the two years, as indicated by an "n/a."
116
A curriculum group listing will not appear if no students in the group were tested in either year.
Office of Assessment and Data Analysis
Grade 2 is the locally administered Stanford Achievement Test, 9th ed. (SAT-9); grades 3-10 results are based on the state's FCAT NRT (SAT-9) program.
Norm-Referenced Test Reading Comprehension and Mathematics Results:
READING COMPREHENSION MEDIAN %ILE Std. Curric. ESE
MATHEMATICS MEDIAN %ILE
School LEP All Students
2003 2004Std. Curric. ESE LEP All Students
Median Percentile Scores, by Grade Level and Curriculum Group, for 2003 and 2004, Grades 2-10
2003 2004 2003 2004 2003 2004 2003 2004 2003 2004 2003 2004 2003 20045711 MAE M. WALTERS ELEMENTARY SCHOOL
Notes: No data are reported when fewer than 10 students in a category were tested, as indicated by an "*."No students were tested in the curriculum group in one of the two years, as indicated by an "n/a."
117
A curriculum group listing will not appear if no students in the group were tested in either year.
Office of Assessment and Data Analysis
Grade 2 is the locally administered Stanford Achievement Test, 9th ed. (SAT-9); grades 3-10 results are based on the state's FCAT NRT (SAT-9) program.
Norm-Referenced Test Reading Comprehension and Mathematics Results:
READING COMPREHENSION MEDIAN %ILE Std. Curric. ESE
MATHEMATICS MEDIAN %ILE
School LEP All Students
2003 2004Std. Curric. ESE LEP All Students
Median Percentile Scores, by Grade Level and Curriculum Group, for 2003 and 2004, Grades 2-10
2003 2004 2003 2004 2003 2004 2003 2004 2003 2004 2003 2004 2003 20045831 WEST LABORATORY ELEMENTARY SCHOOL
Notes: No data are reported when fewer than 10 students in a category were tested, as indicated by an "*."No students were tested in the curriculum group in one of the two years, as indicated by an "n/a."
118
A curriculum group listing will not appear if no students in the group were tested in either year.
Office of Assessment and Data Analysis
Grade 2 is the locally administered Stanford Achievement Test, 9th ed. (SAT-9); grades 3-10 results are based on the state's FCAT NRT (SAT-9) program.
Norm-Referenced Test Reading Comprehension and Mathematics Results:
READING COMPREHENSION MEDIAN %ILE Std. Curric. ESE
MATHEMATICS MEDIAN %ILE
School LEP All Students
2003 2004Std. Curric. ESE LEP All Students
Median Percentile Scores, by Grade Level and Curriculum Group, for 2003 and 2004, Grades 2-10
Notes: No data are reported when fewer than 10 students in a category were tested, as indicated by an "*."No students were tested in the curriculum group in one of the two years, as indicated by an "n/a."
119
A curriculum group listing will not appear if no students in the group were tested in either year.
Office of Assessment and Data Analysis
Grade 2 is the locally administered Stanford Achievement Test, 9th ed. (SAT-9); grades 3-10 results are based on the state's FCAT NRT (SAT-9) program.
Norm-Referenced Test Reading Comprehension and Mathematics Results:
READING COMPREHENSION MEDIAN %ILE Std. Curric. ESE
MATHEMATICS MEDIAN %ILE
School LEP All Students
2003 2004Std. Curric. ESE LEP All Students
Median Percentile Scores, by Grade Level and Curriculum Group, for 2003 and 2004, Grades 2-10
Notes: No data are reported when fewer than 10 students in a category were tested, as indicated by an "*."No students were tested in the curriculum group in one of the two years, as indicated by an "n/a."
120
A curriculum group listing will not appear if no students in the group were tested in either year.
Office of Assessment and Data Analysis
Grade 2 is the locally administered Stanford Achievement Test, 9th ed. (SAT-9); grades 3-10 results are based on the state's FCAT NRT (SAT-9) program.
Norm-Referenced Test Reading Comprehension and Mathematics Results:
READING COMPREHENSION MEDIAN %ILE Std. Curric. ESE
MATHEMATICS MEDIAN %ILE
School LEP All Students
2003 2004Std. Curric. ESE LEP All Students
Median Percentile Scores, by Grade Level and Curriculum Group, for 2003 and 2004, Grades 2-10
2003 2004 2003 2004 2003 2004 2003 2004 2003 2004 2003 2004 2003 20045971 NATHAN B. YOUNG ELEMENTARY SCHOOL
Notes: No data are reported when fewer than 10 students in a category were tested, as indicated by an "*."No students were tested in the curriculum group in one of the two years, as indicated by an "n/a."
121
A curriculum group listing will not appear if no students in the group were tested in either year.
Office of Assessment and Data Analysis
Grade 2 is the locally administered Stanford Achievement Test, 9th ed. (SAT-9); grades 3-10 results are based on the state's FCAT NRT (SAT-9) program.
Norm-Referenced Test Reading Comprehension and Mathematics Results:
READING COMPREHENSION MEDIAN %ILE Std. Curric. ESE
MATHEMATICS MEDIAN %ILE
School LEP All Students
2003 2004Std. Curric. ESE LEP All Students
Median Percentile Scores, by Grade Level and Curriculum Group, for 2003 and 2004, Grades 2-10
2003 2004 2003 2004 2003 2004 2003 2004 2003 2004 2003 2004 2003 20045991 CHARLES DAVID WYCHE JR. ELEMENTARY SCHOOL
Notes: No data are reported when fewer than 10 students in a category were tested, as indicated by an "*."No students were tested in the curriculum group in one of the two years, as indicated by an "n/a."
122
A curriculum group listing will not appear if no students in the group were tested in either year.
Office of Assessment and Data Analysis
Grade 2 is the locally administered Stanford Achievement Test, 9th ed. (SAT-9); grades 3-10 results are based on the state's FCAT NRT (SAT-9) program.
Norm-Referenced Test Reading Comprehension and Mathematics Results:
READING COMPREHENSION MEDIAN %ILE Std. Curric. ESE
MATHEMATICS MEDIAN %ILE
School LEP All Students
2003 2004Std. Curric. ESE LEP All Students
Median Percentile Scores, by Grade Level and Curriculum Group, for 2003 and 2004, Grades 2-10
2003 2004 2003 2004 2003 2004 2003 2004 2003 2004 2003 2004 2003 20046010 FLORIDA INTERNATIONAL ACADEMY
Notes: No data are reported when fewer than 10 students in a category were tested, as indicated by an "*."No students were tested in the curriculum group in one of the two years, as indicated by an "n/a."
123
A curriculum group listing will not appear if no students in the group were tested in either year.
Office of Assessment and Data Analysis
Grade 2 is the locally administered Stanford Achievement Test, 9th ed. (SAT-9); grades 3-10 results are based on the state's FCAT NRT (SAT-9) program.
Norm-Referenced Test Reading Comprehension and Mathematics Results:
READING COMPREHENSION MEDIAN %ILE Std. Curric. ESE
MATHEMATICS MEDIAN %ILE
School LEP All Students
2003 2004Std. Curric. ESE LEP All Students
Median Percentile Scores, by Grade Level and Curriculum Group, for 2003 and 2004, Grades 2-10
2003 2004 2003 2004 2003 2004 2003 2004 2003 2004 2003 2004 2003 20046020 ASPIRA YOUTH LEADERSHIP CHARTER SCHOOL
Notes: No data are reported when fewer than 10 students in a category were tested, as indicated by an "*."No students were tested in the curriculum group in one of the two years, as indicated by an "n/a."
124
A curriculum group listing will not appear if no students in the group were tested in either year.
Office of Assessment and Data Analysis
Grade 2 is the locally administered Stanford Achievement Test, 9th ed. (SAT-9); grades 3-10 results are based on the state's FCAT NRT (SAT-9) program.
Norm-Referenced Test Reading Comprehension and Mathematics Results:
READING COMPREHENSION MEDIAN %ILE Std. Curric. ESE
MATHEMATICS MEDIAN %ILE
School LEP All Students
2003 2004Std. Curric. ESE LEP All Students
Median Percentile Scores, by Grade Level and Curriculum Group, for 2003 and 2004, Grades 2-10
Notes: No data are reported when fewer than 10 students in a category were tested, as indicated by an "*."No students were tested in the curriculum group in one of the two years, as indicated by an "n/a."
125
A curriculum group listing will not appear if no students in the group were tested in either year.
Office of Assessment and Data Analysis
Grade 2 is the locally administered Stanford Achievement Test, 9th ed. (SAT-9); grades 3-10 results are based on the state's FCAT NRT (SAT-9) program.
Norm-Referenced Test Reading Comprehension and Mathematics Results:
READING COMPREHENSION MEDIAN %ILE Std. Curric. ESE
MATHEMATICS MEDIAN %ILE
School LEP All Students
2003 2004Std. Curric. ESE LEP All Students
Median Percentile Scores, by Grade Level and Curriculum Group, for 2003 and 2004, Grades 2-10
2003 2004 2003 2004 2003 2004 2003 2004 2003 2004 2003 2004 2003 20046040 MIAMI SHORES/BARRY UNIVERSITY CONNECTED LEARNING CENTER
Notes: No data are reported when fewer than 10 students in a category were tested, as indicated by an "*."No students were tested in the curriculum group in one of the two years, as indicated by an "n/a."
126
A curriculum group listing will not appear if no students in the group were tested in either year.
Office of Assessment and Data Analysis
Grade 2 is the locally administered Stanford Achievement Test, 9th ed. (SAT-9); grades 3-10 results are based on the state's FCAT NRT (SAT-9) program.
Norm-Referenced Test Reading Comprehension and Mathematics Results:
READING COMPREHENSION MEDIAN %ILE Std. Curric. ESE
MATHEMATICS MEDIAN %ILE
School LEP All Students
2003 2004Std. Curric. ESE LEP All Students
Median Percentile Scores, by Grade Level and Curriculum Group, for 2003 and 2004, Grades 2-10
2003 2004 2003 2004 2003 2004 2003 2004 2003 2004 2003 2004 2003 20046050 YOUTH CO-OP CHARTER SCHOOL
Grade 05 * n/a * n/a 48 n /a 51 n /a * n/a * n/a 57 n /a 57 n /a
Grade 06 * n/a * n/a 61 n /a 64 n /a * n/a * n/a 70 n /a 75 n /a
Grade 07 * n/a n/a n/a 66 n /a 66 n /a * n/a n/a n/a 76 n /a 76 n /a
Grade 08 * n/a n/a n/a 59 n /a 59 n /a * n/a n/a n/a 75 n /a 77 n /a
Notes: No data are reported when fewer than 10 students in a category were tested, as indicated by an "*."No students were tested in the curriculum group in one of the two years, as indicated by an "n/a."
127
A curriculum group listing will not appear if no students in the group were tested in either year.
Office of Assessment and Data Analysis
Grade 2 is the locally administered Stanford Achievement Test, 9th ed. (SAT-9); grades 3-10 results are based on the state's FCAT NRT (SAT-9) program.
Norm-Referenced Test Reading Comprehension and Mathematics Results:
READING COMPREHENSION MEDIAN %ILE Std. Curric. ESE
MATHEMATICS MEDIAN %ILE
School LEP All Students
2003 2004Std. Curric. ESE LEP All Students
Median Percentile Scores, by Grade Level and Curriculum Group, for 2003 and 2004, Grades 2-10
2003 2004 2003 2004 2003 2004 2003 2004 2003 2004 2003 2004 2003 20046060 ASPIRA SOUTH YOUTH LEADERSHIP CHARTER SCHOOL
Notes: No data are reported when fewer than 10 students in a category were tested, as indicated by an "*."No students were tested in the curriculum group in one of the two years, as indicated by an "n/a."
128
A curriculum group listing will not appear if no students in the group were tested in either year.
Office of Assessment and Data Analysis
Grade 2 is the locally administered Stanford Achievement Test, 9th ed. (SAT-9); grades 3-10 results are based on the state's FCAT NRT (SAT-9) program.
Norm-Referenced Test Reading Comprehension and Mathematics Results:
READING COMPREHENSION MEDIAN %ILE Std. Curric. ESE
MATHEMATICS MEDIAN %ILE
School LEP All Students
2003 2004Std. Curric. ESE LEP All Students
Median Percentile Scores, by Grade Level and Curriculum Group, for 2003 and 2004, Grades 2-10
2003 2004 2003 2004 2003 2004 2003 2004 2003 2004 2003 2004 2003 20046071 GEORGE WASHINGTON CARVER MIDDLE SCHOOL
Notes: No data are reported when fewer than 10 students in a category were tested, as indicated by an "*."No students were tested in the curriculum group in one of the two years, as indicated by an "n/a."
129
A curriculum group listing will not appear if no students in the group were tested in either year.
Office of Assessment and Data Analysis
Grade 2 is the locally administered Stanford Achievement Test, 9th ed. (SAT-9); grades 3-10 results are based on the state's FCAT NRT (SAT-9) program.
Norm-Referenced Test Reading Comprehension and Mathematics Results:
READING COMPREHENSION MEDIAN %ILE Std. Curric. ESE
MATHEMATICS MEDIAN %ILE
School LEP All Students
2003 2004Std. Curric. ESE LEP All Students
Median Percentile Scores, by Grade Level and Curriculum Group, for 2003 and 2004, Grades 2-10
Notes: No data are reported when fewer than 10 students in a category were tested, as indicated by an "*."No students were tested in the curriculum group in one of the two years, as indicated by an "n/a."
130
A curriculum group listing will not appear if no students in the group were tested in either year.
Office of Assessment and Data Analysis
Grade 2 is the locally administered Stanford Achievement Test, 9th ed. (SAT-9); grades 3-10 results are based on the state's FCAT NRT (SAT-9) program.
Norm-Referenced Test Reading Comprehension and Mathematics Results:
READING COMPREHENSION MEDIAN %ILE Std. Curric. ESE
MATHEMATICS MEDIAN %ILE
School LEP All Students
2003 2004Std. Curric. ESE LEP All Students
Median Percentile Scores, by Grade Level and Curriculum Group, for 2003 and 2004, Grades 2-10
2003 2004 2003 2004 2003 2004 2003 2004 2003 2004 2003 2004 2003 20046141 CHARLES R. DREW MIDDLE SCHOOL
Notes: No data are reported when fewer than 10 students in a category were tested, as indicated by an "*."No students were tested in the curriculum group in one of the two years, as indicated by an "n/a."
131
A curriculum group listing will not appear if no students in the group were tested in either year.
Office of Assessment and Data Analysis
Grade 2 is the locally administered Stanford Achievement Test, 9th ed. (SAT-9); grades 3-10 results are based on the state's FCAT NRT (SAT-9) program.
Norm-Referenced Test Reading Comprehension and Mathematics Results:
READING COMPREHENSION MEDIAN %ILE Std. Curric. ESE
MATHEMATICS MEDIAN %ILE
School LEP All Students
2003 2004Std. Curric. ESE LEP All Students
Median Percentile Scores, by Grade Level and Curriculum Group, for 2003 and 2004, Grades 2-10
2003 2004 2003 2004 2003 2004 2003 2004 2003 2004 2003 2004 2003 20046171 HENRY H. FILER MIDDLE SCHOOL
Notes: No data are reported when fewer than 10 students in a category were tested, as indicated by an "*."No students were tested in the curriculum group in one of the two years, as indicated by an "n/a."
132
A curriculum group listing will not appear if no students in the group were tested in either year.
Office of Assessment and Data Analysis
Grade 2 is the locally administered Stanford Achievement Test, 9th ed. (SAT-9); grades 3-10 results are based on the state's FCAT NRT (SAT-9) program.
Norm-Referenced Test Reading Comprehension and Mathematics Results:
READING COMPREHENSION MEDIAN %ILE Std. Curric. ESE
MATHEMATICS MEDIAN %ILE
School LEP All Students
2003 2004Std. Curric. ESE LEP All Students
Median Percentile Scores, by Grade Level and Curriculum Group, for 2003 and 2004, Grades 2-10
Notes: No data are reported when fewer than 10 students in a category were tested, as indicated by an "*."No students were tested in the curriculum group in one of the two years, as indicated by an "n/a."
133
A curriculum group listing will not appear if no students in the group were tested in either year.
Office of Assessment and Data Analysis
Grade 2 is the locally administered Stanford Achievement Test, 9th ed. (SAT-9); grades 3-10 results are based on the state's FCAT NRT (SAT-9) program.
Norm-Referenced Test Reading Comprehension and Mathematics Results:
READING COMPREHENSION MEDIAN %ILE Std. Curric. ESE
MATHEMATICS MEDIAN %ILE
School LEP All Students
2003 2004Std. Curric. ESE LEP All Students
Median Percentile Scores, by Grade Level and Curriculum Group, for 2003 and 2004, Grades 2-10
2003 2004 2003 2004 2003 2004 2003 2004 2003 2004 2003 2004 2003 20046281 THOMAS JEFFERSON MIDDLE SCHOOL
Notes: No data are reported when fewer than 10 students in a category were tested, as indicated by an "*."No students were tested in the curriculum group in one of the two years, as indicated by an "n/a."
134
A curriculum group listing will not appear if no students in the group were tested in either year.
Office of Assessment and Data Analysis
Grade 2 is the locally administered Stanford Achievement Test, 9th ed. (SAT-9); grades 3-10 results are based on the state's FCAT NRT (SAT-9) program.
Norm-Referenced Test Reading Comprehension and Mathematics Results:
READING COMPREHENSION MEDIAN %ILE Std. Curric. ESE
MATHEMATICS MEDIAN %ILE
School LEP All Students
2003 2004Std. Curric. ESE LEP All Students
Median Percentile Scores, by Grade Level and Curriculum Group, for 2003 and 2004, Grades 2-10
2003 2004 2003 2004 2003 2004 2003 2004 2003 2004 2003 2004 2003 20046351 LAKE STEVENS MIDDLE SCHOOL
Notes: No data are reported when fewer than 10 students in a category were tested, as indicated by an "*."No students were tested in the curriculum group in one of the two years, as indicated by an "n/a."
135
A curriculum group listing will not appear if no students in the group were tested in either year.
Office of Assessment and Data Analysis
Grade 2 is the locally administered Stanford Achievement Test, 9th ed. (SAT-9); grades 3-10 results are based on the state's FCAT NRT (SAT-9) program.
Norm-Referenced Test Reading Comprehension and Mathematics Results:
READING COMPREHENSION MEDIAN %ILE Std. Curric. ESE
MATHEMATICS MEDIAN %ILE
School LEP All Students
2003 2004Std. Curric. ESE LEP All Students
Median Percentile Scores, by Grade Level and Curriculum Group, for 2003 and 2004, Grades 2-10
2003 2004 2003 2004 2003 2004 2003 2004 2003 2004 2003 2004 2003 20046411 HORACE MANN MIDDLE SCHOOL
Notes: No data are reported when fewer than 10 students in a category were tested, as indicated by an "*."No students were tested in the curriculum group in one of the two years, as indicated by an "n/a."
136
A curriculum group listing will not appear if no students in the group were tested in either year.
Office of Assessment and Data Analysis
Grade 2 is the locally administered Stanford Achievement Test, 9th ed. (SAT-9); grades 3-10 results are based on the state's FCAT NRT (SAT-9) program.
Norm-Referenced Test Reading Comprehension and Mathematics Results:
READING COMPREHENSION MEDIAN %ILE Std. Curric. ESE
MATHEMATICS MEDIAN %ILE
School LEP All Students
2003 2004Std. Curric. ESE LEP All Students
Median Percentile Scores, by Grade Level and Curriculum Group, for 2003 and 2004, Grades 2-10
2003 2004 2003 2004 2003 2004 2003 2004 2003 2004 2003 2004 2003 20046441 HOWARD D. MCMILLAN MIDDLE SCHOOL
Notes: No data are reported when fewer than 10 students in a category were tested, as indicated by an "*."No students were tested in the curriculum group in one of the two years, as indicated by an "n/a."
137
A curriculum group listing will not appear if no students in the group were tested in either year.
Office of Assessment and Data Analysis
Grade 2 is the locally administered Stanford Achievement Test, 9th ed. (SAT-9); grades 3-10 results are based on the state's FCAT NRT (SAT-9) program.
Norm-Referenced Test Reading Comprehension and Mathematics Results:
READING COMPREHENSION MEDIAN %ILE Std. Curric. ESE
MATHEMATICS MEDIAN %ILE
School LEP All Students
2003 2004Std. Curric. ESE LEP All Students
Median Percentile Scores, by Grade Level and Curriculum Group, for 2003 and 2004, Grades 2-10
Notes: No data are reported when fewer than 10 students in a category were tested, as indicated by an "*."No students were tested in the curriculum group in one of the two years, as indicated by an "n/a."
138
A curriculum group listing will not appear if no students in the group were tested in either year.
Office of Assessment and Data Analysis
Grade 2 is the locally administered Stanford Achievement Test, 9th ed. (SAT-9); grades 3-10 results are based on the state's FCAT NRT (SAT-9) program.
Norm-Referenced Test Reading Comprehension and Mathematics Results:
READING COMPREHENSION MEDIAN %ILE Std. Curric. ESE
MATHEMATICS MEDIAN %ILE
School LEP All Students
2003 2004Std. Curric. ESE LEP All Students
Median Percentile Scores, by Grade Level and Curriculum Group, for 2003 and 2004, Grades 2-10
2003 2004 2003 2004 2003 2004 2003 2004 2003 2004 2003 2004 2003 20046591 NORTH DADE MIDDLE SCHOOL
Notes: No data are reported when fewer than 10 students in a category were tested, as indicated by an "*."No students were tested in the curriculum group in one of the two years, as indicated by an "n/a."
139
A curriculum group listing will not appear if no students in the group were tested in either year.
Office of Assessment and Data Analysis
Grade 2 is the locally administered Stanford Achievement Test, 9th ed. (SAT-9); grades 3-10 results are based on the state's FCAT NRT (SAT-9) program.
Norm-Referenced Test Reading Comprehension and Mathematics Results:
READING COMPREHENSION MEDIAN %ILE Std. Curric. ESE
MATHEMATICS MEDIAN %ILE
School LEP All Students
2003 2004Std. Curric. ESE LEP All Students
Median Percentile Scores, by Grade Level and Curriculum Group, for 2003 and 2004, Grades 2-10
Notes: No data are reported when fewer than 10 students in a category were tested, as indicated by an "*."No students were tested in the curriculum group in one of the two years, as indicated by an "n/a."
140
A curriculum group listing will not appear if no students in the group were tested in either year.
Office of Assessment and Data Analysis
Grade 2 is the locally administered Stanford Achievement Test, 9th ed. (SAT-9); grades 3-10 results are based on the state's FCAT NRT (SAT-9) program.
Norm-Referenced Test Reading Comprehension and Mathematics Results:
READING COMPREHENSION MEDIAN %ILE Std. Curric. ESE
MATHEMATICS MEDIAN %ILE
School LEP All Students
2003 2004Std. Curric. ESE LEP All Students
Median Percentile Scores, by Grade Level and Curriculum Group, for 2003 and 2004, Grades 2-10
Notes: No data are reported when fewer than 10 students in a category were tested, as indicated by an "*."No students were tested in the curriculum group in one of the two years, as indicated by an "n/a."
141
A curriculum group listing will not appear if no students in the group were tested in either year.
Office of Assessment and Data Analysis
Grade 2 is the locally administered Stanford Achievement Test, 9th ed. (SAT-9); grades 3-10 results are based on the state's FCAT NRT (SAT-9) program.
Norm-Referenced Test Reading Comprehension and Mathematics Results:
READING COMPREHENSION MEDIAN %ILE Std. Curric. ESE
MATHEMATICS MEDIAN %ILE
School LEP All Students
2003 2004Std. Curric. ESE LEP All Students
Median Percentile Scores, by Grade Level and Curriculum Group, for 2003 and 2004, Grades 2-10
Notes: No data are reported when fewer than 10 students in a category were tested, as indicated by an "*."No students were tested in the curriculum group in one of the two years, as indicated by an "n/a."
142
A curriculum group listing will not appear if no students in the group were tested in either year.
Office of Assessment and Data Analysis
Grade 2 is the locally administered Stanford Achievement Test, 9th ed. (SAT-9); grades 3-10 results are based on the state's FCAT NRT (SAT-9) program.
Norm-Referenced Test Reading Comprehension and Mathematics Results:
READING COMPREHENSION MEDIAN %ILE Std. Curric. ESE
MATHEMATICS MEDIAN %ILE
School LEP All Students
2003 2004Std. Curric. ESE LEP All Students
Median Percentile Scores, by Grade Level and Curriculum Group, for 2003 and 2004, Grades 2-10
2003 2004 2003 2004 2003 2004 2003 2004 2003 2004 2003 2004 2003 20046881 SOUTH MIAMI MIDDLE COMMUNITY
Notes: No data are reported when fewer than 10 students in a category were tested, as indicated by an "*."No students were tested in the curriculum group in one of the two years, as indicated by an "n/a."
143
A curriculum group listing will not appear if no students in the group were tested in either year.
Office of Assessment and Data Analysis
Grade 2 is the locally administered Stanford Achievement Test, 9th ed. (SAT-9); grades 3-10 results are based on the state's FCAT NRT (SAT-9) program.
Norm-Referenced Test Reading Comprehension and Mathematics Results:
READING COMPREHENSION MEDIAN %ILE Std. Curric. ESE
MATHEMATICS MEDIAN %ILE
School LEP All Students
2003 2004Std. Curric. ESE LEP All Students
Median Percentile Scores, by Grade Level and Curriculum Group, for 2003 and 2004, Grades 2-10
2003 2004 2003 2004 2003 2004 2003 2004 2003 2004 2003 2004 2003 20046921 CURRY, LAMAR LOUISE MIDDLE SCHOOL
Notes: No data are reported when fewer than 10 students in a category were tested, as indicated by an "*."No students were tested in the curriculum group in one of the two years, as indicated by an "n/a."
144
A curriculum group listing will not appear if no students in the group were tested in either year.
Office of Assessment and Data Analysis
Grade 2 is the locally administered Stanford Achievement Test, 9th ed. (SAT-9); grades 3-10 results are based on the state's FCAT NRT (SAT-9) program.
Norm-Referenced Test Reading Comprehension and Mathematics Results:
READING COMPREHENSION MEDIAN %ILE Std. Curric. ESE
MATHEMATICS MEDIAN %ILE
School LEP All Students
2003 2004Std. Curric. ESE LEP All Students
Median Percentile Scores, by Grade Level and Curriculum Group, for 2003 and 2004, Grades 2-10
2003 2004 2003 2004 2003 2004 2003 2004 2003 2004 2003 2004 2003 20047020 DORAL ACADEMY HIGH SCHOOL
7081 DESIGN AND ARCHITECTURE SENIOR HIGH SCHOOLGrade 09
* * * * 74 66 74 66 * * * * 91 90 91 91
Grade 10 * * * * 63 69 63 69 * * * * 81 87 81 89
Notes: No data are reported when fewer than 10 students in a category were tested, as indicated by an "*."No students were tested in the curriculum group in one of the two years, as indicated by an "n/a."
145
A curriculum group listing will not appear if no students in the group were tested in either year.
Office of Assessment and Data Analysis
Grade 2 is the locally administered Stanford Achievement Test, 9th ed. (SAT-9); grades 3-10 results are based on the state's FCAT NRT (SAT-9) program.
Norm-Referenced Test Reading Comprehension and Mathematics Results:
READING COMPREHENSION MEDIAN %ILE Std. Curric. ESE
MATHEMATICS MEDIAN %ILE
School LEP All Students
2003 2004Std. Curric. ESE LEP All Students
Median Percentile Scores, by Grade Level and Curriculum Group, for 2003 and 2004, Grades 2-10
2003 2004 2003 2004 2003 2004 2003 2004 2003 2004 2003 2004 2003 20047101 CORAL REEF SENIOR HIGH SCHOOL
Notes: No data are reported when fewer than 10 students in a category were tested, as indicated by an "*."No students were tested in the curriculum group in one of the two years, as indicated by an "n/a."
146
A curriculum group listing will not appear if no students in the group were tested in either year.
Office of Assessment and Data Analysis
Grade 2 is the locally administered Stanford Achievement Test, 9th ed. (SAT-9); grades 3-10 results are based on the state's FCAT NRT (SAT-9) program.
Norm-Referenced Test Reading Comprehension and Mathematics Results:
READING COMPREHENSION MEDIAN %ILE Std. Curric. ESE
MATHEMATICS MEDIAN %ILE
School LEP All Students
2003 2004Std. Curric. ESE LEP All Students
Median Percentile Scores, by Grade Level and Curriculum Group, for 2003 and 2004, Grades 2-10
2003 2004 2003 2004 2003 2004 2003 2004 2003 2004 2003 2004 2003 20047141 DR. MICHAEL M. KROP SENIOR HIGH SCHOOL
Notes: No data are reported when fewer than 10 students in a category were tested, as indicated by an "*."No students were tested in the curriculum group in one of the two years, as indicated by an "n/a."
147
A curriculum group listing will not appear if no students in the group were tested in either year.
Office of Assessment and Data Analysis
Grade 2 is the locally administered Stanford Achievement Test, 9th ed. (SAT-9); grades 3-10 results are based on the state's FCAT NRT (SAT-9) program.
Norm-Referenced Test Reading Comprehension and Mathematics Results:
READING COMPREHENSION MEDIAN %ILE Std. Curric. ESE
MATHEMATICS MEDIAN %ILE
School LEP All Students
2003 2004Std. Curric. ESE LEP All Students
Median Percentile Scores, by Grade Level and Curriculum Group, for 2003 and 2004, Grades 2-10
2003 2004 2003 2004 2003 2004 2003 2004 2003 2004 2003 2004 2003 20047201 MIAMI BEACH SENIOR HIGH SCHOOL
Notes: No data are reported when fewer than 10 students in a category were tested, as indicated by an "*."No students were tested in the curriculum group in one of the two years, as indicated by an "n/a."
148
A curriculum group listing will not appear if no students in the group were tested in either year.
Office of Assessment and Data Analysis
Grade 2 is the locally administered Stanford Achievement Test, 9th ed. (SAT-9); grades 3-10 results are based on the state's FCAT NRT (SAT-9) program.
Norm-Referenced Test Reading Comprehension and Mathematics Results:
READING COMPREHENSION MEDIAN %ILE Std. Curric. ESE
MATHEMATICS MEDIAN %ILE
School LEP All Students
2003 2004Std. Curric. ESE LEP All Students
Median Percentile Scores, by Grade Level and Curriculum Group, for 2003 and 2004, Grades 2-10
2003 2004 2003 2004 2003 2004 2003 2004 2003 2004 2003 2004 2003 20047271 MIAMI CORAL PARK SENIOR HIGH SCHOOL
Notes: No data are reported when fewer than 10 students in a category were tested, as indicated by an "*."No students were tested in the curriculum group in one of the two years, as indicated by an "n/a."
149
A curriculum group listing will not appear if no students in the group were tested in either year.
Office of Assessment and Data Analysis
Grade 2 is the locally administered Stanford Achievement Test, 9th ed. (SAT-9); grades 3-10 results are based on the state's FCAT NRT (SAT-9) program.
Norm-Referenced Test Reading Comprehension and Mathematics Results:
READING COMPREHENSION MEDIAN %ILE Std. Curric. ESE
MATHEMATICS MEDIAN %ILE
School LEP All Students
2003 2004Std. Curric. ESE LEP All Students
Median Percentile Scores, by Grade Level and Curriculum Group, for 2003 and 2004, Grades 2-10
2003 2004 2003 2004 2003 2004 2003 2004 2003 2004 2003 2004 2003 20047371 ROBERT MORGAN EDUCATIONAL CENTER
Notes: No data are reported when fewer than 10 students in a category were tested, as indicated by an "*."No students were tested in the curriculum group in one of the two years, as indicated by an "n/a."
150
A curriculum group listing will not appear if no students in the group were tested in either year.
Office of Assessment and Data Analysis
Grade 2 is the locally administered Stanford Achievement Test, 9th ed. (SAT-9); grades 3-10 results are based on the state's FCAT NRT (SAT-9) program.
Norm-Referenced Test Reading Comprehension and Mathematics Results:
READING COMPREHENSION MEDIAN %ILE Std. Curric. ESE
MATHEMATICS MEDIAN %ILE
School LEP All Students
2003 2004Std. Curric. ESE LEP All Students
Median Percentile Scores, by Grade Level and Curriculum Group, for 2003 and 2004, Grades 2-10
2003 2004 2003 2004 2003 2004 2003 2004 2003 2004 2003 2004 2003 20047431 MIAMI PALMETTO SENIOR HIGH SCHOOL
Notes: No data are reported when fewer than 10 students in a category were tested, as indicated by an "*."No students were tested in the curriculum group in one of the two years, as indicated by an "n/a."
151
A curriculum group listing will not appear if no students in the group were tested in either year.
Office of Assessment and Data Analysis
Grade 2 is the locally administered Stanford Achievement Test, 9th ed. (SAT-9); grades 3-10 results are based on the state's FCAT NRT (SAT-9) program.
Norm-Referenced Test Reading Comprehension and Mathematics Results:
READING COMPREHENSION MEDIAN %ILE Std. Curric. ESE
MATHEMATICS MEDIAN %ILE
School LEP All Students
2003 2004Std. Curric. ESE LEP All Students
Median Percentile Scores, by Grade Level and Curriculum Group, for 2003 and 2004, Grades 2-10
2003 2004 2003 2004 2003 2004 2003 2004 2003 2004 2003 2004 2003 20047541 NORTH MIAMI BEACH SENIOR HIGH SCHOOL
Notes: No data are reported when fewer than 10 students in a category were tested, as indicated by an "*."No students were tested in the curriculum group in one of the two years, as indicated by an "n/a."
152
A curriculum group listing will not appear if no students in the group were tested in either year.
Office of Assessment and Data Analysis
Grade 2 is the locally administered Stanford Achievement Test, 9th ed. (SAT-9); grades 3-10 results are based on the state's FCAT NRT (SAT-9) program.
Norm-Referenced Test Reading Comprehension and Mathematics Results:
READING COMPREHENSION MEDIAN %ILE Std. Curric. ESE
MATHEMATICS MEDIAN %ILE
School LEP All Students
2003 2004Std. Curric. ESE LEP All Students
Median Percentile Scores, by Grade Level and Curriculum Group, for 2003 and 2004, Grades 2-10
2003 2004 2003 2004 2003 2004 2003 2004 2003 2004 2003 2004 2003 20047701 SOUTH DADE SENIOR HIGH SCHOOL
Notes: No data are reported when fewer than 10 students in a category were tested, as indicated by an "*."No students were tested in the curriculum group in one of the two years, as indicated by an "n/a."
153
A curriculum group listing will not appear if no students in the group were tested in either year.
Office of Assessment and Data Analysis
Grade 2 is the locally administered Stanford Achievement Test, 9th ed. (SAT-9); grades 3-10 results are based on the state's FCAT NRT (SAT-9) program.
Norm-Referenced Test Reading Comprehension and Mathematics Results:
READING COMPREHENSION MEDIAN %ILE Std. Curric. ESE
MATHEMATICS MEDIAN %ILE
School LEP All Students
2003 2004Std. Curric. ESE LEP All Students
Median Percentile Scores, by Grade Level and Curriculum Group, for 2003 and 2004, Grades 2-10
2003 2004 2003 2004 2003 2004 2003 2004 2003 2004 2003 2004 2003 20047751 BARBARA GOLEMAN SENIOR HIGH SCHOOL
Notes: No data are reported when fewer than 10 students in a category were tested, as indicated by an "*."No students were tested in the curriculum group in one of the two years, as indicated by an "n/a."
154
A curriculum group listing will not appear if no students in the group were tested in either year.
Office of Assessment and Data Analysis
Grade 2 is the locally administered Stanford Achievement Test, 9th ed. (SAT-9); grades 3-10 results are based on the state's FCAT NRT (SAT-9) program.
Norm-Referenced Test Reading Comprehension and Mathematics Results:
READING COMPREHENSION MEDIAN %ILE Std. Curric. ESE
MATHEMATICS MEDIAN %ILE
School LEP All Students
2003 2004Std. Curric. ESE LEP All Students
Median Percentile Scores, by Grade Level and Curriculum Group, for 2003 and 2004, Grades 2-10
Notes: No data are reported when fewer than 10 students in a category were tested, as indicated by an "*."No students were tested in the curriculum group in one of the two years, as indicated by an "n/a."
155
A curriculum group listing will not appear if no students in the group were tested in either year.
Office of Assessment and Data Analysis
Grade 2 is the locally administered Stanford Achievement Test, 9th ed. (SAT-9); grades 3-10 results are based on the state's FCAT NRT (SAT-9) program.
Norm-Referenced Test Reading Comprehension and Mathematics Results:
READING COMPREHENSION MEDIAN %ILE Std. Curric. ESE
MATHEMATICS MEDIAN %ILE
School LEP All Students
2003 2004Std. Curric. ESE LEP All Students
Median Percentile Scores, by Grade Level and Curriculum Group, for 2003 and 2004, Grades 2-10
Notes: No data are reported when fewer than 10 students in a category were tested, as indicated by an "*."No students were tested in the curriculum group in one of the two years, as indicated by an "n/a."
156
A curriculum group listing will not appear if no students in the group were tested in either year.
Office of Assessment and Data Analysis
Grade 2 is the locally administered Stanford Achievement Test, 9th ed. (SAT-9); grades 3-10 results are based on the state's FCAT NRT (SAT-9) program.
Norm-Referenced Test Reading Comprehension and Mathematics Results:
READING COMPREHENSION MEDIAN %ILE Std. Curric. ESE
MATHEMATICS MEDIAN %ILE
School LEP All Students
2003 2004Std. Curric. ESE LEP All Students
Median Percentile Scores, by Grade Level and Curriculum Group, for 2003 and 2004, Grades 2-10
2003 2004 2003 2004 2003 2004 2003 2004 2003 2004 2003 2004 2003 20048019 ACADEMY FOR COMMUNITY EDUCATION
Notes: No data are reported when fewer than 10 students in a category were tested, as indicated by an "*."No students were tested in the curriculum group in one of the two years, as indicated by an "n/a."
157
A curriculum group listing will not appear if no students in the group were tested in either year.
Office of Assessment and Data Analysis
Grade 2 is the locally administered Stanford Achievement Test, 9th ed. (SAT-9); grades 3-10 results are based on the state's FCAT NRT (SAT-9) program.
Norm-Referenced Test Reading Comprehension and Mathematics Results:
READING COMPREHENSION MEDIAN %ILE Std. Curric. ESE
MATHEMATICS MEDIAN %ILE
School LEP All Students
2003 2004Std. Curric. ESE LEP All Students
Median Percentile Scores, by Grade Level and Curriculum Group, for 2003 and 2004, Grades 2-10
2003 2004 2003 2004 2003 2004 2003 2004 2003 2004 2003 2004 2003 20048121 C.O.P.E. NORTH ALTERNATIVE EDUCATION CENTER
Notes: No data are reported when fewer than 10 students in a category were tested, as indicated by an "*."No students were tested in the curriculum group in one of the two years, as indicated by an "n/a."
158
A curriculum group listing will not appear if no students in the group were tested in either year.
Office of Assessment and Data Analysis
Grade 2 is the locally administered Stanford Achievement Test, 9th ed. (SAT-9); grades 3-10 results are based on the state's FCAT NRT (SAT-9) program.
Norm-Referenced Test Reading Comprehension and Mathematics Results:
READING COMPREHENSION MEDIAN %ILE Std. Curric. ESE
MATHEMATICS MEDIAN %ILE
School LEP All Students
2003 2004Std. Curric. ESE LEP All Students
Median Percentile Scores, by Grade Level and Curriculum Group, for 2003 and 2004, Grades 2-10
10 11 n/a n/a 10 11 * n /a 13 12 n/a n/a 13 12 * n /a
Grade 07 10 5 n/a n/a 10 5n/a n /a 14 11 n/a n/a 14 11n/a n /a
Grade 08 6 10 n/a n/a 7 10n/a n /a 19 16 n/a n/a 19 16n/a n /a
Notes: No data are reported when fewer than 10 students in a category were tested, as indicated by an "*."No students were tested in the curriculum group in one of the two years, as indicated by an "n/a."
159
A curriculum group listing will not appear if no students in the group were tested in either year.
Office of Assessment and Data Analysis
Grade 2 is the locally administered Stanford Achievement Test, 9th ed. (SAT-9); grades 3-10 results are based on the state's FCAT NRT (SAT-9) program.
Norm-Referenced Test Reading Comprehension and Mathematics Results:
READING COMPREHENSION MEDIAN %ILE Std. Curric. ESE
MATHEMATICS MEDIAN %ILE
School LEP All Students
2003 2004Std. Curric. ESE LEP All Students
Median Percentile Scores, by Grade Level and Curriculum Group, for 2003 and 2004, Grades 2-10
2003 2004 2003 2004 2003 2004 2003 2004 2003 2004 2003 2004 2003 20048161 CORPORATE ACADEMY NORTH
Grade 09n/a * n/a n/a n/a 3n/a n /a n/a * n/a n/a n/a 18n/a n /a
Grade 10n/a * n/a n/a n/a 4n/a n /a n/a * n/a n/a n/a 20n/a n /a
Notes: No data are reported when fewer than 10 students in a category were tested, as indicated by an "*."No students were tested in the curriculum group in one of the two years, as indicated by an "n/a."
160
A curriculum group listing will not appear if no students in the group were tested in either year.
Office of Assessment and Data Analysis
Grade 2 is the locally administered Stanford Achievement Test, 9th ed. (SAT-9); grades 3-10 results are based on the state's FCAT NRT (SAT-9) program.
Norm-Referenced Test Reading Comprehension and Mathematics Results:
READING COMPREHENSION MEDIAN %ILE Std. Curric. ESE
MATHEMATICS MEDIAN %ILE
School LEP All Students
2003 2004Std. Curric. ESE LEP All Students
Median Percentile Scores, by Grade Level and Curriculum Group, for 2003 and 2004, Grades 2-10
2003 2004 2003 2004 2003 2004 2003 2004 2003 2004 2003 2004 2003 20048201 CORPORATE ACADEMY SOUTH
8911 ROBERT MORGAN TECHNICAL ARTS SENIOR HIGH SCHOOLGrade 09
* n/a * n/a 24 n /a 24 n /a * n/a * n/a 31 n /a 31 n /a
Grade 10 * n/a * n/a 15 n /a 18 n /a * n/a * n/a 33 n /a 42 n /a
Notes: No data are reported when fewer than 10 students in a category were tested, as indicated by an "*."No students were tested in the curriculum group in one of the two years, as indicated by an "n/a."
161
A curriculum group listing will not appear if no students in the group were tested in either year.
Office of Assessment and Data Analysis
Grade 2 is the locally administered Stanford Achievement Test, 9th ed. (SAT-9); grades 3-10 results are based on the state's FCAT NRT (SAT-9) program.
Norm-Referenced Test Reading Comprehension and Mathematics Results:
READING COMPREHENSION MEDIAN %ILE Std. Curric. ESE
MATHEMATICS MEDIAN %ILE
School LEP All Students
2003 2004Std. Curric. ESE LEP All Students
Median Percentile Scores, by Grade Level and Curriculum Group, for 2003 and 2004, Grades 2-10
Grade 02 * 22 n/a n/a 11 22n/a n /a * 7 n/a n/a 5 7n/a n /a
Grade 03 * 8 n/a n/a 19 8n/a n /a * 5 n/a n/a 11 5n/a n /a
Grade 04 * * n/a n/a 14 9n/a n /a * * n/a n/a 14 14n/a n /a
Grade 05 7 14 n/a n/a 7 14n/a n /a * 3 n/a n/a 3 3n/a n /a
Grade 06 * * n/a n/a 26 9n/a n /a * * n/a n/a 23 26n/a n /a
Grade 09 * * n/a n/a 18 12n/a n /a * * n/a n/a 16 20n/a n /a
Grade 10 * 7 n/a n/a 14 7n/a n /a * 16 n/a n/a 35 16n/a n /a
Notes: No data are reported when fewer than 10 students in a category were tested, as indicated by an "*."No students were tested in the curriculum group in one of the two years, as indicated by an "n/a."
162
A curriculum group listing will not appear if no students in the group were tested in either year.
Office of Assessment and Data Analysis
Grade 2 is the locally administered Stanford Achievement Test, 9th ed. (SAT-9); grades 3-10 results are based on the state's FCAT NRT (SAT-9) program.
Norm-Referenced Test Reading Comprehension and Mathematics Results:
READING COMPREHENSION MEDIAN %ILE Std. Curric. ESE
MATHEMATICS MEDIAN %ILE
School LEP All Students
2003 2004Std. Curric. ESE LEP All Students
Median Percentile Scores, by Grade Level and Curriculum Group, for 2003 and 2004, Grades 2-10
Grade 05n/a n/a n/a n/a 93 n /a * n /a n/a n/a n/a n/a 98 n /a * n /a
Grade 06 * n/a n/a n/a 5 n /an/a n /a * n/a n/a n/a 8 n /an/a n /a
Grade 09 * n/a n/a n/a 13 n /an/a n /a * n/a n/a n/a 24 n /an/a n /a
Grade 10 * n/a n/a n/a 8 n /a * n /a * n/a n/a n/a 25 n /a * n /a
Notes: No data are reported when fewer than 10 students in a category were tested, as indicated by an "*."No students were tested in the curriculum group in one of the two years, as indicated by an "n/a."
163
A curriculum group listing will not appear if no students in the group were tested in either year.
Office of Assessment and Data Analysis
Grade 2 is the locally administered Stanford Achievement Test, 9th ed. (SAT-9); grades 3-10 results are based on the state's FCAT NRT (SAT-9) program.
Norm-Referenced Test Reading Comprehension and Mathematics Results:
READING COMPREHENSION MEDIAN %ILE Std. Curric. ESE
MATHEMATICS MEDIAN %ILE
School LEP All Students
2003 2004Std. Curric. ESE LEP All Students
Median Percentile Scores, by Grade Level and Curriculum Group, for 2003 and 2004, Grades 2-10
Notes: No data are reported when fewer than 10 students in a category were tested, as indicated by an "*."No students were tested in the curriculum group in one of the two years, as indicated by an "n/a."
164
A curriculum group listing will not appear if no students in the group were tested in either year.
Office of Assessment and Data Analysis
Grade 2 is the locally administered Stanford Achievement Test, 9th ed. (SAT-9); grades 3-10 results are based on the state's FCAT NRT (SAT-9) program.