2010 Annual Meeting Syllabus | 325 North American Neuro-Ophthalmology Society 36th Annual Meeting March 6-11, 2010 • JW Starr Pass Marriott Resort & Spa, Tucson, AZ Educational Program Schedule THURSDAY, MARCH 11 LOCATION 6:30 a.m. – 12:30 p.m. Registration Arizona Ballroom Foyer 6:30 a.m. – 7:30 a.m. Continental Breakfast Arizona Salon 8:30 a.m. – 10:30 a.m. Spouse/Guest Hospitality Suite Signature Grill 7:30 a.m. - 9:30 a.m. OCT IN NEURO-OPHTHALMOLOGY PRACTICE [2 CME] Arizona Salons 1-6 Moderators: Laura J. Balcer, MD, MSCE and Fiona Costello, MD This half-morning symposium will review the current knowledge concerning the use of optical coherence tomography (OCT) in patients with neuro-ophthalmologic disorders. The session will discuss the history of OCT and the evolution of the underlying technology. The currently available and future equipment will be discussed and evaluated. The evidence regarding the use of OCT in the diagnosis and follow/up of optic neuritis, chiasmal lesions, multiple sclerosis and other neurologic diseases will be reviewed. A perspective on the clinical utilization of OCT drawing on experience from its place in glaucoma management will be presented. The potential of OCT for monitoring possible neuro-protective treatment of optic nerve and macular disease will be reviewed. At the conclusion of the symposium, the attendees should be able to: 1) Describe the principle of OCT and the forms of equipment available to perform the test; 2) Discuss the currently available evidence about the use of OCT in evaluating optic neuritis, MS, chiasmal lesions, and other neuro-ophthalmologic disorders; 3) Explain the lessons available from the use of OCT in management of glaucoma; and 4) Discuss the potential use of OCT in monitoring the effects of therapy of anterior visual pathway disease, including neuroprotective agents. PAGES 7:30 a.m. – 7:50 a.m. OCT Technologies: Past, Present, and What’s New? - Joel Schuman, MD 327 7:50 a.m. – 8:10 a.m. OCT in Neurologic Disease - Eric Eggenberger, DO, MSEpi 335 8:10 a.m. – 8:30 a.m. Lessons from Glaucoma: Use of OCT in the Clinic and Trials - Joel Schuman, MD 343 8:30 a.m. – 8:50 a.m. Linking Axons and Neurons: Unveiling Mysteries of the Macula and 369 Modeling Neuroprotection - Randy Kardon, MD, PhD 8:50 a.m. – 9:05 a.m. Platform Presentation: Ganglion Cell Layer Volume by Spectralis Optical Coherence 375 Tomography (OCT) in Multiple Sclerosis - Emma Davies, MD 9:05 a.m. – 9:20 a.m. Evidence Meets Practice: Take-Home Points on OCT - Thomas Hedges, III, MD 377 9:20 a.m. – 9:30 a.m. Questions and Discussion 9:30 a.m. – 10:00 a.m. Coffee Break
Conflict of Interest Statement: Dr. Schuman receives
royalties for intellectual property licensed by
Massachusetts Institute of Technology to Carl Zeiss
Meditec. Dr. Wollstein received research funding from
Carl Zeiss Meditec and Optovue. Dr. Schuman received
honoraria from Carl Zeiss Meditec, Heidelberg Engineering
and Optovue. Ms. Gabriele reports no conflicts.
INTRODUCTIONThe development of optical coherence tomography (OCT)
began with a team comprised of clinician-scientists and
a physicist at Massachusetts Eye and Ear Infirmary (MEEI),
Harvard University and engineers at the Massachusetts
Institute of Technology (MIT). Remarkably, one member
of this group was a graduate student, one a postdoctoral
fellow, and another was a predoctoral fellow. OCT actually
began as optical coherence domain ranging (OCDR),
essentially a single A-scan in what we now know as OCT.
OCDR was being developed by James Fujimoto and
Carmen Puliafito for corneal ranging. Joel Schuman was
a fellow in Puliafito’s laser laboratory at MEEI and David
Huang an MD, PhD student in the Harvard-MIT Health
Sciences Technology (HST) program, working in Fujimoto’s
laboratory at MIT. Eric Swanson was an engineer at MIT-
Lincoln Laboratories, Charles Lin a physicist in Puliafito’s
lab and William Stinson a preresidency fellow working in
Puliafito’s lab as well. These seven people were the key
persons involved in the development of this technology.
Joel Schuman, while working on other projects in the laser
laboratory, became aware of the OCDR corneal ranging
target. It occurred to Schuman that the near infrared
wavelength of OCDR would be able to safely measure
retinal thickness, and would perhaps be useful for
measuring retinal layers. After discussing this idea with
Puliafito, Schuman pursued the concept together with
Fujimoto and Huang. Schuman, Huang, Lin and Stinson
did the very first retinal ranging experiments in James
Fujimoto’s laboratory at MIT.
David Huang, while an MD-PhD student, had the insight
that an OCDR A-scan was similar to an ultrasound A-scan,
and that creating a tomographic cross-sectional image
similar to an ultrasound B-scan would be possible. The
technology was refined to create tomography, and was
renamed Optical Coherence Tomography (OCT). In 1991
the first scientific paper regarding OCT was published,
describing the use of an optical detection technique called
low coherence interferometry to acquire cross-sectional
images of the peripapillary region of the human retina ex
vivo.1 Low coherence tomography refers to the detection
of light that has been split, reflected off of an object of
interest and a reference mirror and recombined. This
recombination produces an interference pattern with an
amplitude proportional to the reflectivity of the
corresponding location (same optical path length) within
tissue of interest. Individual axial scans, or A-scans, are
OCT TECHNOLOGIES: PAST, PRESENT, AND WHAT’S NEW? Joel S. Schuman, MD, FACS,1,2,3 Michelle Gabriele, BS, MS,1,2,3 Gadi Wollstein, MD1
1UPMC Eye Center, Eye and Ear Institute, Ophthalmology and Visual Science Research Center, Department of Ophthalmology, University of Pittsburgh School of Medicine, Pittsburgh, PA;
2Department of Bioengineering, Swanson School of Engineering, University of Pittsburgh; 3Center for the Neural Basis of Cognition, Carnegie Mellon University and University of Pittsburgh
328 | North American Neuro-Ophthalmology Society
acquired at a given location in tissue and correspond to a
reflectivity profile in depth. Multiple neighboring A-scans
can be acquired to build up a B-scan that represents an
optical cross-section of the tissue.
OCT was described in vivo in 19932 and quickly used in
human subjects as a research tool to investigate retinal
and glaucomatous abnormalities.3-6 During this time the
technology was transferred to industry. The OCT patent
was granted in 1994 to Fujimoto, Huang, Lin, Puliafito,
Schuman and Swanson, and was licensed by what is now
Carl Zeiss Meditec, Inc. (Dublin, CA), allowing the creation
of a device that could be broadly used for patient care.
The first commercial system became available in 1996
and was a time-domain OCT system (TD-OCT). This
means A-scans are acquired by moving the
interferometer’s reference mirror, which changes the
reference path length and enables the detection
reflectivity from different depths in a given structure.
Hence, in TD-OCT imaging, the time of flight of the light
reflected from the retinal structures determines the OCT
measurements. The commercial time-domain OCT system
has an axial resolution of approximately 10μm.
The first commercial two iterations of OCT were not
particularly successful, in part because of the novelty of
the technology, but also because systems were big, slow
and difficult to use. This changed in 2002 with the
introduction of Stratus OCT. The Stratus system acquired
400 A-scans per second, compared with 100 per second
in prior versions. Stratus OCT also had a normative
database, making clinical use considerably more practical,
and the system was now ergonomically designed. Finally,
a billing code for scanning computerized ocular diagnostic
imaging was introduced around the time that Stratus came
to market. All of these factors contributed to the rapid
adoption of the technology; by 2008 10,000 OCT devices
were in worldwide clinical use.
OCT underwent further evolution with the clinical
availability in 2006 of spectral-domain OCT (SD-OCT).7-11
SD-OCT introduced in 2006 was 40-60 times faster than
TD-OCT, allowing the collection of large amounts of
clinical data, permitting increased scan densities and three
dimensional imaging. SD-OCT refers to the measurement
of tissue thickness using not time of flight but reflected
wavelengths (frequencies). Using SDOCT, an entire A-scan
can be collected simultaneously, and the optical
frequencies analyzed using fast Fourier transformation
and mathematical algorithms to create a tomographic
image and determine depth information, converting from
the frequency domain to the time domain. Because optical
frequencies from different depths are detected at once
and used to determine the spatial locations of reflections
in the A-scans, a moving reference mirror is not required:
conversion from the frequency domain to the time domain
occurs after acquisition. This means SD-OCT systems can
acquire A-scans much faster than time-domain systems.
SD-OCT systems have recently been commercialized by
several companies, and most of these systems have an
axial resolution of approximately 3.5 - 6μm and
acquisition speeds of 24,000 - 55,000 A-scans per
second. Axial resolution improvements in these systems
can be attributed to broader bandwidth light sources.
HEALTHY EYESThis section provides representative ocular OCT images,
both time-domain and spectral domain, from healthy
subjects. Figure 1a shows a representative SD-OCT image
through the macular region of a healthy subject, while the
Figure 1b shows a representative TDOCT image from the
same subject. Note that the time-domain image contains
128 Ascans and the SD-OCT image contains 1000 A-
scans; however, the TD-OCT image required 0.32 seconds
to acquire, while the SD-OCT image, with eight times
more Ascans, took 0.04 seco
Figure 2 shows spectral domain (left panel) and time-
domain (right panel) OCT retinal nerve fiber layer (RNFL)
assessments. With time-domain devices, a 3.4-mm
circular scan centered on the optic nerve head (ONH) is
used to assess peripapillary RNFL thickness. Typically,
three OCT scans (with 256 A-scans per scan) are acquired
in succession, the RNFL is segmented, and thickness
measurements along the scan are compared to a
normative database. Using spectral-domain three-
dimensional tissue volumes from around the optic nerve,
one can reconstruct the RNFL peripapillary scan by
resampling the tissue volume along a 3.4 mm circle
centered on the ONH. An extracted RNFL scan can be seen
in Figure 2, bottom left. Above it, an RNFL thickness
overlay on a normative database is shown along with
clock-hour and quadrant RNFL thickness measurements.
One peripapillary TD-OCT scan, with RNFL segmentation
(white line), is shown in Figure 2, bottom right. Above it
lie the normative database with an overlay of RNFL
thickness and clock-hour and quadrant RNFL thickness
measurements.
FIGURE 1: (a) Vertical SD-OCT cross-section through the maculaof the same subject. The white box with vertical line indicatesthe orientation of SD-OCT image. (b) Vertical TDOCTcross-section through the macula.
a b
2010 Annual Meeting Syllabus | 329
In SD-OCT , after multiple B-scans are acquired in raster
fashion and a three-dimensional volume of tissue is
acquired, en-face (OCT fundus) images can be generated
by summing intensity values along the z-direction (in
depth). An example SD-OCT fundus image through the
macular region of a healthy subject is seen in Figure 3.
When three-dimensional tissue volumes have been
acquired around the optic nerve head region using
SD-OCT , RNFL thickness maps can be created by
segmenting the RNFL in each frame of the volume,
excluding the optic nerve head region. This provides easy
visualization of areas of thinning around the optic nerve.
Example RNFL thickness maps from a healthy subject can
be seen in Figure 4.
In addition to posterior segment imaging, images of the
cornea and anterior chamber can be acquired with OCT.
Figure 5 shows a horizontal TD-OCT image through the
cornea of a healthy subject. Figure 6 shows an anterior
chamber TD-OCT image from the same subject.
FIGURE 2: (Left) SD-OCT RNFL thickness clock-hour andquadrant measurements (top), comparison to normativedatabase (middle), and resampled 3.4-mm RNFL B-scan(bottom). (Right) TD-OCT RNFL thickness measurements (top),comparison to normative database (middle) and 3.4-mm RNFLperipapillary scan (bottom). Both images were acquired fromthe same subject, same day.
FIGURE 3: SD-OCT fundus image of the macular region of theleft eye of a healthy subject, created by taking the sum of thereflections along the direction of each individual A-scans in the200 x 200 A-scan volume. This creates a picture-like image dueto the total reflection at each scan location being viewed in theen-face composite, much the same as in a photograph.
FIGURE 4: RNFL thickness map of the left eye of a healthysubject created from a 200 x 200 A-scan scanning (6 x 6 mm)of the optic nerve head region. Thicker areas are red andthinner areas are blue. The uniform blue area towards thecenter of each map indicates the optic nerve head region,where no thickness measurements are made.
FIGURE 5: TD-OCT image through the cornea of ahealthy subject.
FIGURE 6: TD-OCT image through the anteriorchamber of a healthy subject.
330 | North American Neuro-Ophthalmology Society
GLAUCOMAA 58-year-old woman with a history of primary open
angle glaucoma presented with an IOP of 30 in the right
eye (VA 20/20). Visual field testing showed a superior
arcuate defect, with a glaucoma hemifield test outside
normal limits, mean deviation of -1.25 dB, and pattern
standard deviation of 4.37 dB (Figure 7). Widespread
inferior nerve fiber layer thinning can be seen in the
in the macular region. Similarly, irregularities in the RPE
can be seen in the horizontal OCT crosssection though the
macular region (Figure 10b, arrows).
FIGURE 7: Visual field test showing a superior arcuatedefect from a patient with primary open angle glaucoma.
FIGURE 8: RNFL thickness map of patient with primary openangle glaucoma showing inferior thinning of the RNFL (mapcreated from 200 x 200 A-scans, 6x6 mm region around theoptic nerve head). The uniform blue region towards thecenter of the image represents the optic nerve head whileblack region is the result of RNFL detection algorithm failure.
FIGURE 9: (Left) SD-OCT RNFL thickness clock-hourand quadrant measurements (top), comparison tonormative database (middle), and resampled 3.4-mmRNFL B-scan (bottom) in patient with primary openangle glaucoma and inferior RNFL loss. (Right) TD-OCTRNFL thickness measurements (top), comparison tonormative database (middle) and 3.4-mm RNFLperipapillary scan (bottom). Both images wereacquired from the same subject, same day.
FIGURE 10: (a) Fundus photograph of age-related macular degeneration patient withdrusen (b) Horizontal TD-OCT scan (512 A-scans).Arrows indicate areas that are likely drusen.
a b
a
b
2010 Annual Meeting Syllabus | 331
MACULAR HOLEA 72-year-old male presented with a distorted vision in
the right eye (VA 20/200) and 20/50 vision in the left eye.
Both spectral-domain and TD-OCT images showed a large
macular hole in the right eye with posterior hyaloid
partially attached to edge of the hole (Figure 11, spectral-
domain horizontal and vertical cross-sections on left and
timedomain horizontal and vertical cross-sections on
right). Small cystoid changes with a vitreous traction were
seen in the left eye along with posterior hyaloid traction in
the foveal center (Figure 12). Three-dimensional
reconstructions of the thickness maps of the macular
region are also shown (Figure 11 and 12, top) and were
created by segmenting three-dimensional data volumes
(200 x 200 A-scans in a 6 x 6 mm region of the retina)
from the ILM to the RPE. The blues lines on each thickness
map correspond to the location of the horizontal spectral-
domain cross-sections (1000 A-scans each), while the
purple lines correspond to the location of vertical cross-
sections (1000 A-scans).
BRANCH RETINAL VEIN OCCLUSIONFigure 13a shows a late-phase angiograph from an
82-year-old male with branch retinal vein occlusion in the
right eye. He presented with a visual acuity of 20/400 and
clinical examination showed hemorrhage and macular
edema in the right eye. A slow macular (512 A-scans)
MACULAR PUCKERA 60-year-old woman with 20/70 vision in the left eye
showed a pronounced epiretinal membrane with posterior
vitreous detachment. A three-dimensional reconstruction
of the macular thickness map illustrates the extent of
macular puckering (Figure 14a). The epiretinal membrane
can be seen in individual horizontal spectral-domain
(Figure 14b) and time-domain (Figure 14c) OCT images
(arrows).
FIGURE 11: Right eye (Top) Three-dimensional reconstruction ofmacular region showing foveal thickening (red) that correspondsto the location of a macular hole and corresponding edema(Middle and Bottom, left) Horizontal and vertical SD-OCT (1000A-scans) cross-sections through the macular hole (Middle andBottom, right) Horizontal and vertical TD-OCT (512 A-scans)cross-sections through the macular hole.
FIGURE 12: Left eye. (Top) Three-dimensional reconstruction of macular region showing slight foveal thickening (green) thatcorresponds to the location of small cystoids changes(Middle and Bottom, left) Horizontal and vertical SD-OCT (1000 A-scans) crosssections through the macular (Middle andBottom, right) Horizontal and vertical TDOCT (512 A-scans)cross-sections through the macula.
FIGURE 14: (a) Three-dimensional reconstruction of macularregion showing macular puckering (b) Horizontal SD-OCT (1000A-scans) and (c) time-domain (512 A-scans) OCT images throughthe macula, with arrows indicating epiretinal membrane.
a
b
a
b
c
332 | North American Neuro-Ophthalmology Society
DIABETIC MACULAR EDEMAFigure 15 (a) and (b) show a fundus and red-free
photograph, respectively, from a 65-year-old male with
moderate nonproliferative diabetic retinopathy and
clinically significant diabetic macular edema in the right
eye. He presented with 20/160 vision in this eye.
Scattered blot hemorrhages and hard exudates can be
seen in the fundus photograph, and microaneurysms in
the red-free photograph. A SD-OCT macular thickness
map (200 x 200 A-scans covering 6x6 mm region,
segmented from the ILM to the RPE) superimposed on a
fundus photograph (Figure 15c) shows a region of
thickening that corresponds to the macular edema, with
thicker areas represented as hotter colors. Horizontal
(Figure 15 d) and vertical (Figure 15e) spectral-domain
crosssectional OCT images show the extent of fluid
accumulation in the macular region.
POTENTIAL DIAGNOSTIC POWERSince its commercialization in 1996, OCT has increasingly
become a valuable tool for ophthalmologists. Posterior
segment imaging has improved the quantification of RNFL
damage in glaucoma and the visualization of changes due
to age-related macular degeneration, macular hole,
epiretinal member and macular puckering, macular edema
and more. In addition, anterior segment imaging allows
clinicians to monitor patients after LASIK (not shown here)
and corneal injury, and provides a non-invasive alternative
to ultrasound biomicroscopy for anterior chamber
imaging.
While OCT offers several advantages to clinicians, certain
limitations need to be kept in mind. This technique,
especially spectral-domain imaging, is still rather new and
longitudinal studies are required to evaluate its objective
monitoring capabilities. In addition, high-speed imaging
is very sensitive to eye motion and large movements may
make measurements inaccurate. Fortunately, however,
solutions to these restrictions are currently being pursued
by several research groups.
In sum, OCT offers clinicians a new perspective on
structural damage caused by disease. This may lead to
enhanced diagnostic power — not only through objective
quantification but through synergy with other methods of
evaluation that are presently available to clinicians.
CME ANSWERS1. OCT is based on interferometry
2. Measurements of various ocular structures demonstrate
differences in disease and health. There are numerous
articles showing the usefulness of OCT in disease
detection for glaucoma and other optic neuropathies,
macular degeneration and other retinal diseases, as well
as diseases of the anterior segment and anterior
chamber angle.
3. Change can be measured in the RNFL, macula and optic
nerve head using software algorithms, some of which
exist already and others in development. The relevant
tissue should be evaluated when investigating
longitudinally.
FIGURE 15: (a) Fundus photograph of patient withdiabetic retinopathy and clinically significant macularedema. (b) Red-free photograph. (c) SD-OCT thicknessmap of macular region superimposed onto fundusphotograph, with thicker areas white/red. (d) Horizontal and (e) vertical SD-OCT images (1000 A-scans each), the location of each corresponding tothe blue and purple lines on the macular thickness map.
a
a b
c
d e
2010 Annual Meeting Syllabus | 333
REFERENCES1. Huang D, Swanson EA et al. Optical coherence tomography.
Science. 1991; 254(5035): 1178-81.
2. Fercher AF et al. In vivo optical coherence tomography. Am J
(CSLO) and scanning laser polimetry (SLP) confirmed
normal ONH parameters (Fig. 17 and 18, respectively).
FIGURE 1: Normal color photo (left) and red-free photo (right)of a normal optic nerve head. The white arrow points to thenormal coloration of the nerve fiber bundles in a red-free photo.
FIGURE 2: HVF – Normal gray scale (left) and pattern deviation (right).
FIGURE 3: HVF – VFI graph over 5 years showing noprogression.
FIGURE 4: Stratus OCT - Circumpaillary B scan with excellentsignal strength showing a normal retinal nerve fiber layerthickest in the superior and inferior regions.
FIGURE 5: Stratus OCT Infrared Photo — Circumpaillary scanproperly placed around the ONH (left) and off-centered,displaced nasally (right).
346 | North American Neuro-Ophthalmology Society
FIGURE 6: Stratus OCT circumpaillary thickness profiles forproperly placed (A, B) and nasally displaced (C, D) scanscompared with normal distribution percentiles. Note that the“double hump” pattern in C and D is spread apart. This changesthe thickness, although remaining in the normal distribution.
FIGURE 7: Well-centered Stratus OCT macula raster scan. (A) Infrared fundus image. (B) Normal vertical retinal B scan.Note the paucity of reflectance centrally at the foveal dip. (C) Thickness chart — overall retinal thickness compared to anormative database. (D) Retinal volume map quantitative colormap (top) and sectoral comparison to a normative database(below). Note that the blue foveal thinning is placed centrally.
a
b
c
d
a
b
c
d
2010 Annual Meeting Syllabus | 347
FIGURE 8: Nasally displaced Stratus OCT macula raster scan.(A) Vertical macular B scan. Note that the foveal dip hasincreased reflectance in comparison with the well-centeredscan shown in Figure 7B. (B) Thickness chart with the scandisplaced nasally. (C) Retinal volume map quantitative colormap (top) and sectoral comparison to a normative database(below). Note that the blue foveal thinning is displaced. In thiscase, the quantitative assessment of the macula overall has notbeen compromised, however, the foveal thickness issignificantly different (in comparison with Figure 7D).
FIGURE 9: Normal ONH Scan from Stratus TD-OCT. (A) InfraredONH image. (B) ONH parameter outlining a small cup-to-discratio (C/D). (C) ONH Analysis Results (D) Manually placed edgesof retinal pigment epithelium (red-circles) allow for a computergenerated disc (blue shaded area). (E) Vertical ONH B scanwithout any graphics shows a thick RNFL at the ONH.
a
b
c
a b
c
d
e
348 | North American Neuro-Ophthalmology Society
FIGURE 10: Normal Optic Disc Cube 200x200 from Cirrus SD-OCT showing no progression. (A) RNFL Thickness Map. (B) En-face fundus image showing the location of theperipapillary circle scan location. (C) RNFL Tomogram extractedfrom the cube. (D) RNFL thickness profile compared to anormative database at the Temporal-Superior-Nasal-Inferior-Temporal (TSNIT) locations. (E) RNFL Thickness — Average,Quadrants, and Clock Hours. (F) Optic disc cube maps over 2 years showing no progression. These scan locations areautomatically registered within the cube with the intent to have a consistent circle scan location in following progression.(G) Progression graph of average, superior, and inferiormeasurements. (H) Progression graph of RNFL thickness profile.
FIGURE 11: Normal Optic Disc Cube 200x200 from Cirrus SD-OCT, advanced visualization function. (A) CSLO fundusimage showing the vertical (Purple line) and horizontal (blue line) scans available for viewing in the cube. (B) Vertical BScan through the ONH. (C) Hortizontal B Scan through ONH.
aa bb
c
d
e
f
g
h
a b
c
2010 Annual Meeting Syllabus | 349
FIGURE 12: Normal Macular Cube 200x200 from CirrusSD-OCT. (A) Macular thickness map. (B) Progressionanalysis map showing minimal change. (C) Hortizontal BScan from the macular cube.
FIGURE 13: Normal Optic Disc from Spectralis SD-OCT. (A) Confocal Scanning Laser Ophthalmoscopy ONH image(CSLO) overlay and background with a 3-Dimensionalhorizontal B scan through the ONH. (B) SLO ONH Imagewith peripapillary circle in green. (C) Sectoral RNFLmeasurements compared to a normative database. (D) Peripapillary Circle Scan. (E) RNFL thickness profilecompared to a normative database.
FIGURE 14: Normal Macula Images from Spectralis SD-OCT. (A) Confocal Scanning Laser Ophthalmoscopy (CSLO)background green lines indicating the individual B scans. The brightest line is the scan location seen in the image below.(B) Horizontal B-Scan through the macula.
a b
c
a
b c
d
e
a
b
350 | North American Neuro-Ophthalmology Society
FIGURE 15: Normal Images from TopCon SD-OCT.(A) Peripapillary circle scan. (B) Vertical scan through ONH. (C) Macular scan.
FIGURE 16: Normal Images from RTView SD-OCT. (A) En-faceONH Image. (B) 3-Dimensional horizontal ONH scan cube datawith CLSO overlay. Green line in (A) indicating location of scan.(C) ONH scan. (D) Peripapillary cirlcle scan. (E) Thickness map ofONH compared to a normative database. (F) RNFL profilecompared to a normative database. (G) Horizontal cross-linescan of macula. (H) Vertical cross-line scan of macula. (I) GanglionCell Complex (GCC) Scan of the macula with thickness map (left)and significance map (right).
b
c
a
b
c
d
e
f
g
a
2010 Annual Meeting Syllabus | 351
TAKE HOME POINTS1. Use OCT scans with a high quality signal strength.
2. Use OCT scans with good alignment around the
ONH and on the macula.
3. It is beneficial to analyze data using the normative
database.
CASE 2: GLAUCOMA — THE FOCAL DEFECT WITH EXCELLENT CORRESPONDENCE BETWEENSTRUCTURE AND FUNCTIONThis was the left eye of a 57 year old female with normal
tension glaucoma treated with Lumigan, Cosopt, and
Alphagan. Best corrected visual acuity was 20/30 wearing
a prescription of +0.75+0.50x90 and the IOP was 11 mm.
The anterior segment examination was normal with wide
open angles. The dilated fundus exam revealed an ONH
with C/D = 0.85x0.6 with no other abnormalities
(Fig. 19 A).
Red-free photography reveals a RNFL wedge defect at
4:00 (Figure 19B black arrows). Humphrey visual fields
(HVF) showed a superior nasal step and superior
paracentral scotoma (Figure 20).
FIGURE 17: Normal Images from Scanning Laser Polarimetrywith the highest quality (10/10). (A)Nerve fiber layer thicknessmap of the ONH. (B) Deviation map compared to a normativedatabase.
FIGURE 18: Normal Images from CSLO. (A) MoorfieldsRegression Analysis within normal limits within each sector. (B) Topographic Change Analysis over 8 years showing normalvariation around blood vessels on a CSLO background. (C) RNFL Profile compared to a normative database.
h
i
a b
a b
c
352 | North American Neuro-Ophthalmology Society
Imaging with OCT, both TD (Fig. 21-23) and SD (Fig. 24)
confirm this defect. Confocal scanning laser
ophthalmoscopy (CSLO) and Scaning Laser Polarimetry
also confirms this defect (Fig. 25 A and B, respectively).
FIGURE 19: Color disc photo (left) and Red-Free photo (right)with discoloration indicating an area of defect (between blackarrow), better seen in the red-free photo.
FIGURE 20: HVF showing visual fields with a superior nasal stepand superior paracentral scotoma. Grey scale (left) and patterndeviation (right). Glaucoma Hemifield Test (GHT) is outside ofnormal limits, visual field index (VFI)= 80%, mean deviation(MD)=-4.66 dB with p<0.5%, pattern standard deviation(PSD)=8.63dB with p<0.5%.
FIGURE 21: Images from Stratus TD-OCT Peripapillary CircleScan. (A) B Scan showing focal RNFL inferiotemporal thinning(white arrow). (B) RNFL thickness profile comparison to anormative database confirming the inferiotemporal defect seenin (A). (C) Clock-hours (left) and quadrants (right) comparison toa normative database, again confirming the finding in (A).
FIGURE 22: Stratus OCT macula raster scan. (A) Macular B scanat 330 degrees. Note the thin RNFL indicated by the whitearrow. (B) Thickness chart – overall retinal thickness comparedto a normative database. (C) Retinal volume map quantitativecolor map (left) and sectoral comparison to a normativedatabase (right).
a b
a b
a
b
c
a
b
c
2010 Annual Meeting Syllabus | 353
FIGURE 23: Stratus OCT Images (A) Optic Nerve Head Map. Black arrow indicating where the neuroretinal rim isthinnest, 4:00. (B) Radial B Scan through ONH 4:00 withmanually placed edges of retinal pigment epithelium (red-circles) allow for a computer generated disc (blue shaded area). (E) Identical B scan as (B) without any graphics.
FIGURE 24: Images from RTView SD-OCT (A) “NHM4” ONHScan showing a neuroretinal rim thinnest inferiorly. (B) ONHScan with RNFL sector measurements along the 3.45mmdiameter peripapillary circle. (C) RNFL Thickness Profile alongthe 3.45 mm circle. (D) Vertical Crossline through the maculashowing decreased reflectance of the inferior RNFL.
a
b
c
a
b
c
d
354 | North American Neuro-Ophthalmology Society
TAKE HOME POINTS1. Defects in the RNFL are displayed in the visual field
inverted and reversed.
2. Red free photos are the best type of photo to view
a focal neurofiber bundle defect.
3. The peripapillary circle, ONH, and macula scans can
all provide information about RNFL wedge defects.
CASE 3: ADVANCED GLAUCOMA – THE CENTRAL ISLANDThis was the right eye of a 56 year old male with
primary open angle glaucoma (POAG) treated with a
trabeculectomy. All images are taken after the surgical
treatment. Best corrected visual acuity was 20/30 and
the IOP was 14 mm. The anterior segment examination
was normal other than a flat bleb without leak superiorly
and a patent peripheral iridotomy. The dilated fundus
exam revealed an ONH with a barely perceptible
neuroretinal rim (C/D = 0.99) with no other abnormalities.
Humphrey visual fields (HVF) showed a severly depressed
field with only central vision spared (Figure 26).
Imaging with OCT, both TD (Fig. 27) and SD (Fig. 28)
confirm this defect. Confocal scanning laser
ophthalmoscopy (CSLO) and Scaning Laser Polarimetry
also confirms this global defect (Fig. 30 and 31,
respectively). The macula RNFL thickness remains normal
(Figure 29), corresponding with the remaining central
vision.
FIGURE 25: Other imaging modalities confirm the focal defect.(A) CSLO. (B) SLP.
FIGURE 26: HVF Grey Scale. Pattern deviation is notcommuted by the technology for severely depressedfields.GHT is outside of normal limits, VFI= 11%, MD=-29.59dBwith p<0.5%, PSD=7.89dB with p<0.5%.
FIGURE 27: Images from Stratus TD-OCT Peripapillary CircleScan. (A) B Scan showing global RNFL thinning. (B) RNFLthickness profile comparison to a normative databaseshowing the topography to have thinned predominantlysuperiorly and inferiorly with relative temporal sparing. (C) Clock-hours (left) and quadrants (right) comparison to anormative database.
a
b
2010 Annual Meeting Syllabus | 355
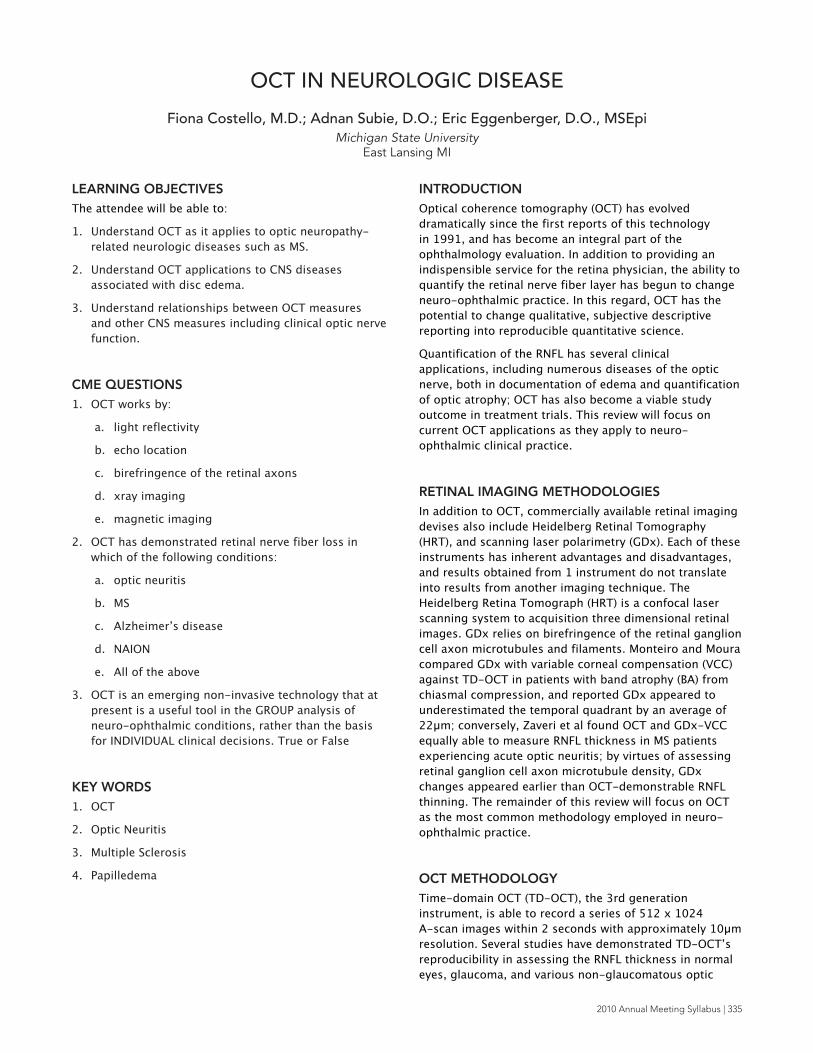
FIGURE 28: (A) Optic Disc Cube 200x200 from Cirrus SD-OCT. (A) RNFL Thickness Map displays global thinning (top). En-face fundus image showing thinning most prominentsuperiorly and interiorly (bottom). (B) RNFL Thickness –Average (top), Quadrants (middle), and Clock Hours(bottom). (C) RNFL Tomogram extracted from the cube. (D) RNFL thickness profile compared to a normativedatabase at the TSNIT locations.
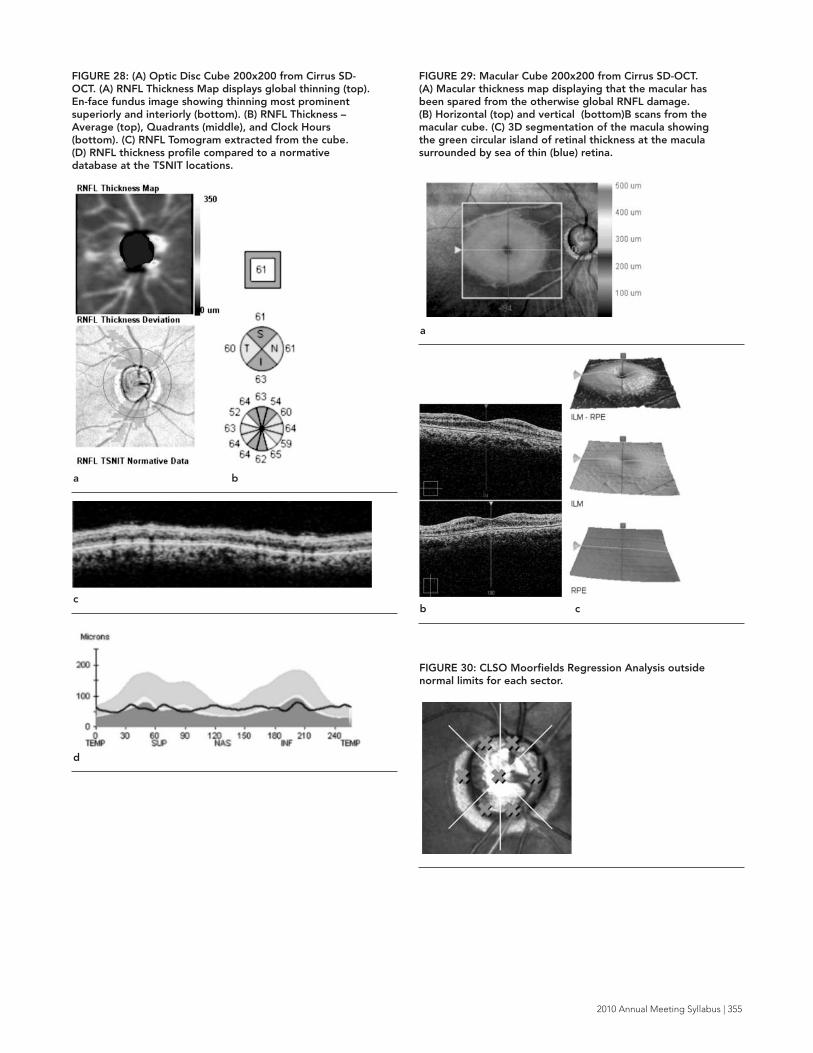
FIGURE 29: Macular Cube 200x200 from Cirrus SD-OCT. (A) Macular thickness map displaying that the macular hasbeen spared from the otherwise global RNFL damage. (B) Horizontal (top) and vertical (bottom)B scans from themacular cube. (C) 3D segmentation of the macula showingthe green circular island of retinal thickness at the maculasurrounded by sea of thin (blue) retina.
FIGURE 30: CLSO Moorfields Regression Analysis outsidenormal limits for each sector.
a b
c
d
a
b c
356 | North American Neuro-Ophthalmology Society
TAKE HOME POINTS1. The RNFL thickness “bottoms out” at 40 microns
in severe damage.
2. Although the TD- and SD-OCT are not
quantitatively identical, they can both provide
into a RNFL defect location and severity.
CASE 4: GLAUCOMA — GLOBAL PROGRESSION This was the left eye of a 52 year old female with juvenile
glaucoma secondary to juvenile rheumatory arthritis. She
was treated with a trabeculectomy in 2004. She also has
ocular rosacea and is psuedophakic. All images are taken
after the surgical treatments. From 2005 to 2009 she
progressed globally both structurally by OCT and
functionally by HVF.
From 2005-2009, the patient’s exam remained stable.
Best corrected visual acuity was 20/30 and the IOP was
12 mm Hg, and remained stable without drops. External
exam was notable for telangiectasis on the lids. The
anterior segment examination was normal other than a
flat bleb without leak superior and a patent peripheral
iridotomy. The posterior chamber intraocular lense was
in place. The dilated fundus exam revealed a pale ONH
with a thin neuroretinal rim (C/D = 0.9) with no other
abnormalities.
Red-free photography clearly shows a loss of the
neurofiber layer from 2005 to 2009. In 2005, clear
neurofiber bundles are visualized following the vascular
arches (Figure 32 B). In 2009, these striations have
disappeared and the shadows of choroidal vessels
are clear (Figure 32D).
In 2005 and 2009, HVF showed significantly depressed
fields with both superior and inferior arcuate scotomas
and superior and inferior nasal steps. (Figure 33).
Glaucoma progression analysis showed a significant VF
deterioration in the superior and inferior nasal step areas.
(Figure 34A). The VFI analysis shows non-significant
progression (Figure 34B).
Imaging with TD-OCT (Figure 35) shows a significant
progression globally from 2005 to 2009 (Figure 36).
The RNFL thins much more than the HVF would suggest.
The macula RNFL thickness remains normal (Figure 37),
corresponding with the remaining central vision.
\
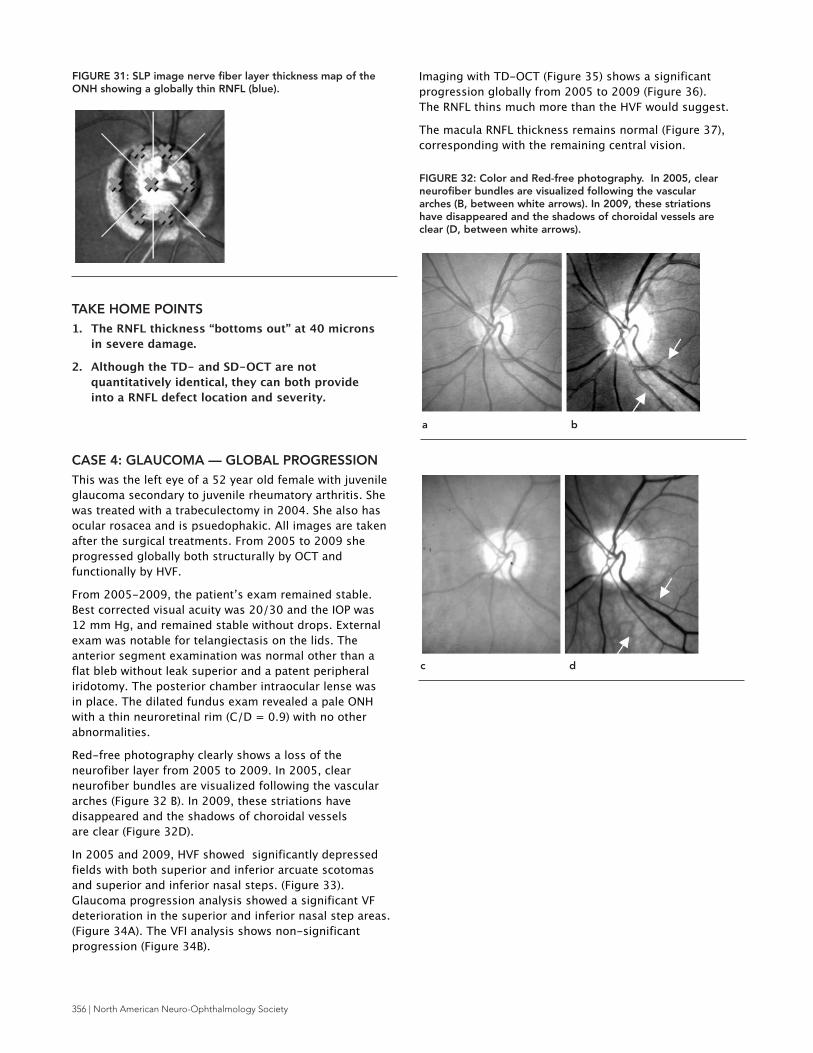
FIGURE 31: SLP image nerve fiber layer thickness map of theONH showing a globally thin RNFL (blue).
FIGURE 32: Color and Red-free photography. In 2005, clearneurofiber bundles are visualized following the vasculararches (B, between white arrows). In 2009, these striationshave disappeared and the shadows of choroidal vessels areclear (D, between white arrows).
a b
c d
2010 Annual Meeting Syllabus | 357
FIGURE 34: Glaucoma progression analysis (A) showed asignificant VF deterioration in the superior and inferior nasalstep areas. The VFI progression analysis shows non-significantprogression (B).
FIGURE 33: HVF grey scale (left) and pattern deviation (right)from 2005 (A and B) and 2009 (C and D) showing visual fieldswith a superior and inferior nasal step as well as a superiorand inferior arcuate. In 2005, GHT is outside of normal limits,VFI= 77%, MD=-9.82 dB with p<0.5%, PSD=7.28dB withp<0.5%. In 2009, GHT is outside of normal limits, VFI=73%,MD=-11.53 dB with p<0.5%, PSD=8.13dB with p<0.5%.
FIGURE 35: Stratus OCT TD-OCT Images in in 2005 (A, C,and E) and 2009 (B, D, and F). Images (A) and (B) show thecircumpaillary B scan in 2005 and 2009, respectively.Comparing (A) and (B) one can see the RNFL thinningglobally. Images (C) and (D) show the RNFL thickness profilecomparison to a normative database in 2005 and 2009,respectively. Images (E) and (F) show clock-hours (left) andquadrants (right) in comparison to a normative database in2005 and 2009, respectively.
a 2005
a
b
a 2005
b 2009
b 2009
c 2009
d 2009
e 2005
358 | North American Neuro-Ophthalmology Society
TAKE HOME POINTS1. OCT is a tool that is able to quantify progression,
even when a clinical fundus exam remains stable.
CASE 5: GLAUCOMA — “PREPERIMETRIC”This was the right eye of a 70 year old female with a
history of ocular hypertension since 1994, referred to the
glaucoma service in 2004 after a structural defect was
seen on imaging. No visual field defects appeared until
2006. She was treated in 2008 and 2009 with Selective
Laser Trabeculoplasty.
Best corrected visual acuity was 20/20 and the IOP was
recorded as 24 mm Hg in 2004 and 13 mm Hg in 2009.
The anterior segment examination was normal with open
angles. The dilated fundus exam revealed an ONH with
C/D = 0.9x0.8 in 2004 and 0.9x0.9 in 2009 with no other
abnormalities (Figure 38 A and B, respectively).
Humphrey visual fields (HVF) in 2004 show a normal field
and in 2009 shows a superior nasal and a superior arcuate
scotoma. (Figure 39 A and B, respectively).
Imaging with TD-OCT (Figure 41) displays a progressing
inferior RNFL defect from 2004-2009. The RNFL changes
are significant and progressive (Figure 42). Confocal
Imaging of the macula with OCT, both TD (Fig. 43) and SD
(Fig. 44) also show an inferior defect. Figure 44 displays
the progressive changes from 2006-2009.
FIGURE 36: Stratus TD-OCT Progression Analysis. (A) RNFLProfiles color coded by date (top) and graph of averageRNFL thickness (bottom) showing a significant rate ofchange. (B) Dates of scans color coded along with signalstrengths and quantitative measurements of each scan.
FIGURE 37: Vertical Macular B Scan (A) and Retinal ThicknessMap (B). The macula in this scenario has been preserveddespite the global damage.
a
b
f 2009
a
b
2010 Annual Meeting Syllabus | 359
FIGURE 38: Color ONH Photographs in 2004 (A) and 2009(B). Note the baring of the lamina cribrosa inferiorly fromand the superior neuroretinal thinning 2004 to 2009.
FIGURE 39: HVF from 2004 and 2009. HVF grey scale (left)and pattern deviation (right) from 2004 (A) and 2009 (B). In 2004, GHT is outside of normal limits, VFI= 100%,MD=+0.46 dB and PSD=1.78dB. In 2009, GHT is outside of normal limits, VFI=94%, MD=-2.73 dB with p<2%, andPSD=3.82dB with p<0.5%.
FIGURE 40: Glaucoma progression analysis from 2004-2009(A) showed a significant VF deterioration in the superiornasal step area. The VFI progression analysis from 2004-2009 shows non-significant progression (B).
FIGURE 41: Stratus OCT TD-OCT Images in in 2004 (A, C,and E) and 2009 (B, D, and F). Images (A) and (B) show thecircumpaillary B scan in 2004 and 2009, respectively.Comparing (A) and (B) one can see the RNFL thinninginferiorly and inferiotemporally (between white arrows).Images (C) and (D) show the RNFL thickness profilecomparison to a normative database in 2004 and 2009,respectively. Images (E) and (F) show clock-hours (left) andquadrants (right) in comparison to a normative database in2004 and 2009, respectively.
a 2004 b 2009
a 2004
b 2009
a
b
a 2004
360 | North American Neuro-Ophthalmology Society
FIGURE 42: Stratus TD-OCT Progression Analysis. (A) RNFLProfiles color coded by date (top) and graph of averageRNFL thickness (bottom) showing a significant rate ofchange. In between the black arrows, the graph highlightsthe inferior area that thins progressively from the first visit(black line) to the last visit (red line). (B) Dates of scans colorcoded along with signal strengths and quantitativemeasurements of each scan.
FIGURE 43: Macular Scan from Stratus TD-OCT. (A) Verticalmacular B Scan. (B) Retinal Thickness Chart. (C) RetinalThickness Map. The macula in this case shows some inferiorthinning.
a
b
a
b
b 2009
c 2004
d 2009
e
f
2010 Annual Meeting Syllabus | 361
TAKE HOME POINTS1. OCT is capable of detecting damage to the RNFL
before functional change occurs.
2. OCT is a tool that is able to quantify progression,
even when a clinical fundus exam remains stable.
3. Some progression analyses are very useful in
visualizing damage, especially for explaining to
patients.
CASE 6: GLAUCOMA — FLUCTUATING FUNCTIONBEFORE STRUCTUREThis was the left eye of a 75 year old male with a history
of ocular hypertension vs. POAG since 2000 treated with
Brimonidine-Timolol drops. A small focal superionasal
scotoma appeared from 2002- 2005, disappeared from
2006-2008, and reappeared in 2009 with no overall
progression (Figure 46). Until 2006 when the OCT
showed a clock-hour defect at 5:00, this spot was
considered a patient–dependent error or lid line mark.
In retrospect, this mark was indicative of impending
corresponding structural changes.
Best corrected visual acuity was 20/25 and the IOP was
recorded as 22 mm Hg in 2005 and 28 mm Hg in 2009.
The anterior segment examination was normal with open
angles. The dilated fundus exam revealed an ONH with
C/D = 0.8 in 2005 and 0.9 thinnest inferiorly in 2009 with
no other abnormalities. In 2006, a disc hemorrhage could
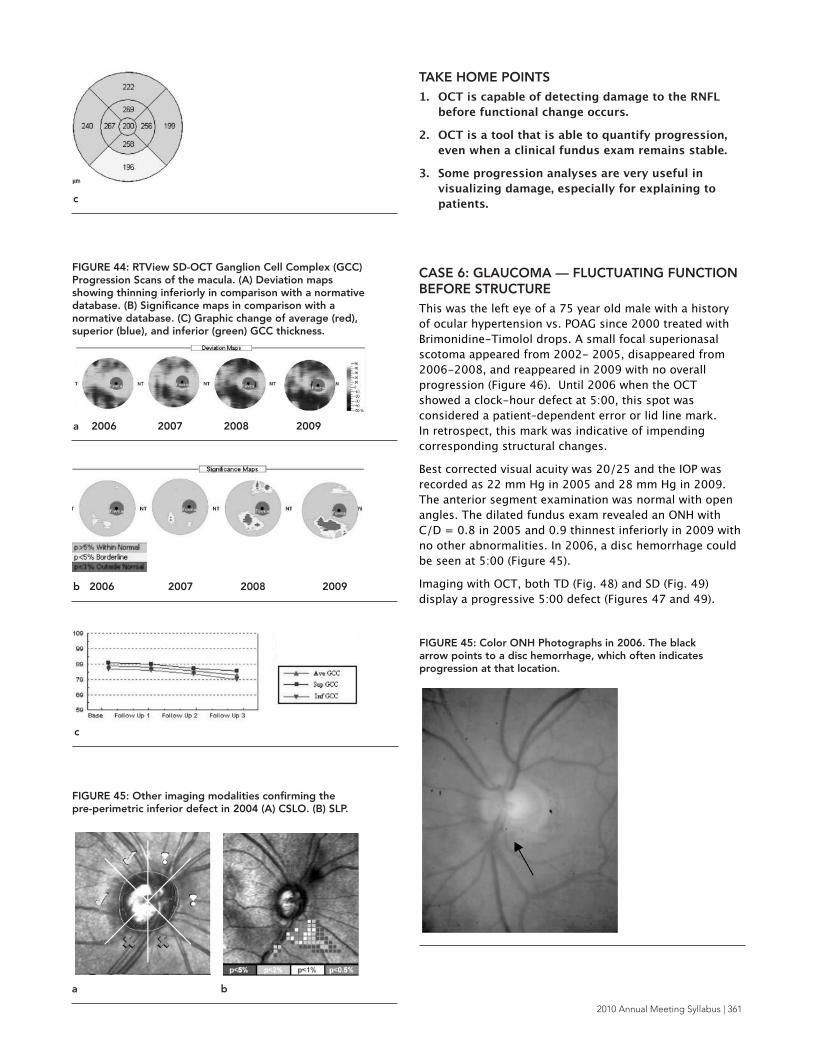
be seen at 5:00 (Figure 45).
Imaging with OCT, both TD (Fig. 48) and SD (Fig. 49)
display a progressive 5:00 defect (Figures 47 and 49).
FIGURE 44: RTView SD-OCT Ganglion Cell Complex (GCC)Progression Scans of the macula. (A) Deviation mapsshowing thinning inferiorly in comparison with a normativedatabase. (B) Significance maps in comparison with anormative database. (C) Graphic change of average (red),superior (blue), and inferior (green) GCC thickness.
FIGURE 45: Other imaging modalities confirming the pre-perimetric inferior defect in 2004 (A) CSLO. (B) SLP.
FIGURE 45: Color ONH Photographs in 2006. The blackarrow points to a disc hemorrhage, which often indicatesprogression at that location.
c
a 2006 2007 2008 2009
b 2006 2007 2008 2009
c
a b
362 | North American Neuro-Ophthalmology Society
FIGURE 46: HVF from 2002-2009. (A) HVF grey scale (top)and pattern deviation (bottom) shows a fluctuating focalsuperior scotoma. (B) VFI progression shows no progression.
FIGURE 47: Stratus TD-OCT Progression Analysis. (A) RNFLProfiles color coded by date (top) and graph of averageRNFL thickness (bottom) showing a significant rate ofchange. The black arrow indicates the inferior area that thinsprogressively from the first visits (black/purple line) to thelast visit (dark blue line). (B) Dates of scans color codedalong with signal strengths and quantitative measurementsof each scan.
FIGURE 48: Stratus OCT TD-OCT Images in 2004 (A, C, and E) and 2008 (B, D, and F). Images (A) and (B) show thecircumpaillary B scan in 2004 and 2009, respectively.Comparing (A) and (B) one can see the RNFL thinninginferiorly and inferiotemporally (between white arrows).Images (C) and (D) show the RNFL thickness profilecomparison to a normative database in 2004 and 2009,respectively. Images (E) and (F) show clock-hours (left) andquadrants (right) in comparison to a normative database in2004 and 2009, respectively.
b
a
b
2002 2004 2005
a 2007 2008 2009
a 2005
2010 Annual Meeting Syllabus | 363
TAKE HOME POINTS1. Beware of misleading HVF. Rely more on VF
CASE 7: GLAUCOMA — STABLE HEMIFIELDSTRUCTURAL DAMAGE WITH BOTH STABLE AND FLUCTUATING FUNCTIONAL CHANGESThis was the right eye of a 65 year old female with a
history of POAG treated with trabeculectomy in 2006. All
images are taken after the surgical treatment, 2007-2009.
Best corrected visual acuity was 20/20 and the IOP was
6 mm Hg, and remained stable without drops. The
anterior segment examination was normal other than a
superior avascular bleb without leak and a patent
peripheral iridotomy at 1:00. The dilated fundus exam
revealed a, the increased cupping from 2007-2009
C/D = 0.8 to 0.9 with no other abnormalities.
From January 2007- February 2009, HVF displayed a
dense inferior nasal step and arcuate scotoma. It also
seemed that the patient’s glaucoma had progressed
functionally to include both a superior nasal step and
arcuate scotoma. However, when the patient returned in
September 2009, the superior defects nearly disappeared.
Imaging with OCT, both TD (Fig. 52) displayed a stable
RNFL thickness through this time period (Figures 53).
Other SD-OCT technologies showed similar B scan
profiles (Figures 54-57).
FIGURE 50: Color ONH Photographs in 2009.
FIGURE 51: HVF from 2007-2009. (A) HVF grey scale (top)and pattern deviation (bottom) shows a fluctuating superiornasal step and arcuate scotoma. (B) VFI progression showsno progression.
FIGURE 52: Stratus OCT TD-OCT Images in 2009 andprogression analysis. Image (A) shows the circumpaillary B Scan. Image (B) shows the RNFL thickness profile incomparison to a normative database. Image C shows clock-hours (left) and quadrants (right) in comparison to anormative database. (A)-(C) all correspond with HVF withmore superior RNFL structural damage leading to a denseinferior defect.
a
b
c
b
a 1/2007 10/2007 2/2009 9/2009
2010 Annual Meeting Syllabus | 365
FIGURE 53: Stratus TD-OCT Progression Analysis. (A) RNFLProfiles color coded by date (top) and graph of averageRNFL thickness (bottom) showing no change. (B) Dates ofscans color coded along with signal strengths andquantitative measurements of each scan. Note, how stablethe measurements stay throughout the time period.
FIGURE 54: Optic Disc Cube 200x200 from Cirrus SD-OCT.(A) RNFL Thickness Map. (B) En-face fundus image showingthe location of the peripapillary circle scan location andcoloration based upon deviation from a normative database.(C) RNFL Tomogram extracted from the cube. (D) RNFLthickness profile compared to a normative database at theTSNITlocations. (E) RNFL Thickness – Average, Quadrants,and Clock Hours.
FIGURE 55: RTView SD-OCT NHM4 ONH Scan. (A) neuroretinal rim thinnest inferiorly. (B) ONH Scan withRNFL sector measurements along the 3.45mm diameterperipapillary circle. (C) RNFL Thickness Profile along the3.45 mm circle.
a
b
e
c
d
a
a b
b
366 | North American Neuro-Ophthalmology Society
TAKE HOME POINTS1. Again, beware of misleading HVF — even large
areas can fluctuate. Do not judge a single VF in
isolation of the others that preceded it.
2. Currently, the various OCT technologies are not
quantitatively comparable to one another.
3. OCT is an excellent quantitative, objective, and
9. Varma R, Steinmann WC, Scott IU. Expert agreement in
evaluating the optic disc for glaucoma. Ophthalmology
1992;99:215-21.
10. Artes PH, Iwase A, Ohno Y, Kitazawa Y, Chauhan BC.
Properties of perimetric threshold estimates from Full
Threshold, SITA Standard, and SITA Fast strategies. Invest
Ophthalmol Vis Sci 2002;43:2654-9.
11. Keltner JL, Johnson CA, Levine RA, et al. Normal visual field
test results following glaucomatous visual field end points in
the Ocular Hypertension Treatment Study. Arch Ophthalmol
2005;123:1201-6.
12. Kerrigan-Baumrind LA, Quigley HA, Pease ME, Kerrigan DF,
Mitchell RS. Number of ganglion cells in glaucoma eyes
compared with threshold visual field tests in the same
persons. Invest Ophthalmol Vis Sci 2000;41:741-8.
FIGURE 56: Spectralis SD-OCT. (A) Peripapillary circleB scan highlighting the RNFL with red lines. (B) RNFLthickness profile compared to a normative database.(C) Sectoral RNFL measurements compared to anormative database.
FIGURE 57: Peripapillary circle scan from TopCon SD-OCT.
a
b
c
a
2010 Annual Meeting Syllabus | 367
13. Schuman JS, Pedut-Kloizman T, Hertzmark E, et al.
Reproducibility of nerve fiber layer thickness measurements
using optical coherence tomography. Ophthalmology
1996;103:1889-98.
14. Paunescu LA, Schuman JS, Price LL, et al. Reproducibility of
nerve fiber thickness, macular thickness, and optic nerve
head measurements using StratusOCT. Invest Ophthalmol Vis
of the GDx VCC scanning laser polarimeter, HRT II confocal
scanning laser ophthalmoscope, and stratus OCT optical
coherence tomograph for the detection of glaucoma. Arch
Ophthalmol 2004;122:827-37.
46. Schuman JS, Wollstein G, Farra T, et al. Comparison of optic
nerve head measurements obtained by optical coherence
tomography and confocal scanning laser ophthalmoscopy.
Am J Ophthalmol 2003;135:504-12.
47. Lin SC, Singh K, Jampel HD, et al. Optic nerve head and retinal
nerve fiber layer analysis: a report by the American Academy
of Ophthalmology. Ophthalmology 2007;114:1937-49.
2010 Annual Meeting Syllabus | 369
LEARNING OBJECTIVES 1. Understand the linear relationship between retinal
nerve fiber layer thickness and corresponding visual
field areas of sensitivity.
2. Understand the limitations of using the retinal nerve
fiber layer thickness to diagnose and monitor optic
nerve disorders.
3. Understand the advantages and disadvantages of
using the retinal ganglion cell layer thickness
determined by OCT for diagnosis and management of
optic neuropathy.
CME QUESTIONS1. Which of the following factors may confound the
accurate OCT determination of RNFL thickness for
diagnosing optic nerve damage?
a) Blood vessels
b) Proliferation of glial elements in the retina
c) Scan signal to noise
d) Developmental differences in the distribution of
axon bundles in the retina
e) all of the above
2. Which of the following clinical conditions is likely to
show the highest correlation between structure and
function using OCT?
a) compressive optic neuropathy
b) NAION after 6 months
c) optic neuritis after 6 months from the acute attack
d) visual field loss in a patient with idiopathic
intracranial hypertension
e) all of the above
3. Which of the following factors may significantly
confound the correlation between ganglion cell layer
thickness and corresponding locations of visual
sensitivity?
a) the number of ganglion cell layers in the normal
retina at the locations being evaluated
b) peripheral field location of damage
c) spatial variability in the mapping of ganglion cell
location to corresponding visual field
d) extent of visual field damage
e) all of the above
KEY WORDSOptical Coherence Tomography
Retinal Nerve Fiber Layer
Ganglion Cells
Glaucoma
Anterior Ischemic Optic Neuropathy
Optic Neuritis
Most clinicians, especially neuro-ophthalmlogists and
glaucoma specialists, have been trying to understand
whether the information yielded by optical coherence
tomography is really helping them to improve upon the
clinical care of their patients. In this context, clinical
decision-making has mainly focused on the status of the
retinal nerve fiber layer (RNFL) thickness in relation to the
threshold sensitivity of the corresponding area of visual
field (see review, reference 1). Theoretically, it is expected
that the degree of thinning of the RNFL will have a
meaningful correlation with optic nerve function in a
patient with loss of axons2-4 and less correlation of
structure with function in locations where axons are still
intact, but not functioning. In the latter case, either a
return of function may still be possible, as in the case
with some eyes with compressive optic neuropathy5,
acute optic neuritis6-9, or ischemic optic neuropathy.
Alternatively, the axons may have undergone irreversible
dysfunction but not enough time has elapsed to produce
atrophy and thinning of the RNFL1.
LINKING AXONS AND NEURONS: UNVEILING MYSTERIES OF THE MACULA AND MODELING NEUROPROTECTION
Randy Kardon, M.D. Ph.D. University of Iowa, Hospitals and Clinics
Iowa City, IA
370 | North American Neuro-Ophthalmology Society
The clinical interpretation becomes even more difficult in
the setting of optic disc edema associated with visual field
loss, since there may be swelling of some axons with
atrophy of neighboring axons, confounding the
relationship between RNFL thickness and corresponding
visual field sensitivity, as long as axon swelling is present
and atrophy is not yet complete. Another potential
confounding variable is the status of other components
that make up the thickness of the RNFL, besides axons,
such as blood vessels and glial elements, which may
influence the measured thickness of the RNFL1,10,11.
Attempts to quantify the relationship between structure
and function between RNFL thickness and visual threshold
at corresponding locations have discovered that there is a
correlation (primarily studied in glaucoma and anterior
ischemic optic neuropathy), but not as great as one would
expect (refs). Factors such as measurement variability in
both visual threshold and in RNFL thickness, the influence
of non-neuronal elements on the RNFL thickness such as
blood vessels and glial elements, and the inter-individual
variation in mapping of RNFL bundles to their
corresponding area of the visual field all confound the
correlation in an individual patient. We have recently
reviewed this topic1 and have provided evidence for a
linear model relating visual threshold (unlogged) and
RNFL thickness in glaucoma and AION2-4. This is depicted
in Fig 1 in semi-log plots.
While the relationship between RNFL thickness and visual
field sensitivity appears to correspond to a linear model,
there are still between and within subject components of
measurement variability that impose limitations of this
framework and its application to individual patients (see
Figure 2). In addition, the dynamic range of both the
RNFL and threshold sensitivity and their associated
measurement variability limit meaningful relationships to
be explored once 10 decibels of threshold loss have been
exceeded or if the RNFL thickness drops below 60 microns
for arcuate field loss.
In glaucoma studies, the RNFL thickness has been shown
to have a very good sensitivity and specificity for
diagnosing glaucoma, using Receiver-Operator
Characteristic curve analysis (ROC). It is important to keep
in mind that such analyses are always influenced by the
criteria that are chosen as the gold standard for the
presence or absence of the disease, the characteristics of
the population being studied in terms of the distribution
of severity of damage in the population included, and
whether structure (disc appearance) or function (visual
field sensitivity and the pattern of loss) is used as the
criteria for the presence of glaucomatous or optic nerve
disease.
A great deal of research has also been directed towards
using the RNFL thickness to detect progression of
glaucomatous damage over time (refs). Most of these
studies have applied techniques that have also been used
to study progression of visual field loss, namely a)
significant change in RNFL status at a given time point
from a prior baseline measurement or b) linear regression
analysis of RNFL thickness over time. The main problems
encountered in detecting progression using these
FIGURE. 1: Relationship of the retinal nerve fiber layer(RNFL) thickness to visual field loss in patients with glaucomaand AION. (A) A schematic illustrating the location of thecorresponding disc sectors and field regions for the superiorarcuate field (left panel) and inferior arcuate field (rightpanel). (B) RNFL thickness as a function of field loss for theupper field/inferior disc (left panel) and the lowerfield/superior disc (right panel). Data are shown for patientswith AION (n = 24; filled gray), asymmetric glaucoma (n =15;filled black), and severe glaucoma (n =16; open symbols),and for the mean of a group of 60 age-similar controls (opensquare). The theoretical structure-function curves are fittedto a linear function, but plotted here on a semi-log plot. Forthe upper and lower visual field regions, three theoreticalcurves are shown (50th percentile=solid line, 95th percentile,and 5th percentile = dashed lines). From review reference 1(with author permission).
FIGURE 2: The ellipses are the 95% confidence boundaries ofthe linear model of structure vs function with variabilitycomponent shown for different glaucoma disease states, d,expressed in decibels of field loss. The 95% ellipses for thecombined within- and between-individual variability (green),for between-individual variability excluding within-individualvariability (red), and for within-individual variability excludingbetween-individual variability (blue) are shown for six levelsof decibel visual field loss (from reference 4 with authorpermission).
2010 Annual Meeting Syllabus | 371
approaches are measurement variability and using
population statistics to determine what constitutes a
significant change over time. Individuals appear to vary
considerably in their measurement variability, so applying
population statistics (defining the variability of a given
patient by applying the variability from a population of
patients) to a given patient may not be optimal for
individualizing the analysis of progression for a given
patient. In addition, defining a statistically significant
change over time may not always equate with what is a
clinically significant change — one that would warrant a
deviation in treatment. Because the rate of glaucomatous
visual field progression varies considerably among treated
and untreated patients and the rate is, in general, slow,
the challenge in the future will be to identify as early as
possible which patients are at the most risk for
progression and focus aggressive treatment on those
patients while not applying the same treatment to patients
who are at low risk for significant progression over their
remaining life expectancy.
For neuro-ophthalmology, the OCT landscape for optic
nerve diseases other than glaucoma pose similar
problems. These mostly encompass the following
disorders and focus on questions regarding the
application of OCT to diagnosis and treatment:
1. Multiple Sclerosis: In this setting OCT is being used to
help substantiate the diagnosis of multiple sclerosis,
determine whether OCT can be used to monitor the
course and treatment of demyelinating disease and
predict which patients are likely to progress at a faster
rate, requiring a more tailored treatment approach6-9.
There is also evidence that total macular thickness may
also reflect neuronal loss in multiple sclerosis13. The
main interest at present is whether acute optic neuritis
is a good model for evaluating the efficacy of new CNS
multiple sclerosis treatment strategies, such as the use
of neuro-protectants and whether the use of OCT is a
valid surrogate for modeling the status of multiple
identified (such as neural opening size in the sclera)
which might predict which patients are at the most
risk for progressive visual field loss during the acute
phase of NAION and who may respond to treatment
interventions during the first 2 weeks (e.g. steroids).
It may be possible to use OCT to help identify patients
that are most likely to benefit from treatments aimed
at preserving axons.
3. Compressive optic neuropathy: The presumption is
that the greater number of axons that are present at
the time of diagnosis, the higher potential for visual
recovery if decompression is successful5. Here the
confounding variables are how much time must elapse
before axonal degeneration is detectable on OCT at
the time of diagnosis and how many neurons/axons
are required to support adequate visual function which
may influence treatment decisions?
4. Papilledema: When the optic nerve appears swollen,
the main questions applicable to OCT concern whether
true papilledema is present vs. pseudopapilledema12,
whether the change in optic disc edema over time can
be better quantified using thickening of the RNFL with
OCT compared to the fundus appearance of the optic
nerve and whether axon loss can be detected while the
disc is still swollen and differentiated from a reduction
in RNFL thickness due to lowering of intracranial
pressure.
5. Differentiation of optic neuropathy from
retinopathy and identifying disorders in which
both are present: OCT scans of other portions of the
posterior pole besides the RNFL can be very revealing.
For example, acute or subacute visual field loss with a
thickened macula on OCT but without obvious
evidence of retinal edema on fundus exam may help
point the diagnosis more correctly toward a branch or
central retinal artery occlusion (CRAO), and away from
anterior or posterior ischemic optic neuropathy,
inflammatory, or compressive optic neuropathy. In the
chronic state, an abnormally reduced total macular
thickness keeping company with a thinned RNFL and
pale nerve may also help make the diagnosis of a
previous retinal artery occlusion, without requiring an
electroretinogram (ERG) or neuro-imaging. Another
example is a patient with possible neuroretinitis and
persistent visual field loss; the combination of an OCT
scan of the peripapillary RNFL and macula scan may
help reveal the layer of the retina which is most likely
to be the source of pathology explaining the visual
field loss.
Most ophthalmologists use the macula OCT to
diagnose disorders causing loss of the photoreceptors
in the outer retina or disorders causing fluid
accumulation in the retina (e.g. cystoid macular
edema, diabetic macular edema, vitreal traction,
perifoveal telangiectasia, choroidal neovascular
membrane), or macular holes. Such patients may make
their way into a neuro-ophthalmology clinic and a
macular OCT may be an important diagnostic tool to
narrow the differential and reduce cost of a work-up.
The factors discussed above pose limitations on relating
the retinal nerve fiber layer to visual threshold and axon
loss. This has prompted an interest in going to the source
of the axons – the soma of retinal ganglion cells, which
predominate in the macula. Here the question is whether
the ganglion cell layer can be accurately quantified within
the macula scan using current OCT technology and
whether a change in the number of viable neurons can
accurately be detected with current software. This also
presupposes that the ganglion cells in the macula are
adequate surrogates for disease affecting the visual field
outside of the macula.
372 | North American Neuro-Ophthalmology Society
Segmentation of the ganglion cell layer within the
central macula with spectral domain OCT has a
number of potential advantages:
1. The retinal ganglion cells are densest in the macula
and form a stratified multi-cellular layer within the
central 6 degrees of visual field. Therefore, loss of
axons and the corresponding soma in this location is
likely to cause a thinning of the retinal ganglion cell
layer.
2. The lack of large retinal vessels in this location makes
their confounding contribution to the thickness of the
ganglion cell layer very minimal, compared to the
peripapillary retina, where they do influence the RNFL
measurement.
3. The mapping of visual field location to corresponding
ganglion cell soma is less complicated than the
situation with the RNFL bundles and may show less
inter-individual developmental variability.
Simplistically, a focal light in the macula activates the
ganglion cells directly underlying it. In the foveal and
perifoveal location this is not strictly the case and
some modification has to be made in this area of the
visual field due to displaced ganglion cells.
4. Recent advances in OCT image analysis using both
manual14 and automated analysis in three
dimensions15,16 have provided a potential solution
for delineation of the different neuronal layers in the
macula (Figures 3-4).
5. Preliminary attempts to quantify the correlation
between visual threshold and retinal ganglion cell
thickness in the macula appear to subjectively
correlate with the spatial pattern of visual field loss
in the macula in patients with glaucoma (Figure 5)
and anterior ischemic optic neuropathy. However,
a quantitative correlation between ganglion cell
thickness and corresponding overlying visual threshold
has not yet been reported in detail.
Challenges associated with OCT analysis of the macula
that need to be overcome before clinical monitoring of
optic nerve function is useful:
1. Total macula thickness is a measurement that is not
likely to be specific and sensitive enough to detect
small changes in the ganglion cell layer associated
with optic neuropathy. This is why segmenting the
different layers is likely to be a better approach.
FIGURE 3: Automated software 3D segmentation of theretinal layers of the normal macula using spectral domainSDOCT. Segmenation is shown for one of many successiveslices of the volume macula scan. The software uses allsurrounding volume image information to segment the layers.
FIGURE 4: Thickness and thickness variability (standarddeviation) maps of six macular intraretinal layers from theright eye of 15 normal subjects. The micron thickness of thedifferent macula layers is color coded (red=thickest,blue=thinnest).
FIGURE 5: Example of a glaucoma patient whose visual fielddefect came close to the center of their visual field and wastested with a denser visual field testing program coveringonly 10 degrees of radius and which corresponds to the areaof retina covered by the macula scan on the correspondingspectral domain OCT. The gray scale map shows visualsensitivity loss that was worst in the top part of the visualfield (dark areas), but also shows some loss in the inferiorfield. The visual field sensitivity di�erence from normal plot isalso shown below the gray scale with the abnormal area withdecrease in sensitivity surrounded by a red dotted line. Thestatistical probability plot of the same visual field data isshown in the lower left corner. 3D-OCT was obtained on thiseye and segmented into the inner retinal layer (ganglion cellsand axons) and outer retinal layer containing thephotoreceptors and bipolar cells. Note the high spatialcorrelation between the thinned layer containing theganglion cells in the inferior macula (thinned areas are redand yellow and depicted as di�erence from normal) and thecorresponding superior (and inferior) areas of visual fielddefect. However, there is no such thinning in the outer retinawhich is known not to be a�ected in most glaucomatousdamage.
2010 Annual Meeting Syllabus | 373
2. Current commercially available OCT and associated
software are not capable of segmenting the ganglion
cell layer in three dimensions. At best, one
manufacturer (Optoview) purports to segment the
inner layers of the retina of the macula as a neural
complex layer (RNFL, ganglion cell layer and inner
pleximform layers), but this software analysis has not
yet been rigorously validated. Recently Don Hood and
colleagues reported to have manually segmented two
dimensional line scans through the macula and have
shown correlation of thinning of the ganglion
cell+inner plexiform layer with corresponding loss of
visual threshold in glaucoma, so this approach does
have promise14. Our group has reported automated
segmentation of retinal layers using a 3D graph search
approach applied to volume OCT scans, as shown in
Figures 3-515,16.
3. Outside of the central 6 degrees of the macula, the
ganglion cell layer is less of a multi-cellular layer. In
areas where there is only a single layer of ganglion
cells it is not known if loss of soma will cause a
measurable, significant thinning of the cellular layer or
whether it will just be replaced by glial and Mueller
cells, making structural thinning of the ganglion cell
layer of the inner retina difficult to measure.
4. Focal peripheral visual field damage would be unlikely
to affect the retinal ganglion cell layer in the macula,
making it theoretically less sensitive to detection and
monitoring of peripheral field pathology. On the other
hand, most optic nerve diseases do show some degree
of diffuse loss and although significant abnormalities
in visual threshold may not be detected, there still may
be a measurable decrease in retinal ganglion cell
thickness in the macula, even though a visual field test
may appear to show mainly extra-macular loss of
sensitivity.
5. It is currently not known how much time it takes for a
decrease in the thickness of the ganglion cell layer to
occur after damage to the optic nerve at different
distances from the globe. The time delay between
permanent damage and atrophy of the ganglion cell
layer would provide a framework for dating the time
of injury.
In summary, recent improvements in OCT resolution and
automated segmentation software has provided a means
of relating visual pathway damage to structural changes in
the RNFL and corresponding soma of the ganglion cells in
the macula. Ganglion cell layer analysis in volume OCT
data may provide yet another piece of the puzzle to
understanding structure-function relationships and its
application to diagnosis and monitoring of optic nerve and
retinal diseases.
CME ANSWERS1. e) all of the above; all of these factors may influence
the ability to differentiate a normal RNFL from an
abnormal thinning due to optic nerve damage
2. b) thinning of the RNFL reaches a maximum at
6 months following acute injury from AION. The
other conditions may not show as good a correlation
between structure and function.
3. e) all of the above.
REFERENCES1. Hood DC, Kardon RH: A framework for comparing structural
and functional measures of glaucomatous damage. Prog
Retin Eye Res 2007;26(6):688-710.
2. Hood DC, Anderson SC, Wall M, Kardon RH: Structure versus
function in glaucoma: an application of a linear model. Invest
PLATFORM PRESENTATIONGANGLION CELL LAYER VOLUME BY SPECTRALIS OPTICAL COHERENCE TOMOGRAPHY (OCT) IN MULTIPLE SCLEROSIS
Emma Davies1, Dina Jacobs1, James Wilson1, Clyde Markowitz1, Steven Galetta1, Elliot Frohman2, Peter Calabresi3, Laura Balcer1
1University of Pennsylvania School of Medicine, Philadelphia, PA, United States, 2University of Texas Southwestern Medical Center, Dallas, TX, United States, 3Johns Hopkins University School of Medicine, Baltimore, MD, United States
376 | North American Neuro-Ophthalmology Society
2010 Annual Meeting Syllabus | 377
LEARNING OBJECTIVES1. To understand how OCT helps identify maculopathy
that may mimic optic neuropathy.
2. To understand how OCT can aid in the management of
various optic neuropathies.
3. To understand some of the limitations of OCT and how
to avoid misinterpretation of OCTs.
CME QUESTIONS1. OCT can identify all but which of the following macular
lesions that may not be apparent clinically?
a. Occult outer retinopathy, including MEWDS
b. Stargardt’s disease
c. Cone dystrophy
d. Solar maculopathy
2. OCT can clearly distinguish improvement of
papilledema from evolution of papilledema into
atrophic papilledema. True or False?
3. Nerve fiber layer analysis by OCT can distinguish mild
papilledema from psuedopapilledema. True or False?
KEY WORDS1. Optical Coherence Tomography
2. Occult Maculopathy
3. Optic Neuropathy
4. Papilledema
5. Optic Neuritis
6. Anterior Ischemic Optic Neuropathy
INTRODUCTIONI have been fortunate to have access to optical coherence
tomography (OCT) since its inception thanks to
collaboration between Joel Schuman and others at the New
England Eye Center1 with Jim Fugimoto at M.I.T.2 At first,
this appeared to be a tool primarily useful for retina
specialists, but, as optic nerve analysis became more
refined for the use in glaucoma, its use in other types of
optic neuropathy became more apparent. However, there
are still some difficulties with regard to this, which will be
reviewed below. What turns out to be most useful in
neuro-ophthalmic practice is the ability of OCT to identify
and prove occult maculopathy mimicking optic
neuropathy, and this has had a significantly positive
impact on my practice.
HOW I USE OCT IN MY NEURO-OPHTHALMICPRACTICEProving Maculopathy That May Mimic Optic
Neuropathy
Years ago, the diagnosis of occult maculopathy mimicking
optic neuropathy depended on subtle and often indirect
findings. Frequently, this also required ruling out optic
neuropathy, sometimes at significant expense. It was not
unusual for neuro-ophthalmologists to become engaged
in a dialogue with a retina specialist who insisted that a
patient with unexplained visual loss had optic neuropathy,
when the neuro-ophthalmologist was sure that the
problem was indeed macular, but had no clear way of
proving this. Central serous retinopathy was a common
maculopathy, which could mimic optic neuropathy yet
could easily be identified with fundus fluorescein
angiography. However, now, with more refined OCT
techniques, other retinal conditions mimicking optic
neuropathy are more easily proven.
The diagnosis of macular hole and epiretinal membrane
often required considerable discussion between neuro-
ophthalmologists and retina colleagues in the past. Now
macular hoe is a favorite diagnosis for retina specialists
now that it can be treated surgically. OCT reliably and
consistently demonstrates macular holes and epiretinal
membranes.3 Another group of conditions, now more
easily identified using OCT, the occult outer retinopathies,
includes multiple evanescent white-dot syndrome, acute
zonal occult outer retinopathy, and acute idiopathic blind
spot enlargement syndrome. These conditions are
especially easy to identify with high-resolution OCT
whereby the inner segment/outer segment junction is
usually affected in the retinal areas corresponding to the
clinical findings.4-8 These diagnoses are also made with
more assurance using multifocal retinography. However,
OCT is much easier and quicker for the patient and usually
suffices.
We have also found that ultra-high resolution OCT helps
in localizing the cause of microscotomas to the outer
retina. However, we still do not have a better
understanding of the pathophysiology of this condition.
Hopefully, with more detailed OCT, the mechanism by
which these micro scotomas occur will become apparent.
The structural findings in some patients with
microscotoma that we see with OCT do resemble those
which are seen with phototoxic maculopathy9-11 which can
EVIDENCE MEETS PRACTICE: TAKE-HOME POINTS ON OCT
Thomas R. Hedges III, MDTufts University
Boston, Massachusetts
378 | North American Neuro-Ophthalmology Society
result in a very discrete area of inner segment/outer
segment loss in such individuals. It also resembles what is
occasionally seen in patients with epiretinal membrane.12
Bilateral central visual loss in young people with
apparently normal appearing retinas and optic nerves has
been a diagnostic dilemma until recently. Frequently,
these children have required a variety of rather expensive
investigations. Although multifocal electroretinography
can identify juvenile retinal degeneration or Stargardt’s
disease when it does occur, OCT does show distinctive
macular outer retinal changes early on, and I think OCT
will become the standard way of making this diagnosis in
the future.13 Multifocal electroretinography may be
difficult in young children, although we have been able to
use this approach in some individuals as young as six
years of age. We have also found that OCT is as sensitive
in identifying hydroxychloroquine retinopathy as
multifocal ERG.14 OCT allows neuro-ophthalmologists to
make diagnosis of occult maculopathy much more
efficiently and, this has saved me time and has saved
patients considerable expense.
OPTIC NEUROPATHY IN THE PRESENCE OFRETINOPATHYOCT can identify optic neuropathy when there is nerve
fiber layer loss, and this may be the first clue that there is
an insidious optic neuropathy occurring such as with optic
nerve sheath meningiomas. In individuals with mild
decrease in visual acuity, mild visual field constriction,
mild color vision loss, and subtle visual field constriction,
finding nerve fiber layer thinning provides more objective
evidence that there is an optic neuropathy that requires
further investigation. We have been impressed with how
optic nerve head analysis by OCT will identify optic
neuropathy in the presence of a known maculopathy.
Even though such individuals may have visual field
characteristics that are more typical of optic neuropathy,
such as bitemporal hemianopia, frequently a concomitant
fiber layer changes on OCT does help motivate me at least
to obtain MRI scans when a retinal surgeon sends me a
patient in whom the possibility of an optic neuropathy
coexisting with maculopathy arises.
FUNCTIONAL LOSS OF VISIONOCT can provide further objective evidence of normal
structure in patients suspected of having functional visual
loss. However, one must remember that retinal nerve fiber
layer degeneration does take time to develop, and a
normal RNFL thickness does not always rule out a
compressive optic neuropathy. However, in patients who
have had functional visual loss for many months or years,
a normal RNFL thickness, along with a normal macular
scan, is strong, objective evidence that there is no
structural pathology accounting for visual loss that is
likely functional in nature.
OPTIC NERVE SWELLINGWe have attempted to use OCT to differentiate mild
papilledema from pseudopapilledema. OCT can show
optic nerve head drusen, and, when there are significant
drusen, one would expect the retinal nerve fiber layer to
be thin.15 However, in those individuals with congenitally
crowded optic nerve heads, without significant drusen, we
have been impressed that OCT shows thickening of the
nerve fiber layer, similar to that which occurs in mild
papilledema.16 Therefore, we now use OCT to observe
such individuals with suspected pseudopapilledema over
time, just the way we used to use photographs for this
purpose. If the OCT does not show any change in the
nerve fiber layer thickness over time, then we can assume
that such individuals were born with crowded nerves and
thicker nerve fiber layers. The finding of thickened nerve
fiber layer on circumferential OCTs in patients with
pseudopapilledema is not surprising, considering that
there is axoplasmic flow stasis in these individuals, just as
there is in those with true papilledema. Of course, one
must remember that patients with pseudopapilledema can
FIGURE 1. Inner segment/outer segment defect in a patientwith a paracentral microscotoma.
FIGURE 2. Perifoveal inner segment/outer segment loss in apatient with Plaquenil retinal toxicity. Note also the presence ofepiretinal membrane on the right portion of the inner retina.
2010 Annual Meeting Syllabus | 379
develop increased intracranial pressure and these two
conditions may occur simultaneously. Recently, one report
showed evidence that peripapillary subretinal fluid may be
seen exclusively in patients with pathologic optic nerve
swelling either from increased intracranial pressure or
from ischemic optic neuropathy. Perhaps this may be the
best way to distinguish mild papilledema from
pseudopapilledema in the future.17
We also have been using OCT to followup patients with
papilledema. However, the main problem with this has
been in interpreting what appears to be normalization of
the retinal nerve fiber layer thickness when there is
concomitant optic atrophy, which also leads to reduction
in the thickness of the nerve fiber layer over time.
However, we have some indication that there may be a
pattern of nerve fiber layer change, which may indicate
that there is optic atrophy superimposed upon
papilledema. When the thickness of the superior nerve
fiber layer diminishes while the thickness of the inferior
nerve fiber layer remains elevated, the likelihood of visual
field loss appears to rise, indicating the onset of atrophic
papilledema, rather than improvement in the papilledema.
One observation that OCT has allowed is the visualization
of subretinal fluid in patients with papilledema.18 This may
correlate with loss of visual acuity which is a reversible
phenomenon. The degree of subretinal fluid in the foveal
region seems to correlate with the degree of visual acuity
loss, and, just as in patients with central serous
retinopathy, the prognosis for recovery of visual acuity
remains good and, in my practice, when there is loss of
visual acuity and this can be demonstrated to be due to
subretinal fluid by OCT, I do not feel that this is definitely
an indication for urgent intervention surgically. The source
of the fluid is not entirely clear. Because there is
frequently a communication between the subfoveal fluid
and the peripapillary subretinal fluid that we also
described, the possibility that the fluid could be coming
from the choroid remains the best possibility. There may
be disruption of the connections between Bruch’s
membrane and the optic nerve which is disturbed because
of the swelling of the nerve, allowing for serous fluid to
leak under the retina in the peripapillary space and then,
in some individuals, track into the subfoveal region.
Subretinal fluid has also been observed in patients with
anterior ischemic optic neuropathy.19 We believe that,
when there is loss of visual acuity in patients with AION
associated with subfoveal fluidfluid, this may have
significant implications with regard to treatment. Patients
with subretinal fluid from AION, like patients with
subretinal fluid from papilledema, also have a good
prognosis for spontaneous recovery of visual acuity as the
subretinal fluid resorbs.
VITREOPAPAPILLARY TRACTIONOCT has also been very useful in our practice in patients
with suspected optic disc swelling due to vitreopapillary
traction.20 Vitreopapillary traction may be difficult to prove
by ophthalmoscopy alone. However, OCT clearly shows
vitreous adhesions to the optic nerve head, and in some
of these individuals, there may be simultaneous,
vitreomacular traction. When the latter occurs, the
resolution of the pseudopapilledema caused by
vitreopapillary traction can be relieved surgically.
COMPRESSIVE OPTIC NEUROPATHYThere have been some interesting OCT findings in
patients with compressive optic neuropathy.21, 22 However,
from a practical point of view, we have not found OCT to
be all that useful in managing patients with compressive
optic neuropathy. We do not feel that OCT aids in the
prognosis any more than ophthalmoscopic observation
of the retinal nerve fiber layer does. Our main goal in
managing patients with compressive optic neuropathy is
to prevent any retinal nerve fiber layer loss, and visual
field testing remains the main tool in identifying
compressive optic neuropathy before optic atrophy
develops. As opposed to patients with optic nerve head
disease, glaucoma being the main example, visual field
changes usually precede nerve fiber layer changes and we
continue to follow all of our patients with compressive
optic neuropathy primarily monitoring their visual fields.
OPTIC NEURITISFrom a practical point of view OCT is occasionally useful
in managing patients with optic neuritis.23-29 Although
OCT can serve as a biomarker for the progression of
demyelinating disease, it may not always reflect the
overall degree of demyelination occurring in such
individuals. Certainly, OCT will be a useful in studies of
the effectiveness of various drugs in the treatment of
demyelinating disease from an investigational point of
view, but for the day-to-day management of patients with
MS, OCT is probably only going to be as useful as MRI
scanning to monitor the overall condition of the patient.
Although there have been reports of OCT helping to
distinguish patients with neuromyelitis optica from those
FIGURE 3. Foveal and peripapillary subretinal fluid in a patientwith acute nonarteritic AION. The patient’s vision spontaneouslyrecovered from 20/400 to 20/40 over 3 months.
380 | North American Neuro-Ophthalmology Society
with multiple sclerosis, the degree of nerve fiber layer
dropout is reflected by the degree of visual loss
demonstrated by visual acuity testing or visual field
testing, so OCT so in and of itself is not all that useful in
that regard.
CAVEATSAlthough OCT has become very useful in my practice over
the last several years, I try to remain aware of some of the
limitations of OCT. OCT can be normal in patients with
compressive optic neuropathy, and visual field testing
remains the most important diagnostic tool in the
diagnosis and followup of patients with compressive optic
neuropathy. OCT can be normal in patients with some
occult maculopathies, and multifocal electroretinography
may be needed to identify maculopathy in these patients
and to prevent extensive evaluations, searching for other
diagnoses. A bad OCT is like a bad MRI or a bad CT scan.
There may be errors in retinal nerve fiber layer analysis.
Sometimes the algorithm used by the OCT machine will
fail and false measurements of the retinal nerve fiber layer
or the macula may occur. It is important to check the
alignment of the circular scans when analyzing retinal
nerve fiber layer measurements. If the scan is not properly
placed which respect to the optic nerve head, inaccurate
measurements may follow. This is especially problematic
in patients with swollen optic nerves where the presence
of subretinal fluid and marked elevation of the nerve fiber
layer may provide measurements which are inaccurate
because they are out of the range of the normal algorithm.
Perhaps, in patients with optic nerve head swelling, a
larger diameter should be used for retinal nerve fiber layer
analysis. Also, there may be errors in macular analysis. To
avoid this, because most macular diagnoses rely on a
more qualitative evaluation of the OCT, I always obtain
line scans, which incorporate the optic nerve head and the
macula. This allows for a better view of the anatomic
details of the macula, which are not always clear on the
typical macular scans. OCT may identify concurrent optic
nerve and macular disease. Therefore, I image the macula
as well as the RNFL in every patient in whom I obtain OCT.
MY STANDARD PROTOCOL FOR OCTMy standard protocol is to obtain a retinal nerve layer
scan, a macula scan, and a line scan of the macula and
nerve. I have not found that the optic nerve head protocol
is useful in analyzing optic nerve disease, and I have very
little experience with this. Spectral domain OCT appears
better than time domain for evaluating macular disease.
However, the time domain appears to be more consistent
with regard to retinal nerve fiber layer analysis, especially
for serial analysis over time. High-speed ultra-high
resolution OCT is best for occult maculopathy, especially
for the occult outer retinopathies, and also in patients